Page 1
Field and Laboratory Investigation of the
Durability Performance of Geopolymer
Concrete
By
Kirubajiny Pasupathy
A thesis submitted in total fulfilment of the requirements for the
degree of
Doctor of Philosophy
Faculty of Science, Engineering and Technology
Swinburne University of Technology
Melbourne, Australia
2018
Page 3
iii
Abstract
The use of geopolymer concrete (GPC) in construction industry has been extensively
investigated in recent decades, owing to the inherent merits of GPC such as reduced CO2
emissions to the environment and increased use of industrial wastes. Traditionally,
ordinary Portland cement (OPC) is used for concrete manufacturing, however, this
results in high embodied energy of production and hence, large amounts of CO2
emission to the environment. GPC uses supplementary cementitious materials
including, fly ash and ground granulated blast furnace slag (GGBFS), which are derived
as industrial waste by-products and the production of GPC shows very less emission to
the environment. GPC behaves similar to OPC concrete, and it possesses similar or
higher engineering and durability properties compared to OPC concrete.
Despite many decades of research on GPC, the widespread application of GPC in the
construction industry is limited. The major challenges of GPC relate to the wide range
of source materials to choose, lack of long-term durability studies and inadequate
standard methods of practice to assess the performance. Furthermore, the long-term
durability of concrete structures exposed to field environment, particularly in aggressive
environments including marine and saline environments, is crucial for the real-world
application of GPC. While the previous studies revealing a superior durability
performance of GPC compared to OPC, they were mainly conducted using accelerated
testing methods in laboratory-controlled environment with little or no relevance to field
environment properties. Therefore, this research study aims to assess the long-term
durability of GPC exposed to various field environments.
Experimental investigations were conducted on the concrete core specimens extracted
from GPC structures exposed to different environmental conditions and compared with
the OPC concrete structures in the same environment. The durability performance of
concrete structures exposed to the normal atmospheric environment was assessed by
studying the carbonation properties of core specimens extracted from these structures.
The tests were conducted on three different GPC structures having the different
constitution of fly ash and slag binder materials, aged at eight years. The results showed
that the carbonation resistance of GPC is lower than OPC concrete in the atmospheric-
Page 4
iv
exposed environment. The formation of soluble carbonation products such as sodium
carbonate (Na2CO3) and potassium carbonate (K2CO3) in fly ash based GPC has found
to be washed out from the concrete surface with the contact of water, causing higher
porosity after the carbonation. The increased porosity of concrete with the washout of
carbonation products further exacerbated the carbonation diffusion and significantly
affecting the durability of fly ash based GPC structures. However, the fly ash-slag based
GPC showed higher resistance to carbonation compared to fly ash based GPC due to the
formation of insoluble CaCO3 products with the use of slag in such GPCs.
On the other hand, the durability performance of GPC exposed to aggressive
environment has also been evaluated. The combined effect of carbonation, chloride
penetration and sulphate attack were investigated on concrete core specimens prepared
using fly ash based GPC structure, and slag-fly ash blended GPC structure exposed to
the saline, marine environment for 6 years and 4 years, respectively. The test results
showed that the durability of GPC is lower than OPC concrete in the marine exposure
conditions. This was particularly elaborated by reduced resistance to carbonation,
chloride diffusion and sulphate attack of GPC, compared to OPC concrete.
Apart from the durability assessment on field exposed concrete structures, the testings
were also conducted on laboratory prepared specimens, subjected to accelerated testing
methods, to validate the test result obtained from field experiments. The geopolymer
mortar specimens prepared with different mix proportion of fly ash and slag were
subjected to accelerated wetting-drying analysis in different solution such as water,
chloride solution and, the combination of chloride and the sulphate solutions. The
compressive strength of the concrete specimens exposed to the accelerated environment
was measured with age. The test results suggested that the degradation in the GPC
specimens is higher than OPC mortar. The loss of compressive strength was, however,
found to be low with the increasing level of slag in the GPC. Furthermore, the corrosion
of rebar in the GPC has been examined when concrete specimens containing rebar
subjected to a concentrated CO2 environment of 1%. The influence of source materials of
GPC on the corrosion behaviour was studied. The test results showed that the corrosion
of rebar in fly ash based GPC was higher than the OPC specimens and, the corrosion rate
is reduced with the incorporation of slag in GPC. Also, the correlation of carbonation
rate with different source materials of GPC was studied with the development of
Page 5
v
carbonation coefficient models according to diffusion equation based on the Fick’s law
and the use of empirical equations.
Overall, it was found that the use of slag in GPC well enhances the durability
performance, compared to fly ash based GPC in atmospheric and aggressive
environments. Under the same activation and mix proportional conditions, high slag
content leads to better durability performance of the resulting geopolymer concrete.
However, the durability of GPC is still lower than traditional OPC based concrete.
Therefore, investigation of suitable GPC chemistry and mix design is required to
enhance the durability of GPC for real-world applications.
Page 6
vi
Declaration
I hereby certify that this thesis entitled “Field and Laboratory Investigation of the
Durability Performance of Geopolymer Concrete” contains no material which has been
accepted for the award to the candidate of any other degree or diploma, except where
due reference is made in the text of the examinable outcome. To the best of my
knowledge, the thesis contains no material previously published or written by another
person except where due reference is made in the text of the examinable outcome. Where
the work is based on joint research or publications, discloses the relative contributions
of the respective workers or authors.
_____________________
Kirubajiny Pasupathy
April 2018
Page 7
vii
List of Publications
Published and Submitted Journal papers
1. Pasupathy, K., M. Berndt, J. Sanjayan, P. Rajeev and D.S. Cheema, “Durability
Performance of Precast Fly Ash–Based Geopolymer Concrete under Atmospheric Exposure
Conditions.” Journal of Materials in Civil Engineering, 2018. 30(3): p. 04018007.
2. Pasupathy, K., M. Berndt, J. Sanjayan, P. Rajeev and D.S. Cheema, “Durability of low
‑calcium fly ash based geopolymer concrete culvert in a saline environment.” Cement and
Concrete Research, 2017. 100: p. 297-310.
3. Pasupathy, K., M. Berndt, A. Castel, J. Sanjayan and R. Pathmanathan, “Carbonation
of a blended slag-fly ash geopolymer concrete in field conditions after 8 years.” Construction
and Building Materials, 2016. 125: p. 661-669.
4. Pasupathy, K., M. Berndt, J. Sanjayan and R. Pathmanathan, “Durability Performance
of Concrete Structures Built with Low Carbon Construction Materials.” Energy Procedia,
2016. 88: p. 794-799.
5. Pasupathy, K., M. Berndt, J. Sanjayan, DW. Law and R. Pathmanathan, “The effect of
chloride penetration on slag-fly ash blended geopolymer concrete in marine environment”
Submitted to Construction and Building Materials.
Journal papers under preparation
1. Pasupathy, K., M. Berndt, J. Sanjayan, and P. Rajeev, “influence of the source materials
on the alkali leaching and the degradation behavior of geopolymer binder in accelerated
wetting-drying environment.”
2. Pasupathy, K., P. Rajeev, J. Sanjayan, and M. Berndt, “Mathematical modelling to
determine the CO2 diffusion of geopolymer concrete”
Conference proceedings
1. Pasupathy, K., M. Berndt, J. Sanjayan and R. Pathmanathan, “Durability Performance
of Concrete Structures Built with Low Carbon Construction Materials”, Applied Energy
Symposium and Summit 2015 (CUE2015), Nov 15-17, 2015, Fuzhou, China.
2. Pasupathy, K., M. Berndt, J. Sanjayan, P. Rajeev and D.S. Cheema, “Evaluation of
Chloride Penetration into Geopolymer Concrete under Marine Environment” Concrete
2017 conference, Adelaide, Australia, 2017.
Page 8
viii
3. Pasupathy, K., M. Berndt, J. Sanjayan and R. Pathmanathan, “Geopolymer Concrete-
Green Technology- Review”, 8th International Conference on Structural Engineering
and Construction Management 2017, Sri Lanka, 2017.
4. Pasupathy, K., R. Pathmanathan K., J. Sanjayan and M. Berndt, “Mathematical approach
to determine the CO2 diffusion coefficient of geopolymer concrete.” Will be presented in
The International Federation for Structural Concrete 5th International fib Congress,
2018.
Page 9
ix
Acknowledgement
It would not have been possible to complete this PhD study without the guidance, help
and support of many people around me. I would like to express my sincere gratitude to
them for their support over the past 3 ½ years of my PhD travel.
I would like to thank and appreciate my supervisors for their patient guidance,
enthusiastic encouragement and useful critiques of this research work. Firstly, I wish
like to express my thank and appreciate to Prof Jay Sanjayan, for his valuable guidance,
advise and support to complete my research study on the prepared schedule. This thesis
would not be finished without his valuable supervision and assistance. Secondly, I
would like to extend my thanks to A/Prof Marita Berndt for her constant guidance as
well as for providing necessary information and the direction to complete my work. I
appreciate her support during the field testing period. I extend my sincere thanks to Dr
Pathmanathan Rajeev for all the advice, ideas, and moral support to progress well in this
research work
I would also like to thank the technical staffs in the smart structural laboratory,
Chemistry Laboratory and material research laboratory from Swinburne University.
Particularly, Michael Culton, Kia Rasekhi, Sanjeet Chandra, Kevin Nievaart and Firas
Al-Akeedi for providing the technical assistance to complete my experimental works
within the time frame. I also specially thank Dr James Wang and Savithri Galappathie
for access and support to use SEM, XRD and FT-IR equipment.
I would like to express my sincere thanks to A/Prof Arnaud Castel from University of
New South Wales, Australia, and Dr David Law from RMIT University, Australia for
their incredible advices, and feedbacks during my PhD programme. Their help and
support provide a path to complete my PhD journey in an easy way. I also thankfully
appreciate Dr D. S. Cheema Didar for his valuable help to conduct the field test in Perth,
Western Australia.
I am grateful to CRC for Low Carbon Living Ltd. (RP1020) supported by the Cooperative
Research Centres program, an Australian Government initiative and Swinburne
Page 10
x
University of Technology for the financial support provided me throughout the 3 1/2
years of my PhD study period.
I would also like to acknowledge the support of Zeobond Pty Ltd and Antonello Precast
Concrete Pty Ltd for allowing access to the field test site in Campbellfield, Australia. I
wish to thank Main Road Western Australia for their support on field study assistance
in Perth, Australia. Furthermore, I gratefully acknowledge the Port of Portland for
providing a site for specimens for marine exposure in Portland, Australia
I would also be thankful to all staff, PhD students and friends at Swinburne University
for their encouragement, support and friendship, during my PhD journey.
Finally, I wish to thank my lovely family for their ongoing support and encouragement
to complete my PhD study. I am also greatly thankful to my loving husband Sayan for
his patience, encouragement and support throughout this PhD period. I would not be
able to complete my PhD thesis without his help and support during the field
investigations, experimental works and thesis writing.
Page 11
xi
Table of Contents
Abstract ................................................................................................................................. iii
Declaration ............................................................................................................................ vi
List of Publications .............................................................................................................. vii
Acknowledgement ............................................................................................................... ix
Table of Contents ................................................................................................................. xi
List of Tables ....................................................................................................................... xvi
List of Figures .................................................................................................................... xvii
Chapter 1 Introduction .......................................................................................................... 1
1.1 Background ............................................................................................................ 1
1.2 Problem statement ................................................................................................. 3
1.3 Aim and objectives................................................................................................. 4
1.4 Significance of the research ................................................................................... 5
1.5 Thesis outline ......................................................................................................... 5
Chapter 2 Literature review .................................................................................................. 8
2.1 Introduction ............................................................................................................ 8
2.2 Overview of geopolymer....................................................................................... 8
2.3 Geopolymerisation mechanism and sources of geopolymer binder ................. 9
2.3.1 Geopolymerisation mechanism..................................................................... 9
2.3.2 The precursor of geopolymer binder ...........................................................12
2.3.3 Activators .......................................................................................................14
2.3.4 Curing method ..............................................................................................15
2.4 Mechanical properties of hardened geopolymer concrete.................................17
2.5 Permeation properties of hardened geopolymer concrete ................................20
2.6 The durability of geopolymer concrete ...............................................................22
2.6.1 Efflorescence and leaching of geopolymer ..................................................23
2.6.2 Carbonation resistance of geopolymer concrete .........................................27
2.6.3 Chloride penetration .....................................................................................31
Page 12
xii
2.6.4 Sulphate attack .............................................................................................. 35
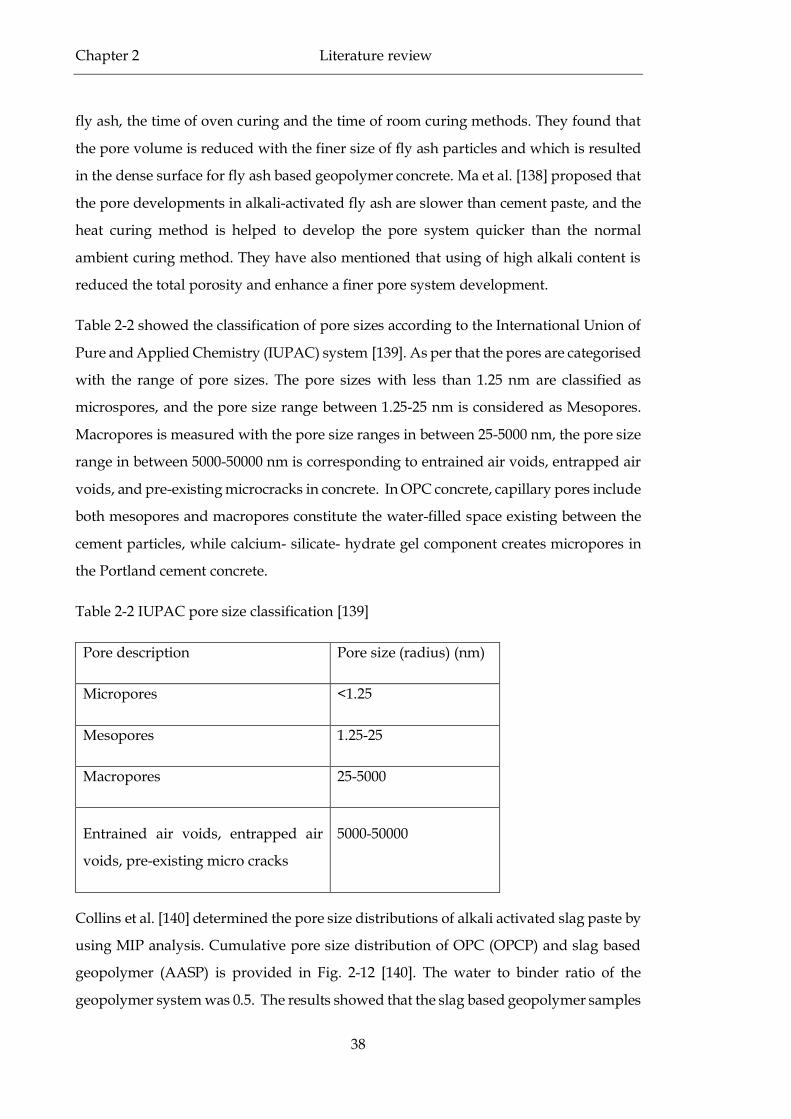
2.7 Porosity and pore structure of geopolymer concrete......................................... 37
2.8 Corrosion of reinforcement .................................................................................. 41
2.9 Studies related to durability of geopolymer concrete structures in field
environments .................................................................................................................... 46
2.10 Current application of geopolymer concrete in the construction field............. 48
2.11 Motivation for the study ...................................................................................... 51
Chapter 3 The durability of geopolymer concrete exposed to the atmospheric
environment ......................................................................................................................... 54
3.1 Introduction .......................................................................................................... 54
3.2 Field Description .................................................................................................. 54
3.2.1 Description of concrete structures ............................................................... 54
3.2.2 Mix design of concrete structures ................................................................ 56
3.3 Testing methods ................................................................................................... 58
3.3.1 Carbonation depth measurement ................................................................ 58
3.3.2 pH profile measurement .............................................................................. 58
3.3.3 Water absorption (Ai) and apparent volume of permeable voids (AVPV)
59
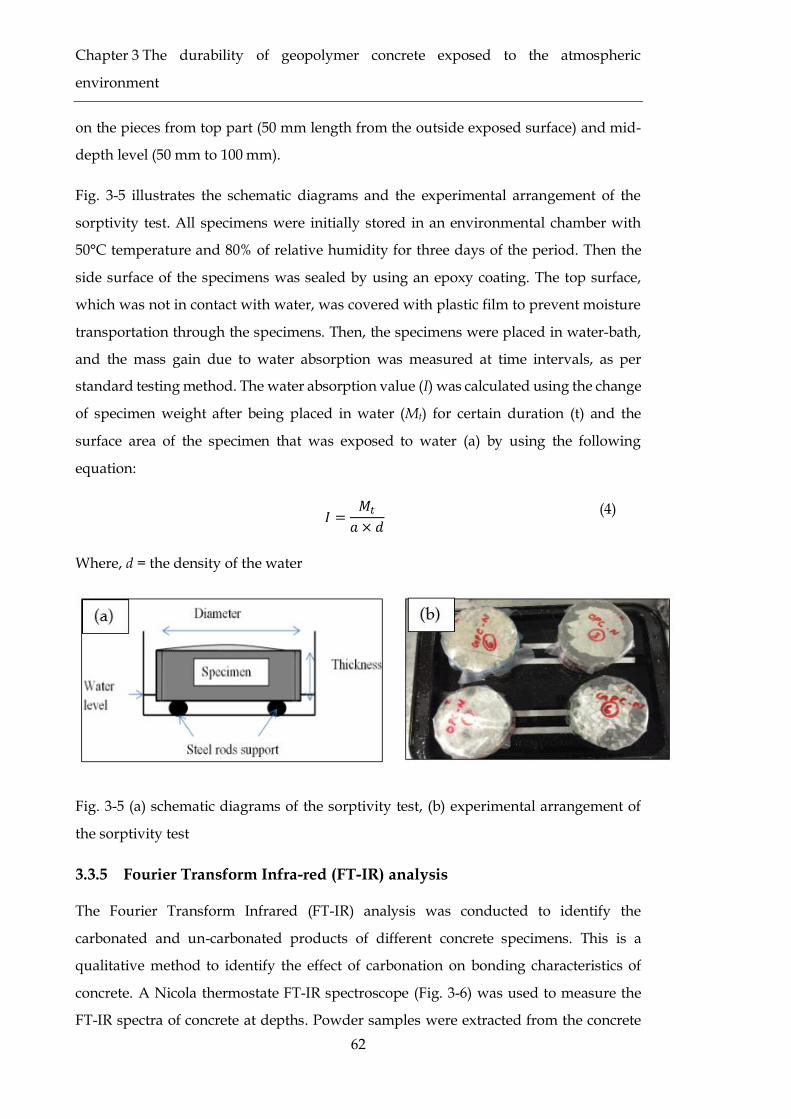
3.3.4 Sorptivity analysis ........................................................................................ 61
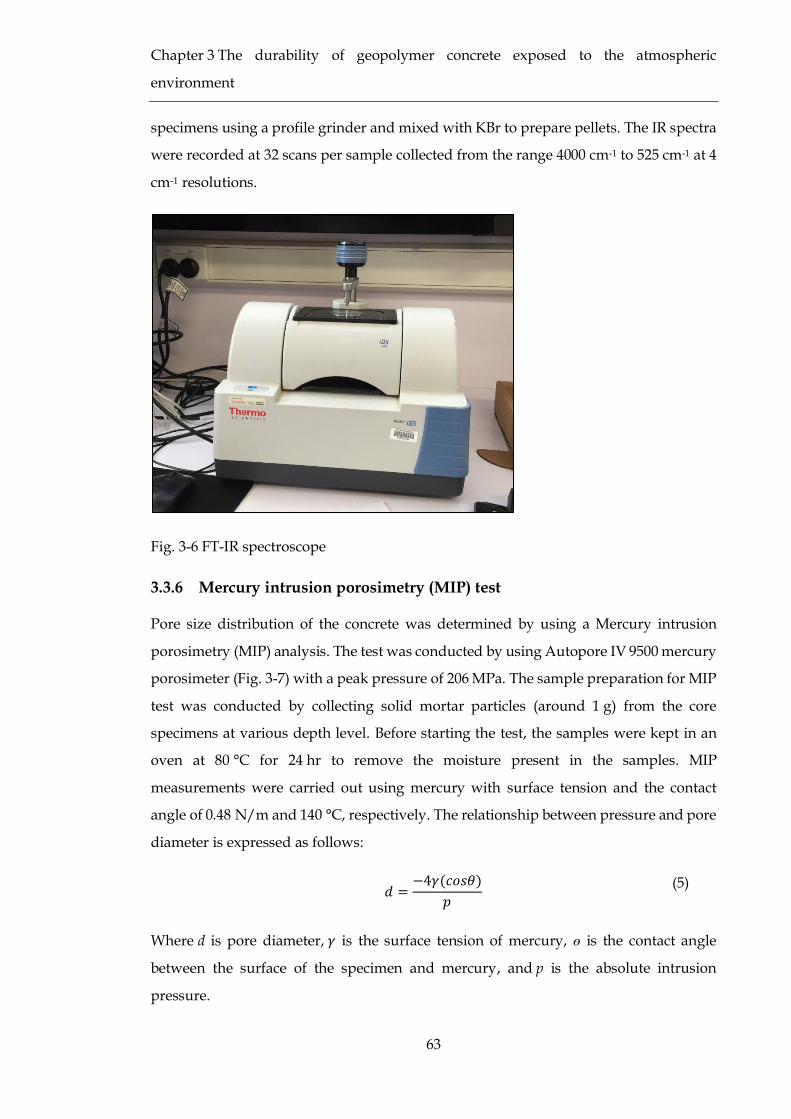
3.3.5 Fourier Transform Infra-red (FT-IR) analysis ............................................. 62
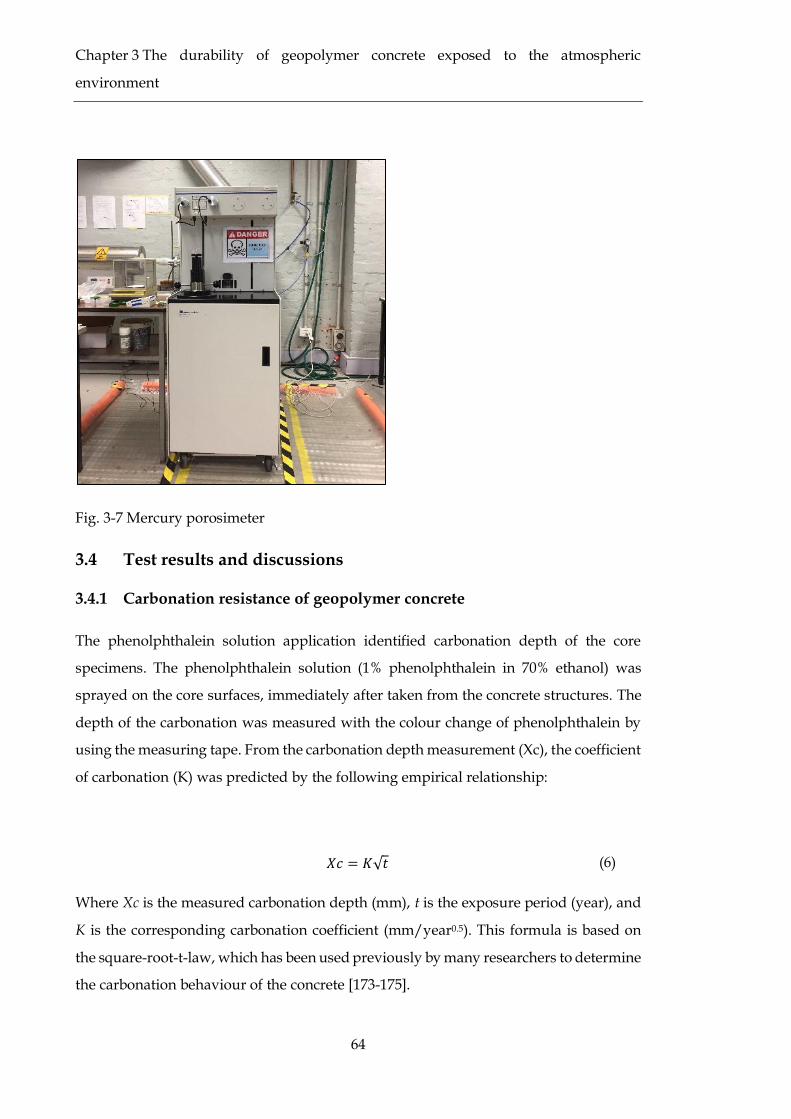
3.3.6 Mercury intrusion porosimetry (MIP) test .................................................. 63
3.4 Test results and discussions ................................................................................. 64
3.4.1 Carbonation resistance of geopolymer concrete ......................................... 64
3.4.2 pH profile measurement .............................................................................. 69
3.4.3 Volume of permeable void test results ........................................................ 71
3.4.4 Sorptivity analysis test results ..................................................................... 73
3.4.5 FT-IR analysis ................................................................................................ 77
3.4.6 Mercury Intrusion Porosimetry (MIP) analysis .......................................... 82
Page 13
xiii
3.4.7 Corrosion of reinforcement in fly ash based geopolymer concrete ...........88
3.5 Concluding remarks .............................................................................................89
Chapter 4 The durability of geopolymer concrete exposed to an aggressive environment
92
4.1 Introduction ...........................................................................................................92
4.2 Field Investigation ................................................................................................93
4.2.1 Description of concrete structures, exposure condition and mix details ..93
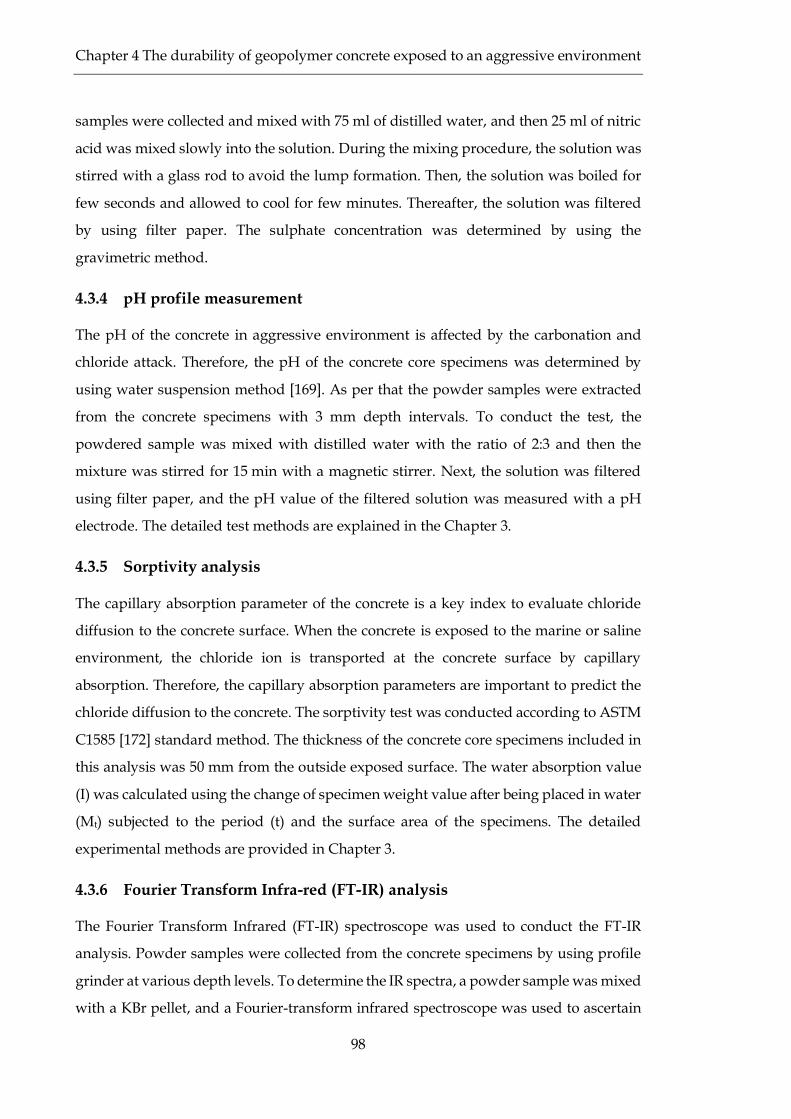
4.3 Testing methods ....................................................................................................96
4.3.1 Carbonation depth measurement ................................................................96
4.3.2 Chloride penetration measurements ...........................................................96
4.3.3 Sulphate content measurements ..................................................................97
4.3.4 pH profile measurement ...............................................................................98
4.3.5 Sorptivity analysis .........................................................................................98
4.3.6 Fourier Transform Infra-red (FT-IR) analysis .............................................98
4.3.7 Mercury intrusion porosimetry (MIP) test ..................................................99
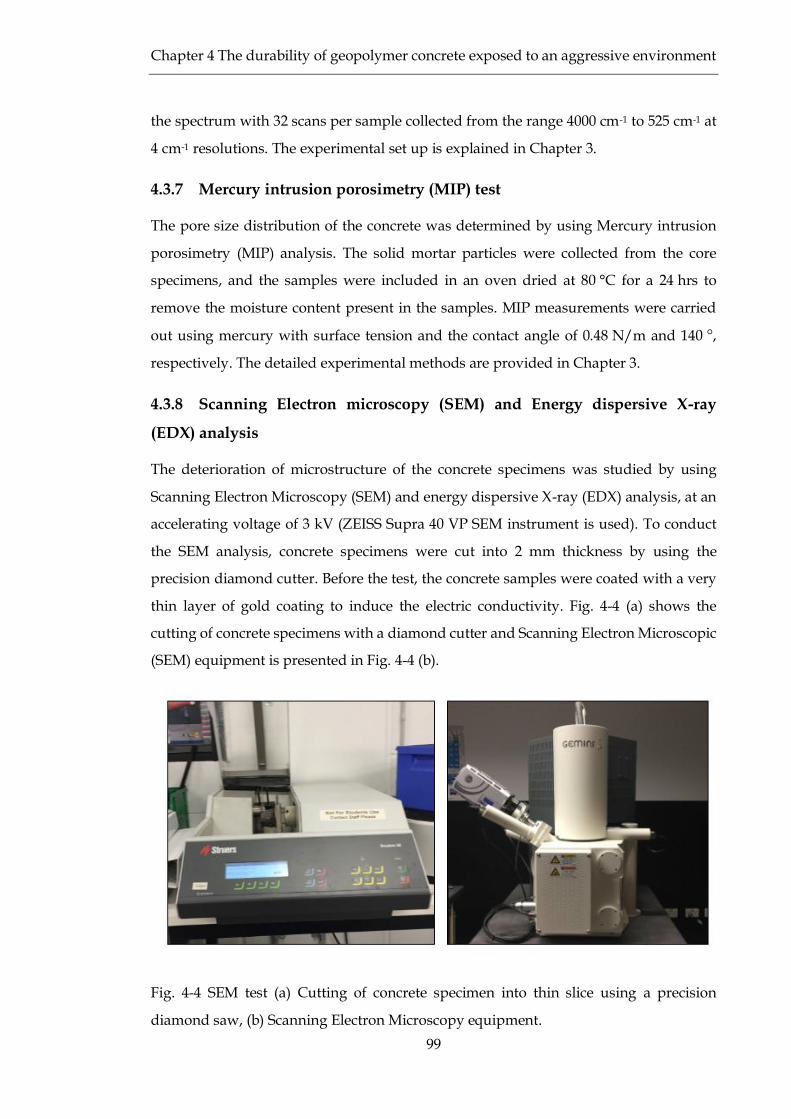
4.3.8 Scanning Electron microscopy (SEM) and Energy dispersive X-ray (EDX)
analysis 99
4.4 Test results and discussions ............................................................................... 100
4.4.1 Carbonation resistance of geopolymer concrete in an aggressive
environment ................................................................................................................ 100
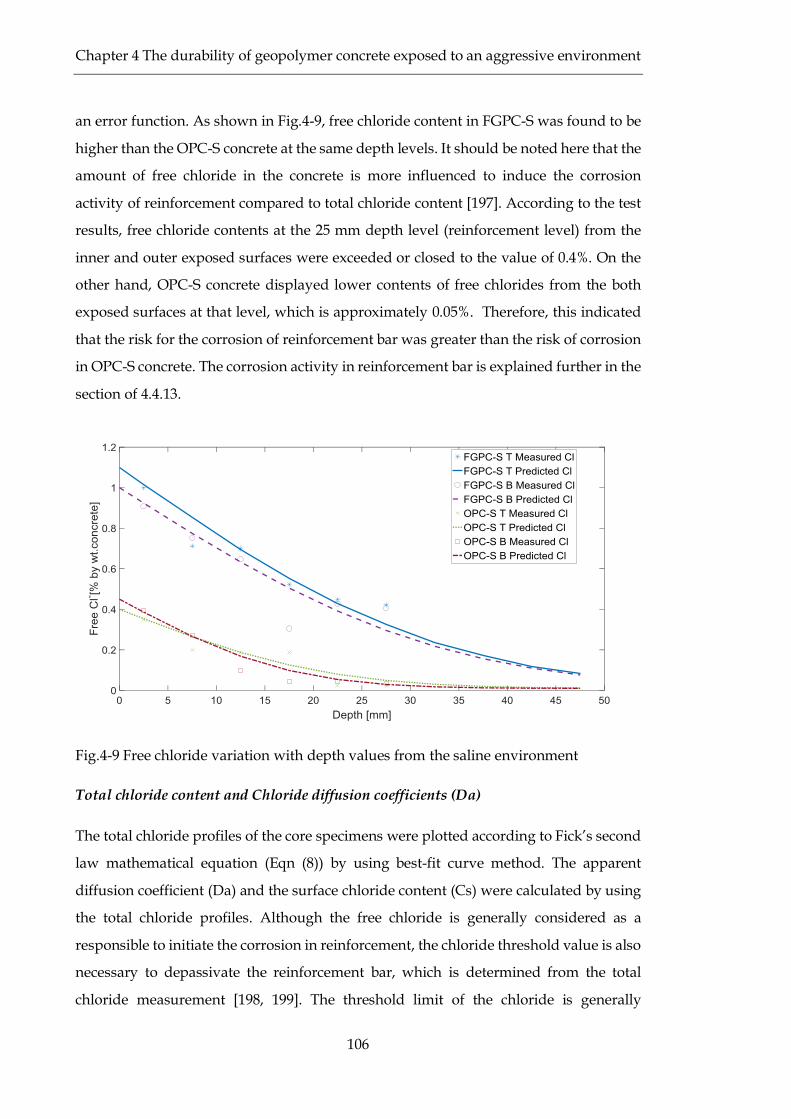
4.4.2 Chloride penetration ................................................................................... 104
4.4.3 Sulphate attack in an aggressive environment ......................................... 113
4.4.4 Scaling effect of geopolymer concrete ....................................................... 115
4.4.5 pH profile measurement ............................................................................. 117
4.4.6 Test results from the sorptivity analysis .................................................... 120
4.4.7 FT-IR analysis .............................................................................................. 122
4.4.8 Pore size distribution analysis with MIP test ............................................ 126
4.4.9 Microstructural analysis by SEM/EDX method ....................................... 130
Page 14
xiv
4.4.10 Corrosion of reinforcement in fly ash based geopolymer concrete ........ 135
4.5 Concluding remarks ........................................................................................... 139
Chapter 5 Study on alkali leaching, wet and dry cyclic resistance of geopolymer....... 141
5.1 Introduction ........................................................................................................ 141
5.2 Materials and Methods ...................................................................................... 141
5.2.1 Materials ...................................................................................................... 141
5.2.2 Testing methods .......................................................................................... 143
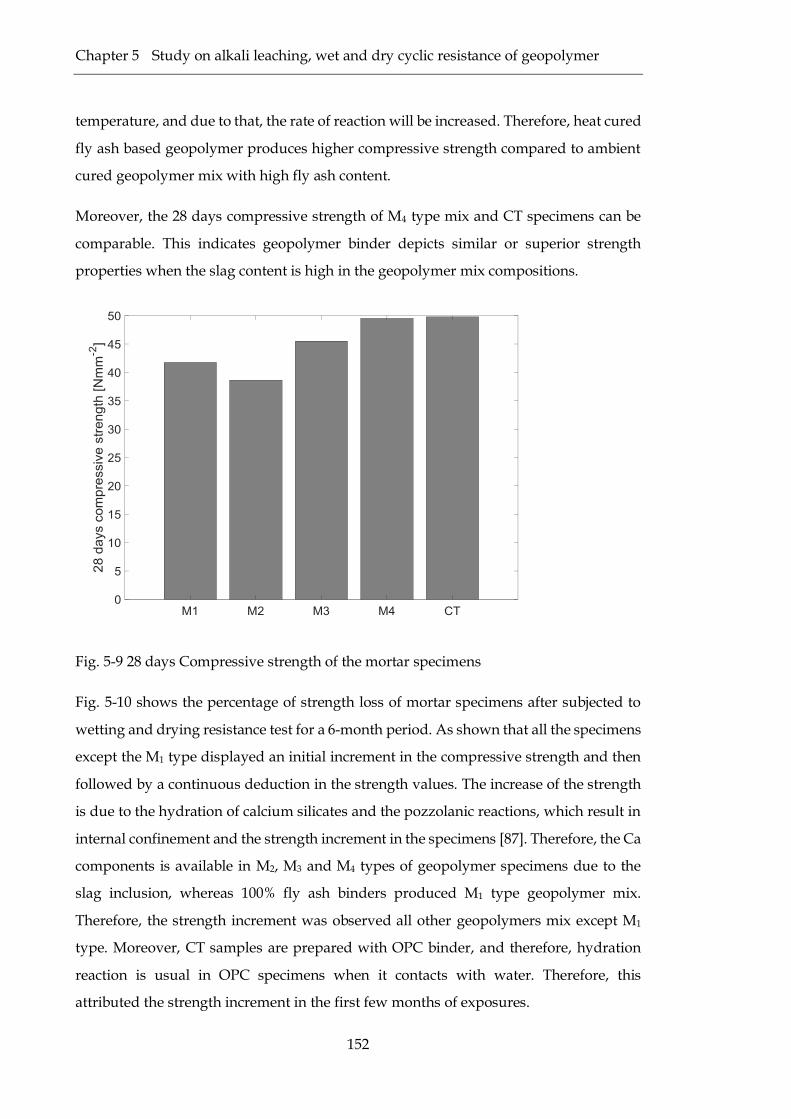
5.3 Results and discussions ...................................................................................... 145
5.3.1 Alkali leaching test...................................................................................... 145
5.3.2 Concrete Resistance in Wetting-drying Cycles in water .......................... 149
5.3.3 Concrete Resistance in Wetting-drying Cycles in chloride solution ....... 153
5.3.4 Concrete Resistance in wetting-drying Cycles in a chloride+ sulphate
solution 156
5.4 Concluding remarks ........................................................................................... 160
Chapter 6 Accelerated carbonation and corrosion test on geopolymer concrete ......... 161
6.1 Introduction ........................................................................................................ 161
6.2 Materials and methods ....................................................................................... 161
6.2.1 Materials ...................................................................................................... 161
6.2.2 Testing methods .......................................................................................... 164
6.3 Results and discussions ...................................................................................... 168
6.3.1 Carbonation depth measurement by universal and phenolphthalein
indicators .................................................................................................................... 168
6.3.2 Carbonation depth measurement of field-exposed fly ash based
geopolymer concrete samples by universal solution .............................................. 175
6.3.3 Evaluation of corrosion of reinforcement ................................................. 176
6.4 Concluding remarks ........................................................................................... 185
Chapter 7 Mathematical models for carbonation of geopolymer concrete ................... 187
7.1 Introduction ........................................................................................................ 187
Page 15
xv
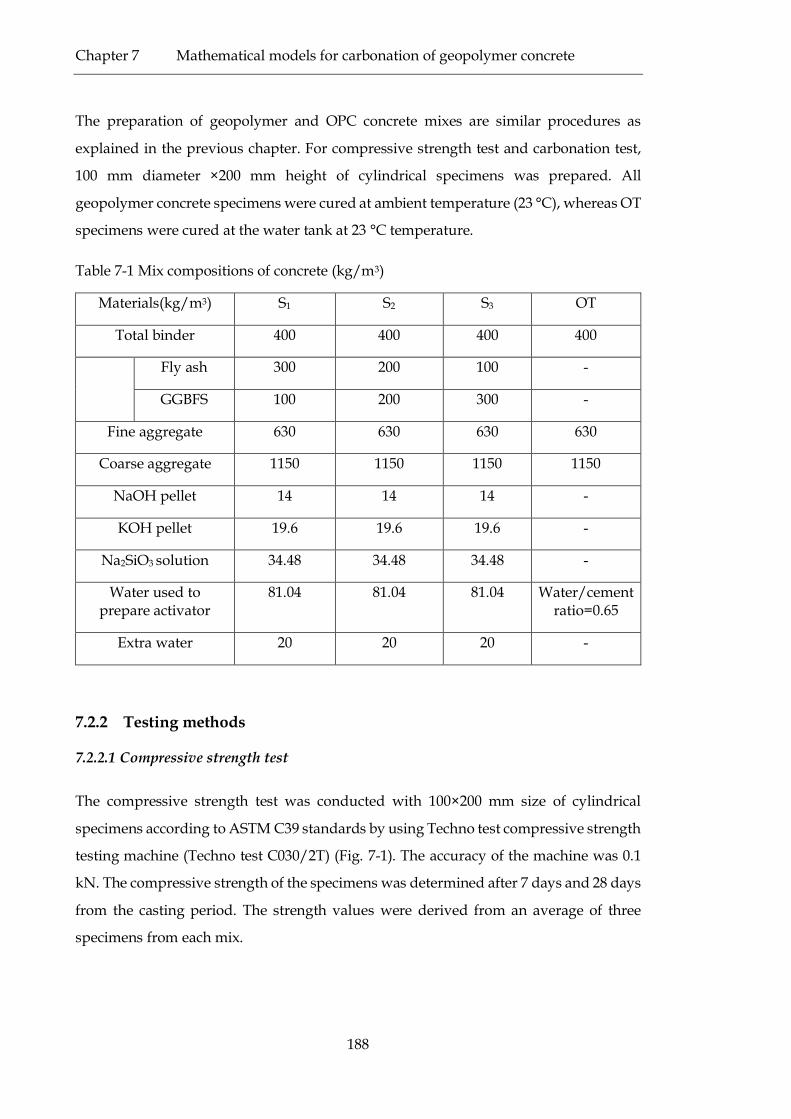
7.2 Materials and methods ....................................................................................... 187
7.2.1 Materials ...................................................................................................... 187
7.2.2 Testing methods .......................................................................................... 188
7.2.3 Mathematical approach on the carbonation of geopolymer concrete ..... 189
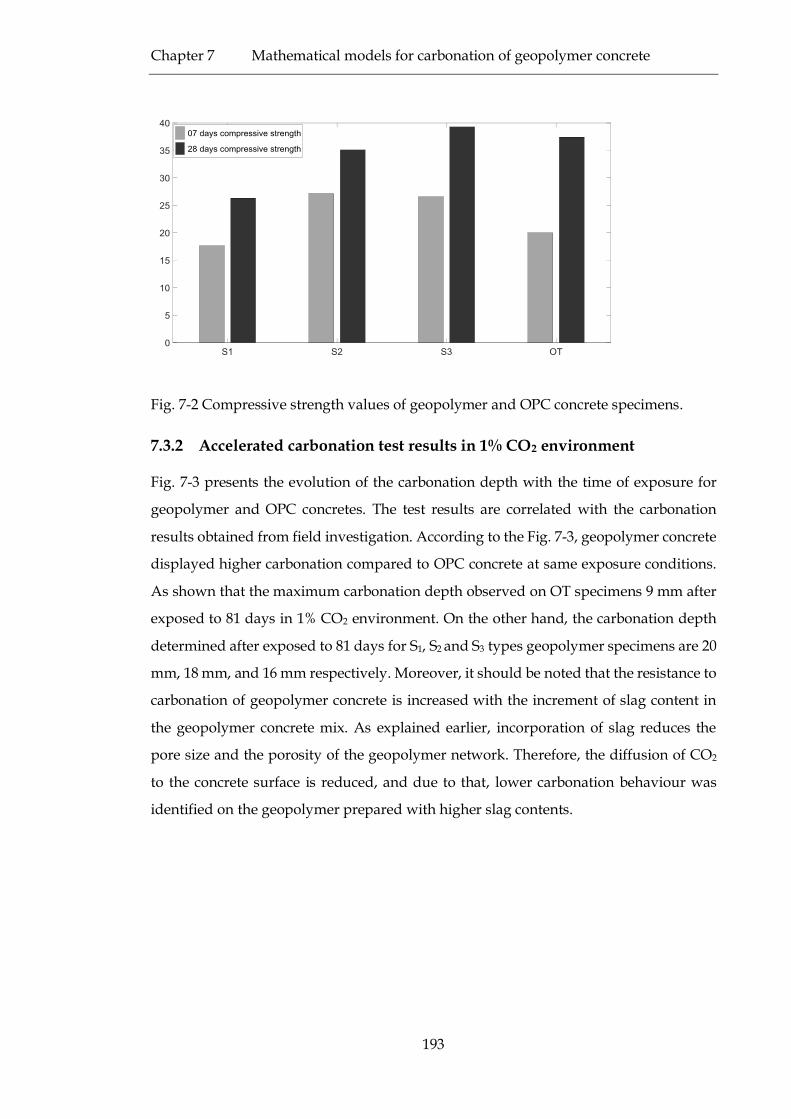
7.3 Results and discussions ...................................................................................... 191
7.3.1 Compressive strength test results .............................................................. 191
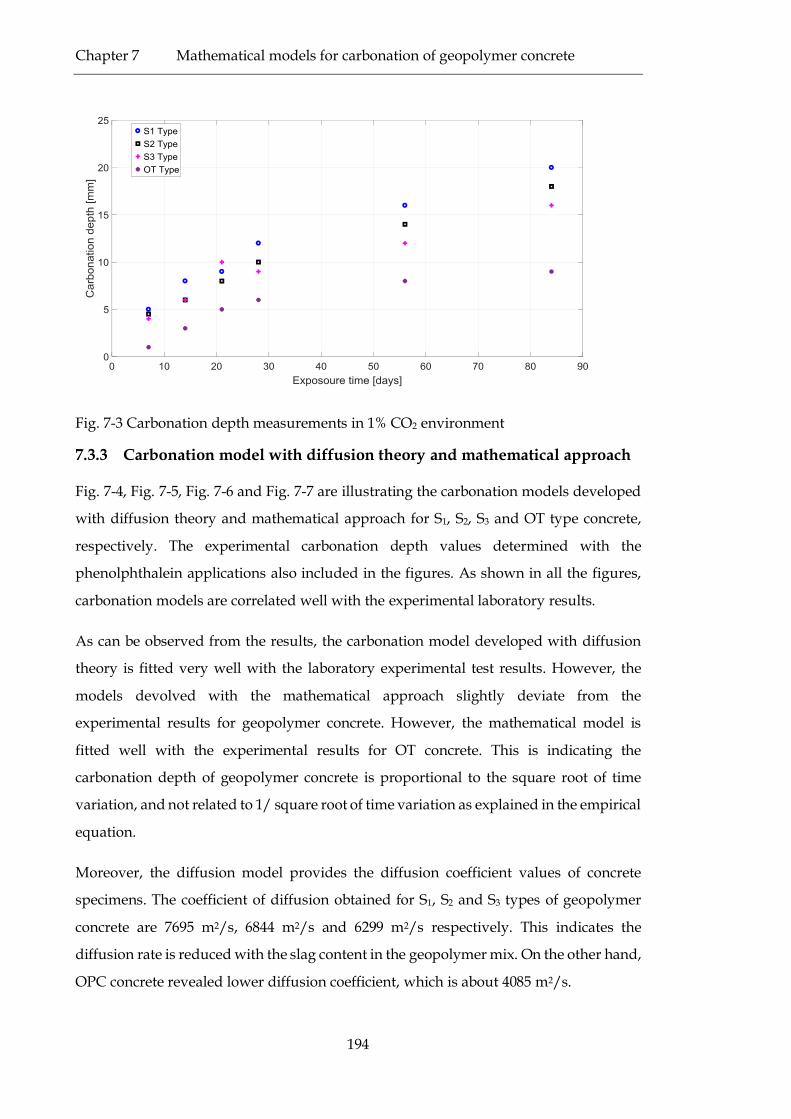
7.3.2 Accelerated carbonation test results in 1% CO2 environment ................. 193
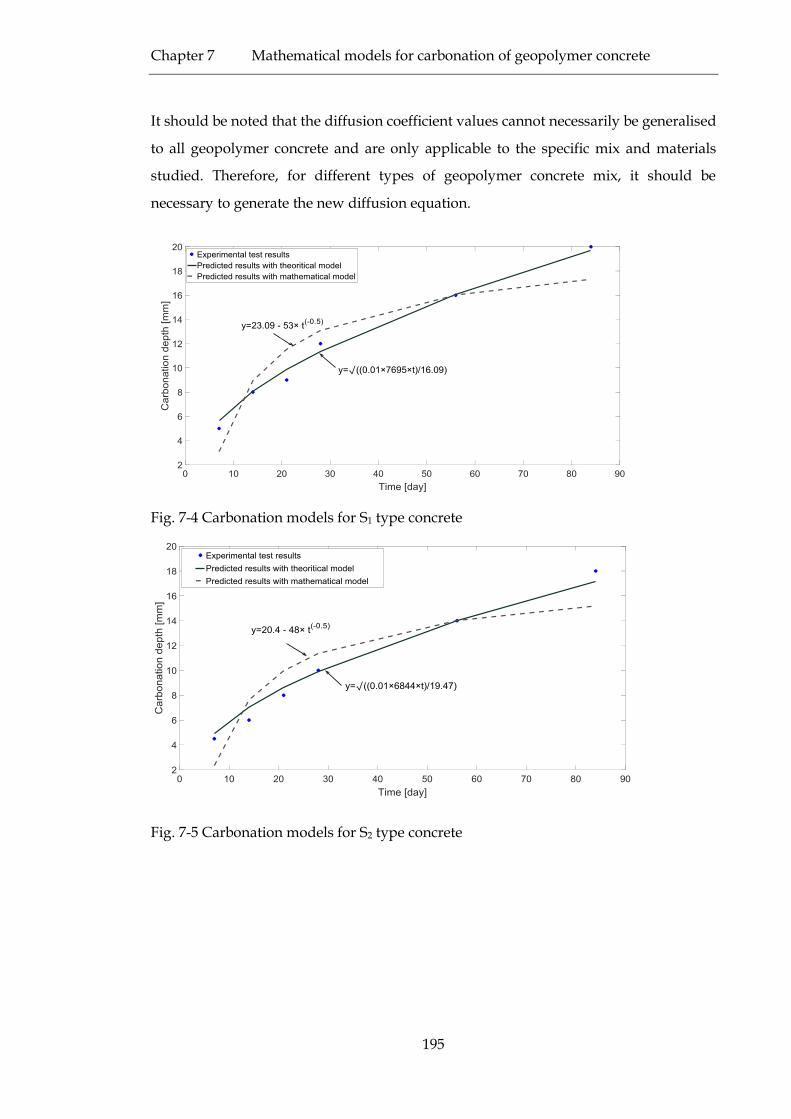
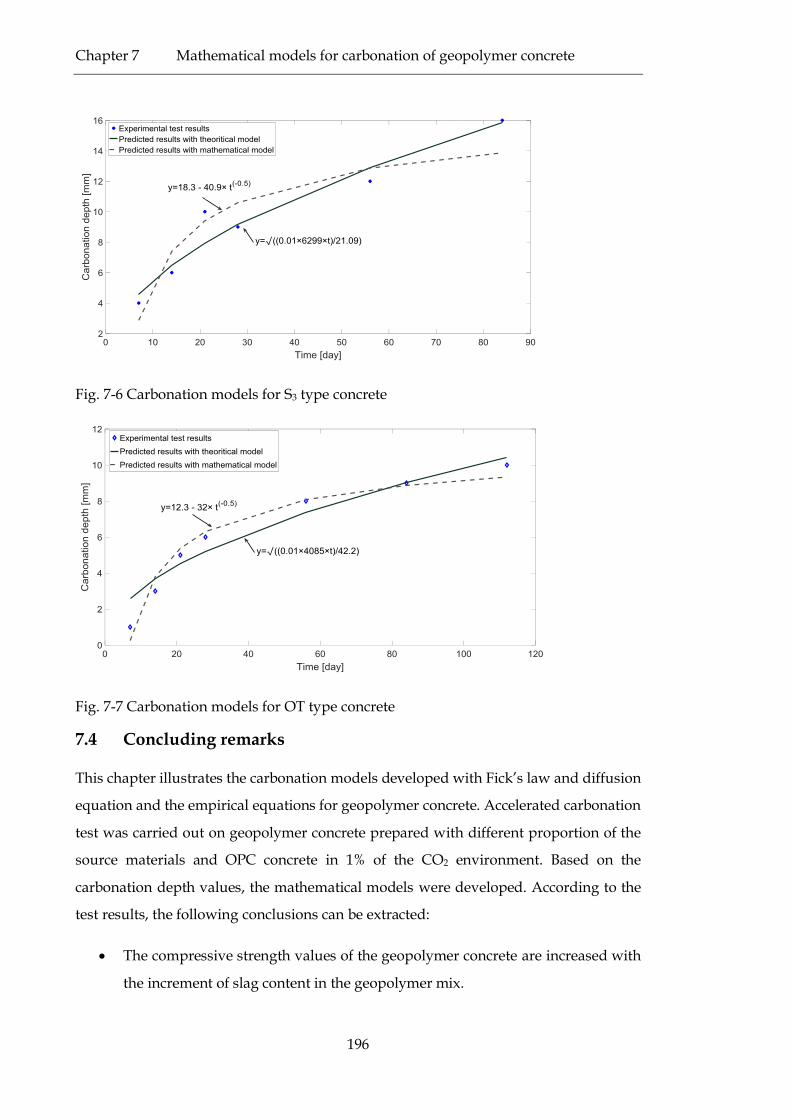
7.3.3 Carbonation model with diffusion theory and mathematical approach 194
7.4 Concluding remarks ........................................................................................... 196
Chapter 8 Conclusions and Recommendations ............................................................... 198
8.1 Summary ............................................................................................................. 198
8.2 Concluding remarks ........................................................................................... 201
8.3 Recommendations for future work ................................................................... 202
References ........................................................................................................................... 204
Page 16
xvi
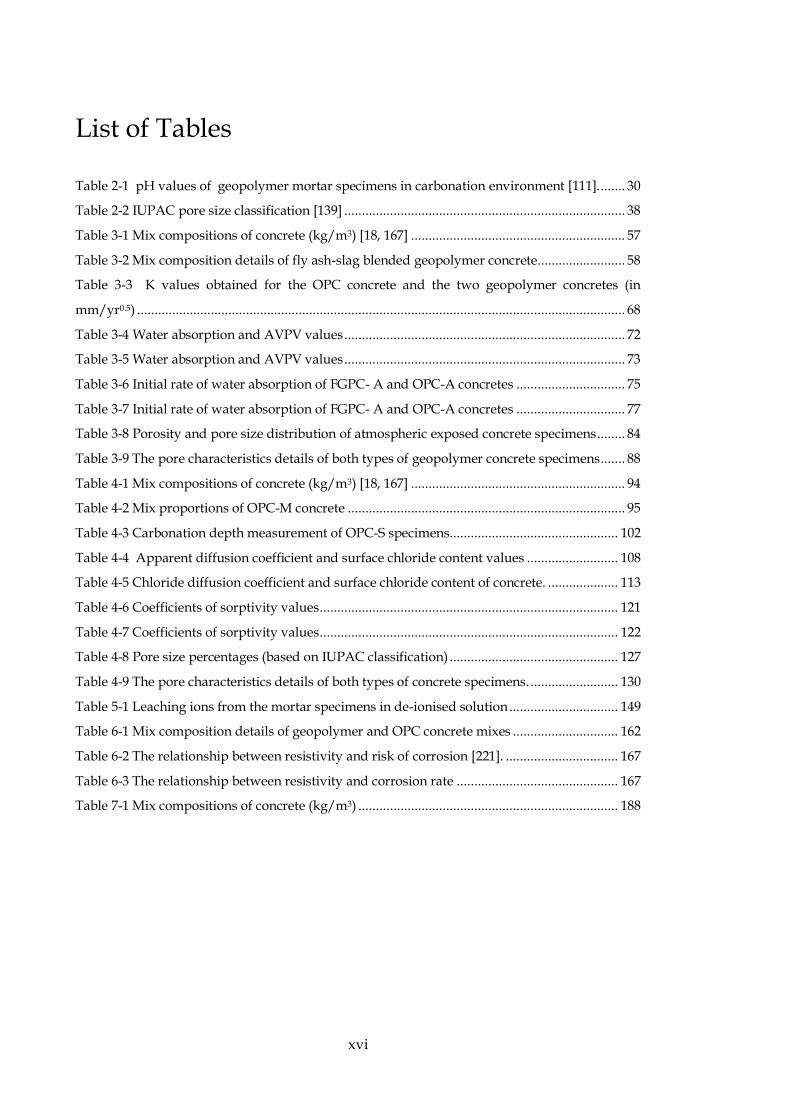
List of Tables
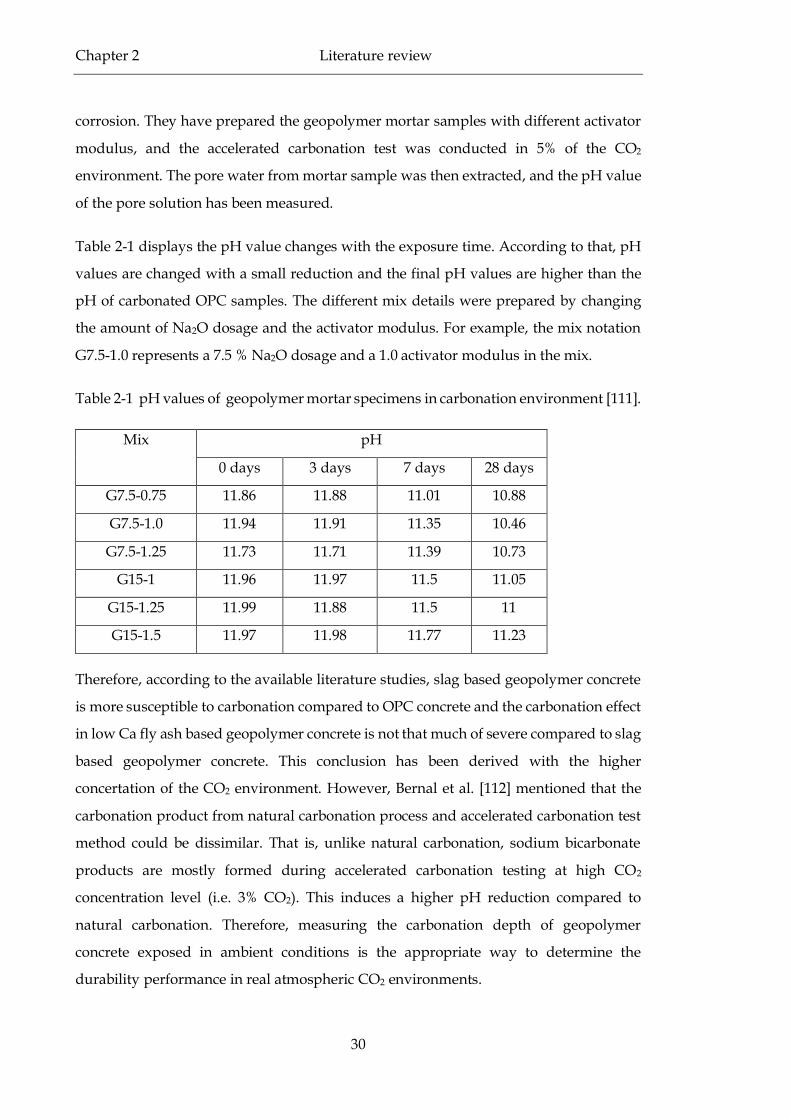
Table 2-1 pH values of geopolymer mortar specimens in carbonation environment [111]. ....... 30
Table 2-2 IUPAC pore size classification [139] ................................................................................ 38
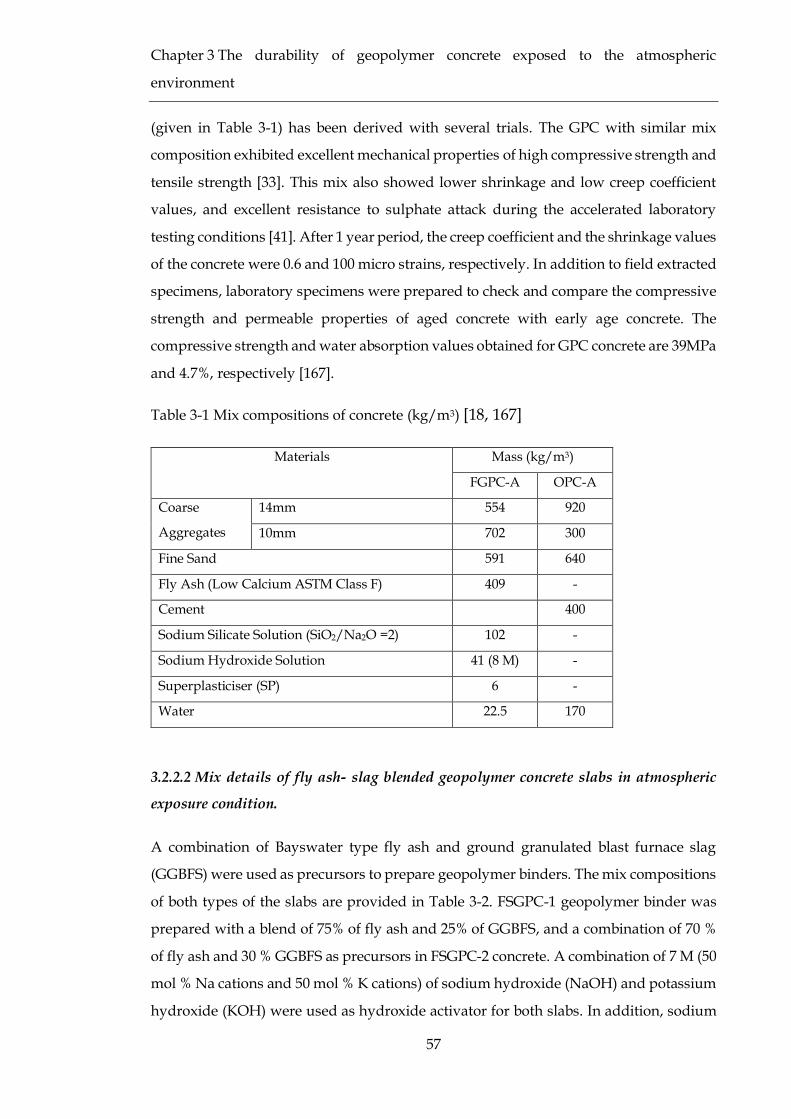
Table 3-1 Mix compositions of concrete (kg/m3) [18, 167] ............................................................. 57
Table 3-2 Mix composition details of fly ash-slag blended geopolymer concrete ......................... 58
Table 3-3 K values obtained for the OPC concrete and the two geopolymer concretes (in
mm/yr0.5) ........................................................................................................................................... 68
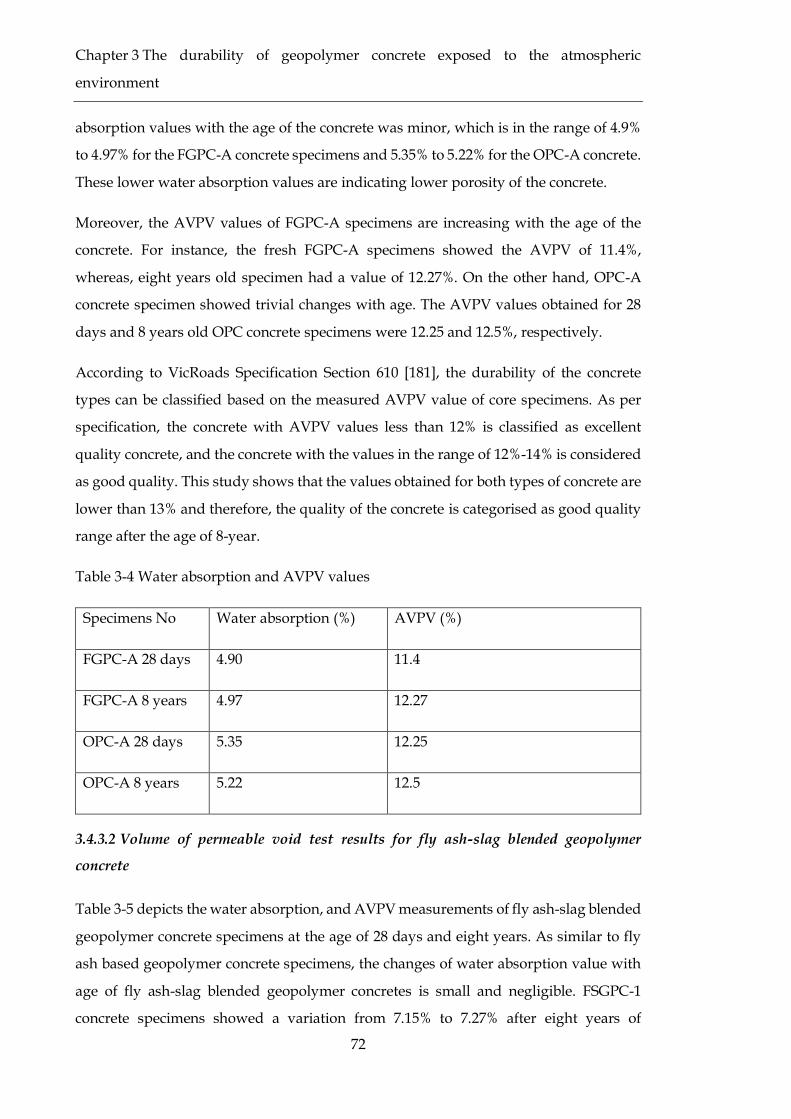
Table 3-4 Water absorption and AVPV values ................................................................................ 72
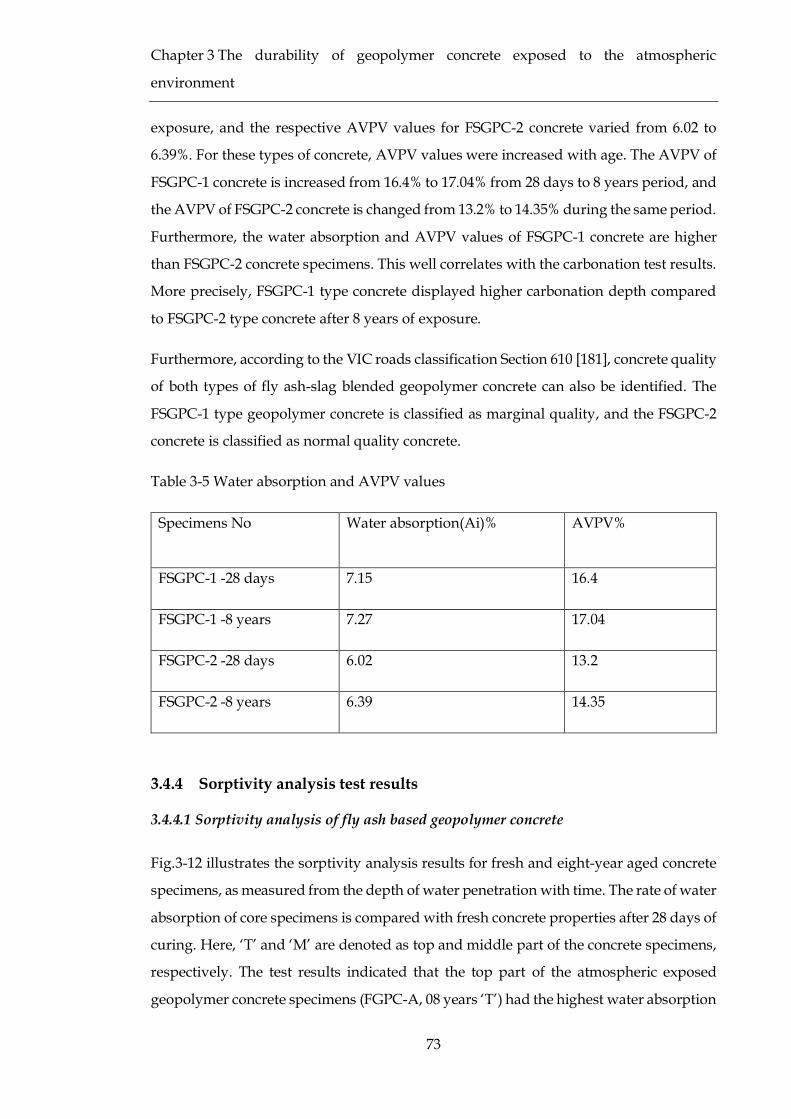
Table 3-5 Water absorption and AVPV values ................................................................................ 73
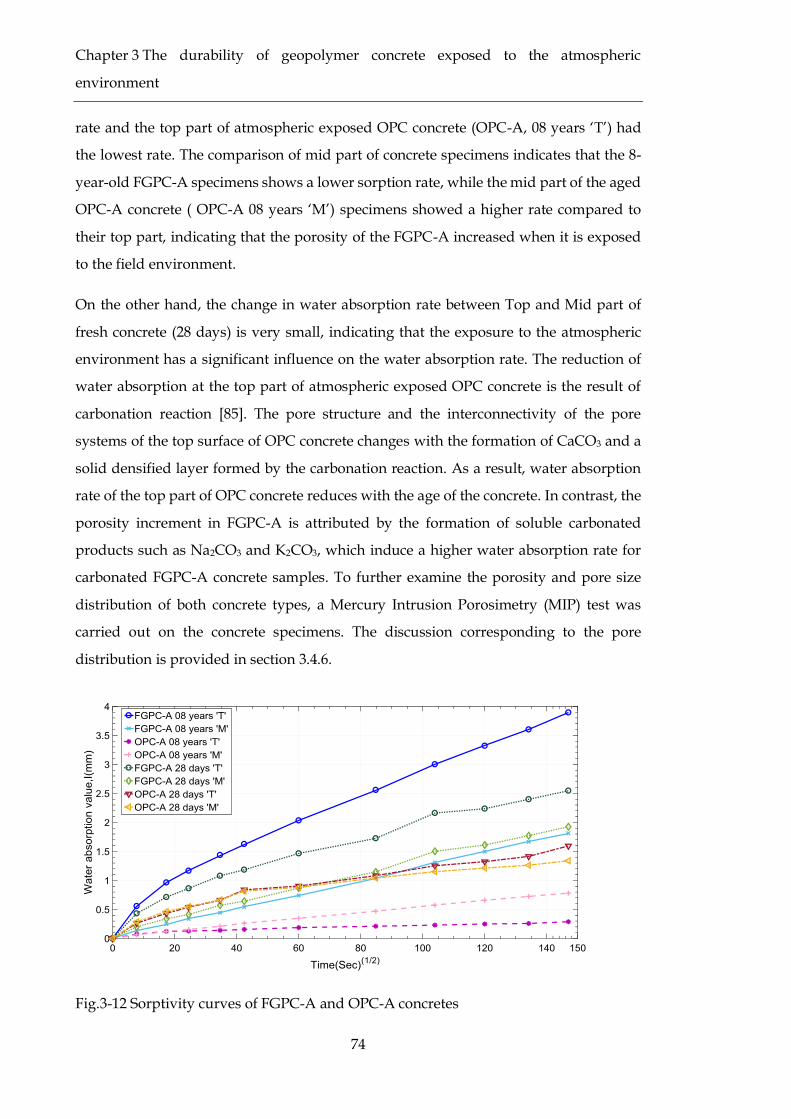
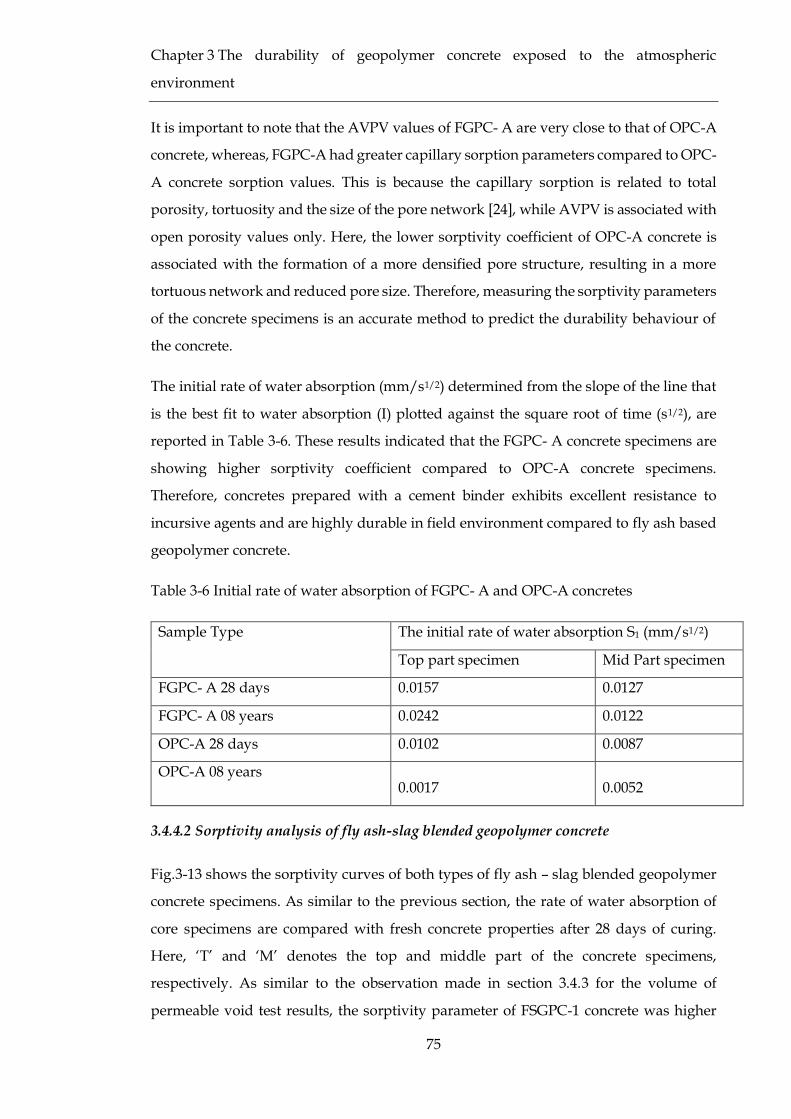
Table 3-6 Initial rate of water absorption of FGPC- A and OPC-A concretes ............................... 75
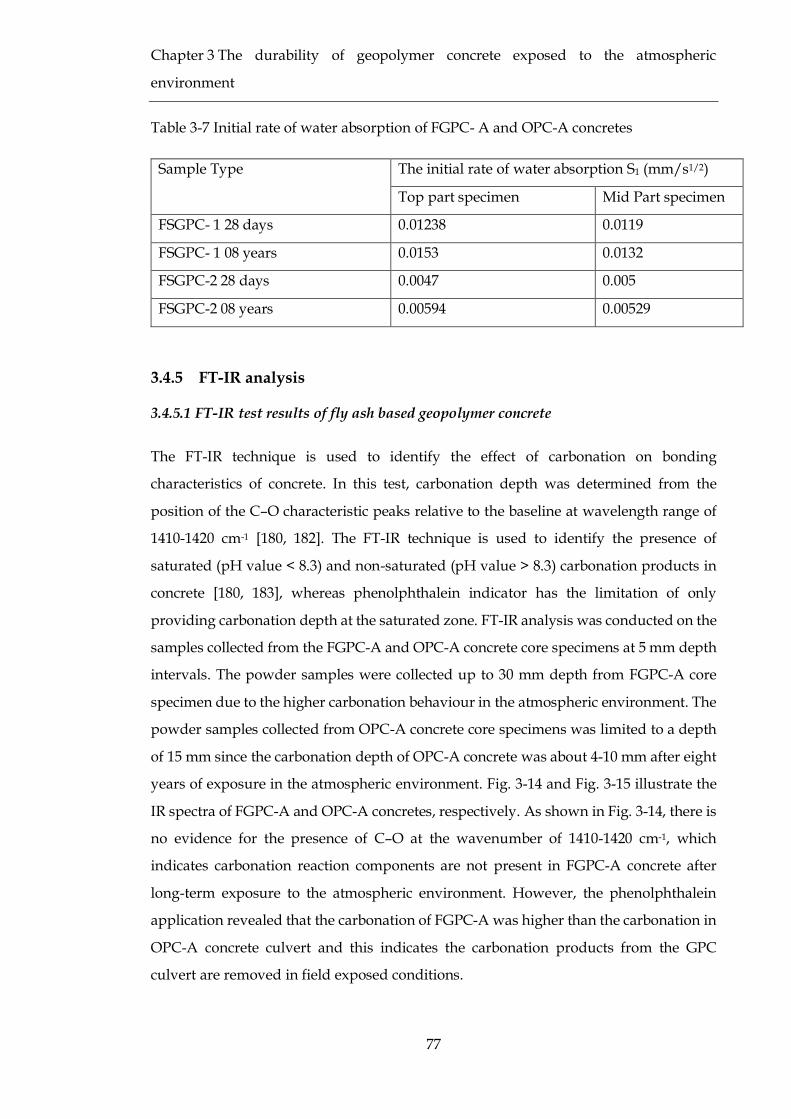
Table 3-7 Initial rate of water absorption of FGPC- A and OPC-A concretes ............................... 77
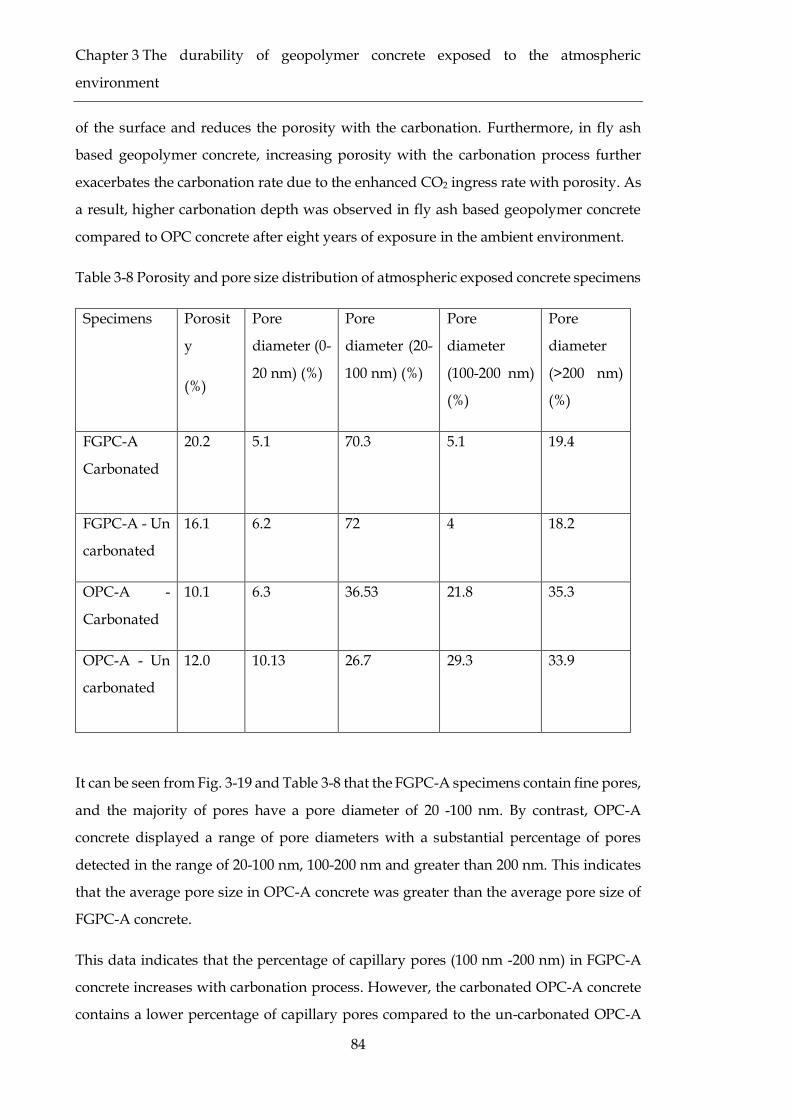
Table 3-8 Porosity and pore size distribution of atmospheric exposed concrete specimens ........ 84
Table 3-9 The pore characteristics details of both types of geopolymer concrete specimens ....... 88
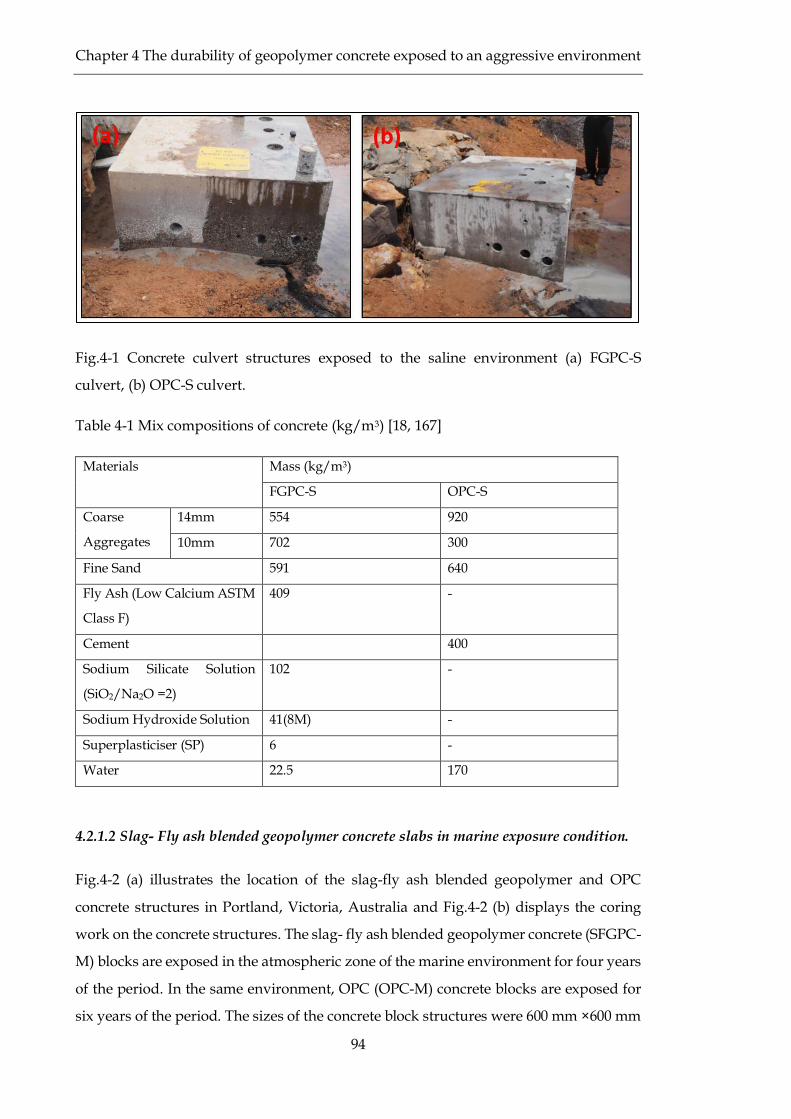
Table 4-1 Mix compositions of concrete (kg/m3) [18, 167] ............................................................. 94
Table 4-2 Mix proportions of OPC-M concrete ............................................................................... 95
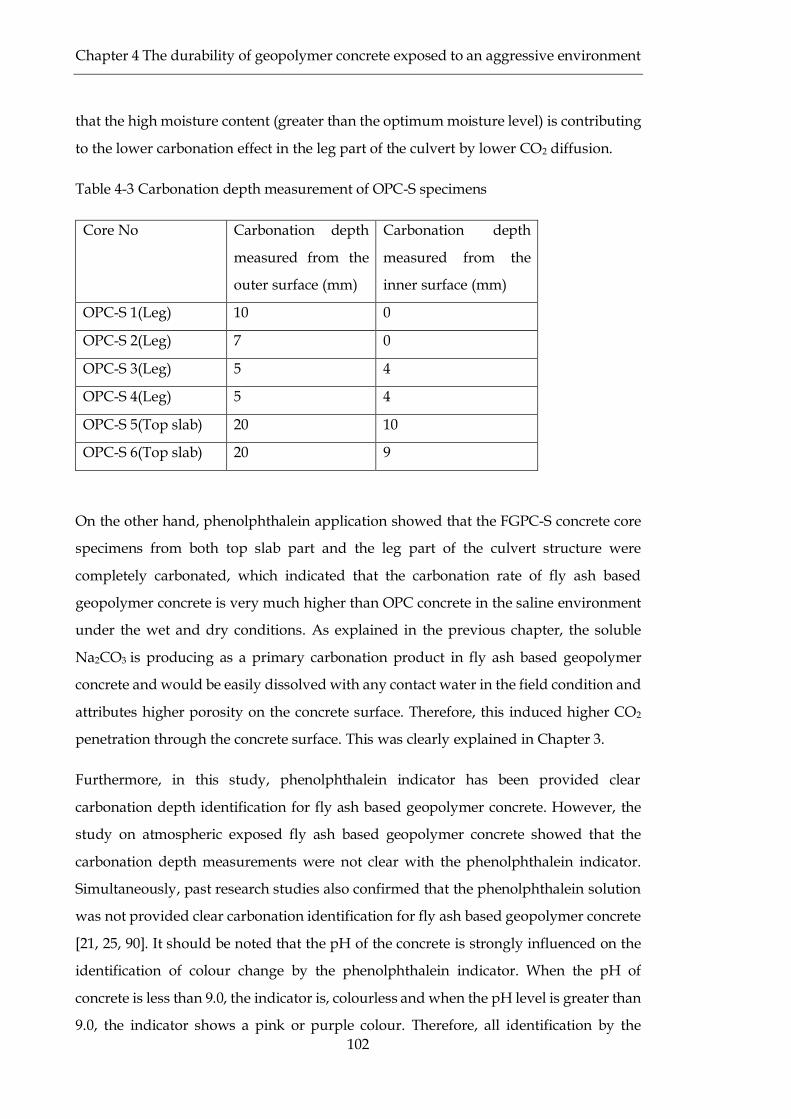
Table 4-3 Carbonation depth measurement of OPC-S specimens ................................................ 102
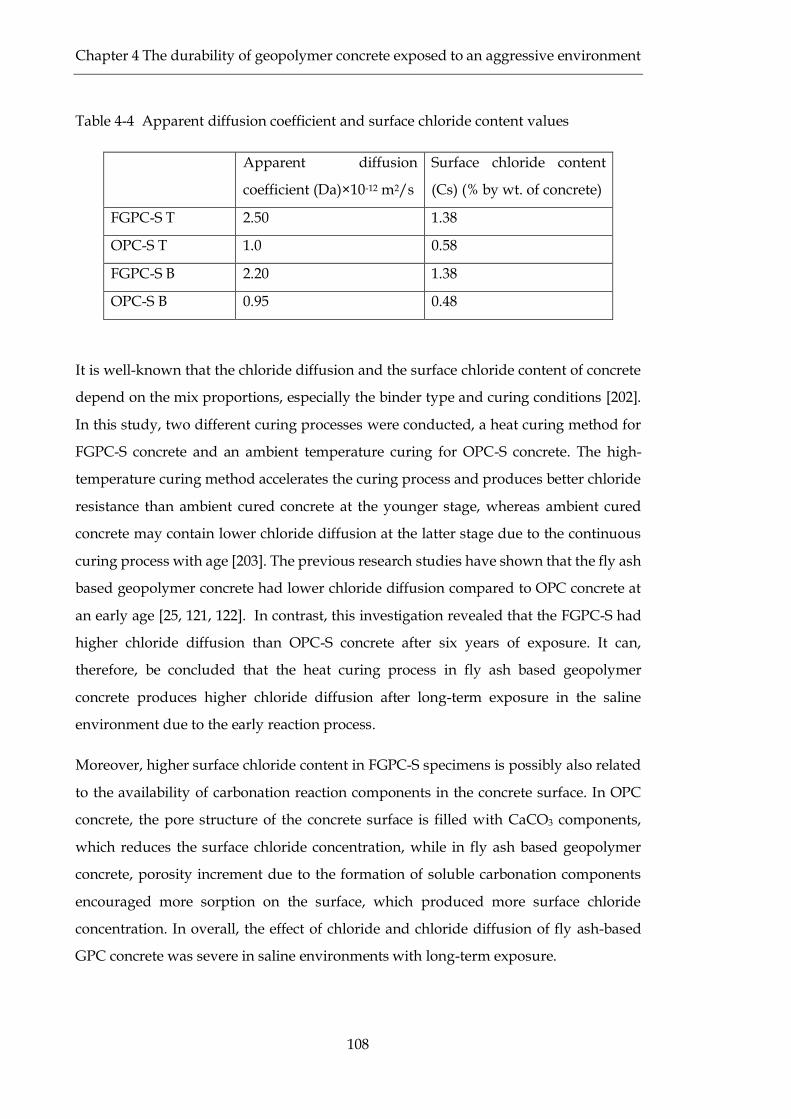
Table 4-4 Apparent diffusion coefficient and surface chloride content values .......................... 108
Table 4-5 Chloride diffusion coefficient and surface chloride content of concrete. .................... 113
Table 4-6 Coefficients of sorptivity values ..................................................................................... 121
Table 4-7 Coefficients of sorptivity values ..................................................................................... 122
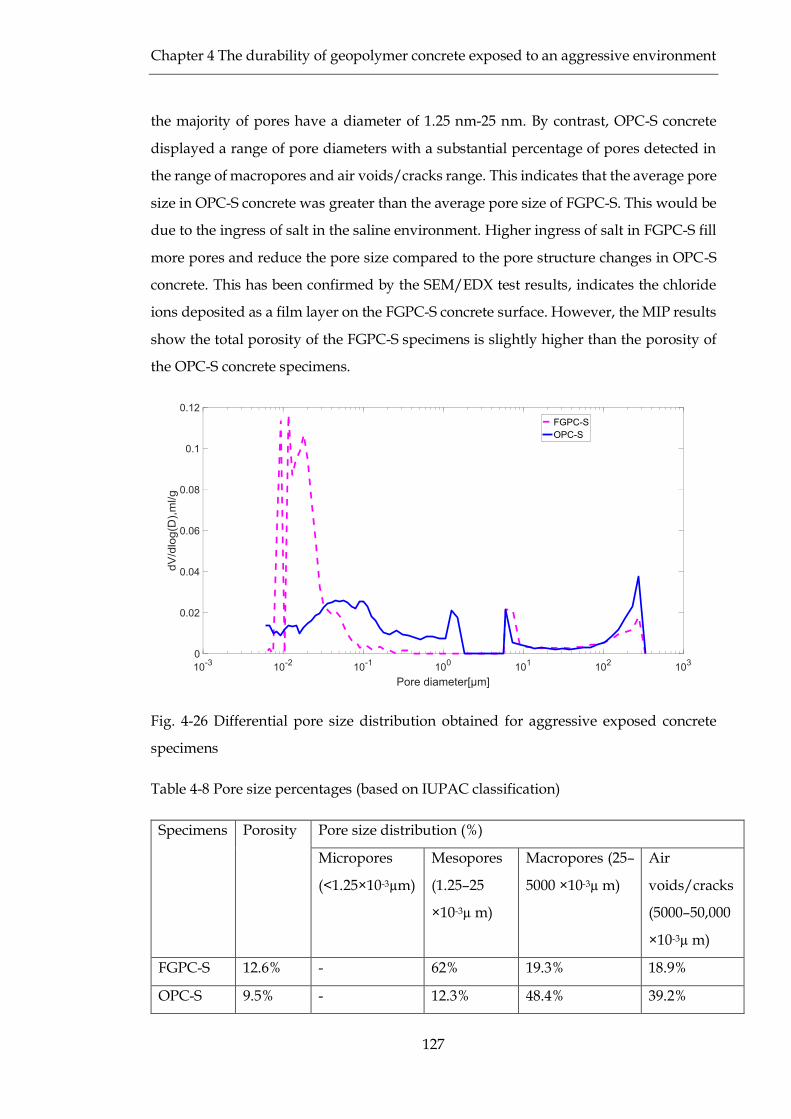
Table 4-8 Pore size percentages (based on IUPAC classification) ................................................ 127
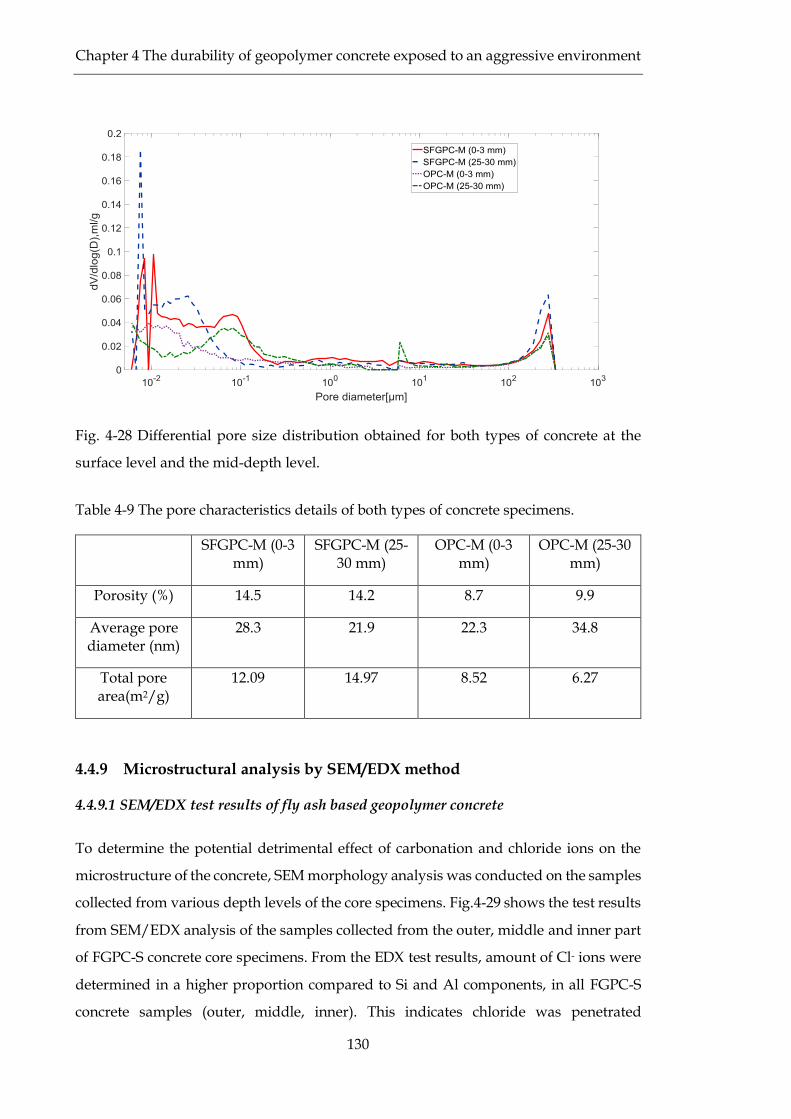
Table 4-9 The pore characteristics details of both types of concrete specimens. ......................... 130
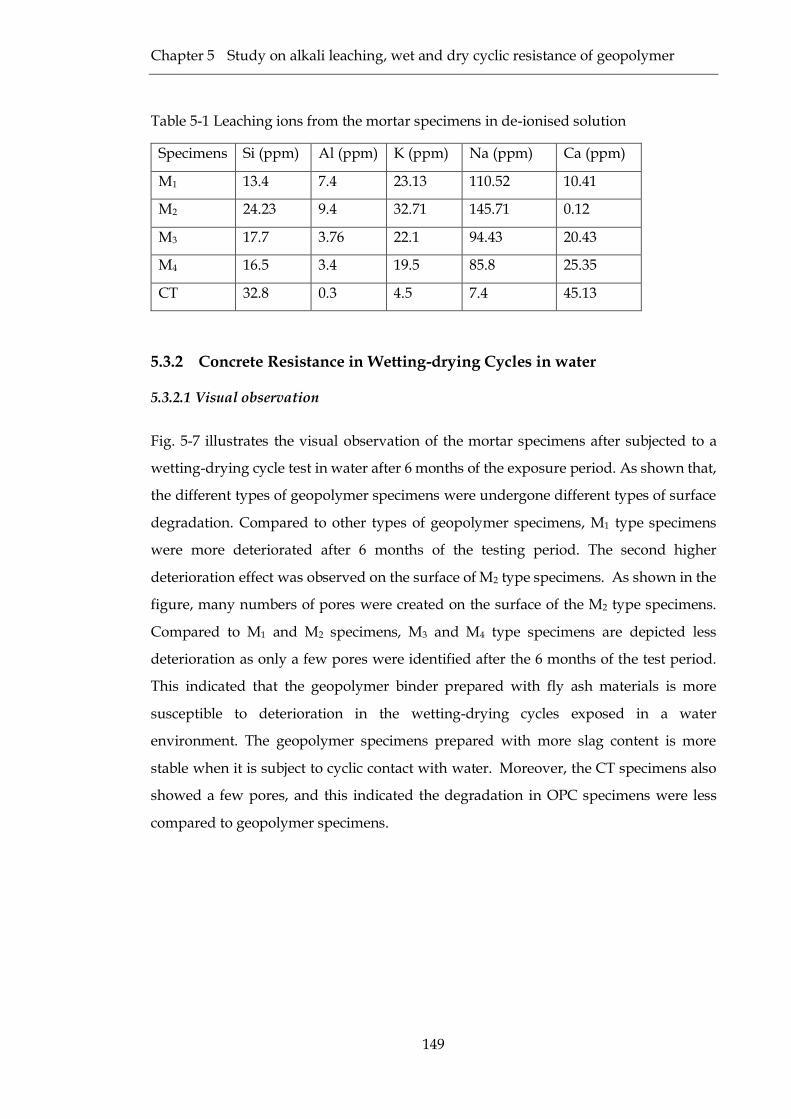
Table 5-1 Leaching ions from the mortar specimens in de-ionised solution ............................... 149
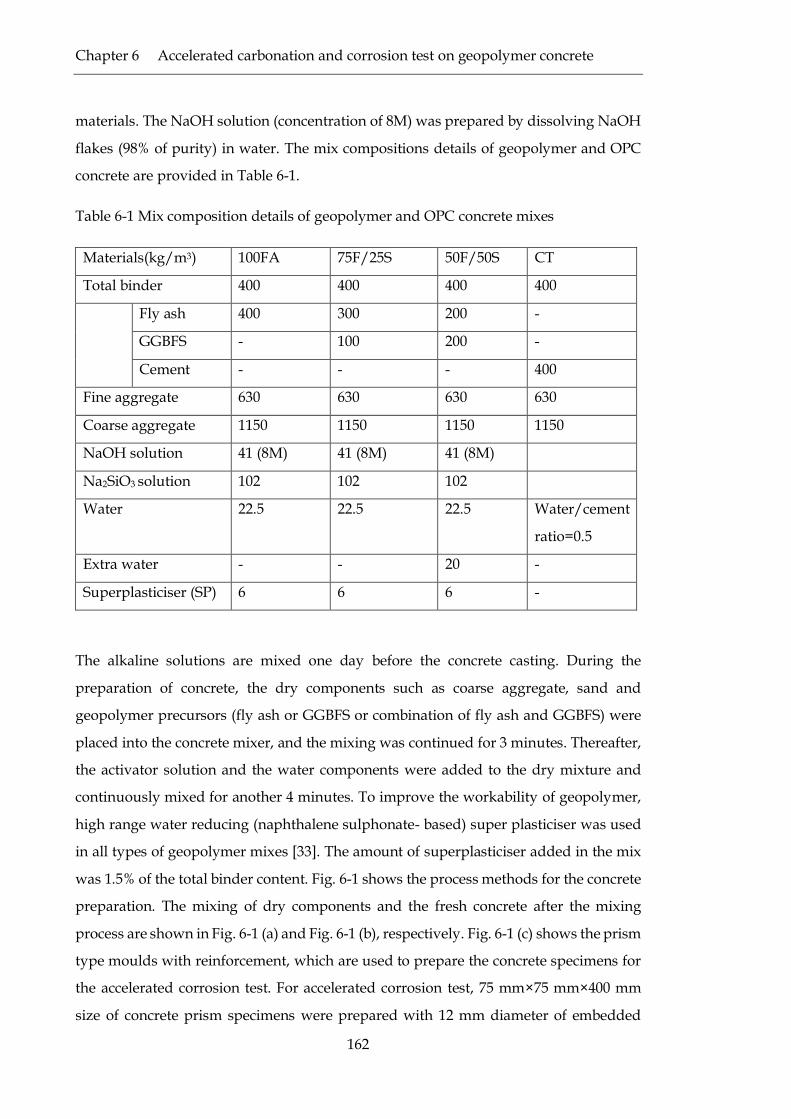
Table 6-1 Mix composition details of geopolymer and OPC concrete mixes .............................. 162
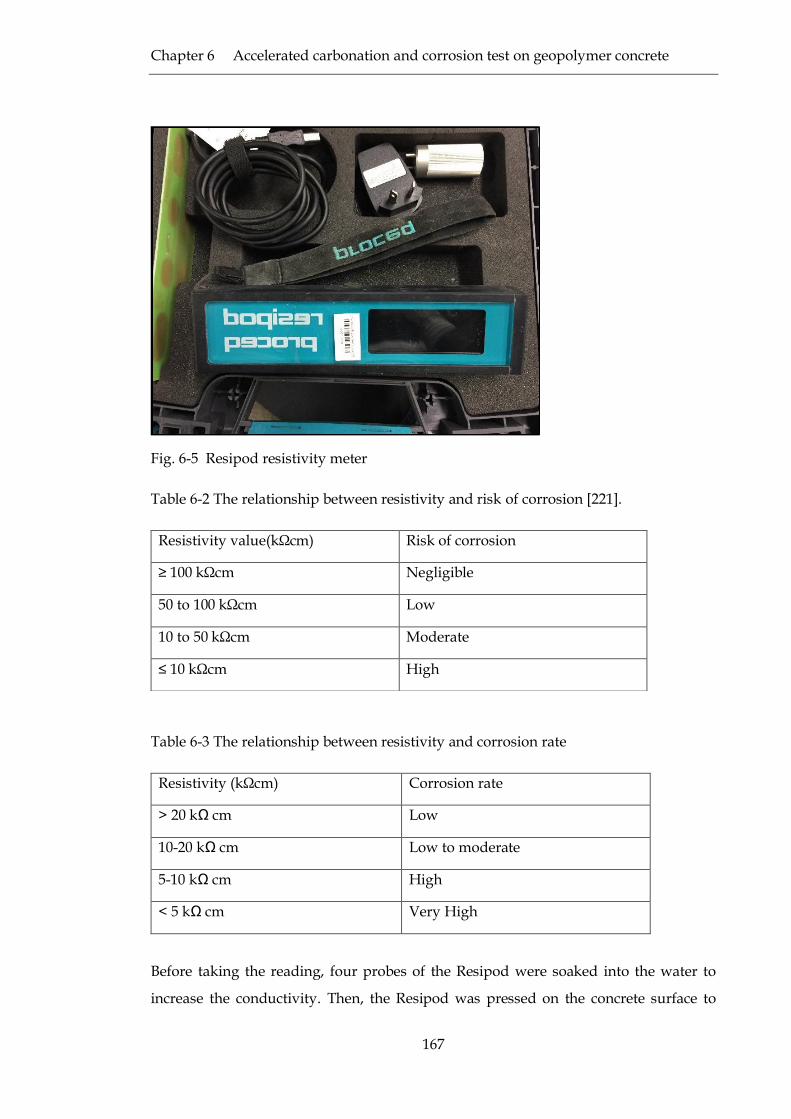
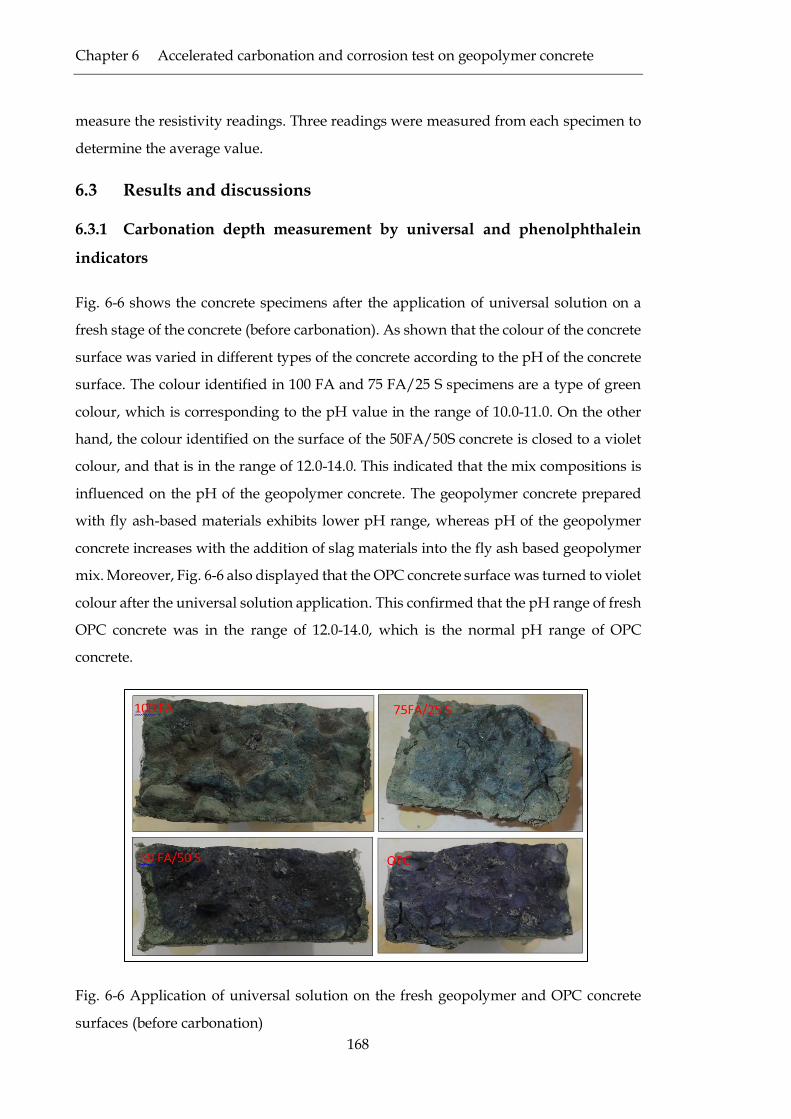
Table 6-2 The relationship between resistivity and risk of corrosion [221]. ................................ 167
Table 6-3 The relationship between resistivity and corrosion rate .............................................. 167
Table 7-1 Mix compositions of concrete (kg/m3) .......................................................................... 188
Page 17
xvii
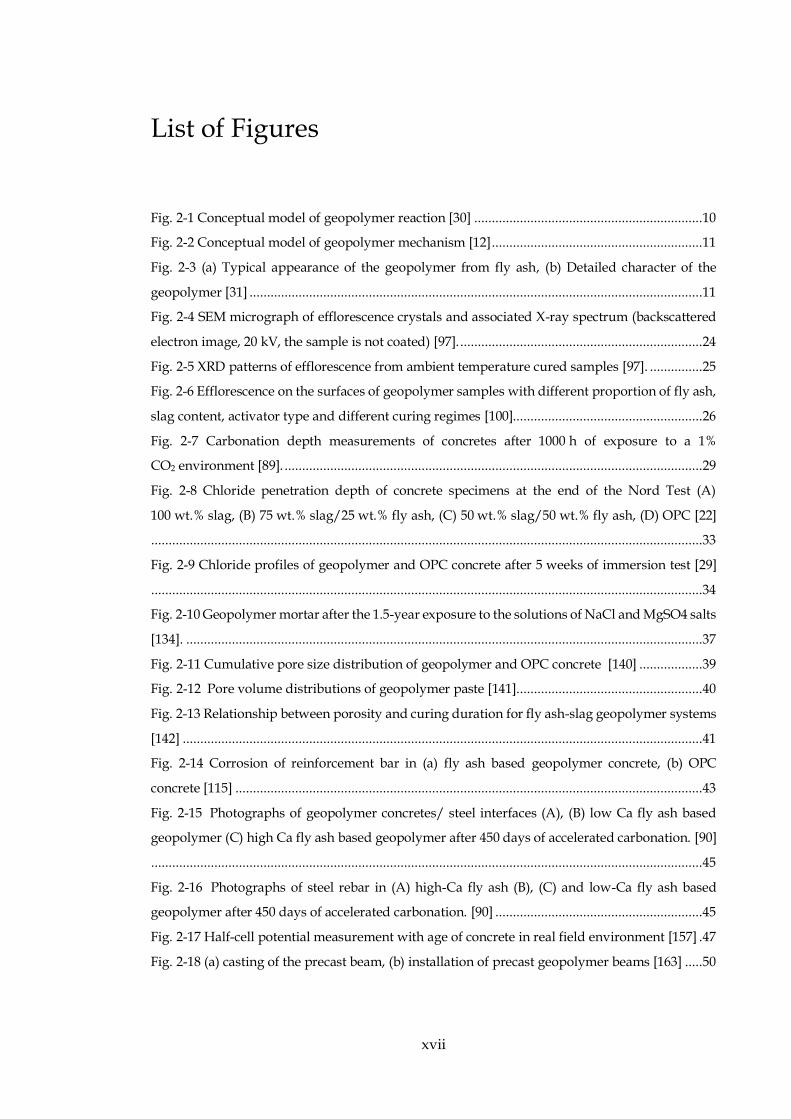
List of Figures
Fig. 2-1 Conceptual model of geopolymer reaction [30] .................................................................10
Fig. 2-2 Conceptual model of geopolymer mechanism [12] ............................................................11
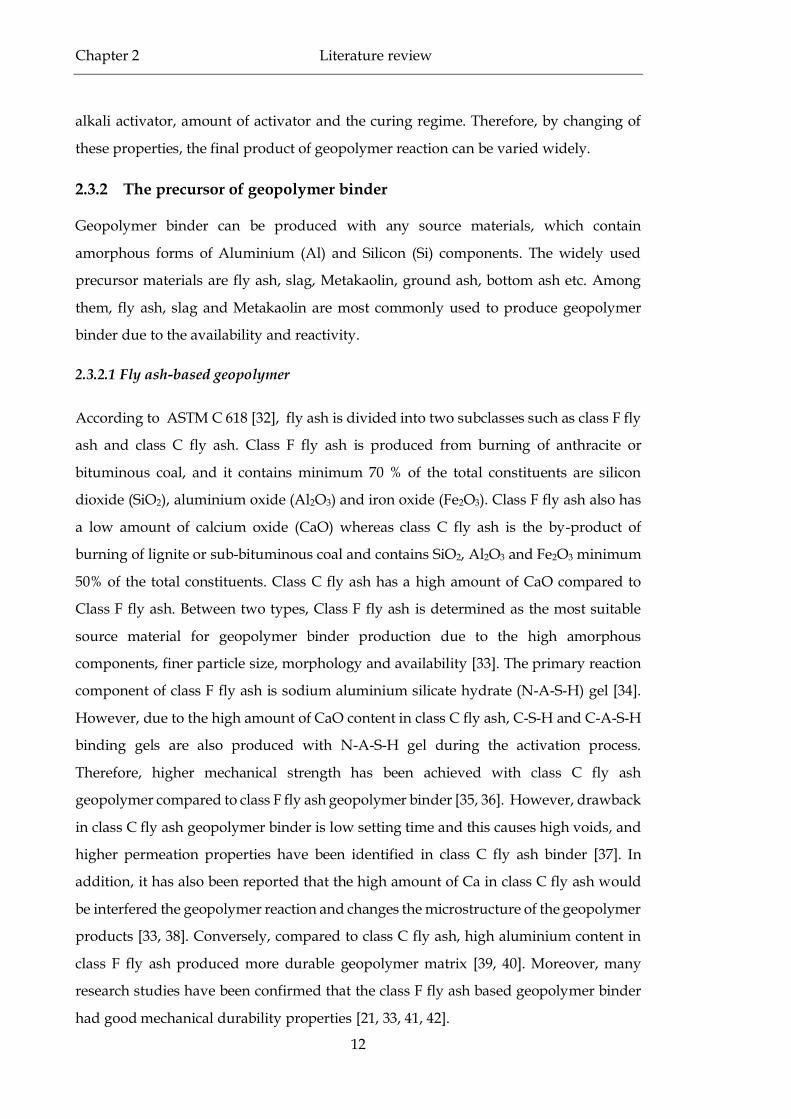
Fig. 2-3 (a) Typical appearance of the geopolymer from fly ash, (b) Detailed character of the
geopolymer [31] .................................................................................................................................11
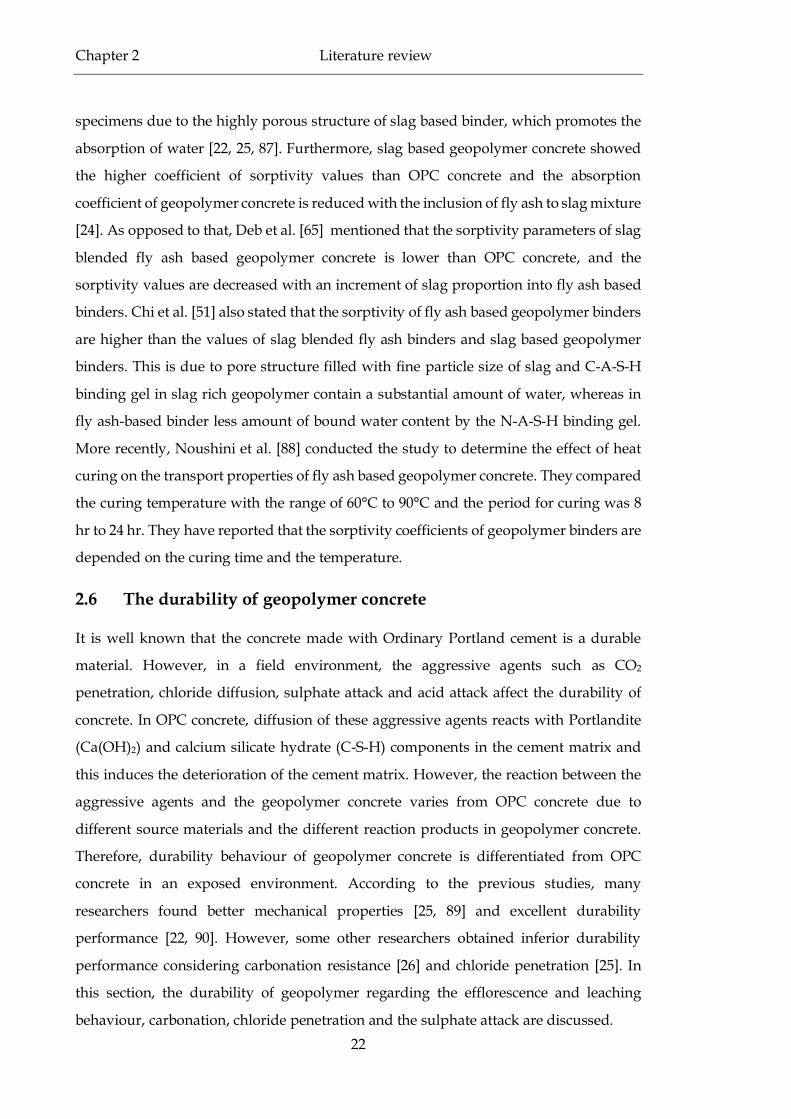
Fig. 2-4 SEM micrograph of efflorescence crystals and associated X-ray spectrum (backscattered
electron image, 20 kV, the sample is not coated) [97]. .....................................................................24
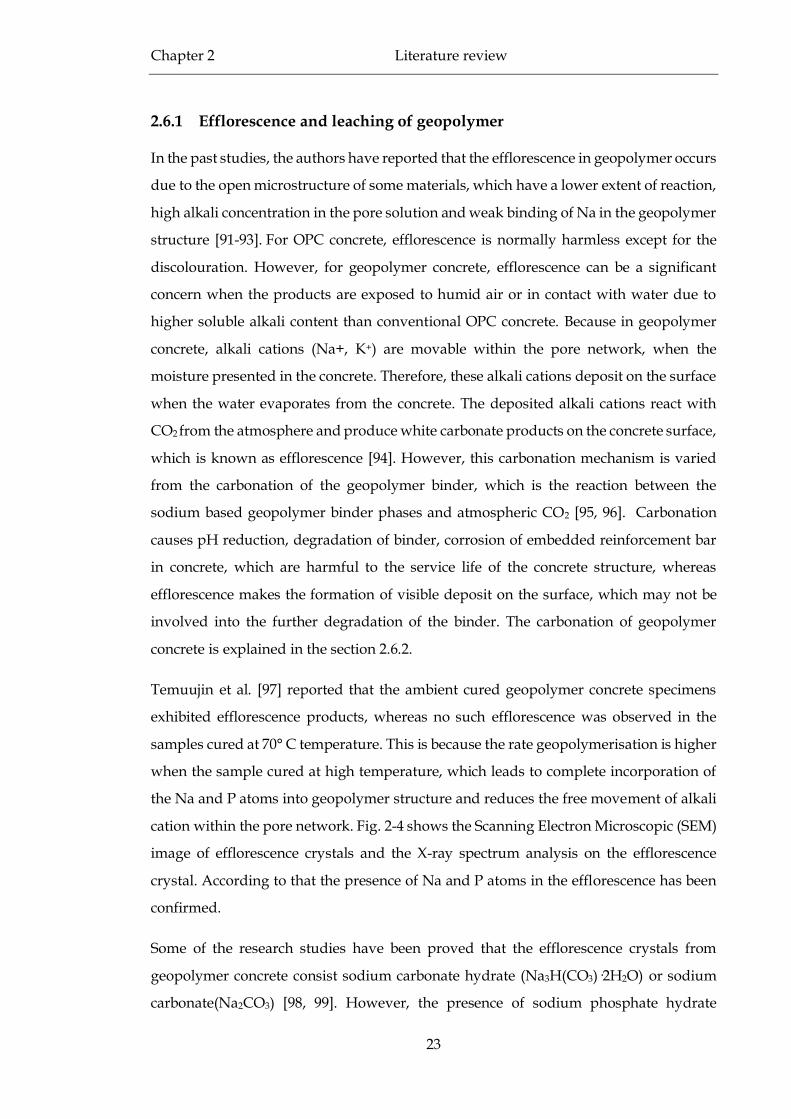
Fig. 2-5 XRD patterns of efflorescence from ambient temperature cured samples [97]. ...............25
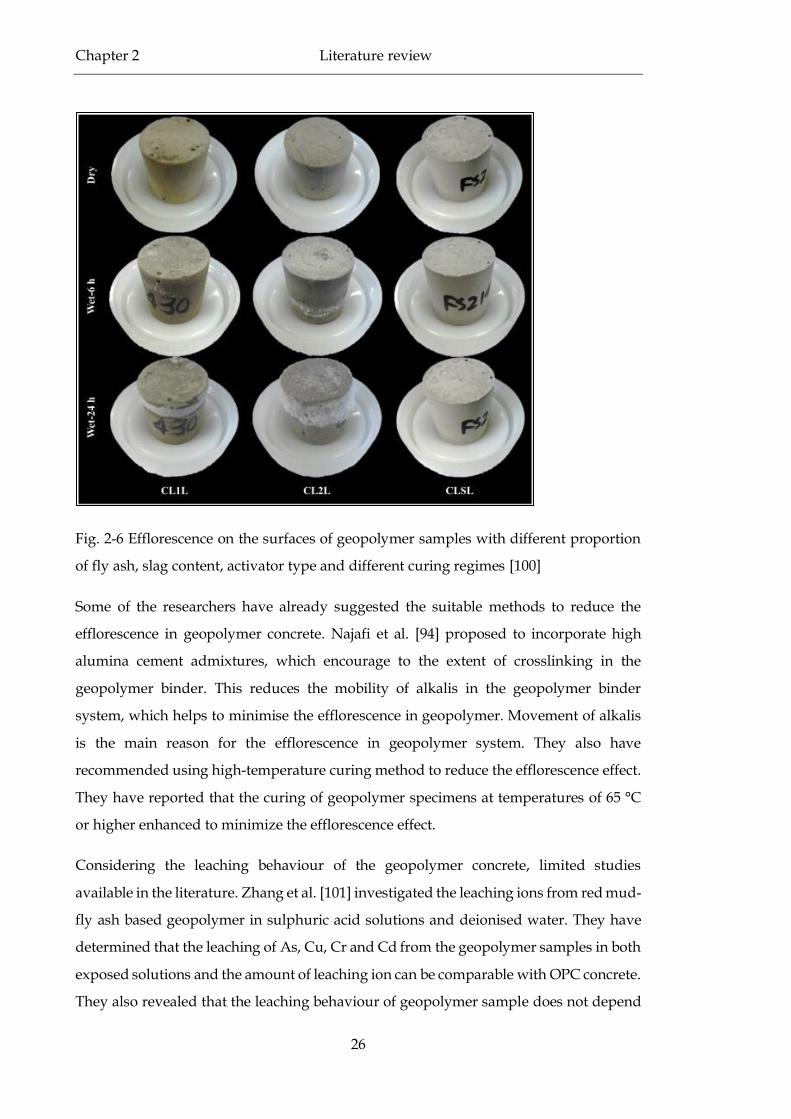
Fig. 2-6 Efflorescence on the surfaces of geopolymer samples with different proportion of fly ash,
slag content, activator type and different curing regimes [100]......................................................26
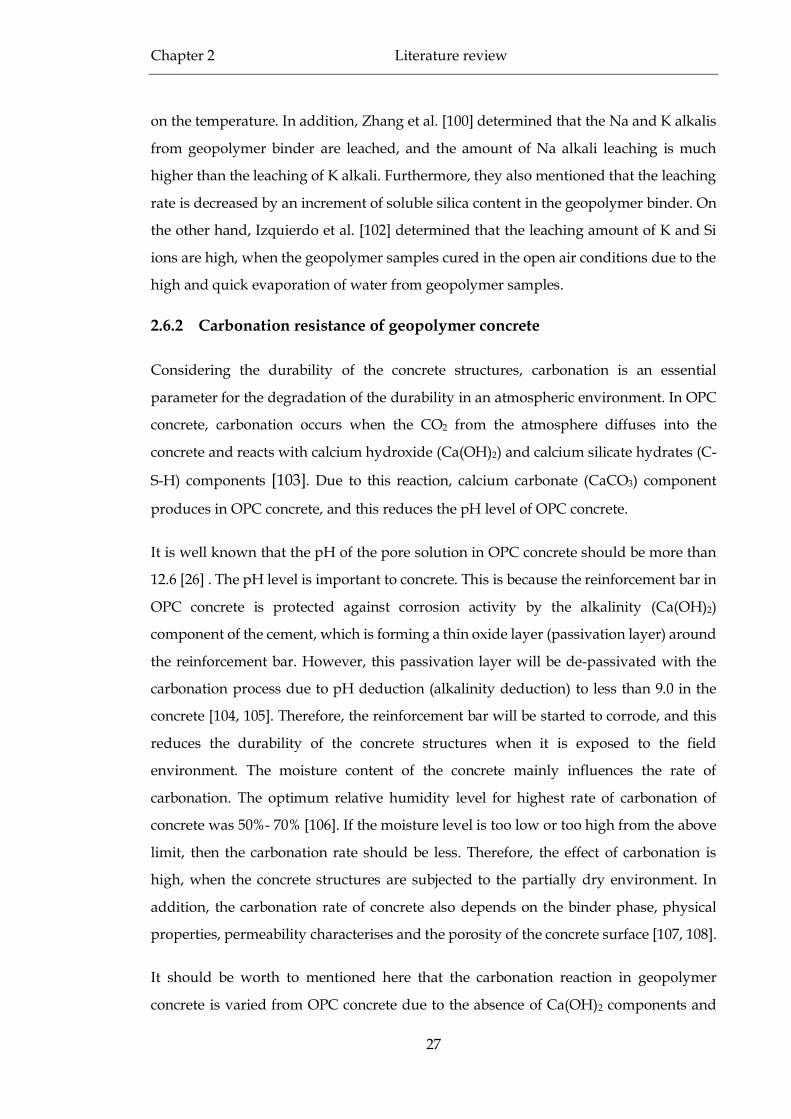
Fig. 2-7 Carbonation depth measurements of concretes after 1000 h of exposure to a 1%
CO2 environment [89]. .......................................................................................................................29
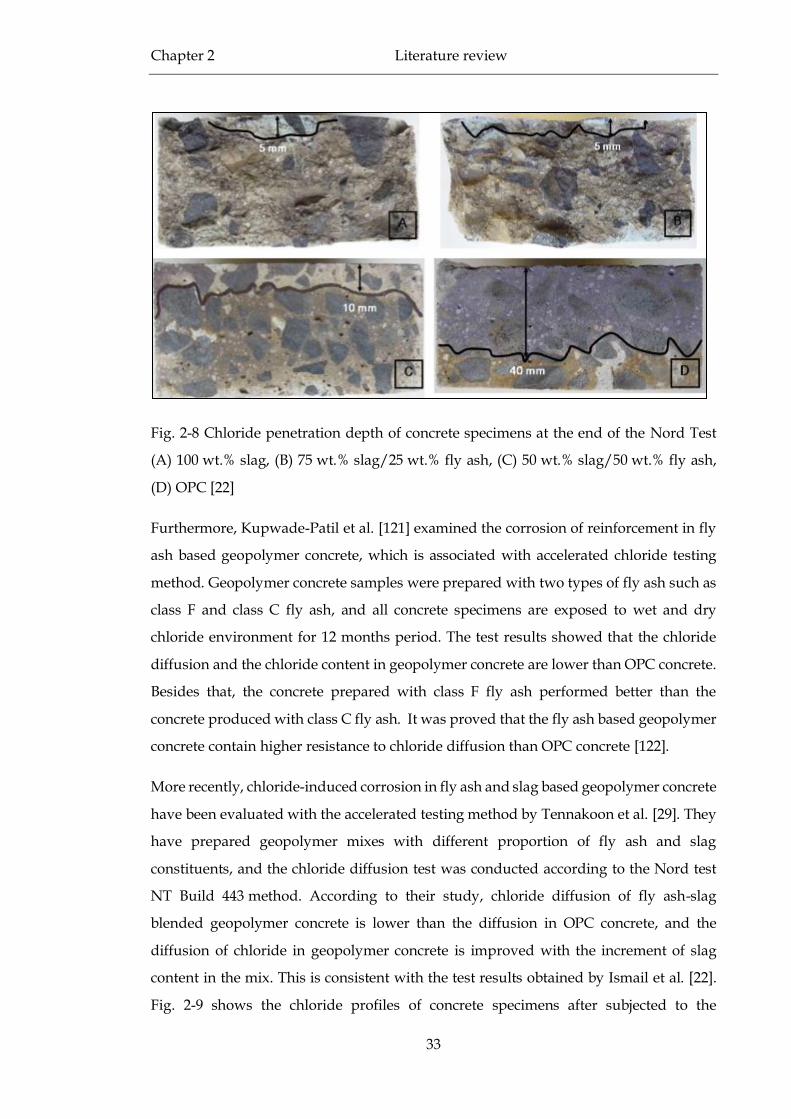
Fig. 2-8 Chloride penetration depth of concrete specimens at the end of the Nord Test (A)
100 wt.% slag, (B) 75 wt.% slag/25 wt.% fly ash, (C) 50 wt.% slag/50 wt.% fly ash, (D) OPC [22]
.............................................................................................................................................................33
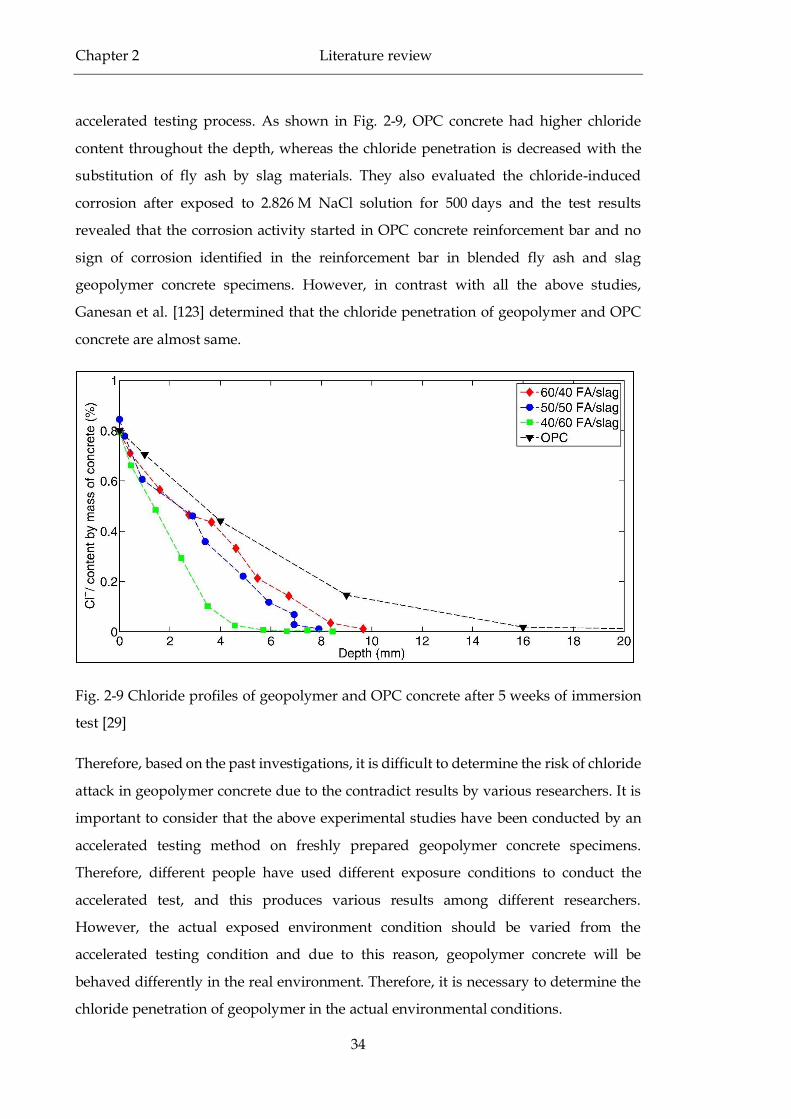
Fig. 2-9 Chloride profiles of geopolymer and OPC concrete after 5 weeks of immersion test [29]
.............................................................................................................................................................34
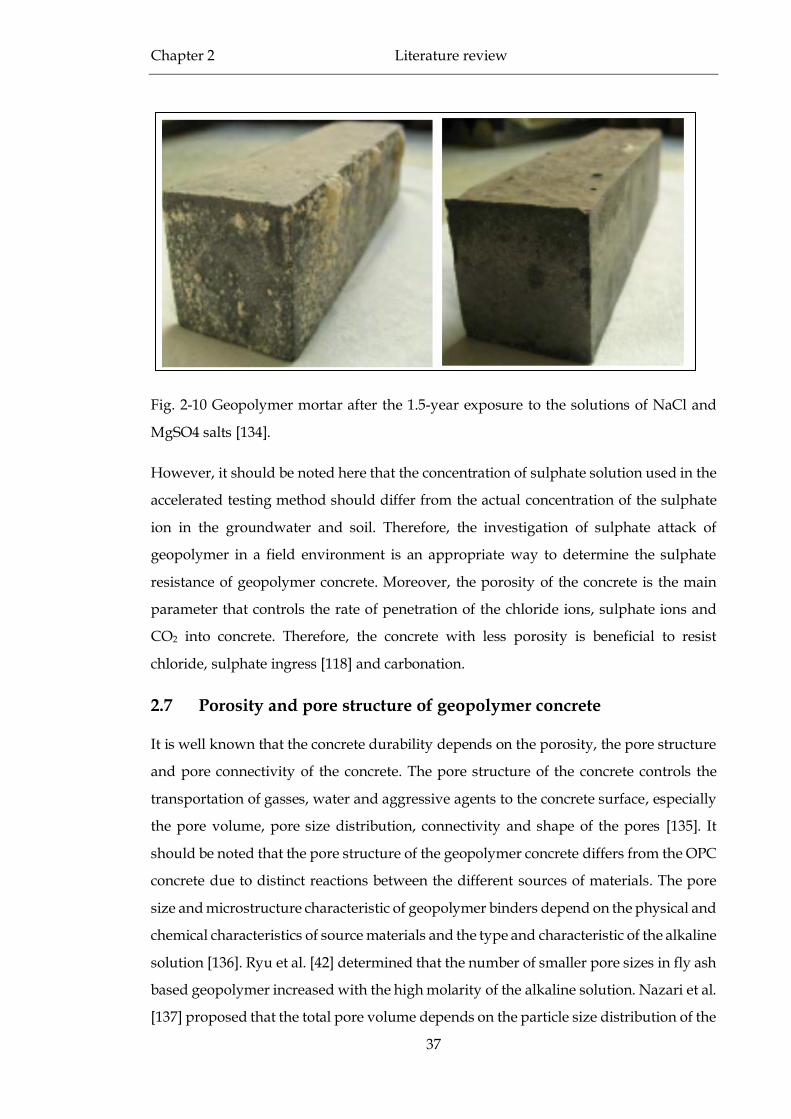
Fig. 2-10 Geopolymer mortar after the 1.5-year exposure to the solutions of NaCl and MgSO4 salts
[134]. ...................................................................................................................................................37
Fig. 2-11 Cumulative pore size distribution of geopolymer and OPC concrete [140] ..................39
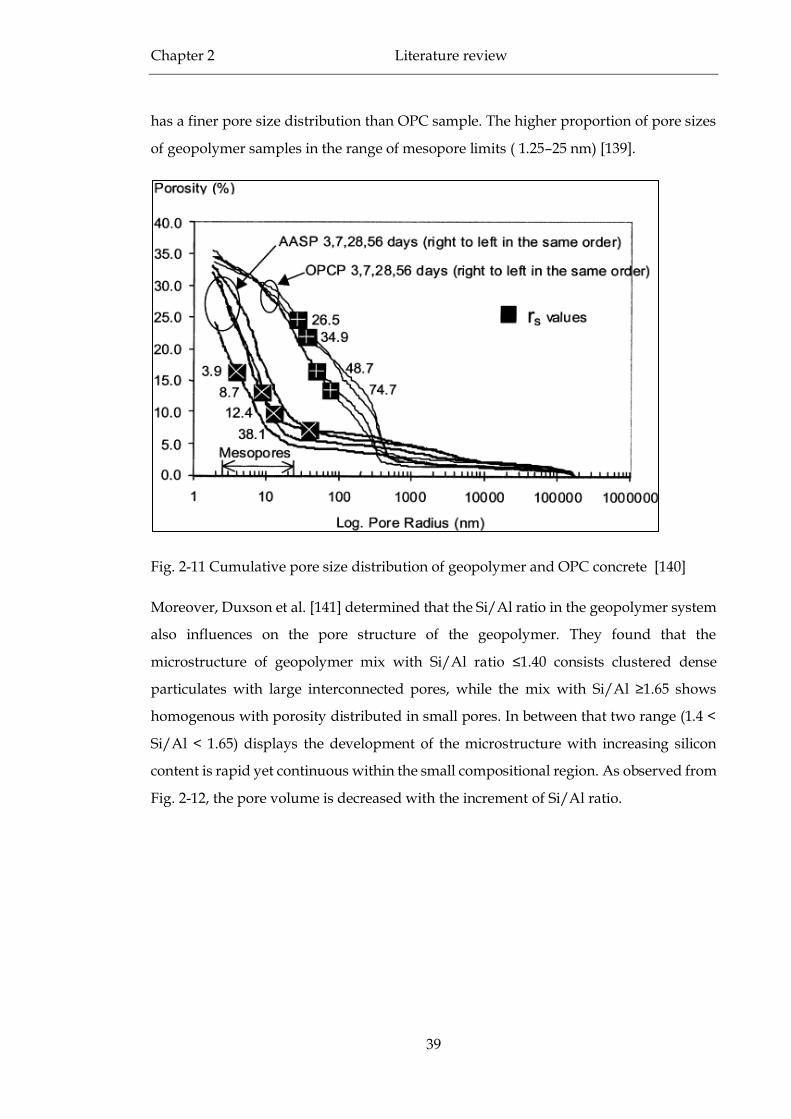
Fig. 2-12 Pore volume distributions of geopolymer paste [141].....................................................40
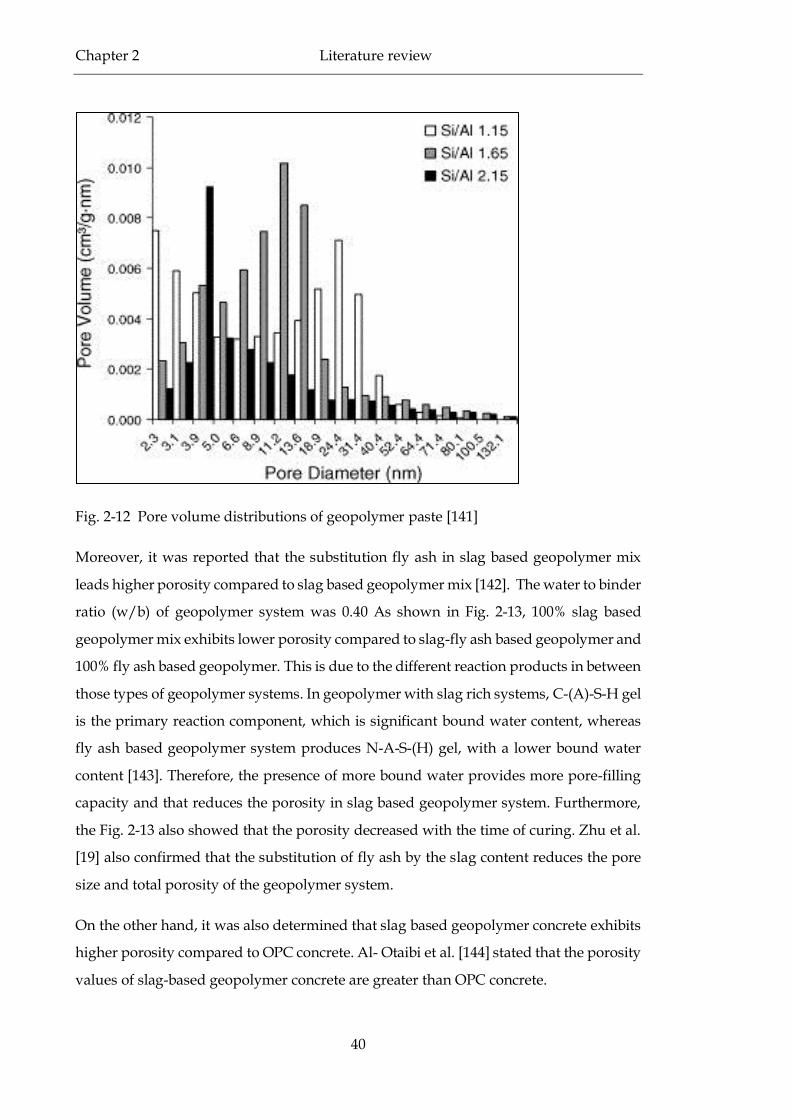
Fig. 2-13 Relationship between porosity and curing duration for fly ash-slag geopolymer systems
[142] ....................................................................................................................................................41
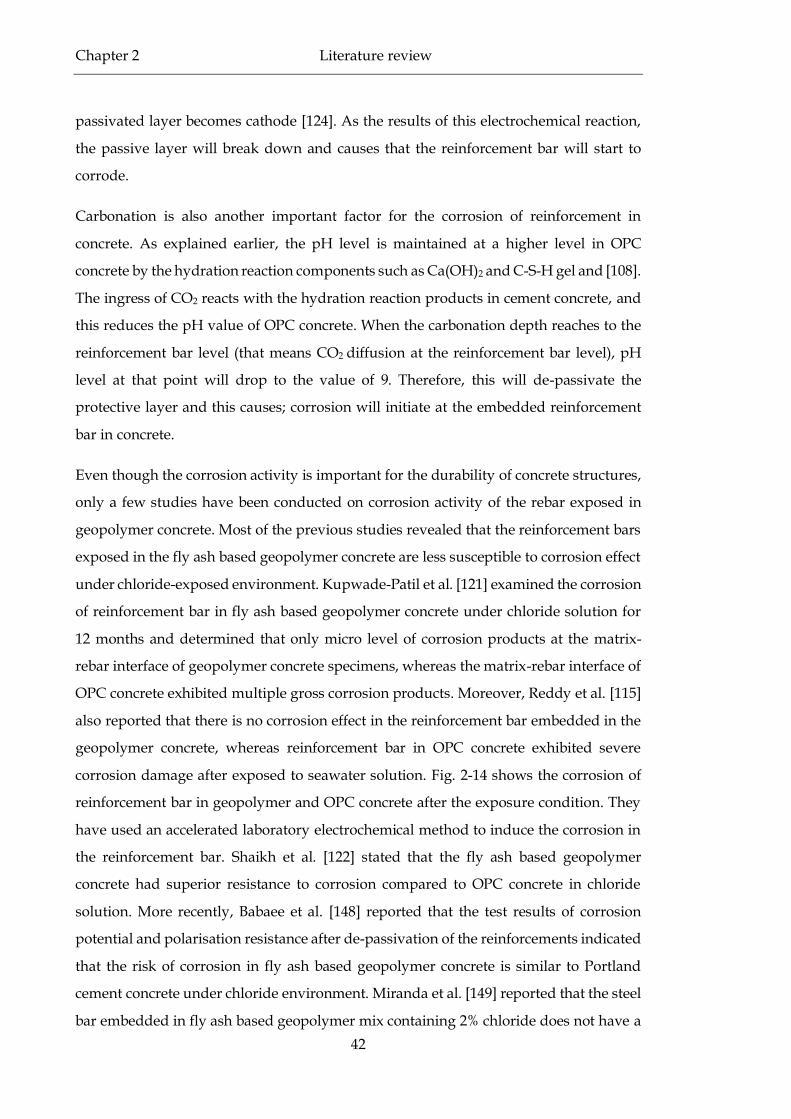
Fig. 2-14 Corrosion of reinforcement bar in (a) fly ash based geopolymer concrete, (b) OPC
concrete [115] .....................................................................................................................................43
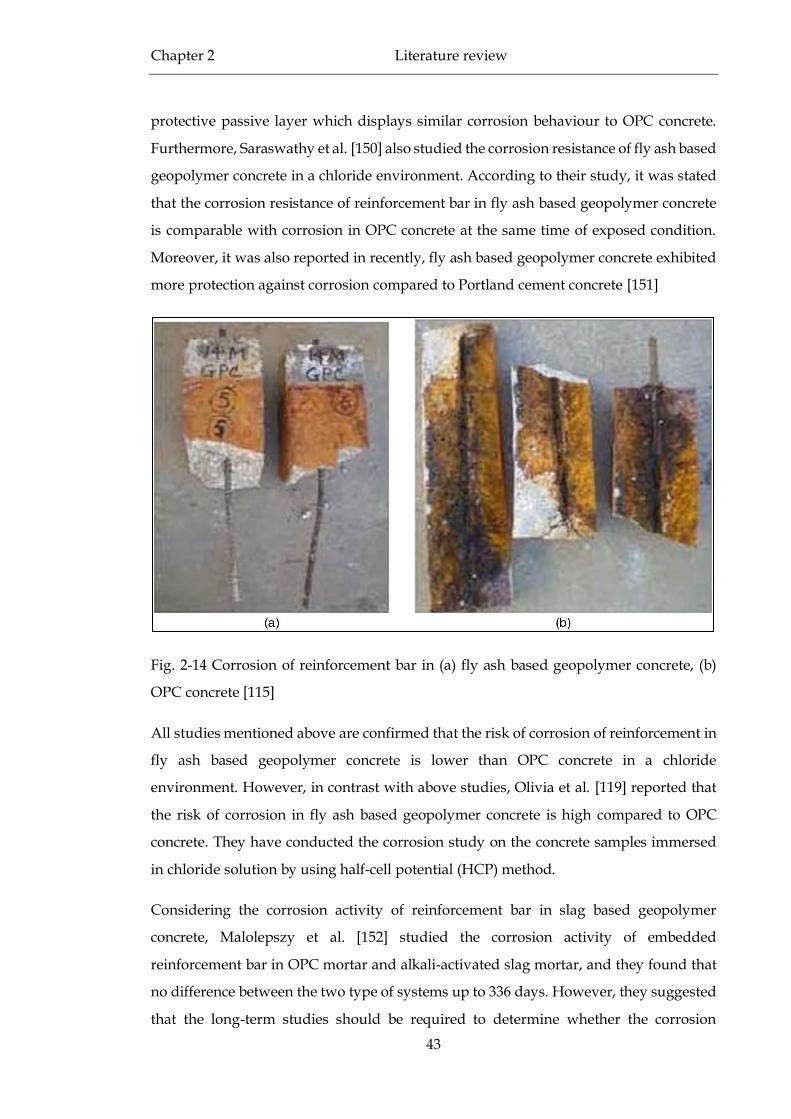
Fig. 2-15 Photographs of geopolymer concretes/ steel interfaces (A), (B) low Ca fly ash based
geopolymer (C) high Ca fly ash based geopolymer after 450 days of accelerated carbonation. [90]
.............................................................................................................................................................45
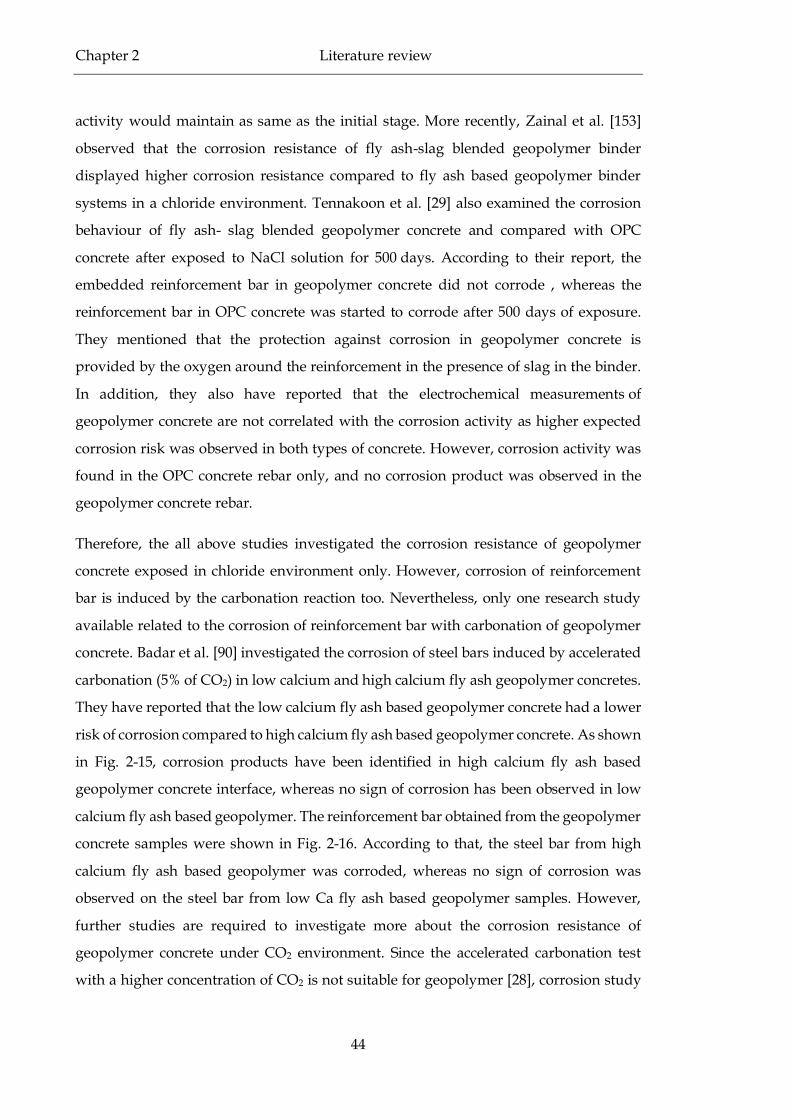
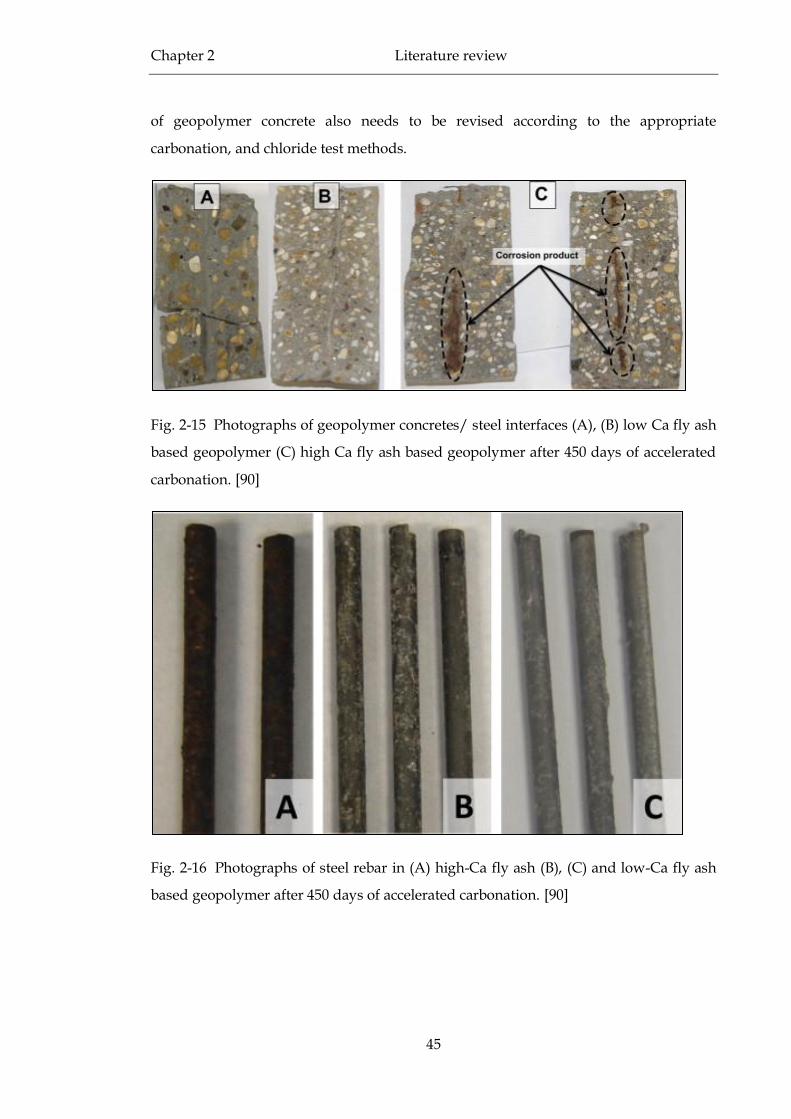
Fig. 2-16 Photographs of steel rebar in (A) high-Ca fly ash (B), (C) and low-Ca fly ash based
geopolymer after 450 days of accelerated carbonation. [90] ...........................................................45
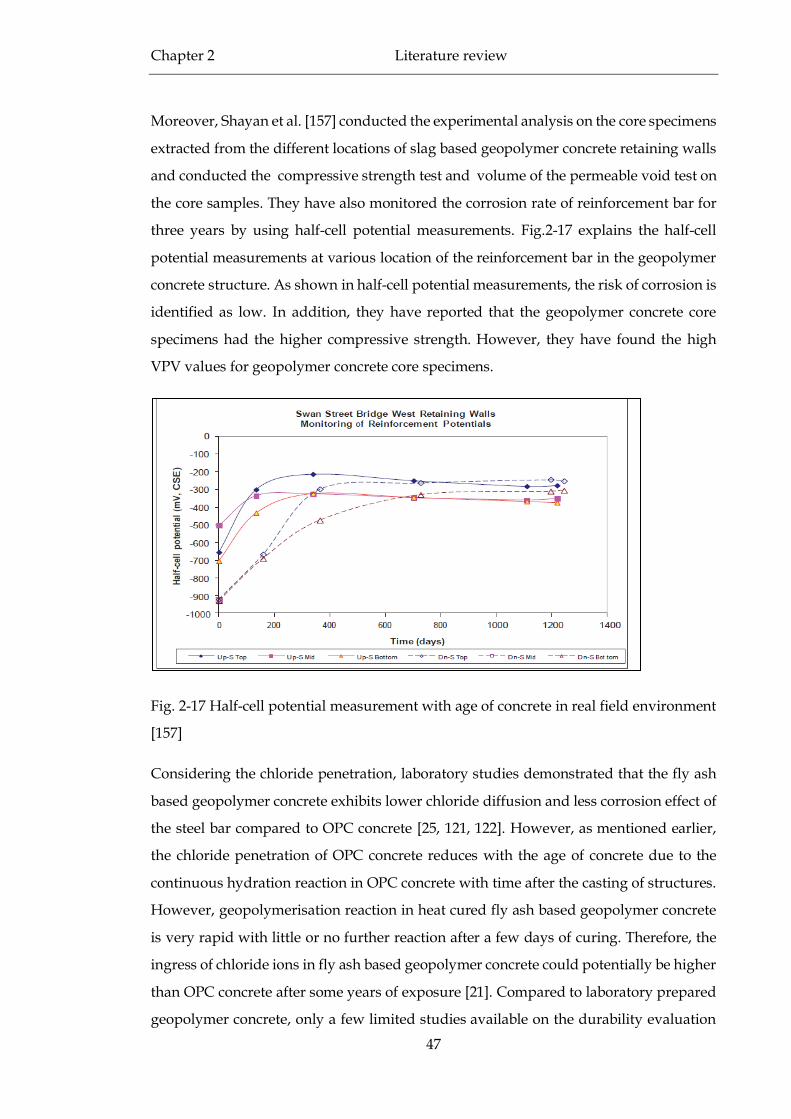
Fig. 2-17 Half-cell potential measurement with age of concrete in real field environment [157] .47
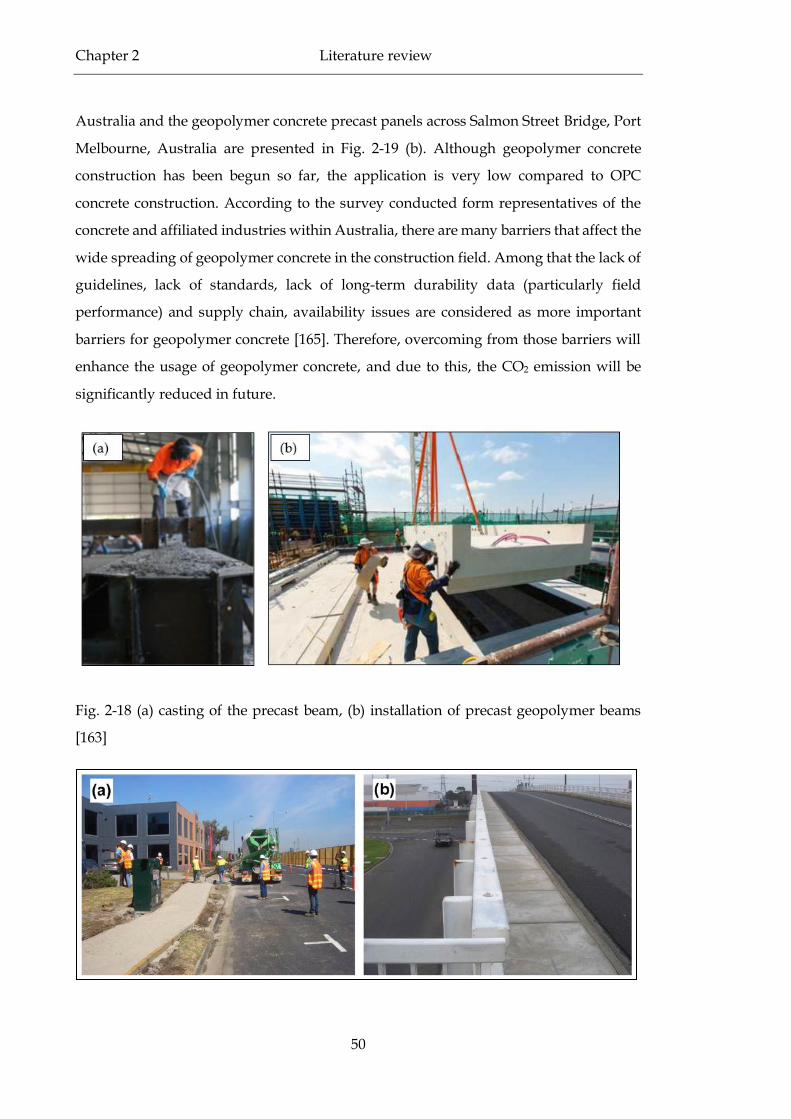
Fig. 2-18 (a) casting of the precast beam, (b) installation of precast geopolymer beams [163] .....50
Page 18
xviii
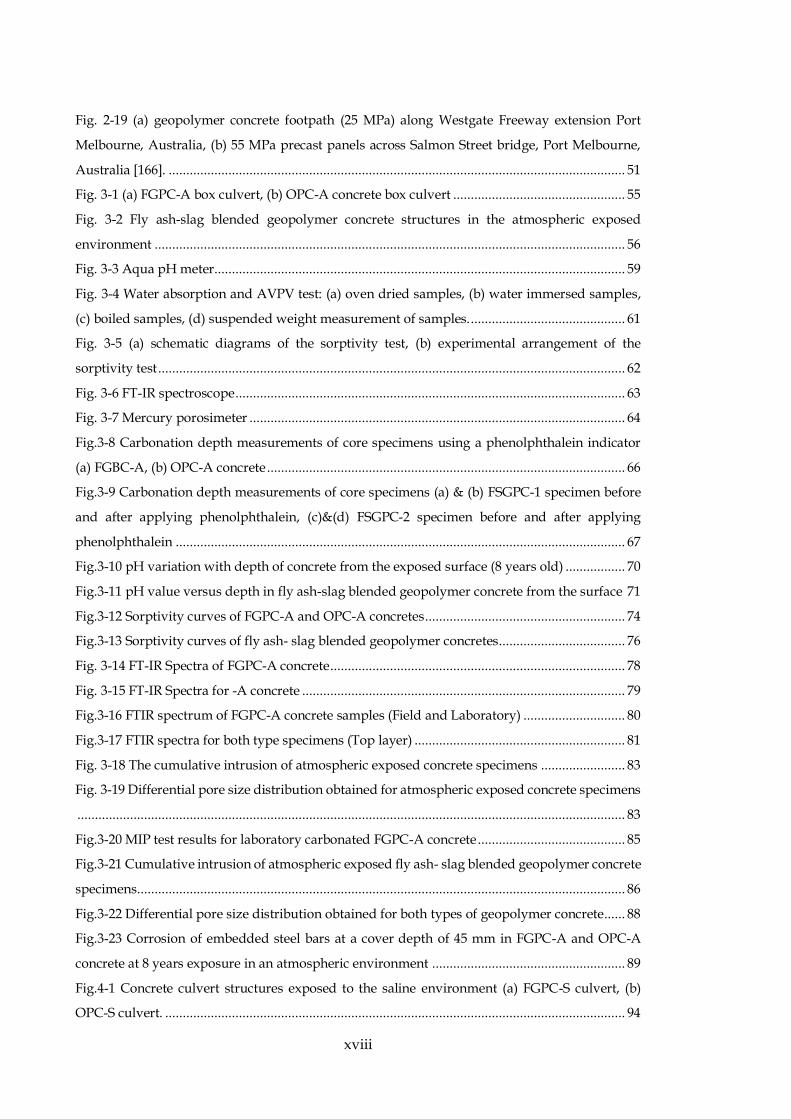
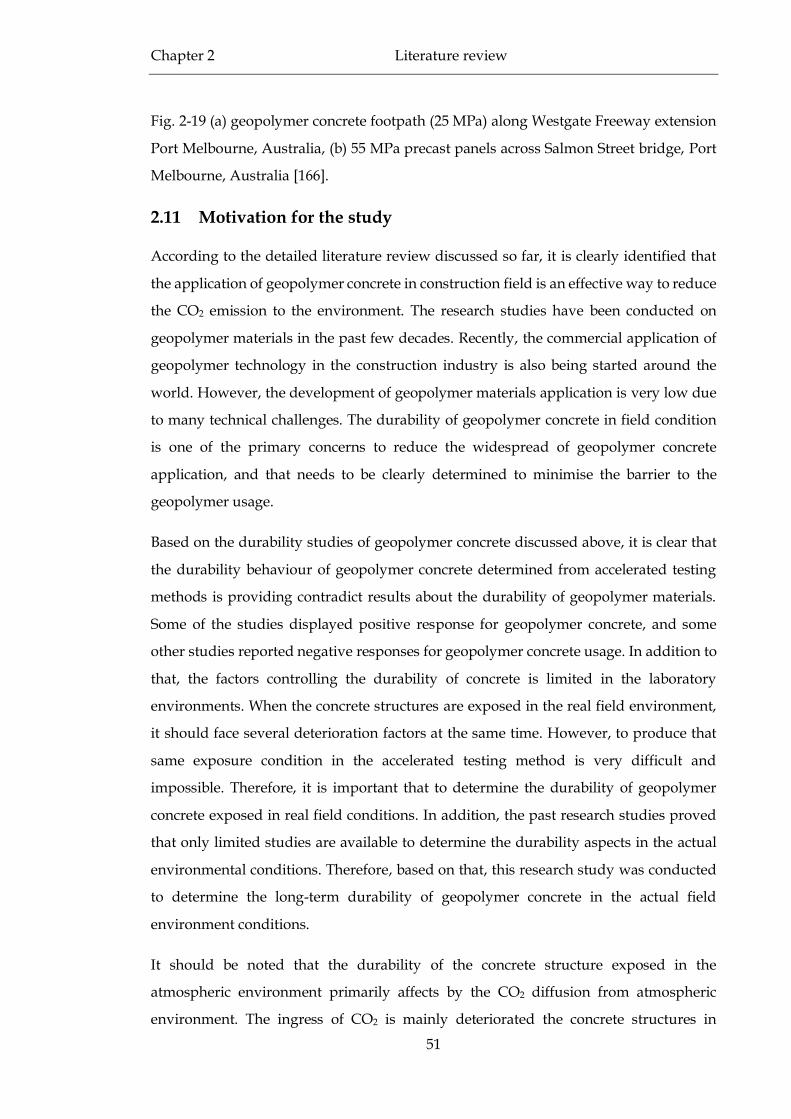
Fig. 2-19 (a) geopolymer concrete footpath (25 MPa) along Westgate Freeway extension Port
Melbourne, Australia, (b) 55 MPa precast panels across Salmon Street bridge, Port Melbourne,
Australia [166]. .................................................................................................................................. 51
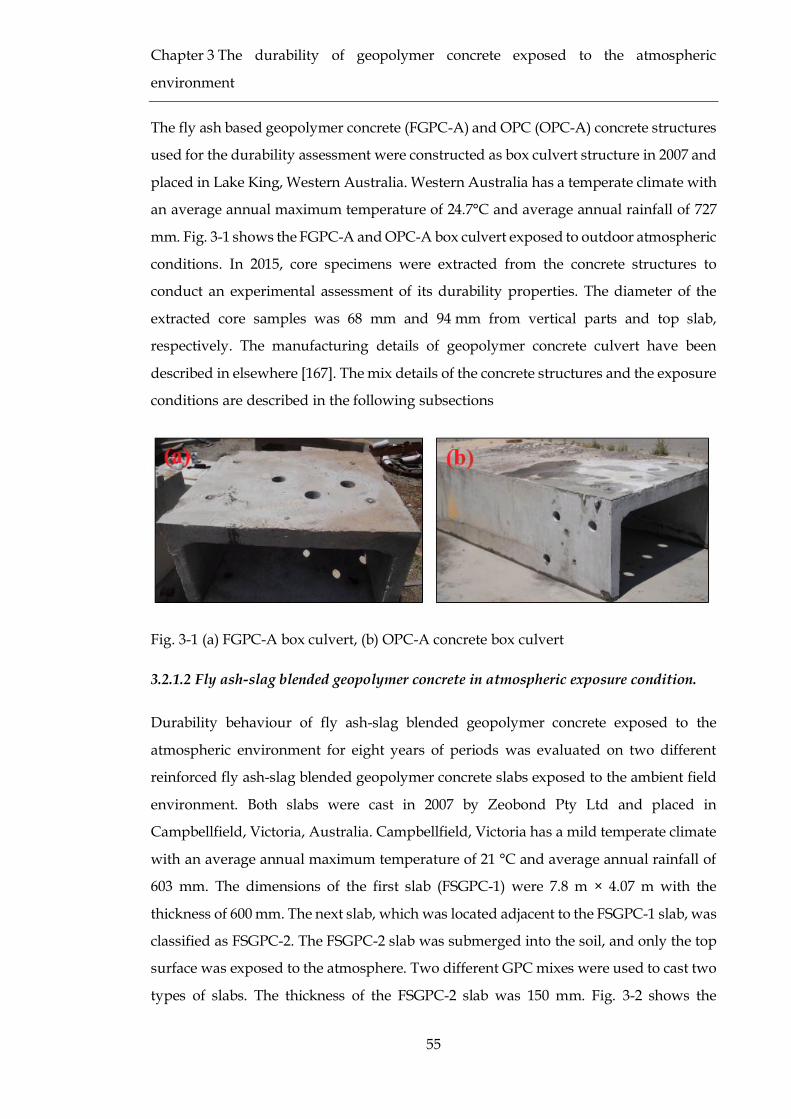
Fig. 3-1 (a) FGPC-A box culvert, (b) OPC-A concrete box culvert ................................................. 55
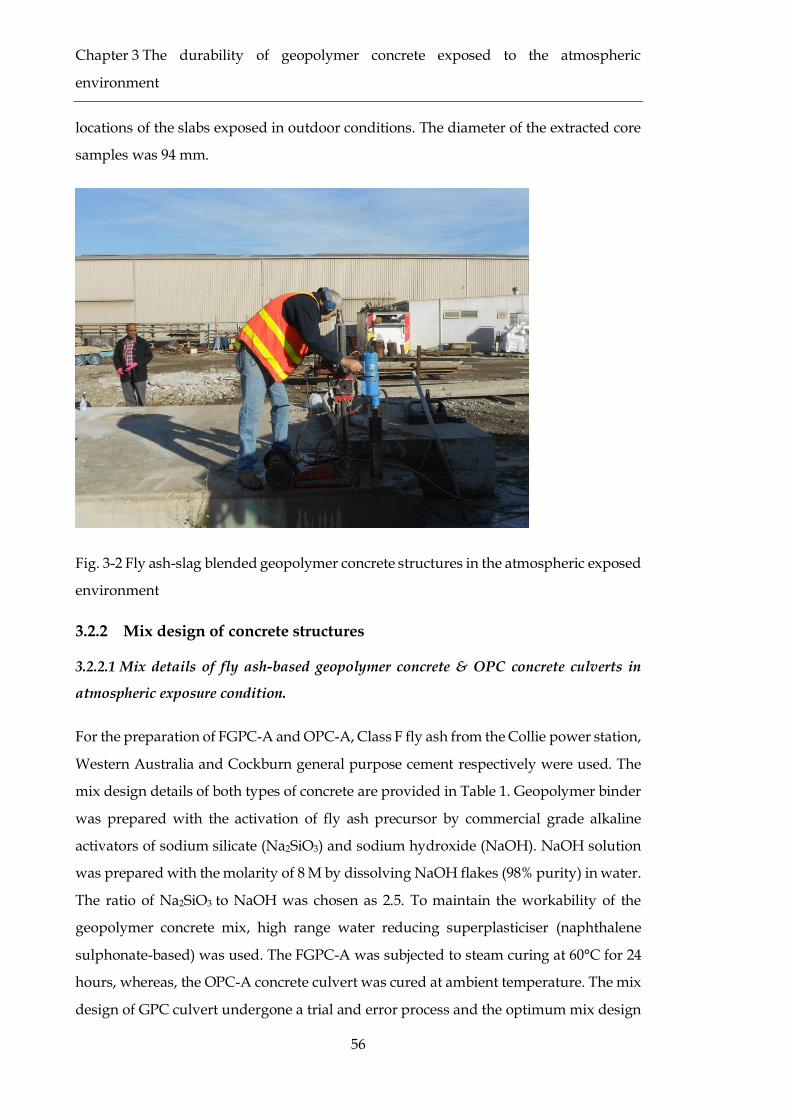
Fig. 3-2 Fly ash-slag blended geopolymer concrete structures in the atmospheric exposed
environment ...................................................................................................................................... 56
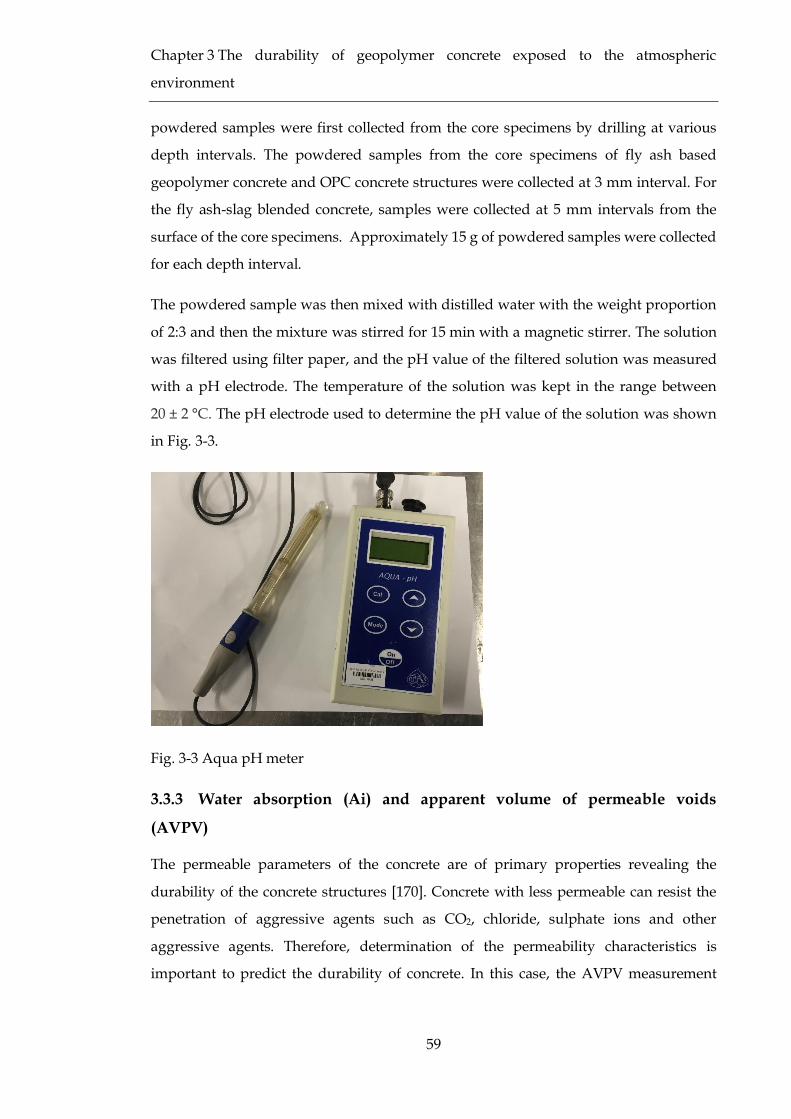
Fig. 3-3 Aqua pH meter ..................................................................................................................... 59
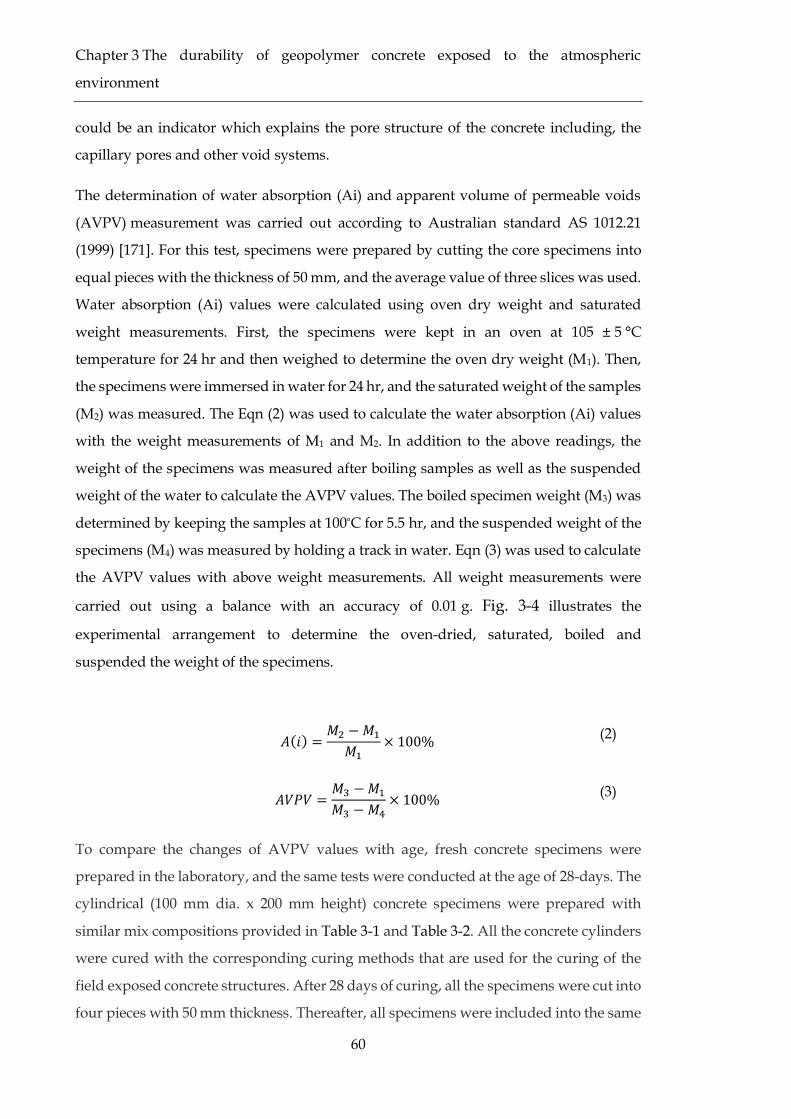
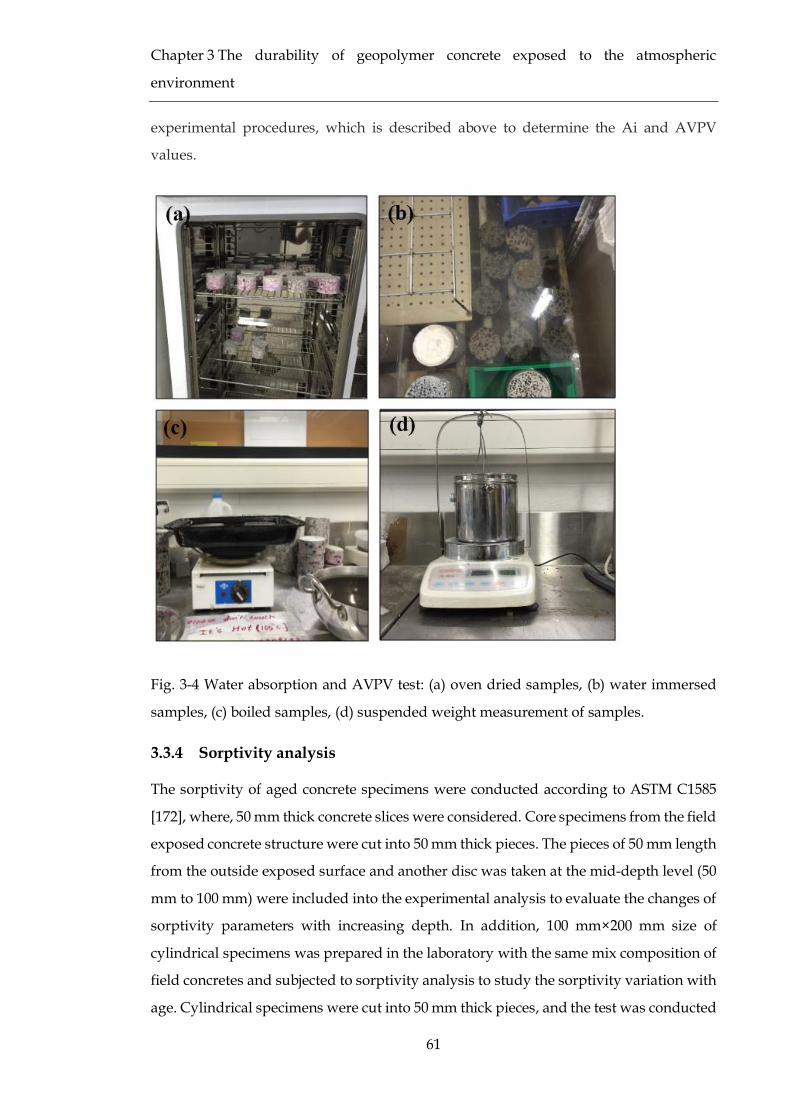
Fig. 3-4 Water absorption and AVPV test: (a) oven dried samples, (b) water immersed samples,
(c) boiled samples, (d) suspended weight measurement of samples. ............................................ 61
Fig. 3-5 (a) schematic diagrams of the sorptivity test, (b) experimental arrangement of the
sorptivity test ..................................................................................................................................... 62
Fig. 3-6 FT-IR spectroscope ............................................................................................................... 63
Fig. 3-7 Mercury porosimeter ........................................................................................................... 64
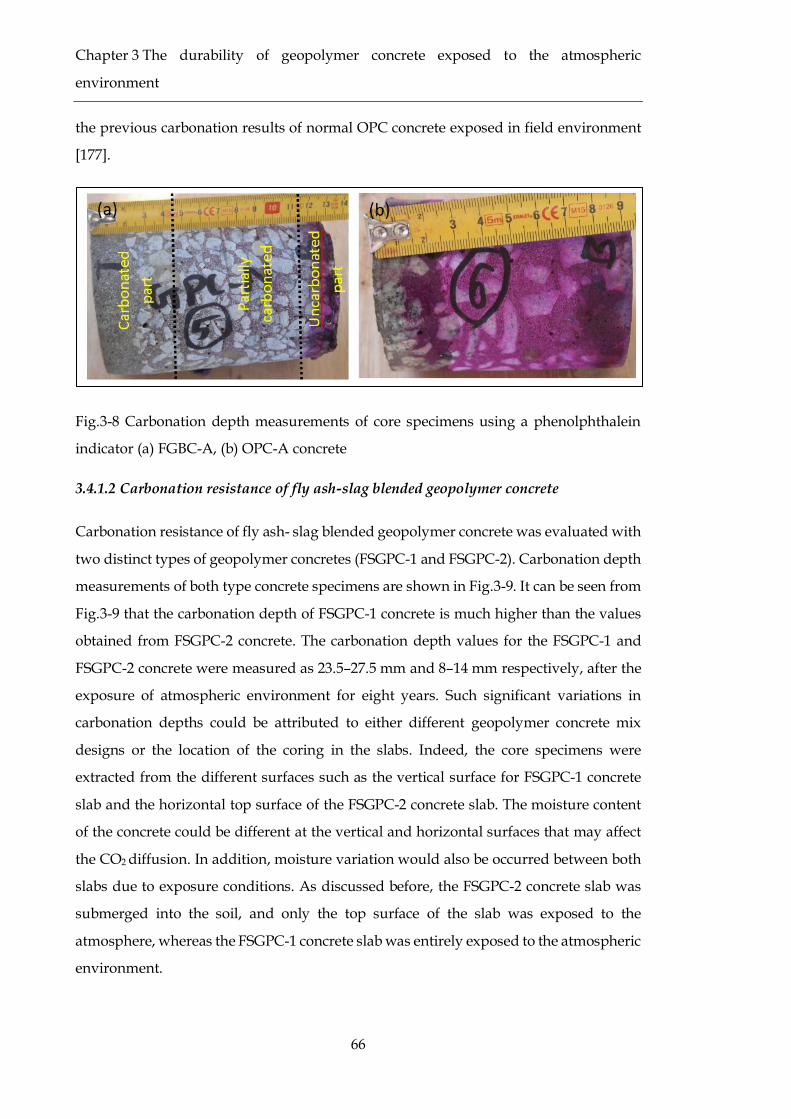
Fig.3-8 Carbonation depth measurements of core specimens using a phenolphthalein indicator
(a) FGBC-A, (b) OPC-A concrete ...................................................................................................... 66
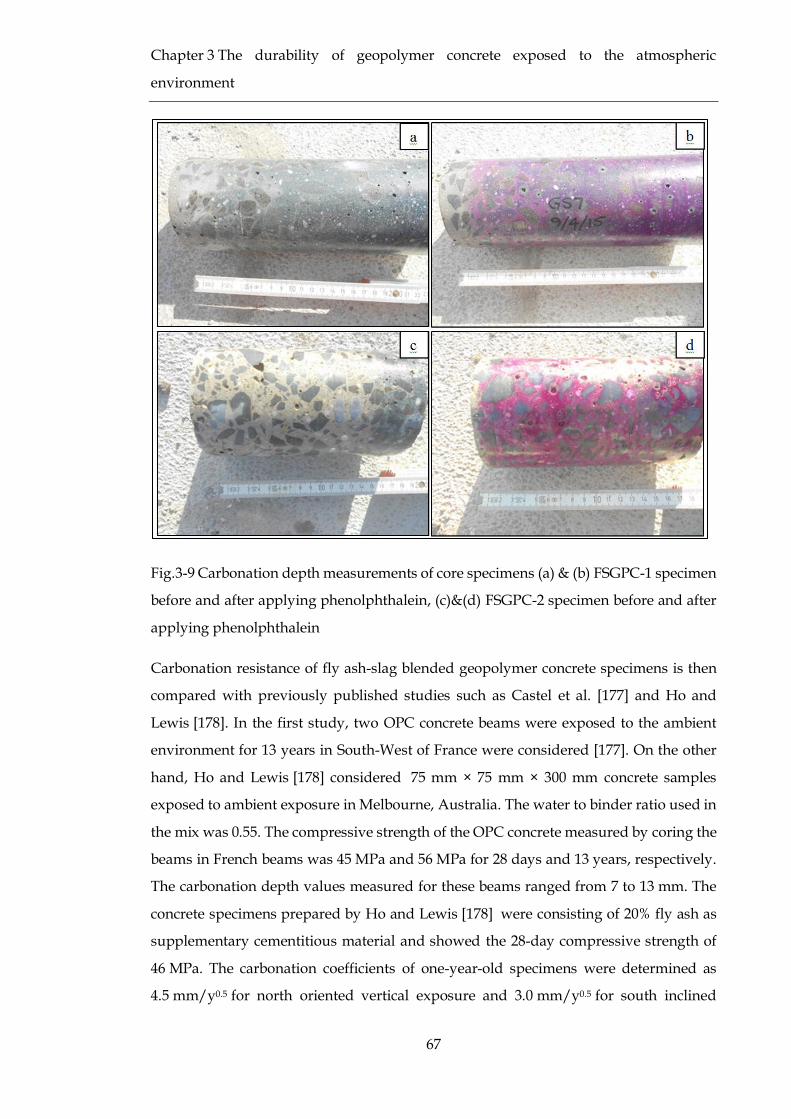
Fig.3-9 Carbonation depth measurements of core specimens (a) & (b) FSGPC-1 specimen before
and after applying phenolphthalein, (c)&(d) FSGPC-2 specimen before and after applying
phenolphthalein ................................................................................................................................ 67
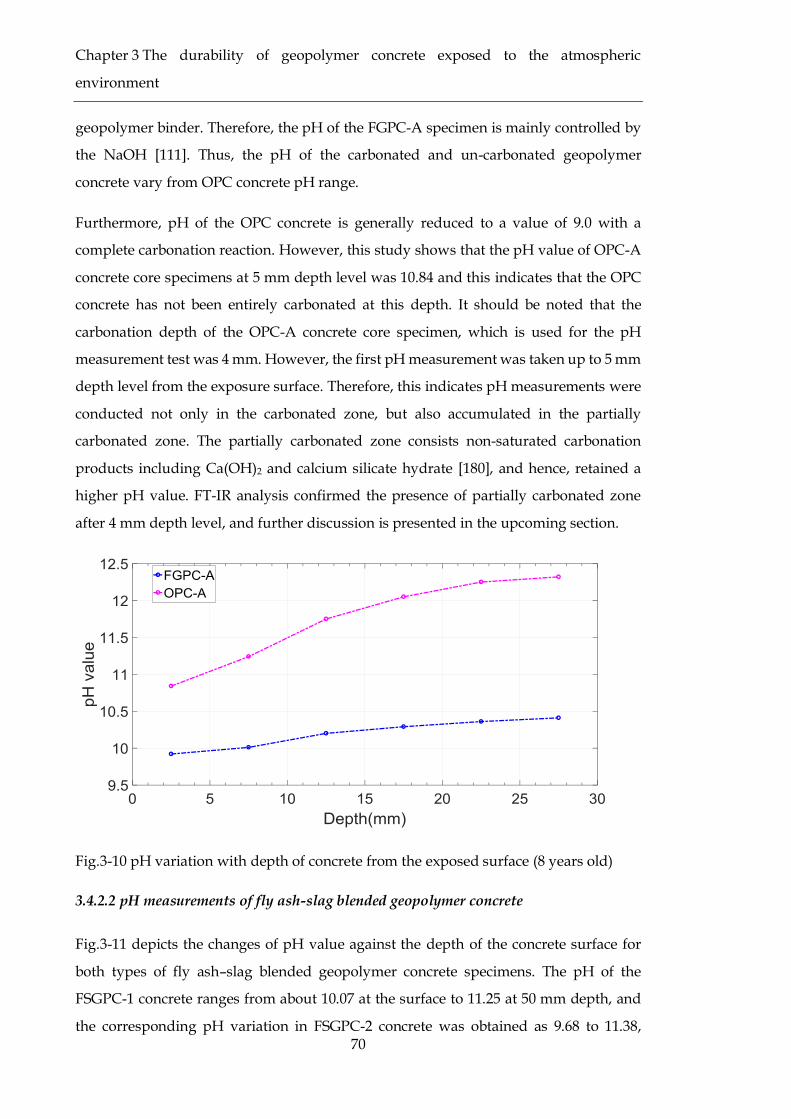
Fig.3-10 pH variation with depth of concrete from the exposed surface (8 years old) ................. 70
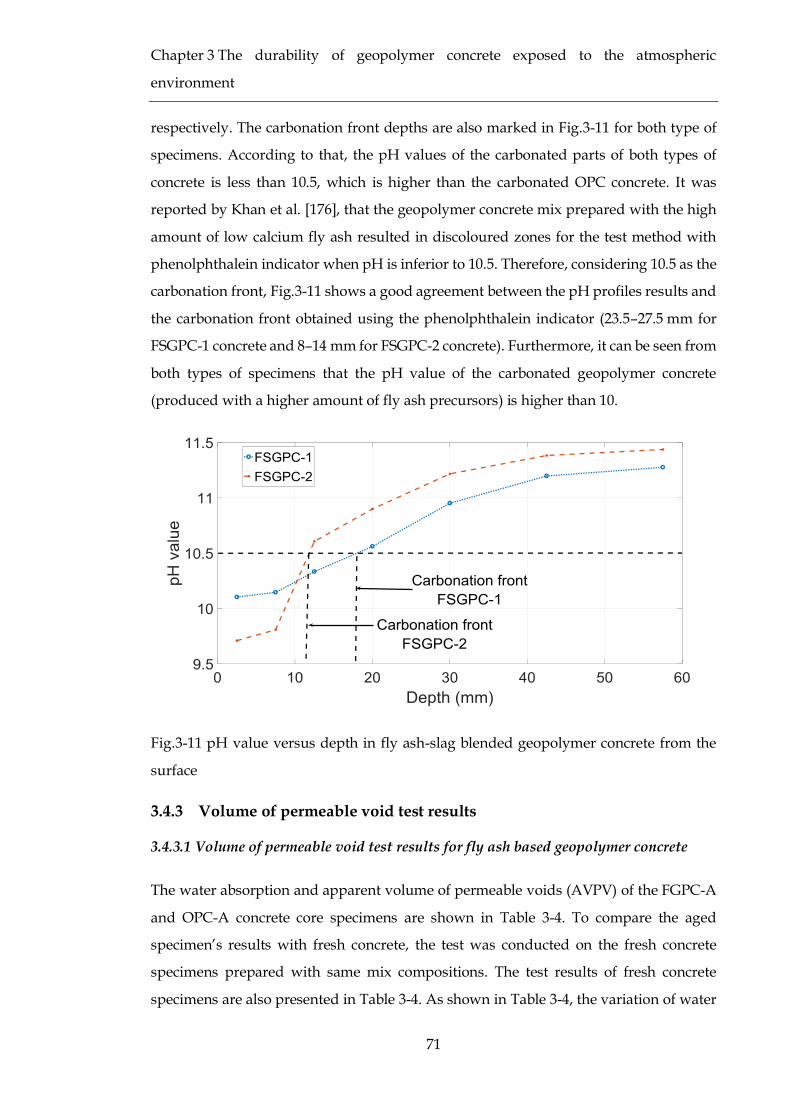
Fig.3-11 pH value versus depth in fly ash-slag blended geopolymer concrete from the surface 71
Fig.3-12 Sorptivity curves of FGPC-A and OPC-A concretes ......................................................... 74
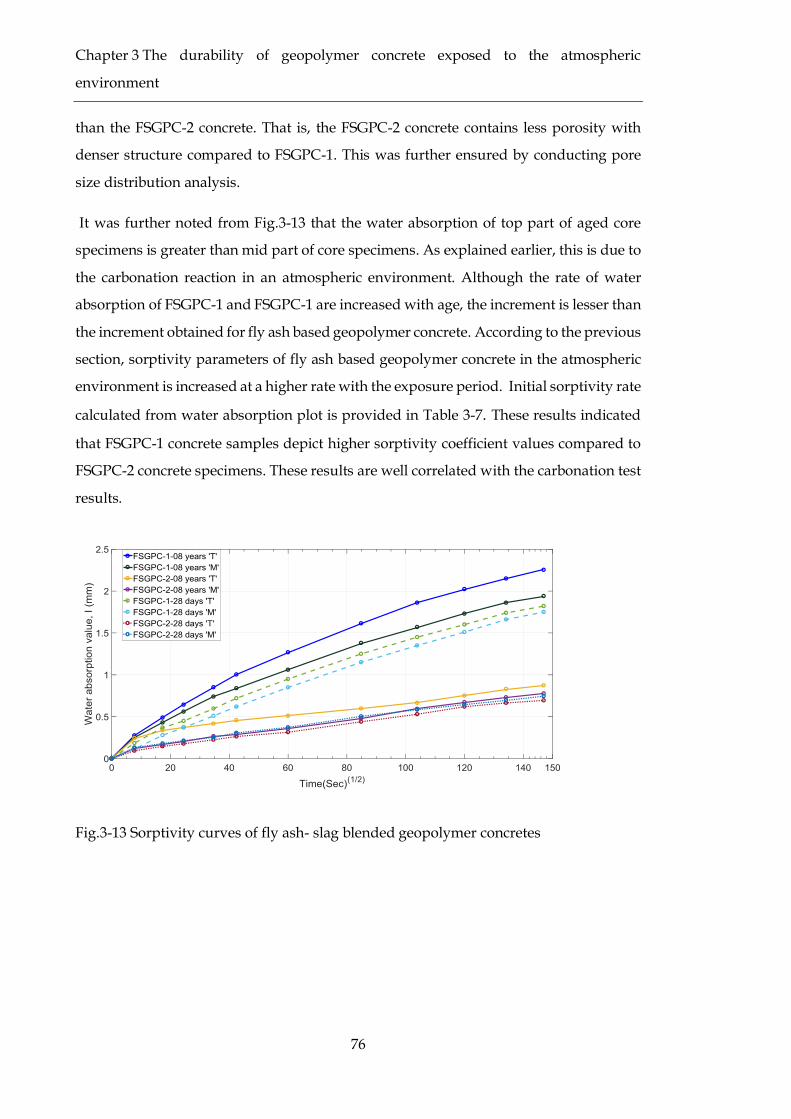
Fig.3-13 Sorptivity curves of fly ash- slag blended geopolymer concretes .................................... 76
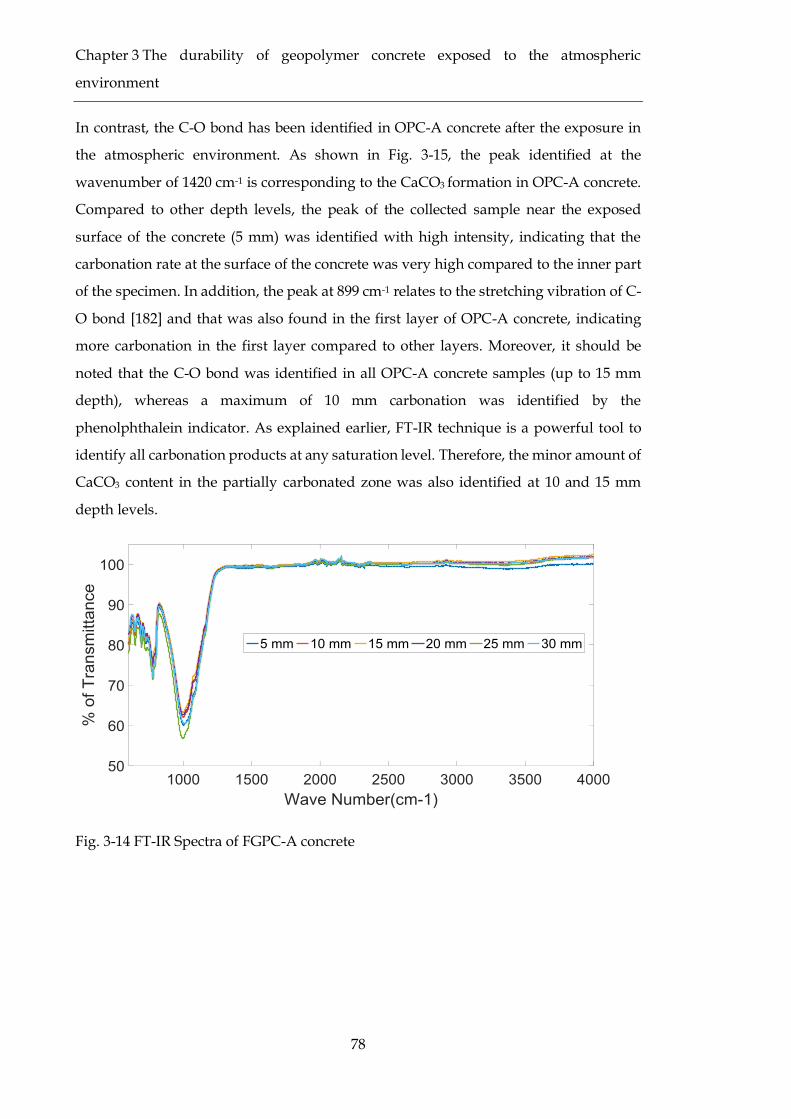
Fig. 3-14 FT-IR Spectra of FGPC-A concrete .................................................................................... 78
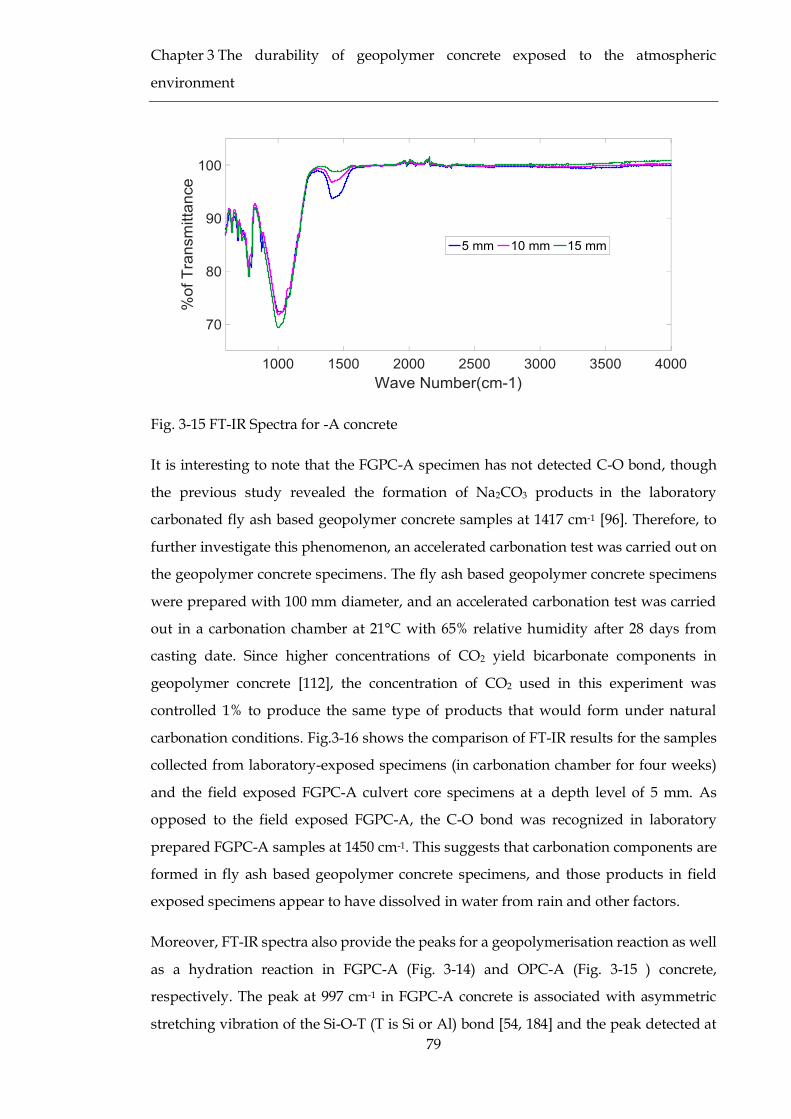
Fig. 3-15 FT-IR Spectra for -A concrete ............................................................................................ 79
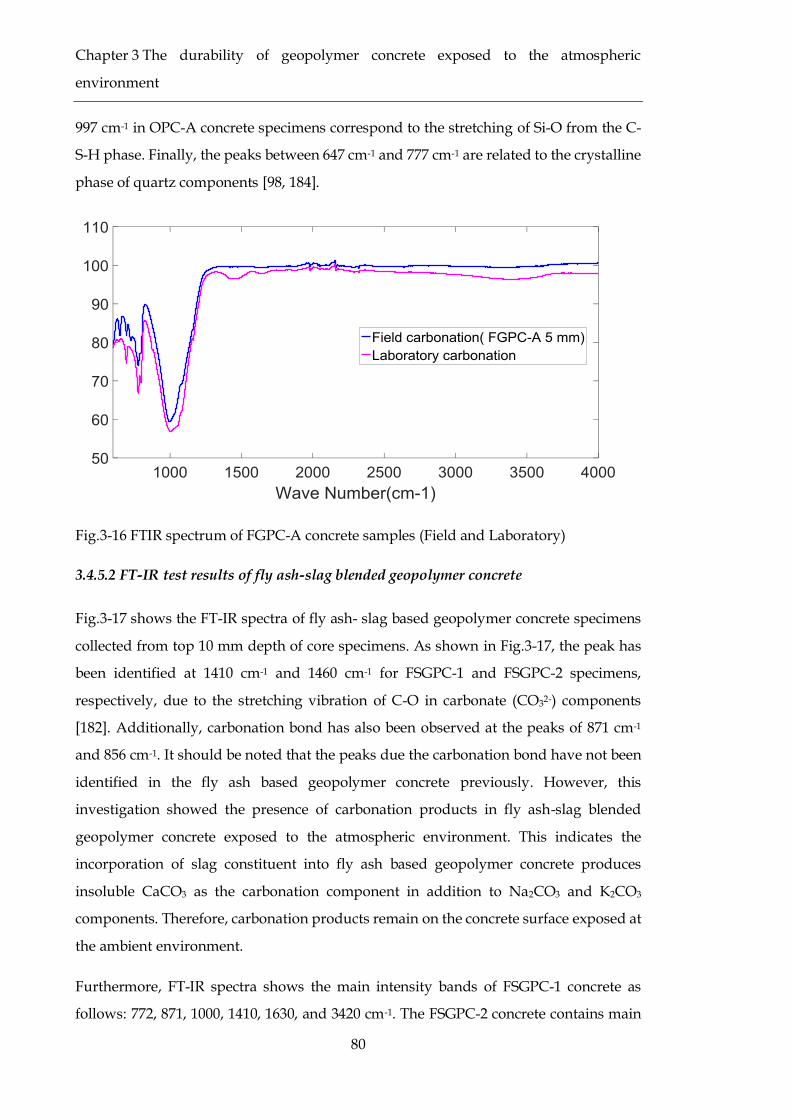
Fig.3-16 FTIR spectrum of FGPC-A concrete samples (Field and Laboratory) ............................. 80
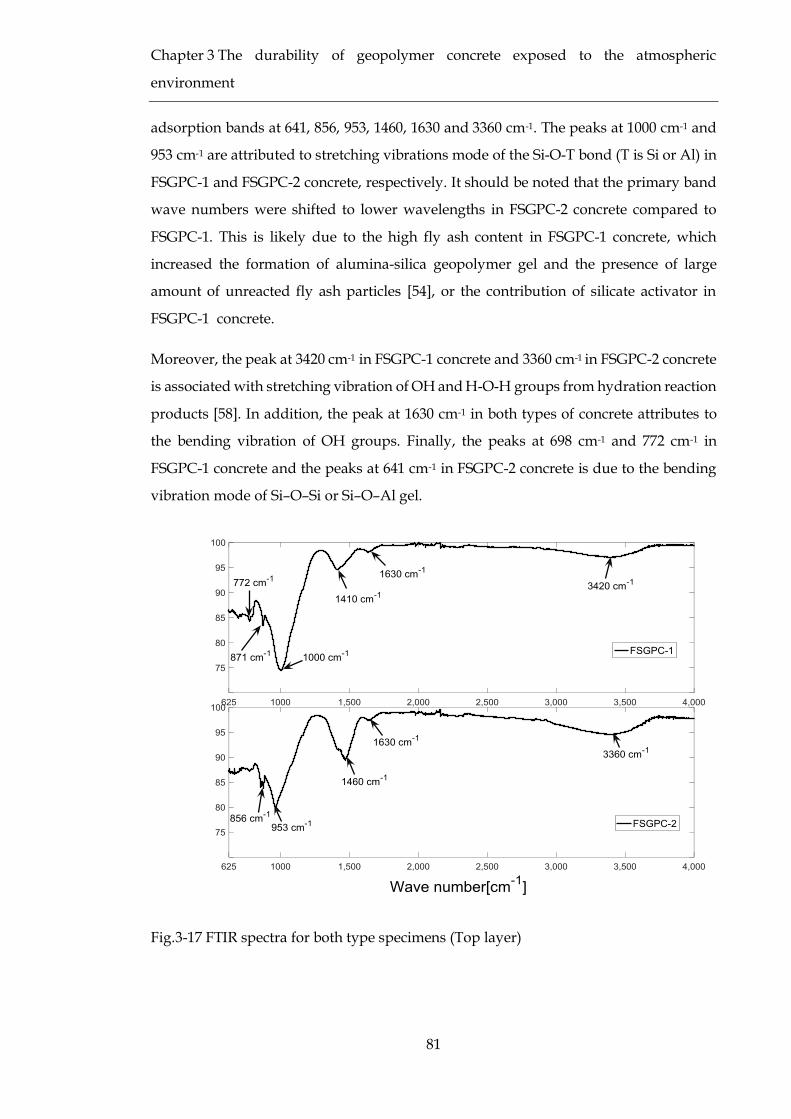
Fig.3-17 FTIR spectra for both type specimens (Top layer) ............................................................ 81
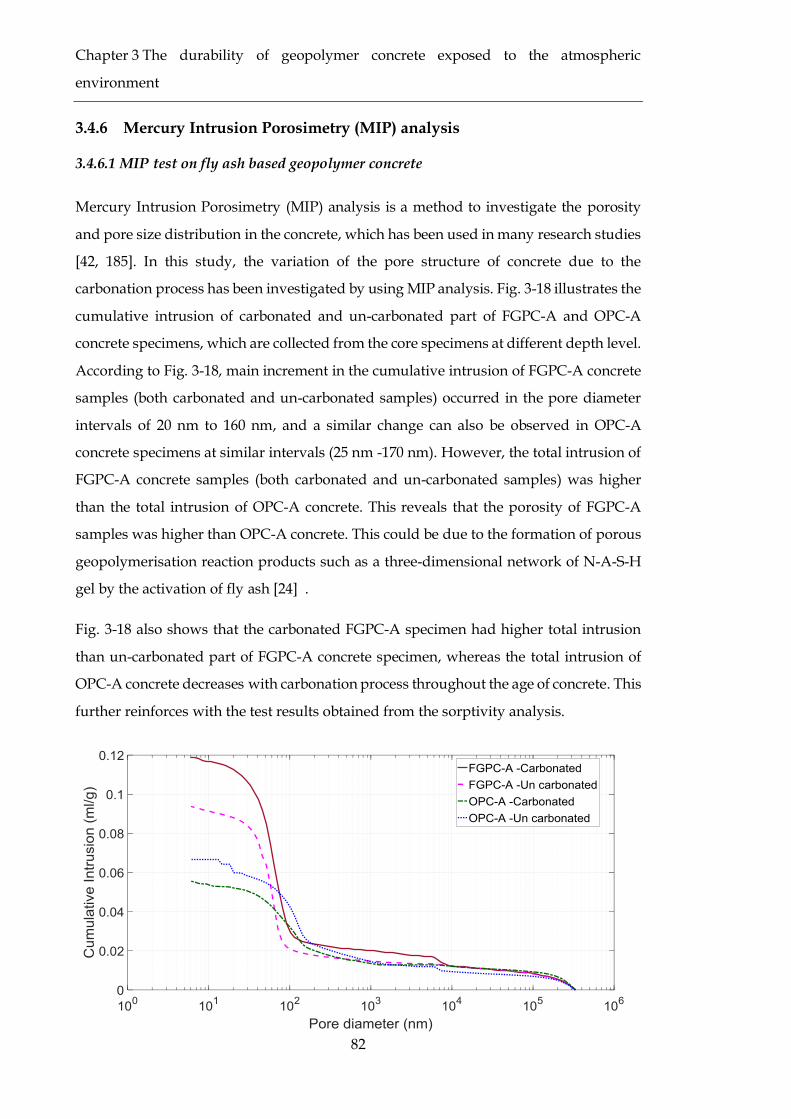
Fig. 3-18 The cumulative intrusion of atmospheric exposed concrete specimens ........................ 83
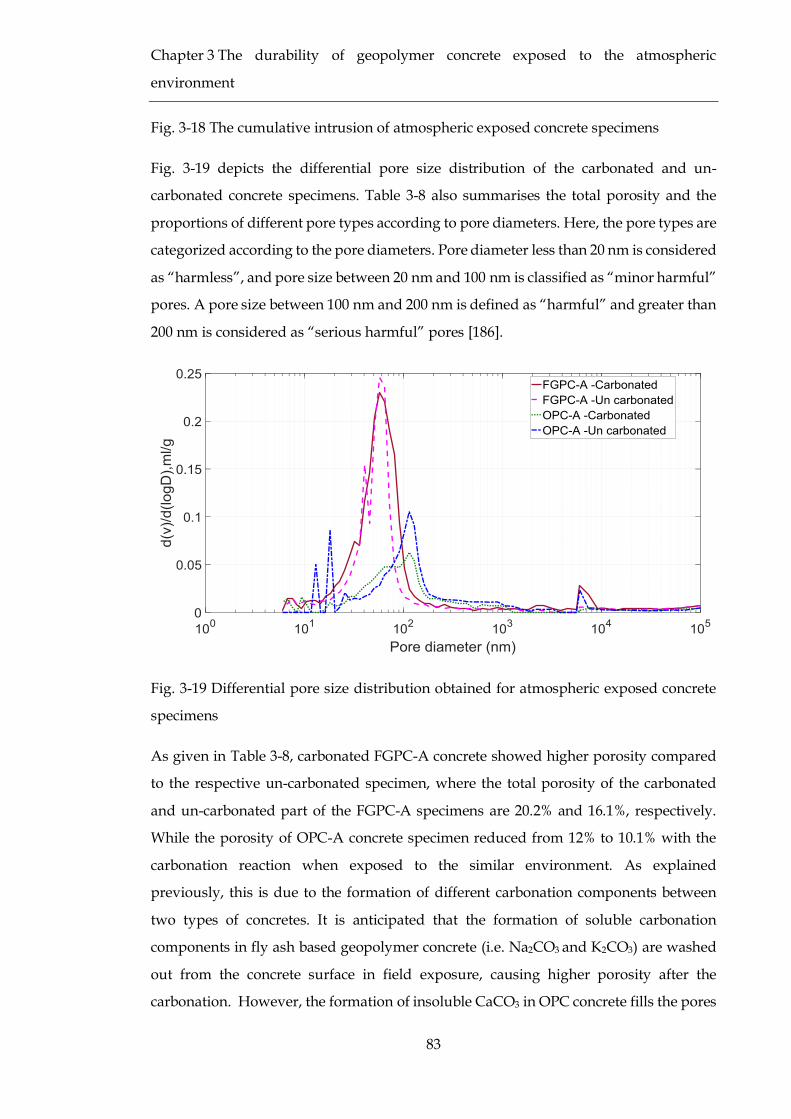
Fig. 3-19 Differential pore size distribution obtained for atmospheric exposed concrete specimens
............................................................................................................................................................ 83
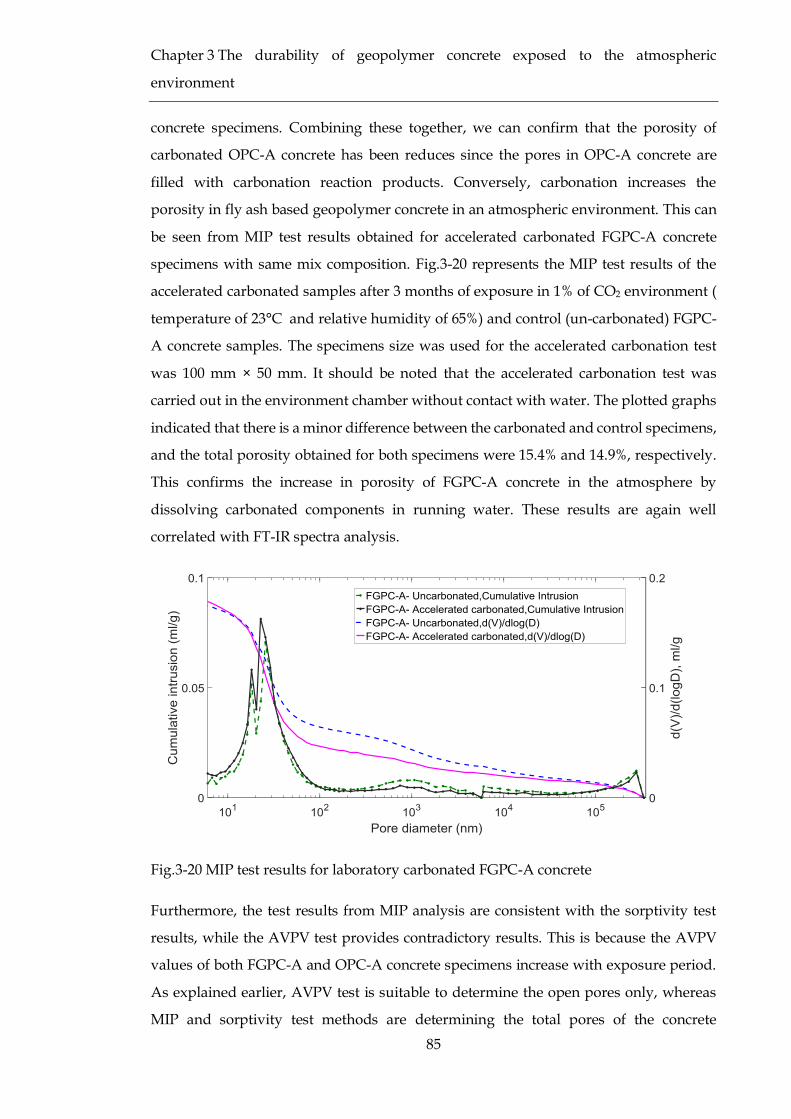
Fig.3-20 MIP test results for laboratory carbonated FGPC-A concrete .......................................... 85
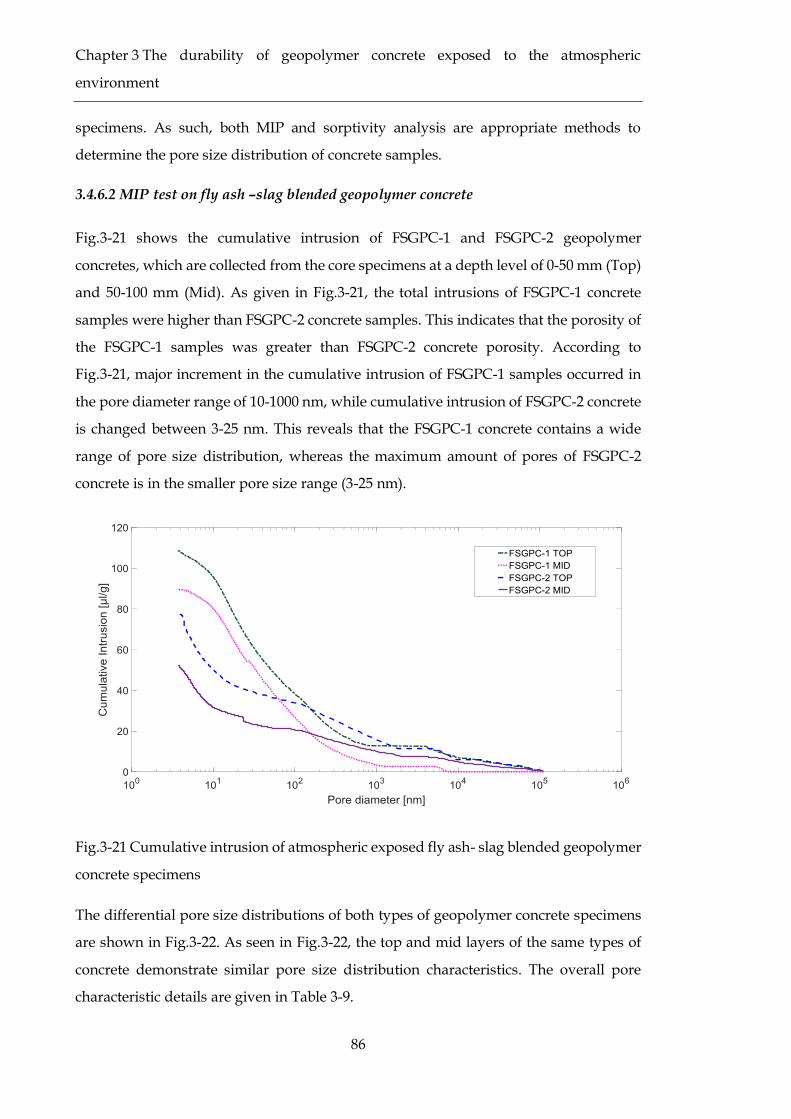
Fig.3-21 Cumulative intrusion of atmospheric exposed fly ash- slag blended geopolymer concrete
specimens ........................................................................................................................................... 86
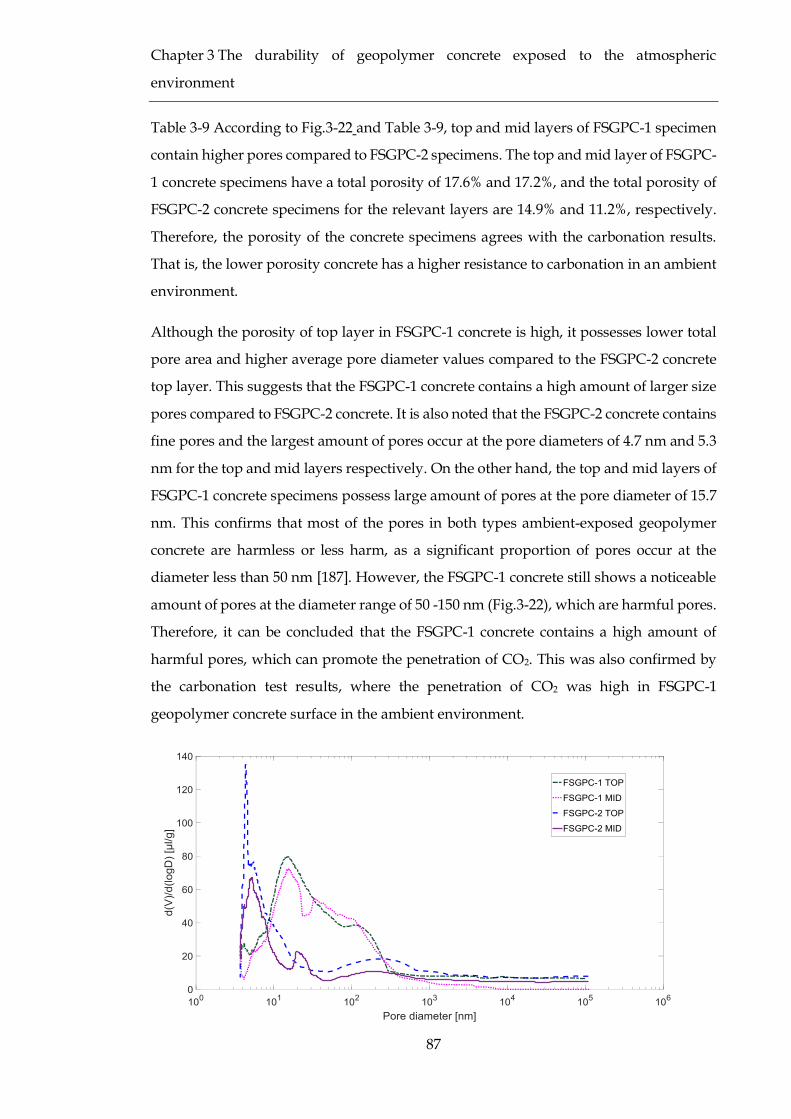
Fig.3-22 Differential pore size distribution obtained for both types of geopolymer concrete ...... 88
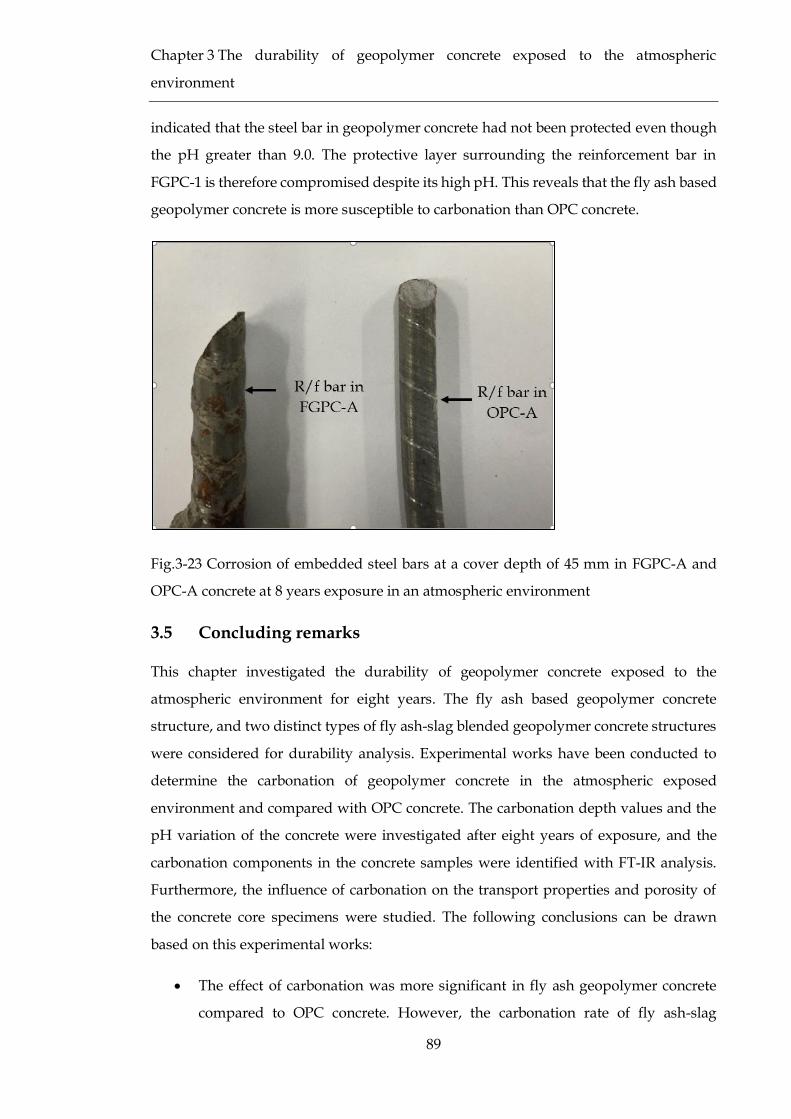
Fig.3-23 Corrosion of embedded steel bars at a cover depth of 45 mm in FGPC-A and OPC-A
concrete at 8 years exposure in an atmospheric environment ....................................................... 89
Fig.4-1 Concrete culvert structures exposed to the saline environment (a) FGPC-S culvert, (b)
OPC-S culvert. ................................................................................................................................... 94
Page 19
xix
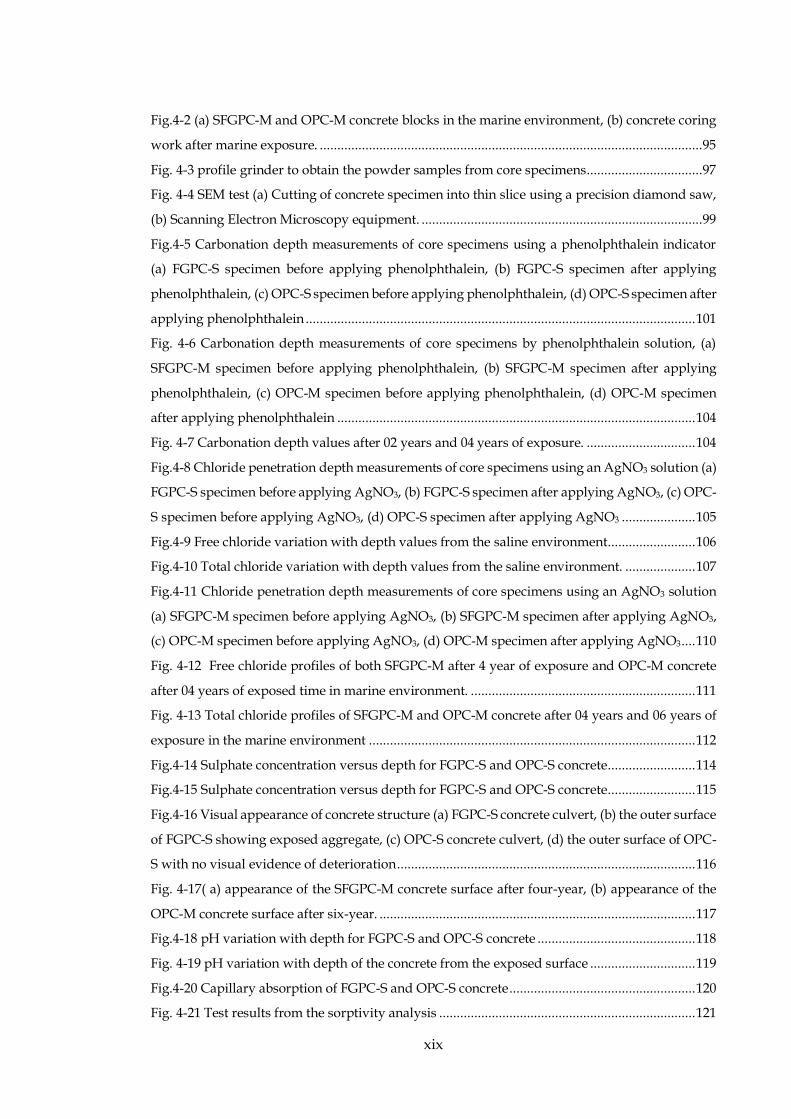
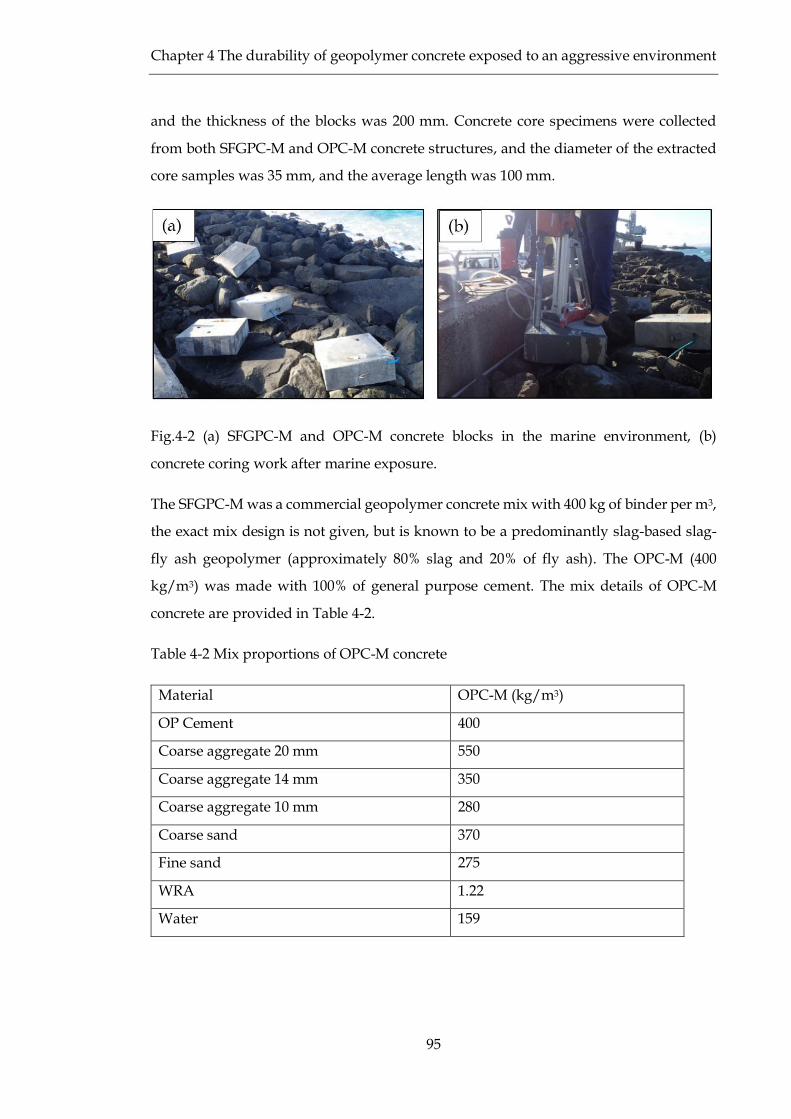
Fig.4-2 (a) SFGPC-M and OPC-M concrete blocks in the marine environment, (b) concrete coring
work after marine exposure. .............................................................................................................95
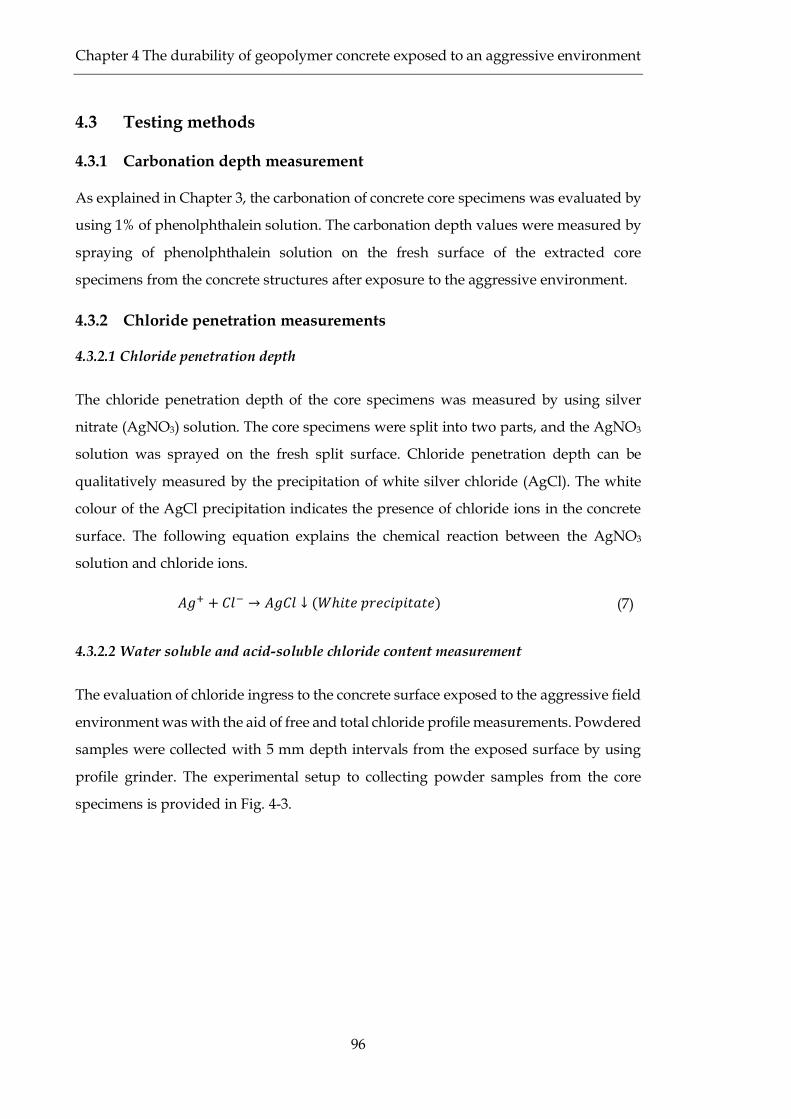
Fig. 4-3 profile grinder to obtain the powder samples from core specimens .................................97
Fig. 4-4 SEM test (a) Cutting of concrete specimen into thin slice using a precision diamond saw,
(b) Scanning Electron Microscopy equipment. ................................................................................99
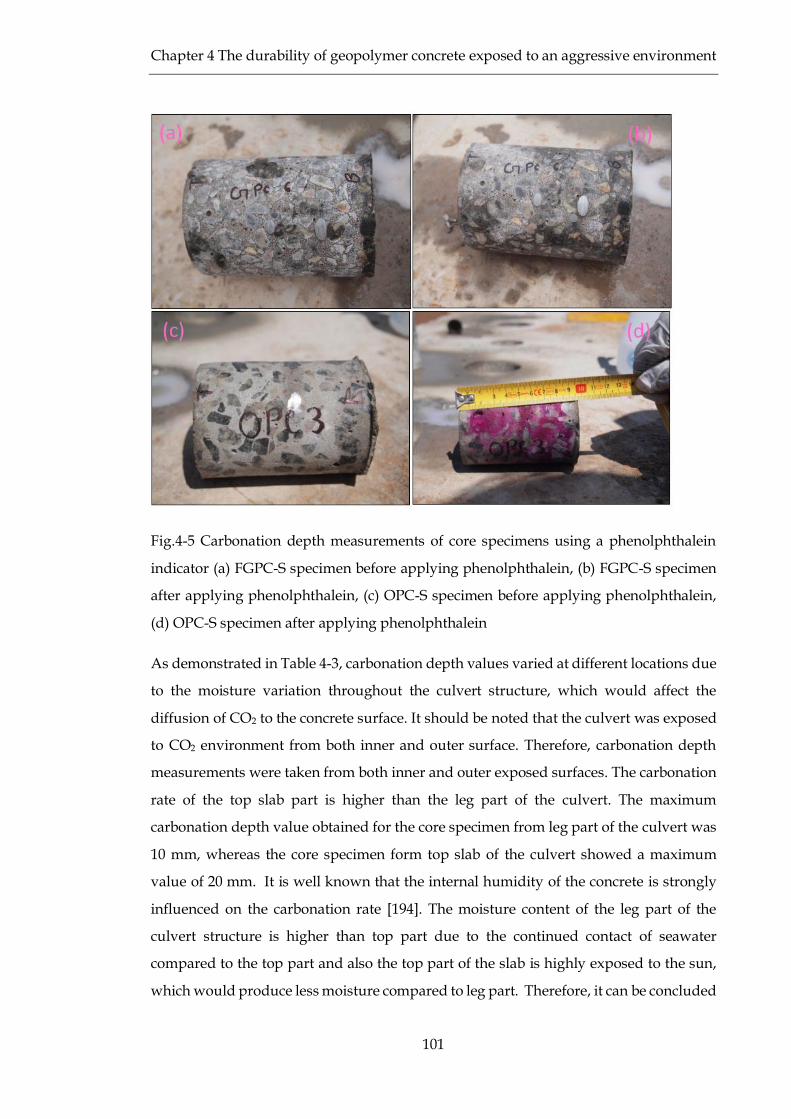
Fig.4-5 Carbonation depth measurements of core specimens using a phenolphthalein indicator
(a) FGPC-S specimen before applying phenolphthalein, (b) FGPC-S specimen after applying
phenolphthalein, (c) OPC-S specimen before applying phenolphthalein, (d) OPC-S specimen after
applying phenolphthalein ............................................................................................................... 101
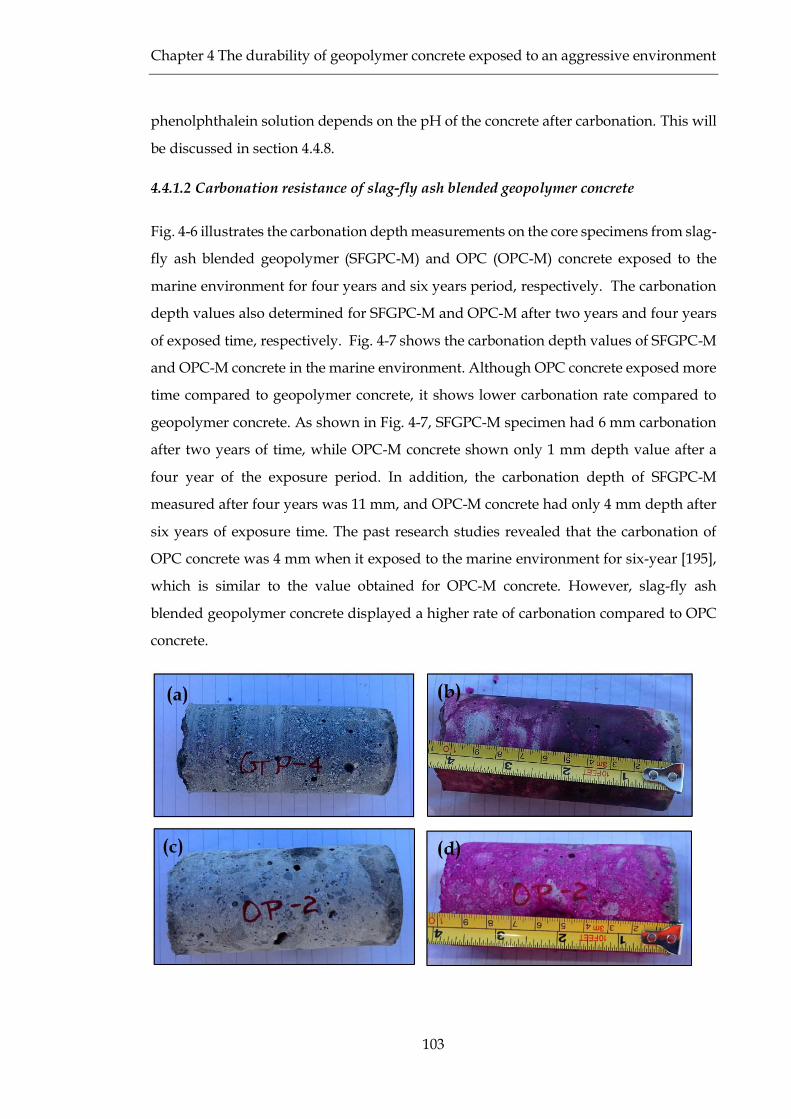
Fig. 4-6 Carbonation depth measurements of core specimens by phenolphthalein solution, (a)
SFGPC-M specimen before applying phenolphthalein, (b) SFGPC-M specimen after applying
phenolphthalein, (c) OPC-M specimen before applying phenolphthalein, (d) OPC-M specimen
after applying phenolphthalein ...................................................................................................... 104
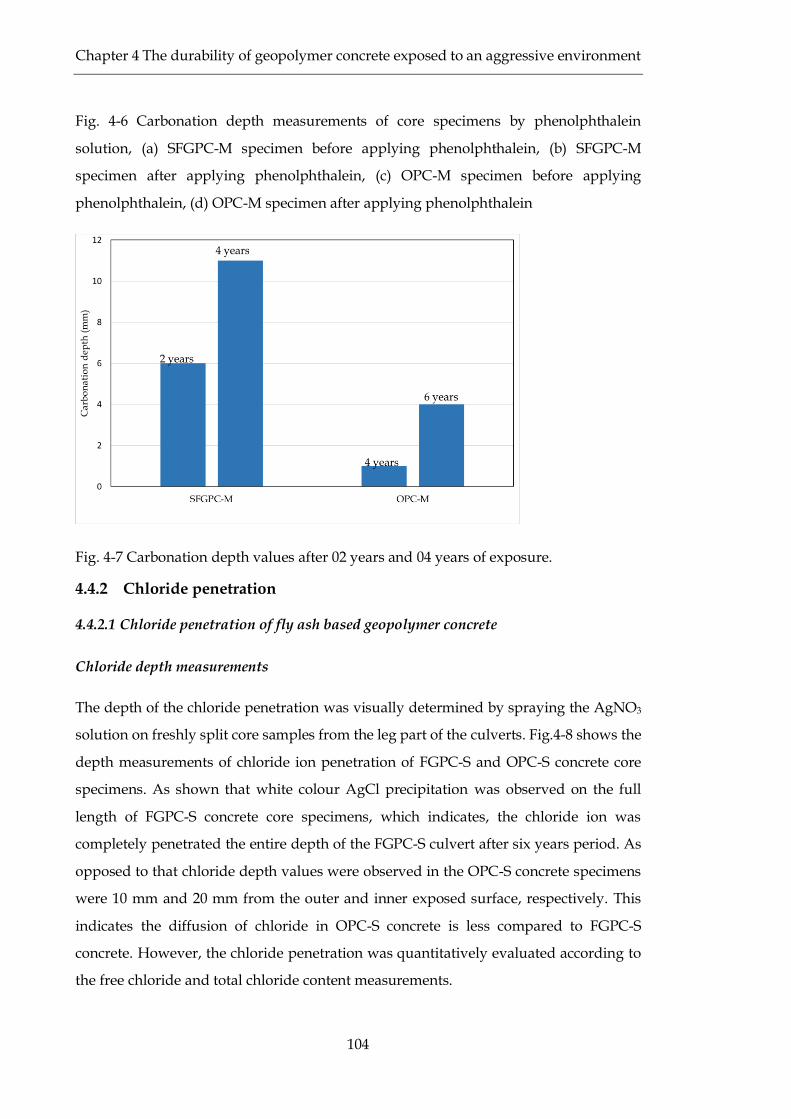
Fig. 4-7 Carbonation depth values after 02 years and 04 years of exposure. ............................... 104
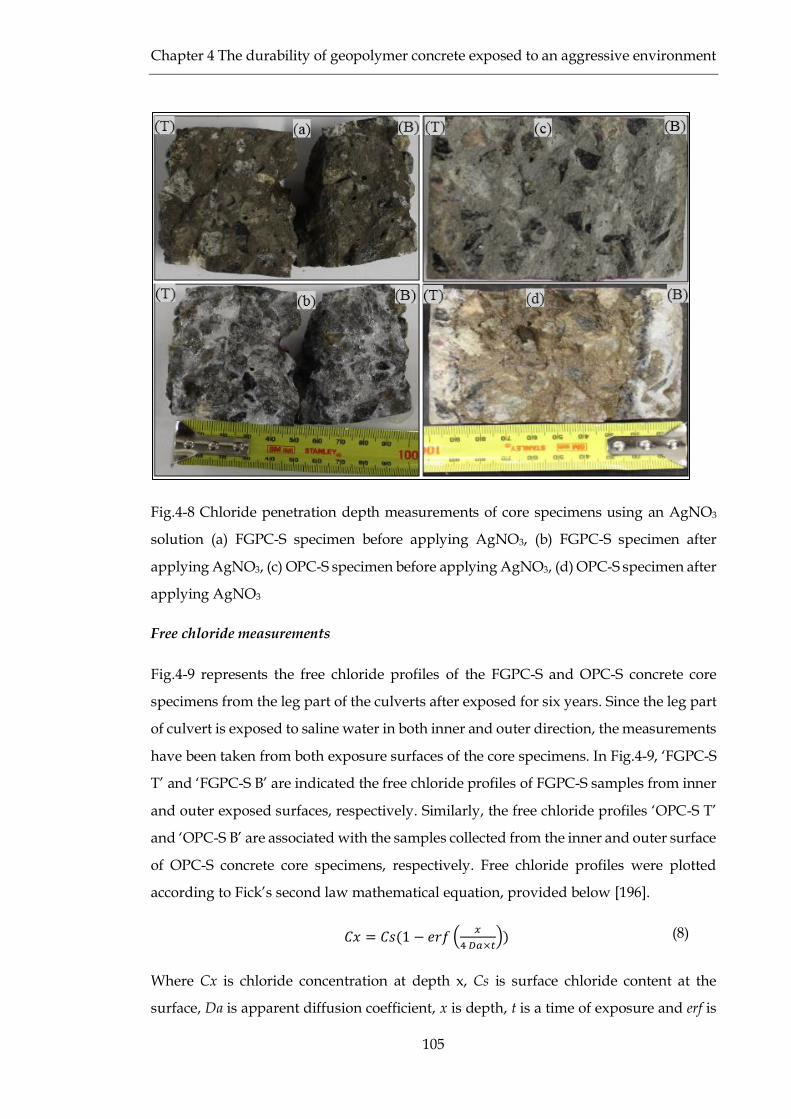
Fig.4-8 Chloride penetration depth measurements of core specimens using an AgNO3 solution (a)
FGPC-S specimen before applying AgNO3, (b) FGPC-S specimen after applying AgNO3, (c) OPC-
S specimen before applying AgNO3, (d) OPC-S specimen after applying AgNO3 ..................... 105
Fig.4-9 Free chloride variation with depth values from the saline environment......................... 106
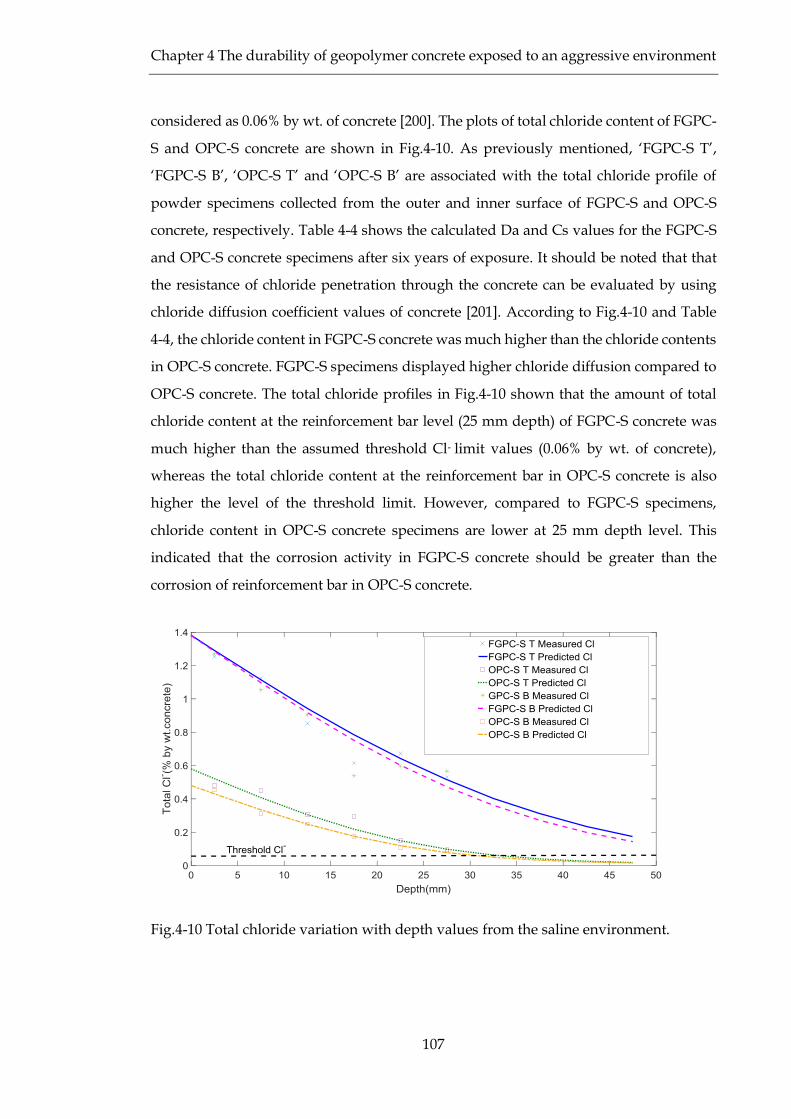
Fig.4-10 Total chloride variation with depth values from the saline environment. .................... 107
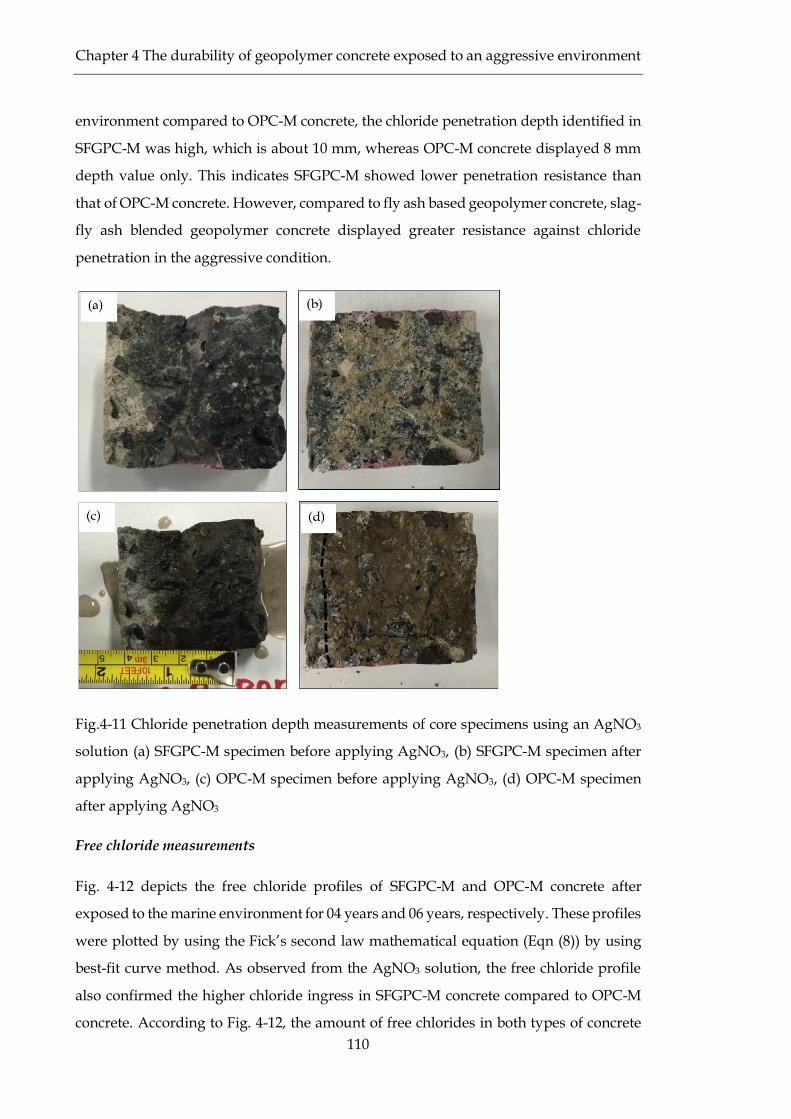
Fig.4-11 Chloride penetration depth measurements of core specimens using an AgNO3 solution
(a) SFGPC-M specimen before applying AgNO3, (b) SFGPC-M specimen after applying AgNO3,
(c) OPC-M specimen before applying AgNO3, (d) OPC-M specimen after applying AgNO3 .... 110
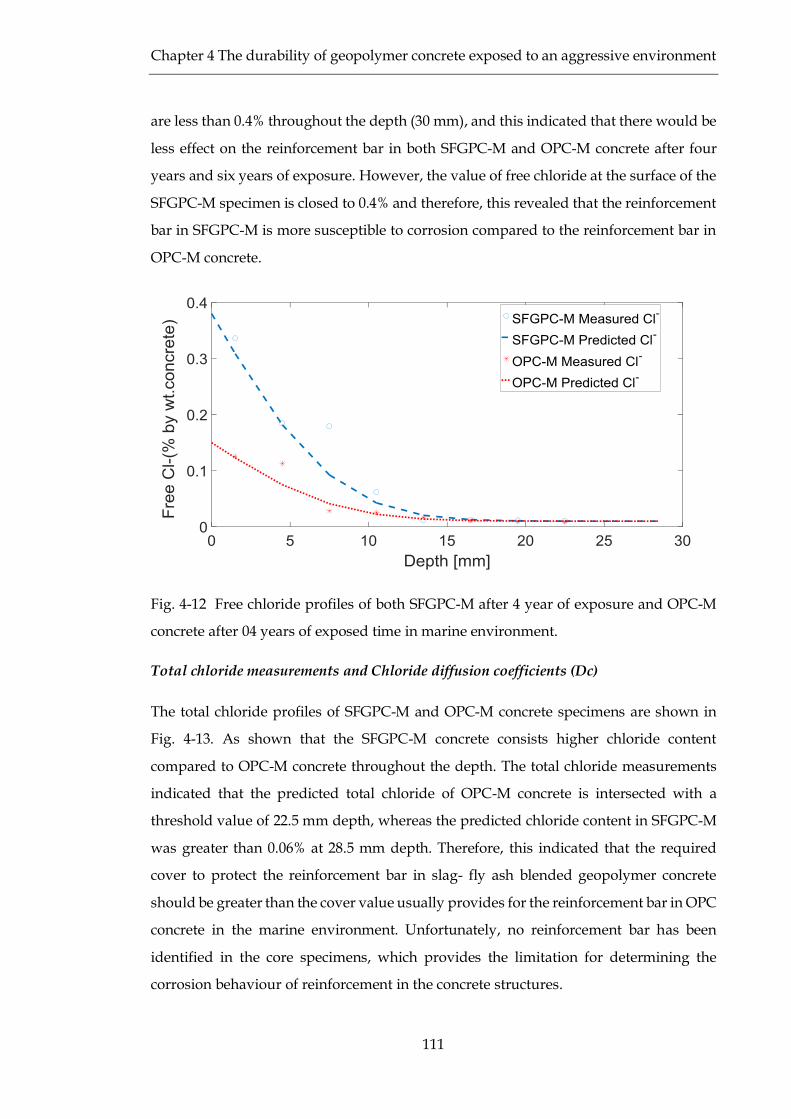
Fig. 4-12 Free chloride profiles of both SFGPC-M after 4 year of exposure and OPC-M concrete
after 04 years of exposed time in marine environment. ................................................................ 111
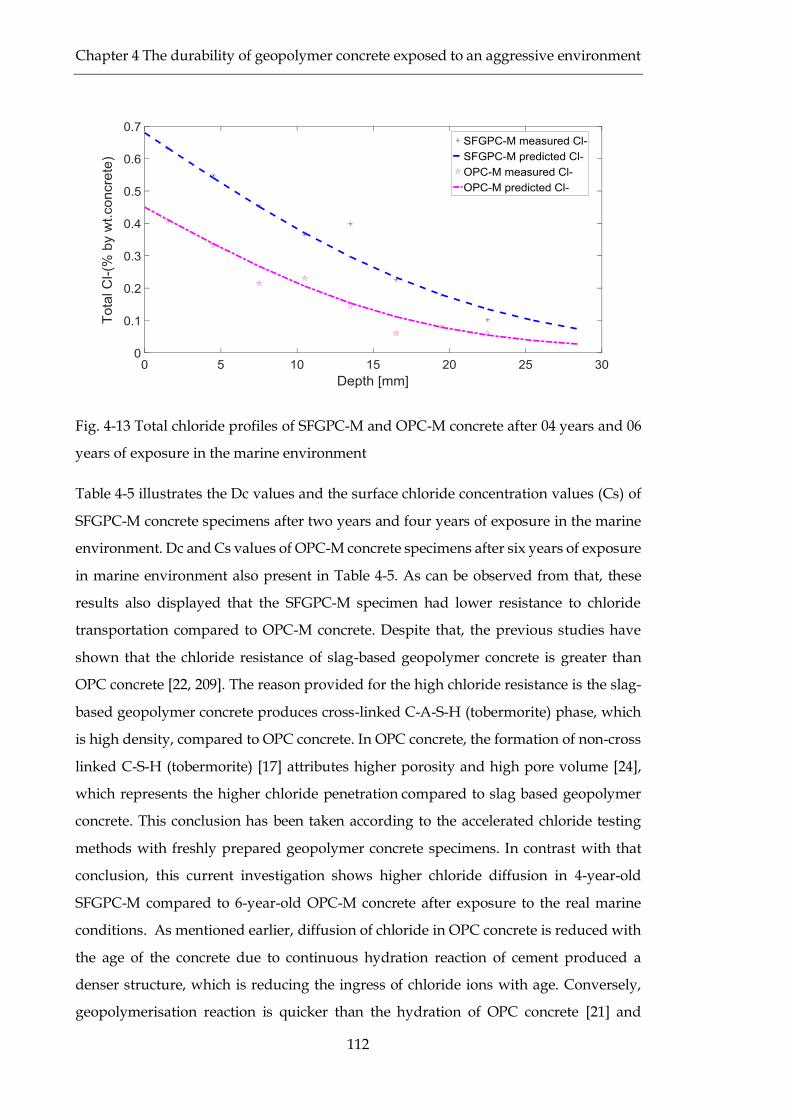
Fig. 4-13 Total chloride profiles of SFGPC-M and OPC-M concrete after 04 years and 06 years of
exposure in the marine environment ............................................................................................. 112
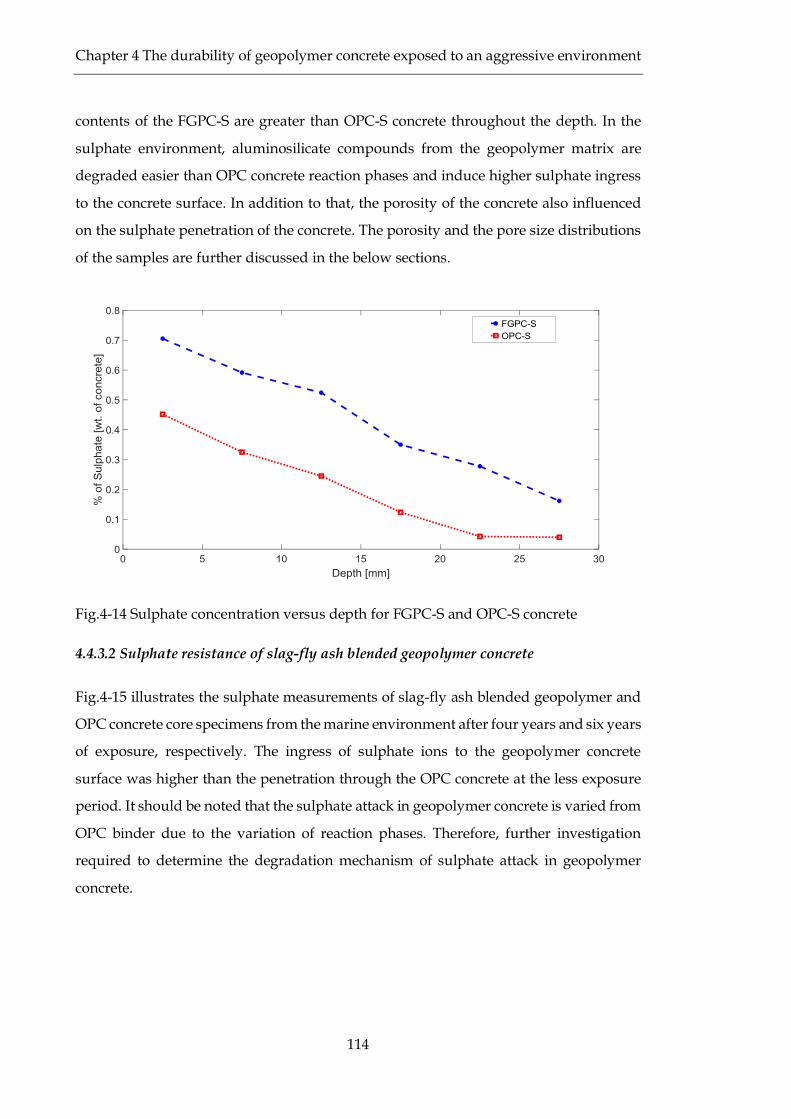
Fig.4-14 Sulphate concentration versus depth for FGPC-S and OPC-S concrete ......................... 114
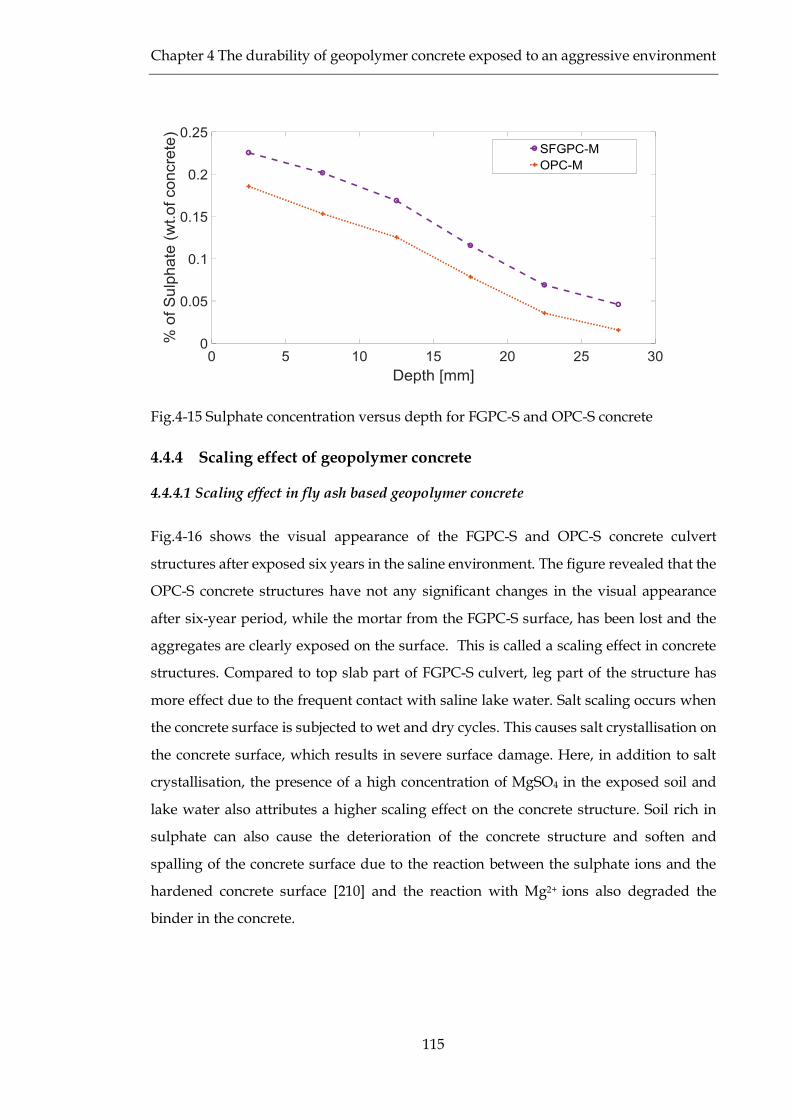
Fig.4-15 Sulphate concentration versus depth for FGPC-S and OPC-S concrete ......................... 115
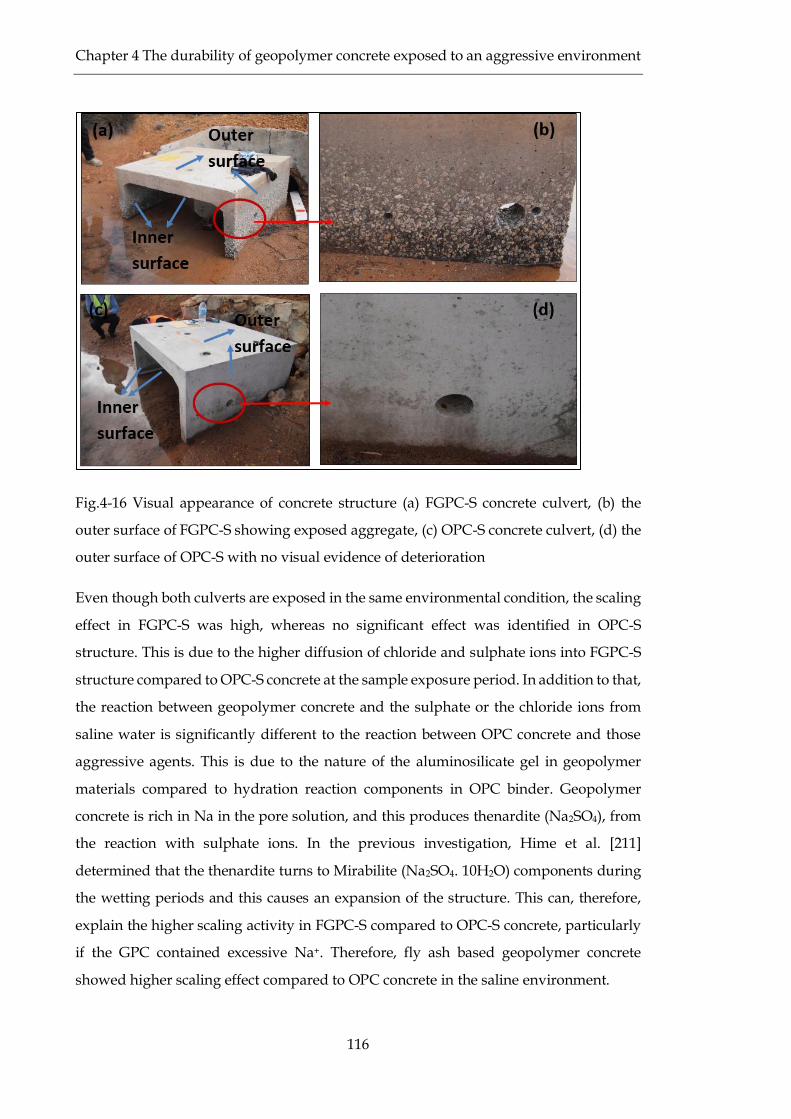
Fig.4-16 Visual appearance of concrete structure (a) FGPC-S concrete culvert, (b) the outer surface
of FGPC-S showing exposed aggregate, (c) OPC-S concrete culvert, (d) the outer surface of OPC-
S with no visual evidence of deterioration ..................................................................................... 116
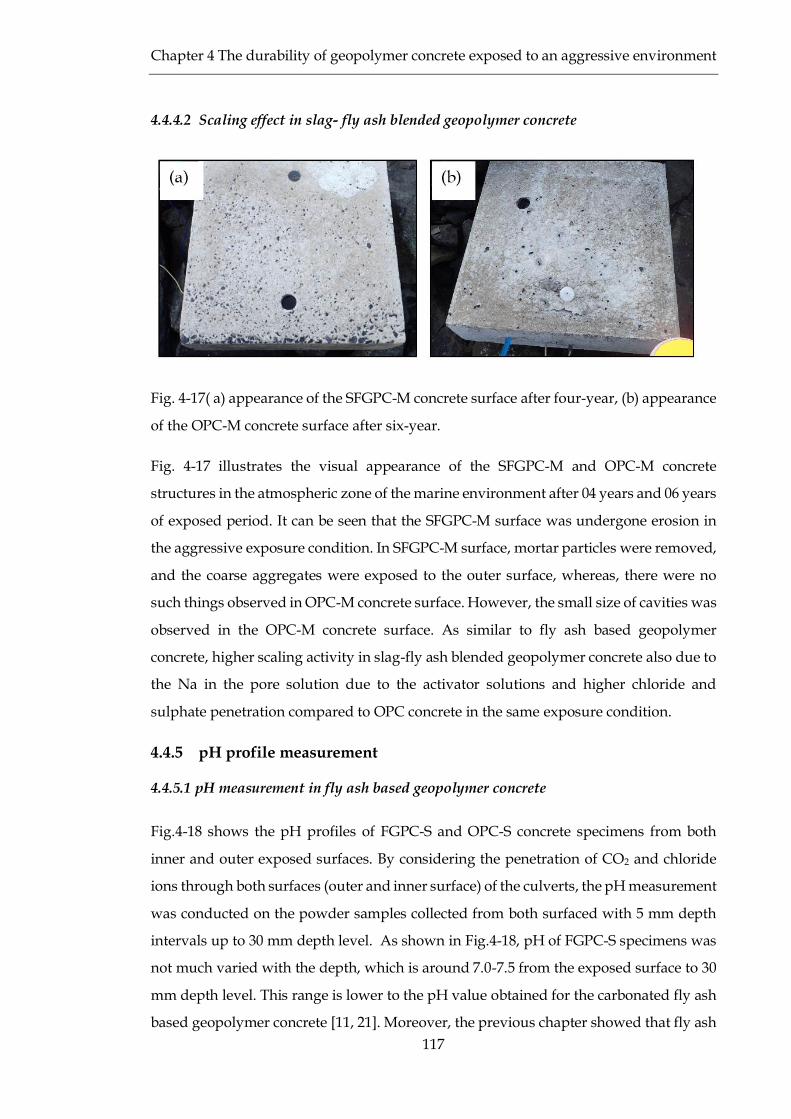
Fig. 4-17( a) appearance of the SFGPC-M concrete surface after four-year, (b) appearance of the
OPC-M concrete surface after six-year. .......................................................................................... 117
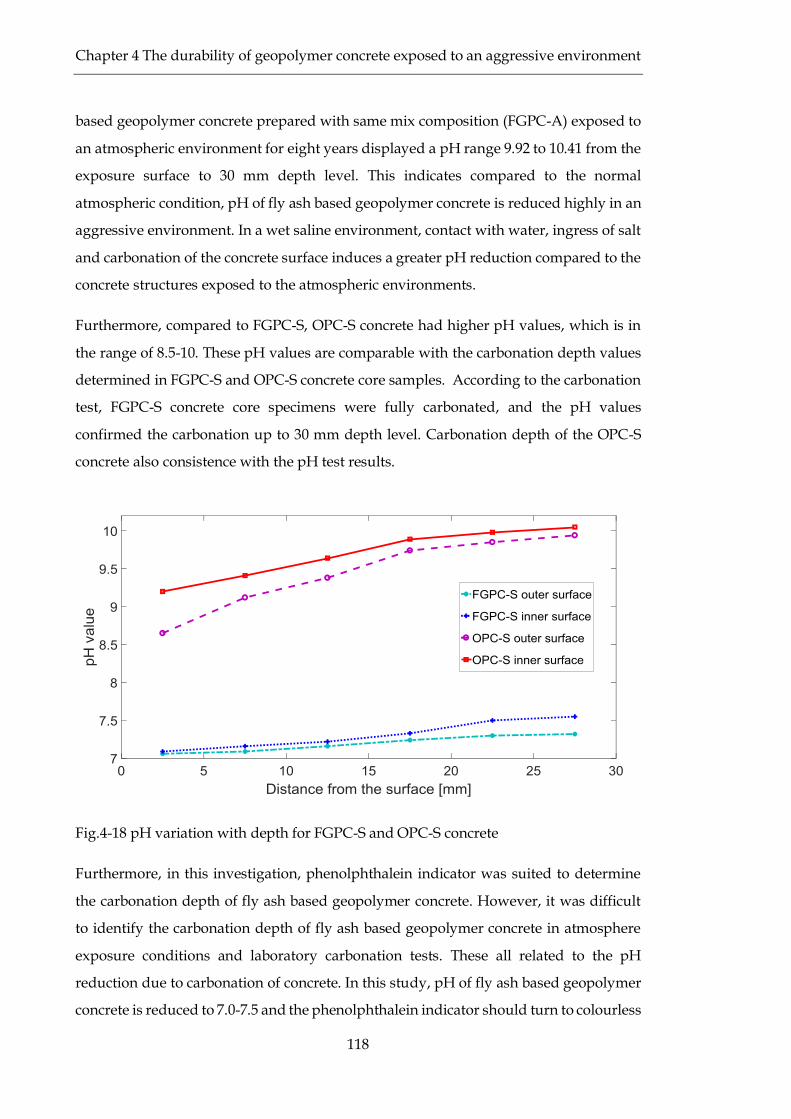
Fig.4-18 pH variation with depth for FGPC-S and OPC-S concrete ............................................. 118
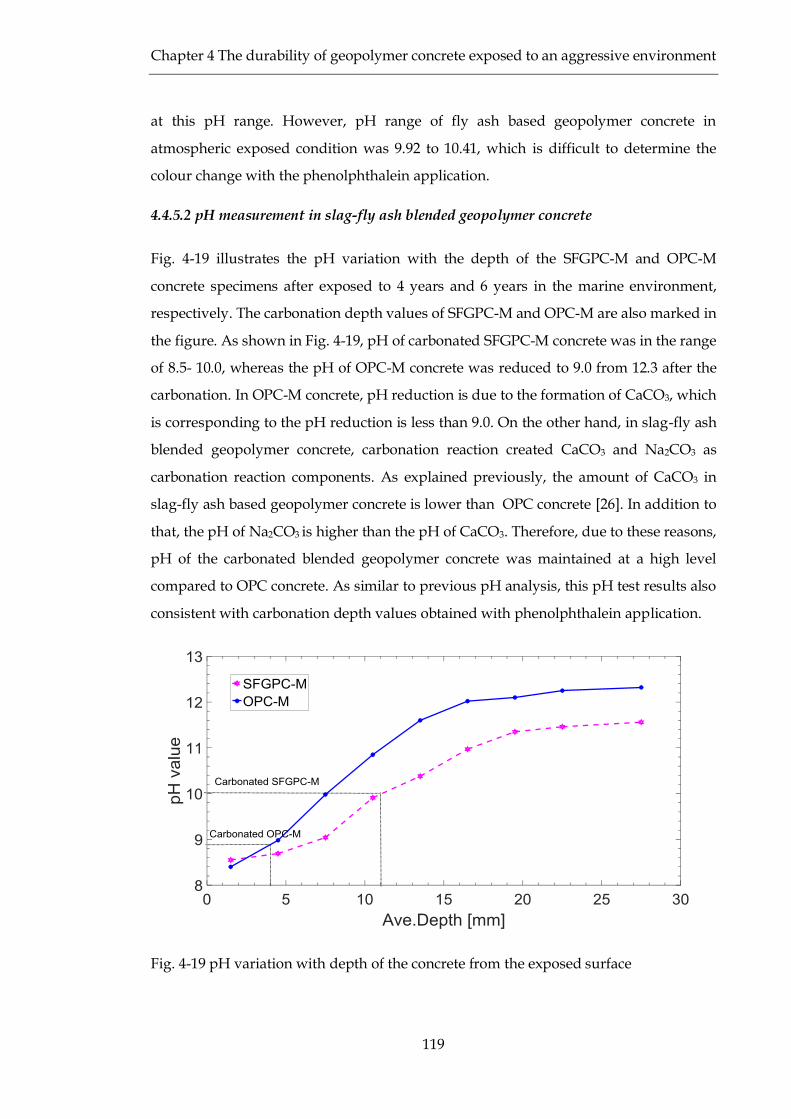
Fig. 4-19 pH variation with depth of the concrete from the exposed surface .............................. 119
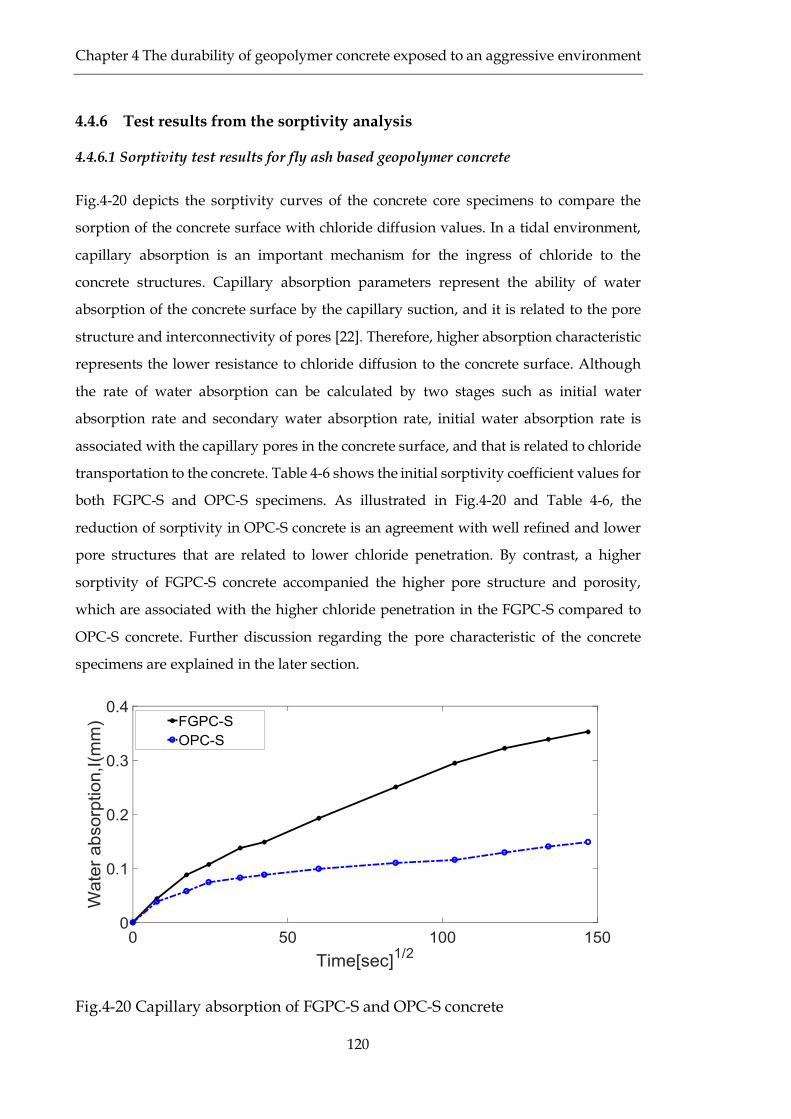
Fig.4-20 Capillary absorption of FGPC-S and OPC-S concrete ..................................................... 120
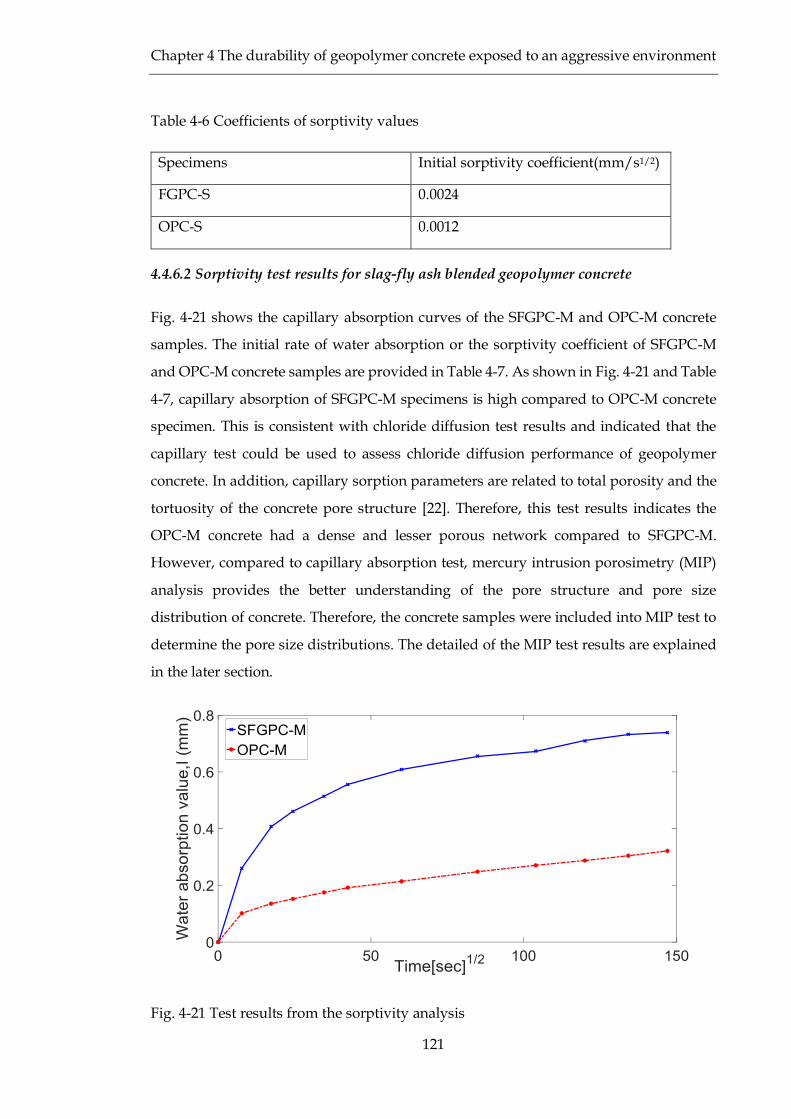
Fig. 4-21 Test results from the sorptivity analysis ......................................................................... 121
Page 20
xx
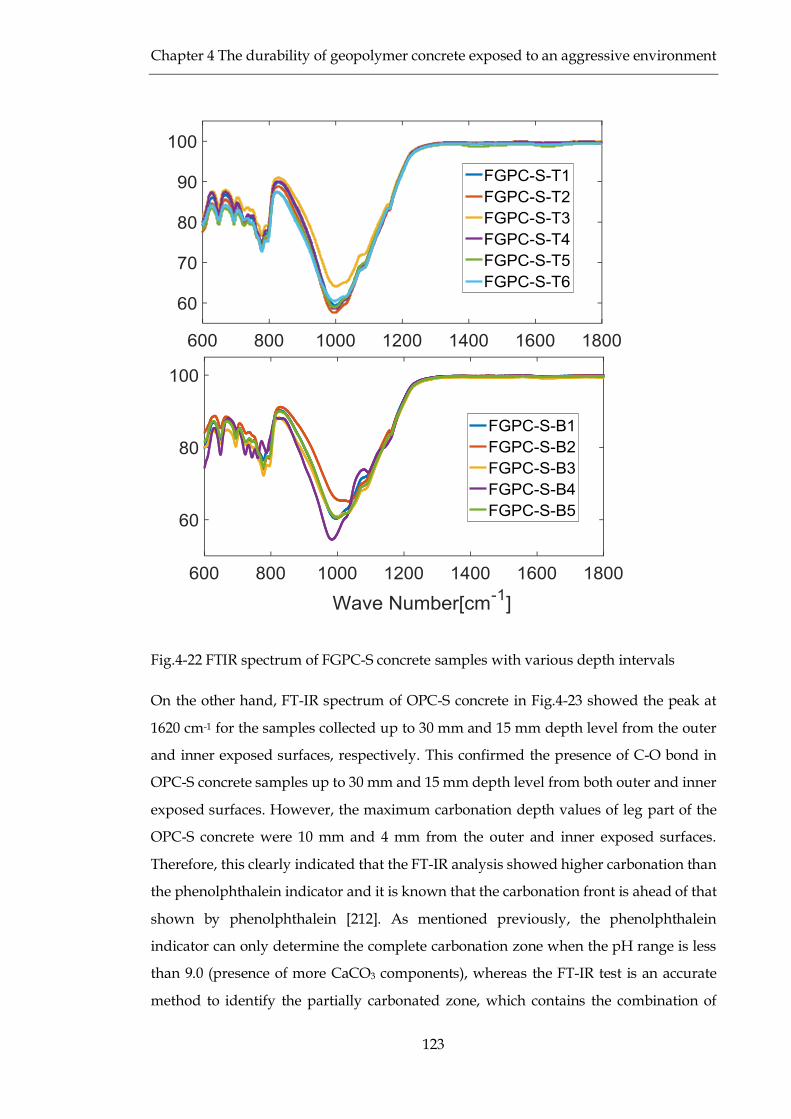
Fig.4-22 FTIR spectrum of FGPC-S concrete samples with various depth intervals................... 123
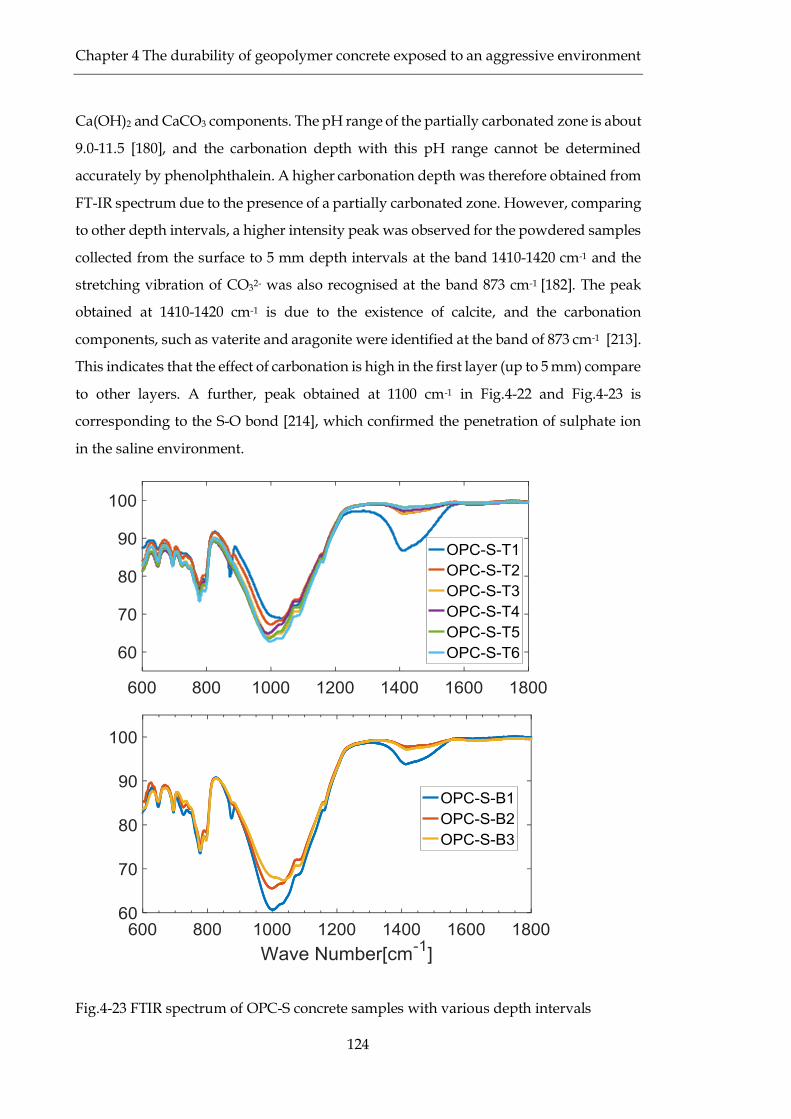
Fig.4-23 FTIR spectrum of OPC-S concrete samples with various depth intervals..................... 124
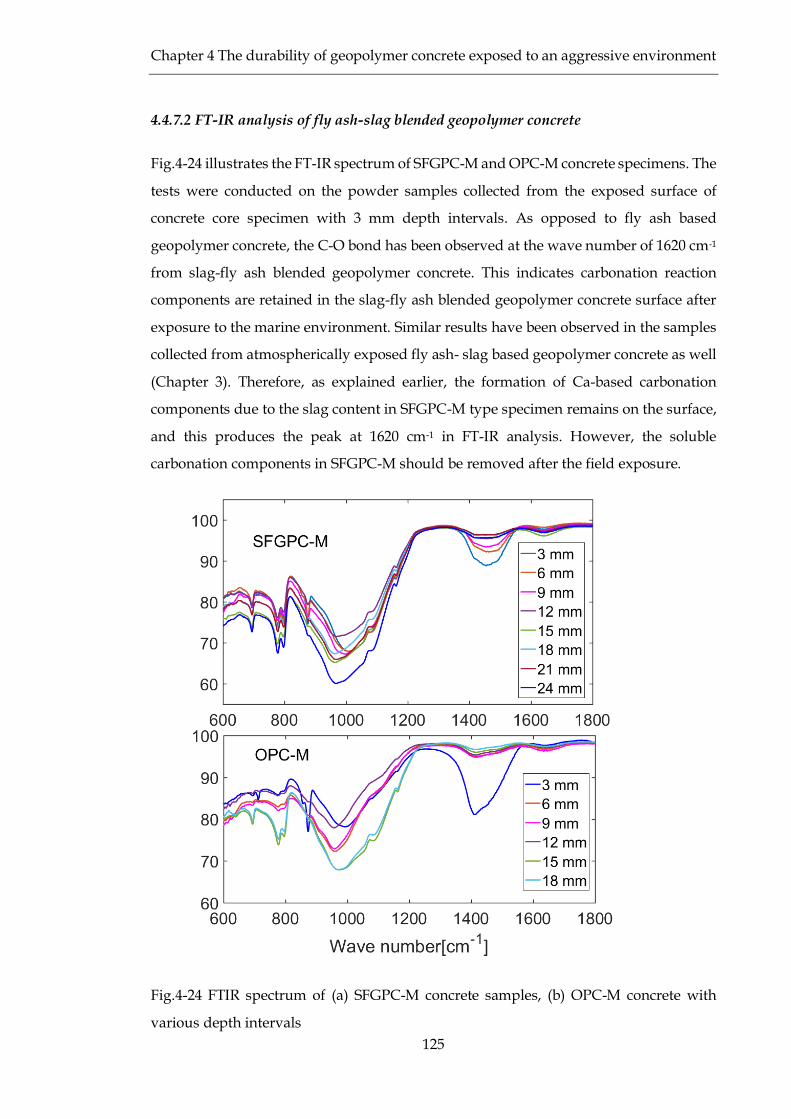
Fig.4-24 FTIR spectrum of (a) SFGPC-M concrete samples, (b) OPC-M concrete with various
depth intervals ................................................................................................................................. 125
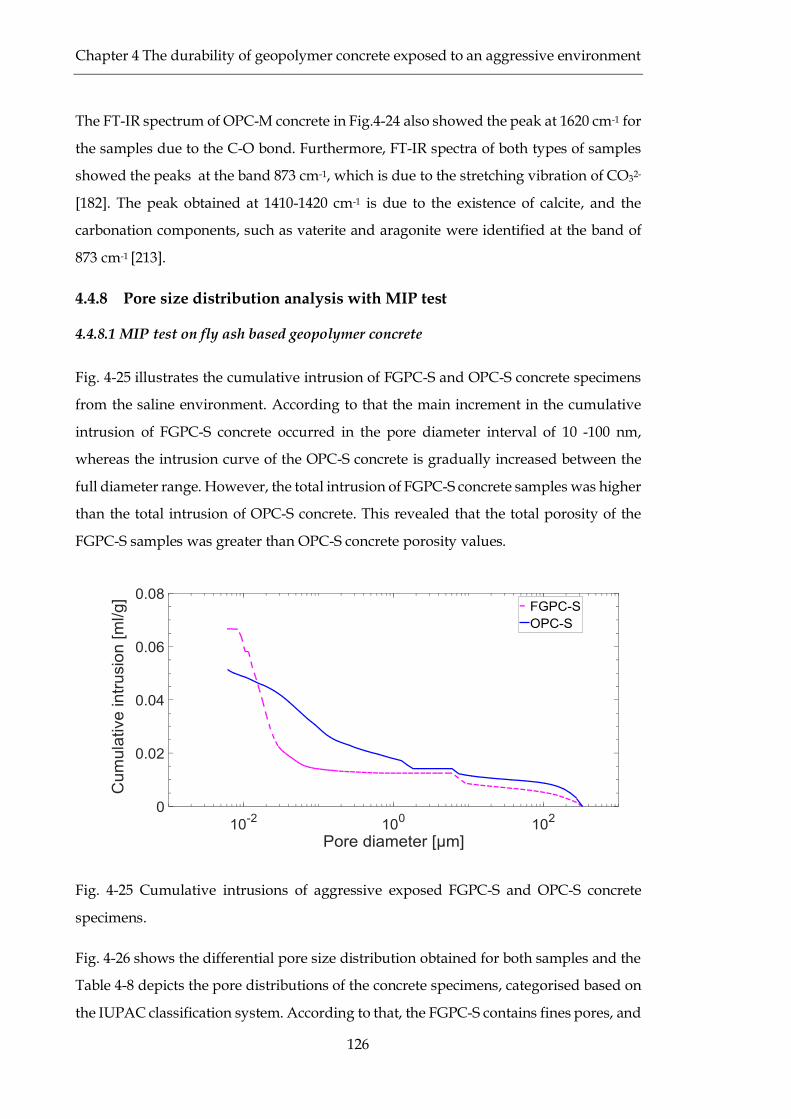
Fig. 4-25 Cumulative intrusions of aggressive exposed FGPC-S and OPC-S concrete specimens.
.......................................................................................................................................................... 126
Fig. 4-26 Differential pore size distribution obtained for aggressive exposed concrete specimens
.......................................................................................................................................................... 127
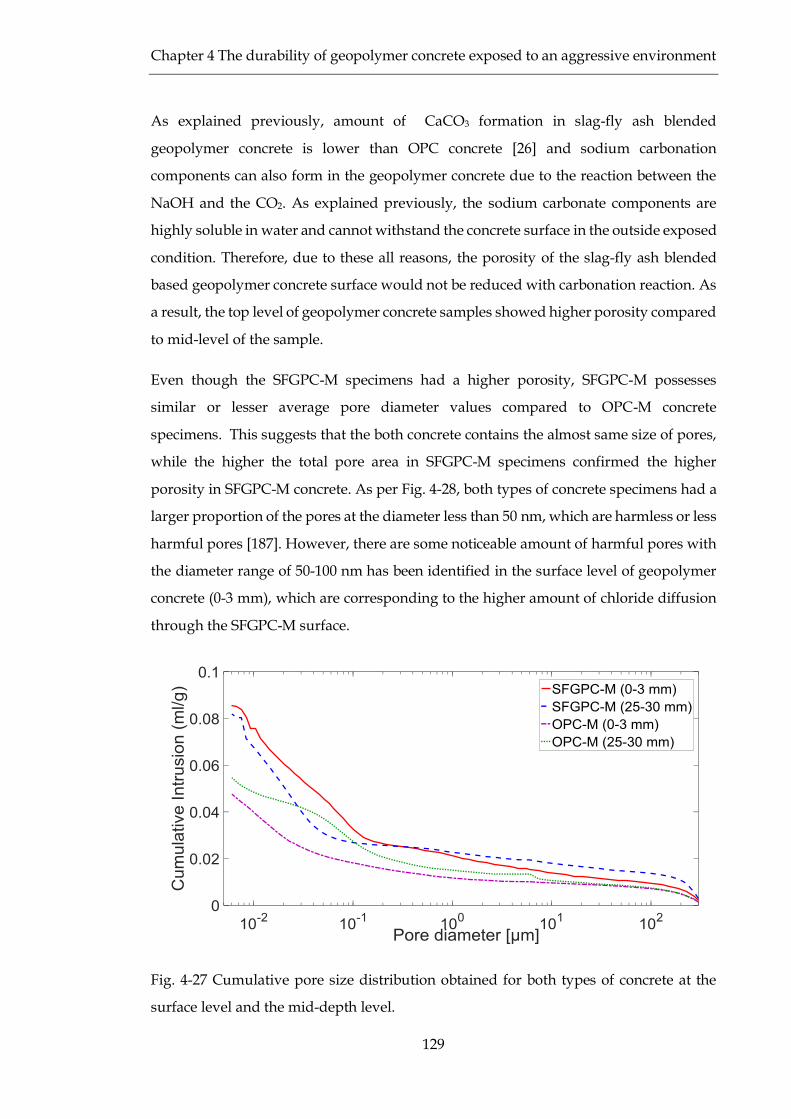
Fig. 4-27 Cumulative pore size distribution obtained for both types of concrete at the surface level
and the mid-depth level. ................................................................................................................. 129
Fig. 4-28 Differential pore size distribution obtained for both types of concrete at the surface level
and the mid-depth level. ................................................................................................................. 130
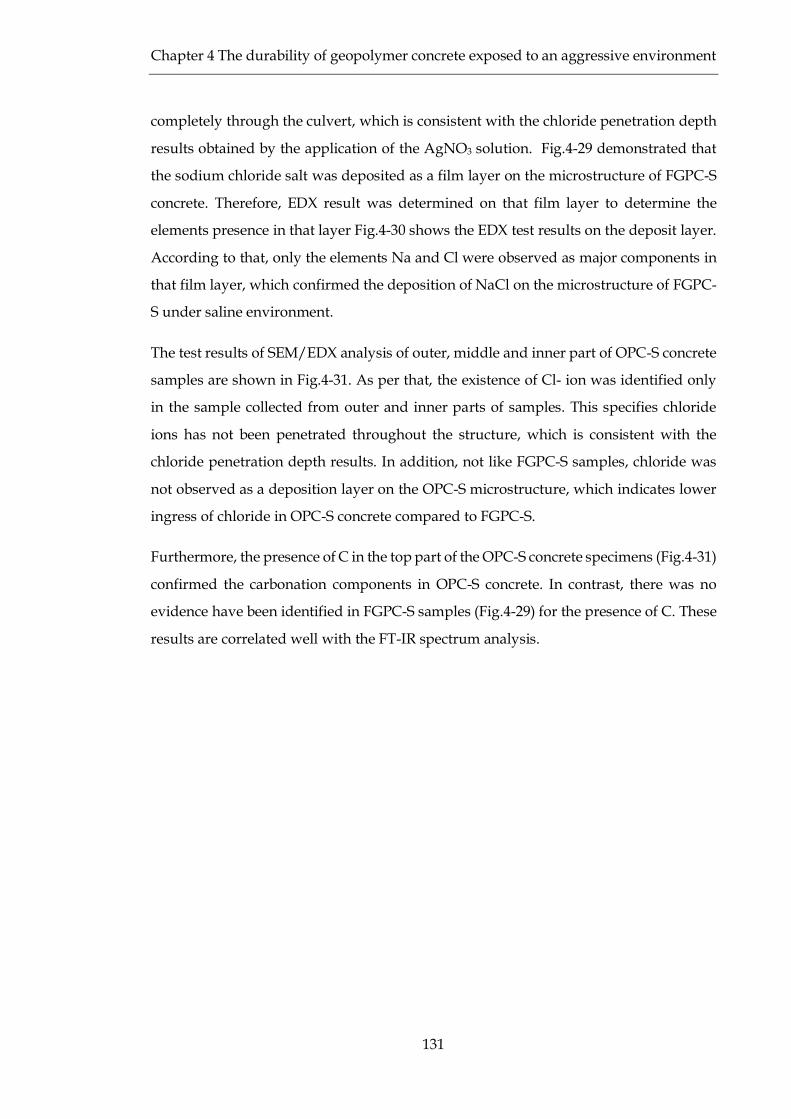
Fig.4-29 SEM micrograph of (a) Top, (b) Middle and (c) Bottom part of FGPC-S concrete core
specimens with corresponding EDX analysis ............................................................................... 132
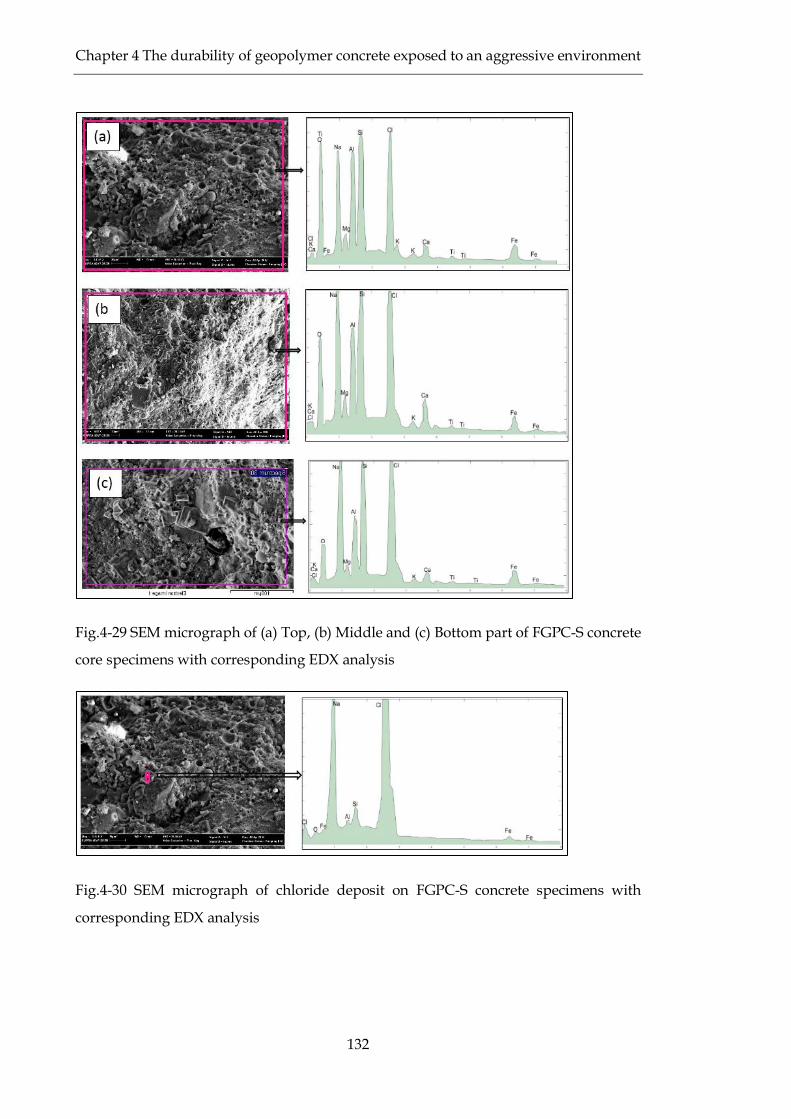
Fig.4-30 SEM micrograph of chloride deposit on FGPC-S concrete specimens with corresponding
EDX analysis .................................................................................................................................... 132
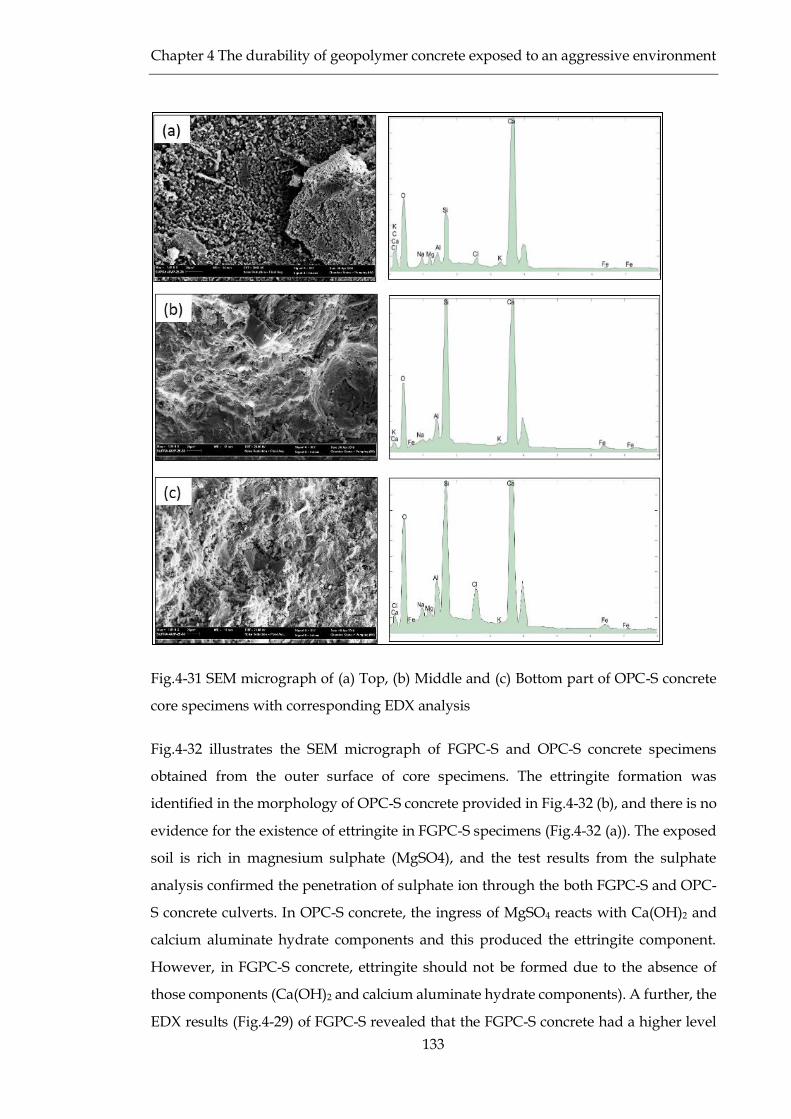
Fig.4-31 SEM micrograph of (a) Top, (b) Middle and (c) Bottom part of OPC-S concrete core
specimens with corresponding EDX analysis ............................................................................... 133
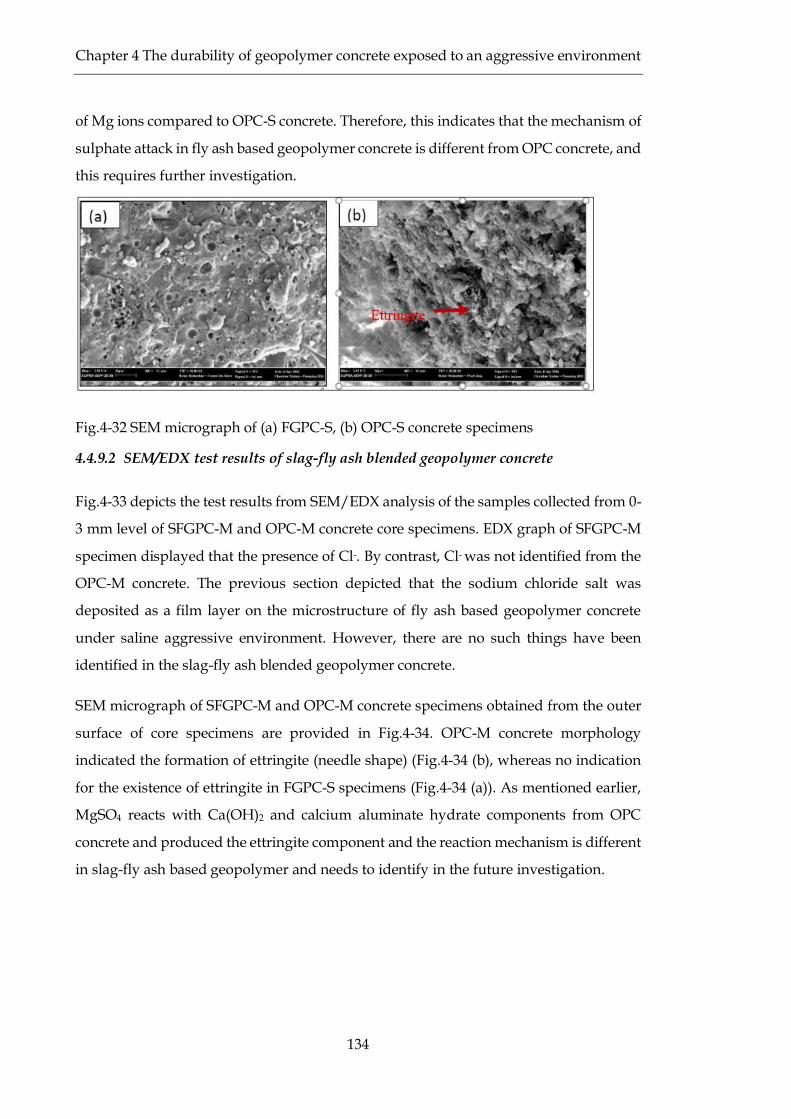
Fig.4-32 SEM micrograph of (a) FGPC-S, (b) OPC-S concrete specimens .................................... 134
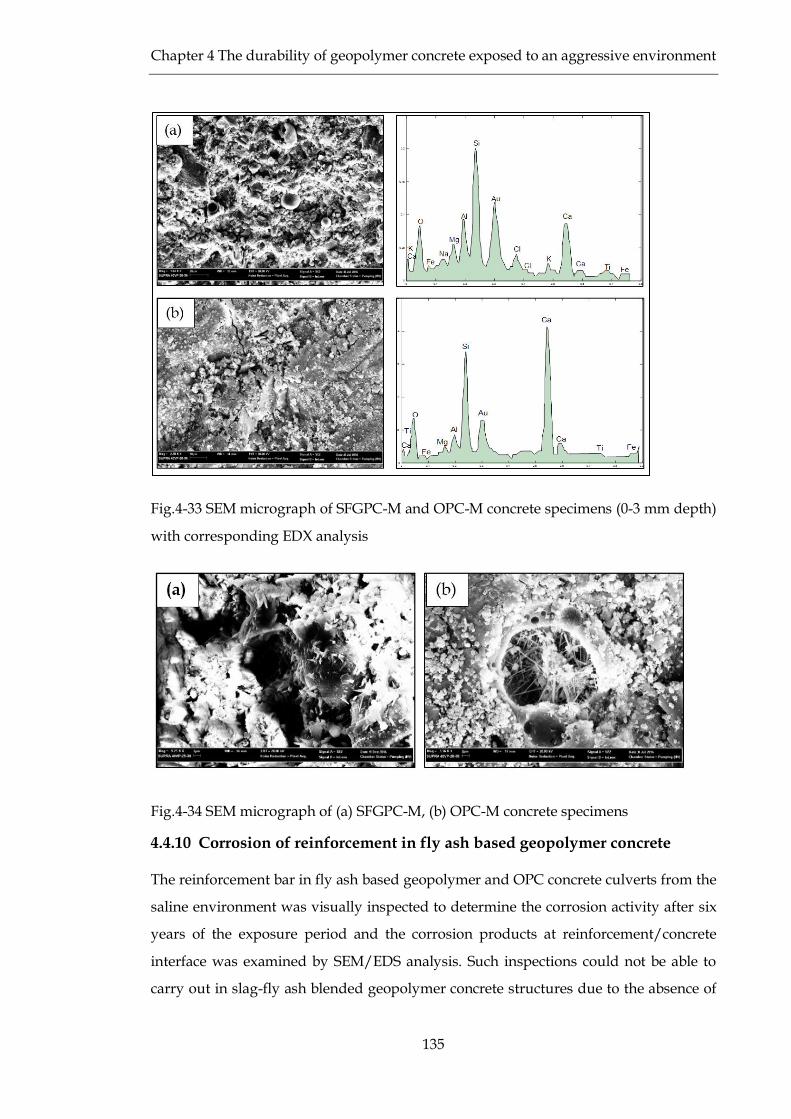
Fig.4-33 SEM micrograph of SFGPC-M and OPC-M concrete specimens (0-3 mm depth) with
corresponding EDX analysis .......................................................................................................... 135
Fig.4-34 SEM micrograph of (a) SFGPC-M, (b) OPC-M concrete specimens .............................. 135
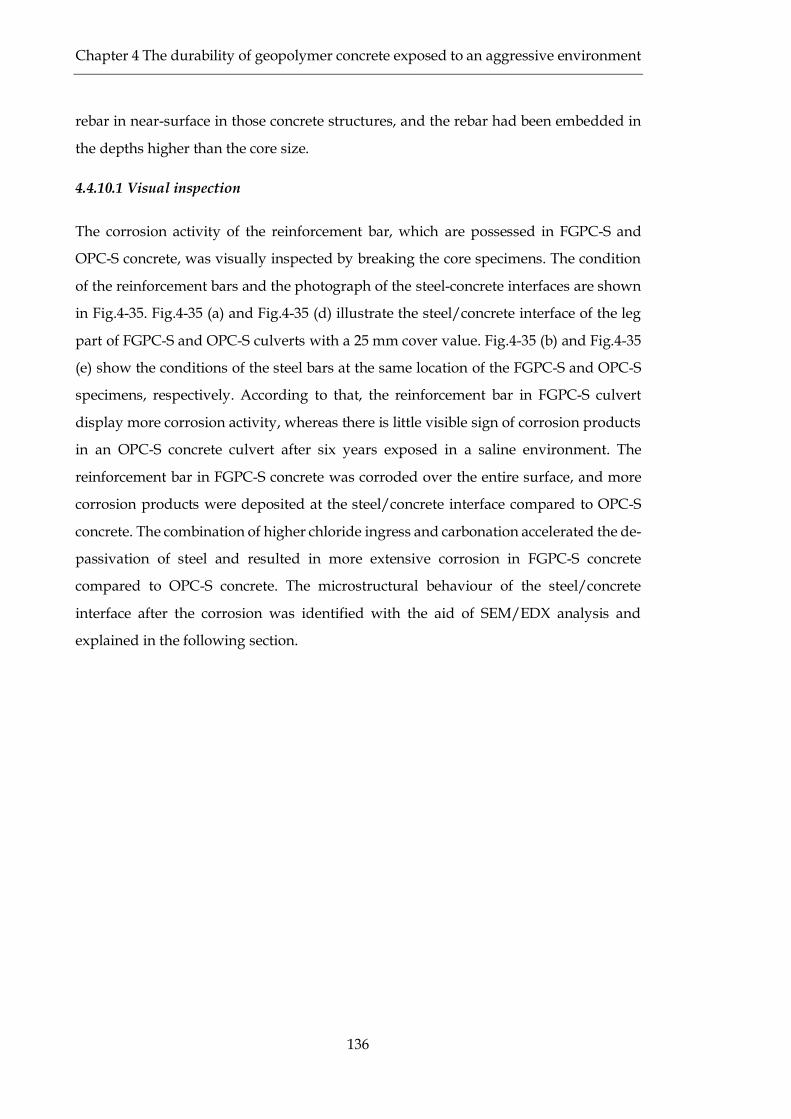
Fig.4-35 Rebar interface and reinforcement bar after six years of exposure, (a) typical rebar
interface of FGPC-S concrete specimen, (b) reinforcement bar in leg part of FGPC-S culvert, (d)
typical rebar interface of OPC-S concrete specimen, (e) reinforcement bar in the leg part of OPC-
S culvert ........................................................................................................................................... 137
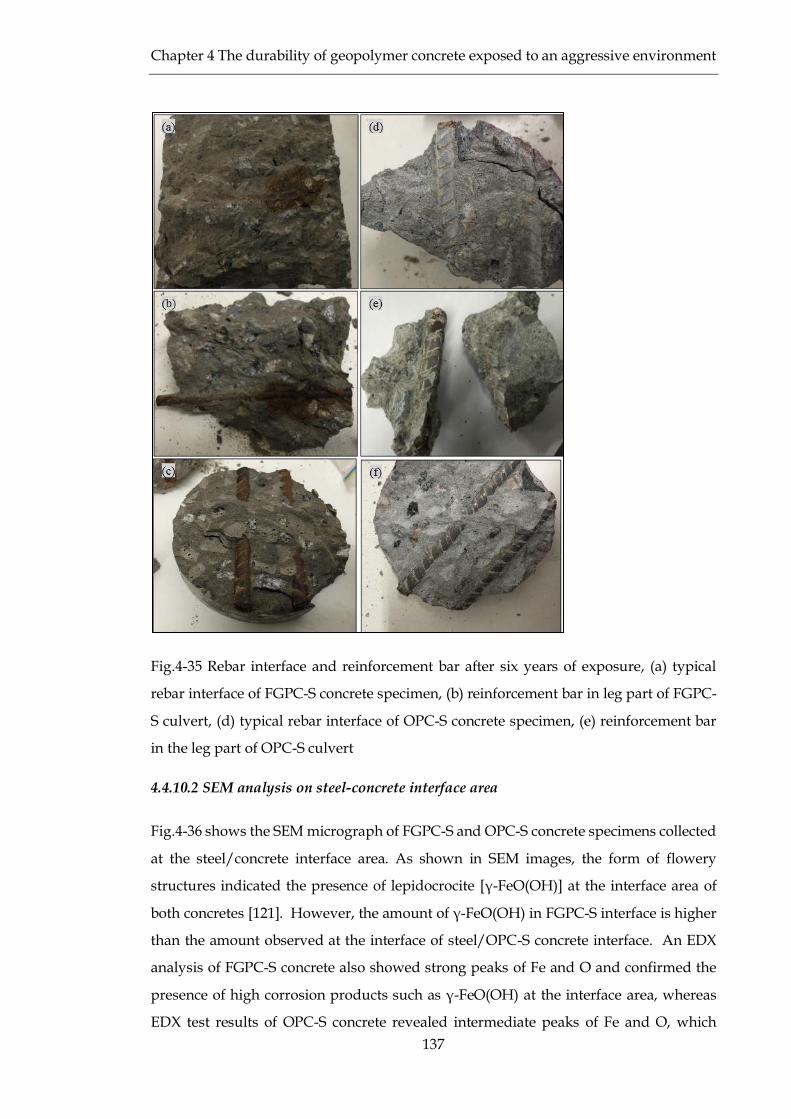
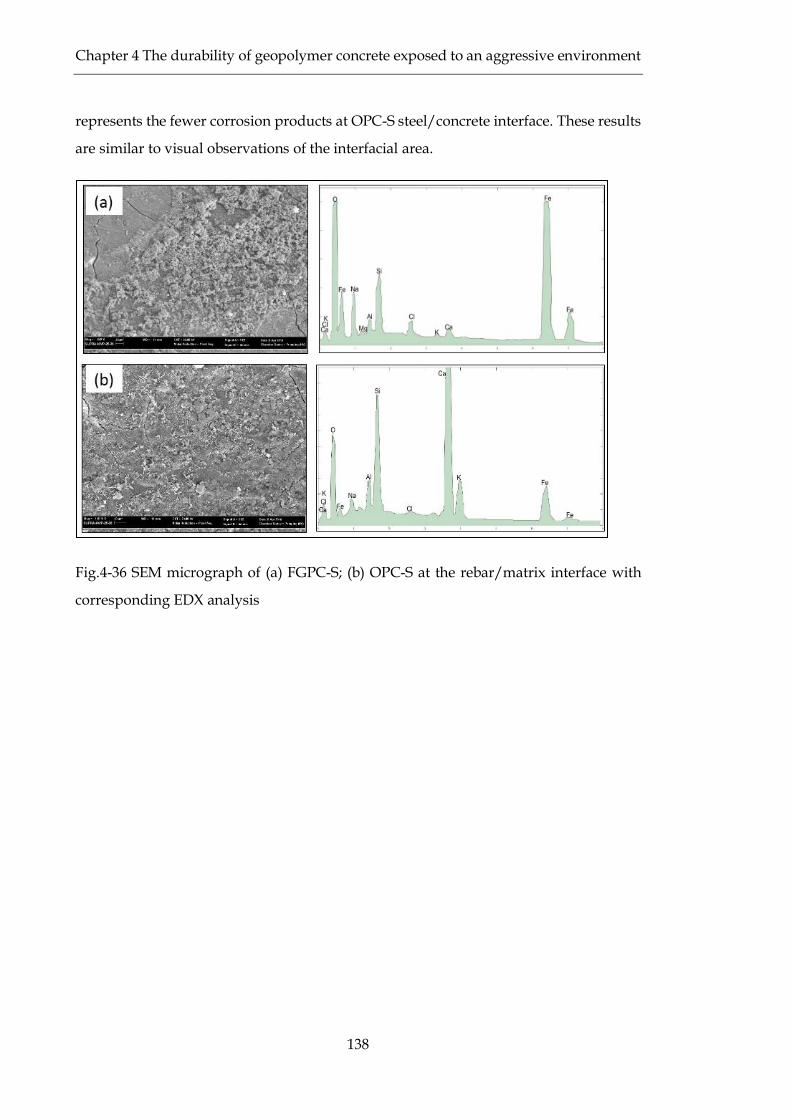
Fig.4-36 SEM micrograph of (a) FGPC-S; (b) OPC-S at the rebar/matrix interface with
corresponding EDX analysis .......................................................................................................... 138
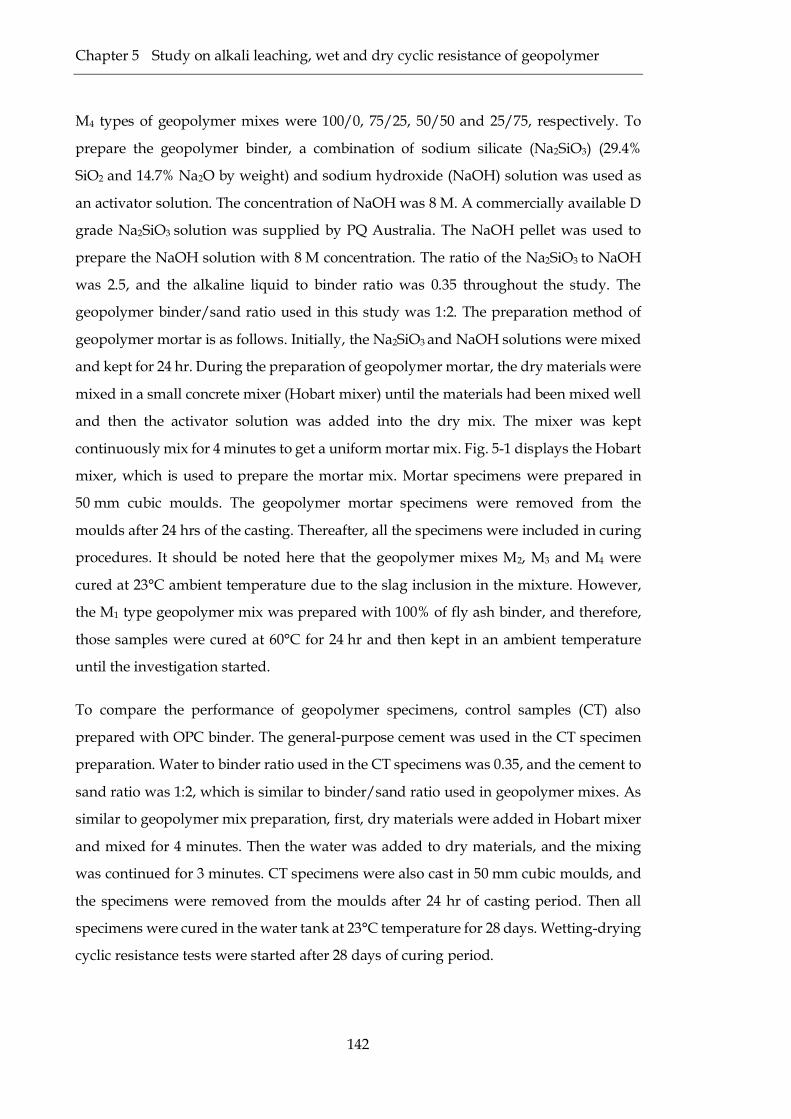
Fig. 5-1 Mortar mixer (Hobart mixer) ............................................................................................ 143
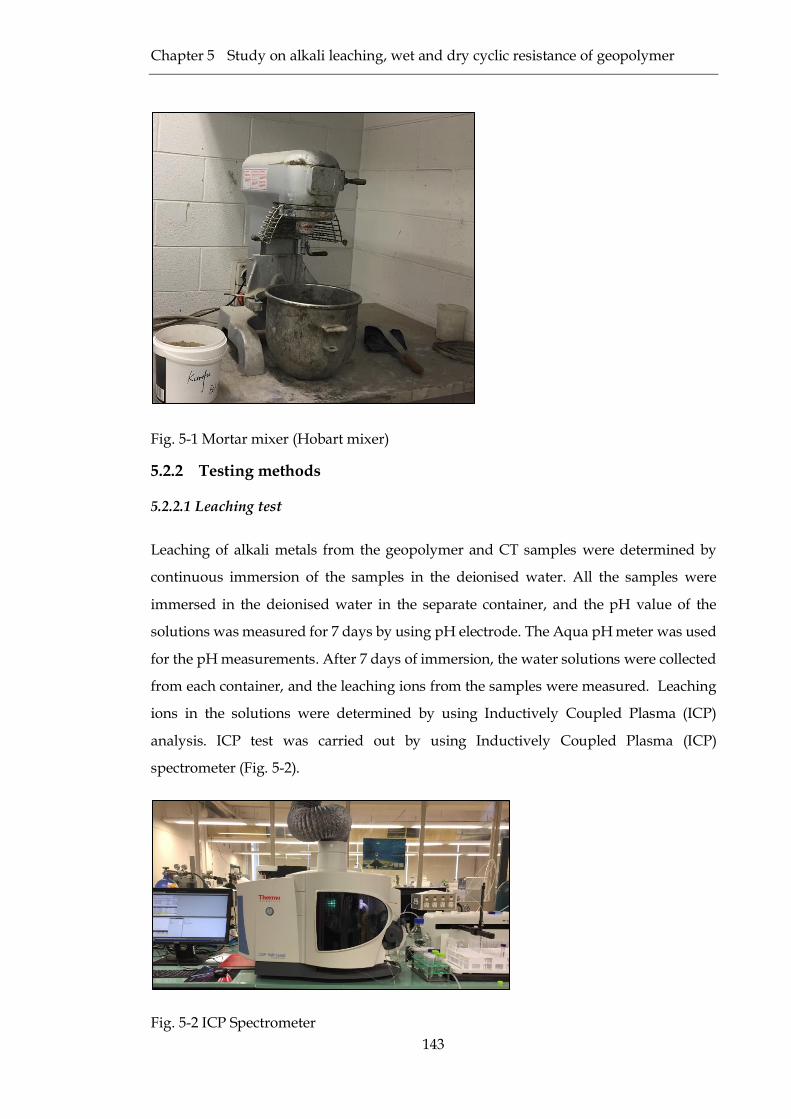
Fig. 5-2 ICP Spectrometer ............................................................................................................... 143
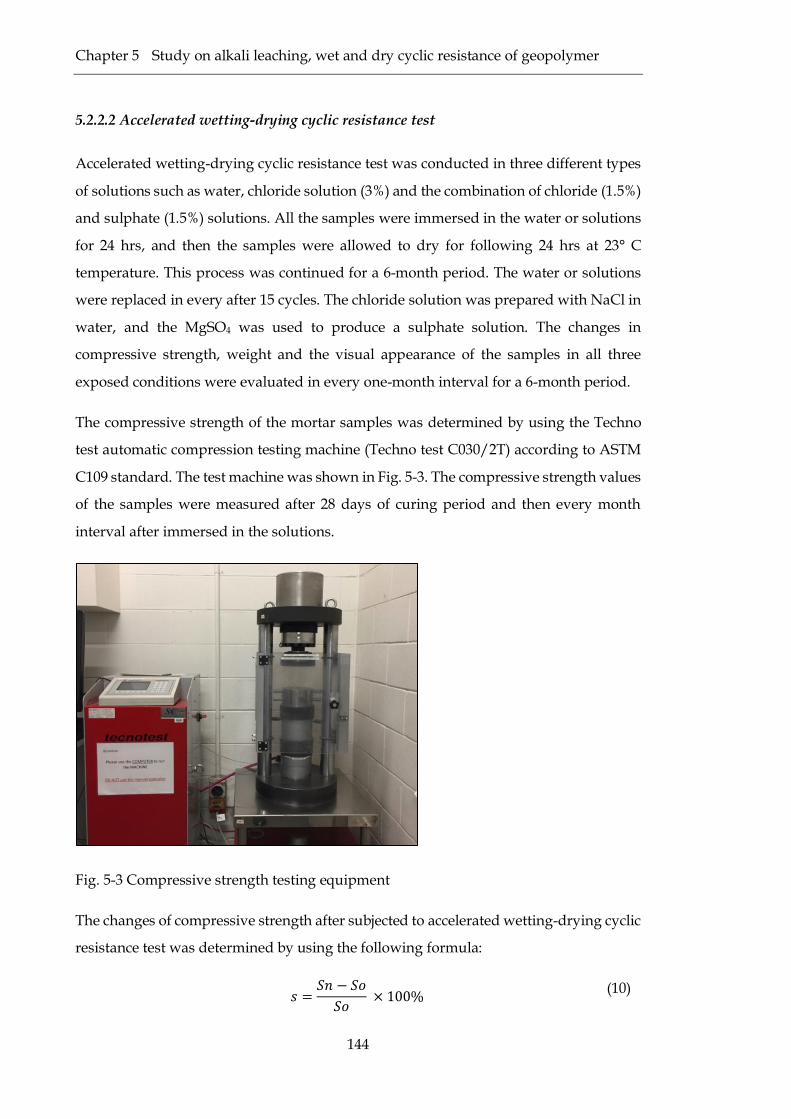
Fig. 5-3 Compressive strength testing equipment ......................................................................... 144
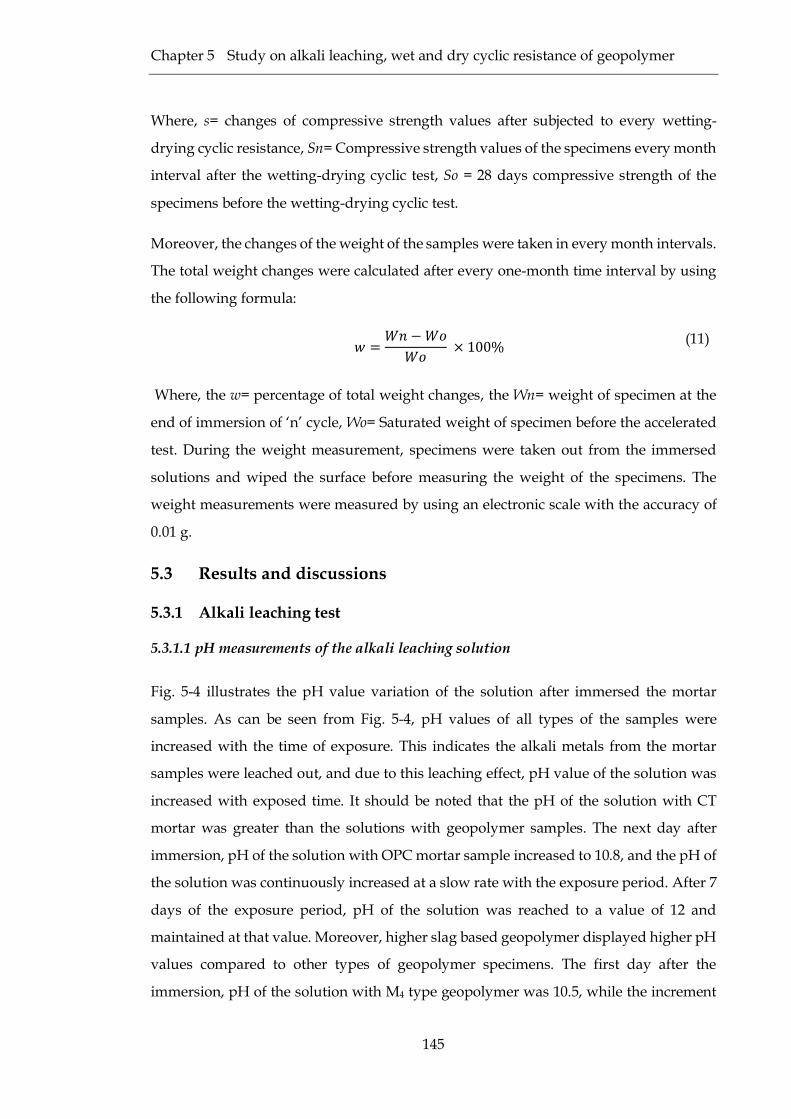
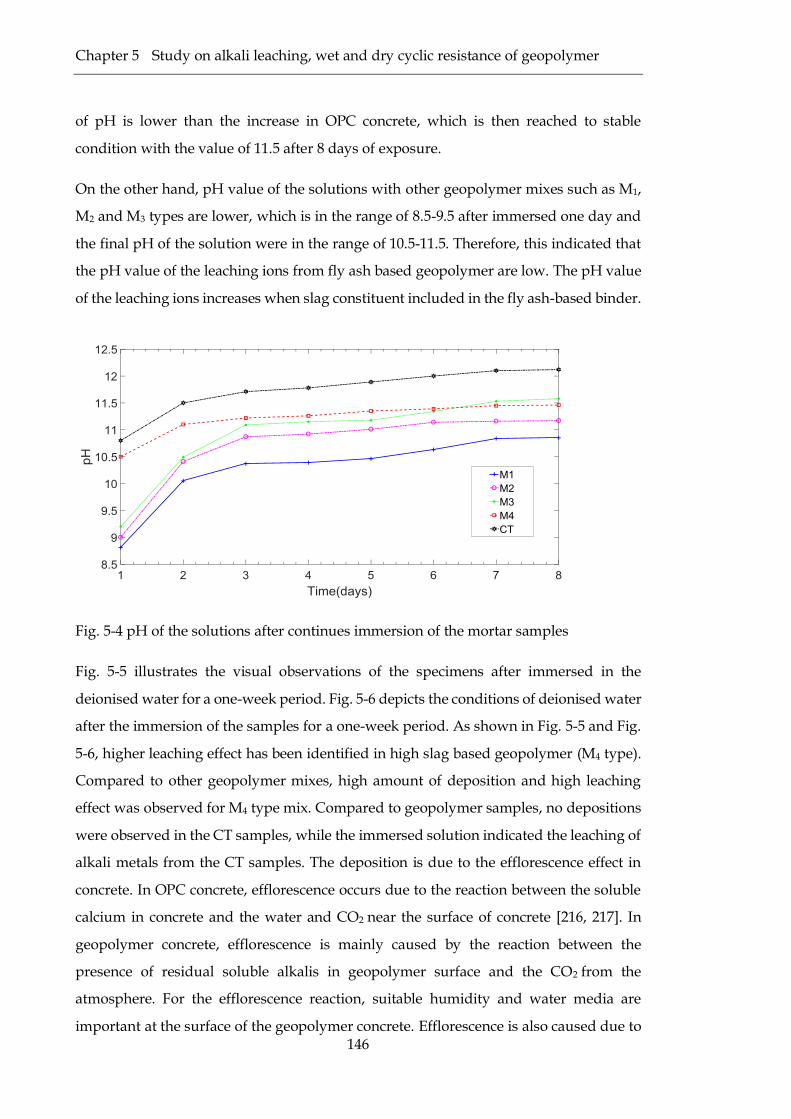
Fig. 5-4 pH of the solutions after continues immersion of the mortar samples .......................... 146
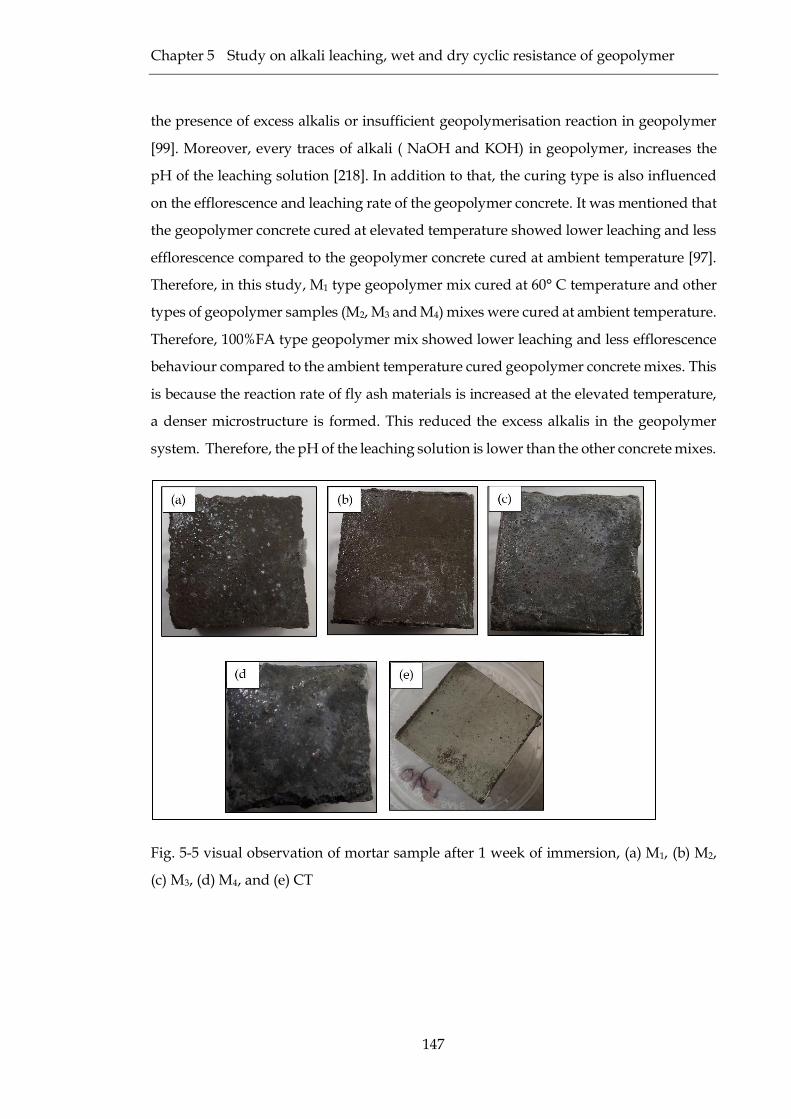
Fig. 5-5 visual observation of mortar sample after 1 week of immersion, (a) M1, (b) M2, (c) M3, (d)
M4, and (e) CT .................................................................................................................................. 147
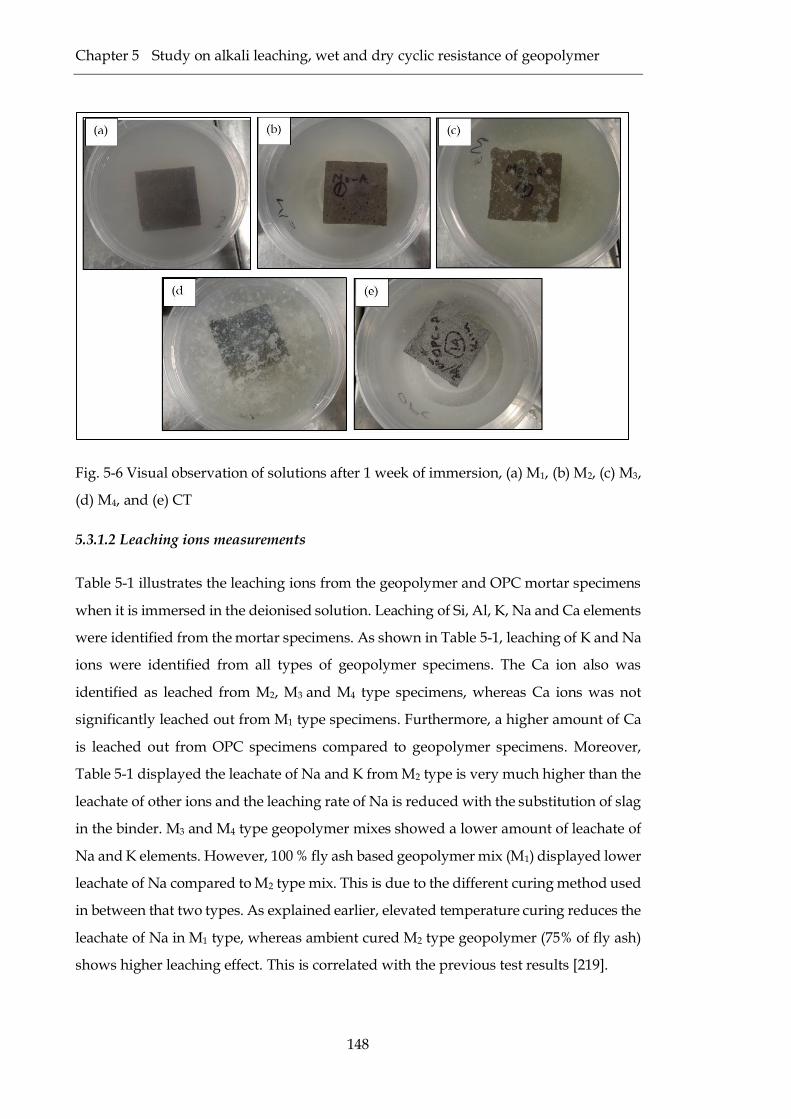
Fig. 5-6 Visual observation of solutions after 1 week of immersion, (a) M1, (b) M2, (c) M3, (d) M4,
and (e) CT ........................................................................................................................................ 148
Page 21
xxi
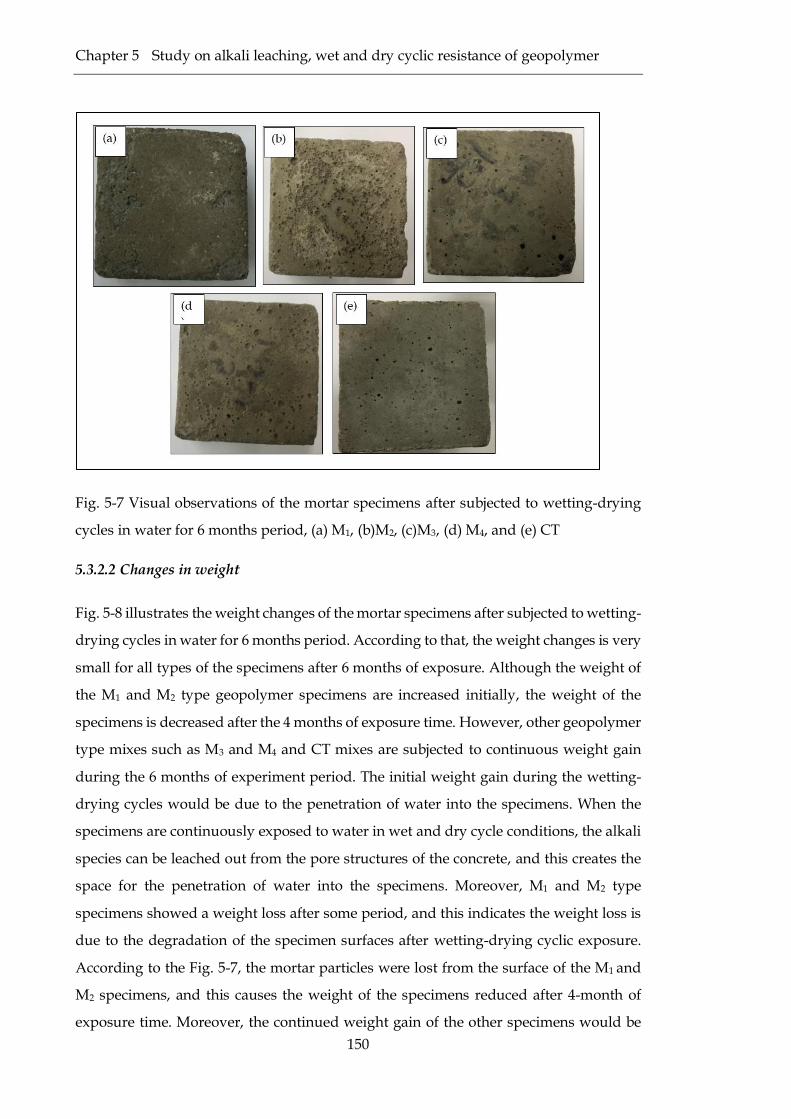
Fig. 5-7 Visual observations of the mortar specimens after subjected to wetting-drying cycles in
water for 6 months period, (a) M1, (b)M2, (c)M3, (d) M4, and (e) CT ............................................ 150
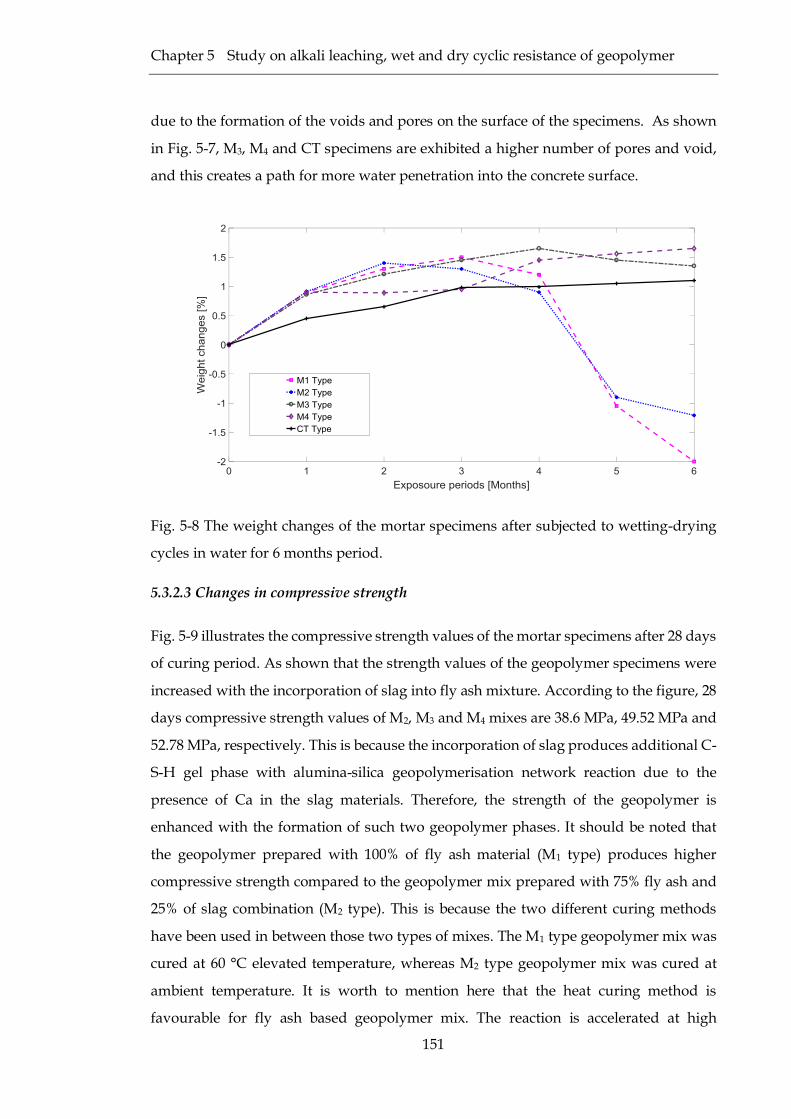
Fig. 5-8 The weight changes of the mortar specimens after subjected to wetting-drying cycles in
water for 6 months period. .............................................................................................................. 151
Fig. 5-9 28 days Compressive strength of the mortar specimens .................................................. 152
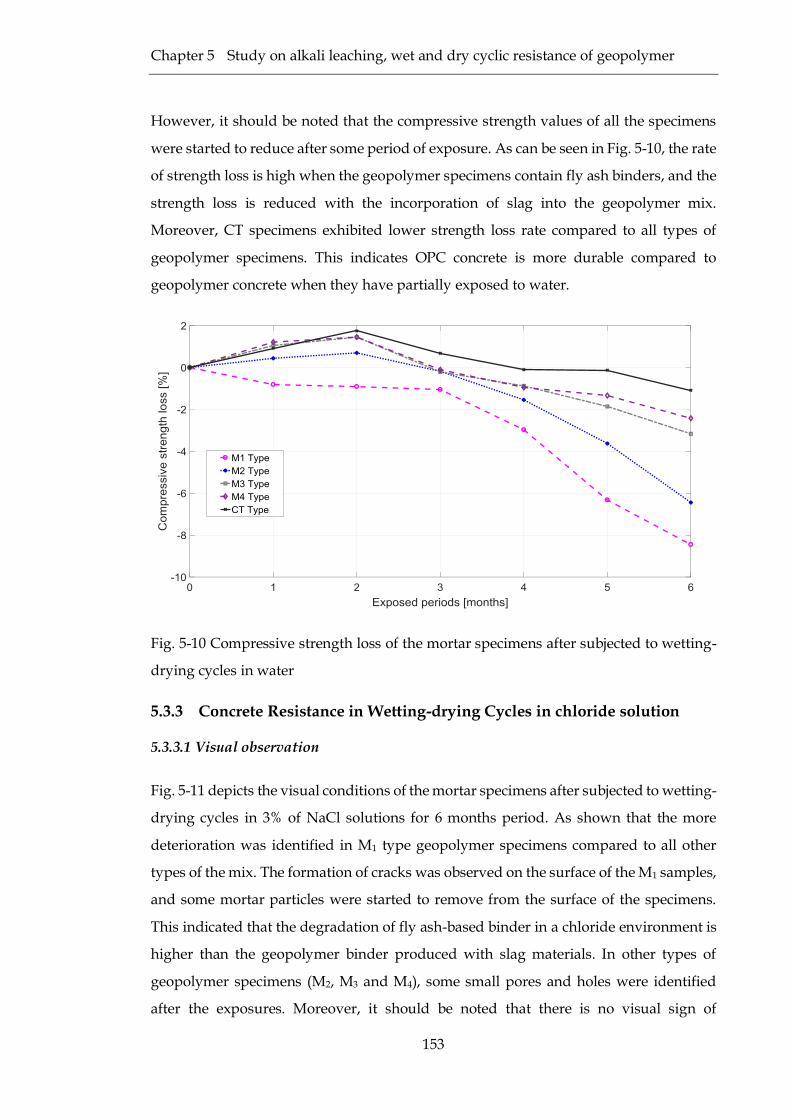
Fig. 5-10 Compressive strength loss of the mortar specimens after subjected to wetting-drying
cycles in water .................................................................................................................................. 153
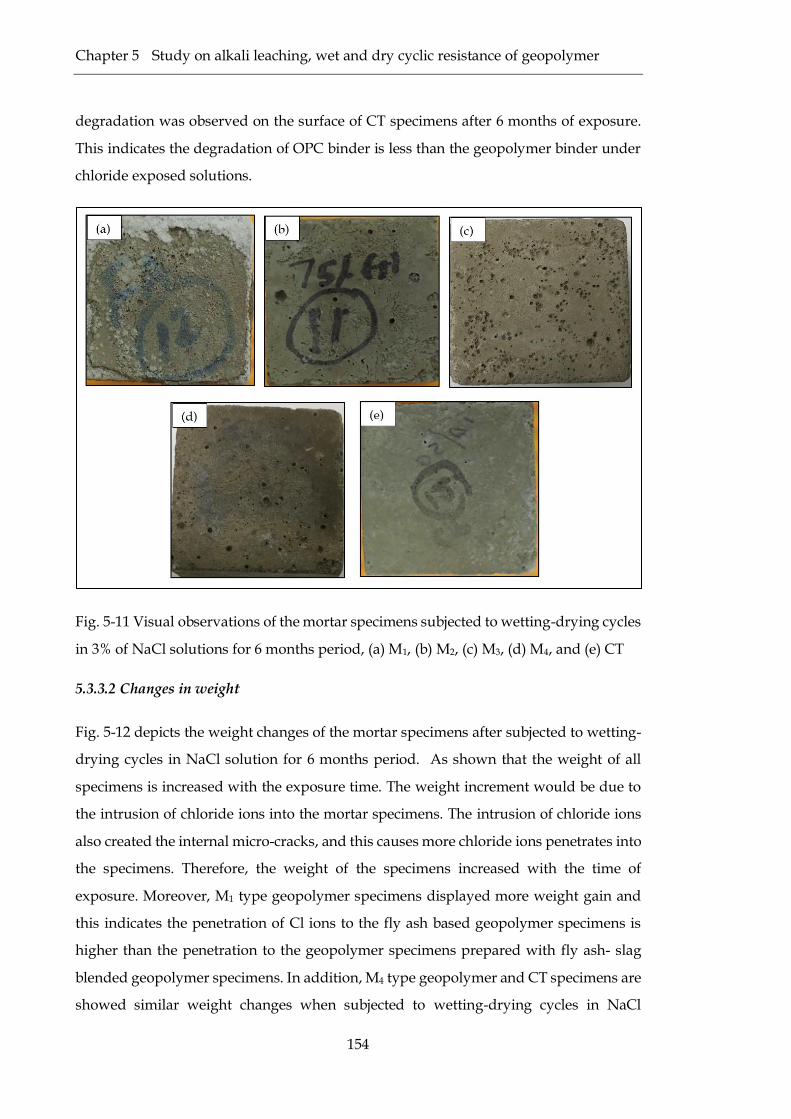
Fig. 5-11 Visual observations of the mortar specimens subjected to wetting-drying cycles in 3% of
NaCl solutions for 6 months period, (a) M1, (b) M2, (c) M3, (d) M4, and (e) CT ........................... 154
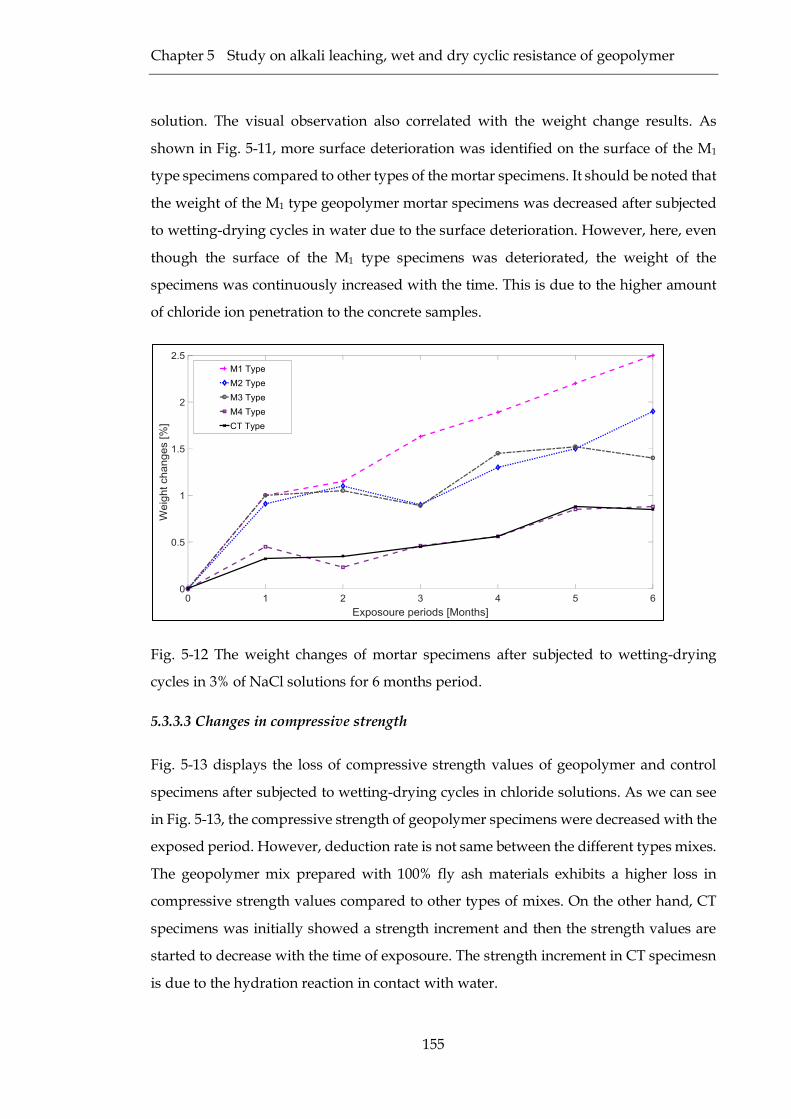
Fig. 5-12 The weight changes of mortar specimens after subjected to wetting-drying cycles in 3%
of NaCl solutions for 6 months period. .......................................................................................... 155
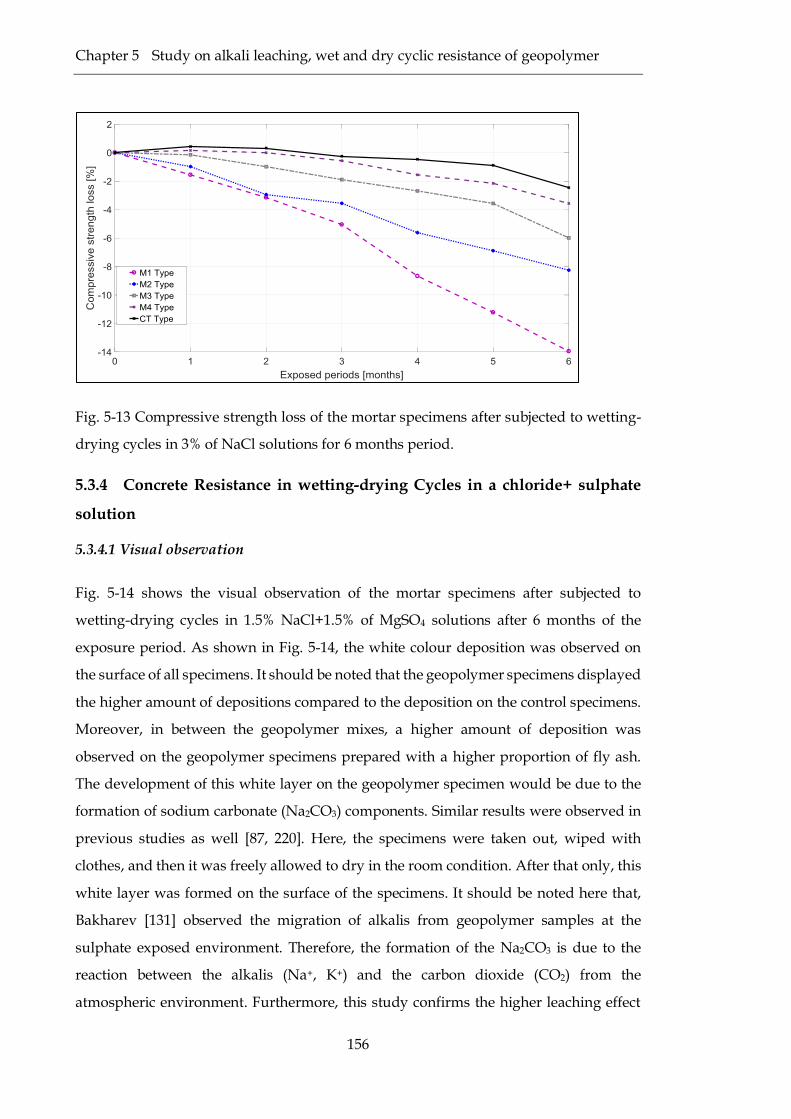
Fig. 5-13 Compressive strength loss of the mortar specimens after subjected to wetting-drying
cycles in 3% of NaCl solutions for 6 months period. ..................................................................... 156
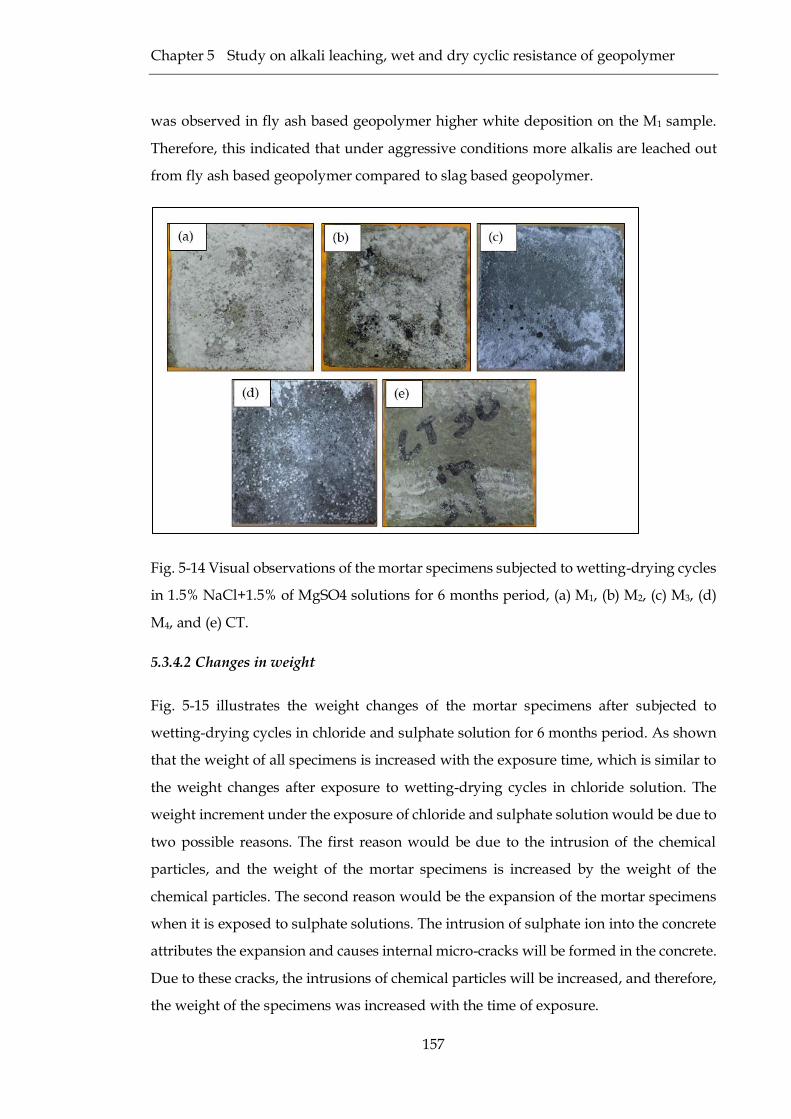
Fig. 5-14 Visual observations of the mortar specimens subjected to wetting-drying cycles in 1.5%
NaCl+1.5% of MgSO4 solutions for 6 months period, (a) M1, (b) M2, (c) M3, (d) M4, and (e) CT.
........................................................................................................................................................... 157
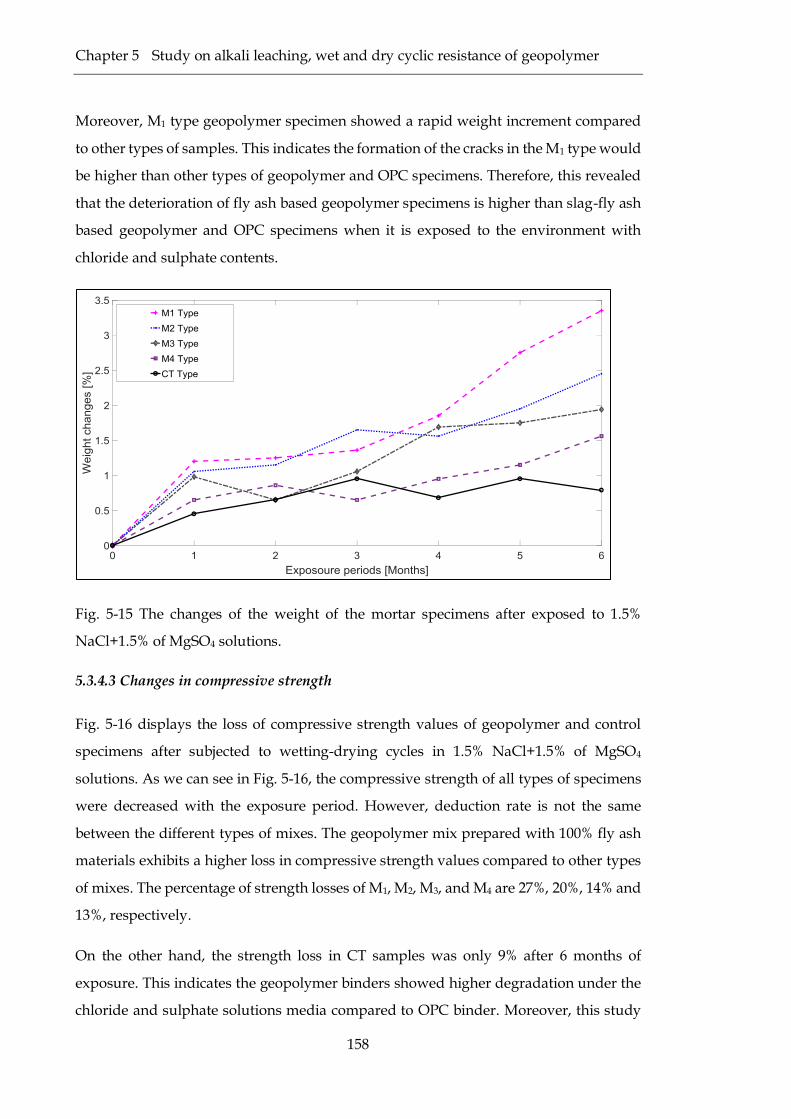
Fig. 5-15 The changes of the weight of the mortar specimens after exposed to 1.5% NaCl+1.5% of
MgSO4 solutions............................................................................................................................... 158
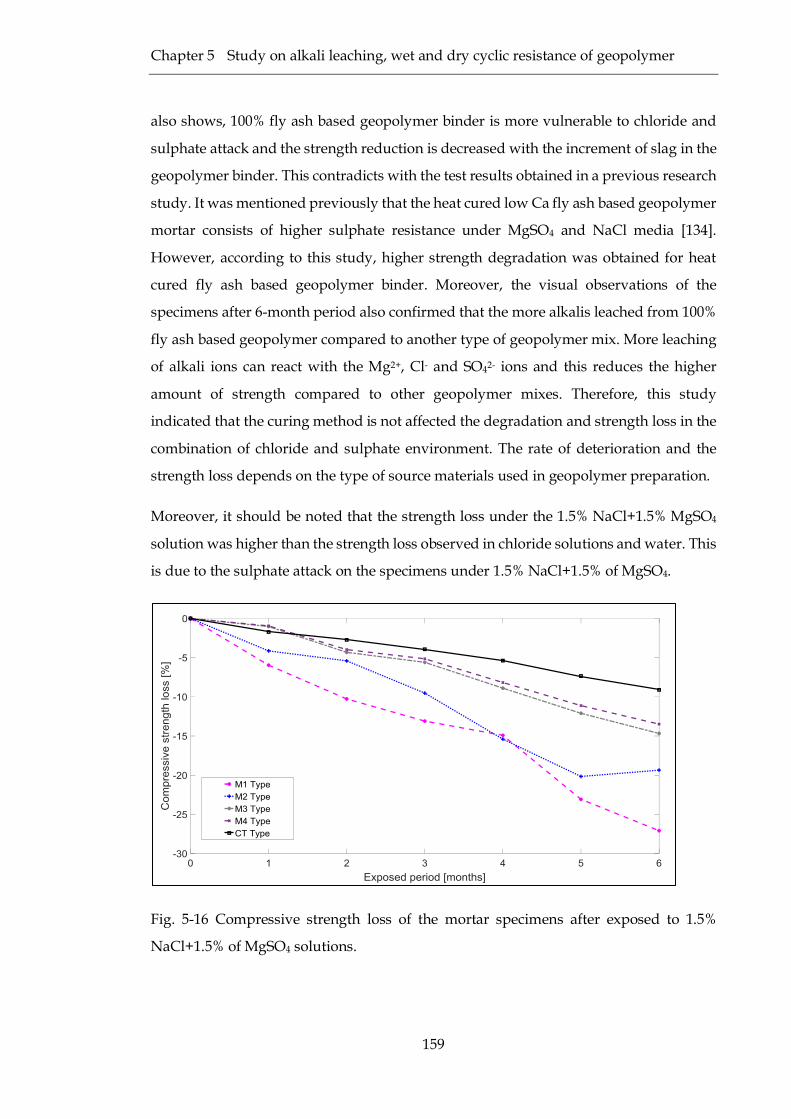
Fig. 5-16 Compressive strength loss of the mortar specimens after exposed to 1.5% NaCl+1.5% of
MgSO4 solutions............................................................................................................................... 159
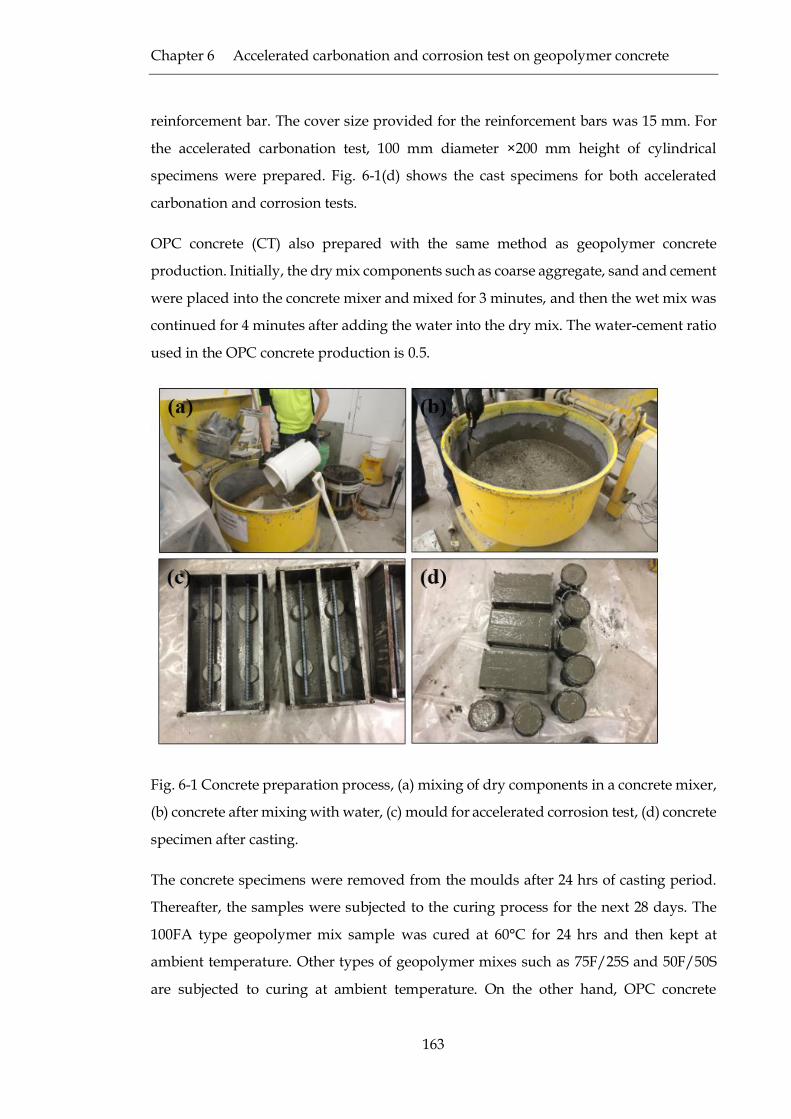
Fig. 6-1 Concrete preparation process, (a) mixing of dry components in a concrete mixer, (b)
concrete after mixing with water, (c) mould for accelerated corrosion test, (d) concrete specimen
after casting. ..................................................................................................................................... 163
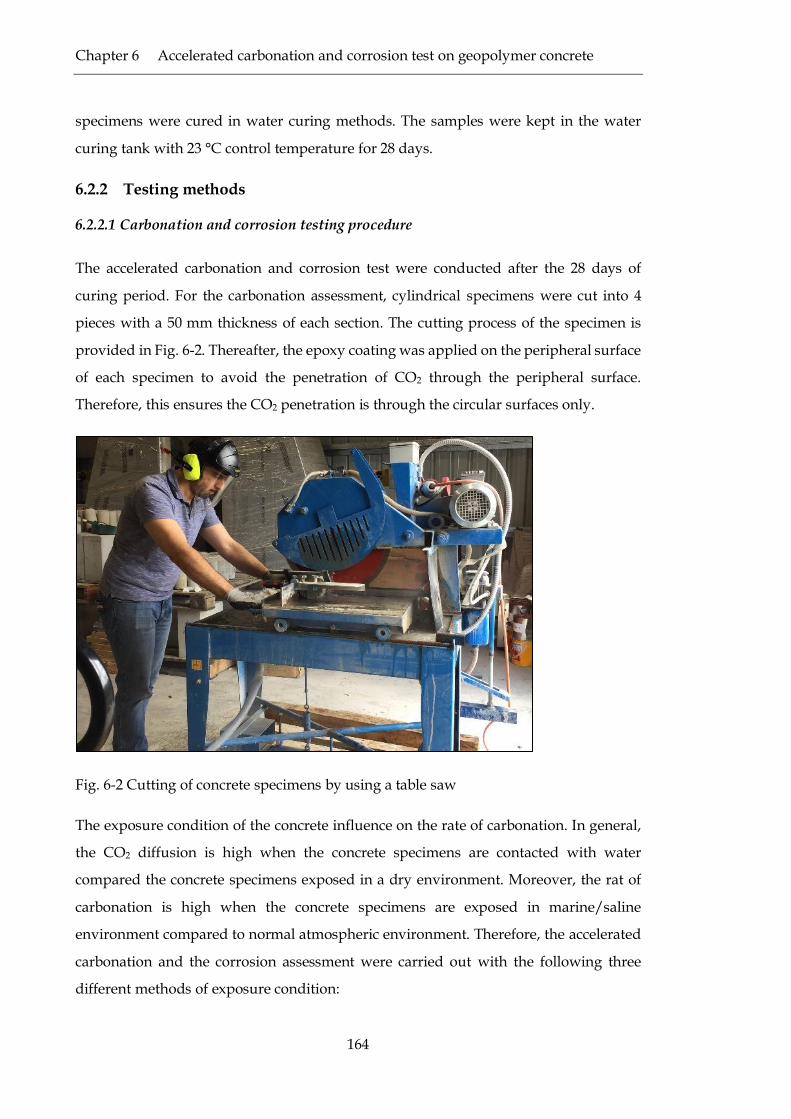
Fig. 6-2 Cutting of concrete specimens by using a table saw ........................................................ 164
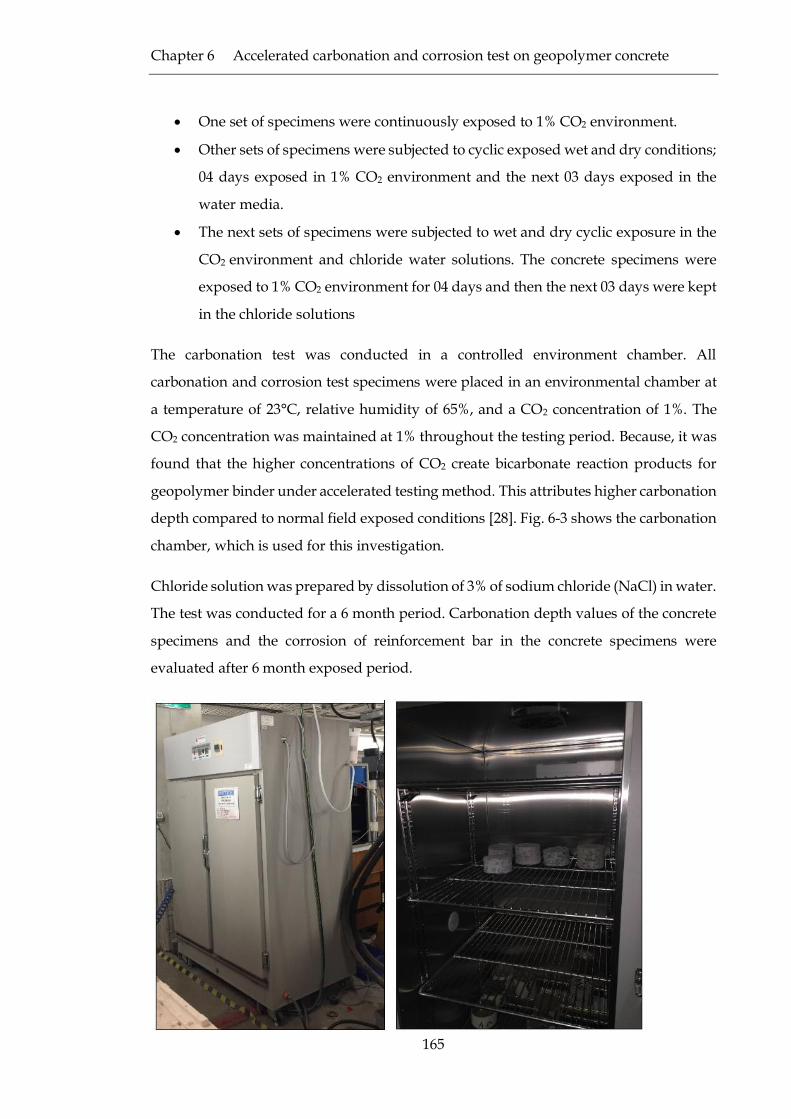
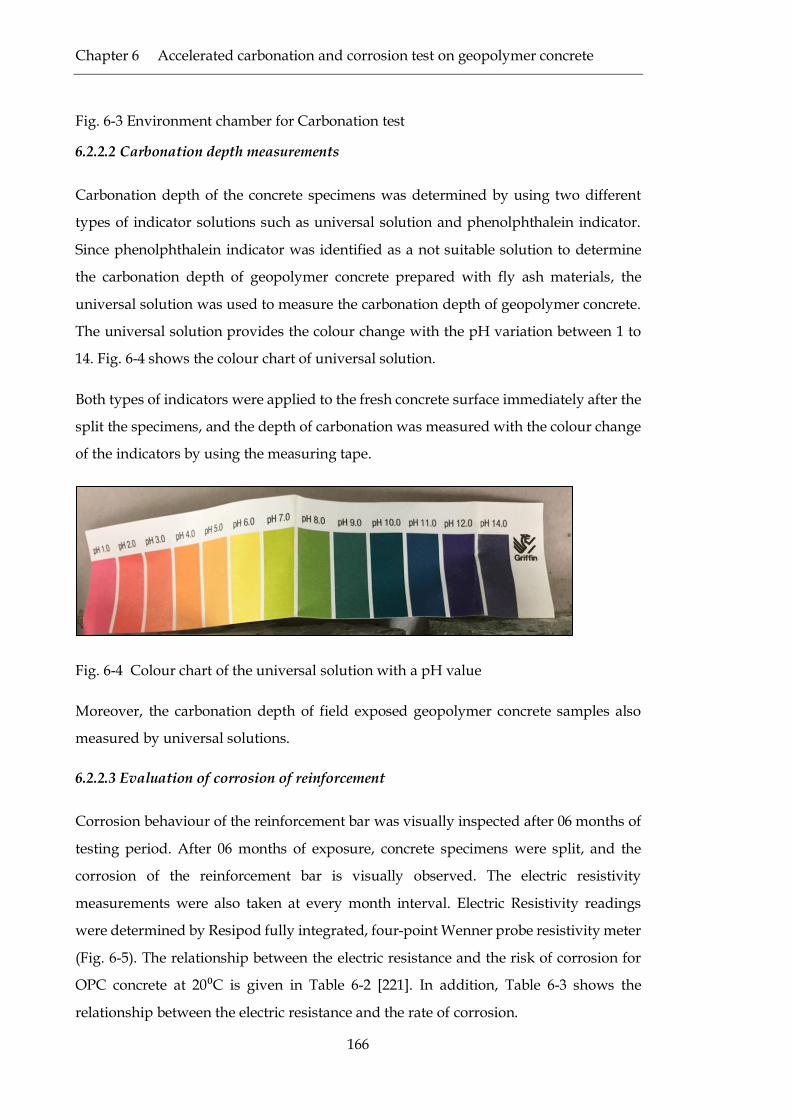
Fig. 6-3 Environment chamber for Carbonation test ..................................................................... 166
Fig. 6-4 Colour chart of the universal solution with a pH value.................................................. 166
Fig. 6-5 Resipod resistivity meter ................................................................................................... 167
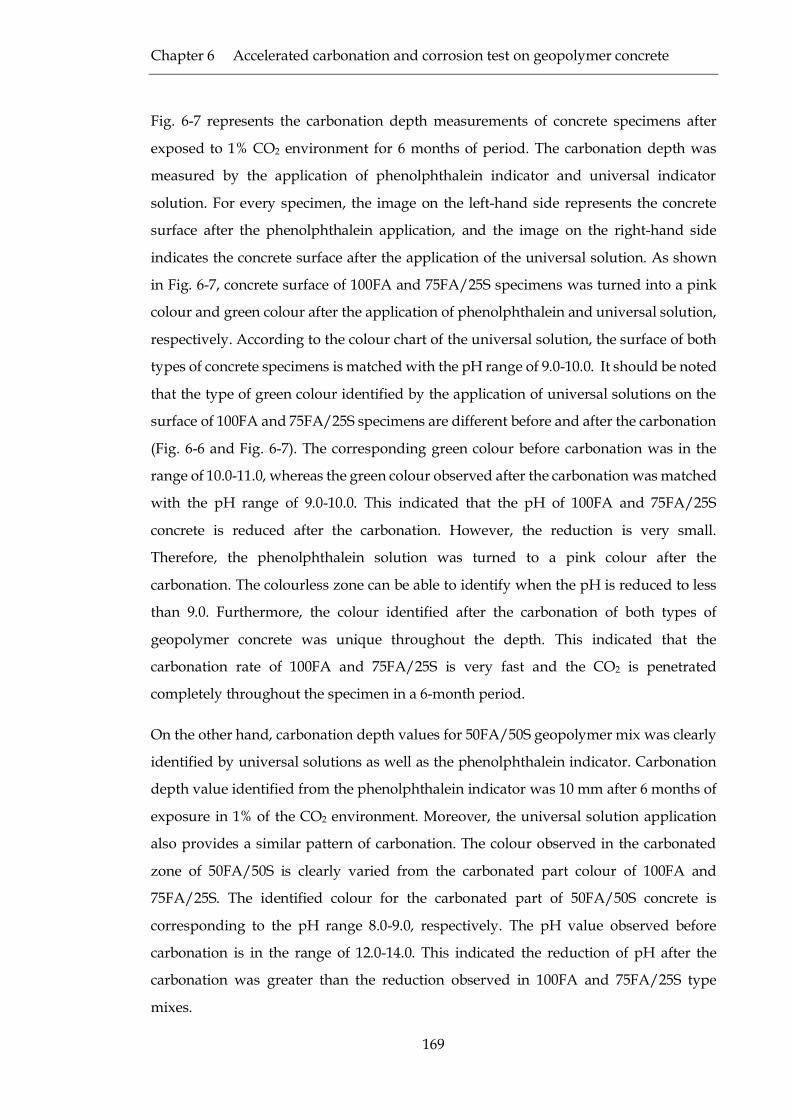
Fig. 6-6 Application of universal solution on the fresh geopolymer and OPC concrete surfaces
(before carbonation) ......................................................................................................................... 168
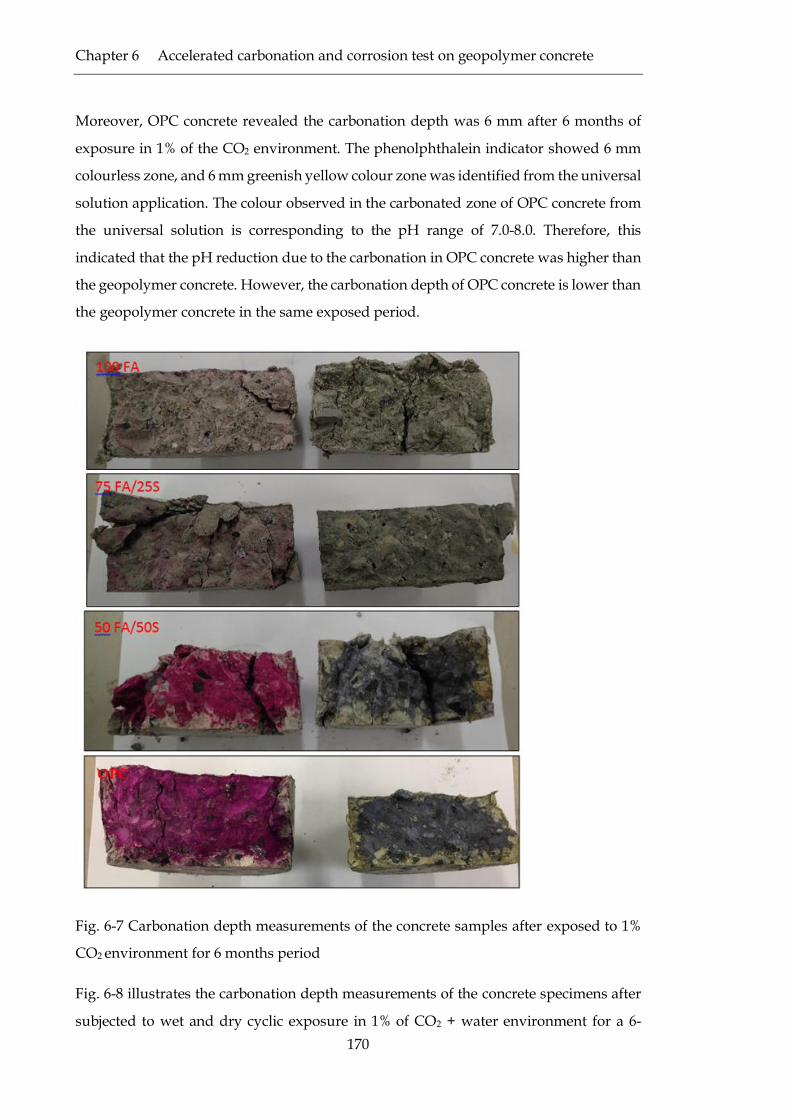
Fig. 6-7 Carbonation depth measurements of the concrete samples after exposed to 1% CO2
environment for 6 months period ................................................................................................... 170
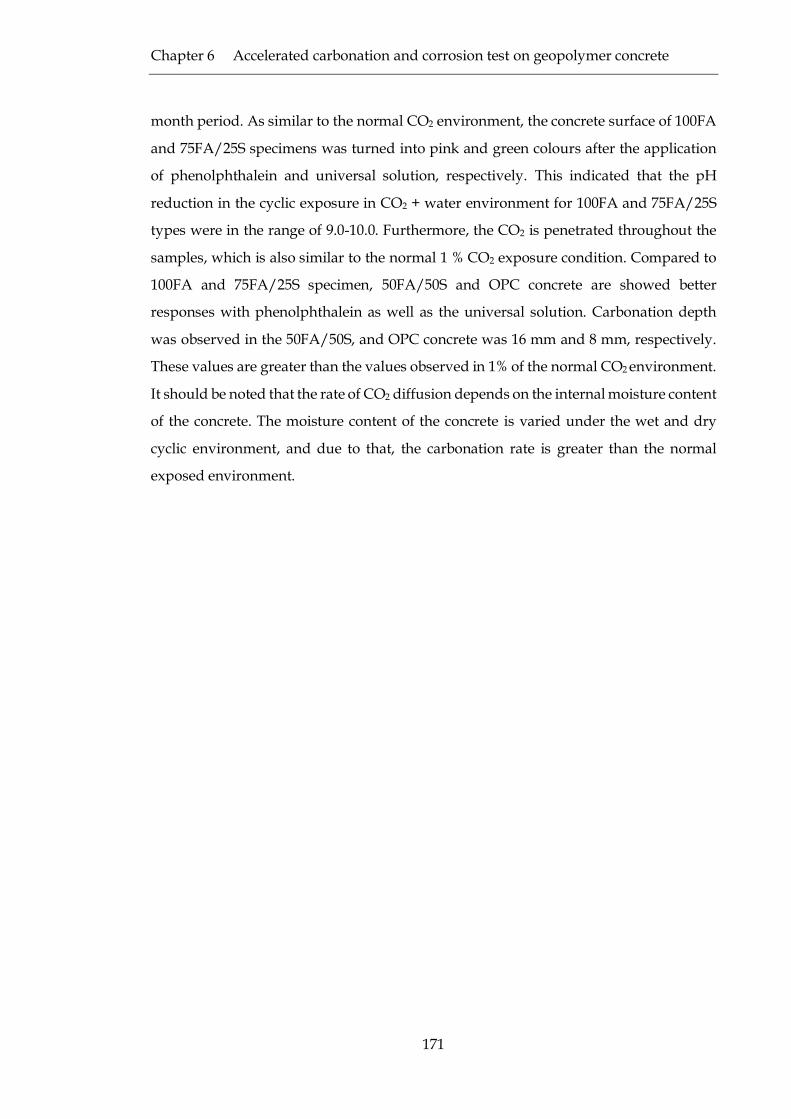
Fig. 6-8 Carbonation depth measurements of the concrete samples after subjected to wet and dry
cyclic exposure in 1% of CO2 + water environment for a 6-month period .................................. 172
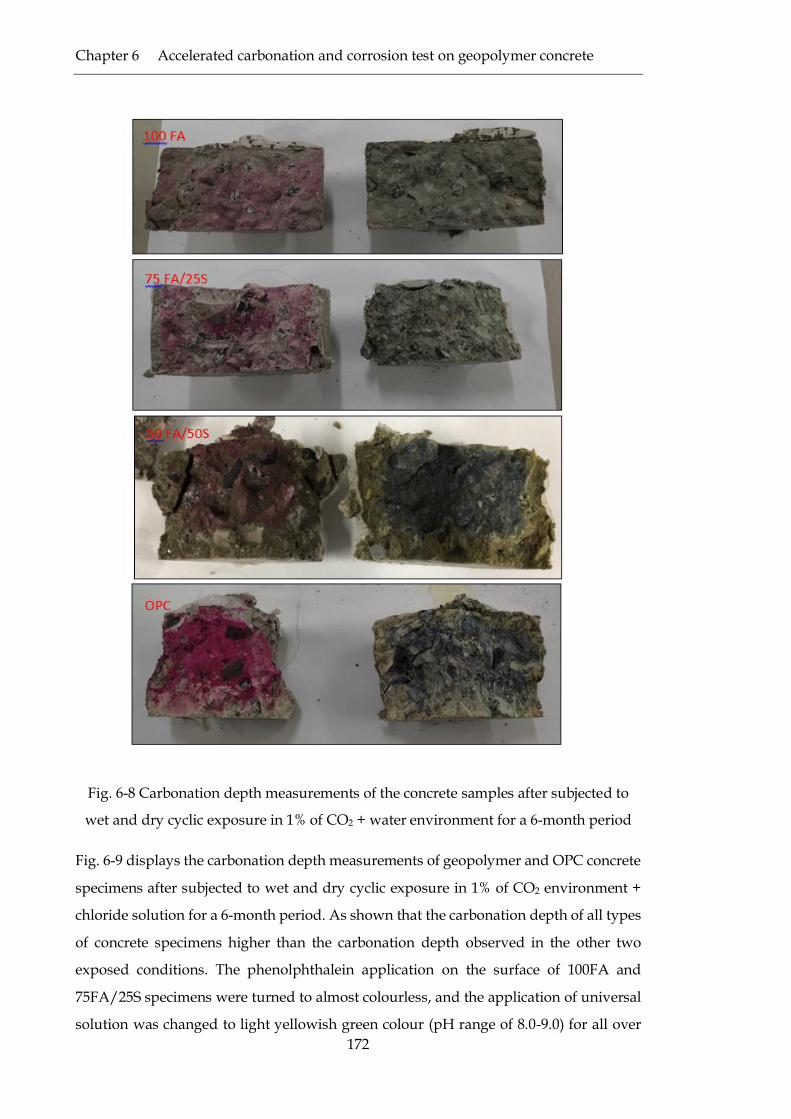
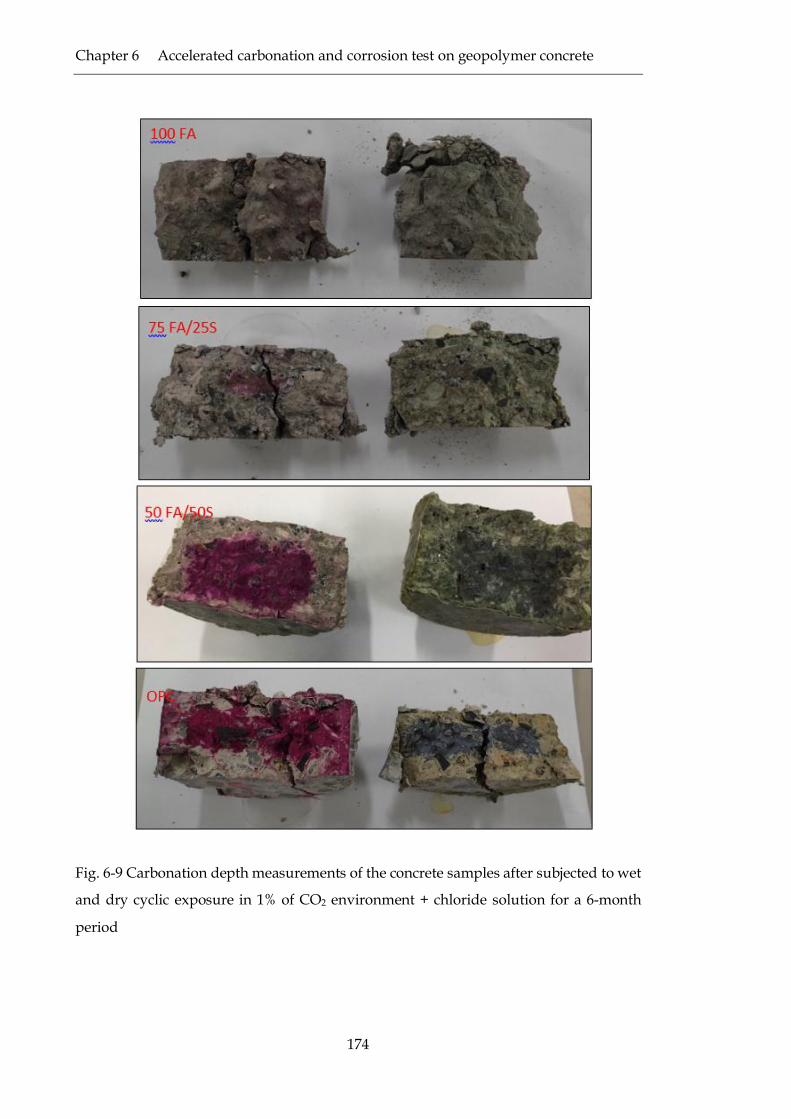
Fig. 6-9 Carbonation depth measurements of the concrete samples after subjected to wet and dry
cyclic exposure in 1% of CO2 environment + chloride solution for a 6-month period ................ 174
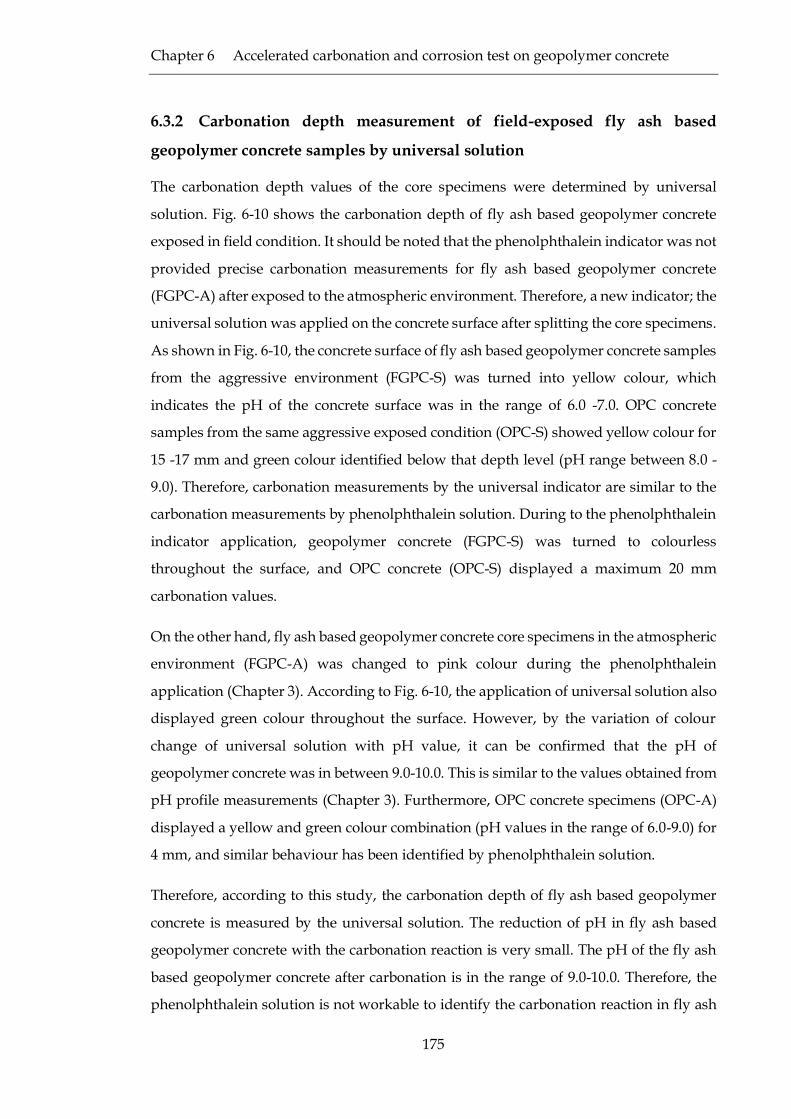
Fig. 6-10 carbonation measurements of core specimens from aggressive and atmospheric exposed
environment. .................................................................................................................................... 176
Page 22
xxii
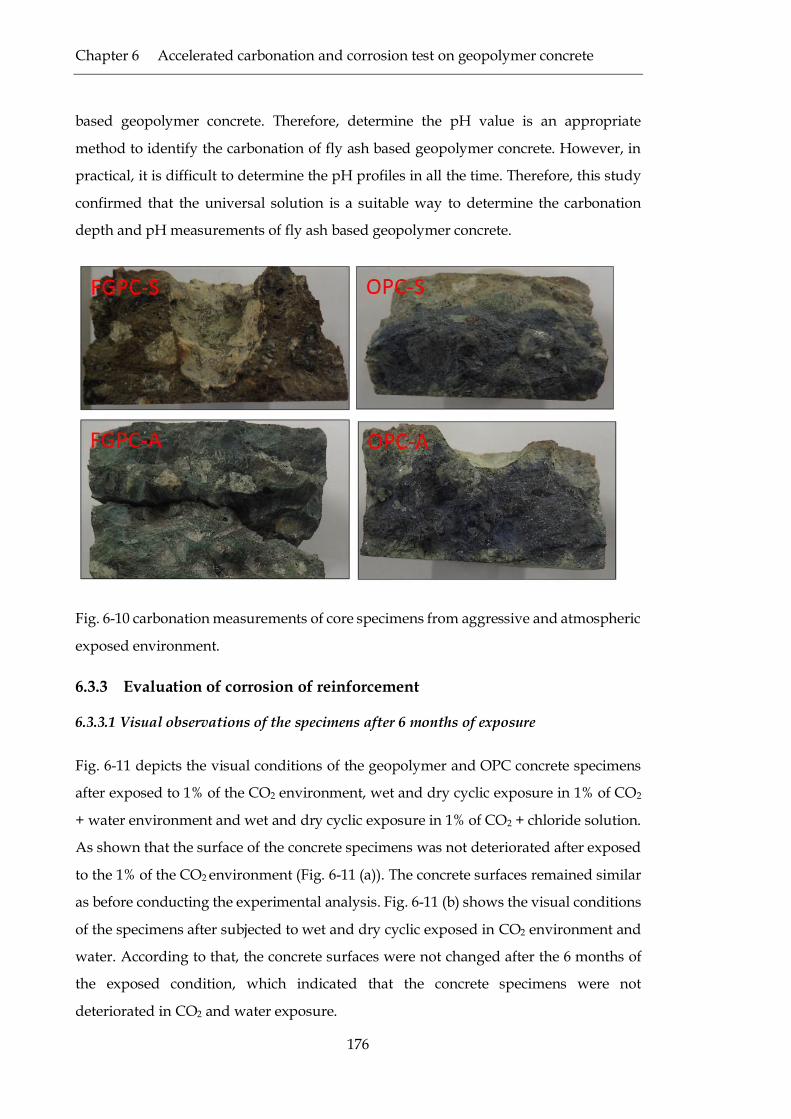
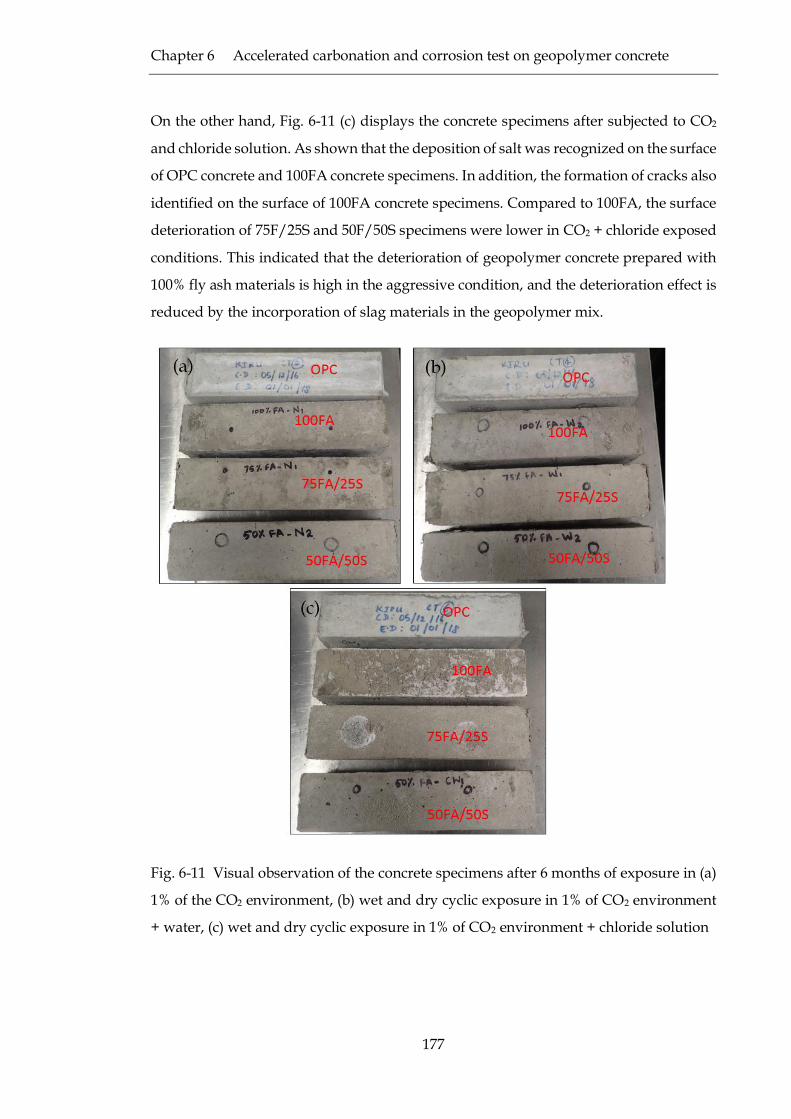
Fig. 6-11 Visual observation of the concrete specimens after 6 months of exposure in (a) 1% of the
CO2 environment, (b) wet and dry cyclic exposure in 1% of CO2 environment + water, (c) wet and
dry cyclic exposure in 1% of CO2 environment + chloride solution ............................................ 177
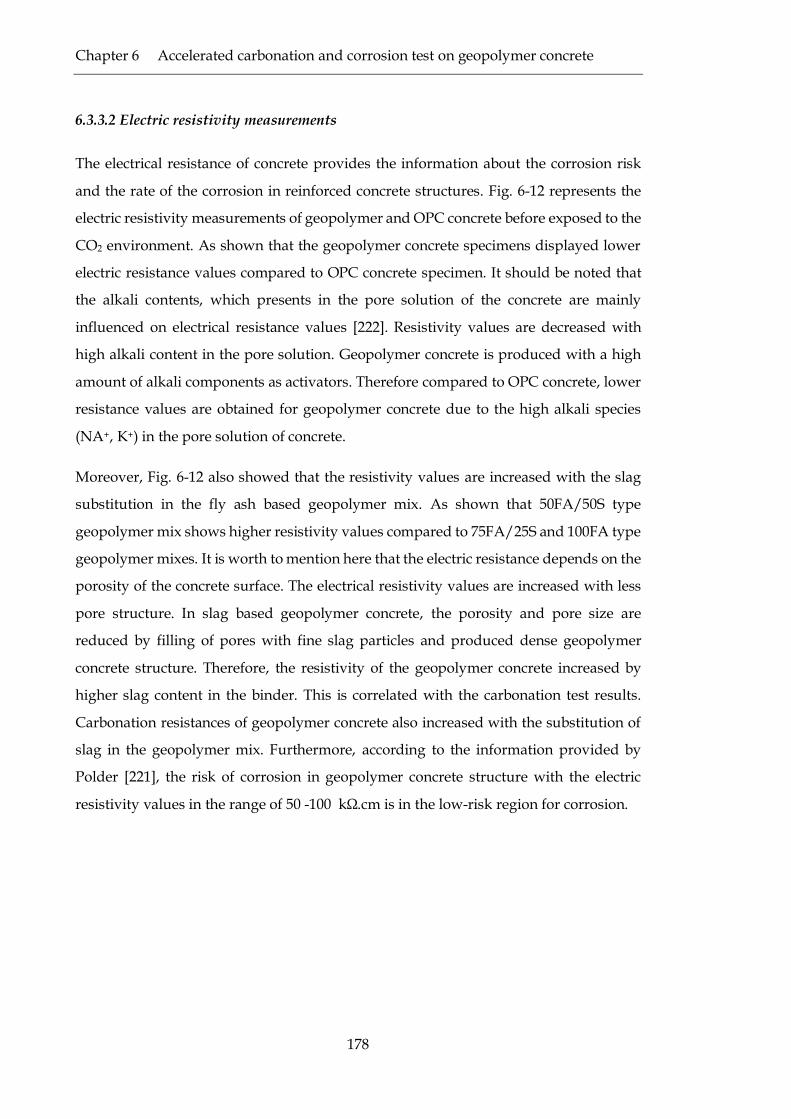
Fig. 6-12 Electric resistivity measurements before exposed to the CO2 environment................. 179
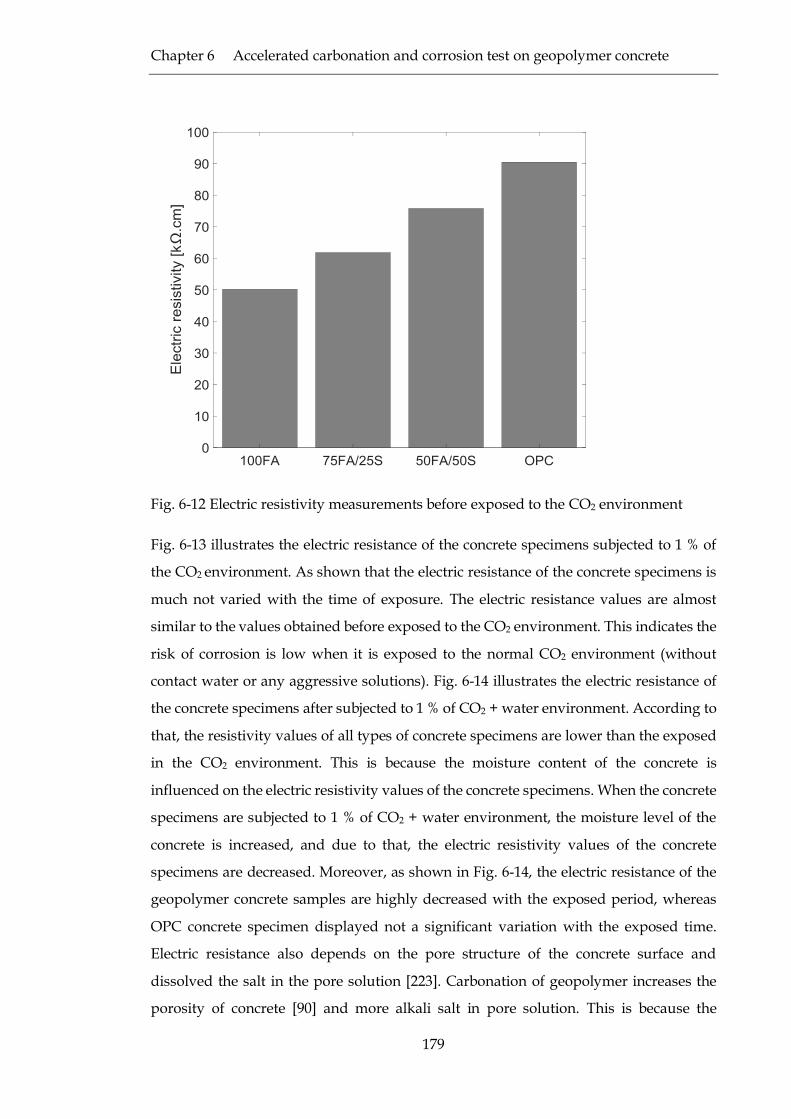
Fig. 6-13 Electric resistivity measurements of concrete specimens subjected to the CO2
environment..................................................................................................................................... 181
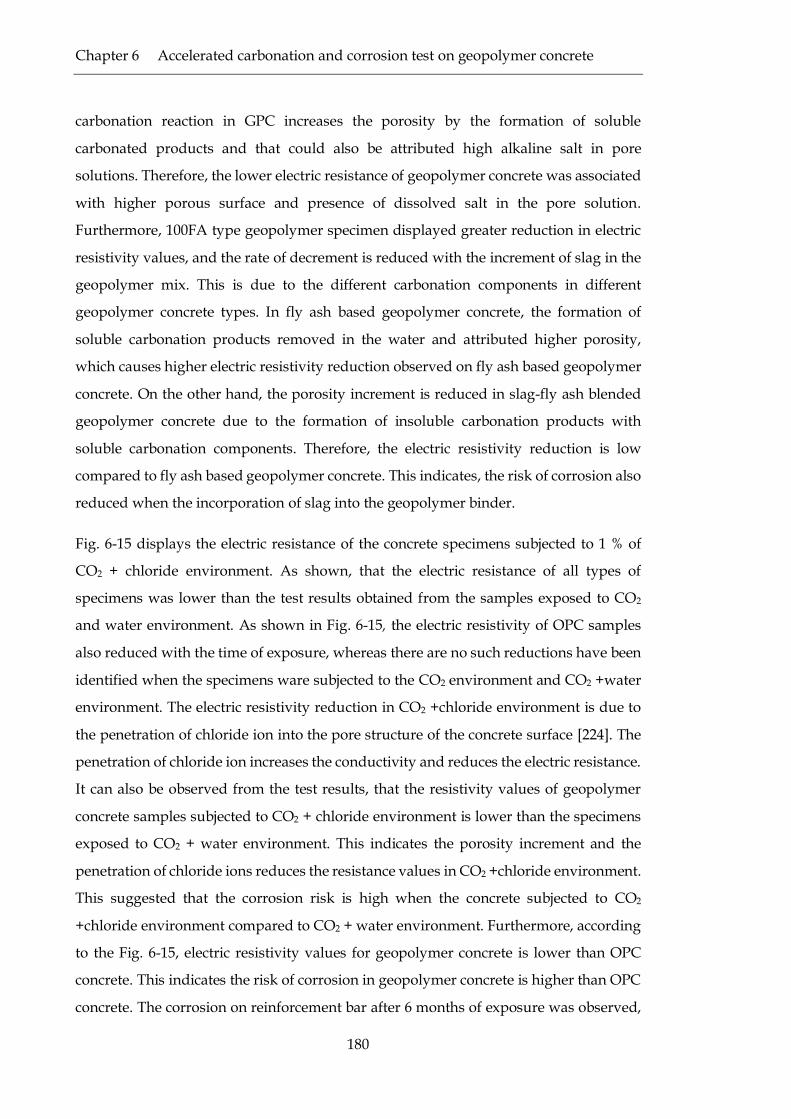
Fig. 6-14 Electric resistivity measurements of concrete specimens subjected to CO2 + water
environment..................................................................................................................................... 181
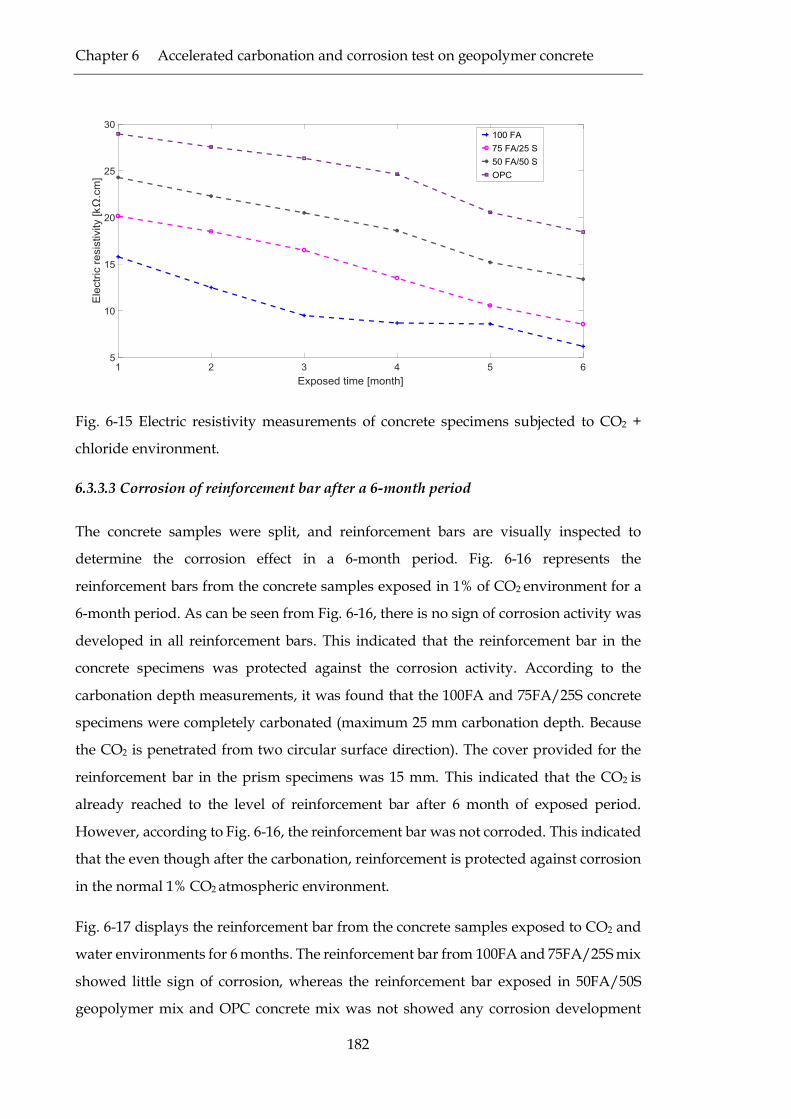
Fig. 6-15 Electric resistivity measurements of concrete specimens subjected to CO2 + chloride
environment..................................................................................................................................... 182
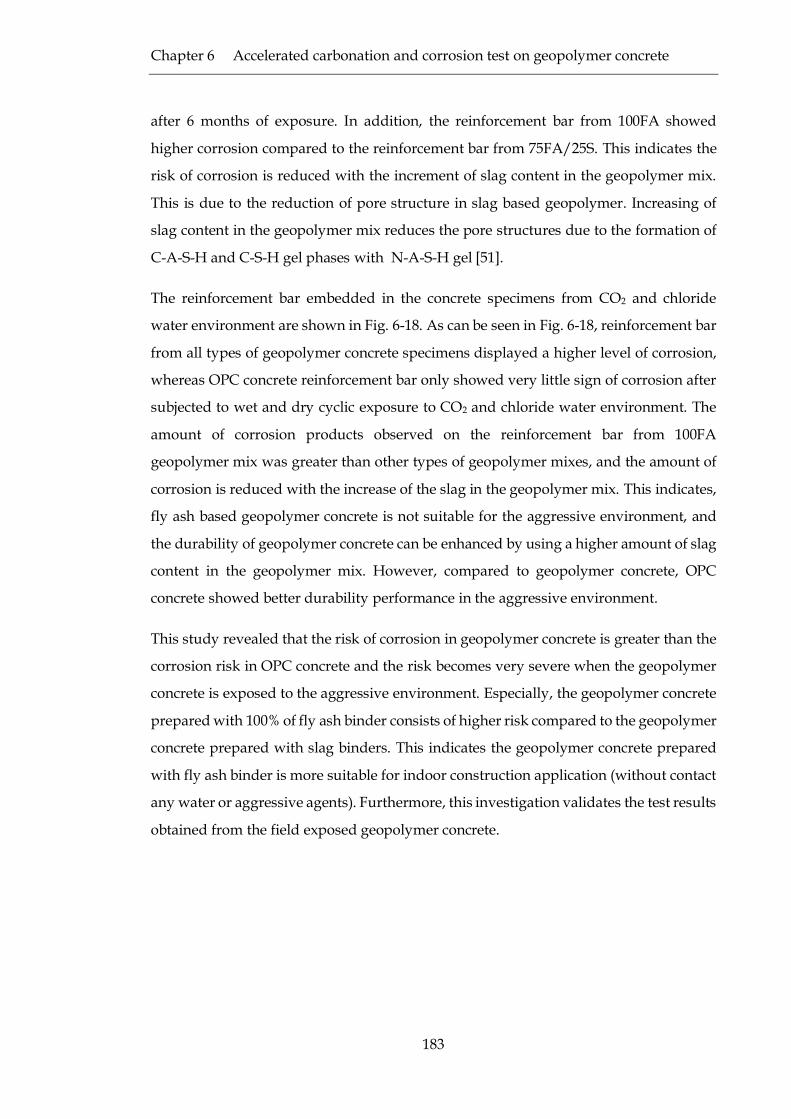
Fig. 6-16 Reinforcement bar from the concrete exposed in 1% of CO2 environment for 6 months
.......................................................................................................................................................... 184
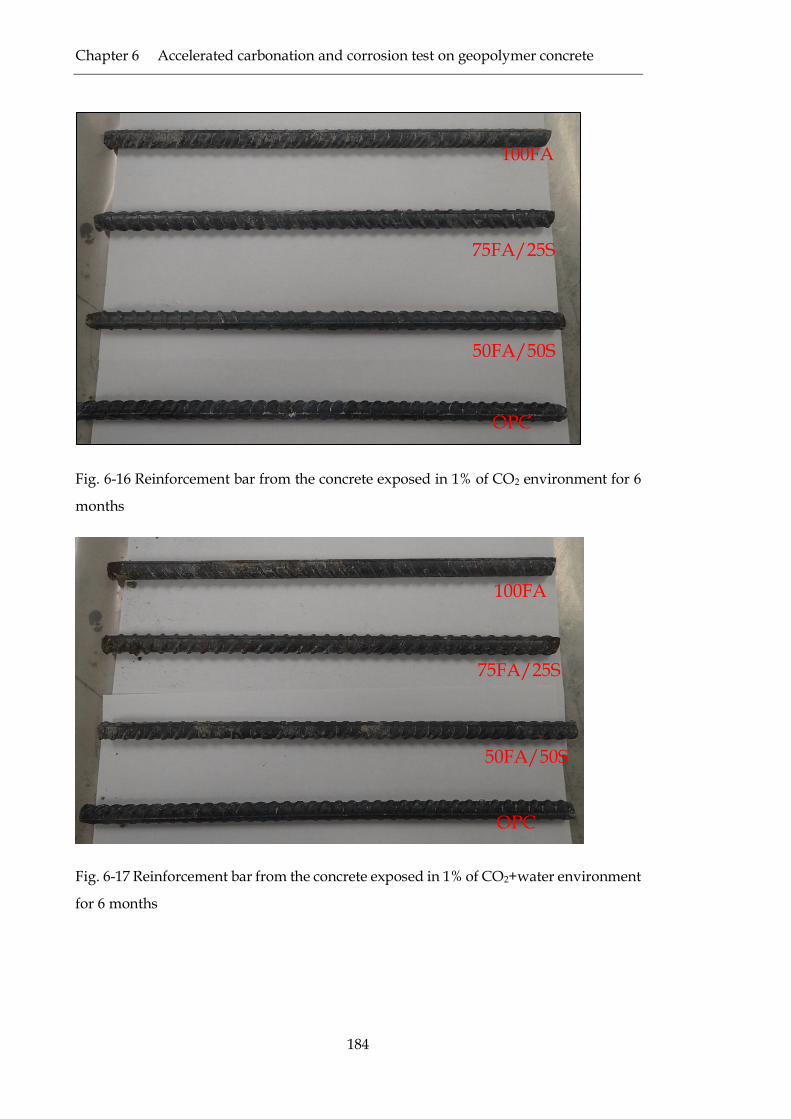
Fig. 6-17 Reinforcement bar from the concrete exposed in 1% of CO2+water environment for 6
months ............................................................................................................................................. 184
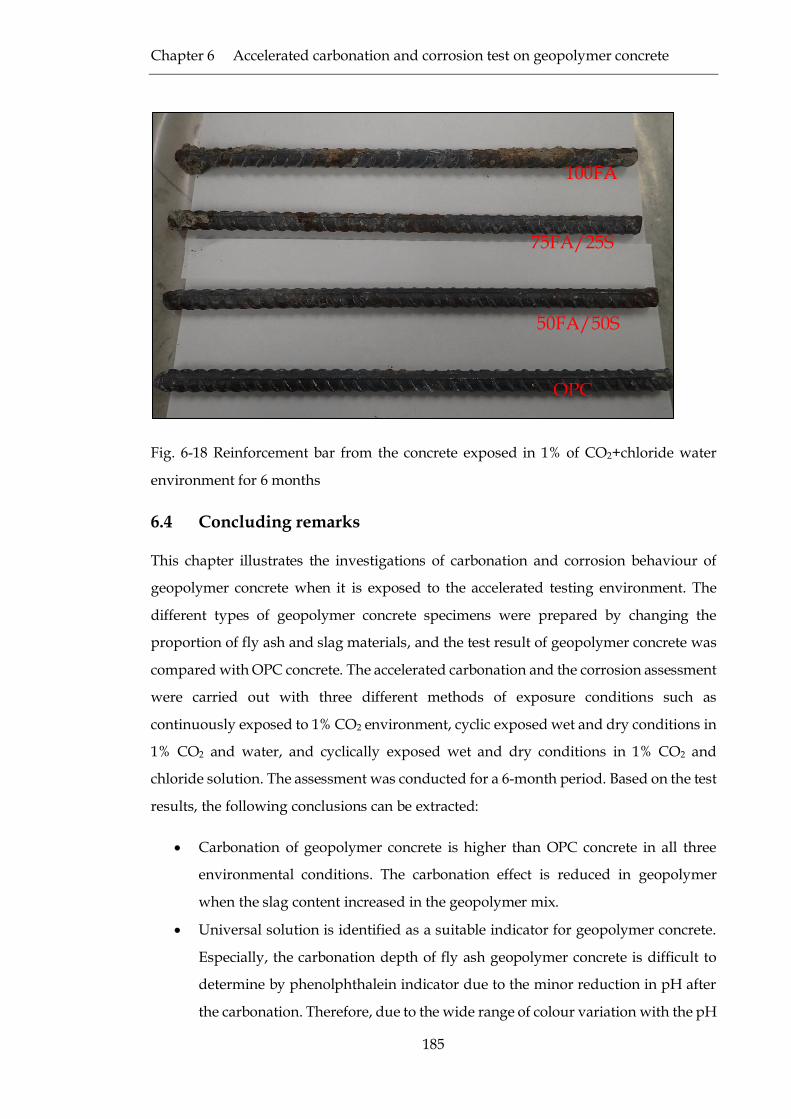
Fig. 6-18 Reinforcement bar from the concrete exposed in 1% of CO2+chloride water environment
for 6 months ..................................................................................................................................... 185
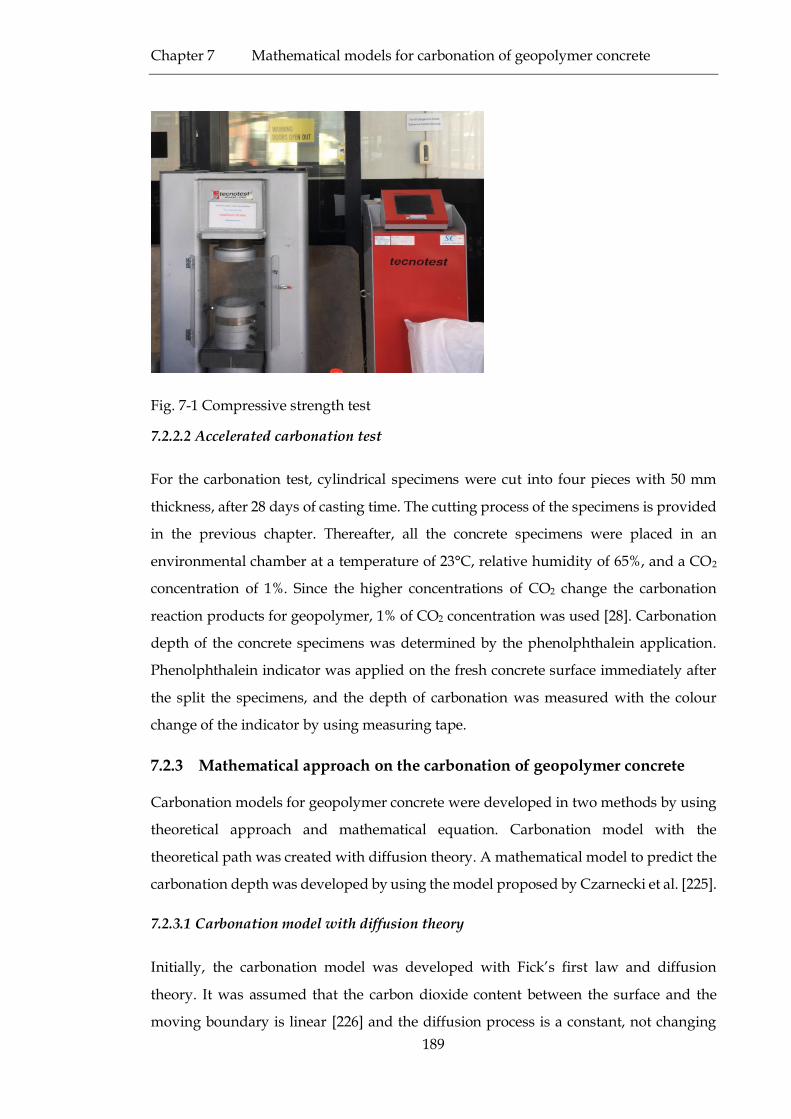
Fig. 7-1 Compressive strength test ................................................................................................. 189
Fig. 7-2 Compressive strength values of geopolymer and OPC concrete specimens. ................ 193
Fig. 7-3 Carbonation depth measurements in 1% CO2 environment ........................................... 194
Fig. 7-4 Carbonation models for S1 type concrete ......................................................................... 195
Fig. 7-5 Carbonation models for S2 type concrete ......................................................................... 195
Fig. 7-6 Carbonation models for S3 type concrete ......................................................................... 196
Fig. 7-7 Carbonation models for OT type concrete ....................................................................... 196
Page 23
Chapter 1 Introduction
1.1 Background
Concrete is the most widely used construction material worldwide with the annual
production exceeding 1 m3 per capita [1]. Moreover, in recent years, the production of
concrete increased sharply due to increasing population growth and the rapid
developments of buildings and infrastructures. The large demand on concrete must be
catered by using the traditional cementitious materials (i.e. clinkers) which are produced
from calcination process operated at 1400° C. The production of clinker for cementitious
materials not only consume a large amount of energy, they also have detrimental effects
to the environment [2]. For instance, the production of 1 tonne of ordinary Portland
cement (OPC) releases approximately 1 tonne of CO2 to the environment, which
increases the greenhouse gas concentration in the atmosphere, causing the global
warming effects and climate change. Furthermore, Schneider et al. [3] forecasted that the
cement production would increase from approximately 2.54 billion tonnes in 2006 to 4.38
billion tonnes in 2050 based on the projected growth rate of 5%. However, most recent
observations revealed that the projected cement demand for 2015 has already been
reached by 2011 [4]. This indicates that the actual demand of cement production in 2050
would be much higher than the projected demand. Moreover, the Portland cement has
high-embodied energy, and the cement manufacture is accountable for approximately
5% to 8% of CO2 emissions worldwide [5-7].
It is therefore understood that alternative cementitious materials with low embodied
energy and less emission of harmful greenhouse gases to the environment are necessary
to ensure sustainable construction practices. In this regard, geopolymer binder has been
identified as a viable alternative cementitious material, owing to its inherent merits of
low embodied energy and less carbon emission to the environment [8, 9]. Geopolymer
binder is formulated by activation of industrial by-products containing supplementary
cementitious materials (i.e. clinker free minerals) with alkaline activators. Therefore,
these binders have lower CO2 emissions as they neither require elevated temperature
Page 24
Chapter 1 Introduction
2
processes nor the formation of clinker products [10]. The previous research has shown
that 1 tonne of geopolymer concrete production releases approximately 0.184 tonnes of
CO2 [11]. The primary factor of CO2 emission in geopolymer concrete (GPC) is caused
by the production of alkalis, such as Na2O and K2O. Therefore, production of alkali-
activated binders is corresponding to 80% of CO2 emission reduction from the Portland
cement production [12, 13].
The replacement of geopolymer binder to Portland cement materials not only helps to
reduce the CO2 emission to the environment but also increases the utilisation of waste
materials. As a result, the landfill wastes can be drastically reduced with the prevention
of groundwater contamination by leaching heavy metals. With the consideration of all
these benefits, geopolymer binder has become a popular cementitious material in recent
years. In addition, GPC has been identified to have superior early age properties and
mechanical strength compared to OPC concrete.
Geopolymer binder varies substantially from Portland cement binder in terms of its
reaction mechanism to attain structural integrity. In Portland cement concrete, strength
development is achieved by the formation of calcium-silicate-hydrate (C-S-H) gel,
whereas GPC exhibits polycondensation reaction of silica and alumina oxides presented
in the supplementary cementitious materials with alkaline activator solutions. Precursor
material for the preparation of geopolymer binder can either be a by-product from
industrial processes (i.e. fly ash, slag, red mud and rice husk ash) or geological sources
like metakaolin, that contains a rich source of alumina and silica oxides [14, 15]. The
process of geopolymerisation starts with the dissolution of silica and alumina oxides
from the precursor materials in an alkaline media. The properties of reacted components
depend on the characteristics of precursor materials as to whether they are made of
aluminosilicate rich materials or calcium-rich materials, type of alkali activator, amount
of activator, curing conditions and mixing procedures. For example, geopolymer
reaction of 100% alumina-silicate rich source materials yields three-dimensional N-A-S-
H gels as a resultant product. On the other hand, the activation of calcium-bearing
alumino-silicate materials such as slag material results in two-dimensional, layer
structured C-S-H or C-A-S-H gel formation along with the N-A-S-H gel three-
dimensional products [16, 17].
Page 25
Chapter 1 Introduction
3
1.2 Problem statement
Although the commercial implementation of geopolymer technology in the construction
industry has already begun, the widespread use of geopolymer binder in the
construction industry is very limited. There are many barriers preventing the application
of geopolymer materials in the construction industry. The major limitations include a
wide variety of precursor materials to choose from, limited studies on the short and long-
term properties of produced GPC and the limited availability of standard guidelines of
practice. Amongst, lack of long-term durability investigation on geopolymer concrete is
a major hindrance to the implementation in construction practice. While the main focus
of early stage geopolymer research was on the mechanical performance of GPC, more
recent research studies investigating the durability performance revealed a detrimental
effect on long-term durability of geopolymer concrete when exposed to the natural
environment [18, 19]. Furthermore, the early stage studies conducted on durability
performance were utilized laboratory scale experiments in a controlled environment (i.e.
accelerated durability testing methods), which cannot be directly interpreted to the
durability performance of real scale GPC structures exposed to the natural environment.
The durability of concrete structures is prime importance in buildings and
infrastructures considering their lifespan of 50 and 100 years, respectively. Thus, there
is an immediate requirement to investigate the long-term durability of real scale GPC
structures exposed to the natural environment in order to adopt the geopolymer
concrete in construction industry [20]. According to the reported literature, accelerated
testing methods conducted in the laboratory conditions revealed superior durability
behaviour for geopolymer concretes, whereas inferior durability characteristic was
obtained in some research studies conducted on natural exposure conditions [21-26].
Another major limitation preventing the application of GPC in the construction industry
is the lack of long-term durability assessment of GPC structures under natural exposure
conditions. The industrial survey conducted on GPC application methods in Australia,
identified that the lack of long-term durability of geopolymer concrete as one of the
significant issues for the usage of GPC in construction industry [27]. The short-term
laboratory testing methods are not suitable to predict the long-term durability behaviour
in the real environment. Therefore, as a new construction material, GPC must be
thoroughly assessed for its long-term durability performance before implementing into
construction practices. In addition, most of the standard laboratory testing methods that
Page 26
Chapter 1 Introduction
4
assess the durability properties use the small size samples exposed to extreme
conditions. In particular, high CO2, and acid or salt concentrations are used for
laboratory-accelerated tests and these tests are carried out for very short periods.
Therefore, the results obtained from those accelerated testing methods would not predict
the actual durability behaviour of GPC.
Furthermore, it is well known that the mechanical and durability properties of the GPC
depend on the types of precursor materials. The durability behaviour of fly ash based
GPC differs from the slag-based GPC. This is due to the distinct types and proportions
of chemical components found in slag and fly ash materials. In addition, the material
properties and chemical compositions of fly ash- slag blended GPC would be different
from the GPC prepared with fly ash or slag materials solely. This leads to dissimilar
durability characteristic of fly ash-slag blended GPC compared to fly ash based
geopolymer or slag based GPC. Therefore, it is necessary to investigate the long-term
durability of the GPC with different precursor materials.
1.3 Aim and objectives
The aim of this research study is to understand the long-term durability of GPC
structures exposed to different field environmental conditions and to validate with the
experimental analysis conducted on laboratory prepared concrete specimens. The
specific objectives are:
1. To assess the durability of atmospheric exposed fly ash based and fly ash-slag
blended GPC structures in relation to the carbonation processes.
2. To investigate the durability of fly ash based GPC when subjected to a
combination of carbonation, chloride attack and sulphate attack, and compare
with the OPC concrete under same aggressive exposed conditions.
3. To assess the durability of slag-fly ash blended GPC in the marine environment
and compare with the OPC concrete under same aggressive exposed conditions.
4. To determine the leaching behaviour and the strength degradation of the
geopolymer concrete exposed to wet-dry cycle analysis and to study the effect of
source materials presence in GPC.
5. To examine the corrosion behaviour of reinforcement bars in geopolymer
concrete and to determine the suitable geopolymer mix to resist the corrosion
Page 27
Chapter 1 Introduction
5
when it is subjected to accelerated carbonation condition with 1% of CO2
environment (near-natural exposed condition).
6. To develop a suitable carbonation model to predict the carbonation behaviour of
geopolymer concrete.
1.4 Significance of the research
While the mechanical performance of GPC has been the focus in previous research, there
has been little consideration given to the long-term durability performance of GPC,
which is affected by the type of precursor materials and exposure conditions. The
detailed durability investigation of the GPC was conducted under different exposure
condition, and the comparison of the durability behaviour has been made with OPC
concrete exposed to same environment. Therefore, this study will assist in identifying
the long-term durability issues in different geopolymer concrete compositions. This
research study will also be beneficial to develop the confidence about the geopolymer
concrete and enhance the adoption of the GPC in construction industry.
1.5 Thesis outline
The thesis is organized into seven chapters. The current chapter provides the
background to the research study, research problems, aim and objectives of this research
and the outline of this thesis. Chapter 2 presents a comprehensive literature review
related to this research study. The literature review on geopolymerisation mechanism
and source materials, mechanical and permeation properties of hardened GPC are
included in this chapter. Chapter 2 also provides the literature review related to
durability of geopolymer concrete in terms of carbonation, chloride penetration,
sulphate attack and corrosion of reinforcement, which has been determined from
accelerated laboratory testing methods.
Chapter 3 reports the durability performance of GPC structures exposed to the
atmospheric environment. Carbonation resistance of GPC after 8 years period in
atmospheric exposed condition was evaluated on core specimens extracted from
different types of GPC structures prepared with different mix proportion of precursor
materials such as fly ash and fly ash-slag blended binders. The description of GPC
structures, experimental methods and the results obtained from the experimental
analysis on the concrete core specimens are included in this chapter. The carbonation is
Page 28
Chapter 1 Introduction
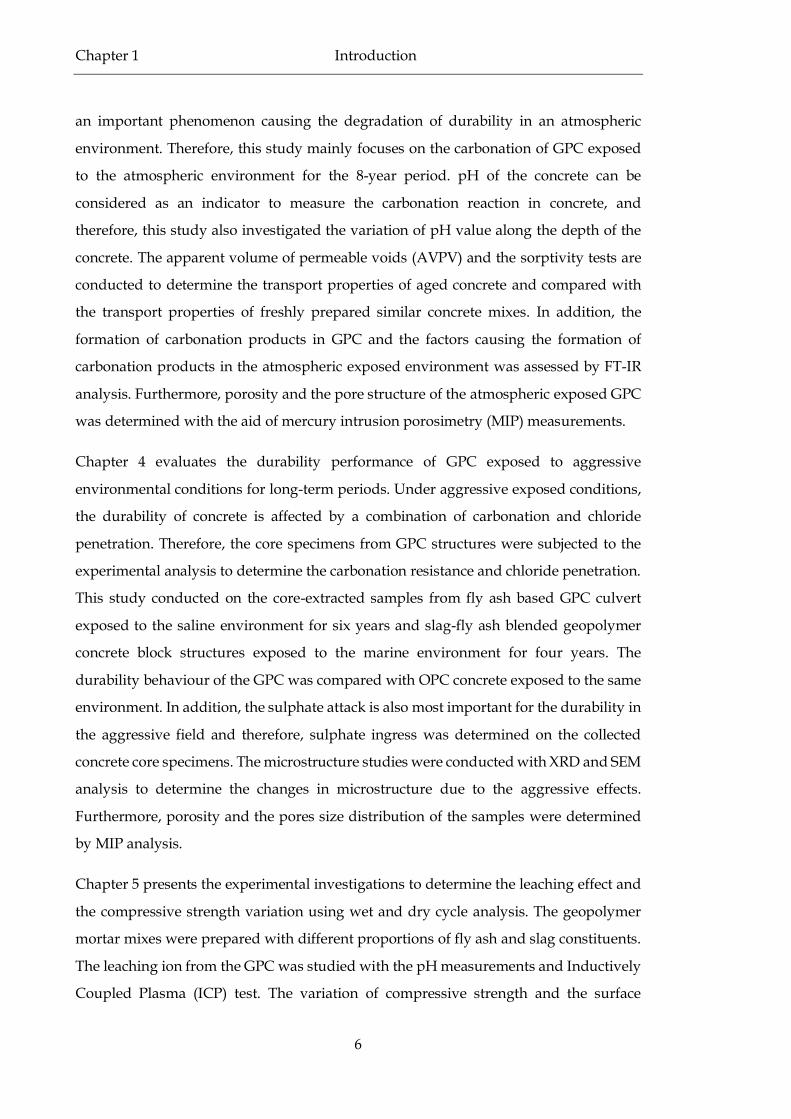
6
an important phenomenon causing the degradation of durability in an atmospheric
environment. Therefore, this study mainly focuses on the carbonation of GPC exposed
to the atmospheric environment for the 8-year period. pH of the concrete can be
considered as an indicator to measure the carbonation reaction in concrete, and
therefore, this study also investigated the variation of pH value along the depth of the
concrete. The apparent volume of permeable voids (AVPV) and the sorptivity tests are
conducted to determine the transport properties of aged concrete and compared with
the transport properties of freshly prepared similar concrete mixes. In addition, the
formation of carbonation products in GPC and the factors causing the formation of
carbonation products in the atmospheric exposed environment was assessed by FT-IR
analysis. Furthermore, porosity and the pore structure of the atmospheric exposed GPC
was determined with the aid of mercury intrusion porosimetry (MIP) measurements.
Chapter 4 evaluates the durability performance of GPC exposed to aggressive
environmental conditions for long-term periods. Under aggressive exposed conditions,
the durability of concrete is affected by a combination of carbonation and chloride
penetration. Therefore, the core specimens from GPC structures were subjected to the
experimental analysis to determine the carbonation resistance and chloride penetration.
This study conducted on the core-extracted samples from fly ash based GPC culvert
exposed to the saline environment for six years and slag-fly ash blended geopolymer
concrete block structures exposed to the marine environment for four years. The
durability behaviour of the GPC was compared with OPC concrete exposed to the same
environment. In addition, the sulphate attack is also most important for the durability in
the aggressive field and therefore, sulphate ingress was determined on the collected
concrete core specimens. The microstructure studies were conducted with XRD and SEM
analysis to determine the changes in microstructure due to the aggressive effects.
Furthermore, porosity and the pores size distribution of the samples were determined
by MIP analysis.
Chapter 5 presents the experimental investigations to determine the leaching effect and
the compressive strength variation using wet and dry cycle analysis. The geopolymer
mortar mixes were prepared with different proportions of fly ash and slag constituents.
The leaching ion from the GPC was studied with the pH measurements and Inductively
Coupled Plasma (ICP) test. The variation of compressive strength and the surface
Page 29
Chapter 1 Introduction
7
deterioration were evaluated for concrete specimens immersed in 3% NaCl solutions
and the combination of 1.5% NaCl +1.5% MgSO4 solutions.
Chapter 6 of the thesis explains the effect of source materials on the corrosion behaviour
of geopolymer concrete. To conduct this analysis, GPC specimens were prepared with
different proportions of fly ash and slag constituents. Corrosion of reinforcement in
geopolymer concrete was investigated after six months in three different exposure
conditions such as 1% of CO2 controlled carbonation chamber, exposed to water and 1
% of CO2 environment, and exposed to chloride solution and 1 % of CO2 environment.
Since the higher concentrations of CO2 changes the carbonation reaction products in
geopolymer, 1% of CO2 concentration was used [28] to predict the natural carbonation
behaviour. Moreover, carbonation of GPC was determined using a new type of indicator
known as universal solution.
Mathematical approaches to determine the carbonation diffusion coefficient of GPC are
presented in chapter 7. The mathematical models were developed using the diffusion
equation based on the Fick’s law and the empirical equations to predict the CO2 diffusion
of geopolymer concrete. The test results from the carbonation test with 1% of CO2 was
used to determine the mathematical models.
Finally, Chapter 8 presents the conclusions of this research work and the
recommendations for future work.
Page 30
Chapter 2 Literature review
8
Chapter 2 Literature review
2.1 Introduction
This chapter presents the background and overview of geopolymerisation mechanism,
binder materials and the development of geopolymerisation products. A brief
introduction about the mechanical and permeation properties of geopolymer concrete is
also presented in this study. Since the durability aspects are an important key parameter
for the concrete structure, this chapter also describes the past studies related to the
durability of the geopolymer concrete such as efflorescence, carbonation, chloride attack
and sulphate attack. The corrosion of reinforcement in geopolymer concrete also
discussed in this chapter. The final section of this chapter explains a summary of the
research requirement and research objectives of the thesis.
2.2 Overview of geopolymer
Geopolymer binder has been identified as a viable replacement for OPC binder
concerning green technology [8, 9]. The production of OPC binder is corresponding to
the significant amount of CO2 emission in globally. One tonne of concrete production
releases about one tonne of CO2 to the environment, whereas geopolymer binder is
produced with sustainable cementitious material and the CO2 emission from one tonne
of geopolymer concrete production is only 0.184 tonnes of CO2 to the environment.
Therefore, the use of geopolymer materials in concrete production is an effective way to
reduce the environment impact due to the CO2 emission. Geopolymer binders are
produced by the activation of aluminosilicate rich source of materials with the alkaline
activators. The most commonly used industrial materials in geopolymer concrete
preparation are fly ash, ground ash, slag, meta-kaolin and so on. The popular alkaline
solutions used as activators in worldwide are sodium hydroxide (NaOH), sodium
silicate (Na2SiO3) and potassium hydroxide (KOH). In addition, the solid type activator
such as sodium-meta silicate powder [24] and sodium metasilicate pentahydrate powder
[29] also used in the geopolymer binder preparation. The growth of research activities
Page 31
Chapter 2 Literature review
9
on geopolymer have been developed very quickly due to low CO2 emission by
geopolymer concrete production compared to OPC and blended cement concrete.
2.3 Geopolymerisation mechanism and sources of geopolymer
binder
2.3.1 Geopolymerisation mechanism
The Geopolymer binders are created as a result of a chain of chemical reactions of
alumina-silicate oxides with alkali polisilicates. These reactions initially produce Si-O-
Al-O bonds which lead to formation aluminium and silicate monomers. The monomers
are then changed into oligomers and subsequently changed into silicate polymers.
Three-dimensional silico-aluminate geopolymer structures can be expressed as one of
the following three formula [14].
1. Poly(sialate) type (-SiO-Al-O-)
2. Poly(sialate-siloxo) type (-Si-O-Al-O-Si-O-)
3. Poly(sialate-disiloxo) type (-Si-O-Al-O-Si-O-Si-O-)
It should be noted here that the word Sialate is an abbreviation of silicon-oxo-aluminate.
Davidovits [11] also proposed that the geopolymerisation is an inorganic
polycondensation reaction. The end products of such geopolymer reaction produce a
three-dimensional tecto-aluminosilicate network product [11], and the general empirical
formula that geopolymer reaction can be explained as below:
Mn[-(SiO2)z-AlO2]n .wH2O [11] (1)
Where, M is alkali cation such as K, Na or Ca and n is a degree of polycondensation and
z is 1, 2, 3 or higher values.
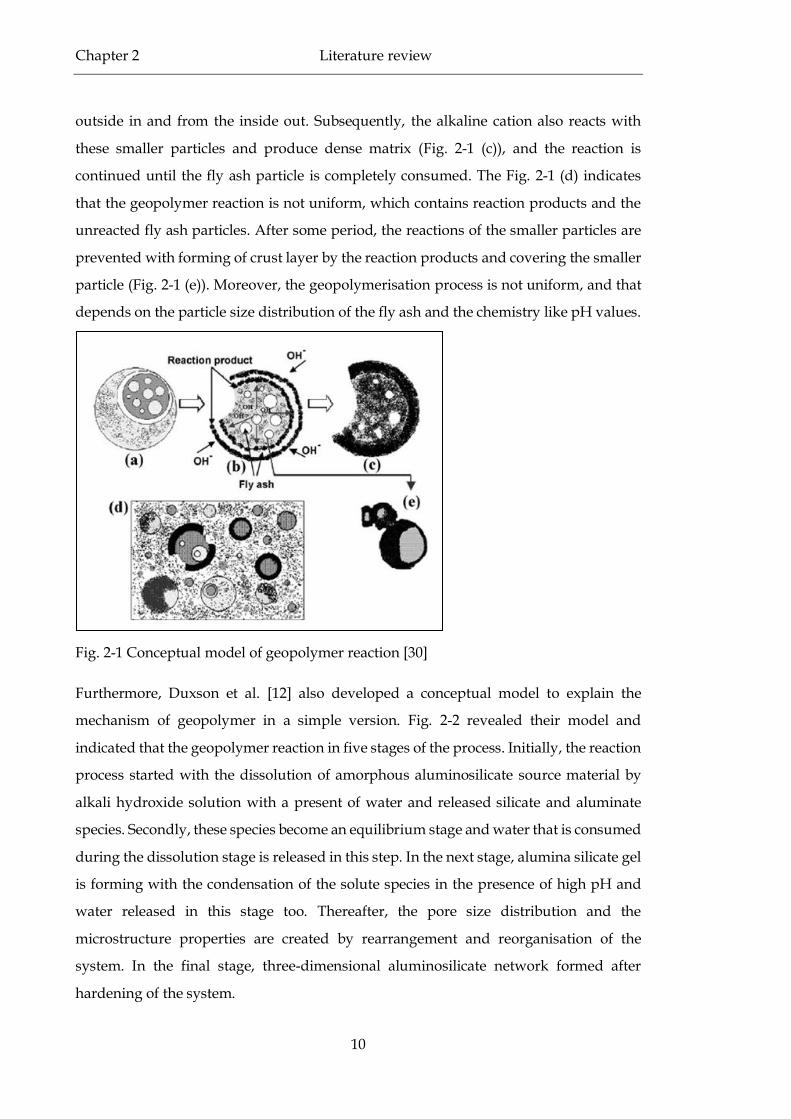
In addition, Fernández-Jiménez et al. [30] proposed a conceptual model to describe the
geopolymer reaction, provided in Fig. 2-1. As explained in Fig. 2-1 (a) and (b),
geopolymerization reaction begun with the dissolution of the fly ash particles by
hydroxide ions. First, the reaction started at a point of the surface and then the reaction
is continued until the consumption of all fly ash particles into the reaction process. In
addition to that, during the initial stage of the reaction, smaller particles are filled the
large holes of the fly ash particle and yields bi-directional alkaline attack: i.e., from the
Page 32
Chapter 2 Literature review
10
outside in and from the inside out. Subsequently, the alkaline cation also reacts with
these smaller particles and produce dense matrix (Fig. 2-1 (c)), and the reaction is
continued until the fly ash particle is completely consumed. The Fig. 2-1 (d) indicates
that the geopolymer reaction is not uniform, which contains reaction products and the
unreacted fly ash particles. After some period, the reactions of the smaller particles are
prevented with forming of crust layer by the reaction products and covering the smaller
particle (Fig. 2-1 (e)). Moreover, the geopolymerisation process is not uniform, and that
depends on the particle size distribution of the fly ash and the chemistry like pH values.
Fig. 2-1 Conceptual model of geopolymer reaction [30]
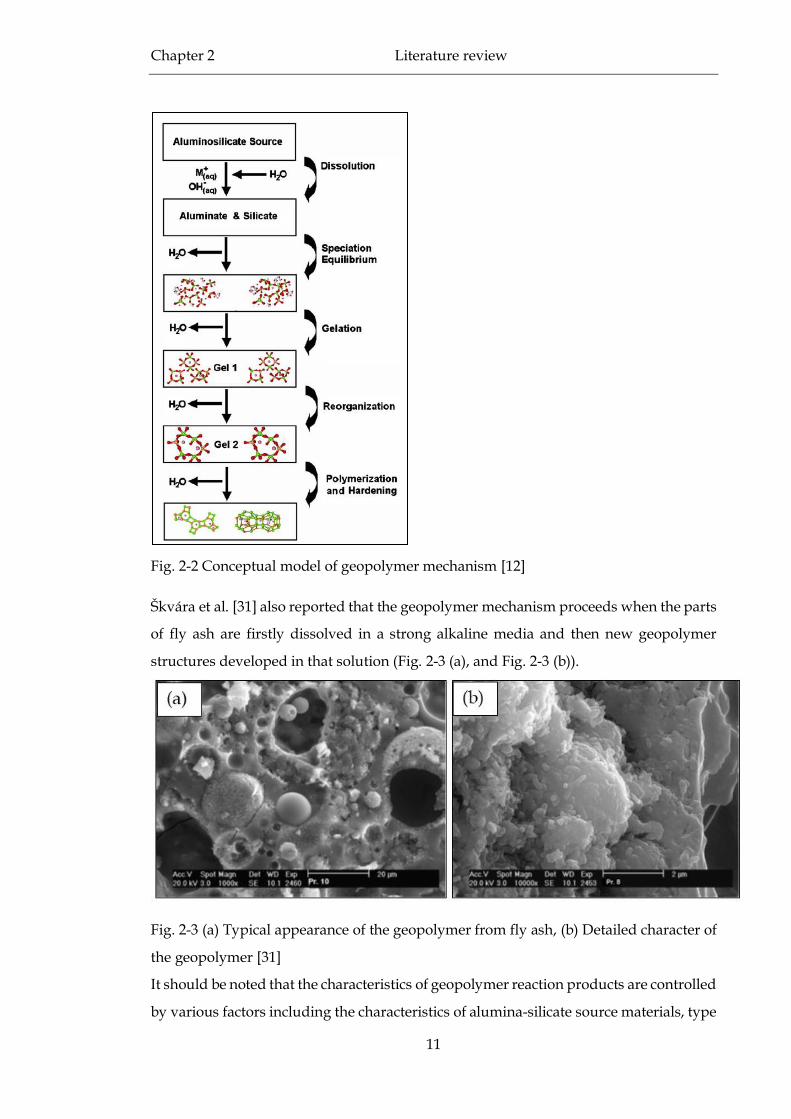
Furthermore, Duxson et al. [12] also developed a conceptual model to explain the
mechanism of geopolymer in a simple version. Fig. 2-2 revealed their model and
indicated that the geopolymer reaction in five stages of the process. Initially, the reaction
process started with the dissolution of amorphous aluminosilicate source material by
alkali hydroxide solution with a present of water and released silicate and aluminate
species. Secondly, these species become an equilibrium stage and water that is consumed
during the dissolution stage is released in this step. In the next stage, alumina silicate gel
is forming with the condensation of the solute species in the presence of high pH and
water released in this stage too. Thereafter, the pore size distribution and the
microstructure properties are created by rearrangement and reorganisation of the
system. In the final stage, three-dimensional aluminosilicate network formed after
hardening of the system.
Page 33
Chapter 2 Literature review
11
Fig. 2-2 Conceptual model of geopolymer mechanism [12]
Škvára et al. [31] also reported that the geopolymer mechanism proceeds when the parts
of fly ash are firstly dissolved in a strong alkaline media and then new geopolymer
structures developed in that solution (Fig. 2-3 (a), and Fig. 2-3 (b)).
Fig. 2-3 (a) Typical appearance of the geopolymer from fly ash, (b) Detailed character of
the geopolymer [31]
It should be noted that the characteristics of geopolymer reaction products are controlled
by various factors including the characteristics of alumina-silicate source materials, type
Page 34
Chapter 2 Literature review
12
alkali activator, amount of activator and the curing regime. Therefore, by changing of
these properties, the final product of geopolymer reaction can be varied widely.
2.3.2 The precursor of geopolymer binder
Geopolymer binder can be produced with any source materials, which contain
amorphous forms of Aluminium (Al) and Silicon (Si) components. The widely used
precursor materials are fly ash, slag, Metakaolin, ground ash, bottom ash etc. Among
them, fly ash, slag and Metakaolin are most commonly used to produce geopolymer
binder due to the availability and reactivity.
2.3.2.1 Fly ash-based geopolymer
According to ASTM C 618 [32], fly ash is divided into two subclasses such as class F fly
ash and class C fly ash. Class F fly ash is produced from burning of anthracite or
bituminous coal, and it contains minimum 70 % of the total constituents are silicon
dioxide (SiO2), aluminium oxide (Al2O3) and iron oxide (Fe2O3). Class F fly ash also has
a low amount of calcium oxide (CaO) whereas class C fly ash is the by-product of
burning of lignite or sub-bituminous coal and contains SiO2, Al2O3 and Fe2O3 minimum
50% of the total constituents. Class C fly ash has a high amount of CaO compared to
Class F fly ash. Between two types, Class F fly ash is determined as the most suitable
source material for geopolymer binder production due to the high amorphous
components, finer particle size, morphology and availability [33]. The primary reaction
component of class F fly ash is sodium aluminium silicate hydrate (N-A-S-H) gel [34].
However, due to the high amount of CaO content in class C fly ash, C-S-H and C-A-S-H
binding gels are also produced with N-A-S-H gel during the activation process.
Therefore, higher mechanical strength has been achieved with class C fly ash
geopolymer compared to class F fly ash geopolymer binder [35, 36]. However, drawback
in class C fly ash geopolymer binder is low setting time and this causes high voids, and
higher permeation properties have been identified in class C fly ash binder [37]. In
addition, it has also been reported that the high amount of Ca in class C fly ash would
be interfered the geopolymer reaction and changes the microstructure of the geopolymer
products [33, 38]. Conversely, compared to class C fly ash, high aluminium content in
class F fly ash produced more durable geopolymer matrix [39, 40]. Moreover, many
research studies have been confirmed that the class F fly ash based geopolymer binder
had good mechanical durability properties [21, 33, 41, 42].
Page 35
Chapter 2 Literature review
13
2.3.2.2 Ground granulated blast-furnace slag (GGBFS) based geopolymer
GGBFS is another source of material for the preparation of geopolymer binder, which is
gaining from the by-product of blast furnaces in iron production. GGBFS mainly
contains CaO, silica and alumina components. In fly ash based geopolymer, N-A-S-H
gel is the primary reaction component during the geopolymerisation whereas in slag
based geopolymer binders C-A-S-H is a primary binder phase, which is amorphous to
partially crystalline and relatively highly cross-linked network [43]. In addition to the C-
A-S-H gel, N-A-S-H gel also forms during the geopolymerisation, and the formation of
both gels promotes the higher mechanical strength [43, 44]. The important benefit to
make geopolymer binder with slag material is that the concrete can be cured at room
temperature conditions. As opposed to that, higher temperature curing is required for
fly ash based geopolymer binder. Therefore, slag based geopolymer would be suitable
for many industrial applications in concrete industry, whereas fly ash based geopolymer
concrete can only be applicable in precast construction.
2.3.2.3 Metakaolin based geopolymer
Metakaolin also used to prepare the geopolymer binder by many researchers [45-49].
The major advantages of the usage of metakaolin in geopolymer binder preparation are
the dissolution rate of metakaolin is high in alkaline medium and can be easily control
of Si/Al ratio [33, 38]. However, the main barrier to the common application of
metakaolin is the cost of the material. Therefore, fly ash and slag are most suitable
materials in geopolymerisation.
2.3.2.4 Fly ash and GGBFS blended based geopolymer
Since the higher temperature curing method is favourable for fly ash based geopolymer,
the incorporation of slag into fly ash based geopolymer mix is an effective technique to
cure at ambient temperature, and this can enhance the usage of geopolymer binder in
concrete preparation. Li et al. [50] reported that the incorporation of slag with alumina-
silicate rich source materials in geopolymer production enhances the properties of
geopolymer binder at fresh and later stages. Blending of slag and fly ash binder produces
calcium aluminate silicate hydrate (C-A-S-H ) and calcium silicate hydrate (C-S-H)
phases with N-A-S-H gels and creates less porous structure [51]. During the
geopolymerisation process, initially, fly ash particles are dissolved in an alkaline
Page 36
Chapter 2 Literature review
14
solution and produced alumina silicate binding gel. The dissolution rate of Ca from the
source of slag is slow compared to the dissolution of fly ash particles. Due to this reason,
C-S-H and C-A-S-H phases are formed at latter stage of geopolymerisation. Therefore,
slag blended fly ash based geopolymer binder produced higher strength at the later age
of concrete [52]. Furthermore, Nath et al. [53] reported that the incorporation of slag into
a fly ash mix up to 30% of total binders produced good quality geopolymer concrete at
ambient temperature by activation of sodium silicate and sodium hydroxide solution.
Moreover, Ismail et al. [54] stated that the end product of geopolymer reaction depends
on the ratio of slag to fly ash in the mix composition. They have reported that the
geopolymer mix with slag content above 50% of total precursors yields C–N–A–S–H
type gel, while more proportion of fly ash in the geopolymer mix produced N–C–A–S–
H gel with small pore size matrix. Ismail et al. [24] also conducted another investigation
to determine the durability performance of geopolymer concrete mixes with different
proportion of slag and fly ash materials. According to their study, they have proposed
that the geopolymer concrete with slag as the main precursor have better the durability
performance compared to the geopolymer mix with a higher proportion of fly ash
content.
2.3.3 Activators
Alkali activators are necessary to initiate the geopolymerisation reaction by dissolution
of source materials. The following types of activators are commonly used in the
geopolymer production:
Sodium hydroxide (NaOH) or potassium hydroxide (KOH) solution only
Sodium silicate (Na2SiO3) or potassium silicate (K2SiO3) solution only
Combination of NaOH+ Na2SiO3 or KOH+ K2SiO3 solution
Combination of NaOH+ Na2SiO3 + KOH solution
Na2SiO3 powder only
From the above types, a combination of NaOH and Na2SiO3 solutions are mostly used
in the geopolymer binder preparation. It should be noted that the ratio of Na2SiO3 to
NaOH is important in the production of geopolymer binder, which is influenced on the
geopolymer concrete properties. Chindaprasirt et al. [55] reported that the higher
mechanical properties in the geopolymer binder could be achieved when the ratio of
Page 37
Chapter 2 Literature review
15
Na2SiO3 to NaOH in the range of 0.6-1.0. The activator modulus (SiO2/Na2O ratio) is also
controlled the reaction rate and influenced on the geopolymer binder properties. Law et
al. [21] identified that the increment of SiO2/Na2O ratio from 0.75 to 1 created the
strength enhancement for fly ash based geopolymer binder. However, they have
proposed that this strength increment is limited when the SiO2/Na2O ratio changed from
1 to 1.25. It was also mentioned that the durability of the geopolymer binder is improved
by the increment of SiO2/Na2O ratio up to 1 for slag based geopolymer binder system
[25].
The evidences are shown that the concentration of NaOH is predominantly influenced
on the rate of geopolymerisation reaction and the mechanical and durability properties
of the geopolymer binder. The increment of NaOH concentration is beneficial for
geopolymer production. The high concentration of NaOH accelerates the
geopolymerisation reaction and reduces the unreacted particles in geopolymer. This
attributes to the dense structure and enhances the strength of the geopolymer binder [33,
56]. It has also mentioned that the geopolymerisation reaction can be produced even
without soluble silicate when the concentration of NaOH is high [57]. There are some
researchers conducted experimental studies with NaOH as a sole activator [56, 58].
Compared to the Na2SiO3 solution, NaOH is commonly available and low viscous
material. However, using of NaOH as a sole activator for fly ash based geopolymer
produces more porous structure than NaOH activated GGBFS based geopolymer [56].
Incorporation of Na2SiO3 solution into NaOH solution promotes the gaining of high
strength by enhancing the formation of binding gel [59].
Moreover, Lee et al. [60, 61] reported that the combination of NaOH and Na2SiO3 or KOH
and K2SiO3 could be commonly used as the activator for geopolymer, which leads to
enhancing the properties of geopolymer. However, KOH is more expensive material
compared to NaOH and therefore, the usage of KOH is limited in the preparation of
geopolymer binder.
2.3.4 Curing method
OPC concrete is generally cured with water curing method at ambient temperature.
However, different types of curing methods can be used in the geopolymer concrete
preparation. Geopolymer concrete is prepared at a different range of curing temperature
with different curing regime. Generally, elevated temperature curing method is
Page 38
Chapter 2 Literature review
16
beneficial for fly ash based geopolymer concrete. According to the study by Hardjito et
al. [33], the compressive strength of the geopolymer concrete increased with the increase
of curing temperature range of 30 °C to 90 °C. Sindutha et al. [62] mentioned that the
high-temperature curing accelerates the dissolution of precursor materials with the
expansion total pore volume and surface area. They have suggested the preferred
temperature for curing of geopolymer was in the range of 30 to 75°C, and the
temperature below 30°C curing produced precipitation of dissolved species instead of
poly-condensation of silicate and aluminate. Palomo et al. [63] also observed that the fly
ash based geopolymer concrete produced 60 Mpa compressive strength after cured at 85
°C temperature. Therefore, heat curing method is favourable for fly ash based
geopolymer concrete and can be achieved higher strength values [64]. However, in
another study, Chindaprasirt et al. [55] reported that the optimum curing temperature
for fly ash based geopolymer was 60 °C and higher temperature curing reduced the
strength of the geopolymer concrete. Therefore, it showed that it should be necessary to
keep an optimum temperature during the curing process of fly ash based geopolymer
concrete preparation.
On the other hand, ambient curing method is beneficial for slag based geopolymer
concrete and fly ash –slag blended geopolymer concrete. Ismail et al. [22] conducted the
study on ambient cured fly ash- slag blended geopolymer concrete with different mix
compositions. According to their research, geopolymer concrete samples displayed
higher compressive strength (65 MPa) compared to OPC concrete (60 MPa) after 90 days
of ambient curing period. Deb et al. [65] studied the properties of ambient cured fly ash-
slag blended geopolymer concrete and reported that the strength of ambient cured
geopolymer concrete is increased with age of the samples. This is because the reaction
rate is lower in ambient temperature compared to elevated temperature curing method.
Furthermore, curing period also influenced on the properties of geopolymer concrete,
especially during the heat curing process. The increment of the duration of heat curing
is providing significant enhancement of the compressive strength when the specimens
are curing at a higher temperature. Hardjito et al. [33] observed that the compressive
strength of fly ash based geopolymer concrete promoted by extended period of curing.
The compressive strength values of the geopolymer concrete increased with higher
curing period. On the other hand, Castel et al. [66] reported that the mechanical
properties of geopolymer concrete are decreased with prolong heat curing at a higher
Page 39
Chapter 2 Literature review
17
temperature. Prolong curing could be attributed to the lower strength due to
deterioration of microstructure of the geopolymer concrete [55, 67]. Moreover, Subhash
et al. [68] proposed that the compressive strength of fly ash based geopolymer mortar is
increased with increasing the period of heat curing. However, they have mentioned that
the curing of more than 12 hr is not significant for the strength increment and they have
suggested that the increasing curing temperature with the less period of heating can be
developed high compressive strength for geopolymer. They have proposed that the
range between 60 °C and 90 °C temperature heat curing is suitable for fly ash based
geopolymer concrete. They also observed that the cracks formed on the geopolymer
mortar surfaces when it is cured at 120 °C temperature.
Moreover, some of the research works have been conducted with the geopolymer
concrete produced with steam curing method. Sarker et al. [69] used two different types
of stream curing methods to prepare the geopolymer concrete. One set of samples were
steam cured at 60 °C for 24 hr immediately after casting, and other sets of samples were
included in steam cured three days after casting at 80 °C for 24 hr. According to their
study, higher compressive strength was obtained for the geopolymer sample prepared
at 80 °C after three days of casting compared to the samples cured at 60 °C temperature.
Therefore, they have proposed that the compressive strength of geopolymer is increased
with a rest period and higher curing temperature. In addition, Olivia et al. [70] also used
steam curing method to prepare the fly ash based geopolymer concrete samples and
achieved higher mechanical properties for geopolymer concrete.
2.4 Mechanical properties of hardened geopolymer concrete
Previous research investigations have indicated that the geopolymer concrete exhibited
superior mechanical properties compared to OPC concrete. The compressive strength
value is an important parameter for the concrete materials. It should be noted that the
mechanical properties of geopolymer concrete depend on various factors including the
type of source material, activator type and the amount of alkali activator, curing regime,
curing temperature, water content and the admixture content used in the concrete mix.
To obtain high compressive strength of concrete, the high reactivity source of materials
are required [71]. The formation of high strength gel phase and the ratio of gel phase to
non-polymeric phases is important to achieve high compressive strength values.
Therefore, the parameters such as the type of source material, molar ratios of Aluminium
Page 40
Chapter 2 Literature review
18
oxide, Silicon oxide in the source material, type, concentration and the pH value of the
alkaline solution and the solubility of source materials in the activator solution are
influenced on the compressive strength of geopolymer concrete.
As explained above, the type of source materials influenced on the strength of
geopolymer concrete. Compared to class F fly ash, higher mechanical strength was
obtained for the concrete prepared with class C fly ash geopolymer binder [35, 36] due
to the high Ca content. Diaz et al. [72] also studied compressive strength characteristic
of geopolymer concrete prepared with class F and class C type fly ash. According to that,
the compressive strength values obtained for class F fly ash based geopolymer concrete
was 45-50 MPa, while the concrete prepared with class C fly ash displayed in the range
of 50-80 MPa. Hardjito et al. [33] reported that the geopolymer concrete prepared with
class F fly ash exhibited higher strength values compared to OPC concrete. Sofi et al. [73]
examined the engineering properties of geopolymer concrete and reported that the
geopolymer concrete prepared with fly ash, slag source materials produces the
compressive strength values in the range of 47-60 MPa. Partha et al. [74] reported that
the mechanical properties such as compressive strength, splitting tensile strength and
the flexural strength of geopolymer concrete are increased with the increment of slag
content in the fly ash mixture. It was reported that the fly ash, slag blended geopolymer
concrete produced 100–160 MPa strength concrete after 28 days of curing [75].
Furthermore, Chi et al. [51] determined that the compressive strength of fly ash slag
blended geopolymer is greater than OPC mortar, whereas the geopolymer mortar
prepared with fly ash binder displayed lower strength values.
The alkaline solution also plays an essential role in the mechanical properties of
geopolymer. Usually, the higher concentration of the activator solution induces the
solubility of aluminosilicate particles present in the source material, and this increases
the high geopolymerisation rate, which produces a noticeable effect on the mechanical
properties of the geopolymer [76]. Hardjito et al. [33] obtained seven days compressive
strength values of 67 MPa for the geopolymer concrete prepared with 14 M concertation
of activator solution. In another study, the higher molarity of the activator (14 M)
produces a compressive strength of geopolymer mortar with 25 MPa strength after 48 hr
[77]. Moreover, Phoo-ngernkham et al. [78] studied the effect of activator solution on the
strength properties of fly ash, fly ash-slag blended mix and slag based geopolymer.
According to their study, they have reported that the geopolymer prepared with fly ash
Page 41
Chapter 2 Literature review
19
and fly ash- slag blended materials with the activation of NaOH or Na2SiO3 solutions
shows lower strength at the ambient curing temperature. To achieve the better strength,
the combination of NaOH and Na2SiO3 activator solutions are required. They have also
reported that the use of Na2SiO3 solutions is favourable for the strength development in
slag-based geopolymer.
In addition to the type of source materials and the activator solution, the curing
temperature also influenced on the strength development of geopolymer concrete. As
explained earlier, curing temperature and the curing period play a vital role in the
mechanical properties of geopolymer. The heat curing method is favourable for fly ash
based geopolymer concrete. As reported in the previous studies, the fly ash based
geopolymer concrete cured at high temperature produced higher compressive strength
values [33, 62, 63]. However, people also reported that the compressive strength of
geopolymer concrete increased with the curing temperature and concrete cured at very
high temperature reduced the strength of the geopolymer concrete [66]. On the other
hand, the source materials rich with calcium can be cured at ambient temperature. Ismail
et al. [24] reported that the incorporation of slag in to fly ash based geopolymer mix
enhances the mechanical strength when it is cured at ambient temperature. They have
obtained 45 MPa and 65 MPa compressive strength values for the geopolymer concrete
prepared with 50% of fly ash and 50% of slag constituents in 28 days and 90 days
respectively. In addition to that Deb et al. [79] showed that the 80% fly ash and 20% slag
based geopolymer mix displayed 51 MPa compressive strength values after 28 days of
ambient curing method. Therefore, this indicates, ambient curing method is
advantageous when the slag is mixed with fly ash source materials to achieve the higher
mechanical strength values.
The curing period also plays another important effect on the strength development of
geopolymer concrete. Bakharev [64] reported that 6 hr cured fly ash based geopolymer
activated with Na2SiO3 activator displayed better strength values compared to the
geopolymer concrete cured for 24 hr period. Palomo et al. [8] stated that the mechanical
strength of geopolymer concrete is high when it is cured at 85 °C than 65°C temperature
curing method. However, compared to 5 hr curing period, the strength increment is
much small when the concrete was cured for 24 hr period.
Page 42
Chapter 2 Literature review
20
Therefore, the past studies revealed that the better mechanical properties could be
achieved for geopolymer concrete by maintaining a suitable combination of the source
material, activator solution and the appropriate curing methods.
2.5 Permeation properties of hardened geopolymer concrete
Permeation is defined as a property of concrete, that allows the fluids ( both liquids and
gases) can enter into the concrete and move through the concrete [80]. The permeation
properties of the concrete are the critical parameters for control the durability of the
concrete structure. A permeability characteristic of the concrete is vital for the
penetration of the aggressive agents such as CO2, chloride ion and other gases or
chemical ions those promote the decaying the concrete and produce the corrosion of the
steel bar in concrete. Less permeable concrete can reduce the penetration of those agents
and minimise the deterioration effect on the concrete structure.
Permeation of fluid through the concrete can be divided into three transport mechanisms
such as absorption, permeability and diffusion [80, 81]. Absorption is a movement of the
liquid through the concrete by capillary suction to fill the pore space available in concrete
[80, 82]. Permeability is a parameter, which allows the fluids pass into the concrete under
the action of a pressure gradient. Finally, gases and chemical ions penetrate to concrete
surface by diffusion mechanism due to a concentration gradient. The diffusion rate of
the gases is very slow through the saturated concrete surface, and the diffusion rate is
high when the concrete is subjected to partially saturated conditions. Therefore,
diffusion is most important to the concrete structures that are exposed to field
environment with partially dry conditions. The diffusion of fluids such as chloride and
sulphate ions are most vulnerable to the deterioration of durability of the concrete
structures that are submerged in the water environment [25].
Many researchers have been investigated the permeation properties of geopolymer
concrete by using accelerated testing methods. However, considering the gas
permeation of geopolymer concrete, only a few studies have been conducted so far.
Sagoe-Crentsil et al. [83] reported that the gas permeability of steam-cured fly ash based
geopolymer was equivalent to OPC concrete with the similar compressive strength
values. However, they have not mentioned the method that was used to determine the
gas permeability coefficient. Gunasekara et al. [84] also compared the air permeability
coefficients of geopolymer concrete, which are prepared with various fly ash types,
Page 43
Chapter 2 Literature review
21
available in Australia. They used Auto Clam Permeability System to determine the air
permeability characteristic of geopolymer concrete. They have determined that the air
diffusion characters of geopolymer concrete depend on the type of fly ash that is used in
geopolymer binder.
Compared to gas permeation, there are many studies have been carried out on
geopolymer concrete to determine the water permeation properties. The water
permeation properties of the geopolymer concrete are commonly measured with the
volume of permeable voids (VPV) test method and sorptivity analysis. According to the
previous studies, contradict conclusion have been derived for the water permeation
properties of geopolymer concrete. Ismail et al. [24] carried out VPV test on geopolymer
concrete samples with different proportion of fly ash and slag and reported that the VPV
values of slag based geopolymer concrete is higher than OPC concrete. They have also
stated that the VPV values of geopolymer concrete can be comparable with OPC concrete
by adding fly ash content into the slag binder [24] .
On the other hand, Deb et al. [65] mentioned that the addition of slag into fly ash binders
reduced the VPV values and showed lower values compared with the test results of OPC
concrete. This study is opposed to the test results of the previous investigation [24]. Chi
et al. [51] also proved that the geopolymer concrete had lower water absorption
compared to OPC concrete.
Sorptivity is a key index for the moisture transport into unsaturated concrete specimens,
which is identified as an important parameter for the durability of the concrete [85]. It
was confirmed that the ratio of SiO2/Na2O is essential to control the sorptivity
parameters of geopolymer binder. Qureshi et al. [86] revealed that the water absorption
and the sorptivity coefficient values of slag based geopolymer concrete are decreased
with the range of SiO2/Na2O ratio between 0.2 to 0.8 and the coefficients are increased
when the ratio is greater than the value of 0.8. However, in contrast with that, Adam et
al. [25] obtained that the optimum sorptivity coefficient value for slag based geopolymer
concrete with a SiO2/Na2O value of 1. In addition, Law et al. [21] mentioned that the
sorptivity value of fly ash based geopolymer concrete reduced when the ratio of
SiO2/Na2O is increased from 0.75 to 1.25.
Previous studies have shown that the slag-based geopolymer displayed higher
sorptivity coefficients compared to fly ash based geopolymer and OPC concrete
Page 44
Chapter 2 Literature review
22
specimens due to the highly porous structure of slag based binder, which promotes the
absorption of water [22, 25, 87]. Furthermore, slag based geopolymer concrete showed
the higher coefficient of sorptivity values than OPC concrete and the absorption
coefficient of geopolymer concrete is reduced with the inclusion of fly ash to slag mixture
[24]. As opposed to that, Deb et al. [65] mentioned that the sorptivity parameters of slag
blended fly ash based geopolymer concrete is lower than OPC concrete, and the
sorptivity values are decreased with an increment of slag proportion into fly ash based
binders. Chi et al. [51] also stated that the sorptivity of fly ash based geopolymer binders
are higher than the values of slag blended fly ash binders and slag based geopolymer
binders. This is due to pore structure filled with fine particle size of slag and C-A-S-H
binding gel in slag rich geopolymer contain a substantial amount of water, whereas in
fly ash-based binder less amount of bound water content by the N-A-S-H binding gel.
More recently, Noushini et al. [88] conducted the study to determine the effect of heat
curing on the transport properties of fly ash based geopolymer concrete. They compared
the curing temperature with the range of 60°C to 90°C and the period for curing was 8
hr to 24 hr. They have reported that the sorptivity coefficients of geopolymer binders are
depended on the curing time and the temperature.
2.6 The durability of geopolymer concrete
It is well known that the concrete made with Ordinary Portland cement is a durable
material. However, in a field environment, the aggressive agents such as CO2
penetration, chloride diffusion, sulphate attack and acid attack affect the durability of
concrete. In OPC concrete, diffusion of these aggressive agents reacts with Portlandite
(Ca(OH)2) and calcium silicate hydrate (C-S-H) components in the cement matrix and
this induces the deterioration of the cement matrix. However, the reaction between the
aggressive agents and the geopolymer concrete varies from OPC concrete due to
different source materials and the different reaction products in geopolymer concrete.
Therefore, durability behaviour of geopolymer concrete is differentiated from OPC
concrete in an exposed environment. According to the previous studies, many
researchers found better mechanical properties [25, 89] and excellent durability
performance [22, 90]. However, some other researchers obtained inferior durability
performance considering carbonation resistance [26] and chloride penetration [25]. In
this section, the durability of geopolymer regarding the efflorescence and leaching
behaviour, carbonation, chloride penetration and the sulphate attack are discussed.
Page 45
Chapter 2 Literature review
23
2.6.1 Efflorescence and leaching of geopolymer
In the past studies, the authors have reported that the efflorescence in geopolymer occurs
due to the open microstructure of some materials, which have a lower extent of reaction,
high alkali concentration in the pore solution and weak binding of Na in the geopolymer
structure [91-93]. For OPC concrete, efflorescence is normally harmless except for the
discolouration. However, for geopolymer concrete, efflorescence can be a significant
concern when the products are exposed to humid air or in contact with water due to
higher soluble alkali content than conventional OPC concrete. Because in geopolymer
concrete, alkali cations (Na+, K+) are movable within the pore network, when the
moisture presented in the concrete. Therefore, these alkali cations deposit on the surface
when the water evaporates from the concrete. The deposited alkali cations react with
CO2 from the atmosphere and produce white carbonate products on the concrete surface,
which is known as efflorescence [94]. However, this carbonation mechanism is varied
from the carbonation of the geopolymer binder, which is the reaction between the
sodium based geopolymer binder phases and atmospheric CO2 [95, 96]. Carbonation
causes pH reduction, degradation of binder, corrosion of embedded reinforcement bar
in concrete, which are harmful to the service life of the concrete structure, whereas
efflorescence makes the formation of visible deposit on the surface, which may not be
involved into the further degradation of the binder. The carbonation of geopolymer
concrete is explained in the section 2.6.2.
Temuujin et al. [97] reported that the ambient cured geopolymer concrete specimens
exhibited efflorescence products, whereas no such efflorescence was observed in the
samples cured at 70° C temperature. This is because the rate geopolymerisation is higher
when the sample cured at high temperature, which leads to complete incorporation of
the Na and P atoms into geopolymer structure and reduces the free movement of alkali
cation within the pore network. Fig. 2-4 shows the Scanning Electron Microscopic (SEM)
image of efflorescence crystals and the X-ray spectrum analysis on the efflorescence
crystal. According to that the presence of Na and P atoms in the efflorescence has been
confirmed.
Some of the research studies have been proved that the efflorescence crystals from
geopolymer concrete consist sodium carbonate hydrate (Na3H(CO3)·2H2O) or sodium
carbonate(Na2CO3) [98, 99]. However, the presence of sodium phosphate hydrate
Page 46
Chapter 2 Literature review
24
(Na3PO4·12H2O) also identified in the efflorescence crystals of ambient temperature
cured samples [97]. According to the XRD test results (Fig. 2-5) presence of
Na3PO4·12H2O has been confirmed for ambient cured geopolymer sample. In those
different studies, different types of fly ash have been used to prepare the geopolymer
binder. Therefore, this indicates, the composition of the efflorescence strongly depends
on the chemical, and mineralogical composition of the fly ash [97].
Fig. 2-4 SEM micrograph of efflorescence crystals and associated X-ray spectrum
(backscattered electron image, 20 kV, the sample is not coated) [97].
Page 47
Chapter 2 Literature review
25
Fig. 2-5 XRD patterns of efflorescence from ambient temperature cured samples [97].
On the other hand, Zhang et al. [100] proposed that the efflorescence of geopolymer
depends on the type of activator, the temperature of curing and the incorporation of slag
content in the geopolymer mix. Fig. 2-6 displayed the visible formation of efflorescence
on the surfaces of geopolymer samples with different proportion of fly ash, slag content,
activator type and different curing regimes. They have determined that the geopolymer
binder activated by NaOH displayed less and slower efflorescence compared to Na2SiO3
activated geopolymer specimens under ambient curing conditions. In addition, as
mentioned previously, these authors also reported that the high-temperature curing is
beneficial to reduce the efflorescence rate, due to the local reorganisation and
crystallisation of N–A–S–H gels. The incorporation of slag as a source of Ca into fly ash
based geopolymer binder reduces pore sizes and porosity with either ambient or high-
temperature curing, which leads lower efflorescence rate in geopolymer system.
Page 48
Chapter 2 Literature review
26
Fig. 2-6 Efflorescence on the surfaces of geopolymer samples with different proportion
of fly ash, slag content, activator type and different curing regimes [100]
Some of the researchers have already suggested the suitable methods to reduce the
efflorescence in geopolymer concrete. Najafi et al. [94] proposed to incorporate high
alumina cement admixtures, which encourage to the extent of crosslinking in the
geopolymer binder. This reduces the mobility of alkalis in the geopolymer binder
system, which helps to minimise the efflorescence in geopolymer. Movement of alkalis
is the main reason for the efflorescence in geopolymer system. They also have
recommended using high-temperature curing method to reduce the efflorescence effect.
They have reported that the curing of geopolymer specimens at temperatures of 65 °C
or higher enhanced to minimize the efflorescence effect.
Considering the leaching behaviour of the geopolymer concrete, limited studies
available in the literature. Zhang et al. [101] investigated the leaching ions from red mud-
fly ash based geopolymer in sulphuric acid solutions and deionised water. They have
determined that the leaching of As, Cu, Cr and Cd from the geopolymer samples in both
exposed solutions and the amount of leaching ion can be comparable with OPC concrete.
They also revealed that the leaching behaviour of geopolymer sample does not depend
Page 49
Chapter 2 Literature review
27
on the temperature. In addition, Zhang et al. [100] determined that the Na and K alkalis
from geopolymer binder are leached, and the amount of Na alkali leaching is much
higher than the leaching of K alkali. Furthermore, they also mentioned that the leaching
rate is decreased by an increment of soluble silica content in the geopolymer binder. On
the other hand, Izquierdo et al. [102] determined that the leaching amount of K and Si
ions are high, when the geopolymer samples cured in the open air conditions due to the
high and quick evaporation of water from geopolymer samples.
2.6.2 Carbonation resistance of geopolymer concrete
Considering the durability of the concrete structures, carbonation is an essential
parameter for the degradation of the durability in an atmospheric environment. In OPC
concrete, carbonation occurs when the CO2 from the atmosphere diffuses into the
concrete and reacts with calcium hydroxide (Ca(OH)2) and calcium silicate hydrates (C-
S-H) components [103]. Due to this reaction, calcium carbonate (CaCO3) component
produces in OPC concrete, and this reduces the pH level of OPC concrete.
It is well known that the pH of the pore solution in OPC concrete should be more than
12.6 [26] . The pH level is important to concrete. This is because the reinforcement bar in
OPC concrete is protected against corrosion activity by the alkalinity (Ca(OH)2)
component of the cement, which is forming a thin oxide layer (passivation layer) around
the reinforcement bar. However, this passivation layer will be de-passivated with the
carbonation process due to pH deduction (alkalinity deduction) to less than 9.0 in the
concrete [104, 105]. Therefore, the reinforcement bar will be started to corrode, and this
reduces the durability of the concrete structures when it is exposed to the field
environment. The moisture content of the concrete mainly influences the rate of
carbonation. The optimum relative humidity level for highest rate of carbonation of
concrete was 50%- 70% [106]. If the moisture level is too low or too high from the above
limit, then the carbonation rate should be less. Therefore, the effect of carbonation is
high, when the concrete structures are subjected to the partially dry environment. In
addition, the carbonation rate of concrete also depends on the binder phase, physical
properties, permeability characterises and the porosity of the concrete surface [107, 108].
It should be worth to mentioned here that the carbonation reaction in geopolymer
concrete is varied from OPC concrete due to the absence of Ca(OH)2 components and
Page 50
Chapter 2 Literature review
28
the different reaction components in geopolymer concrete. Therefore, carbonation
mechanism and the carbonation reaction components in geopolymer concrete is
different than the OPC concrete. Unlike the Portland cement material, the amount of Ca
component is very low in the geopolymer source materials, especially when fly ash
material used as a precursor. Therefore, the availability of Ca(OH)2 in geopolymer
concrete is limited. On the other hand, geopolymer matrix has NaOH and KOH
hydroxides components from the activator solutions. Therefore, during the carbonation
reaction, the diffusion of CO2 reacts with NaOH and KOH, and produced Na2CO3 and
K2CO3 components.
There are various research studies have been conducted on the carbonation resistance of
slag based geopolymer concrete based on accelerated testing method. Adam et al. [25]
mentioned that the alkali-activated slag based geopolymer concrete consists lower
resistance to carbonation compared to OPC concrete. During the accelerated testing
period with 20% of CO2 concentration, they have found that the carbonation depth of
slag-based geopolymer concrete was around 35 mm after the eight weeks of exposure.
Conversely, OPC concrete showed only 10 mm carbonation depth at the same time of
exposure. Song et al. [109] also investigated the carbonation resistance of alkali-activated
slag based geopolymer mortar and reported that the rate of carbonation in geopolymer
binder is higher than OPC binder. They found that the C-S-H gel in slag-based
geopolymer is more vulnerable to carbonation than that in OPC paste and the
carbonation reaction in geopolymer attributes the change of C-S-H gel to silica gel, and
the aluminium compounds were completely disintegrated. Therefore, this produces
higher carbonation rate in slag based geopolymer compared to OPC binder.
Moreover, Bakharev et al. [26] also observed higher carbonation depth for slag based
geopolymer concrete. In addition, Bernal et al. [89] reported that the carbonation depth
of slag based geopolymer concrete is higher than OPC concrete and the resistance to
carbonation is improved with the increment of binder content in the mix. Fig. 2-7 showed
the carbonation depth measurements of slag based geopolymer concrete (AASC) and
OPC concreter (OPCC) after exposed to 1% of CO2 environment for 1000 hr period. As
shown that the geopolymer concrete produced with a low amount of binder content (400
kg/m3) exhibits higher carbonation depth. A further, according to Fig. 2-7, carbonation
depth of OPC concrete was lower than geopolymer concrete when the amount of binder
content is similar. It was also proved that the carbonation rate of geopolymer concrete
Page 51
Chapter 2 Literature review
29
depends on the type of activator. Puertas et al. [110] observed that the carbonation depth
of Na2SiO3 activated slag based geopolymer mortar was 10 mm after four months of
exposure. However, according to their study, slag based geopolymer mortar activated
by NaOH as the sole activator showed only 3 mm depth after four months of the
exposure period. Therefore, they have concluded that the NaOH activator is better than
Na2SiO3 activator to reduce the effect of carbonation in slag based geopolymer concrete.
Fig. 2-7 Carbonation depth measurements of concretes after 1000 h of exposure to a 1%
CO2 environment [89].
Considering the carbonation of fly ash based geopolymer binder, only limited studies
are available in the past literature. The carbonation depth of slag-based geopolymer
concrete was determined by the application of phenolphthalein indicator, which is the
usual method to determine the carbonation of OPC concrete. Despite that, the previous
studies have shown that the phenolphthalein indicator did not provide clear carbonation
front for fly ash based geopolymer concrete [25, 90, 111]. Sufian Badar et al. [90] studied
the effect of fly ash type on the corrosion of steel bars induced by accelerated carbonation
methods. According to their study, the fly ash with high Ca content more susceptible to
carbonation and superior pH reduction compared to low Ca based fly ash based
geopolymer concrete. Besides that, Law.et.al [111] stated that the pH of low Ca fly ash
based geopolymer after the carbonation is sufficient to protect reinforcement bar against
Page 52
Chapter 2 Literature review
30
corrosion. They have prepared the geopolymer mortar samples with different activator
modulus, and the accelerated carbonation test was conducted in 5% of the CO2
environment. The pore water from mortar sample was then extracted, and the pH value
of the pore solution has been measured.
Table 2-1 displays the pH value changes with the exposure time. According to that, pH
values are changed with a small reduction and the final pH values are higher than the
pH of carbonated OPC samples. The different mix details were prepared by changing
the amount of Na2O dosage and the activator modulus. For example, the mix notation
G7.5-1.0 represents a 7.5 % Na2O dosage and a 1.0 activator modulus in the mix.
Table 2-1 pH values of geopolymer mortar specimens in carbonation environment [111].
Mix pH
0 days 3 days 7 days 28 days
G7.5-0.75 11.86 11.88 11.01 10.88
G7.5-1.0 11.94 11.91 11.35 10.46
G7.5-1.25 11.73 11.71 11.39 10.73
G15-1 11.96 11.97 11.5 11.05
G15-1.25 11.99 11.88 11.5 11
G15-1.5 11.97 11.98 11.77 11.23
Therefore, according to the available literature studies, slag based geopolymer concrete
is more susceptible to carbonation compared to OPC concrete and the carbonation effect
in low Ca fly ash based geopolymer concrete is not that much of severe compared to slag
based geopolymer concrete. This conclusion has been derived with the higher
concertation of the CO2 environment. However, Bernal et al. [112] mentioned that the
carbonation product from natural carbonation process and accelerated carbonation test
method could be dissimilar. That is, unlike natural carbonation, sodium bicarbonate
products are mostly formed during accelerated carbonation testing at high CO2
concentration level (i.e. 3% CO2). This induces a higher pH reduction compared to
natural carbonation. Therefore, measuring the carbonation depth of geopolymer
concrete exposed in ambient conditions is the appropriate way to determine the
durability performance in real atmospheric CO2 environments.
Page 53
Chapter 2 Literature review
31
2.6.3 Chloride penetration
Reinforced concrete structures in marine and saline environments are highly susceptible
to deterioration compared to normal atmospheric environments due to the chloride
attack. Evidence shows that the combination of carbonation and chloride penetration
compromises the durability of OPC concrete and causes higher corrosion of the
reinforcement [113, 114]. In addition, concrete is also susceptible to various chemical
reactions with the ions present in the seawater, such as sulphates and magnesium, which
are associated with deterioration of concrete [115-117].
As explained earlier, reinforcement bar in concrete resists against corrosion by a passive
layer of the oxide film. As similar to CO2 penetration, the diffusion of chloride ion also
de- passivates the passive film and creates the path to corrosion of reinforcement bar in
an aggressive environment with the presence of water and oxygen. Therefore, chloride
attack is an important phenomenon for the durability aspects of the concrete structures
in marine environment. In general, chloride ion is penetrated through the concrete
surface with a three-transport mechanisms such as capillary absorption, diffusion and
hydrostatic pressure [82]. Capillary absorption is a mechanism, which transports the
liquids by surface tension acting in capillaries. Capillary absorption is important for the
penetration of chloride ions to the concrete. When the concrete structures are subjected
to not permanently contact with water, then the chloride ions are diffused into the
concrete surface by capillary forces. The risk of chloride attack is high when the concrete
structures are subjected to wet and dry conditions (not permanently contact water).
Diffusion is a transfer of chloride ions as a result of net flow from higher concentration
regions to lower concentration regions. This mechanism is important for the concrete
structures exposed in a fully submerged condition. Hydrostatic pressure method is used
to transfer liquids or gases through the concrete by a pressure head. This type of
transport mechanism is applicable for the concrete structures, which are contacted with
water under a pressure head.
In OPC concrete, there are many factors contributed to the rate of chloride penetration
such as water-cement ratio, type of cement, mix constituents, mix proportions and the
porosity of the concrete. Among that, the rate of diffusion highly depends on the
porosity of the concrete in terms of pore size, pore distribution and interconnectivity of
Page 54
Chapter 2 Literature review
32
the pore system. Therefore, concrete with lesser pore sizes and lower pore connectivity
is beneficial to reduce the chloride ingress through the concrete structure [118].
Although the chloride penetration is important for the durability aspect of the concrete,
past studies showed that only a few investigations have been conducted to determine
chloride diffusion of geopolymer concrete by using accelerated testing methods. Ismail
et al. [22] studied the chloride penetration of geopolymer concrete by using accelerated
chloride penetration test (Nordtest NT Build 492) and chloride ponding test (ASTM
C1543) methods. According to that, the slag based geopolymer exhibited lower chloride
penetration compared to OPC concrete. In addition, the experimental analysis showed
the diffusion of chloride is increased by the addition of fly ash binder into the slag based
geopolymer binder. Fig. 2-8 showed the chloride penetration depth measurements at the
end of chloride penetration test (Nordtest NT Build 492). As per that, the OPC concrete
exhibited higher chloride penetration compared to all geopolymer samples. The depth
of chloride penetration is increased with the increment of fly ash content in the
geopolymer mix. This showed that the replacement of fly ash materials by slag
constituents provided better benefits for the durability of geopolymer concrete and
compared to fly ash based geopolymer concrete, slag based geopolymer concrete is more
suitable for marine environment. Moreover, Olivia et al. [119] also confirmed the higher
chloride attack in fly ash based geopolymer concrete compared to OPC concrete.
However, despite of those studies, Adam et al. [25] revealed that the fly ash based
geopolymer concrete had lower chloride diffusion compared to OPC concrete and
higher diffusion observed in the alkali-activated slag based geopolymer concrete. Shaikh
et al. [120] also proposed that the geopolymer concrete contains the lower risk of
corrosion than OPC concrete under chloride environment by half-cell potential (HCP)
measurement based on CU/CUSO4 electrode.
Page 55
Chapter 2 Literature review
33
Fig. 2-8 Chloride penetration depth of concrete specimens at the end of the Nord Test
(A) 100 wt.% slag, (B) 75 wt.% slag/25 wt.% fly ash, (C) 50 wt.% slag/50 wt.% fly ash,
(D) OPC [22]
Furthermore, Kupwade-Patil et al. [121] examined the corrosion of reinforcement in fly
ash based geopolymer concrete, which is associated with accelerated chloride testing
method. Geopolymer concrete samples were prepared with two types of fly ash such as
class F and class C fly ash, and all concrete specimens are exposed to wet and dry
chloride environment for 12 months period. The test results showed that the chloride
diffusion and the chloride content in geopolymer concrete are lower than OPC concrete.
Besides that, the concrete prepared with class F fly ash performed better than the
concrete produced with class C fly ash. It was proved that the fly ash based geopolymer
concrete contain higher resistance to chloride diffusion than OPC concrete [122].
More recently, chloride-induced corrosion in fly ash and slag based geopolymer concrete
have been evaluated with the accelerated testing method by Tennakoon et al. [29]. They
have prepared geopolymer mixes with different proportion of fly ash and slag
constituents, and the chloride diffusion test was conducted according to the Nord test
NT Build 443 method. According to their study, chloride diffusion of fly ash-slag
blended geopolymer concrete is lower than the diffusion in OPC concrete, and the
diffusion of chloride in geopolymer concrete is improved with the increment of slag
content in the mix. This is consistent with the test results obtained by Ismail et al. [22].
Fig. 2-9 shows the chloride profiles of concrete specimens after subjected to the
Page 56
Chapter 2 Literature review
34
accelerated testing process. As shown in Fig. 2-9, OPC concrete had higher chloride
content throughout the depth, whereas the chloride penetration is decreased with the
substitution of fly ash by slag materials. They also evaluated the chloride-induced
corrosion after exposed to 2.826 M NaCl solution for 500 days and the test results
revealed that the corrosion activity started in OPC concrete reinforcement bar and no
sign of corrosion identified in the reinforcement bar in blended fly ash and slag
geopolymer concrete specimens. However, in contrast with all the above studies,
Ganesan et al. [123] determined that the chloride penetration of geopolymer and OPC
concrete are almost same.
Fig. 2-9 Chloride profiles of geopolymer and OPC concrete after 5 weeks of immersion
test [29]
Therefore, based on the past investigations, it is difficult to determine the risk of chloride
attack in geopolymer concrete due to the contradict results by various researchers. It is
important to consider that the above experimental studies have been conducted by an
accelerated testing method on freshly prepared geopolymer concrete specimens.
Therefore, different people have used different exposure conditions to conduct the
accelerated test, and this produces various results among different researchers.
However, the actual exposed environment condition should be varied from the
accelerated testing condition and due to this reason, geopolymer concrete will be
behaved differently in the real environment. Therefore, it is necessary to determine the
chloride penetration of geopolymer in the actual environmental conditions.
Page 57
Chapter 2 Literature review
35
Moreover, it is well known that the chloride penetration of OPC concrete reduces with
the age of concrete (maturity factor) due to the continuous hydration reaction in OPC
concrete with time after the casting of structures [124]. Due to continuous hydration
reactions in OPC concrete, the porosity and pore connectivity system are decreased with
the time of exposure, and this reduces the chloride diffusion into the concrete with the
age of the structure. Therefore, the chloride penetration in aged OPC concrete is less
compared to the fresh stage. In contrast with the hydration reaction of OPC concrete,
geopolymerisation reaction in heat-cured fly ash based geopolymer concrete is very
rapid with little or no further reaction after a few days of curing. Therefore, even though
the chloride penetration is same or less in geopolymer at fresh stage, the ingress of
chloride ions in geopolymer concrete could potentially be higher than OPC concrete after
some years of exposure [21].
2.6.4 Sulphate attack
Sulphate attack is another important phenomenon for the durability of concrete
structures in marine environment. Sulphate attack on concrete is produced an expansion
in concrete which ultimately leads to cracking or softening of the concrete [125]. In OPC
concrete, the mechanism of the reaction between sulphate and hydration reaction
components are complicated. In OPC concrete, penetration of the sulphate ion reacts
with calcium hydroxide, C–S–H gel and the aluminate component (C3A) of hardened
cement paste [126, 127]. As a result of this reactions, concrete structure suffers
expansion, spalling, cracking and loss of strength [126, 128]. As a results of the reaction
with sulphate ion, gypsum (calcium sulphate dihydrate, CaSO4.2H2O) and ettringite
(Ca6Al2 (SO4)3 (OH) 12 .26H2O) components forms in OPC concrete [129]. The formation
of gypsum and ettringite are the reason for the volume increment of the concrete matrix,
which causes concrete structures undergo cracking and spalling. Moreover, concrete
surface becomes softening and disintegration due to the destruction of C–S–H gel by
sulphate ion. The penetration of magnesium sulphate (MgSO4) caused magnesium
hydroxide (brucite, Mg(OH)2) and gypsum are formed in concrete. It has been confirmed
that the deterioration of concrete structure under MgSO4 penetration is more vulnerable
than in Na2SO4 environment [130]. Under MgSO4 penetration, decalcification of C–S–H
gel is high, and Mg2+ ion replaces the Ca2+, and this caused magnesium silicate hydrate
(M-S–H) are formed.
Page 58
Chapter 2 Literature review
36
On the other hand, mechanism of sulphate attack in geopolymer binder is varied from
OPC binder due to the different of geopolymer reaction products compared to hydration
components in OPC concrete. According to the past literature, only few research studies
were available in regard the sulphate resistance of geopolymer concrete. Bakharev et al.
[131] reported that the durability of the geopolymer concrete depends on the precursor
materials and the type of the sulphate solutions used in the accelerated testing methods.
The best performance was obtained for the concrete prepared using sodium hydroxide
and in the solution of 5% sodium sulphate+5% magnesium sulphate. In addition,
geopolymer concrete also displayed superior durability performance compared to OPC
concrete in sulphuric acid solution under accelerated testing method [132, 133]. Ismail et
al. [128] observed the microstructural changes of alkali-activated fly ash/ slag based
geopolymer paste under Na2SO4 and MgSO4 exposed conditions. They have reported
that the reaction between Na2SO4 and geopolymer binder varies from the reaction
between MgSO4 and geopolymer binder. The degradation of geopolymer paste in
MgSO4 is severe than in Na2SO4 solution, which is similar to OPC concrete performance
under sulphate environment. Under MgSO4 exposed environment, decalcification of the
Ca-rich gel phases in the blended fly ash/slag geopolymer binder due to the Mg ion,
which promotes more degradation of the geopolymer binder and formation of gypsum.
Despite that, the Na2SO4 solution was not degraded the geopolymer binder, and no
components with the presence of sulphate have been identified in geopolymer system.
Moreover, Škvára et al. [134] also determined that the heat cured low Ca fly ash based
geopolymer mortar consists higher sulphate resistance under MgSO4 and NaCl media.
Fig. 2-10 display the geopolymer mortar specimens after exposed to NaCl and MgSO4
solution for 1.5 years. As shown in Fig. 2-10, no significant changes, surface
deterioration, cracking or spalling have been identified after the exposure. In addition,
they found that the compressive strength values of geopolymer samples were not
changed after exposure to the sulphate solution.
Page 59
Chapter 2 Literature review
37
Fig. 2-10 Geopolymer mortar after the 1.5-year exposure to the solutions of NaCl and
MgSO4 salts [134].
However, it should be noted here that the concentration of sulphate solution used in the
accelerated testing method should differ from the actual concentration of the sulphate
ion in the groundwater and soil. Therefore, the investigation of sulphate attack of
geopolymer in a field environment is an appropriate way to determine the sulphate
resistance of geopolymer concrete. Moreover, the porosity of the concrete is the main
parameter that controls the rate of penetration of the chloride ions, sulphate ions and
CO2 into concrete. Therefore, the concrete with less porosity is beneficial to resist
chloride, sulphate ingress [118] and carbonation.
2.7 Porosity and pore structure of geopolymer concrete
It is well known that the concrete durability depends on the porosity, the pore structure
and pore connectivity of the concrete. The pore structure of the concrete controls the
transportation of gasses, water and aggressive agents to the concrete surface, especially
the pore volume, pore size distribution, connectivity and shape of the pores [135]. It
should be noted that the pore structure of the geopolymer concrete differs from the OPC
concrete due to distinct reactions between the different sources of materials. The pore
size and microstructure characteristic of geopolymer binders depend on the physical and
chemical characteristics of source materials and the type and characteristic of the alkaline
solution [136]. Ryu et al. [42] determined that the number of smaller pore sizes in fly ash
based geopolymer increased with the high molarity of the alkaline solution. Nazari et al.
[137] proposed that the total pore volume depends on the particle size distribution of the
Page 60
Chapter 2 Literature review
38
fly ash, the time of oven curing and the time of room curing methods. They found that
the pore volume is reduced with the finer size of fly ash particles and which is resulted
in the dense surface for fly ash based geopolymer concrete. Ma et al. [138] proposed that
the pore developments in alkali-activated fly ash are slower than cement paste, and the
heat curing method is helped to develop the pore system quicker than the normal
ambient curing method. They have also mentioned that using of high alkali content is
reduced the total porosity and enhance a finer pore system development.
Table 2-2 showed the classification of pore sizes according to the International Union of
Pure and Applied Chemistry (IUPAC) system [139]. As per that the pores are categorised
with the range of pore sizes. The pore sizes with less than 1.25 nm are classified as
microspores, and the pore size range between 1.25-25 nm is considered as Mesopores.
Macropores is measured with the pore size ranges in between 25-5000 nm, the pore size
range in between 5000-50000 nm is corresponding to entrained air voids, entrapped air
voids, and pre-existing microcracks in concrete. In OPC concrete, capillary pores include
both mesopores and macropores constitute the water-filled space existing between the
cement particles, while calcium- silicate- hydrate gel component creates micropores in
the Portland cement concrete.
Table 2-2 IUPAC pore size classification [139]
Pore description Pore size (radius) (nm)
Micropores <1.25
Mesopores 1.25-25
Macropores 25-5000
Entrained air voids, entrapped air
voids, pre-existing micro cracks
5000-50000
Collins et al. [140] determined the pore size distributions of alkali activated slag paste by
using MIP analysis. Cumulative pore size distribution of OPC (OPCP) and slag based
geopolymer (AASP) is provided in Fig. 2-12 [140]. The water to binder ratio of the
geopolymer system was 0.5. The results showed that the slag based geopolymer samples
Page 61
Chapter 2 Literature review
39
has a finer pore size distribution than OPC sample. The higher proportion of pore sizes
of geopolymer samples in the range of mesopore limits ( 1.25–25 nm) [139].
Fig. 2-11 Cumulative pore size distribution of geopolymer and OPC concrete [140]
Moreover, Duxson et al. [141] determined that the Si/Al ratio in the geopolymer system
also influences on the pore structure of the geopolymer. They found that the
microstructure of geopolymer mix with Si/Al ratio ≤1.40 consists clustered dense
particulates with large interconnected pores, while the mix with Si/Al ≥1.65 shows
homogenous with porosity distributed in small pores. In between that two range (1.4 <
Si/Al < 1.65) displays the development of the microstructure with increasing silicon
content is rapid yet continuous within the small compositional region. As observed from
Fig. 2-12, the pore volume is decreased with the increment of Si/Al ratio.
Page 62
Chapter 2 Literature review
40
Fig. 2-12 Pore volume distributions of geopolymer paste [141]
Moreover, it was reported that the substitution fly ash in slag based geopolymer mix
leads higher porosity compared to slag based geopolymer mix [142]. The water to binder
ratio (w/b) of geopolymer system was 0.40 As shown in Fig. 2-13, 100% slag based
geopolymer mix exhibits lower porosity compared to slag-fly ash based geopolymer and
100% fly ash based geopolymer. This is due to the different reaction products in between
those types of geopolymer systems. In geopolymer with slag rich systems, C-(A)-S-H gel
is the primary reaction component, which is significant bound water content, whereas
fly ash based geopolymer system produces N-A-S-(H) gel, with a lower bound water
content [143]. Therefore, the presence of more bound water provides more pore-filling
capacity and that reduces the porosity in slag based geopolymer system. Furthermore,
the Fig. 2-13 also showed that the porosity decreased with the time of curing. Zhu et al.
[19] also confirmed that the substitution of fly ash by the slag content reduces the pore
size and total porosity of the geopolymer system.
On the other hand, it was also determined that slag based geopolymer concrete exhibits
higher porosity compared to OPC concrete. Al- Otaibi et al. [144] stated that the porosity
values of slag-based geopolymer concrete are greater than OPC concrete.
Page 63
Chapter 2 Literature review
41
Fig. 2-13 Relationship between porosity and curing duration for fly ash-slag geopolymer
systems [142]
2.8 Corrosion of reinforcement
Corrosion of reinforcement is an important problem in the concrete structures. Usually,
the reinforcement bar in concrete is protected by a thin and stable oxide layer, which is
called a “passive film” [145]. This passive layer is started to form as soon as the initiation
of the hydration reaction in cement due to the pH value of the concrete rises and then
this layer is become stabilised in the first week period to protect the reinforcement from
active corrosion [146]. Then, the passive layer remains around the reinforcement bar and
protect against corrosion under the high pH environments for the service life period of
the structures [146]. The thickness of the passive film would be in the order of 5 nm.
However, in the field exposed environment conditions, several factors contribute to the
deterioration of this passive layer. Among that, carbonation and chloride diffusion are
two important causes for the deterioration of this oxide layer when the concrete exposed
to the field environment. Ingress of chloride ions at the reinforcement bar level reduces
the pH at that point to the lower value. The corrosion at reinforcement bar will initiate
when the sufficient amount of chloride penetrates at the reinforcement bar level [147].
Penetration of chloride ions activate the surface of the steel to form an anode, and the
Page 64
Chapter 2 Literature review
42
passivated layer becomes cathode [124]. As the results of this electrochemical reaction,
the passive layer will break down and causes that the reinforcement bar will start to
corrode.
Carbonation is also another important factor for the corrosion of reinforcement in
concrete. As explained earlier, the pH level is maintained at a higher level in OPC
concrete by the hydration reaction components such as Ca(OH)2 and C-S-H gel and [108].
The ingress of CO2 reacts with the hydration reaction products in cement concrete, and
this reduces the pH value of OPC concrete. When the carbonation depth reaches to the
reinforcement bar level (that means CO2 diffusion at the reinforcement bar level), pH
level at that point will drop to the value of 9. Therefore, this will de-passivate the
protective layer and this causes; corrosion will initiate at the embedded reinforcement
bar in concrete.
Even though the corrosion activity is important for the durability of concrete structures,
only a few studies have been conducted on corrosion activity of the rebar exposed in
geopolymer concrete. Most of the previous studies revealed that the reinforcement bars
exposed in the fly ash based geopolymer concrete are less susceptible to corrosion effect
under chloride-exposed environment. Kupwade-Patil et al. [121] examined the corrosion
of reinforcement bar in fly ash based geopolymer concrete under chloride solution for
12 months and determined that only micro level of corrosion products at the matrix-
rebar interface of geopolymer concrete specimens, whereas the matrix-rebar interface of
OPC concrete exhibited multiple gross corrosion products. Moreover, Reddy et al. [115]
also reported that there is no corrosion effect in the reinforcement bar embedded in the
geopolymer concrete, whereas reinforcement bar in OPC concrete exhibited severe
corrosion damage after exposed to seawater solution. Fig. 2-14 shows the corrosion of
reinforcement bar in geopolymer and OPC concrete after the exposure condition. They
have used an accelerated laboratory electrochemical method to induce the corrosion in
the reinforcement bar. Shaikh et al. [122] stated that the fly ash based geopolymer
concrete had superior resistance to corrosion compared to OPC concrete in chloride
solution. More recently, Babaee et al. [148] reported that the test results of corrosion
potential and polarisation resistance after de-passivation of the reinforcements indicated
that the risk of corrosion in fly ash based geopolymer concrete is similar to Portland
cement concrete under chloride environment. Miranda et al. [149] reported that the steel
bar embedded in fly ash based geopolymer mix containing 2% chloride does not have a
Page 65
Chapter 2 Literature review
43
protective passive layer which displays similar corrosion behaviour to OPC concrete.
Furthermore, Saraswathy et al. [150] also studied the corrosion resistance of fly ash based
geopolymer concrete in a chloride environment. According to their study, it was stated
that the corrosion resistance of reinforcement bar in fly ash based geopolymer concrete
is comparable with corrosion in OPC concrete at the same time of exposed condition.
Moreover, it was also reported in recently, fly ash based geopolymer concrete exhibited
more protection against corrosion compared to Portland cement concrete [151]
Fig. 2-14 Corrosion of reinforcement bar in (a) fly ash based geopolymer concrete, (b)
OPC concrete [115]
All studies mentioned above are confirmed that the risk of corrosion of reinforcement in
fly ash based geopolymer concrete is lower than OPC concrete in a chloride
environment. However, in contrast with above studies, Olivia et al. [119] reported that
the risk of corrosion in fly ash based geopolymer concrete is high compared to OPC
concrete. They have conducted the corrosion study on the concrete samples immersed
in chloride solution by using half-cell potential (HCP) method.
Considering the corrosion activity of reinforcement bar in slag based geopolymer
concrete, Malolepszy et al. [152] studied the corrosion activity of embedded
reinforcement bar in OPC mortar and alkali-activated slag mortar, and they found that
no difference between the two type of systems up to 336 days. However, they suggested
that the long-term studies should be required to determine whether the corrosion
Page 66
Chapter 2 Literature review
44
activity would maintain as same as the initial stage. More recently, Zainal et al. [153]
observed that the corrosion resistance of fly ash-slag blended geopolymer binder
displayed higher corrosion resistance compared to fly ash based geopolymer binder
systems in a chloride environment. Tennakoon et al. [29] also examined the corrosion
behaviour of fly ash- slag blended geopolymer concrete and compared with OPC
concrete after exposed to NaCl solution for 500 days. According to their report, the
embedded reinforcement bar in geopolymer concrete did not corrode , whereas the
reinforcement bar in OPC concrete was started to corrode after 500 days of exposure.
They mentioned that the protection against corrosion in geopolymer concrete is
provided by the oxygen around the reinforcement in the presence of slag in the binder.
In addition, they also have reported that the electrochemical measurements of
geopolymer concrete are not correlated with the corrosion activity as higher expected
corrosion risk was observed in both types of concrete. However, corrosion activity was
found in the OPC concrete rebar only, and no corrosion product was observed in the
geopolymer concrete rebar.
Therefore, the all above studies investigated the corrosion resistance of geopolymer
concrete exposed in chloride environment only. However, corrosion of reinforcement
bar is induced by the carbonation reaction too. Nevertheless, only one research study
available related to the corrosion of reinforcement bar with carbonation of geopolymer
concrete. Badar et al. [90] investigated the corrosion of steel bars induced by accelerated
carbonation (5% of CO2) in low calcium and high calcium fly ash geopolymer concretes.
They have reported that the low calcium fly ash based geopolymer concrete had a lower
risk of corrosion compared to high calcium fly ash based geopolymer concrete. As shown
in Fig. 2-15, corrosion products have been identified in high calcium fly ash based
geopolymer concrete interface, whereas no sign of corrosion has been observed in low
calcium fly ash based geopolymer. The reinforcement bar obtained from the geopolymer
concrete samples were shown in Fig. 2-16. According to that, the steel bar from high
calcium fly ash based geopolymer was corroded, whereas no sign of corrosion was
observed on the steel bar from low Ca fly ash based geopolymer samples. However,
further studies are required to investigate more about the corrosion resistance of
geopolymer concrete under CO2 environment. Since the accelerated carbonation test
with a higher concentration of CO2 is not suitable for geopolymer [28], corrosion study
Page 67
Chapter 2 Literature review
45
of geopolymer concrete also needs to be revised according to the appropriate
carbonation, and chloride test methods.
Fig. 2-15 Photographs of geopolymer concretes/ steel interfaces (A), (B) low Ca fly ash
based geopolymer (C) high Ca fly ash based geopolymer after 450 days of accelerated
carbonation. [90]
Fig. 2-16 Photographs of steel rebar in (A) high-Ca fly ash (B), (C) and low-Ca fly ash
based geopolymer after 450 days of accelerated carbonation. [90]
Page 68
Chapter 2 Literature review
46
2.9 Studies related to durability of geopolymer concrete structures in
field environments
Although many research papers have been published related to the durability evaluation
of geopolymer concrete, those studies have been conducted by an accelerated testing
method on freshly prepared concrete specimens. Besides that, contradict conclusions
were obtained regarding the durability of geopolymer concrete. Therefore, this indicated
that the accelerated testing methods are not suitable to predict the durability properties
of the geopolymer concrete and determining the durability of geopolymer in a real field
environment is more appropriate way compared to accelerated testing methods.
However, the past literature studies indicated that only limited research studies have
been carried out on the geopolymer concrete specimens that are exposed to real field
environment conditions.
In regarding with carbonation of geopolymer concrete, only few research studies are
available for geopolymer concrete exposed in a field environment. This is because the
carbonation rate in the natural exposed condition is very slow compared to accelerated
carbonation testing method. Therefore, more time required to determine the carbonation
of concrete. Bernal et al. [154] investigated the carbonation depth of slag based
geopolymer concrete exposed to real field environment for seven years. They have found
that the carbonation depth values are influenced by the activator and the slag contents.
They have also reported that the carbonation depth of field exposed slag based
geopolymer concrete is less than the test results obtained from accelerated carbonation
testing methods. In addition, seven years old slag based geopolymer concrete displayed
high dense interfacial transition zone and three types of binding gel such as C-A-S-H
and two types of (C, N)-A-S-H binding gels [155]. Therefore, slag based geopolymer
concrete revealed better long-term durable performance without any degradation of
concrete. Furthermore, Nedeljković et al. [156] studied the natural carbonation depth of
alkali-activated pastes after exposed to laboratory ambient environment for 12 months
periods. They have prepared the different geopolymer mixes with a different proportion
of fly ash and slag contents into the mix. The results indicated that the carbonation is
more susceptible to 100% fly ash mix and the carbonation depth is reduced with an
increment of slag component in the mix. Moreover, Cheema et al. [18] found that the fly
ash based geopolymer concrete is more vulnerable to carbonation compared to OPC
concrete in the field environment.
Page 69
Chapter 2 Literature review
47
Moreover, Shayan et al. [157] conducted the experimental analysis on the core specimens
extracted from the different locations of slag based geopolymer concrete retaining walls
and conducted the compressive strength test and volume of the permeable void test on
the core samples. They have also monitored the corrosion rate of reinforcement bar for
three years by using half-cell potential measurements. Fig.2-17 explains the half-cell
potential measurements at various location of the reinforcement bar in the geopolymer
concrete structure. As shown in half-cell potential measurements, the risk of corrosion is
identified as low. In addition, they have reported that the geopolymer concrete core
specimens had the higher compressive strength. However, they have found the high
VPV values for geopolymer concrete core specimens.
Fig. 2-17 Half-cell potential measurement with age of concrete in real field environment
[157]
Considering the chloride penetration, laboratory studies demonstrated that the fly ash
based geopolymer concrete exhibits lower chloride diffusion and less corrosion effect of
the steel bar compared to OPC concrete [25, 121, 122]. However, as mentioned earlier,
the chloride penetration of OPC concrete reduces with the age of concrete due to the
continuous hydration reaction in OPC concrete with time after the casting of structures.
However, geopolymerisation reaction in heat cured fly ash based geopolymer concrete
is very rapid with little or no further reaction after a few days of curing. Therefore, the
ingress of chloride ions in fly ash based geopolymer concrete could potentially be higher
than OPC concrete after some years of exposure [21]. Compared to laboratory prepared
geopolymer concrete, only a few limited studies available on the durability evaluation
Page 70
Chapter 2 Literature review
48
of geopolymer concrete exposed in a real chloride environment. Chindaprasirt et al. [23]
investigated the effect of the sodium hydroxide concentration of fly ash based
geopolymer concrete on chloride penetration and steel corrosion after three years of
exposure in the marine environment. They have reported that the concentration of
NaOH is influenced on the chloride diffusion to the geopolymer concrete. Chloride
penetration and the chloride diffusion coefficient decreased with increased NaOH
concentrations due to the increment of the geopolymer reaction rate by higher NaOH
concentration. However, they have not compared geopolymer concrete with OPC
concrete. In addition to that Zhu et al. [19] reported that the fly ash based geopolymer
paste and mortar mixes are more susceptible to chloride diffusion compared to OPC
paste and mortar mixes under non-saturated conditions.
Furthermore, Cheema et al. [18] determined the chloride diffusion of fly ash based
geopolymer concrete exposed to the saline environment for three years period. As
mentioned in their investigation, the chloride ion ingress into geopolymer concrete is
higher than OPC concrete, and geopolymer concrete displayed higher chloride diffusion
coefficient compared to OPC concrete.
Concerning the sulphate resistance of geopolymer under the field condition, only one
investigation was carried out so far. El-Didamony et al. [158] conducted the experimental
analysis to determine the durability of alkali-activated slag pastes immersed in the sea
water and reported that the geopolymer had good durability under sea water
environment. However, they have measured the compressive strength values after
immersed in seawater and there is no information provided about the amount of
sulphate content in geopolymer specimens after the seawater exposure.
2.10 Current application of geopolymer concrete in the construction
field
The application of geopolymer binder in building and civil infrastructure has begun
worldwide [159]. It should be noted that the geopolymer is not a new material in the
application of civil infrastructures. The evidences are shown that the usage of
geopolymer materials has been started about many decades ago. In very early stages,
geopolymer materials were used in Roman architecture to build an ancient Cister
concrete wall, Israeli Roliea Spa ancient baths and other elements [160]. After that, some
evidence available for the application of geopolymer materials in the mid-decade. In the
Page 71
Chapter 2 Literature review
49
1980s, geopolymer materials have been used in France during the tile production [161].
Furthermore, high rise buildings with more than 20 storeys also built by using alkali-
activated slag based geopolymer concrete in Lipetsk, Russia between the period of 1986
and 1994 [34, 159]. All the building elements were cast with slag based geopolymer
concrete. The exterior walls were cast by in-situ mix, and the floor slabs, staircases and
other structural components were prepared with the pre-cast concrete method. It has
also been reported that the geopolymer concrete was used to prepare commercial scale
products in recent years. Geopolymer concrete also used to prepare the concrete
pavements and roads in Russia and Ukraine. These all geopolymer concrete were
prepared with the activation of slag materials. Geopolymer concrete was also used to
prepare reinforced concrete sewer pipes, railway sleepers and wall panels [162].
In recently, Australia has been started to use geopolymer concrete for many civil
infrastructures in the construction field. In recent times, a building was constructed with
geopolymer precast floor panels for the Global Change Institute at University of
Queensland, Australia [163] and this believed to be a world first use of suspended
modern geopolymer concrete in the building industry. The span of the precast floor
panels was 11 m, and the building contains 33 geopolymer precast floor panels. The
geopolymer concrete was prepared with the combination of fly ash and slag materials,
and the structural performance of geopolymer concrete was checked according to
Australian standards AS 3600. Fig. 2-18 shows the casting and installation procedures of
geopolymer precast beams.
In addition to that geopolymer concrete was also used in the airport construction in
Toowoomba, Queensland, Australia [164]. This is the first green-field public airport in
worldwide, and the geopolymer concrete was used to construct the heavy-duty
pavements in the aircraft turning node and apron areas. The geopolymer concrete was
prepared with the combination of fly ash and slag materials. The concrete was prepared
in a twin mobile wet mix batch plant and supplied to the site by tipper trucks. Curing of
the concrete was carried out in two stages. Initially, a water-based hydrocarbon resin-
curing compound was applied, and then the concrete was covered with a geotextile to
protect against any thermal shock. Moreover, geopolymer concrete was also used in
many other construction applications in Melbourne, Australia such as road pavements,
retaining walls, driveways, footpaths and house-slabs. Fig. 2-19 (a) shows the footpath
built with geopolymer concrete in Westgate Freeway extension Port Melbourne,
Page 72
Chapter 2 Literature review
50
Australia and the geopolymer concrete precast panels across Salmon Street Bridge, Port
Melbourne, Australia are presented in Fig. 2-19 (b). Although geopolymer concrete
construction has been begun so far, the application is very low compared to OPC
concrete construction. According to the survey conducted form representatives of the
concrete and affiliated industries within Australia, there are many barriers that affect the
wide spreading of geopolymer concrete in the construction field. Among that the lack of
guidelines, lack of standards, lack of long-term durability data (particularly field
performance) and supply chain, availability issues are considered as more important
barriers for geopolymer concrete [165]. Therefore, overcoming from those barriers will
enhance the usage of geopolymer concrete, and due to this, the CO2 emission will be
significantly reduced in future.
Fig. 2-18 (a) casting of the precast beam, (b) installation of precast geopolymer beams
[163]
Page 73
Chapter 2 Literature review
51
Fig. 2-19 (a) geopolymer concrete footpath (25 MPa) along Westgate Freeway extension
Port Melbourne, Australia, (b) 55 MPa precast panels across Salmon Street bridge, Port
Melbourne, Australia [166].
2.11 Motivation for the study
According to the detailed literature review discussed so far, it is clearly identified that
the application of geopolymer concrete in construction field is an effective way to reduce
the CO2 emission to the environment. The research studies have been conducted on
geopolymer materials in the past few decades. Recently, the commercial application of
geopolymer technology in the construction industry is also being started around the
world. However, the development of geopolymer materials application is very low due
to many technical challenges. The durability of geopolymer concrete in field condition
is one of the primary concerns to reduce the widespread of geopolymer concrete
application, and that needs to be clearly determined to minimise the barrier to the
geopolymer usage.
Based on the durability studies of geopolymer concrete discussed above, it is clear that
the durability behaviour of geopolymer concrete determined from accelerated testing
methods is providing contradict results about the durability of geopolymer materials.
Some of the studies displayed positive response for geopolymer concrete, and some
other studies reported negative responses for geopolymer concrete usage. In addition to
that, the factors controlling the durability of concrete is limited in the laboratory
environments. When the concrete structures are exposed in the real field environment,
it should face several deterioration factors at the same time. However, to produce that
same exposure condition in the accelerated testing method is very difficult and
impossible. Therefore, it is important that to determine the durability of geopolymer
concrete exposed in real field conditions. In addition, the past research studies proved
that only limited studies are available to determine the durability aspects in the actual
environmental conditions. Therefore, based on that, this research study was conducted
to determine the long-term durability of geopolymer concrete in the actual field
environment conditions.
It should be noted that the durability of the concrete structure exposed in the
atmospheric environment primarily affects by the CO2 diffusion from atmospheric
environment. The ingress of CO2 is mainly deteriorated the concrete structures in
Page 74
Chapter 2 Literature review
52
atmospheric conditions. Therefore, carbonation of geopolymer concrete exposed in the
atmospheric environment for the long-term period will be investigated in this current
study. In addition, the past research works shown that the durability of geopolymer
concrete depends on many factors including the source of materials used to prepare the
geopolymer binders. Among the various source of materials fly ash and slag are two
leading sources, which have been widely used in geopolymer production. Therefore,
geopolymer concrete prepared with fly ash, slag or blended of fly ash and slag mixes
should behave in different ways, when they exposed to the field environment. Thus, it
is necessary to determine the durability behaviour of various types of geopolymer
concrete, and that will provide a better understanding of the durability aspects.
Therefore, in the present study, the durability of geopolymer concrete structures
prepared with fly ash based geopolymer mix and fly ash and slag blended geopolymer
mixes exposed in atmospheric environment condition will be investigated. The
investigation will be conducted by taking the core specimens from the concrete
structures, and the durability of geopolymer concrete will be compared with OPC
concrete from the same exposed environment. The test results obtained from this
investigation are provided in Chapter 3.
When we considered the durability of geopolymer in an aggressive environment,
carbonation is not only the factor influenced on the durability. In aggressive condition
such as marine and saline environment, chloride and sulphate diffusions are also mainly
affected the durability in addition to the carbonation reaction. Therefore, due to this
reason, durability behaviour of concrete structures exposed in the aggressive
environment should be varied from the durability of atmospheric exposed concrete
structures. Therefore, it is necessary to determine the durability of geopolymer materials
in aggressive environment for the commercial enhancement of geopolymer concrete in
the marine or saline exposed conditions. The combined effect of carbonation, chloride
diffusion and the sulphate attack on the geopolymer concrete will be investigated as part
of this research study. As explained in the above paragraph, different types of
geopolymer concrete mix included in this investigation too. The durability of fly ash
based geopolymer concrete and slag, fly ash blended geopolymer concrete exposed in
the aggressive environment will be evaluated. The comparison also will be conducted
with the concrete prepared with Portland cement from the same exposed environment.
The test results of this study are presented in Chapter 4.
Page 75
Chapter 2 Literature review
53
Apart from the field investigations, laboratory-accelerating testing is required to validate
the test result obtained from field samples. In addition to that, there will be some
limitations presented to collect the information regarding the durability of concrete in
some cases from the samples collected from field investigation. Therefore, few
experimental tests will be carried out with the laboratory prepared samples. Alalki
leaching from the geopolymer binder will be studied after immersed of the speciemens
in de-ionised water. In addition, the strength loss of geopolymer in the accelerated
wetting-drying cyclic testing with water, chloride water and the combination of chloride
and sulphate solution will be studied with the laboratory prepared mortar specimens
and the effect of source materials on the strength loss of the mortar samples will be
evaluated. The experimental results from this investigation are provided in Chapter 5.
Corrosion of reinforcement bar is an essential parameter in the concrete building.
Therefore, corrosion of reinforcement in geopolymer concrete will be examined with the
concrete prepared with different proportions of fly ash and slag constituents. According
to this investigation, the influence of the source of geopolymer materials on the corrosion
of reinforcement bar in geopolymer concrete will be determined. The test results from
this relevant experimental method are presented in Chapter 6.
The coefficient of carbonation is key parameter to predict the carbonation behaviour of
the concrete. The CO2 diffusion of geopolymer concrete will be determined with the
mathematical models developed with the diffusion equation based on the Fick’s law and
the empirical equations. The analysis and the results from mathematical models were
presented in Chapter 7.
Page 76
Chapter 3 The durability of geopolymer
concrete exposed to the atmospheric
environment
3.1 Introduction
This chapter experimentally investigates the durability of geopolymer concrete exposed
to the atmospheric environment. The investigation was conducted on the core specimens
from geopolymer concrete structures exposed to the atmospheric environment for the 8-
year period. Three different types of geopolymer mix compositions, such as fly ash based
geopolymer concrete, and two different types of fly ash-slag blended geopolymer
concrete, were included in this analysis. As identified in the literature review of this
thesis, carbonation of concrete is an important parameter that mainly influences the
durability of concrete when exposed to the atmospheric environment. Therefore, this
study primarily focused on the investigation of carbonation rates in different
geopolymer concrete structures and compared with OPC concrete structure exposed to
the same environment. The pH variation along the depth of concrete and Fourier
Transform Infrared (FT-IR) were conducted to study the formation and variation of
carbonation products in concrete. Further, transport properties (apparent volume of
permeable voids (AVPV) and the sorptivity coefficient) and pore structure (using
mercury intrusion porosimetry (MIP) test) were also studied.
3.2 Field Description
3.2.1 Description of concrete structures
3.2.1.1 Fly ash-based geopolymer concrete & OPC concrete culverts in atmospheric
exposure condition.
Page 77
Chapter 3 The durability of geopolymer concrete exposed to the atmospheric
environment
55
The fly ash based geopolymer concrete (FGPC-A) and OPC (OPC-A) concrete structures
used for the durability assessment were constructed as box culvert structure in 2007 and
placed in Lake King, Western Australia. Western Australia has a temperate climate with
an average annual maximum temperature of 24.7°C and average annual rainfall of 727
mm. Fig. 3-1 shows the FGPC-A and OPC-A box culvert exposed to outdoor atmospheric
conditions. In 2015, core specimens were extracted from the concrete structures to
conduct an experimental assessment of its durability properties. The diameter of the
extracted core samples was 68 mm and 94 mm from vertical parts and top slab,
respectively. The manufacturing details of geopolymer concrete culvert have been
described in elsewhere [167]. The mix details of the concrete structures and the exposure
conditions are described in the following subsections
Fig. 3-1 (a) FGPC-A box culvert, (b) OPC-A concrete box culvert
3.2.1.2 Fly ash-slag blended geopolymer concrete in atmospheric exposure condition.
Durability behaviour of fly ash-slag blended geopolymer concrete exposed to the
atmospheric environment for eight years of periods was evaluated on two different
reinforced fly ash-slag blended geopolymer concrete slabs exposed to the ambient field
environment. Both slabs were cast in 2007 by Zeobond Pty Ltd and placed in
Campbellfield, Victoria, Australia. Campbellfield, Victoria has a mild temperate climate
with an average annual maximum temperature of 21 °C and average annual rainfall of
603 mm. The dimensions of the first slab (FSGPC-1) were 7.8 m × 4.07 m with the
thickness of 600 mm. The next slab, which was located adjacent to the FSGPC-1 slab, was
classified as FSGPC-2. The FSGPC-2 slab was submerged into the soil, and only the top
surface was exposed to the atmosphere. Two different GPC mixes were used to cast two
types of slabs. The thickness of the FSGPC-2 slab was 150 mm. Fig. 3-2 shows the
Page 78
Chapter 3 The durability of geopolymer concrete exposed to the atmospheric
environment
56
locations of the slabs exposed in outdoor conditions. The diameter of the extracted core
samples was 94 mm.
Fig. 3-2 Fly ash-slag blended geopolymer concrete structures in the atmospheric exposed
environment
3.2.2 Mix design of concrete structures
3.2.2.1 Mix details of fly ash-based geopolymer concrete & OPC concrete culverts in
atmospheric exposure condition.
For the preparation of FGPC-A and OPC-A, Class F fly ash from the Collie power station,
Western Australia and Cockburn general purpose cement respectively were used. The
mix design details of both types of concrete are provided in Table 1. Geopolymer binder
was prepared with the activation of fly ash precursor by commercial grade alkaline
activators of sodium silicate (Na2SiO3) and sodium hydroxide (NaOH). NaOH solution
was prepared with the molarity of 8 M by dissolving NaOH flakes (98% purity) in water.
The ratio of Na2SiO3 to NaOH was chosen as 2.5. To maintain the workability of the
geopolymer concrete mix, high range water reducing superplasticiser (naphthalene
sulphonate-based) was used. The FGPC-A was subjected to steam curing at 60°C for 24
hours, whereas, the OPC-A concrete culvert was cured at ambient temperature. The mix
design of GPC culvert undergone a trial and error process and the optimum mix design
Page 79
Chapter 3 The durability of geopolymer concrete exposed to the atmospheric
environment
57
(given in Table 3-1) has been derived with several trials. The GPC with similar mix
composition exhibited excellent mechanical properties of high compressive strength and
tensile strength [33]. This mix also showed lower shrinkage and low creep coefficient
values, and excellent resistance to sulphate attack during the accelerated laboratory
testing conditions [41]. After 1 year period, the creep coefficient and the shrinkage values
of the concrete were 0.6 and 100 micro strains, respectively. In addition to field extracted
specimens, laboratory specimens were prepared to check and compare the compressive
strength and permeable properties of aged concrete with early age concrete. The
compressive strength and water absorption values obtained for GPC concrete are 39MPa
and 4.7%, respectively [167].
Table 3-1 Mix compositions of concrete (kg/m3) [18, 167]
Materials Mass (kg/m3)
FGPC-A OPC-A
Coarse
Aggregates
14mm 554 920
10mm 702 300
Fine Sand 591 640
Fly Ash (Low Calcium ASTM Class F) 409 -
Cement 400
Sodium Silicate Solution (SiO2/Na2O =2) 102 -
Sodium Hydroxide Solution 41 (8 M) -
Superplasticiser (SP) 6 -
Water 22.5 170
3.2.2.2 Mix details of fly ash- slag blended geopolymer concrete slabs in atmospheric
exposure condition.
A combination of Bayswater type fly ash and ground granulated blast furnace slag
(GGBFS) were used as precursors to prepare geopolymer binders. The mix compositions
of both types of the slabs are provided in Table 3-2. FSGPC-1 geopolymer binder was
prepared with a blend of 75% of fly ash and 25% of GGBFS, and a combination of 70 %
of fly ash and 30 % GGBFS as precursors in FSGPC-2 concrete. A combination of 7 M (50
mol % Na cations and 50 mol % K cations) of sodium hydroxide (NaOH) and potassium
hydroxide (KOH) were used as hydroxide activator for both slabs. In addition, sodium
Page 80
Chapter 3 The durability of geopolymer concrete exposed to the atmospheric
environment
58
silicate (Na2SiO3) was added to activator combinations for the FSGPC-1 slab, which
consisted of 2.5% SiO2 relative to the binder content. A commercial-grade Na2SiO3 with
D grade (29.4% SiO2 and 14.7% Na2O by weight from PQ Australia) was used. The water
to binder ratio used to prepare activator combination was 0.25. However, to achieve
sufficient workability, extra water was added to maintain total water to binder ratio at
0.3.
Table 3-2 Mix composition details of fly ash-slag blended geopolymer concrete
Materials(kg/m3) Slab 1 (FSGPC-1) Slab 2 (FSGPC-2)
Total binder 400 400
Fly ash 300 280
GGBFS 100 120
Fine aggregate 630 630
Coarse aggregate 1150 1150
NaOH pellet 14 14
KOH pellet 19.6 19.6
Na2SiO3 solution 34.48 -
Water used to prepare activator 81.04 100.32
Extra water 20 20
3.3 Testing methods
3.3.1 Carbonation depth measurement
Carbonation depths of the core specimens were tested immediately after extracting from
the concrete structures. A 1% solution of phenolphthalein indicator was sprayed onto
the surface of the core specimens, and the depth of the carbonation was measured by
observing the colour change of phenolphthalein solution. Phenolphthalein is used as a
pH indicator which changes from purple to colourless when the pH value of the concrete
surface drops below 8.3 due to carbonation [168]. Non-carbonated concrete surfaces
remained with purple colour.
3.3.2 pH profile measurement
The variation of pH with the depth of concrete surface was determined according to the
water suspension method recommended by Räsänen et al. [169]. In this method,
Page 81
Chapter 3 The durability of geopolymer concrete exposed to the atmospheric
environment
59
powdered samples were first collected from the core specimens by drilling at various
depth intervals. The powdered samples from the core specimens of fly ash based
geopolymer concrete and OPC concrete structures were collected at 3 mm interval. For
the fly ash-slag blended concrete, samples were collected at 5 mm intervals from the
surface of the core specimens. Approximately 15 g of powdered samples were collected
for each depth interval.
The powdered sample was then mixed with distilled water with the weight proportion
of 2:3 and then the mixture was stirred for 15 min with a magnetic stirrer. The solution
was filtered using filter paper, and the pH value of the filtered solution was measured
with a pH electrode. The temperature of the solution was kept in the range between
20 ± 2 °C. The pH electrode used to determine the pH value of the solution was shown
in Fig. 3-3.
Fig. 3-3 Aqua pH meter
3.3.3 Water absorption (Ai) and apparent volume of permeable voids
(AVPV)
The permeable parameters of the concrete are of primary properties revealing the
durability of the concrete structures [170]. Concrete with less permeable can resist the
penetration of aggressive agents such as CO2, chloride, sulphate ions and other
aggressive agents. Therefore, determination of the permeability characteristics is
important to predict the durability of concrete. In this case, the AVPV measurement
Page 82
Chapter 3 The durability of geopolymer concrete exposed to the atmospheric
environment
60
could be an indicator which explains the pore structure of the concrete including, the
capillary pores and other void systems.
The determination of water absorption (Ai) and apparent volume of permeable voids
(AVPV) measurement was carried out according to Australian standard AS 1012.21
(1999) [171]. For this test, specimens were prepared by cutting the core specimens into
equal pieces with the thickness of 50 mm, and the average value of three slices was used.
Water absorption (Ai) values were calculated using oven dry weight and saturated
weight measurements. First, the specimens were kept in an oven at 105 ± 5 °C
temperature for 24 hr and then weighed to determine the oven dry weight (M1). Then,
the specimens were immersed in water for 24 hr, and the saturated weight of the samples
(M2) was measured. The Eqn (2) was used to calculate the water absorption (Ai) values
with the weight measurements of M1 and M2. In addition to the above readings, the
weight of the specimens was measured after boiling samples as well as the suspended
weight of the water to calculate the AVPV values. The boiled specimen weight (M3) was
determined by keeping the samples at 100°C for 5.5 hr, and the suspended weight of the
specimens (M4) was measured by holding a track in water. Eqn (3) was used to calculate
the AVPV values with above weight measurements. All weight measurements were
carried out using a balance with an accuracy of 0.01 g. Fig. 3-4 illustrates the
experimental arrangement to determine the oven-dried, saturated, boiled and
suspended the weight of the specimens.
𝐴(𝑖) =
𝑀2 − 𝑀1
𝑀1× 100%
(2)
𝐴𝑉𝑃𝑉 =
𝑀3 − 𝑀1
𝑀3 − 𝑀4× 100%
(3)
To compare the changes of AVPV values with age, fresh concrete specimens were
prepared in the laboratory, and the same tests were conducted at the age of 28-days. The
cylindrical (100 mm dia. x 200 mm height) concrete specimens were prepared with
similar mix compositions provided in Table 3-1 and Table 3-2. All the concrete cylinders
were cured with the corresponding curing methods that are used for the curing of the
field exposed concrete structures. After 28 days of curing, all the specimens were cut into
four pieces with 50 mm thickness. Thereafter, all specimens were included into the same
Page 83
Chapter 3 The durability of geopolymer concrete exposed to the atmospheric
environment
61
experimental procedures, which is described above to determine the Ai and AVPV
values.
Fig. 3-4 Water absorption and AVPV test: (a) oven dried samples, (b) water immersed
samples, (c) boiled samples, (d) suspended weight measurement of samples.
3.3.4 Sorptivity analysis
The sorptivity of aged concrete specimens were conducted according to ASTM C1585
[172], where, 50 mm thick concrete slices were considered. Core specimens from the field
exposed concrete structure were cut into 50 mm thick pieces. The pieces of 50 mm length
from the outside exposed surface and another disc was taken at the mid-depth level (50
mm to 100 mm) were included into the experimental analysis to evaluate the changes of
sorptivity parameters with increasing depth. In addition, 100 mm×200 mm size of
cylindrical specimens was prepared in the laboratory with the same mix composition of
field concretes and subjected to sorptivity analysis to study the sorptivity variation with
age. Cylindrical specimens were cut into 50 mm thick pieces, and the test was conducted
Page 84
Chapter 3 The durability of geopolymer concrete exposed to the atmospheric
environment
62
on the pieces from top part (50 mm length from the outside exposed surface) and mid-
depth level (50 mm to 100 mm).
Fig. 3-5 illustrates the schematic diagrams and the experimental arrangement of the
sorptivity test. All specimens were initially stored in an environmental chamber with
50°C temperature and 80% of relative humidity for three days of the period. Then the
side surface of the specimens was sealed by using an epoxy coating. The top surface,
which was not in contact with water, was covered with plastic film to prevent moisture
transportation through the specimens. Then, the specimens were placed in water-bath,
and the mass gain due to water absorption was measured at time intervals, as per
standard testing method. The water absorption value (I) was calculated using the change
of specimen weight after being placed in water (Mt) for certain duration (t) and the
surface area of the specimen that was exposed to water (a) by using the following
equation:
𝐼 =
𝑀𝑡
𝑎 × 𝑑
(4)
Where, d = the density of the water
Fig. 3-5 (a) schematic diagrams of the sorptivity test, (b) experimental arrangement of
the sorptivity test
3.3.5 Fourier Transform Infra-red (FT-IR) analysis
The Fourier Transform Infrared (FT-IR) analysis was conducted to identify the
carbonated and un-carbonated products of different concrete specimens. This is a
qualitative method to identify the effect of carbonation on bonding characteristics of
concrete. A Nicola thermostate FT-IR spectroscope (Fig. 3-6) was used to measure the
FT-IR spectra of concrete at depths. Powder samples were extracted from the concrete
Page 85
Chapter 3 The durability of geopolymer concrete exposed to the atmospheric
environment
63
specimens using a profile grinder and mixed with KBr to prepare pellets. The IR spectra
were recorded at 32 scans per sample collected from the range 4000 cm-1 to 525 cm-1 at 4
cm-1 resolutions.
Fig. 3-6 FT-IR spectroscope
3.3.6 Mercury intrusion porosimetry (MIP) test
Pore size distribution of the concrete was determined by using a Mercury intrusion
porosimetry (MIP) analysis. The test was conducted by using Autopore IV 9500 mercury
porosimeter (Fig. 3-7) with a peak pressure of 206 MPa. The sample preparation for MIP
test was conducted by collecting solid mortar particles (around 1 g) from the core
specimens at various depth level. Before starting the test, the samples were kept in an
oven at 80 °C for 24 hr to remove the moisture present in the samples. MIP
measurements were carried out using mercury with surface tension and the contact
angle of 0.48 N/m and 140 °C, respectively. The relationship between pressure and pore
diameter is expressed as follows:
𝑑 =
−4𝛾(𝑐𝑜𝑠𝜃)
𝑝
(5)
Where d is pore diameter, 𝛾 is the surface tension of mercury, ɵ is the contact angle
between the surface of the specimen and mercury, and p is the absolute intrusion
pressure.
Page 86
Chapter 3 The durability of geopolymer concrete exposed to the atmospheric
environment
64
Fig. 3-7 Mercury porosimeter
3.4 Test results and discussions
3.4.1 Carbonation resistance of geopolymer concrete
The phenolphthalein solution application identified carbonation depth of the core
specimens. The phenolphthalein solution (1% phenolphthalein in 70% ethanol) was
sprayed on the core surfaces, immediately after taken from the concrete structures. The
depth of the carbonation was measured with the colour change of phenolphthalein by
using the measuring tape. From the carbonation depth measurement (Xc), the coefficient
of carbonation (K) was predicted by the following empirical relationship:
𝑋𝑐 = 𝐾√𝑡 (6)
Where Xc is the measured carbonation depth (mm), t is the exposure period (year), and
K is the corresponding carbonation coefficient (mm/year0.5). This formula is based on
the square-root-t-law, which has been used previously by many researchers to determine
the carbonation behaviour of the concrete [173-175].
Page 87
Chapter 3 The durability of geopolymer concrete exposed to the atmospheric
environment
65
3.4.1.1 Carbonation resistance of fly ash based geopolymer concrete
Fig.3-8 shows the carbonation depth measurements of FGBC-A and OPC-A concrete
core specimens, which are extracted from the FGBC-A and OPC-A concrete culvert
structures exposed to the similar atmospheric environment for eight years. As shown in
Fig.3-8, the application of phenolphthalein solution resulted in the colour change to pink
in FGBC-A specimens. Therefore, this reveals that the clear carbonation depth
measurement is difficult by the phenolphthalein application method for fly ash based
geopolymer concrete. A similar observation has also been reported for fly ash based
geopolymer concrete by various researchers [25, 90, 111]. According to these studies, fly
ash based geopolymer concrete showed pink colour surface after the phenolphthalein
application. However, carbonation of fly ash based geopolymer concrete can be
classified into three different zones with the colour variation of phenolphthalein solution
such as fully carbonated zone (almost colourless), partially carbonated zone (light pink
colour) and un-carbonated zone (deep pink colour) [176]. Fig.3-8 also remarks such
classification of carbonation zones of both concrete core specimens. Accordingly, FGBC-
A exhibited 45 mm of the fully carbonated zone and 70 mm of the partially carbonated
zone after eight years of exposure. The carbonation depth measurements of OPC-A
concrete core specimens can be seen in Fig.3-8 (b), where an excellent response to
phenolphthalein indicator can be observed with the carbonation depths ranging
between 4-10 mm. This indicates carbonation resistance of fly bash based geopolymer
concrete was much less compared to OPC concrete in an ambient exposed environment.
The coefficient of carbonation (K), as measured from Eqn (6) indicates that the K value
for FGBC-A specimen was 15.9 mm/year0.5 and OPC-A concrete specimens was 1.06 to
3.54 mm/year0.5. It is worth to mentioning here that, for FGBC-A specimens, carbonation
depth measurement from fully carbonated zone was used to calculate the K value. This
illustrates that the rate of carbonation in fly ash based geopolymer concrete is much
higher than OPC concrete when exposed to the atmospheric environment and
significantly differs from laboratory carbonation measurements on fly ash based
geopolymer concrete. According to the accelerated carbonation testing methods
conducted previously, low Ca fly ash based geopolymer concrete displayed better
carbonation resistance compared to OPC and high Ca fly ash based geopolymer
concretes [90]. The carbonation rate observed for OPC-A concrete is comparable with
Page 88
Chapter 3 The durability of geopolymer concrete exposed to the atmospheric
environment
66
the previous carbonation results of normal OPC concrete exposed in field environment
[177].
Fig.3-8 Carbonation depth measurements of core specimens using a phenolphthalein
indicator (a) FGBC-A, (b) OPC-A concrete
3.4.1.2 Carbonation resistance of fly ash-slag blended geopolymer concrete
Carbonation resistance of fly ash- slag blended geopolymer concrete was evaluated with
two distinct types of geopolymer concretes (FSGPC-1 and FSGPC-2). Carbonation depth
measurements of both type concrete specimens are shown in Fig.3-9. It can be seen from
Fig.3-9 that the carbonation depth of FSGPC-1 concrete is much higher than the values
obtained from FSGPC-2 concrete. The carbonation depth values for the FSGPC-1 and
FSGPC-2 concrete were measured as 23.5–27.5 mm and 8–14 mm respectively, after the
exposure of atmospheric environment for eight years. Such significant variations in
carbonation depths could be attributed to either different geopolymer concrete mix
designs or the location of the coring in the slabs. Indeed, the core specimens were
extracted from the different surfaces such as the vertical surface for FSGPC-1 concrete
slab and the horizontal top surface of the FSGPC-2 concrete slab. The moisture content
of the concrete could be different at the vertical and horizontal surfaces that may affect
the CO2 diffusion. In addition, moisture variation would also be occurred between both
slabs due to exposure conditions. As discussed before, the FSGPC-2 concrete slab was
submerged into the soil, and only the top surface of the slab was exposed to the
atmosphere, whereas the FSGPC-1 concrete slab was entirely exposed to the atmospheric
environment.
Page 89
Chapter 3 The durability of geopolymer concrete exposed to the atmospheric
environment
67
Fig.3-9 Carbonation depth measurements of core specimens (a) & (b) FSGPC-1 specimen
before and after applying phenolphthalein, (c)&(d) FSGPC-2 specimen before and after
applying phenolphthalein
Carbonation resistance of fly ash-slag blended geopolymer concrete specimens is then
compared with previously published studies such as Castel et al. [177] and Ho and
Lewis [178]. In the first study, two OPC concrete beams were exposed to the ambient
environment for 13 years in South-West of France were considered [177]. On the other
hand, Ho and Lewis [178] considered 75 mm × 75 mm × 300 mm concrete samples
exposed to ambient exposure in Melbourne, Australia. The water to binder ratio used in
the mix was 0.55. The compressive strength of the OPC concrete measured by coring the
beams in French beams was 45 MPa and 56 MPa for 28 days and 13 years, respectively.
The carbonation depth values measured for these beams ranged from 7 to 13 mm. The
concrete specimens prepared by Ho and Lewis [178] were consisting of 20% fly ash as
supplementary cementitious material and showed the 28-day compressive strength of
46 MPa. The carbonation coefficients of one-year-old specimens were determined as
4.5 mm/y0.5 for north oriented vertical exposure and 3.0 mm/y0.5 for south inclined
Page 90
Chapter 3 The durability of geopolymer concrete exposed to the atmospheric
environment
68
exposure. The variation in the carbonation depths between north and south exposures
was reported as due to lower rainfall on the vertical surfaces.
The coefficient of carbonation (K) values of the concrete specimens of this study, as
calculated using the Eqn (6), are given in Table 3-3. From Table 3-3, the carbonation rate
of FSGPC-1 concrete was found higher than OPC concrete in the ambient exposure
conditions. whereas, the carbonation rate of FSGPC-2 concrete is comparable with OPC
and 20% fly ash concrete.
Table 3-3 K values obtained for the OPC concrete and the two geopolymer concretes (in
mm/yr0.5)
OPC Concrete
(mm/yr0.5)
20% fly ash
concrete (mm/yr0.5)
FSGPC-1
(mm/yr0.5)
FSGPC-2 (mm/yr0.5)
2.0 – 3.6 3.0 - 4.5 8.3 – 9.8 2.8– 5.0
3.4.1.3 Discussion of geopolymer concrete carbonation resistance
The above test results reveal that the carbonation resistance of geopolymer concrete is
lower than OPC concrete. Given the same exposure conditions, CO2 ingress into the OPC
concrete surface decreases with time due to the formation calcite (CaCO3) layer, a
product of carbonation reaction. During the carbonation in OPC concrete, CO2 dissolute
in the concrete pore fluid and this reacts with calcium from calcium hydroxide
(Ca(OH)2) and calcium silicate hydrate. This causes the formation of solid, dense, and
water-insoluble CaCO3 layer on the concrete surface, reducing the carbonation rate with
time.
On the other hand, the carbonation process in geopolymer concrete produces sodium
carbonate (Na2CO3) and potassium carbonate (K2CO3) components. Particularly, in fly
ash based geopolymer concrete, primary carbonation reaction products are Na2CO3 and
K2CO3 due to the reactions of NaOH and KOH with CO2 in the atmosphere [179]. These
carbonation products are highly soluble and can dissolve in the contact water when the
concrete is exposed to outdoor environment. Thus, the porosity of the concrete increases
and further increase the penetration of CO2 into concrete. The porosity and the pore size
distribution of the concrete specimens are discussed in the later part of this chapter.
Page 91
Chapter 3 The durability of geopolymer concrete exposed to the atmospheric
environment
69
While Bernal et al. [154] report that the fly ash-slag blended geopolymer concrete
produces CaCO3 as one of the carbonation reaction components, the amount of Ca in the
slag is low compared to Portland cement. Therefore, the formation of CaCO3 is also very
small, and this cannot assist in reducing the CO2 diffusion rate in fly ash- slag blended
geopolymer concrete. In addition, the formation of soluble carbonation components
such as Na2CO3 and K2CO3 also contributes to higher carbonation rate in fly ash- slag
blended geopolymer concrete.
Moreover, the selection of activator type in geopolymer concrete also significantly
influences the carbonation rate of fly ash-slag blended geopolymer concrete, as observed
from above experimental results. The incorporation of Na2SiO3 causes more carbonation
compared to the geopolymer concrete mix activated with NaOH solution only.
3.4.2 pH profile measurement
3.4.2.1 pH measurements of fly ash based geopolymer concrete
pH measurements have been conducted for core specimens (8 years old) extracted from
leg part of the culverts. Fig.3-10 shows the pH profile with increasing depth measured
from the external surface. As shown in Fig.3-10, the pH of FGPC-A does not vary
significantly with the depth; with the pH range from 9.92 to 10.41 from the exposure
surface to 30 mm depth level. The corresponding pH values for OPC-A concrete was
measured as 10.84 at a depth of 2.5 mm and 12.32 at the 30 mm depth respectively. In
addition, the pH value of the uncarbonated zone of the FGPC-A core specimen (120 mm
depth level from exposed surface) was measured as 10.5, revealing that the carbonation
does not have a significant effect on the pH of the fly ash based geopolymer concrete in
the atmospheric exposed environment. It must be underlined that the measured pH
values in this study for un-carbonated fly ash based geopolymer concrete is lower than
previously reported values [11, 111, 148]. The past research studies showed that the pH
of fresh geopolymer concrete is approximately 11.5 [11, 111, 148].
The difference in the pH measurements of both type of concrete can be explained as
follows. Considering the pH of concrete is directly related to pore solution occupied in
the open pores of concrete, OPC concrete contains a combination of Ca (OH)2 and C-S-
H gel. In contrast, the pH of fly ash based geopolymer concrete is influenced by the pH
value of the activator solution and the amount of residual activator that remains in
Page 92
Chapter 3 The durability of geopolymer concrete exposed to the atmospheric
environment
70
geopolymer binder. Therefore, the pH of the FGPC-A specimen is mainly controlled by
the NaOH [111]. Thus, the pH of the carbonated and un-carbonated geopolymer
concrete vary from OPC concrete pH range.
Furthermore, pH of the OPC concrete is generally reduced to a value of 9.0 with a
complete carbonation reaction. However, this study shows that the pH value of OPC-A
concrete core specimens at 5 mm depth level was 10.84 and this indicates that the OPC
concrete has not been entirely carbonated at this depth. It should be noted that the
carbonation depth of the OPC-A concrete core specimen, which is used for the pH
measurement test was 4 mm. However, the first pH measurement was taken up to 5 mm
depth level from the exposure surface. Therefore, this indicates pH measurements were
conducted not only in the carbonated zone, but also accumulated in the partially
carbonated zone. The partially carbonated zone consists non-saturated carbonation
products including Ca(OH)2 and calcium silicate hydrate [180], and hence, retained a
higher pH value. FT-IR analysis confirmed the presence of partially carbonated zone
after 4 mm depth level, and further discussion is presented in the upcoming section.
Fig.3-10 pH variation with depth of concrete from the exposed surface (8 years old)
3.4.2.2 pH measurements of fly ash-slag blended geopolymer concrete
Fig.3-11 depicts the changes of pH value against the depth of the concrete surface for
both types of fly ash–slag blended geopolymer concrete specimens. The pH of the
FSGPC-1 concrete ranges from about 10.07 at the surface to 11.25 at 50 mm depth, and
the corresponding pH variation in FSGPC-2 concrete was obtained as 9.68 to 11.38,
Page 93
Chapter 3 The durability of geopolymer concrete exposed to the atmospheric
environment
71
respectively. The carbonation front depths are also marked in Fig.3-11 for both type of
specimens. According to that, the pH values of the carbonated parts of both types of
concrete is less than 10.5, which is higher than the carbonated OPC concrete. It was
reported by Khan et al. [176], that the geopolymer concrete mix prepared with the high
amount of low calcium fly ash resulted in discoloured zones for the test method with
phenolphthalein indicator when pH is inferior to 10.5. Therefore, considering 10.5 as the
carbonation front, Fig.3-11 shows a good agreement between the pH profiles results and
the carbonation front obtained using the phenolphthalein indicator (23.5–27.5 mm for
FSGPC-1 concrete and 8–14 mm for FSGPC-2 concrete). Furthermore, it can be seen from
both types of specimens that the pH value of the carbonated geopolymer concrete
(produced with a higher amount of fly ash precursors) is higher than 10.
Fig.3-11 pH value versus depth in fly ash-slag blended geopolymer concrete from the
surface
3.4.3 Volume of permeable void test results
3.4.3.1 Volume of permeable void test results for fly ash based geopolymer concrete
The water absorption and apparent volume of permeable voids (AVPV) of the FGPC-A
and OPC-A concrete core specimens are shown in Table 3-4. To compare the aged
specimen’s results with fresh concrete, the test was conducted on the fresh concrete
specimens prepared with same mix compositions. The test results of fresh concrete
specimens are also presented in Table 3-4. As shown in Table 3-4, the variation of water
Page 94
Chapter 3 The durability of geopolymer concrete exposed to the atmospheric
environment
72
absorption values with the age of the concrete was minor, which is in the range of 4.9%
to 4.97% for the FGPC-A concrete specimens and 5.35% to 5.22% for the OPC-A concrete.
These lower water absorption values are indicating lower porosity of the concrete.
Moreover, the AVPV values of FGPC-A specimens are increasing with the age of the
concrete. For instance, the fresh FGPC-A specimens showed the AVPV of 11.4%,
whereas, eight years old specimen had a value of 12.27%. On the other hand, OPC-A
concrete specimen showed trivial changes with age. The AVPV values obtained for 28
days and 8 years old OPC concrete specimens were 12.25 and 12.5%, respectively.
According to VicRoads Specification Section 610 [181], the durability of the concrete
types can be classified based on the measured AVPV value of core specimens. As per
specification, the concrete with AVPV values less than 12% is classified as excellent
quality concrete, and the concrete with the values in the range of 12%-14% is considered
as good quality. This study shows that the values obtained for both types of concrete are
lower than 13% and therefore, the quality of the concrete is categorised as good quality
range after the age of 8-year.
Table 3-4 Water absorption and AVPV values
Specimens No Water absorption (%) AVPV (%)
FGPC-A 28 days 4.90 11.4
FGPC-A 8 years 4.97 12.27
OPC-A 28 days 5.35 12.25
OPC-A 8 years 5.22 12.5
3.4.3.2 Volume of permeable void test results for fly ash-slag blended geopolymer
concrete
Table 3-5 depicts the water absorption, and AVPV measurements of fly ash-slag blended
geopolymer concrete specimens at the age of 28 days and eight years. As similar to fly
ash based geopolymer concrete specimens, the changes of water absorption value with
age of fly ash-slag blended geopolymer concretes is small and negligible. FSGPC-1
concrete specimens showed a variation from 7.15% to 7.27% after eight years of
Page 95
Chapter 3 The durability of geopolymer concrete exposed to the atmospheric
environment
73
exposure, and the respective AVPV values for FSGPC-2 concrete varied from 6.02 to
6.39%. For these types of concrete, AVPV values were increased with age. The AVPV of
FSGPC-1 concrete is increased from 16.4% to 17.04% from 28 days to 8 years period, and
the AVPV of FSGPC-2 concrete is changed from 13.2% to 14.35% during the same period.
Furthermore, the water absorption and AVPV values of FSGPC-1 concrete are higher
than FSGPC-2 concrete specimens. This well correlates with the carbonation test results.
More precisely, FSGPC-1 type concrete displayed higher carbonation depth compared
to FSGPC-2 type concrete after 8 years of exposure.
Furthermore, according to the VIC roads classification Section 610 [181], concrete quality
of both types of fly ash-slag blended geopolymer concrete can also be identified. The
FSGPC-1 type geopolymer concrete is classified as marginal quality, and the FSGPC-2
concrete is classified as normal quality concrete.
Table 3-5 Water absorption and AVPV values
Specimens No Water absorption(Ai)% AVPV%
FSGPC-1 -28 days 7.15 16.4
FSGPC-1 -8 years 7.27 17.04
FSGPC-2 -28 days 6.02 13.2
FSGPC-2 -8 years 6.39 14.35
3.4.4 Sorptivity analysis test results
3.4.4.1 Sorptivity analysis of fly ash based geopolymer concrete
Fig.3-12 illustrates the sorptivity analysis results for fresh and eight-year aged concrete
specimens, as measured from the depth of water penetration with time. The rate of water
absorption of core specimens is compared with fresh concrete properties after 28 days of
curing. Here, ‘T’ and ‘M’ are denoted as top and middle part of the concrete specimens,
respectively. The test results indicated that the top part of the atmospheric exposed
geopolymer concrete specimens (FGPC-A, 08 years ‘T’) had the highest water absorption
Page 96
Chapter 3 The durability of geopolymer concrete exposed to the atmospheric
environment
74
rate and the top part of atmospheric exposed OPC concrete (OPC-A, 08 years ‘T’) had
the lowest rate. The comparison of mid part of concrete specimens indicates that the 8-
year-old FGPC-A specimens shows a lower sorption rate, while the mid part of the aged
OPC-A concrete ( OPC-A 08 years ‘M’) specimens showed a higher rate compared to
their top part, indicating that the porosity of the FGPC-A increased when it is exposed
to the field environment.
On the other hand, the change in water absorption rate between Top and Mid part of
fresh concrete (28 days) is very small, indicating that the exposure to the atmospheric
environment has a significant influence on the water absorption rate. The reduction of
water absorption at the top part of atmospheric exposed OPC concrete is the result of
carbonation reaction [85]. The pore structure and the interconnectivity of the pore
systems of the top surface of OPC concrete changes with the formation of CaCO3 and a
solid densified layer formed by the carbonation reaction. As a result, water absorption
rate of the top part of OPC concrete reduces with the age of the concrete. In contrast, the
porosity increment in FGPC-A is attributed by the formation of soluble carbonated
products such as Na2CO3 and K2CO3, which induce a higher water absorption rate for
carbonated FGPC-A concrete samples. To further examine the porosity and pore size
distribution of both concrete types, a Mercury Intrusion Porosimetry (MIP) test was
carried out on the concrete specimens. The discussion corresponding to the pore
distribution is provided in section 3.4.6.
Fig.3-12 Sorptivity curves of FGPC-A and OPC-A concretes
Page 97
Chapter 3 The durability of geopolymer concrete exposed to the atmospheric
environment
75
It is important to note that the AVPV values of FGPC- A are very close to that of OPC-A
concrete, whereas, FGPC-A had greater capillary sorption parameters compared to OPC-
A concrete sorption values. This is because the capillary sorption is related to total
porosity, tortuosity and the size of the pore network [24], while AVPV is associated with
open porosity values only. Here, the lower sorptivity coefficient of OPC-A concrete is
associated with the formation of a more densified pore structure, resulting in a more
tortuous network and reduced pore size. Therefore, measuring the sorptivity parameters
of the concrete specimens is an accurate method to predict the durability behaviour of
the concrete.
The initial rate of water absorption (mm/s1/2) determined from the slope of the line that
is the best fit to water absorption (I) plotted against the square root of time (s1/2), are
reported in Table 3-6. These results indicated that the FGPC- A concrete specimens are
showing higher sorptivity coefficient compared to OPC-A concrete specimens.
Therefore, concretes prepared with a cement binder exhibits excellent resistance to
incursive agents and are highly durable in field environment compared to fly ash based
geopolymer concrete.
Table 3-6 Initial rate of water absorption of FGPC- A and OPC-A concretes
Sample Type The initial rate of water absorption S1 (mm/s1/2)
Top part specimen Mid Part specimen
FGPC- A 28 days 0.0157 0.0127
FGPC- A 08 years 0.0242 0.0122
OPC-A 28 days 0.0102 0.0087
OPC-A 08 years 0.0017 0.0052
3.4.4.2 Sorptivity analysis of fly ash-slag blended geopolymer concrete
Fig.3-13 shows the sorptivity curves of both types of fly ash – slag blended geopolymer
concrete specimens. As similar to the previous section, the rate of water absorption of
core specimens are compared with fresh concrete properties after 28 days of curing.
Here, ‘T’ and ‘M’ denotes the top and middle part of the concrete specimens,
respectively. As similar to the observation made in section 3.4.3 for the volume of
permeable void test results, the sorptivity parameter of FSGPC-1 concrete was higher
Page 98
Chapter 3 The durability of geopolymer concrete exposed to the atmospheric
environment
76
than the FSGPC-2 concrete. That is, the FSGPC-2 concrete contains less porosity with
denser structure compared to FSGPC-1. This was further ensured by conducting pore
size distribution analysis.
It was further noted from Fig.3-13 that the water absorption of top part of aged core
specimens is greater than mid part of core specimens. As explained earlier, this is due to
the carbonation reaction in an atmospheric environment. Although the rate of water
absorption of FSGPC-1 and FSGPC-1 are increased with age, the increment is lesser than
the increment obtained for fly ash based geopolymer concrete. According to the previous
section, sorptivity parameters of fly ash based geopolymer concrete in the atmospheric
environment is increased at a higher rate with the exposure period. Initial sorptivity rate
calculated from water absorption plot is provided in Table 3-7. These results indicated
that FSGPC-1 concrete samples depict higher sorptivity coefficient values compared to
FSGPC-2 concrete specimens. These results are well correlated with the carbonation test
results.
Fig.3-13 Sorptivity curves of fly ash- slag blended geopolymer concretes
Page 99
Chapter 3 The durability of geopolymer concrete exposed to the atmospheric
environment
77
Table 3-7 Initial rate of water absorption of FGPC- A and OPC-A concretes
Sample Type The initial rate of water absorption S1 (mm/s1/2)
Top part specimen Mid Part specimen
FSGPC- 1 28 days 0.01238 0.0119
FSGPC- 1 08 years 0.0153 0.0132
FSGPC-2 28 days 0.0047 0.005
FSGPC-2 08 years 0.00594 0.00529
3.4.5 FT-IR analysis
3.4.5.1 FT-IR test results of fly ash based geopolymer concrete
The FT-IR technique is used to identify the effect of carbonation on bonding
characteristics of concrete. In this test, carbonation depth was determined from the
position of the C–O characteristic peaks relative to the baseline at wavelength range of
1410-1420 cm-1 [180, 182]. The FT-IR technique is used to identify the presence of
saturated (pH value < 8.3) and non-saturated (pH value > 8.3) carbonation products in
concrete [180, 183], whereas phenolphthalein indicator has the limitation of only
providing carbonation depth at the saturated zone. FT-IR analysis was conducted on the
samples collected from the FGPC-A and OPC-A concrete core specimens at 5 mm depth
intervals. The powder samples were collected up to 30 mm depth from FGPC-A core
specimen due to the higher carbonation behaviour in the atmospheric environment. The
powder samples collected from OPC-A concrete core specimens was limited to a depth
of 15 mm since the carbonation depth of OPC-A concrete was about 4-10 mm after eight
years of exposure in the atmospheric environment. Fig. 3-14 and Fig. 3-15 illustrate the
IR spectra of FGPC-A and OPC-A concretes, respectively. As shown in Fig. 3-14, there is
no evidence for the presence of C–O at the wavenumber of 1410-1420 cm-1, which
indicates carbonation reaction components are not present in FGPC-A concrete after
long-term exposure to the atmospheric environment. However, the phenolphthalein
application revealed that the carbonation of FGPC-A was higher than the carbonation in
OPC-A concrete culvert and this indicates the carbonation products from the GPC
culvert are removed in field exposed conditions.
Page 100
Chapter 3 The durability of geopolymer concrete exposed to the atmospheric
environment
78
In contrast, the C-O bond has been identified in OPC-A concrete after the exposure in
the atmospheric environment. As shown in Fig. 3-15, the peak identified at the
wavenumber of 1420 cm-1 is corresponding to the CaCO3 formation in OPC-A concrete.
Compared to other depth levels, the peak of the collected sample near the exposed
surface of the concrete (5 mm) was identified with high intensity, indicating that the
carbonation rate at the surface of the concrete was very high compared to the inner part
of the specimen. In addition, the peak at 899 cm-1 relates to the stretching vibration of C-
O bond [182] and that was also found in the first layer of OPC-A concrete, indicating
more carbonation in the first layer compared to other layers. Moreover, it should be
noted that the C-O bond was identified in all OPC-A concrete samples (up to 15 mm
depth), whereas a maximum of 10 mm carbonation was identified by the
phenolphthalein indicator. As explained earlier, FT-IR technique is a powerful tool to
identify all carbonation products at any saturation level. Therefore, the minor amount of
CaCO3 content in the partially carbonated zone was also identified at 10 and 15 mm
depth levels.
Fig. 3-14 FT-IR Spectra of FGPC-A concrete
Page 101
Chapter 3 The durability of geopolymer concrete exposed to the atmospheric
environment
79
Fig. 3-15 FT-IR Spectra for -A concrete
It is interesting to note that the FGPC-A specimen has not detected C-O bond, though
the previous study revealed the formation of Na2CO3 products in the laboratory
carbonated fly ash based geopolymer concrete samples at 1417 cm-1 [96]. Therefore, to
further investigate this phenomenon, an accelerated carbonation test was carried out on
the geopolymer concrete specimens. The fly ash based geopolymer concrete specimens
were prepared with 100 mm diameter, and an accelerated carbonation test was carried
out in a carbonation chamber at 21°C with 65% relative humidity after 28 days from
casting date. Since higher concentrations of CO2 yield bicarbonate components in
geopolymer concrete [112], the concentration of CO2 used in this experiment was
controlled 1% to produce the same type of products that would form under natural
carbonation conditions. Fig.3-16 shows the comparison of FT-IR results for the samples
collected from laboratory-exposed specimens (in carbonation chamber for four weeks)
and the field exposed FGPC-A culvert core specimens at a depth level of 5 mm. As
opposed to the field exposed FGPC-A, the C-O bond was recognized in laboratory
prepared FGPC-A samples at 1450 cm-1. This suggests that carbonation components are
formed in fly ash based geopolymer concrete specimens, and those products in field
exposed specimens appear to have dissolved in water from rain and other factors.
Moreover, FT-IR spectra also provide the peaks for a geopolymerisation reaction as well
as a hydration reaction in FGPC-A (Fig. 3-14) and OPC-A (Fig. 3-15 ) concrete,
respectively. The peak at 997 cm-1 in FGPC-A concrete is associated with asymmetric
stretching vibration of the Si-O-T (T is Si or Al) bond [54, 184] and the peak detected at
Page 102
Chapter 3 The durability of geopolymer concrete exposed to the atmospheric
environment
80
997 cm-1 in OPC-A concrete specimens correspond to the stretching of Si-O from the C-
S-H phase. Finally, the peaks between 647 cm-1 and 777 cm-1 are related to the crystalline
phase of quartz components [98, 184].
Fig.3-16 FTIR spectrum of FGPC-A concrete samples (Field and Laboratory)
3.4.5.2 FT-IR test results of fly ash-slag blended geopolymer concrete
Fig.3-17 shows the FT-IR spectra of fly ash- slag based geopolymer concrete specimens
collected from top 10 mm depth of core specimens. As shown in Fig.3-17, the peak has
been identified at 1410 cm-1 and 1460 cm-1 for FSGPC-1 and FSGPC-2 specimens,
respectively, due to the stretching vibration of C-O in carbonate (CO32-) components
[182]. Additionally, carbonation bond has also been observed at the peaks of 871 cm-1
and 856 cm-1. It should be noted that the peaks due the carbonation bond have not been
identified in the fly ash based geopolymer concrete previously. However, this
investigation showed the presence of carbonation products in fly ash-slag blended
geopolymer concrete exposed to the atmospheric environment. This indicates the
incorporation of slag constituent into fly ash based geopolymer concrete produces
insoluble CaCO3 as the carbonation component in addition to Na2CO3 and K2CO3
components. Therefore, carbonation products remain on the concrete surface exposed at
the ambient environment.
Furthermore, FT-IR spectra shows the main intensity bands of FSGPC-1 concrete as
follows: 772, 871, 1000, 1410, 1630, and 3420 cm-1. The FSGPC-2 concrete contains main
Page 103
Chapter 3 The durability of geopolymer concrete exposed to the atmospheric
environment
81
adsorption bands at 641, 856, 953, 1460, 1630 and 3360 cm-1. The peaks at 1000 cm-1 and
953 cm-1 are attributed to stretching vibrations mode of the Si-O-T bond (T is Si or Al) in
FSGPC-1 and FSGPC-2 concrete, respectively. It should be noted that the primary band
wave numbers were shifted to lower wavelengths in FSGPC-2 concrete compared to
FSGPC-1. This is likely due to the high fly ash content in FSGPC-1 concrete, which
increased the formation of alumina-silica geopolymer gel and the presence of large
amount of unreacted fly ash particles [54], or the contribution of silicate activator in
FSGPC-1 concrete.
Moreover, the peak at 3420 cm-1 in FSGPC-1 concrete and 3360 cm-1 in FSGPC-2 concrete
is associated with stretching vibration of OH and H-O-H groups from hydration reaction
products [58]. In addition, the peak at 1630 cm-1 in both types of concrete attributes to
the bending vibration of OH groups. Finally, the peaks at 698 cm-1 and 772 cm-1 in
FSGPC-1 concrete and the peaks at 641 cm-1 in FSGPC-2 concrete is due to the bending
vibration mode of Si–O–Si or Si–O–Al gel.
Fig.3-17 FTIR spectra for both type specimens (Top layer)
Page 104
Chapter 3 The durability of geopolymer concrete exposed to the atmospheric
environment
82
3.4.6 Mercury Intrusion Porosimetry (MIP) analysis
3.4.6.1 MIP test on fly ash based geopolymer concrete
Mercury Intrusion Porosimetry (MIP) analysis is a method to investigate the porosity
and pore size distribution in the concrete, which has been used in many research studies
[42, 185]. In this study, the variation of the pore structure of concrete due to the
carbonation process has been investigated by using MIP analysis. Fig. 3-18 illustrates the
cumulative intrusion of carbonated and un-carbonated part of FGPC-A and OPC-A
concrete specimens, which are collected from the core specimens at different depth level.
According to Fig. 3-18, main increment in the cumulative intrusion of FGPC-A concrete
samples (both carbonated and un-carbonated samples) occurred in the pore diameter
intervals of 20 nm to 160 nm, and a similar change can also be observed in OPC-A
concrete specimens at similar intervals (25 nm -170 nm). However, the total intrusion of
FGPC-A concrete samples (both carbonated and un-carbonated samples) was higher
than the total intrusion of OPC-A concrete. This reveals that the porosity of FGPC-A
samples was higher than OPC-A concrete. This could be due to the formation of porous
geopolymerisation reaction products such as a three-dimensional network of N-A-S-H
gel by the activation of fly ash [24] .
Fig. 3-18 also shows that the carbonated FGPC-A specimen had higher total intrusion
than un-carbonated part of FGPC-A concrete specimen, whereas the total intrusion of
OPC-A concrete decreases with carbonation process throughout the age of concrete. This
further reinforces with the test results obtained from the sorptivity analysis.
Page 105
Chapter 3 The durability of geopolymer concrete exposed to the atmospheric
environment
83
Fig. 3-18 The cumulative intrusion of atmospheric exposed concrete specimens
Fig. 3-19 depicts the differential pore size distribution of the carbonated and un-
carbonated concrete specimens. Table 3-8 also summarises the total porosity and the
proportions of different pore types according to pore diameters. Here, the pore types are
categorized according to the pore diameters. Pore diameter less than 20 nm is considered
as “harmless”, and pore size between 20 nm and 100 nm is classified as “minor harmful”
pores. A pore size between 100 nm and 200 nm is defined as “harmful” and greater than
200 nm is considered as “serious harmful” pores [186].
Fig. 3-19 Differential pore size distribution obtained for atmospheric exposed concrete
specimens
As given in Table 3-8, carbonated FGPC-A concrete showed higher porosity compared
to the respective un-carbonated specimen, where the total porosity of the carbonated
and un-carbonated part of the FGPC-A specimens are 20.2% and 16.1%, respectively.
While the porosity of OPC-A concrete specimen reduced from 12% to 10.1% with the
carbonation reaction when exposed to the similar environment. As explained
previously, this is due to the formation of different carbonation components between
two types of concretes. It is anticipated that the formation of soluble carbonation
components in fly ash based geopolymer concrete (i.e. Na2CO3 and K2CO3) are washed
out from the concrete surface in field exposure, causing higher porosity after the
carbonation. However, the formation of insoluble CaCO3 in OPC concrete fills the pores
Page 106
Chapter 3 The durability of geopolymer concrete exposed to the atmospheric
environment
84
of the surface and reduces the porosity with the carbonation. Furthermore, in fly ash
based geopolymer concrete, increasing porosity with the carbonation process further
exacerbates the carbonation rate due to the enhanced CO2 ingress rate with porosity. As
a result, higher carbonation depth was observed in fly ash based geopolymer concrete
compared to OPC concrete after eight years of exposure in the ambient environment.
Table 3-8 Porosity and pore size distribution of atmospheric exposed concrete specimens
Specimens Porosit
y
(%)
Pore
diameter (0-
20 nm) (%)
Pore
diameter (20-
100 nm) (%)
Pore
diameter
(100-200 nm)
(%)
Pore
diameter
(>200 nm)
(%)
FGPC-A
Carbonated
20.2 5.1 70.3 5.1
19.4
FGPC-A - Un
carbonated
16.1 6.2 72 4 18.2
OPC-A -
Carbonated
10.1 6.3 36.53 21.8 35.3
OPC-A - Un
carbonated
12.0
10.13 26.7 29.3 33.9
It can be seen from Fig. 3-19 and Table 3-8 that the FGPC-A specimens contain fine pores,
and the majority of pores have a pore diameter of 20 -100 nm. By contrast, OPC-A
concrete displayed a range of pore diameters with a substantial percentage of pores
detected in the range of 20-100 nm, 100-200 nm and greater than 200 nm. This indicates
that the average pore size in OPC-A concrete was greater than the average pore size of
FGPC-A concrete.
This data indicates that the percentage of capillary pores (100 nm -200 nm) in FGPC-A
concrete increases with carbonation process. However, the carbonated OPC-A concrete
contains a lower percentage of capillary pores compared to the un-carbonated OPC-A
Page 107
Chapter 3 The durability of geopolymer concrete exposed to the atmospheric
environment
85
concrete specimens. Combining these together, we can confirm that the porosity of
carbonated OPC-A concrete has been reduces since the pores in OPC-A concrete are
filled with carbonation reaction products. Conversely, carbonation increases the
porosity in fly ash based geopolymer concrete in an atmospheric environment. This can
be seen from MIP test results obtained for accelerated carbonated FGPC-A concrete
specimens with same mix composition. Fig.3-20 represents the MIP test results of the
accelerated carbonated samples after 3 months of exposure in 1% of CO2 environment (
temperature of 23°C and relative humidity of 65%) and control (un-carbonated) FGPC-
A concrete samples. The specimens size was used for the accelerated carbonation test
was 100 mm × 50 mm. It should be noted that the accelerated carbonation test was
carried out in the environment chamber without contact with water. The plotted graphs
indicated that there is a minor difference between the carbonated and control specimens,
and the total porosity obtained for both specimens were 15.4% and 14.9%, respectively.
This confirms the increase in porosity of FGPC-A concrete in the atmosphere by
dissolving carbonated components in running water. These results are again well
correlated with FT-IR spectra analysis.
Fig.3-20 MIP test results for laboratory carbonated FGPC-A concrete
Furthermore, the test results from MIP analysis are consistent with the sorptivity test
results, while the AVPV test provides contradictory results. This is because the AVPV
values of both FGPC-A and OPC-A concrete specimens increase with exposure period.
As explained earlier, AVPV test is suitable to determine the open pores only, whereas
MIP and sorptivity test methods are determining the total pores of the concrete
Page 108
Chapter 3 The durability of geopolymer concrete exposed to the atmospheric
environment
86
specimens. As such, both MIP and sorptivity analysis are appropriate methods to
determine the pore size distribution of concrete samples.
3.4.6.2 MIP test on fly ash –slag blended geopolymer concrete
Fig.3-21 shows the cumulative intrusion of FSGPC-1 and FSGPC-2 geopolymer
concretes, which are collected from the core specimens at a depth level of 0-50 mm (Top)
and 50-100 mm (Mid). As given in Fig.3-21, the total intrusions of FSGPC-1 concrete
samples were higher than FSGPC-2 concrete samples. This indicates that the porosity of
the FSGPC-1 samples was greater than FSGPC-2 concrete porosity. According to
Fig.3-21, major increment in the cumulative intrusion of FSGPC-1 samples occurred in
the pore diameter range of 10-1000 nm, while cumulative intrusion of FSGPC-2 concrete
is changed between 3-25 nm. This reveals that the FSGPC-1 concrete contains a wide
range of pore size distribution, whereas the maximum amount of pores of FSGPC-2
concrete is in the smaller pore size range (3-25 nm).
Fig.3-21 Cumulative intrusion of atmospheric exposed fly ash- slag blended geopolymer
concrete specimens
The differential pore size distributions of both types of geopolymer concrete specimens
are shown in Fig.3-22. As seen in Fig.3-22, the top and mid layers of the same types of
concrete demonstrate similar pore size distribution characteristics. The overall pore
characteristic details are given in Table 3-9.
Page 109
Chapter 3 The durability of geopolymer concrete exposed to the atmospheric
environment
87
Table 3-9 According to Fig.3-22 and Table 3-9, top and mid layers of FSGPC-1 specimen
contain higher pores compared to FSGPC-2 specimens. The top and mid layer of FSGPC-
1 concrete specimens have a total porosity of 17.6% and 17.2%, and the total porosity of
FSGPC-2 concrete specimens for the relevant layers are 14.9% and 11.2%, respectively.
Therefore, the porosity of the concrete specimens agrees with the carbonation results.
That is, the lower porosity concrete has a higher resistance to carbonation in an ambient
environment.
Although the porosity of top layer in FSGPC-1 concrete is high, it possesses lower total
pore area and higher average pore diameter values compared to the FSGPC-2 concrete
top layer. This suggests that the FSGPC-1 concrete contains a high amount of larger size
pores compared to FSGPC-2 concrete. It is also noted that the FSGPC-2 concrete contains
fine pores and the largest amount of pores occur at the pore diameters of 4.7 nm and 5.3
nm for the top and mid layers respectively. On the other hand, the top and mid layers of
FSGPC-1 concrete specimens possess large amount of pores at the pore diameter of 15.7
nm. This confirms that most of the pores in both types ambient-exposed geopolymer
concrete are harmless or less harm, as a significant proportion of pores occur at the
diameter less than 50 nm [187]. However, the FSGPC-1 concrete still shows a noticeable
amount of pores at the diameter range of 50 -150 nm (Fig.3-22), which are harmful pores.
Therefore, it can be concluded that the FSGPC-1 concrete contains a high amount of
harmful pores, which can promote the penetration of CO2. This was also confirmed by
the carbonation test results, where the penetration of CO2 was high in FSGPC-1
geopolymer concrete surface in the ambient environment.
Page 110
Chapter 3 The durability of geopolymer concrete exposed to the atmospheric
environment
88
Fig.3-22 Differential pore size distribution obtained for both types of geopolymer
concrete
Table 3-9 The pore characteristics details of both types of geopolymer concrete
specimens
FSGPC-1-Top
layer
FSGPC-1-Mid
layer
FSGPC-2-Top
layer
FSGPC-2-Mid
layer
Porosity (%) 17.6 17.2 14.9 11.8
Total pore
area(m2/g)
15.252 18.966 22.8 16.621
Average Pore
diameter(nm)
23.6 22.9 13.5 12.5
3.4.7 Corrosion of reinforcement in fly ash based geopolymer concrete
The corrosion of reinforcement bar in the field exposed FGPC-A concrete and OPC-A
concrete was visually inspected after the split the core specimens. Special attention has
been paid on the rust development on the surface of the rebar. Such inspections could
not be performed for fly ash-slag blended geopolymer concrete structures due to the
absence of rebar in near-surface, and the rebar had been embedded in the depths higher
than the core size.
Photographs of embedded reinforcement bars in fly ash based geopolymer and OPC
concrete from the atmospheric environment are illustrated in Fig.3-23. These
reinforcement bars are collected from the leg parts of the concrete culverts with 45 mm
cover depth values. As shown in Fig.3-23, the reinforcement bar in FGPC-A has begun
to corrode, whereas no corrosion products can be observed in the reinforcement bar
embedded in OPC-A concrete. In OPC concrete, reinforcement bars are well protected
by the formation of a thin oxide layer around the reinforcement (called a passivation
layer) in the presence of alkalinity (Ca(OH)2) component of cement. The carbonation
process leads to the de- passivation of this oxide layer due to alkalinity deduction (pH
deduction to less than 9.0) in the concrete.
The pH range of FGPC-A specimens was measured as 9.92 to 10.41 from the exposure
surface to 30 mm depth level and 10.5 at 120 mm depth, as reported in section 3.3.1. This
Page 111
Chapter 3 The durability of geopolymer concrete exposed to the atmospheric
environment
89
indicated that the steel bar in geopolymer concrete had not been protected even though
the pH greater than 9.0. The protective layer surrounding the reinforcement bar in
FGPC-1 is therefore compromised despite its high pH. This reveals that the fly ash based
geopolymer concrete is more susceptible to carbonation than OPC concrete.
Fig.3-23 Corrosion of embedded steel bars at a cover depth of 45 mm in FGPC-A and
OPC-A concrete at 8 years exposure in an atmospheric environment
3.5 Concluding remarks
This chapter investigated the durability of geopolymer concrete exposed to the
atmospheric environment for eight years. The fly ash based geopolymer concrete
structure, and two distinct types of fly ash-slag blended geopolymer concrete structures
were considered for durability analysis. Experimental works have been conducted to
determine the carbonation of geopolymer concrete in the atmospheric exposed
environment and compared with OPC concrete. The carbonation depth values and the
pH variation of the concrete were investigated after eight years of exposure, and the
carbonation components in the concrete samples were identified with FT-IR analysis.
Furthermore, the influence of carbonation on the transport properties and porosity of
the concrete core specimens were studied. The following conclusions can be drawn
based on this experimental works:
The effect of carbonation was more significant in fly ash geopolymer concrete
compared to OPC concrete. However, the carbonation rate of fly ash-slag
Page 112
Chapter 3 The durability of geopolymer concrete exposed to the atmospheric
environment
90
blended geopolymer concrete highly depends on the mix design of materials.
FSGPC-1 geopolymer concrete, with 75% fly ash/25% GGBFS and additional
Na2SiO3 activator showed a poor resistance against carbonation compared to
OPC concrete. In contrast, the performance of FSGPC-2 geopolymer, with 70%
fly ash/30% GGBFS with hydroxide activator, was similar to OPC concrete.
FT-IR spectra revealed the absence of carbonation products in fly ash based
exposed to the atmospheric environment. On the other hand, the presence of
carbonation products such as calcium carbonate components and crystallised
CaCO3 in fly ash-slag blended geopolymer concrete were identified.
According to the sorptivity test results of fly ash based geopolymer concrete, the
sorptivity characteristic of geopolymer concrete increases with the age of the
concrete, while the sorptivity of OPC concrete reduces with age. Similar
behaviour also observed in fly ash-slag blended geopolymer concrete specimens.
The FSGPC-1 and FSGPC-2 specimens showed that the sorptivity parameters are
increased with the age of concrete.
The MIP test results of fly ash based geopolymer concrete confirm the porosity
increase with carbonation in field conditions. The carbonated part of the field
exposed FGPC-A sample shows higher porosity than un-carbonated FGPC-A
sample from field environment. However, laboratory prepared accelerated
carbonated FGPC-A specimens (without contact with water) displays similar
porosity compared to un-carbonated FGPC-A sample. This is due to the removal
of carbonation components from the FGPC-A concrete in the ambient
environment. Once again, these results validate the observations made in FT-IR
analysis. On the other hand, field exposed OPC concrete after the carbonation
had lower porosity compared to un-carbonated OPC samples.
The MIP test results of fly ash-slag blended geopolymer concrete also confirm
the porosity increment in geopolymer concrete in the ambient environment. This
is due to the soluble carbonation components with insoluble carbonation
products. In addition, MIP analysis illustrates the relationship between
carbonation and the porosity of the concrete. Specifically, the test results revealed
that the FSGPC-1 concrete contains higher porosity and larger average pore
diameter than FSGPC- 2 concrete.
Page 113
Chapter 3 The durability of geopolymer concrete exposed to the atmospheric
environment
91
The visual inspection of the embedded reinforcement bar in fly ash based
geopolymer concrete shows the corrosion initiation after eight years of exposure
in the ambient environment, whereas the reinforcement bar in OPC concrete is
in good condition at the same exposure conditions.
Page 114
Chapter 4 The durability of geopolymer
concrete exposed to an aggressive environment
4.1 Introduction
Concrete is less durable in the aggressive environment compared to the normal
atmospheric environment due to the more influences of aggressive agents such as CO2,
chloride ions, sulphate ions and so on. This chapter consists the experimental works
related to the durability of geopolymer concrete exposed in the aggressive exposed
environment. The investigation was conducted on the core specimens collected from two
distinct types of geopolymer concrete structures, such as fly ash based geopolymer
concrete culvert exposed to the saline environment for six years and the slag-fly ash
blended geopolymer concrete block structures exposed to the marine environment for
four years. The durability behaviour of the geopolymer concrete was also compared with
OPC concrete structures exposed to the same environmental conditions. This study
presents the investigation of the combined effect of carbonation and chloride ingress in
geopolymer concrete. Furthermore, sulphate attack also influenced on the concrete
durability in aggressive condition and therefore, the sulphate penetration to the concrete
also evaluated. Moreover, the durability of the concrete is validated by measuring the
other properties such as pH changes, transport properties and pore size distribution
measurements. Finally, the microstructural characterisation of the field exposed concrete
also studied to determine the deterioration of microstructure due to carbonation,
chloride diffusion and the sulphate attack.
Page 115
Chapter 4 The durability of geopolymer concrete exposed to an aggressive environment
93
4.2 Field Investigation
4.2.1 Description of concrete structures, exposure condition and mix details
4.2.1.1 Fly ash-based geopolymer concrete & OPC concrete culverts in the saline
exposure condition
Fig.4-1 depicts the exposure conditions of fly ash based geopolymer concrete (FGPC-S)
and OPC (OPC-S) box culverts in the saline lake environment for the six-year period.
The culverts were cast by Rocla’s precast concrete plant located in Perth, Western
Australia and placed in a saline lake environment (Lake King, Western Australia) in
2009. The chloride contents of the lake water are higher than the typical chloride amount
in the seawater. The chloride content and the total soluble salt content of lake water are
150,080 ppm and 468,390 ppm, respectively [18]. By comparison, seawater typically has
a chloride concentration of 19,000-19,500 ppm and total soluble salt concentration of
approximately 35,000 ppm. The legs of the culverts were exposed to wetting and drying
cycles associated with the changes in the lake water depth. The dimensions of the
concrete box culverts were 1200 mm length, 1200 mm width and 600 mm depth. The
details and the manufacturing methods of geopolymer concrete are presented in
previous studies [18, 167]. An experimental investigation was carried out on the core
specimens extracted from both culverts. Two cores were taken from the top slab and four
core specimens from the leg part of the culverts. The diameter of the core samples from
top slab was 94 mm and 68 mm for the leg part cores, and the length of the core
specimens was 135 mm and 90 mm, respectively.
Geopolymer and OPC binders were prepared using the mix details provided in Table
4-1. Similar mix details have been used to prepare the FGPC-A and OPC-A types
concrete, which are exposed in an atmospheric environment. The durability of FGPC-A
and OPC-A types concrete were discussed in Chapter 3. The FGPC-S concrete culvert
was cured by a stream curing method at 60°C for 24 hrs, and the OPC-S concrete culvert
was cured at ambient temperature.
Page 116
Chapter 4 The durability of geopolymer concrete exposed to an aggressive environment
94
Fig.4-1 Concrete culvert structures exposed to the saline environment (a) FGPC-S
culvert, (b) OPC-S culvert.
Table 4-1 Mix compositions of concrete (kg/m3) [18, 167]
Materials Mass (kg/m3)
FGPC-S OPC-S
Coarse
Aggregates
14mm 554 920
10mm 702 300
Fine Sand 591 640
Fly Ash (Low Calcium ASTM
Class F)
409 -
Cement 400
Sodium Silicate Solution
(SiO2/Na2O =2)
102 -
Sodium Hydroxide Solution 41(8M) -
Superplasticiser (SP) 6 -
Water 22.5 170
4.2.1.2 Slag- Fly ash blended geopolymer concrete slabs in marine exposure condition.
Fig.4-2 (a) illustrates the location of the slag-fly ash blended geopolymer and OPC
concrete structures in Portland, Victoria, Australia and Fig.4-2 (b) displays the coring
work on the concrete structures. The slag- fly ash blended geopolymer concrete (SFGPC-
M) blocks are exposed in the atmospheric zone of the marine environment for four years
of the period. In the same environment, OPC (OPC-M) concrete blocks are exposed for
six years of the period. The sizes of the concrete block structures were 600 mm ×600 mm
Page 117
Chapter 4 The durability of geopolymer concrete exposed to an aggressive environment
95
and the thickness of the blocks was 200 mm. Concrete core specimens were collected
from both SFGPC-M and OPC-M concrete structures, and the diameter of the extracted
core samples was 35 mm, and the average length was 100 mm.
Fig.4-2 (a) SFGPC-M and OPC-M concrete blocks in the marine environment, (b)
concrete coring work after marine exposure.
The SFGPC-M was a commercial geopolymer concrete mix with 400 kg of binder per m3,
the exact mix design is not given, but is known to be a predominantly slag-based slag-
fly ash geopolymer (approximately 80% slag and 20% of fly ash). The OPC-M (400
kg/m3) was made with 100% of general purpose cement. The mix details of OPC-M
concrete are provided in Table 4-2.
Table 4-2 Mix proportions of OPC-M concrete
Material OPC-M (kg/m3)
OP Cement 400
Coarse aggregate 20 mm 550
Coarse aggregate 14 mm 350
Coarse aggregate 10 mm 280
Coarse sand 370
Fine sand 275
WRA 1.22
Water 159
Page 118
Chapter 4 The durability of geopolymer concrete exposed to an aggressive environment
96
4.3 Testing methods
4.3.1 Carbonation depth measurement
As explained in Chapter 3, the carbonation of concrete core specimens was evaluated by
using 1% of phenolphthalein solution. The carbonation depth values were measured by
spraying of phenolphthalein solution on the fresh surface of the extracted core
specimens from the concrete structures after exposure to the aggressive environment.
4.3.2 Chloride penetration measurements
4.3.2.1 Chloride penetration depth
The chloride penetration depth of the core specimens was measured by using silver
nitrate (AgNO3) solution. The core specimens were split into two parts, and the AgNO3
solution was sprayed on the fresh split surface. Chloride penetration depth can be
qualitatively measured by the precipitation of white silver chloride (AgCl). The white
colour of the AgCl precipitation indicates the presence of chloride ions in the concrete
surface. The following equation explains the chemical reaction between the AgNO3
solution and chloride ions.
𝐴𝑔+ + 𝐶𝑙− → 𝐴𝑔𝐶𝑙 ↓ (𝑊ℎ𝑖𝑡𝑒 𝑝𝑟𝑒𝑐𝑖𝑝𝑖𝑡𝑎𝑡𝑒) (7)
4.3.2.2 Water soluble and acid-soluble chloride content measurement
The evaluation of chloride ingress to the concrete surface exposed to the aggressive field
environment was with the aid of free and total chloride profile measurements. Powdered
samples were collected with 5 mm depth intervals from the exposed surface by using
profile grinder. The experimental setup to collecting powder samples from the core
specimens is provided in Fig. 4-3.
Page 119
Chapter 4 The durability of geopolymer concrete exposed to an aggressive environment
97
Fig. 4-3 profile grinder to obtain the powder samples from core specimens
The water-soluble chloride (free chloride) content in the powder sample was estimated
according to ASTM C 1218 [188] standard. Prior to the test, powdered samples were oven
dried at 105°C to remove the moisture content in the samples. As per mentioned in the
standard, 10 g of powdered sample was mixed with 50 ml of distilled water and boiled
for 5 min. Then the solution was filtered by using filter paper. The free chloride content
in the filtered solution was determined by using Potentiometric titration method with a
1 N AgNO3 solution.
The amount of acid soluble chloride (total chloride) in the powder sample was evaluated
with ASTM C 1152 [189] standard. This method is commonly used by many researchers
[190-192]. Similar to the water-soluble measurement test, the powdered samples were
oven dried at 105°C temperature. Then, approximately 10 g of powdered sample was
mixed with 75 ml of distilled water, and then 25 ml of nitric acid was mixed slowly into
the solution. The solution was stirred with a glass rod to avoid forming of any lumps in
the solution. Thereafter, the solution was boiled for few seconds, and then the solution
was filtered by using filter paper. Potentiometric titration method was used to determine
the acid-soluble chloride content in the filtered solution by titrating 1N AgNO3 solution.
4.3.3 Sulphate content measurements
The sulphate content was measured on the collected powdered samples from the core
specimens up to 30 mm depth, at 5 mm depth intervals with Australian Standard AS
1012.20 [193]. As similar to chloride content measurements, 10 g of oven dried powdered
Page 120
Chapter 4 The durability of geopolymer concrete exposed to an aggressive environment
98
samples were collected and mixed with 75 ml of distilled water, and then 25 ml of nitric
acid was mixed slowly into the solution. During the mixing procedure, the solution was
stirred with a glass rod to avoid the lump formation. Then, the solution was boiled for
few seconds and allowed to cool for few minutes. Thereafter, the solution was filtered
by using filter paper. The sulphate concentration was determined by using the
gravimetric method.
4.3.4 pH profile measurement
The pH of the concrete in aggressive environment is affected by the carbonation and
chloride attack. Therefore, the pH of the concrete core specimens was determined by
using water suspension method [169]. As per that the powder samples were extracted
from the concrete specimens with 3 mm depth intervals. To conduct the test, the
powdered sample was mixed with distilled water with the ratio of 2:3 and then the
mixture was stirred for 15 min with a magnetic stirrer. Next, the solution was filtered
using filter paper, and the pH value of the filtered solution was measured with a pH
electrode. The detailed test methods are explained in the Chapter 3.
4.3.5 Sorptivity analysis
The capillary absorption parameter of the concrete is a key index to evaluate chloride
diffusion to the concrete surface. When the concrete is exposed to the marine or saline
environment, the chloride ion is transported at the concrete surface by capillary
absorption. Therefore, the capillary absorption parameters are important to predict the
chloride diffusion to the concrete. The sorptivity test was conducted according to ASTM
C1585 [172] standard method. The thickness of the concrete core specimens included in
this analysis was 50 mm from the outside exposed surface. The water absorption value
(I) was calculated using the change of specimen weight value after being placed in water
(Mt) subjected to the period (t) and the surface area of the specimens. The detailed
experimental methods are provided in Chapter 3.
4.3.6 Fourier Transform Infra-red (FT-IR) analysis
The Fourier Transform Infrared (FT-IR) spectroscope was used to conduct the FT-IR
analysis. Powder samples were collected from the concrete specimens by using profile
grinder at various depth levels. To determine the IR spectra, a powder sample was mixed
with a KBr pellet, and a Fourier-transform infrared spectroscope was used to ascertain
Page 121
Chapter 4 The durability of geopolymer concrete exposed to an aggressive environment
99
the spectrum with 32 scans per sample collected from the range 4000 cm-1 to 525 cm-1 at
4 cm-1 resolutions. The experimental set up is explained in Chapter 3.
4.3.7 Mercury intrusion porosimetry (MIP) test
The pore size distribution of the concrete was determined by using Mercury intrusion
porosimetry (MIP) analysis. The solid mortar particles were collected from the core
specimens, and the samples were included in an oven dried at 80 °C for a 24 hrs to
remove the moisture content present in the samples. MIP measurements were carried
out using mercury with surface tension and the contact angle of 0.48 N/m and 140 °,
respectively. The detailed experimental methods are provided in Chapter 3.
4.3.8 Scanning Electron microscopy (SEM) and Energy dispersive X-ray
(EDX) analysis
The deterioration of microstructure of the concrete specimens was studied by using
Scanning Electron Microscopy (SEM) and energy dispersive X-ray (EDX) analysis, at an
accelerating voltage of 3 kV (ZEISS Supra 40 VP SEM instrument is used). To conduct
the SEM analysis, concrete specimens were cut into 2 mm thickness by using the
precision diamond cutter. Before the test, the concrete samples were coated with a very
thin layer of gold coating to induce the electric conductivity. Fig. 4-4 (a) shows the
cutting of concrete specimens with a diamond cutter and Scanning Electron Microscopic
(SEM) equipment is presented in Fig. 4-4 (b).
Fig. 4-4 SEM test (a) Cutting of concrete specimen into thin slice using a precision
diamond saw, (b) Scanning Electron Microscopy equipment.
Page 122
Chapter 4 The durability of geopolymer concrete exposed to an aggressive environment
100
Moreover, the SEM test was also conducted on the samples collected from the
steel/concrete interface area to identify the corrosion products in that place.
4.4 Test results and discussions
4.4.1 Carbonation resistance of geopolymer concrete in an aggressive
environment
4.4.1.1 Carbonation resistance of fly ash based geopolymer concrete
Fig.4-5 illustrates the carbonation depth measurements of FGPC-S and OPC-S concrete
core specimens from saline exposed concrete structures (6 years of exposure) by the
application of phenolphthalein indicator. According to that carbonation rate of FGPC-S
specimen is much higher than OPC-S concrete under the same exposure condition. The
phenolphthalein application showed that the total length of FGPC-S type core specimen
was turned to colourless (approximately 90 mm of leg parts and 135 mm of the top slab
of the culvert), indicated that the FGPC-S culvert was completely carbonated after six
years of exposure in the saline environment. However, carbonation depth values
obtained from OPC-S concrete core specimens were less than FGPC-S, with a maximum
value of 20 mm. Table 4-3 shows the carbonation depth values of OPC-S concrete core
specimens extracted from various locations of the culvert structure.
Page 123
Chapter 4 The durability of geopolymer concrete exposed to an aggressive environment
101
Fig.4-5 Carbonation depth measurements of core specimens using a phenolphthalein
indicator (a) FGPC-S specimen before applying phenolphthalein, (b) FGPC-S specimen
after applying phenolphthalein, (c) OPC-S specimen before applying phenolphthalein,
(d) OPC-S specimen after applying phenolphthalein
As demonstrated in Table 4-3, carbonation depth values varied at different locations due
to the moisture variation throughout the culvert structure, which would affect the
diffusion of CO2 to the concrete surface. It should be noted that the culvert was exposed
to CO2 environment from both inner and outer surface. Therefore, carbonation depth
measurements were taken from both inner and outer exposed surfaces. The carbonation
rate of the top slab part is higher than the leg part of the culvert. The maximum
carbonation depth value obtained for the core specimen from leg part of the culvert was
10 mm, whereas the core specimen form top slab of the culvert showed a maximum
value of 20 mm. It is well known that the internal humidity of the concrete is strongly
influenced on the carbonation rate [194]. The moisture content of the leg part of the
culvert structure is higher than top part due to the continued contact of seawater
compared to the top part and also the top part of the slab is highly exposed to the sun,
which would produce less moisture compared to leg part. Therefore, it can be concluded
Page 124
Chapter 4 The durability of geopolymer concrete exposed to an aggressive environment
102
that the high moisture content (greater than the optimum moisture level) is contributing
to the lower carbonation effect in the leg part of the culvert by lower CO2 diffusion.
Table 4-3 Carbonation depth measurement of OPC-S specimens
Core No Carbonation depth
measured from the
outer surface (mm)
Carbonation depth
measured from the
inner surface (mm)
OPC-S 1(Leg) 10 0
OPC-S 2(Leg) 7 0
OPC-S 3(Leg) 5 4
OPC-S 4(Leg) 5 4
OPC-S 5(Top slab) 20 10
OPC-S 6(Top slab) 20 9
On the other hand, phenolphthalein application showed that the FGPC-S concrete core
specimens from both top slab part and the leg part of the culvert structure were
completely carbonated, which indicated that the carbonation rate of fly ash based
geopolymer concrete is very much higher than OPC concrete in the saline environment
under the wet and dry conditions. As explained in the previous chapter, the soluble
Na2CO3 is producing as a primary carbonation product in fly ash based geopolymer
concrete and would be easily dissolved with any contact water in the field condition and
attributes higher porosity on the concrete surface. Therefore, this induced higher CO2
penetration through the concrete surface. This was clearly explained in Chapter 3.
Furthermore, in this study, phenolphthalein indicator has been provided clear
carbonation depth identification for fly ash based geopolymer concrete. However, the
study on atmospheric exposed fly ash based geopolymer concrete showed that the
carbonation depth measurements were not clear with the phenolphthalein indicator.
Simultaneously, past research studies also confirmed that the phenolphthalein solution
was not provided clear carbonation identification for fly ash based geopolymer concrete
[21, 25, 90]. It should be noted that the pH of the concrete is strongly influenced on the
identification of colour change by the phenolphthalein indicator. When the pH of
concrete is less than 9.0, the indicator is, colourless and when the pH level is greater than
9.0, the indicator shows a pink or purple colour. Therefore, all identification by the
Page 125
Chapter 4 The durability of geopolymer concrete exposed to an aggressive environment
103
phenolphthalein solution depends on the pH of the concrete after carbonation. This will
be discussed in section 4.4.8.
4.4.1.2 Carbonation resistance of slag-fly ash blended geopolymer concrete
Fig. 4-6 illustrates the carbonation depth measurements on the core specimens from slag-
fly ash blended geopolymer (SFGPC-M) and OPC (OPC-M) concrete exposed to the
marine environment for four years and six years period, respectively. The carbonation
depth values also determined for SFGPC-M and OPC-M after two years and four years
of exposed time, respectively. Fig. 4-7 shows the carbonation depth values of SFGPC-M
and OPC-M concrete in the marine environment. Although OPC concrete exposed more
time compared to geopolymer concrete, it shows lower carbonation rate compared to
geopolymer concrete. As shown in Fig. 4-7, SFGPC-M specimen had 6 mm carbonation
after two years of time, while OPC-M concrete shown only 1 mm depth value after a
four year of the exposure period. In addition, the carbonation depth of SFGPC-M
measured after four years was 11 mm, and OPC-M concrete had only 4 mm depth after
six years of exposure time. The past research studies revealed that the carbonation of
OPC concrete was 4 mm when it exposed to the marine environment for six-year [195],
which is similar to the value obtained for OPC-M concrete. However, slag-fly ash
blended geopolymer concrete displayed a higher rate of carbonation compared to OPC
concrete.
Page 126
Chapter 4 The durability of geopolymer concrete exposed to an aggressive environment
104
Fig. 4-6 Carbonation depth measurements of core specimens by phenolphthalein
solution, (a) SFGPC-M specimen before applying phenolphthalein, (b) SFGPC-M
specimen after applying phenolphthalein, (c) OPC-M specimen before applying
phenolphthalein, (d) OPC-M specimen after applying phenolphthalein
Fig. 4-7 Carbonation depth values after 02 years and 04 years of exposure.
4.4.2 Chloride penetration
4.4.2.1 Chloride penetration of fly ash based geopolymer concrete
Chloride depth measurements
The depth of the chloride penetration was visually determined by spraying the AgNO3
solution on freshly split core samples from the leg part of the culverts. Fig.4-8 shows the
depth measurements of chloride ion penetration of FGPC-S and OPC-S concrete core
specimens. As shown that white colour AgCl precipitation was observed on the full
length of FGPC-S concrete core specimens, which indicates, the chloride ion was
completely penetrated the entire depth of the FGPC-S culvert after six years period. As
opposed to that chloride depth values were observed in the OPC-S concrete specimens
were 10 mm and 20 mm from the outer and inner exposed surface, respectively. This
indicates the diffusion of chloride in OPC-S concrete is less compared to FGPC-S
concrete. However, the chloride penetration was quantitatively evaluated according to
the free chloride and total chloride content measurements.
Page 127
Chapter 4 The durability of geopolymer concrete exposed to an aggressive environment
105
Fig.4-8 Chloride penetration depth measurements of core specimens using an AgNO3
solution (a) FGPC-S specimen before applying AgNO3, (b) FGPC-S specimen after
applying AgNO3, (c) OPC-S specimen before applying AgNO3, (d) OPC-S specimen after
applying AgNO3
Free chloride measurements
Fig.4-9 represents the free chloride profiles of the FGPC-S and OPC-S concrete core
specimens from the leg part of the culverts after exposed for six years. Since the leg part
of culvert is exposed to saline water in both inner and outer direction, the measurements
have been taken from both exposure surfaces of the core specimens. In Fig.4-9, ‘FGPC-S
T’ and ‘FGPC-S B’ are indicated the free chloride profiles of FGPC-S samples from inner
and outer exposed surfaces, respectively. Similarly, the free chloride profiles ‘OPC-S T’
and ‘OPC-S B’ are associated with the samples collected from the inner and outer surface
of OPC-S concrete core specimens, respectively. Free chloride profiles were plotted
according to Fick’s second law mathematical equation, provided below [196].
𝐶𝑥 = 𝐶𝑠(1 − 𝑒𝑟𝑓 (𝑥
4 𝐷𝑎×𝑡)) (8)
Where Cx is chloride concentration at depth x, Cs is surface chloride content at the
surface, Da is apparent diffusion coefficient, x is depth, t is a time of exposure and erf is
Page 128
Chapter 4 The durability of geopolymer concrete exposed to an aggressive environment
106
an error function. As shown in Fig.4-9, free chloride content in FGPC-S was found to be
higher than the OPC-S concrete at the same depth levels. It should be noted here that the
amount of free chloride in the concrete is more influenced to induce the corrosion
activity of reinforcement compared to total chloride content [197]. According to the test
results, free chloride contents at the 25 mm depth level (reinforcement level) from the
inner and outer exposed surfaces were exceeded or closed to the value of 0.4%. On the
other hand, OPC-S concrete displayed lower contents of free chlorides from the both
exposed surfaces at that level, which is approximately 0.05%. Therefore, this indicated
that the risk for the corrosion of reinforcement bar was greater than the risk of corrosion
in OPC-S concrete. The corrosion activity in reinforcement bar is explained further in the
section of 4.4.13.
Fig.4-9 Free chloride variation with depth values from the saline environment
Total chloride content and Chloride diffusion coefficients (Da)
The total chloride profiles of the core specimens were plotted according to Fick’s second
law mathematical equation (Eqn (8)) by using best-fit curve method. The apparent
diffusion coefficient (Da) and the surface chloride content (Cs) were calculated by using
the total chloride profiles. Although the free chloride is generally considered as a
responsible to initiate the corrosion in reinforcement, the chloride threshold value is also
necessary to depassivate the reinforcement bar, which is determined from the total
chloride measurement [198, 199]. The threshold limit of the chloride is generally
Page 129
Chapter 4 The durability of geopolymer concrete exposed to an aggressive environment
107
considered as 0.06% by wt. of concrete [200]. The plots of total chloride content of FGPC-
S and OPC-S concrete are shown in Fig.4-10. As previously mentioned, ‘FGPC-S T’,
‘FGPC-S B’, ‘OPC-S T’ and ‘OPC-S B’ are associated with the total chloride profile of
powder specimens collected from the outer and inner surface of FGPC-S and OPC-S
concrete, respectively. Table 4-4 shows the calculated Da and Cs values for the FGPC-S
and OPC-S concrete specimens after six years of exposure. It should be noted that that
the resistance of chloride penetration through the concrete can be evaluated by using
chloride diffusion coefficient values of concrete [201]. According to Fig.4-10 and Table
4-4, the chloride content in FGPC-S concrete was much higher than the chloride contents
in OPC-S concrete. FGPC-S specimens displayed higher chloride diffusion compared to
OPC-S concrete. The total chloride profiles in Fig.4-10 shown that the amount of total
chloride content at the reinforcement bar level (25 mm depth) of FGPC-S concrete was
much higher than the assumed threshold Cl- limit values (0.06% by wt. of concrete),
whereas the total chloride content at the reinforcement bar in OPC-S concrete is also
higher the level of the threshold limit. However, compared to FGPC-S specimens,
chloride content in OPC-S concrete specimens are lower at 25 mm depth level. This
indicated that the corrosion activity in FGPC-S concrete should be greater than the
corrosion of reinforcement bar in OPC-S concrete.
Fig.4-10 Total chloride variation with depth values from the saline environment.
Page 130
Chapter 4 The durability of geopolymer concrete exposed to an aggressive environment
108
Table 4-4 Apparent diffusion coefficient and surface chloride content values
Apparent diffusion
coefficient (Da)×10-12 m2/s
Surface chloride content
(Cs) (% by wt. of concrete)
FGPC-S T 2.50 1.38
OPC-S T 1.0 0.58
FGPC-S B 2.20 1.38
OPC-S B 0.95 0.48
It is well-known that the chloride diffusion and the surface chloride content of concrete
depend on the mix proportions, especially the binder type and curing conditions [202].
In this study, two different curing processes were conducted, a heat curing method for
FGPC-S concrete and an ambient temperature curing for OPC-S concrete. The high-
temperature curing method accelerates the curing process and produces better chloride
resistance than ambient cured concrete at the younger stage, whereas ambient cured
concrete may contain lower chloride diffusion at the latter stage due to the continuous
curing process with age [203]. The previous research studies have shown that the fly ash
based geopolymer concrete had lower chloride diffusion compared to OPC concrete at
an early age [25, 121, 122]. In contrast, this investigation revealed that the FGPC-S had
higher chloride diffusion than OPC-S concrete after six years of exposure. It can,
therefore, be concluded that the heat curing process in fly ash based geopolymer
concrete produces higher chloride diffusion after long-term exposure in the saline
environment due to the early reaction process.
Moreover, higher surface chloride content in FGPC-S specimens is possibly also related
to the availability of carbonation reaction components in the concrete surface. In OPC
concrete, the pore structure of the concrete surface is filled with CaCO3 components,
which reduces the surface chloride concentration, while in fly ash based geopolymer
concrete, porosity increment due to the formation of soluble carbonation components
encouraged more sorption on the surface, which produced more surface chloride
concentration. In overall, the effect of chloride and chloride diffusion of fly ash-based
GPC concrete was severe in saline environments with long-term exposure.
Page 131
Chapter 4 The durability of geopolymer concrete exposed to an aggressive environment
109
Chloride binding capacity of fly ash based geopolymer concrete
The chloride binding capacity of concrete can be evaluated by using the values of free
chloride and total chloride content. The following equation is used to calculate the
chloride binding capacity of concrete after exposure to 6 years in saline aggressive
condition [190, 204].
𝑃𝑏𝑐 =
𝐶𝑡 − 𝐶𝑓
𝐶𝑡∗ 100%
(9)
Where Pbc is the chloride binding capacity, Ct is the total chloride content, and Cf is the
free chloride content in the concrete.
The calculated chloride binding capacity of the FGPC-S and OPC-S concrete specimens
are 20% and 31%, respectively. In general, there are two mechanisms influenced on the
chloride binding capacity of Ordinary Portland cement concrete: such as physical
adsorption and chemical reactions [205, 206]. The chloride binding capacity of the
concrete increases with the tricalcium aluminate (C3A) content and tetra calcium
alumina ferrite (C4AF) phases in concrete. The C3A component in the cement binder
reacted with bound chloride and produced calcium chloroaluminate hydrate
(3CaO·Al2O3·CaCl2·10H2O), which is known as Friedel’s salt [190]. This enhances the
chemical binding of chloride. On the other hand, chloride ions are physically bounded
with the C-S-H gel in the hydration products and the ettringite components [124, 205].
Nevertheless, higher chloride diffusion in fly ash based geopolymer concrete is due to
no C3A, C4AF phases or C–S–H gel compared to OPC concrete [207]. Moreover, chloride
ions in OPC concrete are bound by Friedel’s salt and calcium chloride phases, from the
reaction between hydration phases of cement and the chloride ions. In contrast, the
formation of soluble metal salt components, as a reaction between fly ash based
geopolymer concrete phases and chloride ions, would not be sufficient to provide
enough chloride binding capacity [208].
4.4.2.2 Chloride penetration of slag- fly ash blended geopolymer concrete
Chloride penetration depth measurements
Fig.4-11 showed the measurement of chloride penetration depth of SFGPC-M and OPC-
M concrete core specimens by using AgNO3 solutions after the exposure of 4 years and
6 years in the marine environment, respectively. Although lesser exposure in the marine
Page 132
Chapter 4 The durability of geopolymer concrete exposed to an aggressive environment
110
environment compared to OPC-M concrete, the chloride penetration depth identified in
SFGPC-M was high, which is about 10 mm, whereas OPC-M concrete displayed 8 mm
depth value only. This indicates SFGPC-M showed lower penetration resistance than
that of OPC-M concrete. However, compared to fly ash based geopolymer concrete, slag-
fly ash blended geopolymer concrete displayed greater resistance against chloride
penetration in the aggressive condition.
Fig.4-11 Chloride penetration depth measurements of core specimens using an AgNO3
solution (a) SFGPC-M specimen before applying AgNO3, (b) SFGPC-M specimen after
applying AgNO3, (c) OPC-M specimen before applying AgNO3, (d) OPC-M specimen
after applying AgNO3
Free chloride measurements
Fig. 4-12 depicts the free chloride profiles of SFGPC-M and OPC-M concrete after
exposed to the marine environment for 04 years and 06 years, respectively. These profiles
were plotted by using the Fick’s second law mathematical equation (Eqn (8)) by using
best-fit curve method. As observed from the AgNO3 solution, the free chloride profile
also confirmed the higher chloride ingress in SFGPC-M concrete compared to OPC-M
concrete. According to Fig. 4-12, the amount of free chlorides in both types of concrete
Page 133
Chapter 4 The durability of geopolymer concrete exposed to an aggressive environment
111
are less than 0.4% throughout the depth (30 mm), and this indicated that there would be
less effect on the reinforcement bar in both SFGPC-M and OPC-M concrete after four
years and six years of exposure. However, the value of free chloride at the surface of the
SFGPC-M specimen is closed to 0.4% and therefore, this revealed that the reinforcement
bar in SFGPC-M is more susceptible to corrosion compared to the reinforcement bar in
OPC-M concrete.
Fig. 4-12 Free chloride profiles of both SFGPC-M after 4 year of exposure and OPC-M
concrete after 04 years of exposed time in marine environment.
Total chloride measurements and Chloride diffusion coefficients (Dc)
The total chloride profiles of SFGPC-M and OPC-M concrete specimens are shown in
Fig. 4-13. As shown that the SFGPC-M concrete consists higher chloride content
compared to OPC-M concrete throughout the depth. The total chloride measurements
indicated that the predicted total chloride of OPC-M concrete is intersected with a
threshold value of 22.5 mm depth, whereas the predicted chloride content in SFGPC-M
was greater than 0.06% at 28.5 mm depth. Therefore, this indicated that the required
cover to protect the reinforcement bar in slag- fly ash blended geopolymer concrete
should be greater than the cover value usually provides for the reinforcement bar in OPC
concrete in the marine environment. Unfortunately, no reinforcement bar has been
identified in the core specimens, which provides the limitation for determining the
corrosion behaviour of reinforcement in the concrete structures.
Page 134
Chapter 4 The durability of geopolymer concrete exposed to an aggressive environment
112
Fig. 4-13 Total chloride profiles of SFGPC-M and OPC-M concrete after 04 years and 06
years of exposure in the marine environment
Table 4-5 illustrates the Dc values and the surface chloride concentration values (Cs) of
SFGPC-M concrete specimens after two years and four years of exposure in the marine
environment. Dc and Cs values of OPC-M concrete specimens after six years of exposure
in marine environment also present in Table 4-5. As can be observed from that, these
results also displayed that the SFGPC-M specimen had lower resistance to chloride
transportation compared to OPC-M concrete. Despite that, the previous studies have
shown that the chloride resistance of slag-based geopolymer concrete is greater than
OPC concrete [22, 209]. The reason provided for the high chloride resistance is the slag-
based geopolymer concrete produces cross-linked C-A-S-H (tobermorite) phase, which
is high density, compared to OPC concrete. In OPC concrete, the formation of non-cross
linked C-S-H (tobermorite) [17] attributes higher porosity and high pore volume [24],
which represents the higher chloride penetration compared to slag based geopolymer
concrete. This conclusion has been taken according to the accelerated chloride testing
methods with freshly prepared geopolymer concrete specimens. In contrast with that
conclusion, this current investigation shows higher chloride diffusion in 4-year-old
SFGPC-M compared to 6-year-old OPC-M concrete after exposure to the real marine
conditions. As mentioned earlier, diffusion of chloride in OPC concrete is reduced with
the age of the concrete due to continuous hydration reaction of cement produced a
denser structure, which is reducing the ingress of chloride ions with age. Conversely,
geopolymerisation reaction is quicker than the hydration of OPC concrete [21] and
Page 135
Chapter 4 The durability of geopolymer concrete exposed to an aggressive environment
113
therefore, the pore structure of SFGPC-M would not be changed much with the age of
the concrete. Therefore, the chloride diffusion of SFGPC-M is higher compared to OPC
concrete in the marine environment.
Furthermore, Table 4-5 showed that the Dc and Cs values of the geopolymer concrete are
decreased with the time of exposure. The diffusion coefficient of SFGPC-M was
1.92 × 10⁻¹² and 1.15 × 10⁻¹² m2/s at 02 and 04 years periods, respectively. These values
are higher than the value observed by Ismail et al. [22] for high slag based geopolymer
concrete with accelerated testing methods. On the other hand, for OPC-M concrete, the
comparison could not be conducted with the time of exposure due to no Dc and Cs
values were calculated for OPC-M concrete after two years and four-year exposed
period.
Table 4-5 Chloride diffusion coefficient and surface chloride content of concrete.
Chloride Diffusion Coefficient, Dc (1 x 10-12 m2s-1)
Surface Chloride Concentration, Cs (% by weight concrete)
02 years 04 years
06 years
02 years 04 years 06 years
SFGPC-M concrete
1.92 1.15 N/A 0.651 0.68 N/A
OPC-M concrete
N/A N/A 0.45 N/A N/A 0.45
Chloride binding capacity of slag-fly ash blended geopolymer concrete
The calculated chloride binding capacity of the SFGPC-M and OPC-M concrete
specimens are 34% and 46% after four years and six years of the exposed period,
respectively. This revealed that in OPC-M concrete, more chloride ions bound with the
reaction phases compared to the binding of chloride ion with SFGPC-M reaction
components.
4.4.3 Sulphate attack in an aggressive environment
4.4.3.1 Sulphate resistance of fly ash based geopolymer concrete
The test results of the sulphate measurements of core specimens extracted from the leg
parts of the box culvert are shown in Fig.4-14. As similar to CO2 and chloride penetration,
FGPC-S showed higher sulphate ingress compared OPC-S concrete. The sulphate
Page 136
Chapter 4 The durability of geopolymer concrete exposed to an aggressive environment
114
contents of the FGPC-S are greater than OPC-S concrete throughout the depth. In the
sulphate environment, aluminosilicate compounds from the geopolymer matrix are
degraded easier than OPC concrete reaction phases and induce higher sulphate ingress
to the concrete surface. In addition to that, the porosity of the concrete also influenced
on the sulphate penetration of the concrete. The porosity and the pore size distributions
of the samples are further discussed in the below sections.
Fig.4-14 Sulphate concentration versus depth for FGPC-S and OPC-S concrete
4.4.3.2 Sulphate resistance of slag-fly ash blended geopolymer concrete
Fig.4-15 illustrates the sulphate measurements of slag-fly ash blended geopolymer and
OPC concrete core specimens from the marine environment after four years and six years
of exposure, respectively. The ingress of sulphate ions to the geopolymer concrete
surface was higher than the penetration through the OPC concrete at the less exposure
period. It should be noted that the sulphate attack in geopolymer concrete is varied from
OPC binder due to the variation of reaction phases. Therefore, further investigation
required to determine the degradation mechanism of sulphate attack in geopolymer
concrete.
Page 137
Chapter 4 The durability of geopolymer concrete exposed to an aggressive environment
115
Fig.4-15 Sulphate concentration versus depth for FGPC-S and OPC-S concrete
4.4.4 Scaling effect of geopolymer concrete
4.4.4.1 Scaling effect in fly ash based geopolymer concrete
Fig.4-16 shows the visual appearance of the FGPC-S and OPC-S concrete culvert
structures after exposed six years in the saline environment. The figure revealed that the
OPC-S concrete structures have not any significant changes in the visual appearance
after six-year period, while the mortar from the FGPC-S surface, has been lost and the
aggregates are clearly exposed on the surface. This is called a scaling effect in concrete
structures. Compared to top slab part of FGPC-S culvert, leg part of the structure has
more effect due to the frequent contact with saline lake water. Salt scaling occurs when
the concrete surface is subjected to wet and dry cycles. This causes salt crystallisation on
the concrete surface, which results in severe surface damage. Here, in addition to salt
crystallisation, the presence of a high concentration of MgSO4 in the exposed soil and
lake water also attributes a higher scaling effect on the concrete structure. Soil rich in
sulphate can also cause the deterioration of the concrete structure and soften and
spalling of the concrete surface due to the reaction between the sulphate ions and the
hardened concrete surface [210] and the reaction with Mg2+ ions also degraded the
binder in the concrete.
Page 138
Chapter 4 The durability of geopolymer concrete exposed to an aggressive environment
116
Fig.4-16 Visual appearance of concrete structure (a) FGPC-S concrete culvert, (b) the
outer surface of FGPC-S showing exposed aggregate, (c) OPC-S concrete culvert, (d) the
outer surface of OPC-S with no visual evidence of deterioration
Even though both culverts are exposed in the same environmental condition, the scaling
effect in FGPC-S was high, whereas no significant effect was identified in OPC-S
structure. This is due to the higher diffusion of chloride and sulphate ions into FGPC-S
structure compared to OPC-S concrete at the sample exposure period. In addition to that,
the reaction between geopolymer concrete and the sulphate or the chloride ions from
saline water is significantly different to the reaction between OPC concrete and those
aggressive agents. This is due to the nature of the aluminosilicate gel in geopolymer
materials compared to hydration reaction components in OPC binder. Geopolymer
concrete is rich in Na in the pore solution, and this produces thenardite (Na2SO4), from
the reaction with sulphate ions. In the previous investigation, Hime et al. [211]
determined that the thenardite turns to Mirabilite (Na2SO4. 10H2O) components during
the wetting periods and this causes an expansion of the structure. This can, therefore,
explain the higher scaling activity in FGPC-S compared to OPC-S concrete, particularly
if the GPC contained excessive Na+. Therefore, fly ash based geopolymer concrete
showed higher scaling effect compared to OPC concrete in the saline environment.
Page 139
Chapter 4 The durability of geopolymer concrete exposed to an aggressive environment
117
4.4.4.2 Scaling effect in slag- fly ash blended geopolymer concrete
Fig. 4-17( a) appearance of the SFGPC-M concrete surface after four-year, (b) appearance
of the OPC-M concrete surface after six-year.
Fig. 4-17 illustrates the visual appearance of the SFGPC-M and OPC-M concrete
structures in the atmospheric zone of the marine environment after 04 years and 06 years
of exposed period. It can be seen that the SFGPC-M surface was undergone erosion in
the aggressive exposure condition. In SFGPC-M surface, mortar particles were removed,
and the coarse aggregates were exposed to the outer surface, whereas, there were no
such things observed in OPC-M concrete surface. However, the small size of cavities was
observed in the OPC-M concrete surface. As similar to fly ash based geopolymer
concrete, higher scaling activity in slag-fly ash blended geopolymer concrete also due to
the Na in the pore solution due to the activator solutions and higher chloride and
sulphate penetration compared to OPC concrete in the same exposure condition.
4.4.5 pH profile measurement
4.4.5.1 pH measurement in fly ash based geopolymer concrete
Fig.4-18 shows the pH profiles of FGPC-S and OPC-S concrete specimens from both
inner and outer exposed surfaces. By considering the penetration of CO2 and chloride
ions through both surfaces (outer and inner surface) of the culverts, the pH measurement
was conducted on the powder samples collected from both surfaced with 5 mm depth
intervals up to 30 mm depth level. As shown in Fig.4-18, pH of FGPC-S specimens was
not much varied with the depth, which is around 7.0-7.5 from the exposed surface to 30
mm depth level. This range is lower to the pH value obtained for the carbonated fly ash
based geopolymer concrete [11, 21]. Moreover, the previous chapter showed that fly ash
Page 140
Chapter 4 The durability of geopolymer concrete exposed to an aggressive environment
118
based geopolymer concrete prepared with same mix composition (FGPC-A) exposed to
an atmospheric environment for eight years displayed a pH range 9.92 to 10.41 from the
exposure surface to 30 mm depth level. This indicates compared to the normal
atmospheric condition, pH of fly ash based geopolymer concrete is reduced highly in an
aggressive environment. In a wet saline environment, contact with water, ingress of salt
and carbonation of the concrete surface induces a greater pH reduction compared to the
concrete structures exposed to the atmospheric environments.
Furthermore, compared to FGPC-S, OPC-S concrete had higher pH values, which is in
the range of 8.5-10. These pH values are comparable with the carbonation depth values
determined in FGPC-S and OPC-S concrete core samples. According to the carbonation
test, FGPC-S concrete core specimens were fully carbonated, and the pH values
confirmed the carbonation up to 30 mm depth level. Carbonation depth of the OPC-S
concrete also consistence with the pH test results.
Fig.4-18 pH variation with depth for FGPC-S and OPC-S concrete
Furthermore, in this investigation, phenolphthalein indicator was suited to determine
the carbonation depth of fly ash based geopolymer concrete. However, it was difficult
to identify the carbonation depth of fly ash based geopolymer concrete in atmosphere
exposure conditions and laboratory carbonation tests. These all related to the pH
reduction due to carbonation of concrete. In this study, pH of fly ash based geopolymer
concrete is reduced to 7.0-7.5 and the phenolphthalein indicator should turn to colourless
Page 141
Chapter 4 The durability of geopolymer concrete exposed to an aggressive environment
119
at this pH range. However, pH range of fly ash based geopolymer concrete in
atmospheric exposed condition was 9.92 to 10.41, which is difficult to determine the
colour change with the phenolphthalein application.
4.4.5.2 pH measurement in slag-fly ash blended geopolymer concrete
Fig. 4-19 illustrates the pH variation with the depth of the SFGPC-M and OPC-M
concrete specimens after exposed to 4 years and 6 years in the marine environment,
respectively. The carbonation depth values of SFGPC-M and OPC-M are also marked in
the figure. As shown in Fig. 4-19, pH of carbonated SFGPC-M concrete was in the range
of 8.5- 10.0, whereas the pH of OPC-M concrete was reduced to 9.0 from 12.3 after the
carbonation. In OPC-M concrete, pH reduction is due to the formation of CaCO3, which
is corresponding to the pH reduction is less than 9.0. On the other hand, in slag-fly ash
blended geopolymer concrete, carbonation reaction created CaCO3 and Na2CO3 as
carbonation reaction components. As explained previously, the amount of CaCO3 in
slag-fly ash based geopolymer concrete is lower than OPC concrete [26]. In addition to
that, the pH of Na2CO3 is higher than the pH of CaCO3. Therefore, due to these reasons,
pH of the carbonated blended geopolymer concrete was maintained at a high level
compared to OPC concrete. As similar to previous pH analysis, this pH test results also
consistent with carbonation depth values obtained with phenolphthalein application.
Fig. 4-19 pH variation with depth of the concrete from the exposed surface
Page 142
Chapter 4 The durability of geopolymer concrete exposed to an aggressive environment
120
4.4.6 Test results from the sorptivity analysis
4.4.6.1 Sorptivity test results for fly ash based geopolymer concrete
Fig.4-20 depicts the sorptivity curves of the concrete core specimens to compare the
sorption of the concrete surface with chloride diffusion values. In a tidal environment,
capillary absorption is an important mechanism for the ingress of chloride to the
concrete structures. Capillary absorption parameters represent the ability of water
absorption of the concrete surface by the capillary suction, and it is related to the pore
structure and interconnectivity of pores [22]. Therefore, higher absorption characteristic
represents the lower resistance to chloride diffusion to the concrete surface. Although
the rate of water absorption can be calculated by two stages such as initial water
absorption rate and secondary water absorption rate, initial water absorption rate is
associated with the capillary pores in the concrete surface, and that is related to chloride
transportation to the concrete. Table 4-6 shows the initial sorptivity coefficient values for
both FGPC-S and OPC-S specimens. As illustrated in Fig.4-20 and Table 4-6, the
reduction of sorptivity in OPC-S concrete is an agreement with well refined and lower
pore structures that are related to lower chloride penetration. By contrast, a higher
sorptivity of FGPC-S concrete accompanied the higher pore structure and porosity,
which are associated with the higher chloride penetration in the FGPC-S compared to
OPC-S concrete. Further discussion regarding the pore characteristic of the concrete
specimens are explained in the later section.
Fig.4-20 Capillary absorption of FGPC-S and OPC-S concrete
Page 143
Chapter 4 The durability of geopolymer concrete exposed to an aggressive environment
121
Table 4-6 Coefficients of sorptivity values
Specimens Initial sorptivity coefficient(mm/s1/2)
FGPC-S 0.0024
OPC-S 0.0012
4.4.6.2 Sorptivity test results for slag-fly ash blended geopolymer concrete
Fig. 4-21 shows the capillary absorption curves of the SFGPC-M and OPC-M concrete
samples. The initial rate of water absorption or the sorptivity coefficient of SFGPC-M
and OPC-M concrete samples are provided in Table 4-7. As shown in Fig. 4-21 and Table
4-7, capillary absorption of SFGPC-M specimens is high compared to OPC-M concrete
specimen. This is consistent with chloride diffusion test results and indicated that the
capillary test could be used to assess chloride diffusion performance of geopolymer
concrete. In addition, capillary sorption parameters are related to total porosity and the
tortuosity of the concrete pore structure [22]. Therefore, this test results indicates the
OPC-M concrete had a dense and lesser porous network compared to SFGPC-M.
However, compared to capillary absorption test, mercury intrusion porosimetry (MIP)
analysis provides the better understanding of the pore structure and pore size
distribution of concrete. Therefore, the concrete samples were included into MIP test to
determine the pore size distributions. The detailed of the MIP test results are explained
in the later section.
Fig. 4-21 Test results from the sorptivity analysis
Page 144
Chapter 4 The durability of geopolymer concrete exposed to an aggressive environment
122
Table 4-7 Coefficients of sorptivity values
Specimens Initial sorptivity coefficient(mm/s1/2)
SFGPC-M 0.0101
OPC-M 0.0016
4.4.7 FT-IR analysis
4.4.7.1 FT-IR analysis of fly ash based geopolymer concrete
The FT-IR spectrum of FGPC-S and OPC-S concrete specimens are shown in Fig.4-22 and
Fig.4-23, respectively. ‘FGPC-S -T’ series reflect the powder samples collected from the
outer surface of the structure with 5 mm depth intervals, whereas ‘FGPC-S-B’ series
indicate the test results from the powder sample collected from the inner surface of the
geopolymer concrete structure. Similarly, in Fig.4-23, ‘OPC-S- T’ and ‘OPC-S- B’ are
associated with the test results of powder collected from the outer and inner surface of
OPC-S concrete specimens, with 5 mm depth variation, respectively. As we can see from
Fig.4-22, there are no peaks has been observed at the wave number of 1620 cm-1 for all
FGPC-S samples. This indicates carbonation components are not presented in FGPC-S
after exposed to the saline environment. Similar results have been observed in the
samples collected from fly ash based geopolymer concrete (FGPC-A) after exposure to
the atmospheric environment, that was explained in the previous chapter. Carbonation
depth results and the pH test results are confirmed the severe carbonation in FGPC-S at
the saline environment. Therefore, as explained in the previous chapter, Na and K based
carbonation reaction components in fly ash based geopolymer concrete is removed from
the concrete by dissolving of water under the aggressive field conditions.
Page 145
Chapter 4 The durability of geopolymer concrete exposed to an aggressive environment
123
Fig.4-22 FTIR spectrum of FGPC-S concrete samples with various depth intervals
On the other hand, FT-IR spectrum of OPC-S concrete in Fig.4-23 showed the peak at
1620 cm-1 for the samples collected up to 30 mm and 15 mm depth level from the outer
and inner exposed surfaces, respectively. This confirmed the presence of C-O bond in
OPC-S concrete samples up to 30 mm and 15 mm depth level from both outer and inner
exposed surfaces. However, the maximum carbonation depth values of leg part of the
OPC-S concrete were 10 mm and 4 mm from the outer and inner exposed surfaces.
Therefore, this clearly indicated that the FT-IR analysis showed higher carbonation than
the phenolphthalein indicator and it is known that the carbonation front is ahead of that
shown by phenolphthalein [212]. As mentioned previously, the phenolphthalein
indicator can only determine the complete carbonation zone when the pH range is less
than 9.0 (presence of more CaCO3 components), whereas the FT-IR test is an accurate
method to identify the partially carbonated zone, which contains the combination of
Page 146
Chapter 4 The durability of geopolymer concrete exposed to an aggressive environment
124
Ca(OH)2 and CaCO3 components. The pH range of the partially carbonated zone is about
9.0-11.5 [180], and the carbonation depth with this pH range cannot be determined
accurately by phenolphthalein. A higher carbonation depth was therefore obtained from
FT-IR spectrum due to the presence of a partially carbonated zone. However, comparing
to other depth intervals, a higher intensity peak was observed for the powdered samples
collected from the surface to 5 mm depth intervals at the band 1410-1420 cm-1 and the
stretching vibration of CO32- was also recognised at the band 873 cm-1 [182]. The peak
obtained at 1410-1420 cm-1 is due to the existence of calcite, and the carbonation
components, such as vaterite and aragonite were identified at the band of 873 cm-1 [213].
This indicates that the effect of carbonation is high in the first layer (up to 5 mm) compare
to other layers. A further, peak obtained at 1100 cm-1 in Fig.4-22 and Fig.4-23 is
corresponding to the S-O bond [214], which confirmed the penetration of sulphate ion
in the saline environment.
Fig.4-23 FTIR spectrum of OPC-S concrete samples with various depth intervals
Page 147
Chapter 4 The durability of geopolymer concrete exposed to an aggressive environment
125
4.4.7.2 FT-IR analysis of fly ash-slag blended geopolymer concrete
Fig.4-24 illustrates the FT-IR spectrum of SFGPC-M and OPC-M concrete specimens. The
tests were conducted on the powder samples collected from the exposed surface of
concrete core specimen with 3 mm depth intervals. As opposed to fly ash based
geopolymer concrete, the C-O bond has been observed at the wave number of 1620 cm-1
from slag-fly ash blended geopolymer concrete. This indicates carbonation reaction
components are retained in the slag-fly ash blended geopolymer concrete surface after
exposure to the marine environment. Similar results have been observed in the samples
collected from atmospherically exposed fly ash- slag based geopolymer concrete as well
(Chapter 3). Therefore, as explained earlier, the formation of Ca-based carbonation
components due to the slag content in SFGPC-M type specimen remains on the surface,
and this produces the peak at 1620 cm-1 in FT-IR analysis. However, the soluble
carbonation components in SFGPC-M should be removed after the field exposure.
Fig.4-24 FTIR spectrum of (a) SFGPC-M concrete samples, (b) OPC-M concrete with
various depth intervals
Page 148
Chapter 4 The durability of geopolymer concrete exposed to an aggressive environment
126
The FT-IR spectrum of OPC-M concrete in Fig.4-24 also showed the peak at 1620 cm-1 for
the samples due to the C-O bond. Furthermore, FT-IR spectra of both types of samples
showed the peaks at the band 873 cm-1, which is due to the stretching vibration of CO32-
[182]. The peak obtained at 1410-1420 cm-1 is due to the existence of calcite, and the
carbonation components, such as vaterite and aragonite were identified at the band of
873 cm-1 [213].
4.4.8 Pore size distribution analysis with MIP test
4.4.8.1 MIP test on fly ash based geopolymer concrete
Fig. 4-25 illustrates the cumulative intrusion of FGPC-S and OPC-S concrete specimens
from the saline environment. According to that the main increment in the cumulative
intrusion of FGPC-S concrete occurred in the pore diameter interval of 10 -100 nm,
whereas the intrusion curve of the OPC-S concrete is gradually increased between the
full diameter range. However, the total intrusion of FGPC-S concrete samples was higher
than the total intrusion of OPC-S concrete. This revealed that the total porosity of the
FGPC-S samples was greater than OPC-S concrete porosity values.
Fig. 4-25 Cumulative intrusions of aggressive exposed FGPC-S and OPC-S concrete
specimens.
Fig. 4-26 shows the differential pore size distribution obtained for both samples and the
Table 4-8 depicts the pore distributions of the concrete specimens, categorised based on
the IUPAC classification system. According to that, the FGPC-S contains fines pores, and
Page 149
Chapter 4 The durability of geopolymer concrete exposed to an aggressive environment
127
the majority of pores have a diameter of 1.25 nm-25 nm. By contrast, OPC-S concrete
displayed a range of pore diameters with a substantial percentage of pores detected in
the range of macropores and air voids/cracks range. This indicates that the average pore
size in OPC-S concrete was greater than the average pore size of FGPC-S. This would be
due to the ingress of salt in the saline environment. Higher ingress of salt in FGPC-S fill
more pores and reduce the pore size compared to the pore structure changes in OPC-S
concrete. This has been confirmed by the SEM/EDX test results, indicates the chloride
ions deposited as a film layer on the FGPC-S concrete surface. However, the MIP results
show the total porosity of the FGPC-S specimens is slightly higher than the porosity of
the OPC-S concrete specimens.
Fig. 4-26 Differential pore size distribution obtained for aggressive exposed concrete
specimens
Table 4-8 Pore size percentages (based on IUPAC classification)
Specimens Porosity Pore size distribution (%)
Micropores
(<1.25×10⁻³µm)
Mesopores
(1.25–25
×10-3µ m)
Macropores (25–
5000 ×10-3µ m)
Air
voids/cracks
(5000–50,000
×10-3µ m)
FGPC-S 12.6% - 62% 19.3% 18.9%
OPC-S 9.5% - 12.3% 48.4% 39.2%
Page 150
Chapter 4 The durability of geopolymer concrete exposed to an aggressive environment
128
In fly ash based geopolymer concrete, Sodium Alumino Silicate Hydrate gel (N-A-S-H)
structure is the main reaction components during the geopolymerisation. This is a three-
dimensional network product, and therefore this promotes a higher porosity in concrete
structures. In addition, the presence of un-reacted fly ash particles in geopolymer
concrete also caused the higher porosity and a higher transfer of chloride ions into the
concrete surface [22]. However, the inclusion of slag into fly ash based system produces
a dense C–S–H phase, in addition to N-A-S-H gel, establishes a highly refined pore
network by filling the pore volume of aluminosilicate geopolymer gel and reducing
the chloride ion penetration to the concrete surface [215]. Here, only fly ash was used
as a precursor for the geopolymer concrete. Therefore, FGPC-S concrete had porous
structure, and this attribute the higher diffusion of CO2 and chloride ions into the
concrete.
4.4.8.2 MIP test on slag-fly ash blended geopolymer concrete
Fig. 4-27 shows the cumulative pore size distribution of both types of concrete samples
from 0-3 mm (top-level) and 25-30 (mid-level) mm depth levels. The results indicated
that the total volume of intruded mercury for SFGPC-M specimens is higher than that of
the OPC-M concrete at all depth level. The SFGPC-M specimens had 0.085 ml/g for 0-3
mm depth level and 0.081 ml/g of cumulative pore volumes for the sample from 25-30
mm, whereas OPC-M concrete showed the of cumulative intrusion volumes are 0.048
and 0.055 ml/g for the samples from 0-3 mm and 25-30 mm depth levels, respectively.
This revealed that the porosity of the SFGPC-M is greater than OPC-M concrete. The
differential pore size distribution and overall pore characteristic details of both types of
concrete are provided in Fig. 4-28 the Table 4-9, respectively. According to that, the total
porosity of the SFGPC-M specimens from both depth levels was greater than OPC-M
concrete samples, In addition, the total porosity of top level of SFGPC-M is higher than
the sample from mid-level, whereas, the top-level OPC-M concrete specimen had lower
porosity compared to mid-level of OPC-M concrete. This is due to the carbonation effect
in concrete after exposed to the field environment. In OPC concrete, carbonation reaction
reduces the porosity of the surface due to the formation of carbonation components.
During the carbonation reaction, insoluble CaCO3 fills the pore structure of the OPC
concrete and reduce the size of pores on the surface. Therefore, samples from the top
level (0-3 mm) of OPC concrete had lower porosity compared to mid-level (25-30 mm)
sample.
Page 151
Chapter 4 The durability of geopolymer concrete exposed to an aggressive environment
129
As explained previously, amount of CaCO3 formation in slag-fly ash blended
geopolymer concrete is lower than OPC concrete [26] and sodium carbonation
components can also form in the geopolymer concrete due to the reaction between the
NaOH and the CO2. As explained previously, the sodium carbonate components are
highly soluble in water and cannot withstand the concrete surface in the outside exposed
condition. Therefore, due to these all reasons, the porosity of the slag-fly ash blended
based geopolymer concrete surface would not be reduced with carbonation reaction. As
a result, the top level of geopolymer concrete samples showed higher porosity compared
to mid-level of the sample.
Even though the SFGPC-M specimens had a higher porosity, SFGPC-M possesses
similar or lesser average pore diameter values compared to OPC-M concrete
specimens. This suggests that the both concrete contains the almost same size of pores,
while the higher the total pore area in SFGPC-M specimens confirmed the higher
porosity in SFGPC-M concrete. As per Fig. 4-28, both types of concrete specimens had a
larger proportion of the pores at the diameter less than 50 nm, which are harmless or less
harmful pores [187]. However, there are some noticeable amount of harmful pores with
the diameter range of 50-100 nm has been identified in the surface level of geopolymer
concrete (0-3 mm), which are corresponding to the higher amount of chloride diffusion
through the SFGPC-M surface.
Fig. 4-27 Cumulative pore size distribution obtained for both types of concrete at the
surface level and the mid-depth level.
Page 152
Chapter 4 The durability of geopolymer concrete exposed to an aggressive environment
130
Fig. 4-28 Differential pore size distribution obtained for both types of concrete at the
surface level and the mid-depth level.
Table 4-9 The pore characteristics details of both types of concrete specimens.
SFGPC-M (0-3 mm)
SFGPC-M (25-30 mm)
OPC-M (0-3 mm)
OPC-M (25-30 mm)
Porosity (%) 14.5 14.2 8.7 9.9
Average pore diameter (nm)
28.3 21.9 22.3 34.8
Total pore area(m2/g)
12.09 14.97 8.52 6.27
4.4.9 Microstructural analysis by SEM/EDX method
4.4.9.1 SEM/EDX test results of fly ash based geopolymer concrete
To determine the potential detrimental effect of carbonation and chloride ions on the
microstructure of the concrete, SEM morphology analysis was conducted on the samples
collected from various depth levels of the core specimens. Fig.4-29 shows the test results
from SEM/EDX analysis of the samples collected from the outer, middle and inner part
of FGPC-S concrete core specimens. From the EDX test results, amount of Cl- ions were
determined in a higher proportion compared to Si and Al components, in all FGPC-S
concrete samples (outer, middle, inner). This indicates chloride was penetrated
Page 153
Chapter 4 The durability of geopolymer concrete exposed to an aggressive environment
131
completely through the culvert, which is consistent with the chloride penetration depth
results obtained by the application of the AgNO3 solution. Fig.4-29 demonstrated that
the sodium chloride salt was deposited as a film layer on the microstructure of FGPC-S
concrete. Therefore, EDX result was determined on that film layer to determine the
elements presence in that layer Fig.4-30 shows the EDX test results on the deposit layer.
According to that, only the elements Na and Cl were observed as major components in
that film layer, which confirmed the deposition of NaCl on the microstructure of FGPC-
S under saline environment.
The test results of SEM/EDX analysis of outer, middle and inner part of OPC-S concrete
samples are shown in Fig.4-31. As per that, the existence of Cl- ion was identified only
in the sample collected from outer and inner parts of samples. This specifies chloride
ions has not been penetrated throughout the structure, which is consistent with the
chloride penetration depth results. In addition, not like FGPC-S samples, chloride was
not observed as a deposition layer on the OPC-S microstructure, which indicates lower
ingress of chloride in OPC-S concrete compared to FGPC-S.
Furthermore, the presence of C in the top part of the OPC-S concrete specimens (Fig.4-31)
confirmed the carbonation components in OPC-S concrete. In contrast, there was no
evidence have been identified in FGPC-S samples (Fig.4-29) for the presence of C. These
results are correlated well with the FT-IR spectrum analysis.
Page 154
Chapter 4 The durability of geopolymer concrete exposed to an aggressive environment
132
Fig.4-29 SEM micrograph of (a) Top, (b) Middle and (c) Bottom part of FGPC-S concrete
core specimens with corresponding EDX analysis
Fig.4-30 SEM micrograph of chloride deposit on FGPC-S concrete specimens with
corresponding EDX analysis
Page 155
Chapter 4 The durability of geopolymer concrete exposed to an aggressive environment
133
Fig.4-31 SEM micrograph of (a) Top, (b) Middle and (c) Bottom part of OPC-S concrete
core specimens with corresponding EDX analysis
Fig.4-32 illustrates the SEM micrograph of FGPC-S and OPC-S concrete specimens
obtained from the outer surface of core specimens. The ettringite formation was
identified in the morphology of OPC-S concrete provided in Fig.4-32 (b), and there is no
evidence for the existence of ettringite in FGPC-S specimens (Fig.4-32 (a)). The exposed
soil is rich in magnesium sulphate (MgSO4), and the test results from the sulphate
analysis confirmed the penetration of sulphate ion through the both FGPC-S and OPC-
S concrete culverts. In OPC-S concrete, the ingress of MgSO4 reacts with Ca(OH)2 and
calcium aluminate hydrate components and this produced the ettringite component.
However, in FGPC-S concrete, ettringite should not be formed due to the absence of
those components (Ca(OH)2 and calcium aluminate hydrate components). A further, the
EDX results (Fig.4-29) of FGPC-S revealed that the FGPC-S concrete had a higher level
Page 156
Chapter 4 The durability of geopolymer concrete exposed to an aggressive environment
134
of Mg ions compared to OPC-S concrete. Therefore, this indicates that the mechanism of
sulphate attack in fly ash based geopolymer concrete is different from OPC concrete, and
this requires further investigation.
Fig.4-32 SEM micrograph of (a) FGPC-S, (b) OPC-S concrete specimens
4.4.9.2 SEM/EDX test results of slag-fly ash blended geopolymer concrete
Fig.4-33 depicts the test results from SEM/EDX analysis of the samples collected from 0-
3 mm level of SFGPC-M and OPC-M concrete core specimens. EDX graph of SFGPC-M
specimen displayed that the presence of Cl-. By contrast, Cl- was not identified from the
OPC-M concrete. The previous section depicted that the sodium chloride salt was
deposited as a film layer on the microstructure of fly ash based geopolymer concrete
under saline aggressive environment. However, there are no such things have been
identified in the slag-fly ash blended geopolymer concrete.
SEM micrograph of SFGPC-M and OPC-M concrete specimens obtained from the outer
surface of core specimens are provided in Fig.4-34. OPC-M concrete morphology
indicated the formation of ettringite (needle shape) (Fig.4-34 (b), whereas no indication
for the existence of ettringite in FGPC-S specimens (Fig.4-34 (a)). As mentioned earlier,
MgSO4 reacts with Ca(OH)2 and calcium aluminate hydrate components from OPC
concrete and produced the ettringite component and the reaction mechanism is different
in slag-fly ash based geopolymer and needs to identify in the future investigation.
Page 157
Chapter 4 The durability of geopolymer concrete exposed to an aggressive environment
135
Fig.4-33 SEM micrograph of SFGPC-M and OPC-M concrete specimens (0-3 mm depth)
with corresponding EDX analysis
Fig.4-34 SEM micrograph of (a) SFGPC-M, (b) OPC-M concrete specimens
4.4.10 Corrosion of reinforcement in fly ash based geopolymer concrete
The reinforcement bar in fly ash based geopolymer and OPC concrete culverts from the
saline environment was visually inspected to determine the corrosion activity after six
years of the exposure period and the corrosion products at reinforcement/concrete
interface was examined by SEM/EDS analysis. Such inspections could not be able to
carry out in slag-fly ash blended geopolymer concrete structures due to the absence of
Page 158
Chapter 4 The durability of geopolymer concrete exposed to an aggressive environment
136
rebar in near-surface in those concrete structures, and the rebar had been embedded in
the depths higher than the core size.
4.4.10.1 Visual inspection
The corrosion activity of the reinforcement bar, which are possessed in FGPC-S and
OPC-S concrete, was visually inspected by breaking the core specimens. The condition
of the reinforcement bars and the photograph of the steel-concrete interfaces are shown
in Fig.4-35. Fig.4-35 (a) and Fig.4-35 (d) illustrate the steel/concrete interface of the leg
part of FGPC-S and OPC-S culverts with a 25 mm cover value. Fig.4-35 (b) and Fig.4-35
(e) show the conditions of the steel bars at the same location of the FGPC-S and OPC-S
specimens, respectively. According to that, the reinforcement bar in FGPC-S culvert
display more corrosion activity, whereas there is little visible sign of corrosion products
in an OPC-S concrete culvert after six years exposed in a saline environment. The
reinforcement bar in FGPC-S concrete was corroded over the entire surface, and more
corrosion products were deposited at the steel/concrete interface compared to OPC-S
concrete. The combination of higher chloride ingress and carbonation accelerated the de-
passivation of steel and resulted in more extensive corrosion in FGPC-S concrete
compared to OPC-S concrete. The microstructural behaviour of the steel/concrete
interface after the corrosion was identified with the aid of SEM/EDX analysis and
explained in the following section.
Page 159
Chapter 4 The durability of geopolymer concrete exposed to an aggressive environment
137
Fig.4-35 Rebar interface and reinforcement bar after six years of exposure, (a) typical
rebar interface of FGPC-S concrete specimen, (b) reinforcement bar in leg part of FGPC-
S culvert, (d) typical rebar interface of OPC-S concrete specimen, (e) reinforcement bar
in the leg part of OPC-S culvert
4.4.10.2 SEM analysis on steel-concrete interface area
Fig.4-36 shows the SEM micrograph of FGPC-S and OPC-S concrete specimens collected
at the steel/concrete interface area. As shown in SEM images, the form of flowery
structures indicated the presence of lepidocrocite [γ-FeO(OH)] at the interface area of
both concretes [121]. However, the amount of γ-FeO(OH) in FGPC-S interface is higher
than the amount observed at the interface of steel/OPC-S concrete interface. An EDX
analysis of FGPC-S concrete also showed strong peaks of Fe and O and confirmed the
presence of high corrosion products such as γ-FeO(OH) at the interface area, whereas
EDX test results of OPC-S concrete revealed intermediate peaks of Fe and O, which
Page 160
Chapter 4 The durability of geopolymer concrete exposed to an aggressive environment
138
represents the fewer corrosion products at OPC-S steel/concrete interface. These results
are similar to visual observations of the interfacial area.
Fig.4-36 SEM micrograph of (a) FGPC-S; (b) OPC-S at the rebar/matrix interface with
corresponding EDX analysis
Page 161
Chapter 4 The durability of geopolymer concrete exposed to an aggressive environment
139
4.5 Concluding remarks
This chapter depicts the durability of geopolymer concrete in saline and marine
environment. The combined effect of carbonation, chloride diffusion and sulphate
penetration on the durability of geopolymer concrete was studied, and the durability
parameters were compared with OPC concrete from the same exposure environments.
In this investigation, fly ash based geopolymer concrete structure from the saline
environment after six years of exposure and slag-fly ash blended geopolymer concrete
exposed in the marine environment for four years were included. Based on the
experimental investigations, following conclusions can be extracted:
The effect of carbonation in fly ash based geopolymer was much greater than the
influence in OPC concrete over the six years of exposure in saline environments.
According to the test results, the core specimens from FGPC-S culvert was
completely carbonated in the leg parts (90 mm) as well as in the top slab (135 mm
thickness), whereas a maximum of 10 mm and 20 mm carbonation depth values
were obtained in the leg parts and top slab part of the OPC-S concrete structure,
respectively. The CO2 diffusion to the slag- fly ash blended geopolymer concrete also greater
than OPC concrete in the marine environment. Even though SFGPC-M concrete
structure was exposed less period (4 years) in the marine environment, it showed
higher carbonation values (11 mm) compared to OPC-M concrete. OPC-M
concrete displayed only 4 mm carbonation after 06 years of exposed period.
The chloride penetration in the fly ash based geopolymer concrete was high in
saline environments. Besides, SEM analysis revealed that the chloride contents
were deposited as a film layer on the FGPC-S concrete. As similar to fly ash based
geopolymer concrete, chloride penetration in slag-fly ash blended geopolymer
concrete also greater than OPC concrete under the exposure in the marine
environment. However, compared to fly ash based geopolymer, the chloride
penetration in slag-fly ash based geopolymer concrete is low, and SEM analysis
was not provided with any deposition of chloride layer ion the microstructure of
the concrete.
Considering sulphate penetration, FGPC-S concrete displayed higher ingress of
sulphate compared to OPC-S concrete. This produced more scaling effect in GPC
Page 162
Chapter 4 The durability of geopolymer concrete exposed to an aggressive environment
140
structure. SEM/EDX test results also revealed the higher sulphate penetration,
and there is no formation of ettringite observed in FGPC-S specimens. Similar
behaviour has also been identified on slag-fly ash blended geopolymer concrete.
This indicates the mechanism of sulphate attack in geopolymer concrete is
different from OPC concrete.
The salt scaling effect in both types of geopolymer concrete (FGPC-S and SFGPC-
M) was higher than OPC concrete. The mortar from the FGPC-S surface,
especially from the leg part of a culvert that is frequently contacted with saline
lake water, has been lost and the aggregate is clearly exposed on the surface,
whereas no significant changes have been identified in the visual appearance of
an OPC-S concrete culvert over time. Similarly, mortar from the surface of
SFGPC-M concrete also removed after four years exposed in the marine
environment, while OPC-M concrete was not shown such observation after six
years of exposed period.
The combination of higher carbonation and chloride penetration produced
higher corrosion activity of the steel bar in fly ash based geopolymer concrete.
The reinforcement bar in FGPC-S concrete was corroded on the entire surface,
and the deposition of corrosion products at the interface area of FGPC-S concrete
was much higher than for OPC-S concrete.
Page 163
Chapter 5 Study on alkali leaching, wet and dry
cyclic resistance of geopolymer
5.1 Introduction
This chapter presents the experimental investigation of alkali leaching and wetting-
drying cyclic resistances of geopolymer in different exposure conditions. The leaching
of alkali elements from the geopolymer specimens was determined by immersed in
deionised water. Accelerated wetting-drying cyclic resistance test was conducted on the
samples exposed to three different types of media such as water, chloride solution and
the combination of chloride and sulphate solution. To determine the influence of the
source materials on the leaching properties and the wetting-drying cyclic resistances,
geopolymer mortar samples were prepared with different proportion of fly ash and slag
constituents. The compressive strength and the weight of the specimens were measured
with the time interval to determine the strength and weight losses of the samples in the
wet and dry cycle analysis. Although this is an accelerated testing method, the test was
carried out due to the insufficient data determined from the field exposed geopolymer
concrete specimens. According to the field investigations, a limited number of mix
compositions of geopolymer was evaluated, and the leaching ions from geopolymer and
the compressive strength variation were not be evaluated. Therefore, this study was
conducted to evaluate the leaching effect, compressive strength losses of geopolymer
samples in different exposed condition. Furthermore, the test results of geopolymer
specimens were compared with OPC mortar specimens.
5.2 Materials and Methods
5.2.1 Materials
Class F fly ash from Gladstone power station, and Ground granulated blast furnace slag
(GGBFS) from Independent Cement Australia Pty Ltd was used as the source materials
for the preparation of geopolymer binder. The fly ash/slag ratios used in M1, M2, M3 and
Page 164
Chapter 5 Study on alkali leaching, wet and dry cyclic resistance of geopolymer
142
M4 types of geopolymer mixes were 100/0, 75/25, 50/50 and 25/75, respectively. To
prepare the geopolymer binder, a combination of sodium silicate (Na2SiO3) (29.4%
SiO2 and 14.7% Na2O by weight) and sodium hydroxide (NaOH) solution was used as
an activator solution. The concentration of NaOH was 8 M. A commercially available D
grade Na2SiO3 solution was supplied by PQ Australia. The NaOH pellet was used to
prepare the NaOH solution with 8 M concentration. The ratio of the Na2SiO3 to NaOH
was 2.5, and the alkaline liquid to binder ratio was 0.35 throughout the study. The
geopolymer binder/sand ratio used in this study was 1:2. The preparation method of
geopolymer mortar is as follows. Initially, the Na2SiO3 and NaOH solutions were mixed
and kept for 24 hr. During the preparation of geopolymer mortar, the dry materials were
mixed in a small concrete mixer (Hobart mixer) until the materials had been mixed well
and then the activator solution was added into the dry mix. The mixer was kept
continuously mix for 4 minutes to get a uniform mortar mix. Fig. 5-1 displays the Hobart
mixer, which is used to prepare the mortar mix. Mortar specimens were prepared in
50 mm cubic moulds. The geopolymer mortar specimens were removed from the
moulds after 24 hrs of the casting. Thereafter, all the specimens were included in curing
procedures. It should be noted here that the geopolymer mixes M2, M3 and M4 were
cured at 23°C ambient temperature due to the slag inclusion in the mixture. However,
the M1 type geopolymer mix was prepared with 100% of fly ash binder, and therefore,
those samples were cured at 60°C for 24 hr and then kept in an ambient temperature
until the investigation started.
To compare the performance of geopolymer specimens, control samples (CT) also
prepared with OPC binder. The general-purpose cement was used in the CT specimen
preparation. Water to binder ratio used in the CT specimens was 0.35, and the cement to
sand ratio was 1:2, which is similar to binder/sand ratio used in geopolymer mixes. As
similar to geopolymer mix preparation, first, dry materials were added in Hobart mixer
and mixed for 4 minutes. Then the water was added to dry materials, and the mixing
was continued for 3 minutes. CT specimens were also cast in 50 mm cubic moulds, and
the specimens were removed from the moulds after 24 hr of casting period. Then all
specimens were cured in the water tank at 23°C temperature for 28 days. Wetting-drying
cyclic resistance tests were started after 28 days of curing period.
Page 165
Chapter 5 Study on alkali leaching, wet and dry cyclic resistance of geopolymer
143
Fig. 5-1 Mortar mixer (Hobart mixer)
5.2.2 Testing methods
5.2.2.1 Leaching test
Leaching of alkali metals from the geopolymer and CT samples were determined by
continuous immersion of the samples in the deionised water. All the samples were
immersed in the deionised water in the separate container, and the pH value of the
solutions was measured for 7 days by using pH electrode. The Aqua pH meter was used
for the pH measurements. After 7 days of immersion, the water solutions were collected
from each container, and the leaching ions from the samples were measured. Leaching
ions in the solutions were determined by using Inductively Coupled Plasma (ICP)
analysis. ICP test was carried out by using Inductively Coupled Plasma (ICP)
spectrometer (Fig. 5-2).
Fig. 5-2 ICP Spectrometer
Page 166
Chapter 5 Study on alkali leaching, wet and dry cyclic resistance of geopolymer
144
5.2.2.2 Accelerated wetting-drying cyclic resistance test
Accelerated wetting-drying cyclic resistance test was conducted in three different types
of solutions such as water, chloride solution (3%) and the combination of chloride (1.5%)
and sulphate (1.5%) solutions. All the samples were immersed in the water or solutions
for 24 hrs, and then the samples were allowed to dry for following 24 hrs at 23° C
temperature. This process was continued for a 6-month period. The water or solutions
were replaced in every after 15 cycles. The chloride solution was prepared with NaCl in
water, and the MgSO4 was used to produce a sulphate solution. The changes in
compressive strength, weight and the visual appearance of the samples in all three
exposed conditions were evaluated in every one-month interval for a 6-month period.
The compressive strength of the mortar samples was determined by using the Techno
test automatic compression testing machine (Techno test C030/2T) according to ASTM
C109 standard. The test machine was shown in Fig. 5-3. The compressive strength values
of the samples were measured after 28 days of curing period and then every month
interval after immersed in the solutions.
Fig. 5-3 Compressive strength testing equipment
The changes of compressive strength after subjected to accelerated wetting-drying cyclic
resistance test was determined by using the following formula:
𝑠 =
𝑆𝑛 − 𝑆𝑜
𝑆𝑜 × 100%
(10)
Page 167
Chapter 5 Study on alkali leaching, wet and dry cyclic resistance of geopolymer
145
Where, s= changes of compressive strength values after subjected to every wetting-
drying cyclic resistance, Sn= Compressive strength values of the specimens every month
interval after the wetting-drying cyclic test, So = 28 days compressive strength of the
specimens before the wetting-drying cyclic test.
Moreover, the changes of the weight of the samples were taken in every month intervals.
The total weight changes were calculated after every one-month time interval by using
the following formula:
𝑤 =
𝑊𝑛 − 𝑊𝑜
𝑊𝑜 × 100%
(11)
Where, the w= percentage of total weight changes, the Wn= weight of specimen at the
end of immersion of ‘n’ cycle, Wo= Saturated weight of specimen before the accelerated
test. During the weight measurement, specimens were taken out from the immersed
solutions and wiped the surface before measuring the weight of the specimens. The
weight measurements were measured by using an electronic scale with the accuracy of
0.01 g.
5.3 Results and discussions
5.3.1 Alkali leaching test
5.3.1.1 pH measurements of the alkali leaching solution
Fig. 5-4 illustrates the pH value variation of the solution after immersed the mortar
samples. As can be seen from Fig. 5-4, pH values of all types of the samples were
increased with the time of exposure. This indicates the alkali metals from the mortar
samples were leached out, and due to this leaching effect, pH value of the solution was
increased with exposed time. It should be noted that the pH of the solution with CT
mortar was greater than the solutions with geopolymer samples. The next day after
immersion, pH of the solution with OPC mortar sample increased to 10.8, and the pH of
the solution was continuously increased at a slow rate with the exposure period. After 7
days of the exposure period, pH of the solution was reached to a value of 12 and
maintained at that value. Moreover, higher slag based geopolymer displayed higher pH
values compared to other types of geopolymer specimens. The first day after the
immersion, pH of the solution with M4 type geopolymer was 10.5, while the increment
Page 168
Chapter 5 Study on alkali leaching, wet and dry cyclic resistance of geopolymer
146
of pH is lower than the increase in OPC concrete, which is then reached to stable
condition with the value of 11.5 after 8 days of exposure.
On the other hand, pH value of the solutions with other geopolymer mixes such as M1,
M2 and M3 types are lower, which is in the range of 8.5-9.5 after immersed one day and
the final pH of the solution were in the range of 10.5-11.5. Therefore, this indicated that
the pH value of the leaching ions from fly ash based geopolymer are low. The pH value
of the leaching ions increases when slag constituent included in the fly ash-based binder.
Fig. 5-4 pH of the solutions after continues immersion of the mortar samples
Fig. 5-5 illustrates the visual observations of the specimens after immersed in the
deionised water for a one-week period. Fig. 5-6 depicts the conditions of deionised water
after the immersion of the samples for a one-week period. As shown in Fig. 5-5 and Fig.
5-6, higher leaching effect has been identified in high slag based geopolymer (M4 type).
Compared to other geopolymer mixes, high amount of deposition and high leaching
effect was observed for M4 type mix. Compared to geopolymer samples, no depositions
were observed in the CT samples, while the immersed solution indicated the leaching of
alkali metals from the CT samples. The deposition is due to the efflorescence effect in
concrete. In OPC concrete, efflorescence occurs due to the reaction between the soluble
calcium in concrete and the water and CO2 near the surface of concrete [216, 217]. In
geopolymer concrete, efflorescence is mainly caused by the reaction between the
presence of residual soluble alkalis in geopolymer surface and the CO2 from the
atmosphere. For the efflorescence reaction, suitable humidity and water media are
important at the surface of the geopolymer concrete. Efflorescence is also caused due to
Page 169
Chapter 5 Study on alkali leaching, wet and dry cyclic resistance of geopolymer
147
the presence of excess alkalis or insufficient geopolymerisation reaction in geopolymer
[99]. Moreover, every traces of alkali ( NaOH and KOH) in geopolymer, increases the
pH of the leaching solution [218]. In addition to that, the curing type is also influenced
on the efflorescence and leaching rate of the geopolymer concrete. It was mentioned that
the geopolymer concrete cured at elevated temperature showed lower leaching and less
efflorescence compared to the geopolymer concrete cured at ambient temperature [97].
Therefore, in this study, M1 type geopolymer mix cured at 60° C temperature and other
types of geopolymer samples (M2, M3 and M4) mixes were cured at ambient temperature.
Therefore, 100%FA type geopolymer mix showed lower leaching and less efflorescence
behaviour compared to the ambient temperature cured geopolymer concrete mixes. This
is because the reaction rate of fly ash materials is increased at the elevated temperature,
a denser microstructure is formed. This reduced the excess alkalis in the geopolymer
system. Therefore, the pH of the leaching solution is lower than the other concrete mixes.
Fig. 5-5 visual observation of mortar sample after 1 week of immersion, (a) M1, (b) M2,
(c) M3, (d) M4, and (e) CT
Page 170
Chapter 5 Study on alkali leaching, wet and dry cyclic resistance of geopolymer
148
Fig. 5-6 Visual observation of solutions after 1 week of immersion, (a) M1, (b) M2, (c) M3,
(d) M4, and (e) CT
5.3.1.2 Leaching ions measurements
Table 5-1 illustrates the leaching ions from the geopolymer and OPC mortar specimens
when it is immersed in the deionised solution. Leaching of Si, Al, K, Na and Ca elements
were identified from the mortar specimens. As shown in Table 5-1, leaching of K and Na
ions were identified from all types of geopolymer specimens. The Ca ion also was
identified as leached from M2, M3 and M4 type specimens, whereas Ca ions was not
significantly leached out from M1 type specimens. Furthermore, a higher amount of Ca
is leached out from OPC specimens compared to geopolymer specimens. Moreover,
Table 5-1 displayed the leachate of Na and K from M2 type is very much higher than the
leachate of other ions and the leaching rate of Na is reduced with the substitution of slag
in the binder. M3 and M4 type geopolymer mixes showed a lower amount of leachate of
Na and K elements. However, 100 % fly ash based geopolymer mix (M1) displayed lower
leachate of Na compared to M2 type mix. This is due to the different curing method used
in between that two types. As explained earlier, elevated temperature curing reduces the
leachate of Na in M1 type, whereas ambient cured M2 type geopolymer (75% of fly ash)
shows higher leaching effect. This is correlated with the previous test results [219].
Page 171
Chapter 5 Study on alkali leaching, wet and dry cyclic resistance of geopolymer
149
Table 5-1 Leaching ions from the mortar specimens in de-ionised solution
Specimens Si (ppm) Al (ppm) K (ppm) Na (ppm) Ca (ppm)
M1 13.4 7.4 23.13 110.52 10.41
M2 24.23 9.4 32.71 145.71 0.12
M3 17.7 3.76 22.1 94.43 20.43
M4 16.5 3.4 19.5 85.8 25.35
CT 32.8 0.3 4.5 7.4 45.13
5.3.2 Concrete Resistance in Wetting-drying Cycles in water
5.3.2.1 Visual observation
Fig. 5-7 illustrates the visual observation of the mortar specimens after subjected to a
wetting-drying cycle test in water after 6 months of the exposure period. As shown that,
the different types of geopolymer specimens were undergone different types of surface
degradation. Compared to other types of geopolymer specimens, M1 type specimens
were more deteriorated after 6 months of the testing period. The second higher
deterioration effect was observed on the surface of M2 type specimens. As shown in the
figure, many numbers of pores were created on the surface of the M2 type specimens.
Compared to M1 and M2 specimens, M3 and M4 type specimens are depicted less
deterioration as only a few pores were identified after the 6 months of the test period.
This indicated that the geopolymer binder prepared with fly ash materials is more
susceptible to deterioration in the wetting-drying cycles exposed in a water
environment. The geopolymer specimens prepared with more slag content is more
stable when it is subject to cyclic contact with water. Moreover, the CT specimens also
showed a few pores, and this indicated the degradation in OPC specimens were less
compared to geopolymer specimens.
Page 172
Chapter 5 Study on alkali leaching, wet and dry cyclic resistance of geopolymer
150
Fig. 5-7 Visual observations of the mortar specimens after subjected to wetting-drying
cycles in water for 6 months period, (a) M1, (b)M2, (c)M3, (d) M4, and (e) CT
5.3.2.2 Changes in weight
Fig. 5-8 illustrates the weight changes of the mortar specimens after subjected to wetting-
drying cycles in water for 6 months period. According to that, the weight changes is very
small for all types of the specimens after 6 months of exposure. Although the weight of
the M1 and M2 type geopolymer specimens are increased initially, the weight of the
specimens is decreased after the 4 months of exposure time. However, other geopolymer
type mixes such as M3 and M4 and CT mixes are subjected to continuous weight gain
during the 6 months of experiment period. The initial weight gain during the wetting-
drying cycles would be due to the penetration of water into the specimens. When the
specimens are continuously exposed to water in wet and dry cycle conditions, the alkali
species can be leached out from the pore structures of the concrete, and this creates the
space for the penetration of water into the specimens. Moreover, M1 and M2 type
specimens showed a weight loss after some period, and this indicates the weight loss is
due to the degradation of the specimen surfaces after wetting-drying cyclic exposure.
According to the Fig. 5-7, the mortar particles were lost from the surface of the M1 and
M2 specimens, and this causes the weight of the specimens reduced after 4-month of
exposure time. Moreover, the continued weight gain of the other specimens would be
Page 173
Chapter 5 Study on alkali leaching, wet and dry cyclic resistance of geopolymer
151
due to the formation of the voids and pores on the surface of the specimens. As shown
in Fig. 5-7, M3, M4 and CT specimens are exhibited a higher number of pores and void,
and this creates a path for more water penetration into the concrete surface.
Fig. 5-8 The weight changes of the mortar specimens after subjected to wetting-drying
cycles in water for 6 months period.
5.3.2.3 Changes in compressive strength
Fig. 5-9 illustrates the compressive strength values of the mortar specimens after 28 days
of curing period. As shown that the strength values of the geopolymer specimens were
increased with the incorporation of slag into fly ash mixture. According to the figure, 28
days compressive strength values of M2, M3 and M4 mixes are 38.6 MPa, 49.52 MPa and
52.78 MPa, respectively. This is because the incorporation of slag produces additional C-
S-H gel phase with alumina-silica geopolymerisation network reaction due to the
presence of Ca in the slag materials. Therefore, the strength of the geopolymer is
enhanced with the formation of such two geopolymer phases. It should be noted that
the geopolymer prepared with 100% of fly ash material (M1 type) produces higher
compressive strength compared to the geopolymer mix prepared with 75% fly ash and
25% of slag combination (M2 type). This is because the two different curing methods
have been used in between those two types of mixes. The M1 type geopolymer mix was
cured at 60 °C elevated temperature, whereas M2 type geopolymer mix was cured at
ambient temperature. It is worth to mention here that the heat curing method is
favourable for fly ash based geopolymer mix. The reaction is accelerated at high
Page 174
Chapter 5 Study on alkali leaching, wet and dry cyclic resistance of geopolymer
152
temperature, and due to that, the rate of reaction will be increased. Therefore, heat cured
fly ash based geopolymer produces higher compressive strength compared to ambient
cured geopolymer mix with high fly ash content.
Moreover, the 28 days compressive strength of M4 type mix and CT specimens can be
comparable. This indicates geopolymer binder depicts similar or superior strength
properties when the slag content is high in the geopolymer mix compositions.
Fig. 5-9 28 days Compressive strength of the mortar specimens
Fig. 5-10 shows the percentage of strength loss of mortar specimens after subjected to
wetting and drying resistance test for a 6-month period. As shown that all the specimens
except the M1 type displayed an initial increment in the compressive strength and then
followed by a continuous deduction in the strength values. The increase of the strength
is due to the hydration of calcium silicates and the pozzolanic reactions, which result in
internal confinement and the strength increment in the specimens [87]. Therefore, the Ca
components is available in M2, M3 and M4 types of geopolymer specimens due to the
slag inclusion, whereas 100% fly ash binders produced M1 type geopolymer mix.
Therefore, the strength increment was observed all other geopolymers mix except M1
type. Moreover, CT samples are prepared with OPC binder, and therefore, hydration
reaction is usual in OPC specimens when it contacts with water. Therefore, this
attributed the strength increment in the first few months of exposures.
Page 175
Chapter 5 Study on alkali leaching, wet and dry cyclic resistance of geopolymer
153
However, it should be noted that the compressive strength values of all the specimens
were started to reduce after some period of exposure. As can be seen in Fig. 5-10, the rate
of strength loss is high when the geopolymer specimens contain fly ash binders, and the
strength loss is reduced with the incorporation of slag into the geopolymer mix.
Moreover, CT specimens exhibited lower strength loss rate compared to all types of
geopolymer specimens. This indicates OPC concrete is more durable compared to
geopolymer concrete when they have partially exposed to water.
Fig. 5-10 Compressive strength loss of the mortar specimens after subjected to wetting-
drying cycles in water
5.3.3 Concrete Resistance in Wetting-drying Cycles in chloride solution
5.3.3.1 Visual observation
Fig. 5-11 depicts the visual conditions of the mortar specimens after subjected to wetting-
drying cycles in 3% of NaCl solutions for 6 months period. As shown that the more
deterioration was identified in M1 type geopolymer specimens compared to all other
types of the mix. The formation of cracks was observed on the surface of the M1 samples,
and some mortar particles were started to remove from the surface of the specimens.
This indicated that the degradation of fly ash-based binder in a chloride environment is
higher than the geopolymer binder produced with slag materials. In other types of
geopolymer specimens (M2, M3 and M4), some small pores and holes were identified
after the exposures. Moreover, it should be noted that there is no visual sign of
Page 176
Chapter 5 Study on alkali leaching, wet and dry cyclic resistance of geopolymer
154
degradation was observed on the surface of CT specimens after 6 months of exposure.
This indicates the degradation of OPC binder is less than the geopolymer binder under
chloride exposed solutions.
Fig. 5-11 Visual observations of the mortar specimens subjected to wetting-drying cycles
in 3% of NaCl solutions for 6 months period, (a) M1, (b) M2, (c) M3, (d) M4, and (e) CT
5.3.3.2 Changes in weight
Fig. 5-12 depicts the weight changes of the mortar specimens after subjected to wetting-
drying cycles in NaCl solution for 6 months period. As shown that the weight of all
specimens is increased with the exposure time. The weight increment would be due to
the intrusion of chloride ions into the mortar specimens. The intrusion of chloride ions
also created the internal micro-cracks, and this causes more chloride ions penetrates into
the specimens. Therefore, the weight of the specimens increased with the time of
exposure. Moreover, M1 type geopolymer specimens displayed more weight gain and
this indicates the penetration of Cl ions to the fly ash based geopolymer specimens is
higher than the penetration to the geopolymer specimens prepared with fly ash- slag
blended geopolymer specimens. In addition, M4 type geopolymer and CT specimens are
showed similar weight changes when subjected to wetting-drying cycles in NaCl
Page 177
Chapter 5 Study on alkali leaching, wet and dry cyclic resistance of geopolymer
155
solution. The visual observation also correlated with the weight change results. As
shown in Fig. 5-11, more surface deterioration was identified on the surface of the M1
type specimens compared to other types of the mortar specimens. It should be noted that
the weight of the M1 type geopolymer mortar specimens was decreased after subjected
to wetting-drying cycles in water due to the surface deterioration. However, here, even
though the surface of the M1 type specimens was deteriorated, the weight of the
specimens was continuously increased with the time. This is due to the higher amount
of chloride ion penetration to the concrete samples.
Fig. 5-12 The weight changes of mortar specimens after subjected to wetting-drying
cycles in 3% of NaCl solutions for 6 months period.
5.3.3.3 Changes in compressive strength
Fig. 5-13 displays the loss of compressive strength values of geopolymer and control
specimens after subjected to wetting-drying cycles in chloride solutions. As we can see
in Fig. 5-13, the compressive strength of geopolymer specimens were decreased with the
exposed period. However, deduction rate is not same between the different types mixes.
The geopolymer mix prepared with 100% fly ash materials exhibits a higher loss in
compressive strength values compared to other types of mixes. On the other hand, CT
specimens was initially showed a strength increment and then the strength values are
started to decrease with the time of exposoure. The strength increment in CT specimesn
is due to the hydration reaction in contact with water.
Page 178
Chapter 5 Study on alkali leaching, wet and dry cyclic resistance of geopolymer
156
Fig. 5-13 Compressive strength loss of the mortar specimens after subjected to wetting-
drying cycles in 3% of NaCl solutions for 6 months period.
5.3.4 Concrete Resistance in wetting-drying Cycles in a chloride+ sulphate
solution
5.3.4.1 Visual observation
Fig. 5-14 shows the visual observation of the mortar specimens after subjected to
wetting-drying cycles in 1.5% NaCl+1.5% of MgSO4 solutions after 6 months of the
exposure period. As shown in Fig. 5-14, the white colour deposition was observed on
the surface of all specimens. It should be noted that the geopolymer specimens displayed
the higher amount of depositions compared to the deposition on the control specimens.
Moreover, in between the geopolymer mixes, a higher amount of deposition was
observed on the geopolymer specimens prepared with a higher proportion of fly ash.
The development of this white layer on the geopolymer specimen would be due to the
formation of sodium carbonate (Na2CO3) components. Similar results were observed in
previous studies as well [87, 220]. Here, the specimens were taken out, wiped with
clothes, and then it was freely allowed to dry in the room condition. After that only, this
white layer was formed on the surface of the specimens. It should be noted here that,
Bakharev [131] observed the migration of alkalis from geopolymer samples at the
sulphate exposed environment. Therefore, the formation of the Na2CO3 is due to the
reaction between the alkalis (Na+, K+) and the carbon dioxide (CO2) from the
atmospheric environment. Furthermore, this study confirms the higher leaching effect
Page 179
Chapter 5 Study on alkali leaching, wet and dry cyclic resistance of geopolymer
157
was observed in fly ash based geopolymer higher white deposition on the M1 sample.
Therefore, this indicated that under aggressive conditions more alkalis are leached out
from fly ash based geopolymer compared to slag based geopolymer.
Fig. 5-14 Visual observations of the mortar specimens subjected to wetting-drying cycles
in 1.5% NaCl+1.5% of MgSO4 solutions for 6 months period, (a) M1, (b) M2, (c) M3, (d)
M4, and (e) CT.
5.3.4.2 Changes in weight
Fig. 5-15 illustrates the weight changes of the mortar specimens after subjected to
wetting-drying cycles in chloride and sulphate solution for 6 months period. As shown
that the weight of all specimens is increased with the exposure time, which is similar to
the weight changes after exposure to wetting-drying cycles in chloride solution. The
weight increment under the exposure of chloride and sulphate solution would be due to
two possible reasons. The first reason would be due to the intrusion of the chemical
particles, and the weight of the mortar specimens is increased by the weight of the
chemical particles. The second reason would be the expansion of the mortar specimens
when it is exposed to sulphate solutions. The intrusion of sulphate ion into the concrete
attributes the expansion and causes internal micro-cracks will be formed in the concrete.
Due to these cracks, the intrusions of chemical particles will be increased, and therefore,
the weight of the specimens was increased with the time of exposure.
Page 180
Chapter 5 Study on alkali leaching, wet and dry cyclic resistance of geopolymer
158
Moreover, M1 type geopolymer specimen showed a rapid weight increment compared
to other types of samples. This indicates the formation of the cracks in the M1 type would
be higher than other types of geopolymer and OPC specimens. Therefore, this revealed
that the deterioration of fly ash based geopolymer specimens is higher than slag-fly ash
based geopolymer and OPC specimens when it is exposed to the environment with
chloride and sulphate contents.
Fig. 5-15 The changes of the weight of the mortar specimens after exposed to 1.5%
NaCl+1.5% of MgSO4 solutions.
5.3.4.3 Changes in compressive strength
Fig. 5-16 displays the loss of compressive strength values of geopolymer and control
specimens after subjected to wetting-drying cycles in 1.5% NaCl+1.5% of MgSO4
solutions. As we can see in Fig. 5-16, the compressive strength of all types of specimens
were decreased with the exposure period. However, deduction rate is not the same
between the different types of mixes. The geopolymer mix prepared with 100% fly ash
materials exhibits a higher loss in compressive strength values compared to other types
of mixes. The percentage of strength losses of M1, M2, M3, and M4 are 27%, 20%, 14% and
13%, respectively.
On the other hand, the strength loss in CT samples was only 9% after 6 months of
exposure. This indicates the geopolymer binders showed higher degradation under the
chloride and sulphate solutions media compared to OPC binder. Moreover, this study
Page 181
Chapter 5 Study on alkali leaching, wet and dry cyclic resistance of geopolymer
159
also shows, 100% fly ash based geopolymer binder is more vulnerable to chloride and
sulphate attack and the strength reduction is decreased with the increment of slag in the
geopolymer binder. This contradicts with the test results obtained in a previous research
study. It was mentioned previously that the heat cured low Ca fly ash based geopolymer
mortar consists of higher sulphate resistance under MgSO4 and NaCl media [134].
However, according to this study, higher strength degradation was obtained for heat
cured fly ash based geopolymer binder. Moreover, the visual observations of the
specimens after 6-month period also confirmed that the more alkalis leached from 100%
fly ash based geopolymer compared to another type of geopolymer mix. More leaching
of alkali ions can react with the Mg2+, Cl- and SO42- ions and this reduces the higher
amount of strength compared to other geopolymer mixes. Therefore, this study
indicated that the curing method is not affected the degradation and strength loss in the
combination of chloride and sulphate environment. The rate of deterioration and the
strength loss depends on the type of source materials used in geopolymer preparation.
Moreover, it should be noted that the strength loss under the 1.5% NaCl+1.5% MgSO4
solution was higher than the strength loss observed in chloride solutions and water. This
is due to the sulphate attack on the specimens under 1.5% NaCl+1.5% of MgSO4.
Fig. 5-16 Compressive strength loss of the mortar specimens after exposed to 1.5%
NaCl+1.5% of MgSO4 solutions.
Page 182
Chapter 5 Study on alkali leaching, wet and dry cyclic resistance of geopolymer
160
5.4 Concluding remarks
This chapter investigated the alkali leaching and wetting-drying cyclic resistances of
geopolymer in different exposed condition. To determine the influence of the source
materials on the leaching properties and wetting-drying cyclic resistances, geopolymer
mortar samples were prepared with different proportion of fly ash and slag constituents.
The leaching of alkali elements from the geopolymer specimens was determined by
immersed in deionised water. Accelerated wetting-drying cyclic resistance test was
conducted on the samples exposed to three different types of media such as water,
chloride solution and the combination chloride and sulphate solution. The degradation
of the mortar specimens was evaluated with the measurements of compressive strength
loss and the weight changes after the exposed conditions with the time intervals.
According to the investigation results, the following conclusions can be drawn:
The pH measurements of the leaching solutions indicated that the pH value
leaching ions from fly ash based geopolymer are low and the pH value increases
when slag constituent included in the fly ash-based binder.
The leaching test confirmed that the curing temperature is influenced on the
leaching rate from fly ash based geopolymer binder in the deionised water.
According to the test results, ambient cured geopolymer with high fly ash
content exhibits higher leachate of Na compared to higher temperature cured fly
ash based geopolymer.
The degradation of geopolymer specimens is higher than OPC specimens when
subjected to accelerated wetting and drying resistance test under the water,
chloride and the combination of chloride and sulphate environment.
The resistance to accelerated wetting and drying environment of geopolymer
specimens is increased with the increment of slag content in the geopolymer mix.
Geopolymer specimens displayed more strength loss and the weight changes
than OPC specimens after subjected to the accelerated environment.
The degradation of the specimens in the combination of chloride and sulphate
environment is severe than the effect on chloride and water environments. In
addition, the chloride environment attributes more deterioration compared to
the mortar specimens exposed to water.
Page 183
Chapter 6 Accelerated carbonation and
corrosion test on geopolymer concrete
6.1 Introduction
This chapter presents the investigation of accelerated carbonation and corrosion tests on
geopolymer concrete. According to the field exposed geopolymer concrete samples,
corrosion of reinforcement in geopolymer concrete was not completely studied. The
reinforcement bars have been identified from some of the structures and not recognised
in some structures due to the higher depth level of the bar in the structures. Therefore,
this chapter investigates the corrosion of reinforcement bar in the geopolymer concrete
prepared with different of mix compositions. The effect of source materials on the
carbonation and corrosion behaviour of geopolymer concrete has been evaluated in this
chapter. The tests were conducted on the geopolymer concrete specimens prepared with
different proportion of fly ash, ground granulated blast furnace slag (GGBFS) materials
and the test results were compared with Ordinary Portland cement (OPC) concrete in
1% of the CO2 environment.
Moreover, this chapter also depicts the carbonation depth measurements by a new type
of indicator; i.e. universal solution. Carbonation of geopolymer concrete was determined
after 6 months of exposure.
6.2 Materials and methods
6.2.1 Materials
Three different types of geopolymer concrete mixes were prepared by changing the
proportion of fly ash and slag in the binder content. To prepare the geopolymer binder,
class F fly ash and GGBFS are used as source materials with different proportions. The
proportion of fly ash and GGBFS in the mix of 100FA, 75F/25S and 50F/50S are 100:0,
75:25 and 50:50, respectively. A combination of sodium silicate (Na2SiO3) solutions and
sodium hydroxide (NaOH) solutions are used as activators to activate the geopolymer
Page 184
Chapter 6 Accelerated carbonation and corrosion test on geopolymer concrete
162
materials. The NaOH solution (concentration of 8M) was prepared by dissolving NaOH
flakes (98% of purity) in water. The mix compositions details of geopolymer and OPC
concrete are provided in Table 6-1.
Table 6-1 Mix composition details of geopolymer and OPC concrete mixes
Materials(kg/m3) 100FA 75F/25S 50F/50S CT
Total binder 400 400 400 400
Fly ash 400 300 200 -
GGBFS - 100 200 -
Cement - - - 400
Fine aggregate 630 630 630 630
Coarse aggregate 1150 1150 1150 1150
NaOH solution 41 (8M) 41 (8M) 41 (8M)
Na2SiO3 solution 102 102 102
Water 22.5 22.5 22.5 Water/cement
ratio=0.5
Extra water - - 20 -
Superplasticiser (SP) 6 6 6 -
The alkaline solutions are mixed one day before the concrete casting. During the
preparation of concrete, the dry components such as coarse aggregate, sand and
geopolymer precursors (fly ash or GGBFS or combination of fly ash and GGBFS) were
placed into the concrete mixer, and the mixing was continued for 3 minutes. Thereafter,
the activator solution and the water components were added to the dry mixture and
continuously mixed for another 4 minutes. To improve the workability of geopolymer,
high range water reducing (naphthalene sulphonate- based) super plasticiser was used
in all types of geopolymer mixes [33]. The amount of superplasticiser added in the mix
was 1.5% of the total binder content. Fig. 6-1 shows the process methods for the concrete
preparation. The mixing of dry components and the fresh concrete after the mixing
process are shown in Fig. 6-1 (a) and Fig. 6-1 (b), respectively. Fig. 6-1 (c) shows the prism
type moulds with reinforcement, which are used to prepare the concrete specimens for
the accelerated corrosion test. For accelerated corrosion test, 75 mm×75 mm×400 mm
size of concrete prism specimens were prepared with 12 mm diameter of embedded
Page 185
Chapter 6 Accelerated carbonation and corrosion test on geopolymer concrete
163
reinforcement bar. The cover size provided for the reinforcement bars was 15 mm. For
the accelerated carbonation test, 100 mm diameter ×200 mm height of cylindrical
specimens were prepared. Fig. 6-1(d) shows the cast specimens for both accelerated
carbonation and corrosion tests.
OPC concrete (CT) also prepared with the same method as geopolymer concrete
production. Initially, the dry mix components such as coarse aggregate, sand and cement
were placed into the concrete mixer and mixed for 3 minutes, and then the wet mix was
continued for 4 minutes after adding the water into the dry mix. The water-cement ratio
used in the OPC concrete production is 0.5.
Fig. 6-1 Concrete preparation process, (a) mixing of dry components in a concrete mixer,
(b) concrete after mixing with water, (c) mould for accelerated corrosion test, (d) concrete
specimen after casting.
The concrete specimens were removed from the moulds after 24 hrs of casting period.
Thereafter, the samples were subjected to the curing process for the next 28 days. The
100FA type geopolymer mix sample was cured at 60°C for 24 hrs and then kept at
ambient temperature. Other types of geopolymer mixes such as 75F/25S and 50F/50S
are subjected to curing at ambient temperature. On the other hand, OPC concrete
Page 186
Chapter 6 Accelerated carbonation and corrosion test on geopolymer concrete
164
specimens were cured in water curing methods. The samples were kept in the water
curing tank with 23 °C control temperature for 28 days.
6.2.2 Testing methods
6.2.2.1 Carbonation and corrosion testing procedure
The accelerated carbonation and corrosion test were conducted after the 28 days of
curing period. For the carbonation assessment, cylindrical specimens were cut into 4
pieces with a 50 mm thickness of each section. The cutting process of the specimen is
provided in Fig. 6-2. Thereafter, the epoxy coating was applied on the peripheral surface
of each specimen to avoid the penetration of CO2 through the peripheral surface.
Therefore, this ensures the CO2 penetration is through the circular surfaces only.
Fig. 6-2 Cutting of concrete specimens by using a table saw
The exposure condition of the concrete influence on the rate of carbonation. In general,
the CO2 diffusion is high when the concrete specimens are contacted with water
compared the concrete specimens exposed in a dry environment. Moreover, the rat of
carbonation is high when the concrete specimens are exposed in marine/saline
environment compared to normal atmospheric environment. Therefore, the accelerated
carbonation and the corrosion assessment were carried out with the following three
different methods of exposure condition:
Page 187
Chapter 6 Accelerated carbonation and corrosion test on geopolymer concrete
165
One set of specimens were continuously exposed to 1% CO2 environment.
Other sets of specimens were subjected to cyclic exposed wet and dry conditions;
04 days exposed in 1% CO2 environment and the next 03 days exposed in the
water media.
The next sets of specimens were subjected to wet and dry cyclic exposure in the
CO2 environment and chloride water solutions. The concrete specimens were
exposed to 1% CO2 environment for 04 days and then the next 03 days were kept
in the chloride solutions
The carbonation test was conducted in a controlled environment chamber. All
carbonation and corrosion test specimens were placed in an environmental chamber at
a temperature of 23°C, relative humidity of 65%, and a CO2 concentration of 1%. The
CO2 concentration was maintained at 1% throughout the testing period. Because, it was
found that the higher concentrations of CO2 create bicarbonate reaction products for
geopolymer binder under accelerated testing method. This attributes higher carbonation
depth compared to normal field exposed conditions [28]. Fig. 6-3 shows the carbonation
chamber, which is used for this investigation.
Chloride solution was prepared by dissolution of 3% of sodium chloride (NaCl) in water.
The test was conducted for a 6 month period. Carbonation depth values of the concrete
specimens and the corrosion of reinforcement bar in the concrete specimens were
evaluated after 6 month exposed period.
Page 188
Chapter 6 Accelerated carbonation and corrosion test on geopolymer concrete
166
Fig. 6-3 Environment chamber for Carbonation test
6.2.2.2 Carbonation depth measurements
Carbonation depth of the concrete specimens was determined by using two different
types of indicator solutions such as universal solution and phenolphthalein indicator.
Since phenolphthalein indicator was identified as a not suitable solution to determine
the carbonation depth of geopolymer concrete prepared with fly ash materials, the
universal solution was used to measure the carbonation depth of geopolymer concrete.
The universal solution provides the colour change with the pH variation between 1 to
14. Fig. 6-4 shows the colour chart of universal solution.
Both types of indicators were applied to the fresh concrete surface immediately after the
split the specimens, and the depth of carbonation was measured with the colour change
of the indicators by using the measuring tape.
Fig. 6-4 Colour chart of the universal solution with a pH value
Moreover, the carbonation depth of field exposed geopolymer concrete samples also
measured by universal solutions.
6.2.2.3 Evaluation of corrosion of reinforcement
Corrosion behaviour of the reinforcement bar was visually inspected after 06 months of
testing period. After 06 months of exposure, concrete specimens were split, and the
corrosion of the reinforcement bar is visually observed. The electric resistivity
measurements were also taken at every month interval. Electric Resistivity readings
were determined by Resipod fully integrated, four-point Wenner probe resistivity meter
(Fig. 6-5). The relationship between the electric resistance and the risk of corrosion for
OPC concrete at 20⁰C is given in Table 6-2 [221]. In addition, Table 6-3 shows the
relationship between the electric resistance and the rate of corrosion.
Page 189
Chapter 6 Accelerated carbonation and corrosion test on geopolymer concrete
167
Fig. 6-5 Resipod resistivity meter
Table 6-2 The relationship between resistivity and risk of corrosion [221].
Table 6-3 The relationship between resistivity and corrosion rate
Resistivity (kΩcm) Corrosion rate
> 20 kΩ cm Low
10-20 kΩ cm Low to moderate
5-10 kΩ cm High
< 5 kΩ cm Very High
Before taking the reading, four probes of the Resipod were soaked into the water to
increase the conductivity. Then, the Resipod was pressed on the concrete surface to
Resistivity value(kΩcm) Risk of corrosion
≥ 100 kΩcm Negligible
50 to 100 kΩcm Low
10 to 50 kΩcm Moderate
≤ 10 kΩcm High
Page 190
Chapter 6 Accelerated carbonation and corrosion test on geopolymer concrete
168
measure the resistivity readings. Three readings were measured from each specimen to
determine the average value.
6.3 Results and discussions
6.3.1 Carbonation depth measurement by universal and phenolphthalein
indicators
Fig. 6-6 shows the concrete specimens after the application of universal solution on a
fresh stage of the concrete (before carbonation). As shown that the colour of the concrete
surface was varied in different types of the concrete according to the pH of the concrete
surface. The colour identified in 100 FA and 75 FA/25 S specimens are a type of green
colour, which is corresponding to the pH value in the range of 10.0-11.0. On the other
hand, the colour identified on the surface of the 50FA/50S concrete is closed to a violet
colour, and that is in the range of 12.0-14.0. This indicated that the mix compositions is
influenced on the pH of the geopolymer concrete. The geopolymer concrete prepared
with fly ash-based materials exhibits lower pH range, whereas pH of the geopolymer
concrete increases with the addition of slag materials into the fly ash based geopolymer
mix. Moreover, Fig. 6-6 also displayed that the OPC concrete surface was turned to violet
colour after the universal solution application. This confirmed that the pH range of fresh
OPC concrete was in the range of 12.0-14.0, which is the normal pH range of OPC
concrete.
Fig. 6-6 Application of universal solution on the fresh geopolymer and OPC concrete
surfaces (before carbonation)
Page 191
Chapter 6 Accelerated carbonation and corrosion test on geopolymer concrete
169
Fig. 6-7 represents the carbonation depth measurements of concrete specimens after
exposed to 1% CO2 environment for 6 months of period. The carbonation depth was
measured by the application of phenolphthalein indicator and universal indicator
solution. For every specimen, the image on the left-hand side represents the concrete
surface after the phenolphthalein application, and the image on the right-hand side
indicates the concrete surface after the application of the universal solution. As shown
in Fig. 6-7, concrete surface of 100FA and 75FA/25S specimens was turned into a pink
colour and green colour after the application of phenolphthalein and universal solution,
respectively. According to the colour chart of the universal solution, the surface of both
types of concrete specimens is matched with the pH range of 9.0-10.0. It should be noted
that the type of green colour identified by the application of universal solutions on the
surface of 100FA and 75FA/25S specimens are different before and after the carbonation
(Fig. 6-6 and Fig. 6-7). The corresponding green colour before carbonation was in the
range of 10.0-11.0, whereas the green colour observed after the carbonation was matched
with the pH range of 9.0-10.0. This indicated that the pH of 100FA and 75FA/25S
concrete is reduced after the carbonation. However, the reduction is very small.
Therefore, the phenolphthalein solution was turned to a pink colour after the
carbonation. The colourless zone can be able to identify when the pH is reduced to less
than 9.0. Furthermore, the colour identified after the carbonation of both types of
geopolymer concrete was unique throughout the depth. This indicated that the
carbonation rate of 100FA and 75FA/25S is very fast and the CO2 is penetrated
completely throughout the specimen in a 6-month period.
On the other hand, carbonation depth values for 50FA/50S geopolymer mix was clearly
identified by universal solutions as well as the phenolphthalein indicator. Carbonation
depth value identified from the phenolphthalein indicator was 10 mm after 6 months of
exposure in 1% of the CO2 environment. Moreover, the universal solution application
also provides a similar pattern of carbonation. The colour observed in the carbonated
zone of 50FA/50S is clearly varied from the carbonated part colour of 100FA and
75FA/25S. The identified colour for the carbonated part of 50FA/50S concrete is
corresponding to the pH range 8.0-9.0, respectively. The pH value observed before
carbonation is in the range of 12.0-14.0. This indicated the reduction of pH after the
carbonation was greater than the reduction observed in 100FA and 75FA/25S type
mixes.
Page 192
Chapter 6 Accelerated carbonation and corrosion test on geopolymer concrete
170
Moreover, OPC concrete revealed the carbonation depth was 6 mm after 6 months of
exposure in 1% of the CO2 environment. The phenolphthalein indicator showed 6 mm
colourless zone, and 6 mm greenish yellow colour zone was identified from the universal
solution application. The colour observed in the carbonated zone of OPC concrete from
the universal solution is corresponding to the pH range of 7.0-8.0. Therefore, this
indicated that the pH reduction due to the carbonation in OPC concrete was higher than
the geopolymer concrete. However, the carbonation depth of OPC concrete is lower than
the geopolymer concrete in the same exposed period.
Fig. 6-7 Carbonation depth measurements of the concrete samples after exposed to 1%
CO2 environment for 6 months period
Fig. 6-8 illustrates the carbonation depth measurements of the concrete specimens after
subjected to wet and dry cyclic exposure in 1% of CO2 + water environment for a 6-
Page 193
Chapter 6 Accelerated carbonation and corrosion test on geopolymer concrete
171
month period. As similar to the normal CO2 environment, the concrete surface of 100FA
and 75FA/25S specimens was turned into pink and green colours after the application
of phenolphthalein and universal solution, respectively. This indicated that the pH
reduction in the cyclic exposure in CO2 + water environment for 100FA and 75FA/25S
types were in the range of 9.0-10.0. Furthermore, the CO2 is penetrated throughout the
samples, which is also similar to the normal 1 % CO2 exposure condition. Compared to
100FA and 75FA/25S specimen, 50FA/50S and OPC concrete are showed better
responses with phenolphthalein as well as the universal solution. Carbonation depth
was observed in the 50FA/50S, and OPC concrete was 16 mm and 8 mm, respectively.
These values are greater than the values observed in 1% of the normal CO2 environment.
It should be noted that the rate of CO2 diffusion depends on the internal moisture content
of the concrete. The moisture content of the concrete is varied under the wet and dry
cyclic environment, and due to that, the carbonation rate is greater than the normal
exposed environment.
Page 194
Chapter 6 Accelerated carbonation and corrosion test on geopolymer concrete
172
Fig. 6-8 Carbonation depth measurements of the concrete samples after subjected to
wet and dry cyclic exposure in 1% of CO2 + water environment for a 6-month period
Fig. 6-9 displays the carbonation depth measurements of geopolymer and OPC concrete
specimens after subjected to wet and dry cyclic exposure in 1% of CO2 environment +
chloride solution for a 6-month period. As shown that the carbonation depth of all types
of concrete specimens higher than the carbonation depth observed in the other two
exposed conditions. The phenolphthalein application on the surface of 100FA and
75FA/25S specimens were turned to almost colourless, and the application of universal
solution was changed to light yellowish green colour (pH range of 8.0-9.0) for all over
Page 195
Chapter 6 Accelerated carbonation and corrosion test on geopolymer concrete
173
the surface. This indicated that the carbonation effect on 100FA and 75FA/25S is severe
when it is subjected to wet and dry cyclic exposure in CO2 and chloride solution. The
application of phenolphthalein and universal solution indicated that the carbonation
depth obtained for 50FA/50S sample was 18 mm after exposed to 6 months in wet and
dry chloride and CO2 environment. In the same environment, OPC concrete displayed
the carbonation depth was 10 mm. This is revealed that the carbonation effect on
geopolymer concrete is higher than OPC concrete in any exposed environment.
Moreover, this investigation indicated that the geopolymer concrete prepared with more
slag content displayed higher carbonation resistance compared to fly ash based
geopolymer.
It was determined from this investigation that the universal solution is a more suitable
indicator for geopolymer concrete to determine the carbonation depth values.
Especially, for the geopolymer concrete prepared with the fly ash based material, which
is not able to determine the carbonation by phenolphthalein indicator. Therefore, due to
the wide range of colour variation in universal solutions, the pH reduction in
geopolymer concrete can be easily identified. Therefore, universal solution is suitable to
determine the carbonation measurements of geopolymer binders.
Page 196
Chapter 6 Accelerated carbonation and corrosion test on geopolymer concrete
174
Fig. 6-9 Carbonation depth measurements of the concrete samples after subjected to wet
and dry cyclic exposure in 1% of CO2 environment + chloride solution for a 6-month
period
Page 197
Chapter 6 Accelerated carbonation and corrosion test on geopolymer concrete
175
6.3.2 Carbonation depth measurement of field-exposed fly ash based
geopolymer concrete samples by universal solution
The carbonation depth values of the core specimens were determined by universal
solution. Fig. 6-10 shows the carbonation depth of fly ash based geopolymer concrete
exposed in field condition. It should be noted that the phenolphthalein indicator was not
provided precise carbonation measurements for fly ash based geopolymer concrete
(FGPC-A) after exposed to the atmospheric environment. Therefore, a new indicator; the
universal solution was applied on the concrete surface after splitting the core specimens.
As shown in Fig. 6-10, the concrete surface of fly ash based geopolymer concrete samples
from the aggressive environment (FGPC-S) was turned into yellow colour, which
indicates the pH of the concrete surface was in the range of 6.0 -7.0. OPC concrete
samples from the same aggressive exposed condition (OPC-S) showed yellow colour for
15 -17 mm and green colour identified below that depth level (pH range between 8.0 -
9.0). Therefore, carbonation measurements by the universal indicator are similar to the
carbonation measurements by phenolphthalein solution. During to the phenolphthalein
indicator application, geopolymer concrete (FGPC-S) was turned to colourless
throughout the surface, and OPC concrete (OPC-S) displayed a maximum 20 mm
carbonation values.
On the other hand, fly ash based geopolymer concrete core specimens in the atmospheric
environment (FGPC-A) was changed to pink colour during the phenolphthalein
application (Chapter 3). According to Fig. 6-10, the application of universal solution also
displayed green colour throughout the surface. However, by the variation of colour
change of universal solution with pH value, it can be confirmed that the pH of
geopolymer concrete was in between 9.0-10.0. This is similar to the values obtained from
pH profile measurements (Chapter 3). Furthermore, OPC concrete specimens (OPC-A)
displayed a yellow and green colour combination (pH values in the range of 6.0-9.0) for
4 mm, and similar behaviour has been identified by phenolphthalein solution.
Therefore, according to this study, the carbonation depth of fly ash based geopolymer
concrete is measured by the universal solution. The reduction of pH in fly ash based
geopolymer concrete with the carbonation reaction is very small. The pH of the fly ash
based geopolymer concrete after carbonation is in the range of 9.0-10.0. Therefore, the
phenolphthalein solution is not workable to identify the carbonation reaction in fly ash
Page 198
Chapter 6 Accelerated carbonation and corrosion test on geopolymer concrete
176
based geopolymer concrete. Therefore, determine the pH value is an appropriate
method to identify the carbonation of fly ash based geopolymer concrete. However, in
practical, it is difficult to determine the pH profiles in all the time. Therefore, this study
confirmed that the universal solution is a suitable way to determine the carbonation
depth and pH measurements of fly ash based geopolymer concrete.
Fig. 6-10 carbonation measurements of core specimens from aggressive and atmospheric
exposed environment.
6.3.3 Evaluation of corrosion of reinforcement
6.3.3.1 Visual observations of the specimens after 6 months of exposure
Fig. 6-11 depicts the visual conditions of the geopolymer and OPC concrete specimens
after exposed to 1% of the CO2 environment, wet and dry cyclic exposure in 1% of CO2
+ water environment and wet and dry cyclic exposure in 1% of CO2 + chloride solution.
As shown that the surface of the concrete specimens was not deteriorated after exposed
to the 1% of the CO2 environment (Fig. 6-11 (a)). The concrete surfaces remained similar
as before conducting the experimental analysis. Fig. 6-11 (b) shows the visual conditions
of the specimens after subjected to wet and dry cyclic exposed in CO2 environment and
water. According to that, the concrete surfaces were not changed after the 6 months of
the exposed condition, which indicated that the concrete specimens were not
deteriorated in CO2 and water exposure.
Page 199
Chapter 6 Accelerated carbonation and corrosion test on geopolymer concrete
177
On the other hand, Fig. 6-11 (c) displays the concrete specimens after subjected to CO2
and chloride solution. As shown that the deposition of salt was recognized on the surface
of OPC concrete and 100FA concrete specimens. In addition, the formation of cracks also
identified on the surface of 100FA concrete specimens. Compared to 100FA, the surface
deterioration of 75F/25S and 50F/50S specimens were lower in CO2 + chloride exposed
conditions. This indicated that the deterioration of geopolymer concrete prepared with
100% fly ash materials is high in the aggressive condition, and the deterioration effect is
reduced by the incorporation of slag materials in the geopolymer mix.
Fig. 6-11 Visual observation of the concrete specimens after 6 months of exposure in (a)
1% of the CO2 environment, (b) wet and dry cyclic exposure in 1% of CO2 environment
+ water, (c) wet and dry cyclic exposure in 1% of CO2 environment + chloride solution
Page 200
Chapter 6 Accelerated carbonation and corrosion test on geopolymer concrete
178
6.3.3.2 Electric resistivity measurements
The electrical resistance of concrete provides the information about the corrosion risk
and the rate of the corrosion in reinforced concrete structures. Fig. 6-12 represents the
electric resistivity measurements of geopolymer and OPC concrete before exposed to the
CO2 environment. As shown that the geopolymer concrete specimens displayed lower
electric resistance values compared to OPC concrete specimen. It should be noted that
the alkali contents, which presents in the pore solution of the concrete are mainly
influenced on electrical resistance values [222]. Resistivity values are decreased with
high alkali content in the pore solution. Geopolymer concrete is produced with a high
amount of alkali components as activators. Therefore compared to OPC concrete, lower
resistance values are obtained for geopolymer concrete due to the high alkali species
(NA+, K+) in the pore solution of concrete.
Moreover, Fig. 6-12 also showed that the resistivity values are increased with the slag
substitution in the fly ash based geopolymer mix. As shown that 50FA/50S type
geopolymer mix shows higher resistivity values compared to 75FA/25S and 100FA type
geopolymer mixes. It is worth to mention here that the electric resistance depends on the
porosity of the concrete surface. The electrical resistivity values are increased with less
pore structure. In slag based geopolymer concrete, the porosity and pore size are
reduced by filling of pores with fine slag particles and produced dense geopolymer
concrete structure. Therefore, the resistivity of the geopolymer concrete increased by
higher slag content in the binder. This is correlated with the carbonation test results.
Carbonation resistances of geopolymer concrete also increased with the substitution of
slag in the geopolymer mix. Furthermore, according to the information provided by
Polder [221], the risk of corrosion in geopolymer concrete structure with the electric
resistivity values in the range of 50 -100 kΩ.cm is in the low-risk region for corrosion.
Page 201
Chapter 6 Accelerated carbonation and corrosion test on geopolymer concrete
179
Fig. 6-12 Electric resistivity measurements before exposed to the CO2 environment
Fig. 6-13 illustrates the electric resistance of the concrete specimens subjected to 1 % of
the CO2 environment. As shown that the electric resistance of the concrete specimens is
much not varied with the time of exposure. The electric resistance values are almost
similar to the values obtained before exposed to the CO2 environment. This indicates the
risk of corrosion is low when it is exposed to the normal CO2 environment (without
contact water or any aggressive solutions). Fig. 6-14 illustrates the electric resistance of
the concrete specimens after subjected to 1 % of CO2 + water environment. According to
that, the resistivity values of all types of concrete specimens are lower than the exposed
in the CO2 environment. This is because the moisture content of the concrete is
influenced on the electric resistivity values of the concrete specimens. When the concrete
specimens are subjected to 1 % of CO2 + water environment, the moisture level of the
concrete is increased, and due to that, the electric resistivity values of the concrete
specimens are decreased. Moreover, as shown in Fig. 6-14, the electric resistance of the
geopolymer concrete samples are highly decreased with the exposed period, whereas
OPC concrete specimen displayed not a significant variation with the exposed time.
Electric resistance also depends on the pore structure of the concrete surface and
dissolved the salt in the pore solution [223]. Carbonation of geopolymer increases the
porosity of concrete [90] and more alkali salt in pore solution. This is because the
Page 202
Chapter 6 Accelerated carbonation and corrosion test on geopolymer concrete
180
carbonation reaction in GPC increases the porosity by the formation of soluble
carbonated products and that could also be attributed high alkaline salt in pore
solutions. Therefore, the lower electric resistance of geopolymer concrete was associated
with higher porous surface and presence of dissolved salt in the pore solution.
Furthermore, 100FA type geopolymer specimen displayed greater reduction in electric
resistivity values, and the rate of decrement is reduced with the increment of slag in the
geopolymer mix. This is due to the different carbonation components in different
geopolymer concrete types. In fly ash based geopolymer concrete, the formation of
soluble carbonation products removed in the water and attributed higher porosity,
which causes higher electric resistivity reduction observed on fly ash based geopolymer
concrete. On the other hand, the porosity increment is reduced in slag-fly ash blended
geopolymer concrete due to the formation of insoluble carbonation products with
soluble carbonation components. Therefore, the electric resistivity reduction is low
compared to fly ash based geopolymer concrete. This indicates, the risk of corrosion also
reduced when the incorporation of slag into the geopolymer binder.
Fig. 6-15 displays the electric resistance of the concrete specimens subjected to 1 % of
CO2 + chloride environment. As shown, that the electric resistance of all types of
specimens was lower than the test results obtained from the samples exposed to CO2
and water environment. As shown in Fig. 6-15, the electric resistivity of OPC samples
also reduced with the time of exposure, whereas there are no such reductions have been
identified when the specimens ware subjected to the CO2 environment and CO2 +water
environment. The electric resistivity reduction in CO2 +chloride environment is due to
the penetration of chloride ion into the pore structure of the concrete surface [224]. The
penetration of chloride ion increases the conductivity and reduces the electric resistance.
It can also be observed from the test results, that the resistivity values of geopolymer
concrete samples subjected to CO2 + chloride environment is lower than the specimens
exposed to CO2 + water environment. This indicates the porosity increment and the
penetration of chloride ions reduces the resistance values in CO2 +chloride environment.
This suggested that the corrosion risk is high when the concrete subjected to CO2
+chloride environment compared to CO2 + water environment. Furthermore, according
to the Fig. 6-15, electric resistivity values for geopolymer concrete is lower than OPC
concrete. This indicates the risk of corrosion in geopolymer concrete is higher than OPC
concrete. The corrosion on reinforcement bar after 6 months of exposure was observed,
Page 203
Chapter 6 Accelerated carbonation and corrosion test on geopolymer concrete
181
and the discussion regarding the corrosion activity of the reinforcement bar is described
in the following section.
Fig. 6-13 Electric resistivity measurements of concrete specimens subjected to the CO2
environment.
Fig. 6-14 Electric resistivity measurements of concrete specimens subjected to CO2 +
water environment.
Page 204
Chapter 6 Accelerated carbonation and corrosion test on geopolymer concrete
182
Fig. 6-15 Electric resistivity measurements of concrete specimens subjected to CO2 +
chloride environment.
6.3.3.3 Corrosion of reinforcement bar after a 6-month period
The concrete samples were split, and reinforcement bars are visually inspected to
determine the corrosion effect in a 6-month period. Fig. 6-16 represents the
reinforcement bars from the concrete samples exposed in 1% of CO2 environment for a
6-month period. As can be seen from Fig. 6-16, there is no sign of corrosion activity was
developed in all reinforcement bars. This indicated that the reinforcement bar in the
concrete specimens was protected against the corrosion activity. According to the
carbonation depth measurements, it was found that the 100FA and 75FA/25S concrete
specimens were completely carbonated (maximum 25 mm carbonation depth. Because
the CO2 is penetrated from two circular surface direction). The cover provided for the
reinforcement bar in the prism specimens was 15 mm. This indicated that the CO2 is
already reached to the level of reinforcement bar after 6 month of exposed period.
However, according to Fig. 6-16, the reinforcement bar was not corroded. This indicated
that the even though after the carbonation, reinforcement is protected against corrosion
in the normal 1% CO2 atmospheric environment.
Fig. 6-17 displays the reinforcement bar from the concrete samples exposed to CO2 and
water environments for 6 months. The reinforcement bar from 100FA and 75FA/25S mix
showed little sign of corrosion, whereas the reinforcement bar exposed in 50FA/50S
geopolymer mix and OPC concrete mix was not showed any corrosion development
Page 205
Chapter 6 Accelerated carbonation and corrosion test on geopolymer concrete
183
after 6 months of exposure. In addition, the reinforcement bar from 100FA showed
higher corrosion compared to the reinforcement bar from 75FA/25S. This indicates the
risk of corrosion is reduced with the increment of slag content in the geopolymer mix.
This is due to the reduction of pore structure in slag based geopolymer. Increasing of
slag content in the geopolymer mix reduces the pore structures due to the formation of
C-A-S-H and C-S-H gel phases with N-A-S-H gel [51].
The reinforcement bar embedded in the concrete specimens from CO2 and chloride
water environment are shown in Fig. 6-18. As can be seen in Fig. 6-18, reinforcement bar
from all types of geopolymer concrete specimens displayed a higher level of corrosion,
whereas OPC concrete reinforcement bar only showed very little sign of corrosion after
subjected to wet and dry cyclic exposure to CO2 and chloride water environment. The
amount of corrosion products observed on the reinforcement bar from 100FA
geopolymer mix was greater than other types of geopolymer mixes, and the amount of
corrosion is reduced with the increase of the slag in the geopolymer mix. This indicates,
fly ash based geopolymer concrete is not suitable for the aggressive environment, and
the durability of geopolymer concrete can be enhanced by using a higher amount of slag
content in the geopolymer mix. However, compared to geopolymer concrete, OPC
concrete showed better durability performance in the aggressive environment.
This study revealed that the risk of corrosion in geopolymer concrete is greater than the
corrosion risk in OPC concrete and the risk becomes very severe when the geopolymer
concrete is exposed to the aggressive environment. Especially, the geopolymer concrete
prepared with 100% of fly ash binder consists of higher risk compared to the geopolymer
concrete prepared with slag binders. This indicates the geopolymer concrete prepared
with fly ash binder is more suitable for indoor construction application (without contact
any water or aggressive agents). Furthermore, this investigation validates the test results
obtained from the field exposed geopolymer concrete.
Page 206
Chapter 6 Accelerated carbonation and corrosion test on geopolymer concrete
184
Fig. 6-16 Reinforcement bar from the concrete exposed in 1% of CO2 environment for 6
months
Fig. 6-17 Reinforcement bar from the concrete exposed in 1% of CO2+water environment
for 6 months
100FA
OPC
50FA/50S
75FA/25S
100FA
75FA/25S
50FA/50S
OPC
Page 207
Chapter 6 Accelerated carbonation and corrosion test on geopolymer concrete
185
Fig. 6-18 Reinforcement bar from the concrete exposed in 1% of CO2+chloride water
environment for 6 months
6.4 Concluding remarks
This chapter illustrates the investigations of carbonation and corrosion behaviour of
geopolymer concrete when it is exposed to the accelerated testing environment. The
different types of geopolymer concrete specimens were prepared by changing the
proportion of fly ash and slag materials, and the test result of geopolymer concrete was
compared with OPC concrete. The accelerated carbonation and the corrosion assessment
were carried out with three different methods of exposure conditions such as
continuously exposed to 1% CO2 environment, cyclic exposed wet and dry conditions in
1% CO2 and water, and cyclically exposed wet and dry conditions in 1% CO2 and
chloride solution. The assessment was conducted for a 6-month period. Based on the test
results, the following conclusions can be extracted:
Carbonation of geopolymer concrete is higher than OPC concrete in all three
environmental conditions. The carbonation effect is reduced in geopolymer
when the slag content increased in the geopolymer mix.
Universal solution is identified as a suitable indicator for geopolymer concrete.
Especially, the carbonation depth of fly ash geopolymer concrete is difficult to
determine by phenolphthalein indicator due to the minor reduction in pH after
the carbonation. Therefore, due to the wide range of colour variation with the pH
100FA
75FA/25S
50FA/50S
OPC
Page 208
Chapter 6 Accelerated carbonation and corrosion test on geopolymer concrete
186
values in the universal solutions method, that is more suitable to determine the
carbonation in geopolymer concrete.
The risk of corrosion in geopolymer concrete is greater than the corrosion risk in
OPC concrete, and the risk becomes very severe when the geopolymer concrete
is exposed to the aggressive environment. Especially, the geopolymer concrete
prepared with 100% of fly ash binder showed higher corrosion compared to the
geopolymer concrete prepared with slag binders. The level of corrosion is
reduced when the slag content increases in the geopolymer mix.
The electric resistivity measurements are correlated well with the corrosion of
reinforcement. However, in real field conditions, the moisture content of the
concrete is fluctuating in various locations of the concrete structure and different
time. Therefore, it is difficult to predict the corrosion risk in the real exposed
environment with electric resistance measurements.
Page 209
Chapter 7 Mathematical models for carbonation
of geopolymer concrete
7.1 Introduction
This chapter presents the mathematical models developed with the diffusion equation
based on the Fick’s law and the empirical equations for geopolymer concrete.
Accelerated carbonation test was carried out on geopolymer concrete prepared with
different proportion of the source materials, and the test was conducted with 1% of the
CO2 environment. Based on the carbonation depth values, the mathematical models
were developed. The geopolymer concrete test results also compared with OPC
concrete.
7.2 Materials and methods
7.2.1 Materials
The mix compositions details are provided in Table 7-1. Geopolymer concrete specimens
were prepared with different proportions of fly ash and slag contents. OPC concrete also
prepared to compare the carbonation behaviour with geopolymer concrete mixes. A
combination of Bayswater type fly ash and ground granulated blast furnace slag
(GGBFS) are used as precursors to prepare geopolymer binders. The proportion of fly
ash to slag in the geopolymer mix types S1, S2 and S3 are 75:25, 50:50, and 25:75,
respectively. The mix OT is produced with the Portland cement binder. The geopolymer
mixes were activated by the combination of sodium hydroxide (NaOH), potassium
hydroxide (KOH) and sodium silicate (Na2SiO3) solutions. The concentration of
hydroxide activator was 7 M (50 mol % Na cations and 50 mol % K cations). A
commercially available Na2SiO3 solution with D grade (29.4% SiO2 and 14.7% Na2O by
weight) was purchased from PQ Australia. The water to binder ratio used to prepare
activator combination was 0.3.
Page 210
Chapter 7 Mathematical models for carbonation of geopolymer concrete
188
The preparation of geopolymer and OPC concrete mixes are similar procedures as
explained in the previous chapter. For compressive strength test and carbonation test,
100 mm diameter ×200 mm height of cylindrical specimens was prepared. All
geopolymer concrete specimens were cured at ambient temperature (23 °C), whereas OT
specimens were cured at the water tank at 23 °C temperature.
Table 7-1 Mix compositions of concrete (kg/m3)
Materials(kg/m3) S1 S2 S3 OT
Total binder 400 400 400 400
Fly ash 300 200 100 -
GGBFS 100 200 300 -
Fine aggregate 630 630 630 630
Coarse aggregate 1150 1150 1150 1150
NaOH pellet 14 14 14 -
KOH pellet 19.6 19.6 19.6 -
Na2SiO3 solution 34.48 34.48 34.48 -
Water used to prepare activator
81.04 81.04 81.04 Water/cement ratio=0.65
Extra water 20 20 20 -
7.2.2 Testing methods
7.2.2.1 Compressive strength test
The compressive strength test was conducted with 100×200 mm size of cylindrical
specimens according to ASTM C39 standards by using Techno test compressive strength
testing machine (Techno test C030/2T) (Fig. 7-1). The accuracy of the machine was 0.1
kN. The compressive strength of the specimens was determined after 7 days and 28 days
from the casting period. The strength values were derived from an average of three
specimens from each mix.
Page 211
Chapter 7 Mathematical models for carbonation of geopolymer concrete
189
Fig. 7-1 Compressive strength test
7.2.2.2 Accelerated carbonation test
For the carbonation test, cylindrical specimens were cut into four pieces with 50 mm
thickness, after 28 days of casting time. The cutting process of the specimens is provided
in the previous chapter. Thereafter, all the concrete specimens were placed in an
environmental chamber at a temperature of 23°C, relative humidity of 65%, and a CO2
concentration of 1%. Since the higher concentrations of CO2 change the carbonation
reaction products for geopolymer, 1% of CO2 concentration was used [28]. Carbonation
depth of the concrete specimens was determined by the phenolphthalein application.
Phenolphthalein indicator was applied on the fresh concrete surface immediately after
the split the specimens, and the depth of carbonation was measured with the colour
change of the indicator by using measuring tape.
7.2.3 Mathematical approach on the carbonation of geopolymer concrete
Carbonation models for geopolymer concrete were developed in two methods by using
theoretical approach and mathematical equation. Carbonation model with the
theoretical path was created with diffusion theory. A mathematical model to predict the
carbonation depth was developed by using the model proposed by Czarnecki et al. [225].
7.2.3.1 Carbonation model with diffusion theory
Initially, the carbonation model was developed with Fick’s first law and diffusion
theory. It was assumed that the carbon dioxide content between the surface and the
moving boundary is linear [226] and the diffusion process is a constant, not changing
Page 212
Chapter 7 Mathematical models for carbonation of geopolymer concrete
190
with the period [227]. According to that, the following equation is explained the
relationship between the flux of carbon dioxide, CO2 concentration, depth of carbonation
and the diffusion of CO2 [226]:
𝐽 = 𝐷
∆𝐶
𝑋𝑐𝑎
(12)
Where J = Flux of carbon dioxide into concrete g/ (m2s).
D= Diffusion coefficient with respect to carbon dioxide (m2/s).
Xca= The distance of the moving carbonation boundary from the surface of the structure
(m).
∆c = Cs- Cx (g (CO2)/m3).
Cs = CO2 content of air at the surface of concrete (g (CO2)/m3)
Cx= CO2 content of air at the moving boundary, g (CO2)/m3.
However, it is known that the carbon dioxide flux into concrete is equal to the rate of
mass growth of bound CO2. Therefore, carbon dioxide flux can be explained as follows:
𝐽 =
𝑑𝑄𝑐𝑎
𝑑𝑡
(13)
Where Qca = Mass of chemically bound CO2 in concrete
The mass of bound CO2 (Q) can be expressed as follows:
𝑄 = 𝑎 × 𝑋𝑐𝑎 (14)
Where a is the CO2 binding capacity of concrete.
𝑑𝑄
𝑑𝑡= 𝑎 ×
𝑑𝑋𝑐𝑎
𝑑𝑡
(15)
Where, t = time.
Therefore, by combining Equations 1 and 4 and integrating over time (xca = 0 when t =
0), the following solution was developed with the flux of carbon dioxide(CO2) and the
CO2 binding capacity [228].
Page 213
Chapter 7 Mathematical models for carbonation of geopolymer concrete
191
X=√
2×𝐷×∆𝑐× 𝑡
𝑎
( 16)
Where, X is carbonation depth. We also can represent the above equation by following
way:
X=√
𝐷×∆𝑐 𝑡
𝐴
( 17)
Where A=a/2.
Therefore, by using the Eqn ( 17) predicted carbonation depth was determined. For the
calculations, ∆c is considered as 1%. The graph was fitted with the laboratory
carbonation depth values by using least square root error methods.
7.2.3.2 Carbonation model with a mathematical approach
The carbonation model was also developed with a mathematical approach. The
mathematical model proposed by Czarnecki et al. [225] was used to determine the
carbonation depth is explained as follows:
ℎ = 𝑎 +
𝑏
√𝑡
( 18)
The formula presented above is based on the general hyperbolic model of carbonation,
according to which change in the depth of carbonation (h) with the time of t.
Where a, b are characteristic coefficients of the function.
Therefore, according to the above equation, carbonation depth was predicted based on
the graph was fitted with the laboratory carbonation depth values by using least square
root error methods.
7.3 Results and discussions
7.3.1 Compressive strength test results
Fig. 7-2 displays the compressive strength values of geopolymer and OPC concrete
samples after 7 and 28 days of curing period. All concrete samples confirmed the
strength increment from 7 days to 28 days of curing. This indicated that the geopolymer
reactions is continued for 28 days of curing period. It should be noted that the source of
Page 214
Chapter 7 Mathematical models for carbonation of geopolymer concrete
192
materials and the curing methods are influenced on the geopolymerisation reaction. In
this study, geopolymer concrete mixes were prepared with fly ash-slag materials and
the samples were cured at ambient temperature. It was proved that the reaction rate of
Ca in slag materials is slow. During the geopolymerisation of fly ash and slag blended
mix, alumino silicate binding gel forms initially, due to the reaction of dissolute fly ash
particles with activator solution and then the Ca in the slag particles dissolute slowly
and produced high compressive strength at the later aged of concrete [52]. Therefore,
this attributes the strength increment with the curing period.
Moreover, as shown in Fig. 7-2, the compressive strength of geopolymer is increased
with the increment of slag content in the geopolymer mix. The 28 days of compressive
strength values of S1, S2 and S3 types are 27 MPa, 35 MPa and 38 MPa, respectively. As it
was mentioned previously, the pore structure of the concrete is reduced with the
incorporation of slag materials into fly ash mixture due to the formation of a C-A-S-H
binding gel with N-A-S-H gel [51]. Kumar et al. [229] determined that the compressive
strength of the geopolymer concrete is increased with the addition of slag materials due
to the formation C–S–H and C-A–S–H gel phases and compactness of microstructure.
Therefore, a less porous structure in the high slag content mix produces higher
compressive strength compared to the mix have higher fly ash content. Moreover, the
compressive strength of geopolymer concrete is increased with the addition of slag
content in the mix due to the increment of Si/Al ratio, which creates a more
geopolymerisation reaction.
It can also notice from Fig. 7-2, the 28 days of compressive strength values of S1 and S2
type mixes were lower than OT specimens, whereas, S3 type geopolymer mix exhibits
higher strength compared to OT specimens. This indicates the geopolymer concrete
prepared with higher slag content showed superior strength behaviour compared to the
concrete prepared with Portland cement binder.
Page 215
Chapter 7 Mathematical models for carbonation of geopolymer concrete
193
Fig. 7-2 Compressive strength values of geopolymer and OPC concrete specimens.
7.3.2 Accelerated carbonation test results in 1% CO2 environment
Fig. 7-3 presents the evolution of the carbonation depth with the time of exposure for
geopolymer and OPC concretes. The test results are correlated with the carbonation
results obtained from field investigation. According to the Fig. 7-3, geopolymer concrete
displayed higher carbonation compared to OPC concrete at same exposure conditions.
As shown that the maximum carbonation depth observed on OT specimens 9 mm after
exposed to 81 days in 1% CO2 environment. On the other hand, the carbonation depth
determined after exposed to 81 days for S1, S2 and S3 types geopolymer specimens are 20
mm, 18 mm, and 16 mm respectively. Moreover, it should be noted that the resistance to
carbonation of geopolymer concrete is increased with the increment of slag content in
the geopolymer concrete mix. As explained earlier, incorporation of slag reduces the
pore size and the porosity of the geopolymer network. Therefore, the diffusion of CO2
to the concrete surface is reduced, and due to that, lower carbonation behaviour was
identified on the geopolymer prepared with higher slag contents.
Page 216
Chapter 7 Mathematical models for carbonation of geopolymer concrete
194
Fig. 7-3 Carbonation depth measurements in 1% CO2 environment
7.3.3 Carbonation model with diffusion theory and mathematical approach
Fig. 7-4, Fig. 7-5, Fig. 7-6 and Fig. 7-7 are illustrating the carbonation models developed
with diffusion theory and mathematical approach for S1, S2, S3 and OT type concrete,
respectively. The experimental carbonation depth values determined with the
phenolphthalein applications also included in the figures. As shown in all the figures,
carbonation models are correlated well with the experimental laboratory results.
As can be observed from the results, the carbonation model developed with diffusion
theory is fitted very well with the laboratory experimental test results. However, the
models devolved with the mathematical approach slightly deviate from the
experimental results for geopolymer concrete. However, the mathematical model is
fitted well with the experimental results for OT concrete. This is indicating the
carbonation depth of geopolymer concrete is proportional to the square root of time
variation, and not related to 1/ square root of time variation as explained in the empirical
equation.
Moreover, the diffusion model provides the diffusion coefficient values of concrete
specimens. The coefficient of diffusion obtained for S1, S2 and S3 types of geopolymer
concrete are 7695 m2/s, 6844 m2/s and 6299 m2/s respectively. This indicates the
diffusion rate is reduced with the slag content in the geopolymer mix. On the other hand,
OPC concrete revealed lower diffusion coefficient, which is about 4085 m2/s.
Page 217
Chapter 7 Mathematical models for carbonation of geopolymer concrete
195
It should be noted that the diffusion coefficient values cannot necessarily be generalised
to all geopolymer concrete and are only applicable to the specific mix and materials
studied. Therefore, for different types of geopolymer concrete mix, it should be
necessary to generate the new diffusion equation.
Fig. 7-4 Carbonation models for S1 type concrete
Fig. 7-5 Carbonation models for S2 type concrete
Page 218
Chapter 7 Mathematical models for carbonation of geopolymer concrete
196
Fig. 7-6 Carbonation models for S3 type concrete
Fig. 7-7 Carbonation models for OT type concrete
7.4 Concluding remarks
This chapter illustrates the carbonation models developed with Fick’s law and diffusion
equation and the empirical equations for geopolymer concrete. Accelerated carbonation
test was carried out on geopolymer concrete prepared with different proportion of the
source materials and OPC concrete in 1% of the CO2 environment. Based on the
carbonation depth values, the mathematical models were developed. According to the
test results, the following conclusions can be extracted:
The compressive strength values of the geopolymer concrete are increased with
the increment of slag content in the geopolymer mix.
Page 219
Chapter 7 Mathematical models for carbonation of geopolymer concrete
197
The geopolymer concrete prepared with fly ash material showed higher
carbonation, and the carbonation depth values were decreased with the addition
of slag content in the geopolymer mix.
The model developed with diffusion theory is correlated with the laboratory test
results for OPC and geopolymer concrete.
The CO2 diffusion coefficient values were calculated with the diffusion model.
The coefficient of carbonation diffusion of geopolymer concrete is greater than
OPC concrete. According to the diffusion models, the coefficient values are
decreased with the increment of slag content in the geopolymer mix.
Page 220
Chapter 8 Conclusions and Recommendations
198
Chapter 8 Conclusions and Recommendations
8.1 Summary
This thesis presented an extensive study on the long-term durability of geopolymer
concrete structures exposed in the field and laboratory environmental conditions.
Chapter 3 investigated the durability of geopolymer concrete exposed to the
atmospheric environment for 8 years. The durability performance was assessed by
studying the carbonation properties of concrete core specimens. For this investigation,
the core specimens were extracted from the fly ash-based geopolymer concrete structure
and two different mix compositions of fly ash- slag based geopolymer concrete
structures. The test results were compared with OPC concrete structures located in the
same exposed environmental conditions. The research found that the carbonation
resistance of geopolymer concrete is lower than that of OPC concrete in the atmospheric-
exposed environment. Among the different geopolymer compositions, fly ash based
geopolymer concrete exhibited lower carbonation resistance compared to the
geopolymer concrete prepared with fly ash-slag blended geopolymer concrete. In fly
ash-based geopolymer concrete, the formation of water-soluble carbonation products of
Na2CO3 and K2CO3 is the main reason for the lower carbonation resistance since they
can be washed out with the contact of water, leading to the increased porosity with the
carbonation. This further exacerbated the CO2 diffusion and significantly affecting the
durability of fly ash based geopolymer concrete structures. In fly ash-slag blended GPC,
in addition with the soluble carbonation components, insoluble CaCO3 products are also
formed during the carbonation as a result of the slag content. Therefore, the increase in
porosity is comparably lower than fly ash based geopolymer concrete, and this leads to
better carbonation resistance. Furthermore, this study also revealed that the choice of
activator has a significant influence on the carbonation resistance of fly ash-slag blended
geopolymer concrete. The GPC prepared with NaOH activator showed better
carbonation resistance compared to the combined activators of NaOH and Na2SiO3.
Chapter 4 of this thesis reported the durability of geopolymer concrete in the aggressive
environment by determining the durability performance in terms of carbonation,
Page 221
Chapter 8 Conclusions and Recommendations
199
chloride diffusions and sulphate attack of the GPC. The investigation was conducted on
core specimens from fly ash-based GPC structure exposed in the saline environment for
6 years, and slag-fly ash blended GPC exposed in the marine environment for 4 years,
and the durability properties were compared with OPC concrete from the same exposed
environment. The results showed that the durability of GPC concrete is lower than OPC
concrete in saline/marine environmental conditions. The GPC prepared with fly ash
binder displayed lower resistance to chloride penetration compared to OPC concrete
with the exposure period of 6 years in the saline environment. The GPC showed higher
chloride diffusion coefficient values compared to OPC concrete. Besides, the
microstructural analysis of the fly ash based GPC studied with SEM test revealed that
the chloride ions were deposited as a film layer on the surface of fly ash particles. As
similar to fly ash-based GPC, chloride penetration in slag-fly ash blended GPC was also
greater than OPC concrete under the exposure in the marine environment. However,
compared to fly ash based geopolymer, the chloride penetration in slag-fly ash based
geopolymer concrete is low, and the SEM analysis has not indicated deposition of
chloride ions on the microstructure of the slag-fly ash blended geopolymer concrete.
Furthermore, the carbonation of fly ash-based GPC was found to be much higher than
OPC concrete over the six years of exposure to aggressive saline conditions. According
to the test results, the core specimens from fly ash based GPC was completely carbonated
in the leg parts (90 mm) as well as in the top slab (135 mm thickness). On the other hand,
the corresponding carbonation depths in the OPC concrete structures were determined
as 10 mm and 20 mm, respectively. The CO2 diffusion of the slag- fly ash blended GPC
also greater than OPC concrete in the marine environment. Even though slag-fly ash
based GPC concrete was exposed for a shorter period (4 years) than OPC concrete (6
years) in the marine environment, GPC showed higher carbonation values (11 mm)
compared to OPC concrete (4 mm).
Chapter 4 also showed that the salt scaling effect in GPC was higher than OPC concrete
in aggressive exposed conditions. The mortar from the fly ash-based GPC surface,
especially the vertical surface of the culvert which was frequently in contact with saline
lake water, has been found lost and the aggregate is exposed to the surface, whereas no
significant changes have been identified in the visual appearance of an OPC concrete
culvert over time. Similarly, mortar from the surface of slag-fly ash blended GPC also
removed after four years exposed in the marine environment, while OPC concrete was
Page 222
Chapter 8 Conclusions and Recommendations
200
not shown such observation after six years of exposure in the similar environment.
Higher scaling effect in GPC concrete is due to the poor sulphate resistance of GPC. The
test results showed that the GPC concrete displayed higher ingress of sulphate
compared to OPC concrete. Furthermore, the SEM/EDX test results also revealed the
higher sulphate penetration, and there is no formation of ettringite observed in GPC
specimens. This indicates the mechanism of sulphate attack in GPC is different from
OPC concrete.
Moreover, fly ash based geopolymer concrete provides lower protection against
corrosion of reinforcement than the OPC concrete in the saline environment. The
reinforcement bar in fly ash-based GPC was corroded on the entire surface, and the
deposition of corrosion products at the interface area of fly ash-based GPC was much
higher than the OPC concrete. The combination of higher carbonation and chloride
penetration caused higher corrosion activity of the steel bar in fly ash based geopolymer
concrete.
Chapter 5 presented the accelerated wetting-drying analysis of geopolymer mortar in
different solution such as water, chloride solution and the combination of chloride and
the sulphate solutions. The test results revealed that the degradation effect of GPC
specimens is higher than OPC mortar. The loss of compressive strength was found to be
low with the increasing level of slag in the GPC. Moreover, fly ash based geopolymer
showed a higher amount of sodium leaching compared to the geopolymer concrete
prepared with the higher amount of slag content.
Chapter 6 highlights the test results of the corrosion of reinforcement in the GPC when
subjected to three different exposure conditions in the laboratory such as continuous
exposure in 1% CO2 environment, cyclic exposure to wet and dry conditions in 1% CO2
and water solution, and cyclic exposure to wet and dry conditions in 1% CO2 and
chloride water solution. The assessment was conducted for a period of 6-month. The test
results showed that the carbonation and corrosion of rebar in fly ash-based GPC was
higher than the fly ash- slag blended GPC and the carbonation and corrosion rate was
reduced with the incorporation of slag in GPC. However, OPC concrete displayed
superior durability performance against carbonation and corrosion effect compared to
GPC. Furthermore, among the different in-situ carbonation testing indicators, the
universal solution was identified as a suitable indicator for measuring the carbonation
Page 223
Chapter 8 Conclusions and Recommendations
201
depth in geopolymer concrete. Especially, GPC prepared with fly ash-based materials
did not show a clear carbonation indication with phenolphthalein indicator. Universal
solution is a more suitable indicator for fly ash-based GPC due to the wide range of
colour variation with pH values.
The mathematical models for theoretically determining the carbonation properties of
geopolymer concrete was presented in Chapter 7. The diffusion equation based on the
Fick’s law and corresponding empirical equations were used to develop the carbonation
diffusion models for geopolymer concrete. The developed carbonation profile models
were calibrated with experimental results observed in this study. It was found that the
developed carbonation models are well fit with the experimental results and hence, these
models can be used to analytically determine the carbonation depth of concrete over the
period.
8.2 Concluding remarks
Carbonation resistance of geopolymer concrete is lower than OPC concrete when
it is exposed to both atmospheric and aggressive field environment conditions.
The formation of soluble carbonation products is the main reason for the higher
carbonation rate in GPC, which attributes higher porosity, and increases the CO2
diffusion in GPC.
The salt scaling effect in GPC was higher than OPC concrete. The mortar from
the GPC surface has been removed, and the aggregate is exposed on the surface,
whereas no significant changes were identified in the visual appearance of OPC
concrete over time.
The chloride penetration in the GPC concrete was high in saline and marine
environments. According to the total chloride analysis, the surface chloride
content and the chloride diffusion coefficient of fly ash-based GPC concrete was
approximately 2.5 times greater than the values obtained for OPC concrete. The
SEM analysis revealed that the chloride contents were deposited as a film layer
on the fly ash-based GPC concrete.
GPC exhibited higher ingress of sulphate compared to OPC concrete causing
more scaling effect in GPC structure. SEM/EDX test results also revealed the
higher sulphate penetration, and there is no formation of ettringite observed in
Page 224
Chapter 8 Conclusions and Recommendations
202
GPC specimens. This indicates the mechanism of sulphate attack in GPC is
different from OPC concrete.
The fly ash-based GPC displayed lower resistance to corrosion in the saline
aggressive conditions. The reinforcement bar in GPC concrete was corroded on
the entire surface, and the deposition of corrosion products at the interface of
concrete and rebar were much greater than for OPC concrete.
The wetting and drying cycle test results revealed higher compressive strength
loss degradation in GPC. As similar to field investigation, GPC showed less
durability performance compared to OPC concrete in laboratory controlled
conditions. Moreover, strength reduction and the deterioration effect were found
to be low with the increasing level of slag in the GPC.
The accelerated carbonation test results (1 % of the CO2 environment) showed
that the corrosion of rebar in fly ash-based GPC is greater than the OPC
specimens and, the corrosion rate is reduced with the slag content in GPC.
Carbonation coefficient models were developed and calibrated for GPC
according to the diffusion equation based on the Fick’s law and the use of
empirical equations.
Finally, this investigation suggested that the geopolymer concrete prepared with
fly ash binder is more suitable for interior construction applications (less effect
from water or aggressive agents) and the GPC prepared with slag binder can be
used for exterior construction applications. However, the required cover size to
protect the reinforcement should be higher than the cover size used in OPC
concrete.
8.3 Recommendations for future work
This research study shows that the GPC has less durability in the field
environments. However, the finding cannot necessarily be generalised to all
geopolymer concrete and are only applicable to the specific mix and materials
studied. Therefore, investigation of suitable geopolymer concrete chemistry and
mix design is required to enhance durability in the field environment.
The sulphate attack in geopolymer concrete was found to be significantly higher
than OPC concrete in an aggressive environment. However, the test results
revealed that the mechanism of sulphate attack in GPC is different from OPC
concrete as no observation of ettringite in GPC microstructure. Therefore, further
Page 225
Chapter 8 Conclusions and Recommendations
203
investigation is required to determine the mechanism of sulphate attack in GPC
and the formation of sulphate reaction components in GPC.
The strength loss of GPC in real field environment condition has not been
evaluated in this investigation. Therefore, further research is recommended to
determine the strength reduction of GPC with the period of exposure in the field
environment condition.
This study determined only the corrosion of reinforcement bar in fly ash based
geopolymer concrete when it is exposed to field conditions. However,
accelerated laboratory test results indicated that the type of source materials
influence on the corrosion of the reinforcement bar. Therefore, it is recommended
to study the influence of the source materials on the corrosion behaviour of
geopolymer concrete exposed to the field environment.
Furthermore, this study found that the carbonation behaviour of fly ash-slag
blended GPC in the atmospheric environment depends on the type of activator
used for the geopolymer preparation. Therefore, further research investigations
will be recommended to conduct the detailed investigations on this conclusion.
Page 226
R ef e r e n c e s
1. G a rt n e r, E., I n d u stri all y i nteresti n g a p pr o a c hes t o “l o w -C O 2 ” c e m e nts . C e m e nt a n d
C o n cr et e R e s e a r c h, 2 0 0 4. 3 4 ( 9): p. 1 4 8 9-1 4 9 8. 2. L a wr e n c e, C. D., T he pr o d u cti o n of l o w -e n er g y c e m e nts . L e a’ s c h e mi st r y of c e m e nt
a n d c o n cr et e, 1 9 9 8: p. 4 2 1 -4 7 0. 3. S c h n ei d e r, M., M. R o m e r, M. T s c h u di n a n d H. B oli o, S u st ai n a bl e c e me nt
pr o d u cti o n — pres e nt a n d f ut u re. C e m e nt a n d C o n cr et e R e s e a r c h, 2 0 1 1. 4 1 ( 7): p. 6 4 2-6 5 0.
4 . S T A NI F O R D, S., Ce m e nt Pr o d u cti o n: C hi n a a n d El se w her e. , E. W A R NI N G a n d
R. A. O. G. C. RI S K, E dit o r s. 2 0 1 2. 5. H u nt zi n g e r, D. N. a n d T. D. E at m o n, A lif e -c y cl e ass es s m e nt of P ortl a n d c e m e nt
m a n uf a ct u ri n g: c o m p ari n g t he tr a diti o n al pr o c es s wit h alter n ati ve te c h n ol o gi es. J o u r n al
of Cl e a n e r P r o d u cti o n, 2 0 0 9. 1 7 ( 7): p. 6 6 8-6 7 5. 6. M e y e r, C., T he gre e ni n g of t he c o n c rete i n d u str y. C e m e nt a n d C o n cr et e C o m p o sit e s,
2 0 0 9. 3 1 ( 8): p. 6 0 1-6 0 5. 7. C h e n, C., G. H a b e rt , Y. B o u zi di a n d A. J ulli e n, E n vi r o n m e nt al i m p a ct of c e m e nt
pr o d u cti o n: det ail of t he diff er e nt pr o c es se s a n d c e me nt pl a nt v ari a bilit y e v al u ati o n.
J o u r n al of Cl e a n e r P r o d u cti o n, 2 0 1 0. 1 8 ( 5): p. 4 7 8-4 8 5. 8. P al o m o, A., M. W. G r ut z e c k a n d M. T. Bl a n c o, Al k ali -a cti v ate d fl y as hes: A c e m e nt
f or t he f ut u re. C e m e nt a n d C o n cr et e R e s e a r c h, 1 9 9 9. 2 9 ( 8): p. 1 3 2 3-1 3 2 9. 9 . P u e rt a s, F., S. M a rt ı n e z -R a m ı r e z, S. Al o n s o a n d T. V á z q u e z, Al k ali -a cti v ate d fl y
as h/ sl a g c e m e nts: Stre n gt h be h a vi o u r a n d h y dr ati o n pr o d u cts. C e m e nt a n d C o n cr et e
R e s e a r c h, 2 0 0 0. 3 0 ( 1 0): p. 1 6 2 5-1 6 3 2. 1 0. D a v i d o vit s, J. E n vi r o n m e nt all y dri ve n ge o p ol y m er c e m e nt a p plic ati o n s . i n Pr o c ee di n gs
of 2 0 0 2 Ge o p ol y m er C o nf ere n c e. Mel b o u r n e. A ustr ali a . 2 0 0 2. 1 1. D a vi d o vit s, J., Ge o p ol y m er, Gre e n C he mistr y a n d S ust ai n a bl e D e vel o p me nt S ol uti o n s:
Pr o c ee di n gs of t he W orl d C o n gre ss Ge o p ol y m er 2 0 0 5 . 2 0 0 5: G e o p ol y m e r I n stit ut e.
1 2. D u x s o n, P., A. F e r n á n d e z -Ji m é n e z, J. P r o vi s, G. L u k e y, A. P al o m o a n d J. V a n D e v e nt e r, Ge o p ol y m er te c h n ol o g y: t he c u rre nt st ate of t he art. J o u r n al of M at e ri al s
S ci e n c e, 2 0 0 7. 4 2 ( 9): p. 2 9 1 7-2 9 3 3. 1 3. P r o vi s, J. L. a n d J. S.J. V a n D e v e nt e r, Ge o p ol y m er s: str u ct u res, pr o c essi n g, pr o perti es
a n d i n d u stri al a p plic ati o n s . 2 0 0 9: El s e vi e r. 1 4. D a vi d o vit s, J., Ge o p ol y m er s: i n or g a ni c p ol y m eri c ne w m ateri al s. J o u r n al of T h e r m al
A n al y si s a n d c al o ri m et r y, 1 9 9 1. 3 7 ( 8): p. 1 6 3 3 -1 6 5 6. 1 5. P r o vi s, J. L. a n d S. A. B e r n al, Ge o p ol y mer s a n d rel ate d al k ali -a cti v ate d m ateri al s.
A n n u al R e vi e w of M at e ri al s R e s e a r c h, 2 0 1 4. 4 4 : p. 2 9 9-3 2 7. 1 6. Ri c h a r d s o n, I., T o ber m orite/j e n nite -a n d t o ber m orite/ c al ci u m h y dr o xi de -b ase d m o del s
f or t he str u ct u re of C S H: a p pli c a bilit y t o h ar de n e d p astes of tri c al ci u m silic ate, β -di c al ci u m silic ate, P ortl a n d ce m e nt, a n d bl e n ds of P ortl a n d c e m e nt wit h bl ast -f u r n a c e sl a g, met a k a oli n, or sili c a f u m e. C e m e nt a n d C o n cr et e R e s e a r c h, 2 0 0 4. 3 4 ( 9): p. 1 7 3 3-
1 7 7 7. 1 7. B e r n al, S. A., J. L. P r o vi s, A. F e r n á n d e z -Ji m é n e z, P. V. Kri v e n k o, E. K a v al e r o v a, M.
P al a ci o s, a n d C. S hi, Bi n der c he mi str y – hi g h -c al ci u m al k ali -a cti v ate d m ateri al s , i n Al k ali A cti v ate d M ateri al s . 2 0 1 4, S p ri n g e r. p. 5 9-9 1.
1 8. C h e e m a, D. S., L o w C al ci u m Fl y As h B ase d Ge o p ol y m er C o n crete: L o n g Ter m D u r a bilit y Pr o perti es. 2 0 1 4.
Page 227
205
19. Zhu, H., Z. Zhang, Y. Zhu and L. Tian, Durability of alkali-activated fly ash concrete: Chloride penetration in pastes and mortars. Construction and Building Materials,
2014. 65: p. 51-59. 20. Duxson, P., J.L. Provis, G.C. Lukey and J.S.J. van Deventer, The role of inorganic
polymer technology in the development of ‘green concrete’. Cement and Concrete Research, 2007. 37(12): p. 1590-1597.
21. Law, D.W., A.A. Adam, T.K. Molyneaux, I. Patnaikuni and A. Wardhono, Long term durability properties of class F fly ash geopolymer concrete. Materials and
Structures, 2014. 48(3): p. 721-731. 22. Ismail, I., S.A. Bernal, J.L. Provis, R. San Nicolas, D.G. Brice, A.R. Kilcullen, S.
Hamdan, and J.S.J. van Deventer, Influence of fly ash on the water and chloride permeability of alkali-activated slag mortars and concretes. Construction and Building Materials, 2013. 48: p. 1187-1201.
23. Chindaprasirt, P. and W. Chalee, Effect of sodium hydroxide concentration on chloride penetration and steel corrosion of fly ash-based geopolymer concrete under marine site. Construction and Building Materials, 2014. 63(0): p. 303-310.
24. Ismail, I., S.A. Bernal, J.L. Provis, R. San Nicolas, D.G. Brice, A.R. Kilcullen, S. Hamdan, and J.S.J. van Deventer, Influence of fly ash on the water and chloride permeability of alkali-activated slag mortars and concretes. Construction and Building Materials, 2013. 48(0): p. 1187-1201.
25. Adam, A.A., Strength and durability properties of alkali activated slag and fly ash-based geopolymer concrete. 2009, RMIT University Melbourne, Australia.
26. Bakharev, T., J.G. Sanjayan and Y.B. Cheng, Resistance of alkali-activated slag concrete to carbonation. Cement and Concrete Research, 2001. 31(9): p. 1277-1283.
27. Heidrich, C., J. Sanjayan, M.L. Berndt, S. Foster and K. Sagoe-Crentsil, Pathways and barriers for acceptance and usage of geopolymer concrete in mainstream construction. 2015.
28. Bernal, S.A., J.L. Provis, D.G. Brice, A. Kilcullen, P. Duxson and J.S. van Deventer, Accelerated carbonation testing of alkali-activated binders significantly underestimates service life: the role of pore solution chemistry. Cement and Concrete Research, 2012. 42(10): p. 1317-1326.
29. Tennakoon, C., A. Shayan, J.G. Sanjayan and A. Xu, Chloride ingress and steel corrosion in geopolymer concrete based on long term tests. Materials & Design, 2017. 116: p. 287-299.
30. Fernández-Jiménez, A., A. Palomo and M. Criado, Microstructure development of alkali-activated fly ash cement: a descriptive model. Cement and Concrete Research, 2005. 35(6): p. 1204-1209.
31. Škvára, F., L. Kopecký, J. Nemecek and Z. Bittnar, Microstructure of geopolymer materials based on fly ash. Ceramics-Silikaty, 2006. 50(4): p. 208-215.
32. Astm, C., 618. Standard specification for fly ash and raw or calcined natural pozzolan for use as a mineral Admixture in Portland Cement Concrete, 2003.
33. Hardjito, D. and B.V. Rangan, Development and properties of low-calcium fly ash-based geopolymer concrete. Perth, Australia: Curtin University of Technology, 2005.
34. Shi, C., D. Roy and P. Krivenko, Alkali-activated cements and concretes. 2006: CRC
press. 35. Phoo-ngernkham, T., P. Chindaprasirt, V. Sata, S. Hanjitsuwan and S. Hatanaka,
The effect of adding nano-SiO2 and nano-Al2O3 on properties of high calcium fly ash geopolymer cured at ambient temperature. Materials & Design, 2014. 55(0): p. 58-65.
Page 228
206
36. Guo, X., H. Shi and W.A. Dick, Compressive strength and microstructural characteristics of class C fly ash geopolymer. Cement and Concrete Composites, 2010.
32(2): p. 142-147. 37. Tho-in, T., V. Sata, P. Chindaprasirt and C. Jaturapitakkul, Pervious high-calcium
fly ash geopolymer concrete. Construction and Building Materials, 2012. 30(0): p. 366-371.
38. Gourley, J. Geopolymers; opportunities for environmentally friendly construction materials. in Materials 2003 Conference: Adaptive Materials for a Modern Society, Sydney, Institute of Materials Engineering Australia. 2003.
39. Duxson, P. and J.L. Provis, Designing precursors for geopolymer cements. Journal of the American Ceramic Society, 2008. 91(12): p. 3864-3869.
40. Temuujin, J., W. Rickard and A. Van Riessen, Characterization of various fly ashes for preparation of geopolymers with advanced applications. Advanced Powder Technology, 2013. 24(2): p. 495-498.
41. Wallah, S. and B.V. Rangan, Low-calcium fly ash-based geopolymer concrete: Long-term properties. Res. Report-GC2, Curtin University, Australia. pp, 2006: p. 76-80.
42. Ryu, G.S., Y.B. Lee, K.T. Koh and Y.S. Chung, The mechanical properties of fly ash-based geopolymer concrete with alkaline activators. Construction and Building Materials, 2013. 47(0): p. 409-418.
43. Juenger, M.C.G., F. Winnefeld, J.L. Provis and J.H. Ideker, Advances in alternative cementitious binders. Cement and Concrete Research, 2011. 41(12): p. 1232-1243.
44. Yip, C.K., G.C. Lukey and J.S.J. van Deventer, The coexistence of geopolymeric gel and calcium silicate hydrate at the early stage of alkaline activation. Cement and Concrete Research, 2005. 35(9): p. 1688-1697.
45. Ren, D., C. Yan, P. Duan, Z. Zhang, L. Li and Z. Yan, Durability performances of wollastonite, tremolite and basalt fiber-reinforced metakaolin geopolymer composites under sulfate and chloride attack. Construction and Building Materials, 2017. 134: p. 56-66.
46. Kong, D.L.Y., J.G. Sanjayan and K. Sagoe-Crentsil, Comparative performance of geopolymers made with metakaolin and fly ash after exposure to elevated temperatures.
Cement and Concrete Research, 2007. 37(12): p. 1583-1589. 47. Cyr, M. and R. Pouhet, Carbonation in the pore solution of metakaolin-based
geopolymer. Cement and Concrete Research, 2016. 88: p. 227-235. 48. Rovnaník, P., Effect of curing temperature on the development of hard structure of
metakaolin-based geopolymer. Construction and Building Materials, 2010. 24(7): p. 1176-1183.
49. Granizo, M.L., S. Alonso, M.T. Blanco‐Varela and A. Palomo, Alkaline activation of metakaolin: effect of calcium hydroxide in the products of reaction. Journal of the
American Ceramic Society, 2002. 85(1): p. 225-231. 50. Li, C., H. Sun and L. Li, A review: The comparison between alkali-activated slag (Si+
Ca) and metakaolin (Si+ Al) cements. Cement and Concrete Research, 2010. 40(9): p. 1341-1349.
51. Chi, M. and R. Huang, Binding mechanism and properties of alkali-activated fly ash/slag mortars. Construction and Building Materials, 2013. 40(0): p. 291-298.
52. Puligilla, S. and P. Mondal, Role of slag in microstructural development and hardening of fly ash-slag geopolymer. Cement and Concrete Research, 2013. 43(0): p. 70-80.
53. Nath, P. and P.K. Sarker, Effect of GGBFS on setting, workability and early strength properties of fly ash geopolymer concrete cured in ambient condition. Construction and Building Materials, 2014. 66(0): p. 163-171.
Page 229
207
54. Ismail, I., S.A. Bernal, J.L. Provis, R. San Nicolas, S. Hamdan and J.S.J. van Deventer, Modification of phase evolution in alkali-activated blast furnace slag by the incorporation of fly ash. Cement and Concrete Composites, 2014. 45(0): p. 125-135.
55. Chindaprasirt, P., T. Chareerat and V. Sirivivatnanon, Workability and strength of coarse high calcium fly ash geopolymer. Cement and Concrete Composites, 2007. 29(3): p. 224-229.
56. Ravikumar, D., S. Peethamparan and N. Neithalath, Structure and strength of NaOH activated concretes containing fly ash or GGBFS as the sole binder. Cement and
Concrete Composites, 2010. 32(6): p. 399-410. 57. Álvarez-Ayuso, E., X. Querol, F. Plana, A. Alastuey, N. Moreno, M. Izquierdo, O.
Font, T. Moreno, S. Diez, and E. Vázquez, Environmental, physical and structural characterisation of geopolymer matrixes synthesised from coal (co-) combustion fly ashes. Journal of Hazardous Materials, 2008. 154(1): p. 175-183.
58. Somna, K., C. Jaturapitakkul, P. Kajitvichyanukul and P. Chindaprasirt, NaOH-activated ground fly ash geopolymer cured at ambient temperature. Fuel, 2011. 90(6): p. 2118-2124.
59. Bignozzi, M.C., S. Manzi, M.E. Natali, W.D.A. Rickard and A. van Riessen, Room temperature alkali activation of fly ash: The effect of Na2O/SiO2 ratio. Construction and Building Materials, 2014. 69(0): p. 262-270.
60. Lee, W. and J. Van Deventer, The effect of ionic contaminants on the early-age properties of alkali-activated fly ash-based cements. Cement and Concrete Research, 2002. 32(4): p. 577-584.
61. Lee, W. and J. Van Deventer, Chemical interactions between siliceous aggregates and low-Ca alkali-activated cements. Cement and concrete research, 2007. 37(6): p. 844-855.
62. Sindhunata, J. Van Deventer, G. Lukey and H. Xu, Effect of curing temperature and silicate concentration on fly-ash-based geopolymerization. Industrial & Engineering Chemistry Research, 2006. 45(10): p. 3559-3568.
63. Palomo, A., M. Grutzeck and M. Blanco, Alkali-activated fly ashes: a cement for the future. Cement and concrete research, 1999. 29(8): p. 1323-1329.
64. Bakharev, T., Geopolymeric materials prepared using Class F fly ash and elevated temperature curing. Cement and Concrete Research, 2005. 35(6): p. 1224-1232.
65. Deb, P., P. Nath and P. Sarker, Properties of fly ash and slag blended geopolymer concrete cured at ambient temperature. 2013.
66. Castel, A., S. Foster and J. Aldred, TIME-DEPENDENT BEHAVIOUR OF A CLASS F FLY ASH-BASED GEOPOLYMER CONCRETE.
67. van Jaarsveld, J.G.S., J.S.J. van Deventer and G.C. Lukey, The effect of composition and temperature on the properties of fly ash- and kaolinite-based geopolymers. Chemical
Engineering Journal, 2002. 89(1–3): p. 63-73. 68. Patankar, S.V., Y.M. Ghugal and S.S. Jamkar, Effect of concentration of sodium
hydroxide and degree of heat curing on fly ash-based geopolymer mortar. Indian Journal of Materials Science, 2014. 2014.
69. Sarker, P.K., S. Kelly and Z. Yao, Effect of fire exposure on cracking, spalling and residual strength of fly ash geopolymer concrete. Materials & Design, 2014. 63: p. 584-
592. 70. Olivia, M. and H. Nikraz, Properties of fly ash geopolymer concrete designed by
Taguchi method. Materials & Design, 2012. 36(0): p. 191-198. 71. Xu, H. and J.S. Van Deventer, Geopolymerisation of multiple minerals. Minerals
engineering, 2002. 15(12): p. 1131-1139.
Page 230
208
72. Diaz, E. and E. Allouche. Recycling of fly ash into geopolymer concrete: creation of a database. in Green Technologies Conference, 2010 IEEE. 2010. IEEE.
73. Sofi, M., J.S.J. van Deventer, P.A. Mendis and G.C. Lukey, Engineering properties of inorganic polymer concretes (IPCs). Cement and Concrete Research, 2007. 37(2): p. 251-257.
74. Partha, S.D., N. Pradip and K.S. Prabir, Strength and permeation properties of slag blended fly ash based geopolymer concrete. Advanced Materials Research, 2013. 651: p. 168-173.
75. McDonald, M. and J. Thompson, Sodium silicate a binder for the 21st century. National silicates and PQ Corporation of Industrial Chemicals Division, 2006.
76. de Vargas, A.S., D.C.C. Dal Molin, A.C.F. Vilela, F.J.d. Silva, B. Pavão and H. Veit, The effects of Na2O/SiO2molar ratio, curing temperature and age on compressive strength, morphology and microstructure of alkali-activated fly ash-based geopolymers. Cement and Concrete Composites, 2011. 33(6): p. 653-660.
77. Budh, C. and N. Warhade, Effect of molarity on compressive strength of geopolymer mortar. International Journal of Civil Engineering Research, 2014. 5(1): p. 83-86.
78. Phoo-ngernkham, T., A. Maegawa, N. Mishima, S. Hatanaka and P. Chindaprasirt, Effects of sodium hydroxide and sodium silicate solutions on compressive and shear bond strengths of FA–GBFS geopolymer. Construction and Building Materials, 2015. 91: p. 1-8.
79. Deb, P.S., P. Nath and P.K. Sarker, The effects of ground granulated blast-furnace slag blending with fly ash and activator content on the workability and strength properties of geopolymer concrete cured at ambient temperature. Materials & Design, 2014. 62(0): p. 32-39.
80. Ho, D., Durability of Concrete. The civil engineering handbook, 2003. 81. Long, A.E., G.D. Henderson and F.R. Montgomery, Why assess the properties of
near-surface concrete? Construction and Building Materials, 2001. 15(2): p. 65-79. 82. Basheer, L., J. Kropp and D.J. Cleland, Assessment of the durability of concrete from
its permeation properties: a review. Construction and Building Materials, 2001. 15(2–3): p. 93-103.
83. Sagoe–Crentsil, K., T. Brown and S.Q. Yan. Medium to long term engineering properties and performance of high-strength geopolymers for structural applications. in Advances in Science and Technology. 2010. Trans Tech Publ.
84. Gunasekara, C., D.W. Law and S. Setunge, Long term permeation properties of different fly ash geopolymer concretes. Construction and Building Materials, 2016. 124: p. 352-362.
85. Dias, W.P.S., Reduction of concrete sorptivity with age through carbonation. Cement and Concrete Research, 2000. 30(8): p. 1255-1261.
86. Qureshi, M.N. and S. Ghosh, Effect of Silicate content on the Properties of Alkali-activated Blast furnace Slag Paste. Arabian Journal for Science and Engineering, 2014. 39(8): p. 5905-5916.
87. Albitar, M., M.S. Mohamed Ali, P. Visintin and M. Drechsler, Durability evaluation of geopolymer and conventional concretes. Construction and Building Materials, 2017. 136: p. 374-385.
88. Noushini, A. and A. Castel, The effect of heat-curing on transport properties of low-calcium fly ash-based geopolymer concrete. Construction and Building Materials, 2016. 112: p. 464-477.
89. Bernal, S.A., R. Mejía de Gutiérrez, A.L. Pedraza, J.L. Provis, E.D. Rodriguez and S. Delvasto, Effect of binder content on the performance of alkali-activated slag concretes. Cement and Concrete Research, 2011. 41(1): p. 1-8.
Page 231
209
90. Sufian Badar, M., K. Kupwade-Patil, S.A. Bernal, J.L. Provis and E.N. Allouche, Corrosion of steel bars induced by accelerated carbonation in low and high calcium fly
ash geopolymer concretes. Construction and Building Materials, 2014. 61(0): p. 79-89.
91. Lloyd, R.R., J.L. Provis and J.S. Van Deventer, Pore solution composition and alkali diffusion in inorganic polymer cement. Cement and Concrete Research, 2010. 40(9): p. 1386-1392.
92. Szklorzová, H. and V. Bílek. Influence of alkali ions in the activator on the performance of alkali-activated mortars. in 3rd International Symposium on Non-traditional Cement and Concrete. Brno: Czech Republic. 2008.
93. Bortnovsky, O., J. Dědeček, Z. Tvarůžková, Z. Sobalík and J. Šubrt, Metal ions as probes for characterization of geopolymer materials. Journal of the American Ceramic Society, 2008. 91(9): p. 3052-3057.
94. Najafi Kani, E., A. Allahverdi and J.L. Provis, Efflorescence control in geopolymer binders based on natural pozzolan. Cement and Concrete Composites, 2012. 34(1): p. 25-33.
95. Bernal, S.A., R.M. de Gutierrez, J.L. Provis and V. Rose, Effect of silicate modulus and metakaolin incorporation on the carbonation of alkali silicate-activated slags. Cement and Concrete Research, 2010. 40(6): p. 898-907.
96. Criado, M., A. Palomo and A. Fernández-Jiménez, Alkali activation of fly ashes. Part 1: Effect of curing conditions on the carbonation of the reaction products. Fuel, 2005. 84(16): p. 2048-2054.
97. Temuujin, J., A. van Riessen and R. Williams, Influence of calcium compounds on the mechanical properties of fly ash geopolymer pastes. Journal of Hazardous Materials, 2009. 167(1): p. 82-88.
98. Barbosa, V.F.F., K.J.D. MacKenzie and C. Thaumaturgo, Synthesis and characterisation of materials based on inorganic polymers of alumina and silica: sodium polysialate polymers. International Journal of Inorganic Materials, 2000. 2(4): p. 309-317.
99. Temuujin, J. and A. Van Riessen, Effect of fly ash preliminary calcination on the properties of geopolymer. Journal of Hazardous Materials, 2009. 164(2): p. 634-639.
100. Zhang, Z., J.L. Provis, A. Reid and H. Wang, Fly ash-based geopolymers: The relationship between composition, pore structure and efflorescence. Cement and Concrete Research, 2014. 64: p. 30-41.
101. Zhang, M., M. Zhao, G. Zhang, D. Mann, K. Lumsden and M. Tao, Durability of red mud-fly ash based geopolymer and leaching behavior of heavy metals in sulfuric acid solutions and deionized water. Construction and Building Materials, 2016. 124: p. 373-382.
102. Izquierdo, M., X. Querol, C. Phillipart and D. Antenucci. Influence of curing conditions on geopolymer leaching. in World of coal ash conference, Lexington, KY. 2009.
103. Fernández Bertos, M., S.J.R. Simons, C.D. Hills and P.J. Carey, A review of accelerated carbonation technology in the treatment of cement-based materials and sequestration of CO2. Journal of Hazardous Materials, 2004. 112(3): p. 193-205.
104. Huet, B., V. L’Hostis, F. Miserque and H. Idrissi, Electrochemical behavior of mild steel in concrete: Influence of pH and carbonate content of concrete pore solution. Electrochimica Acta, 2005. 51(1): p. 172-180.
105. Broomfield, J.P., Corrosion of steel in concrete: understanding, investigation and repair. 2002: CRC Press.
106. Neville, A.M., Properties of concrete. Vol. 4. 1995: Longman London.
Page 232
210
107. Wassermann, R., A. Katz and A. Bentur, Minimum cement content requirements: a must or a myth? Materials and Structures, 2009. 42(7): p. 973-982.
108. Steffens, A., D. Dinkler and H. Ahrens, Modeling carbonation for corrosion risk prediction of concrete structures. Cement and Concrete Research, 2002. 32(6): p. 935-941.
109. Song, K.-I., J.-K. Song, B.Y. Lee and K.-H. Yang, Carbonation characteristics of alkali-activated blast-furnace slag mortar. Advances in Materials Science and Engineering, 2014. 2014.
110. Puertas, F., M. Palacios and T. Vázquez, Carbonation process of alkali-activated slag mortars. Journal of Materials Science, 2006. 41(10): p. 3071-3082.
111. Law, D.W., A.A. Adam, T.K. Molyneaux, I. Patnaikuni and A. Wardhono, Long term durability properties of class F fly ash geopolymer concrete. Materials and Structures, 2014: p. 1-11.
112. Bernal, S.A., J.L. Provis, D.G. Brice, A. Kilcullen, P. Duxson and J.S.J. van Deventer, Accelerated carbonation testing of alkali-activated binders significantly underestimates service life: The role of pore solution chemistry. Cement and Concrete Research, 2012. 42(10): p. 1317-1326.
113. Roper, H. and D. Baweja, Carbonation-Chloride Interactions and Their Influence Corrosion Rates of Steel in Concrete. Special Publication, 1991. 126: p. 295-316.
114. Suryavanshi, A. and R.N. Swamy, Stability of Friedel's salt in carbonated concrete structural elements. Cement and Concrete Research, 1996. 26(5): p. 729-741.
115. Reddy, D.V., J.-B. Edouard and K. Sobhan, Durability of fly ash–based geopolymer structural concrete in the marine environment. Journal of Materials in Civil Engineering, 2012. 25(6): p. 781-787.
116. Vera, R., M. Villarroel, A.M. Carvajal, E. Vera and C. Ortiz, Corrosion products of reinforcement in concrete in marine and industrial environments. Materials Chemistry
and Physics, 2009. 114(1): p. 467-474. 117. Thomas, M.D.A. and J.D. Matthews, Performance of pfa concrete in a marine
environment––10-year results. Cement and Concrete Composites, 2004. 26(1): p. 5-20.
118. Stanish, K., R. Hooton and M. Thomas, Testing the chloride penetration resistance of concrete: a literature review. FHWA contract DTFH61, 1997: p. 19-22.
119. Olivia, M., Durability related properties of low calcium fly ash based geopolymer concrete. 2011.
120. Shaikh, F., Effects of alkali solutions on corrosion durability of geopolymer concrete. 2014.
121. Kupwade-Patil, K. and E.N. Allouche, Examination of Chloride-Induced Corrosion in Reinforced Geopolymer Concretes. Journal of Materials in Civil Engineering, 2012.
25(10): p. 1465-1476. 122. Shaikh, F.U., Effects of alkali solutions on corrosion durability of geopolymer concrete.
Advances in Concrete Construction, 2014. 2(2): p. 109-123. 123. Ganesan, N., R. Abraham and S.D. Raj, Durability characteristics of steel fibre
reinforced geopolymer concrete. Construction and Building Materials, 2015. 93: p. 471-476.
124. Neville, A., Chloride attack of reinforced concrete: an overview. Materials and Structures, 1995. 28(2): p. 63.
125. Lawrence, C., Sulphate attack on concrete. Magazine of concrete Research, 1990. 42(153): p. 249-264.
Page 233
211
126. FERRARIS JR, C., P.S. CLIFTON and E. GARBOCZI, 22 Mechanisms of degradation of Portland cement-based systems by sulfate attack. Mechanisms of chemical
degradation of cement-based systems, 1997: p. 185. 127. Santhanam, M., M.D. Cohen and J. Olek, Mechanism of sulfate attack: a fresh look:
Part 2. Proposed mechanisms. Cement and Concrete Research, 2003. 33(3): p. 341-346.
128. Ismail, I., S.A. Bernal, J.L. Provis, S. Hamdan and J.S. van Deventer, Microstructural changes in alkali activated fly ash/slag geopolymers with sulfate exposure. Materials and structures, 2013. 46(3): p. 361-373.
129. Neville, A., The confused world of sulfate attack on concrete. Cement and Concrete research, 2004. 34(8): p. 1275-1296.
130. Gollop, R. and H. Taylor, Microstructural and microanalytical studies of sulfate attack. I. Ordinary Portland cement paste. Cement and Concrete Research, 1992. 22(6): p. 1027-1038.
131. Bakharev, T., Durability of geopolymer materials in sodium and magnesium sulfate solutions. Cement and Concrete Research, 2005. 35(6): p. 1233-1246.
132. Ariffin, M.A.M., M.A.R. Bhutta, M.W. Hussin, M. Mohd Tahir and N. Aziah, Sulfuric acid resistance of blended ash geopolymer concrete. Construction and Building Materials, 2013. 43: p. 80-86.
133. Sata, V., A. Sathonsaowaphak and P. Chindaprasirt, Resistance of lignite bottom ash geopolymer mortar to sulfate and sulfuric acid attack. Cement and Concrete Composites, 2012. 34(5): p. 700-708.
134. Škvára, F., J. Doležal, P. Svoboda, L. Kopecký, S. Pawlasová, M. Lucuk, K. Dvořáček, M. Beksa, L. Myšková, and R. Šulc, Concrete based on fly ash geopolymers. Proceedings of 16th IBAUSIL, 2006. 1: p. 1079-1097.
135. Hughes, D., Pore structure and permeability of hardened cement paste. Magazine of Concrete Research, 1985. 37(133): p. 227-233.
136. Hossain, M.M., M.R. Karim, M.K. Hossain, M.N. Islam and M.F.M. Zain, Durability of mortar and concrete containing alkali-activated binder with pozzolans: A
review. Construction and Building Materials, 2015. 93(0): p. 95-109. 137. Nazari, A., G. Khalaj, S. Riahi, H. Bohlooli and M.M. Kaykha, Prediction total
specific pore volume of geopolymers produced from waste ashes by ANFIS. Ceramics
International, 2012. 38(4): p. 3111-3120. 138. Ma, Y., J. Hu and G. Ye, The pore structure and permeability of alkali activated fly ash.
Fuel, 2013. 104(0): p. 771-780. 139. Everett, D., Manual of symbols and terminology for physicochemical quantities and
units, appendix II: Definitions, terminology and symbols in colloid and surface
chemistry. Pure and Applied Chemistry, 1972. 31(4): p. 577-638. 140. Collins, F. and J.G. Sanjayan, Effect of pore size distribution on drying shrinking of
alkali-activated slag concrete. Cement and Concrete Research, 2000. 30(9): p. 1401-1406.
141. Duxson, P., J.L. Provis, G.C. Lukey, S.W. Mallicoat, W.M. Kriven and J.S.J. van Deventer, Understanding the relationship between geopolymer composition, microstructure and mechanical properties. Colloids and Surfaces A: Physicochemical
and Engineering Aspects, 2005. 269(1–3): p. 47-58. 142. Provis, J.L., R.J. Myers, C.E. White, V. Rose and J.S.J. van Deventer, X-ray
microtomography shows pore structure and tortuosity in alkali-activated binders. Cement and Concrete Research, 2012. 42(6): p. 855-864.
143. Juenger, M., F. Winnefeld, J.L. Provis and J. Ideker, Advances in alternative cementitious binders. Cement and concrete research, 2011. 41(12): p. 1232-1243.
Page 234
212
144. Al-Otaibi, S., Durability of concrete incorporating GGBS activated by water-glass. Construction and Building Materials, 2008. 22(10): p. 2059-2067.
145. Page, C. and K. Treadaway, Aspects of the electrochemistry of steel in concrete. Nature, 1982. 297(5862): p. 109-115.
146. Hansson, C., A. Poursaee and S. Jaffer, Corrosion of reinforcing bars in concrete. R&D Serial, 2007(3013).
147. Hussain, S.E., Rasheeduzzafar, A. Al-Musallam and A.S. Al-Gahtani, Factors affecting threshold chloride for reinforcement corrosion in concrete. Cement and
Concrete Research, 1995. 25(7): p. 1543-1555. 148. Babaee, M. and A. Castel, Chloride-induced corrosion of reinforcement in low-calcium
fly ash-based geopolymer concrete. Cement and Concrete Research, 2016. 88: p. 96-107.
149. Miranda, J.M., A. Fernández-Jiménez, J.A. González and A. Palomo, Corrosion resistance in activated fly ash mortars. Cement and Concrete Research, 2005. 35(6):
p. 1210-1217. 150. Saraswathy, V., S. Muralidharan, K. Thangavel and S. Srinivasan, Influence of
activated fly ash on corrosion-resistance and strength of concrete. Cement and Concrete Composites, 2003. 25(7): p. 673-680.
151. Monticelli, C., M.E. Natali, A. Balbo, C. Chiavari, F. Zanotto, S. Manzi, and M.C. Bignozzi, Corrosion behavior of steel in alkali-activated fly ash mortars in the light of their microstructural, mechanical and chemical characterization. Cement and Concrete Research, 2016. 80: p. 60-68.
152. Malolepszy, J. and J. Deja. Corrosion of steel in alkali activated slag binders. in BLENDED CEMENTS IN CONSTRUCTION. PAPERS PRESENTED AT THE INTERNATIONAL CONFERENCE, UNIVERSITY OF SHEFFIELD, UK, 9-12 SEPTEMBER 1991. 1991.
153. Zainal, F., S. Amli, K. Hussin, A. Rahmat and M. Abdullah. Corrosion Studies of Fly Ash and Fly Ash-Slag Based Geopolymer. in Materials Science and Engineering Conference Series. 2017.
154. Bernal, S.A., R. San Nicolas, J.L. Provis, R.M. de Gutiérrez and J.S. van Deventer, Natural carbonation of aged alkali-activated slag concretes. Materials and Structures, 2014. 47(4): p. 693-707.
155. San Nicolas, R., S.A. Bernal, R. Mejía de Gutiérrez, J.S.J. van Deventer and J.L. Provis, Distinctive microstructural features of aged sodium silicate-activated slag concretes. Cement and Concrete Research, 2014. 65(0): p. 41-51.
156. Nedeljković, M., Y. Zuo, K. Arbi and G. Ye, Natural Carbonation of Alkali-Activated Fly Ash and Slag Pastes, in High Tech Concrete: Where Technology and Engineering Meet. 2018, Springer. p. 2213-2223.
157. Shayan, A., A. Xu and F. Andrews-Phaedonos, Field applications of geopolymer concrete: a measure towards reducing carbon dioxide emission. Concrete in Australia, 2013. 39(3): p. 34-44.
158. El-Didamony, H., A.A. Amer and H. Abd Ela-ziz, Properties and durability of alkali-activated slag pastes immersed in sea water. Ceramics International, 2012. 38(5): p. 3773-3780.
159. Provis, J.L. and J.S. van Deventer, Alkali Activated Materials. 2014: Springer. 160. Davidovits, J., The ancient egyptian pyramids-concrete or rock. Concrete
International, 1987. 9(12): p. 28-37. 161. Ou, Z.W., S.Y. Zhou, C.X. Xu, Y. Zhang, J.C. Yang and Y.X. Li, Research and
Application of Geopolymer Cementitious Material Progress and Review. Applied Mechanics and Materials, 2013. 405: p. 2903-2911.
Page 235
213
162. Gourley, J. and G. Johnson. Developments in geopolymer precast concrete. in World Congress Geopolymer. 2005.
163. Bligh, R. and T. Glasby. Development of geopolymer precast floor panels for the Global Change Institute at University of Queensland. in Proceedings Concrete Institute of Australia Biennial Conference, Concrete. 2013.
164. Corbett, D., World first earth-friendly concrete airport. Concrete in Australia, 2014. 40: p. 7-8.
165. Heidrich, C., J. Sanjayan, M.L. Berndt, S. Foster and K. Sagoe-Crentsil, Pathways and barriers for acceptance and usage of geopolymer concrete in mainstream construction. Proceedings of the 2015 World of Coal Ash (WOCA), Nashville, TN, USA, 2015.
166. Van Deventer, J.S.J., J.L. Provis and P. Duxson, Technical and commercial progress in the adoption of geopolymer cement. Minerals Engineering, 2012. 29(0): p. 89-104.
167. Cheema, D., N. Lloyd and B.V. Rangan. Durability of geopolymer concrete box culverts-A green alternative. in Proceedings of the 34th Conference on Our World in Concrete and Structures. 2009.
168. Morandeau, A., M. Thiéry and P. Dangla, Impact of accelerated carbonation on OPC cement paste blended with fly ash. Cement and Concrete Research, 2015. 67: p. 226-236.
169. Räsänen, V. and V. Penttala, The pH measurement of concrete and smoothing mortar using a concrete powder suspension. Cement and Concrete Research, 2004. 34(5): p. 813-820.
170. Concrete, C. and A. Australia, Chloride resistance of concrete. Report, June, 2009. 171. Australia, S., Determination of water absorption and apparent volume of permeable
voids in hardened concrete, in AS1012.21. 1999, Australian Standards: Australia. 172. ASTM, C., 1585-04. Standard Test Method for Measurement of Rate of Absorption of
Water by Hydraulic-Cement Concretes. ASTM International, 2004. 173. Sulapha, P., S. Wong, T. Wee and S. Swaddiwudhipong, Carbonation of concrete
containing mineral admixtures. Journal of materials in civil engineering, 2003. 15(2): p. 134-143.
174. Castro, P., M.A. Sanjuán and J. Genescá, Carbonation of concretes in the Mexican Gulf. Building and Environment, 2000. 35(2): p. 145-149.
175. Khunthongkeaw, J., S. Tangtermsirikul and T. Leelawat, A study on carbonation depth prediction for fly ash concrete. Construction and Building Materials, 2006. 20(9): p. 744-753.
176. M.S.H. Khan, A.C., Amin Noushini. Carbonation of a low calcium fly ash geopolymer concrete. in The 9th International Concrete Conference 2016. 2016.
177. Castel, A., R. François and G. Arliguie, Effect of loading on carbonation penetration in reinforced concrete elements. Cement and Concrete Research, 1999. 29(4): p. 561-565.
178. Ho, D.W.S. and R.K. Lewis, Carbonation of concrete and its prediction. Cement and Concrete Research, 1987. 17(3): p. 489-504.
179. Bernal, S.A., J.L. Provis, B. Walkley, R. San Nicolas, J.D. Gehman, D.G. Brice, A.R. Kilcullen, P. Duxson, and J.S.J. van Deventer, Gel nanostructure in alkali-activated binders based on slag and fly ash, and effects of accelerated carbonation. Cement and Concrete Research, 2013. 53: p. 127-144.
180. Chang, C.-F. and J.-W. Chen, The experimental investigation of concrete carbonation depth. Cement and Concrete Research, 2006. 36(9): p. 1760-1767.
181. VicRoads, Test Methods for the Assessment of Durability of Concrete. Technical Note 89: , 2007: p. 4.
Page 236
214
182. Dong, J., L. Wang and T. Zhang, Study on the strength development, hydration process and carbonation process of NaOH-activated Pisha Sandstone. Construction and
Building Materials, 2014. 66(0): p. 154-162. 183. Lo, Y. and H.M. Lee, Curing effects on carbonation of concrete using a phenolphthalein
indicator and Fourier-transform infrared spectroscopy. Building and Environment, 2002. 37(5): p. 507-514.
184. Lee, W.K.W. and J.S.J. van Deventer, Structural reorganisation of class F fly ash in alkaline silicate solutions. Colloids and Surfaces A: Physicochemical and
Engineering Aspects, 2002. 211(1): p. 49-66. 185. Song, H.-W. and S.-J. Kwon, Permeability characteristics of carbonated concrete
considering capillary pore structure. Cement and Concrete Research, 2007. 37(6): p. 909-915.
186. Jiang, C., K. Fan, F. Wu and D. Chen, Experimental study on the mechanical properties and microstructure of chopped basalt fibre reinforced concrete. Materials & Design,
2014. 58: p. 187-193. 187. Zhang, M.-h. and H. Li, Pore structure and chloride permeability of concrete containing
nano-particles for pavement. Construction and Building Materials, 2011. 25(2): p. 608-616.
188. ASTM, C., 1218. C 1218M-99" Standard Test Method for Water-Soluble Chloride in Mortar and Concrete, 1999.
189. ASTM, C., 1152. Standard test method for acid-soluble chloride in mortar and concrete, 1990.
190. Cheewaket, T., C. Jaturapitakkul and W. Chalee, Long term performance of chloride binding capacity in fly ash concrete in a marine environment. Construction and Building Materials, 2010. 24(8): p. 1352-1357.
191. Ismail, I., S.A. Bernal, J.L. Provis, R. San Nicolas, D.G. Brice, A.R. Kilcullen, S. Hamdan, and J.S. van Deventer, Influence of fly ash on the water and chloride permeability of alkali-activated slag mortars and concretes. Construction and Building Materials, 2013. 48: p. 1187-1201.
192. Ransinchung, G., B. Kumar and V. Kumar, Assessment of water absorption and chloride ion penetration of pavement quality concrete admixed with wollastonite and microsilica. Construction and Building Materials, 2009. 23(2): p. 1168-1177.
193. AS 1012.20, in Methods of testing concrete-Determination of chloride and sulfate in hardened concrete and concrete aggregates. 1992.
194. Bertolini, L., B. Elsener, P. Pedeferri, E. Redaelli and R.B. Polder, Corrosion of steel in concrete: prevention, diagnosis, repair. 2013: John Wiley & Sons.
195. Costa, A. and J. Appleton, Concrete carbonation and chloride penetration in a marine environment. Concrete Science and Engineering, 2001. 3(12): p. 242-249.
196. Collepardi, M., A. Marcialis and R. Turriziani, Penetration of chloride ions into cement pastes and concretes. Journal of the American Ceramic Society, 1972. 55(10): p. 534-535.
197. Geng, J., D. Easterbrook, L.-y. Li and L.-w. Mo, The stability of bound chlorides in cement paste with sulfate attack. Cement and Concrete Research, 2015. 68(0): p. 211-
222. 198. Alonso, C., C. Andrade, M. Castellote and P. Castro, Chloride threshold values to
depassivate reinforcing bars embedded in a standardized OPC mortar. Cement and Concrete Research, 2000. 30(7): p. 1047-1055.
199. Mohammed, T.U. and H. Hamada, Relationship between free chloride and total chloride contents in concrete. Cement and Concrete Research, 2003. 33(9): p. 1487-
1490.
Page 237
215
200. Green, W., Riordan, G, Richardson, G., Marrosszeky, A., Durability Assessment, Design and Planning- Port Botany Expansion Project, in CIA 2010.
201. Lizarazo-Marriaga, J. and P. Claisse, Determination of the concrete chloride diffusion coefficient based on an electrochemical test and an optimization model. Materials Chemistry and Physics, 2009. 117(2–3): p. 536-543.
202. Song, H.-W., C.-H. Lee and K.Y. Ann, Factors influencing chloride transport in concrete structures exposed to marine environments. Cement and Concrete Composites, 2008. 30(2): p. 113-121.
203. Detwiler, R.J., K.O. Kjellsen and O.E. Gjorv, Resistance to chloride intrusion of concrete cured at different temperatures. Materials Journal, 1991. 88(1): p. 19-24.
204. Chalee, W. and C. Jaturapitakkul, Effects of W/B ratios and fly ash finenesses on chloride diffusion coefficient of concrete in marine environment. Materials and structures, 2009. 42(4): p. 505-514.
205. Luo, R., Y. Cai, C. Wang and X. Huang, Study of chloride binding and diffusion in GGBS concrete. Cement and Concrete Research, 2003. 33(1): p. 1-7.
206. Hirao, H., K. Yamada, H. Takahashi and H. Zibara, Chloride binding of cement estimated by binding isotherms of hydrates. Journal of Advanced Concrete Technology, 2005. 3(1): p. 77-84.
207. Olivia, M. and H. Nikraz. Durability of Fly Ash Geopolymer Concrete in a Seawater Environment. in Concrete 2011. 25th Biennial Conference of Concrete Institute of Australia. 2011.
208. Monticelli, C., M.E. Natali, A. Balbo, C. Chiavari, F. Zanotto, S. Manzi, and M.C. Bignozzi, A study on the corrosion of reinforcing bars in alkali-activated fly ash mortars under wet and dry exposures to chloride solutions. Cement and Concrete Research, 2016. 87: p. 53-63.
209. Heikal, M., M.Y. Nassar, G. El-Sayed and S.M. Ibrahim, Physico-chemical, mechanical, microstructure and durability characteristics of alkali activated Egyptian slag. Construction and Building Materials, 2014. 69(0): p. 60-72.
210. Menéndez, E., T. Matschei and F.P. Glasser, Sulfate attack of concrete, in Performance of Cement-Based Materials in Aggressive Aqueous Environments. 2013, Springer. p. 7-74.
211. Hime, W.G., R.A. Martinek, L.A. Backus and S.L. Marusin, Salt hydration distress.
Concrete international, 2001. 23(10): p. 43-50. 212. Neville, A.M., Concrete: Neville's insights and issues. 2006: Thomas Telford. 213. Villain, G., M. Thiery and G. Platret, Measurement methods of carbonation profiles in
concrete: Thermogravimetry, chemical analysis and gammadensimetry. Cement and Concrete Research, 2007. 37(8): p. 1182-1192.
214. Barnett, S.J., D.E. Macphee, E.E. Lachowski and N.J. Crammond, XRD, EDX and IR analysis of solid solutions between thaumasite and ettringite. Cement and Concrete Research, 2002. 32(5): p. 719-730.
215. van Deventer, J.S., J.L. Provis, P. Duxson and D.G. Brice, Chemical research and climate change as drivers in the commercial adoption of alkali activated materials. Waste and Biomass Valorization, 2010. 1(1): p. 145-155.
216. Kobayashi, K. and Y. Uno, Influence of alkali on carbonation of concrete, part 2-influence of alkali in cement on rate of carbonation of concrete. Cement and Concrete Research, 1990. 20(4): p. 619-622.
217. Dow, C. and F. Glasser, Calcium carbonate efflorescence on Portland cement and building materials. Cement and Concrete Research, 2003. 33(1): p. 147-154.
218. Dow, C. and F.P. Glasser, Calcium carbonate efflorescence on Portland cement and building materials. Cement and Concrete Research, 2003. 33(1): p. 147-154.
Page 238
216
219. Zhang, Z., J.L. Provis, A. Reid and H. Wang, Fly ash-based geopolymers: The relationship between composition, pore structure and efflorescence. Cement and
Concrete Research, 2014. 64(0): p. 30-41. 220. Singh, N., S. Vyas, R. Pathak, P. Sharma, N. Mahure and S. Gupta, Effect of
Aggressive Chemical Environment on Durability of Green Geopolymer Concrete. International Journal of Engineering and Innovative Technology (IJEIT) Volume, 2013. 3: p. 277-284.
221. Polder, R.B., Test methods for on site measurement of resistivity of concrete—a RILEM TC-154 technical recommendation. Construction and building materials, 2001. 15(2): p. 125-131.
222. Bu, Y. and J. Weiss, The influence of alkali content on the electrical resistivity and transport properties of cementitious materials. Cement and Concrete Composites, 2014. 51: p. 49-58.
223. Simon, T.K. and V. Vass, The electrical resistivity of concrete. Concrete Structures,
2012: p. 61-65. 224. Polder, R.B. and W.H. Peelen, Characterisation of chloride transport and
reinforcement corrosion in concrete under cyclic wetting and drying by electrical resistivity. Cement and Concrete Composites, 2002. 24(5): p. 427-435.
225. Czarnecki, L. and P. Woyciechowski, Modelling of concrete carbonation; is it a process unlimited in time and restricted in space? Bulletin of the Polish Academy of
Sciences Technical Sciences, 2015. 63(1): p. 43-54. 226. 5.2, C.e.-i.d.b.T.G. and C.e.-i.d.b.T.G. 5.1, New approach to durability design: an
example for carbonation induced corrosion. 1997: CEB Comité euro-international du béton.
227. Muntean, A., On the interplay between fast reaction and slow diffusion in the concrete carbonation process: a matched-asymptotics approach. Meccanica, 2009. 44(1): p. 35-
46. 228. Vesikari, E., Carbonation and chloride penetration in concrete with special objective of
service life modelling by the Factor Approach. VTT Technical Research Centre of Finland. VTT, 2009.
229. Kumar, S., R. Kumar and S. Mehrotra, Influence of granulated blast furnace slag on the reaction, structure and properties of fly ash based geopolymer. Journal of materials
science, 2010. 45(3): p. 607-615.