33
Field Assessment of Pandemic Preparedness & Response Capacity in Indonesia SUMMARY REPORT JUNE TO SEPTEMBER 2020

Field Assessment of Pandemic Preparedness & Response Capacity in Indonesia
SUMMARY REPORT JUNE TO SEPTEMBER 2020

Field Assessment of Pandemic Preparedness & Response Capacity in Indonesia: Summary Report © World Health Organization 2021 Some rights reserved. This work is available under the Creative Commons Attribution-Non-Commercial-Share Alike 3.0 IGO licence (CC BY-NC-SA 3.0 IGO; https://creativecommons.org/licenses/by-nc-sa/3.0/igo). Under the terms of this licence, you may copy, redistribute and adapt the work for non-commercial purposes, provided the work is appropriately cited, as indicated below. In any use of this work, there should be no suggestion that WHO endorses any specific organization, products or services. The use of the WHO logo is not permitted. If you adapt the work, then you must license your work under the same or equivalent Creative Commons licence. If you create a translation of this work, you should add the following disclaimer along with the suggested citation: “This translation was not created by the World Health Organization (WHO). WHO is not responsible for the content or accuracy of this translation. The original English edition shall be the binding and authentic edition”. Any mediation relating to disputes arising under the licence shall be conducted in accordance with the mediation rules of the World Intellectual Property Organization (http://www.wipo.int/amc/en/mediation/rules/). Suggested citation. Field Assessment of Pandemic Preparedness & Response Capacity in Indonesia: Summary Report, June to September, 2020. Jakarta: World Health Organization; 2021. Cataloguing-in-Publication (CIP) data. CIP data are available at http://apps.who.int/iris. Sales, rights and licensing. To purchase WHO publications, see http://apps.who.int/bookorders. To submit requests for commercial use and queries on rights and licensing, see http://www.who.int/about/licensing. Third-party materials. If you wish to reuse material from this work that is attributed to a third party, such as tables, figures or images, it is your responsibility to determine whether permission is needed for that reuse and to obtain permission from the copyright holder. The risk of claims resulting from infringement of any third-party-owned component in the work rests solely with the user. General disclaimers. The designations employed and the presentation of the material in this publication do not imply the expression of any opinion whatsoever on the part of WHO concerning the legal status of any country, territory, city or area or of its authorities, or concerning the delimitation of its frontiers or boundaries. Dotted and dashed lines on maps represent approximate border lines for which there may not yet be full agreement. The mention of specific companies or of certain manufacturers’ products does not imply that they are endorsed or recommended by WHO in preference to others of a similar nature that are not mentioned. Errors and omissions excepted, the names of proprietary products are distinguished by initial capital letters. All reasonable precautions have been taken by WHO to verify the information contained in this publication. However, the published material is being distributed without warranty of any kind, either expressed or implied. The responsibility for the interpretation and use of the material lies with the reader. In no event shall WHO be liable for damages arising from its use. This publication contains the collective views of those participating in Indonesia’s First Intra-Action Review on COVID-19 and does not necessarily represent the decisions or the policies of WHO.

1
Contents
Executive Summary ................................................................................................................. 3
Background ............................................................................................................................. 5
Objectives ............................................................................................................................ 5
Methods .................................................................................................................................. 6
Key findings by location .......................................................................................................... 8
Provincial Command Centres .............................................................................................. 8
Port Health Authorities ........................................................................................................ 9
Provincial Health Offices.................................................................................................... 10
Hospitals ............................................................................................................................ 12
Laboratories ...................................................................................................................... 16
District Health Offices ........................................................................................................ 18
Puskesmas (Public Health Centres) ................................................................................... 19
Community ........................................................................................................................ 20
Key findings by Province ....................................................................................................... 22
Central Java ....................................................................................................................... 23
South Sulawesi ...................................................................... Error! Bookmark not defined.
East Nusa Tenggara ............................................................... Error! Bookmark not defined.
East Java ................................................................................ Error! Bookmark not defined.
Bangka Belitung Islands ......................................................... Error! Bookmark not defined.
Jakarta ................................................................................... Error! Bookmark not defined.
West Kalimantan ................................................................... Error! Bookmark not defined.
Riau Islands ............................................................................ Error! Bookmark not defined.
North Sumatra ....................................................................... Error! Bookmark not defined.
Maluku .................................................................................. Error! Bookmark not defined.
Central Sulawesi .................................................................... Error! Bookmark not defined.
Bali ......................................................................................... Error! Bookmark not defined.
Central Kalimantan ................................................................ Error! Bookmark not defined.
Papua .................................................................................... Error! Bookmark not defined.
Riau ....................................................................................... Error! Bookmark not defined.
Recommendations ................................................................................................................ 26

2

3
Executive Summary
In early 2020 COVID-19 rapidly developed into a global health emergency, with the World Health Orgranization (WHO) declaring it a Public Health Emergency of International Concern (PHEIC) on 30 January 2020, and a pandemic on 11 March. The Government of Indonesia, with support from the World Health Organization and partners, has been responding to the threat of COVID-19, since its emergence was first recognized, to when the first cases were identified in Indonesia in March 2020, through to the present. As of the 31 December 2020, Indonesia has recorded 735,124 cases of COVID-19 as well as 21,944 deaths. Case numbers are continuing to grow, with around 50,000 new cases recorded per week at the end of 2020.
This report summarises the findings of a field assessment of pandemic preparedness and response capacity in Indonesia. The assessment was carried out between June and September 2020, by the Ministry of Health with the support of the WHO and Hasanuddin University.
The assessment utilised standardised tools to assess capacity in: Provincial Command Centres; Port Health Authorities; Provincial Health Offices; Hospitals; Laboratories; District Health Offices; Puskesmas (Public Health Centres); and within the community. Fifteen provinces were purposively sampled based on pandemic risk status and representation of the regions of Indonesia.
Key findings from the assessment included:
• All provinces have had functioning command and control structure for pandemic management, however there is a need to ensure all provinces have established Emergency Operation Centres (EOC).
• Many locations have developed contingency plans for pandemic response, however there is a need to strengthen contingency planning for managing in border areas related to cross-border movements.
• There is a need to improve case reporting and strengthen capacity for epidemiological analysis and risk assessment of pandemic severity.
• Budget allocation for purchase and stockpiling of personal protective equipment and activities at points of entry could be improved.
• Critical care capacity was limited in some facilities and likely to be stretched by any increase in COVID-19 case numbers.
• There is a need for health system strengthening activities to be conducted in health facilities at district level to improve care of patients with COVID-19.
• Accumulations of patient specimens and sub-optimal levels of testing were noted in referral laboratories – contributing to delayed turnaround time of test results. There

4
is a need to address this through developing a laboratory referral system to optimise testing capacity across the laboratory network.
• Risk communication activities could be further enhanced through greater engagement with media and community organisations, and improved infodemic monitoring and response.
• Discrepancies were noted between health authority and community perceptions of compliance with public health measures and protocols.
The period since the field assessment was initiated has seen a growing number of COVID-19 cases. It is thus clear that further work is needed to reduce transmission of COVID-19 in Indonesia. The field assessment of pandemic preparedness and response capacity identified gaps and areas for improvement. This report highlights the key areas for improvement across the different levels and areas of the pandemic response.

5
Background
In early 2020 COVID-19 rapidly developed into a global health emergency, with the World Health Orgranization (WHO) declaring it a Public Health Emergency of International Concern (PHEIC) on 30 January 2020, and a pandemic on 11 March. The Government of Indonesia, with support from the World Health Organization and partners, has been responding to the threat of COVID-19, since its emergence was first recognized, to when the first cases were identified in Indonesia in March 2020, through to the present. As of the 31 December 2020, Indonesia has recorded 735,124 cases of COVID-19 as well as 21,944 deaths. Case numbers are continuing to grow, with around 50,000 new cases recorded per week at the end of 2020.
Indonesia is a large country with a high level of diversity across its districts, provinces and regions, in terms of population, geography, socioeconomic development, and health system capacity. These factors greatly influence both the epidemiological situation in relation to COVID-19, as well as preparedness and capacity to respond to the pandemic.
There is a need to develop a greater and more granular understanding of both the epidemiological context and pandemic preparedness and response capacities across Indonesia, particularly at sub-national levels. This knowledge will help to inform public policy and resource allocation by the Government of Indonesia and response partners.
Objectives
The overarching objective was to conduct a comprehensive assessment of the pandemic response in Indonesia, in order to identify gaps and challenges and develop recommendations to address these.
Within the overarching objective, were several specific objectives:
a. To conduct a pandemic preparedness assessment
b. To assess the provincial COVID-19 Operational Plan implementation
c. To conduct an epidemiological analysis of the COVID-19 situation in the districts and cities assessed
d. To assess the readiness of the health system to handle an influx of COVID-19 patients
e. To assess the performance of the surveillance systems for case finding, contact tracing, providing information for public health risk assessment systems, and capacity of COVID-19 rapid response teams
f. To conduct an analysis of gaps and intervention plans for the preparation, review and or strengthening of COVID-19 operational plans.

6
Methods
The assessment utilised standardised tools to assess capacity for pandemic preparedness and response. The data collection tools were field tested prior to finalisation and converted into electronic format for online data collection in the field. The tools are available for review here: http://bit.ly/field-assessment-tools.
A total of 90 enumerators (6 per province) were recruited from the National Disaster Management Authority’s COVID-19 national volunteer register and provided relevant training before being deployed to the various sites for field assessment.
Field Assessment was conducted at provincial and district level in Indonesia. The provinces were selected based on provincial risk assessment, health system capacity and representation of regions at Indonesia such as Sumatra, Kalimantan, Java, Bali – Nusa Tenggara and Maluku – Papua. Assessment was also conducted at capital and comparative districts in the province and selected based on representation of COVID-19 pandemic risk. There were 15 provinces selected (figure 1) for field assessment and two districts were selected from each province.
Figure 1: Field assessment locations in Indonesia
The field assessment was conducted across eight locations in each of the provinces, including: Provincial Command Centres; Port Health Authorities; Provincial Health Offices; Hospitals; Laboratories; District Health Offices; Puskesmas (Public Health Centres); and within the community (figure 2) – totalling 211 sites assessed. Key stakeholders in each of the locations were interviewed for the field assessment – as detailed in the full report. Enumeration occurred between 4 September and 22 October 2020.

7
Figure 2: Field assessment locations
Each question in the questionnaires was allocated a binary score based on the response, with a score of one indicating that the criteria of the assessment for that question was met and a score of zero if the criteria were not met. A score of 0.5 was allocated where criteria were reported to be met, but no supporting evidence was available.
Scoring of questions with an unfavourable outcome was reversed. For example, “Has there been an increase of deaths in hospitals other than due to COVID-19?”, with an answer of ‘yes’ being allocated zero and an answer of ‘no’ being allocated one point.
The scoring then aggregated from each field assessment site and location for each question, and the aggregated scores were converted to a percentage, such that the highest possible score for each question or category was 100% and the lowest possible score was 0%.
See full report for detailed description of methods.

8
Key findings by location
Provincial Command Centres
All provinces have had functioning command and control structures for pandemic management, however not all provinces established an Emergency Operation Centre (EOC). The lowest score within the planning and coordination capacity was around availability of Standard Operating Procedures (SOPs) for early identification of outbreaks and information flow during a pandemic.
Most (9 out of 10) questions within the surveillance capacity had a score of 80% or more. The lowest score (60%) was related to availability of increased surveillance for people exposed to animals with potential to be infected with pandemic strains in times of pandemic risk. The next lowest scores (80%) were availability of surveillance guidelines and SOPs for early detection of emerging diseases and plans to meet emergency needs such as training, staff mobilization and necessary tools.
In relation to availability of guidelines, tools, systems and mechanisms, there were 4 out of 11 questions with a score below 80 and no question with a score of 100. The lowest score (57%) was availability of SOPs and guidelines for collecting epidemiological data, conducting investigation, and analysing severity of pandemic for response. The next lowest score (60%) was on mechanism to discontinue routine surveillance when the attack rate is high.
Four out of 15 provinces (score 73%) responded that they do not have guidelines, tools and mechanisms for surveillance of unknown deaths associated with acute respiratory infections in hospitals, and the surveillance officers have not been trained for pandemic preparedness or understand SOP for interpandemic surveillance and reporting during pandemic escalation and de-escalation.
Provincial command centre key capacities
9
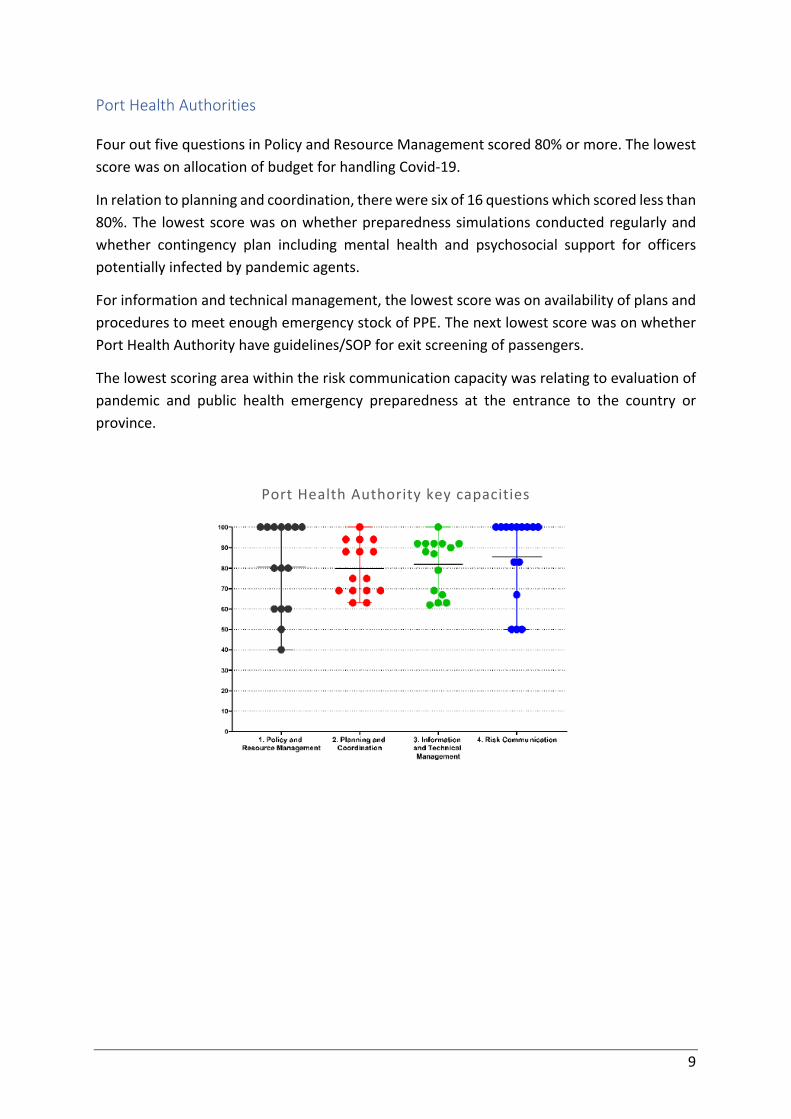
Port Health Authorities
Four out five questions in Policy and Resource Management scored 80% or more. The lowest score was on allocation of budget for handling Covid-19.
In relation to planning and coordination, there were six of 16 questions which scored less than 80%. The lowest score was on whether preparedness simulations conducted regularly and whether contingency plan including mental health and psychosocial support for officers potentially infected by pandemic agents.
For information and technical management, the lowest score was on availability of plans and procedures to meet enough emergency stock of PPE. The next lowest score was on whether Port Health Authority have guidelines/SOP for exit screening of passengers.
The lowest scoring area within the risk communication capacity was relating to evaluation of pandemic and public health emergency preparedness at the entrance to the country or province.
Port Health Authority key capacities

10
Provincial Health Offices
The lowest score within the policy and resource management capacity was relating to whether a contingency plan was available, with only 40% of PHO responded that a contingency plan was available at their province. Only 63% of PHOs with a contingency plan have tested their plan. Only 60% of PHOs responded that they provide insurance for Emergency Response Team (ERT).
In relation to planning and coordination, only 64% of PHOs involved a veterinarian in their pandemic preparedness plan and only 79% of PHOs involved a virologist in their pandemic preparedness plan.
There were only 68% PHOs surveyed that had a COVID-19 Operational Plan and only 46% of the PHOs conducted routine evaluation of their Operational Plan.
Only 46% PHOs monitor news, hoaxes, rumours and misinformation about COVID-19 and only 54% of PHOs discuss the risk communication strategy during coordination meetings at health emergency control.
In relation to the logistics capacity, the lowest score (33%) was on whether the PHO has socialized the Essential Supply Forecasting Tool (ESFT) to districts. There were only 43% of PHOs which responded that they developed plans based on ESFT. There were only 47% of PHOs which responded that there was a request and distribution of PPE for handling the bodies of deceased COVID-19 patients.
Only 40% of PHOs conducted a periodic survey of behaviour and 53% of PHOs had regional communication network for massive health promotion to prevent transmission of COVID-19.
Half of PHOs surveyed responded that they have a mechanism to support and monitor the physical and mental health of staff.
There were only 57% of PHOs which responded that there was enough oxygen capacity for at least 15% of their confirmed and suspected caseload of COVID-19. There were 79% of PHOs which responded that health services in their province have triage and screening facilities set-up for managing patients suspected of having COVID-19 when visiting health facilities.
Only 36% of PHOs indicated that they would be able to isolate 90% of suspect COVID-19 cases and have the status confirmed within 48 hours. However, 71% of PHOs monitor at least 80% of contacts for 14 days.

11
Provincial Health Office key capacities

12
Hospitals
All provincial hospitals had policies regarding COVID-19 pandemic preparedness and had their own administrative policies and guidelines to support staff to respond to the COVID-19 pandemic. However, not all these hospitals have plans or targets to assess implementation of the policies and most hospitals had not done preparedness simulations of their pandemic plans.
The incident management team, in a few of the assessed provincial hospitals, did not have a system assessing and identifying the need for expansion of inpatient, outpatient, and hospital intensive care unit, if there is an increase in the burden of COVID-19 cases.
All observed hospitals had an active Infection Control Committee, as well as protocols and systems in place maintaining infection control standards. However, only 39% of the surveyed hospitals had a standardized water cleaning system with chlorine available.
Only 86% had procedures for staff transfer and reassignment, though all hospitals had calculated optimal number of staff needed to ensure the continuity of essential hospital services during pandemic.
The majority (93%) of hospitals had a dedicated spokesperson for COVID-19. Almost all the hospitals updated their risk communication materials regularly to manage rumours in the hospital and to keep everyone informed about the COVID-19 pandemic, but only 71% had access to research and information related to COVID-19. All hospitals had a hospital message system or information board which could be easily accessed by public to receive key health messages.
Most (93%) of assessed hospitals had supplies reserved for COVID-19 pandemic use, with 92% of those stockpiles assessed as being sufficient for current conditions and 79% having a logistics monitoring system for supplies of PPE. However, only 25% of the hospitals had an agreement with the Ministry of Health or other organization regarding the procurement of equipment needed in the event of a surge of cases.
All COVID-19 patients were treated free of charge in provincial hospitals, and in all surveyed provincial hospitals, patients were treated in accordance with the current COVID-19 guidelines.
Just over half (57%) of hospitals assessed dedicated additional service capacity for COVID-19 cases, and around a third (36%) ran at maximum ICU capacity continuously. More than 80% of the hospitals surveyed observed an increase in death cases in hospital due to causes other than COVID-19.
All emergency and outpatient health services had a mechanism to isolate suspected COVID-19 patients, and 79% had their hospital rooms arranged and separated for suspected COVID-19 cases.
13
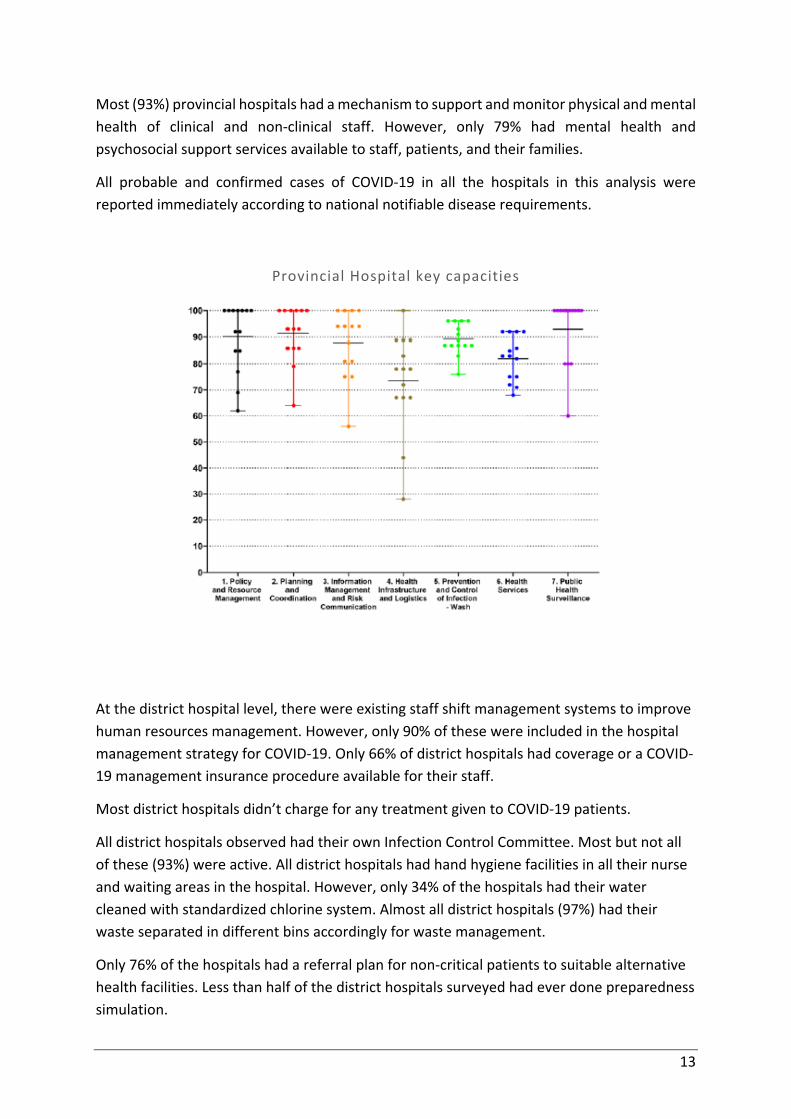
Most (93%) provincial hospitals had a mechanism to support and monitor physical and mental health of clinical and non-clinical staff. However, only 79% had mental health and psychosocial support services available to staff, patients, and their families.
All probable and confirmed cases of COVID-19 in all the hospitals in this analysis were reported immediately according to national notifiable disease requirements.
Provincial Hospital key capacities
At the district hospital level, there were existing staff shift management systems to improve human resources management. However, only 90% of these were included in the hospital management strategy for COVID-19. Only 66% of district hospitals had coverage or a COVID-19 management insurance procedure available for their staff.
Most district hospitals didn’t charge for any treatment given to COVID-19 patients.
All district hospitals observed had their own Infection Control Committee. Most but not all of these (93%) were active. All district hospitals had hand hygiene facilities in all their nurse and waiting areas in the hospital. However, only 34% of the hospitals had their water cleaned with standardized chlorine system. Almost all district hospitals (97%) had their waste separated in different bins accordingly for waste management.
Only 76% of the hospitals had a referral plan for non-critical patients to suitable alternative health facilities. Less than half of the district hospitals surveyed had ever done preparedness simulation.

14
For the Information Management and Risk Communication key capacity, 97% of the assessed district hospitals had oversight of their staff in case of COVID-19 infection.
More than 90% of the hospitals had a risk communication protocol available for use and the protocol in most of these hospitals was updated regularly.
The health infrastructure and logistics key capacity has a wide range of scores, with 97% of the hospitals answering that they had logistical reserves for the COVID-19 pandemic, while only 17% had an agreement with the authorities regarding procurement of equipment required for a surge of COVID-19 cases.
Only one-third of district hospitals assessed had a volunteers’ list to help in case of increased cases of COVID-19.
Nearly half (48%) of the district hospitals surveyed in this assessment allocated their service capacity specifically for COVID-19 cases only. Around 59% had their ICU at maximum capacity constantly during this pandemic. Most district hospitals (79%) reported increased deaths in hospital due to causes other than COVID-19 during the pandemic.
Almost all district hospitals (93%) had their hospital rooms arranged and separated specifically for suspected COVID-19 cases and this was the same case for emergency and outpatient health service facilities to isolate suspected COVID-19 cases.
There were more than half of the hospitals which compared their oxygen use with oxygen capacities and a slightly higher percentage of hospitals had their oxygen concentrators available for all confirmed and suspected COVID-19 patients treated in the hospital.
Most of the hospitals had functioning procedures for receiving and transferring suspected COVID-19 patients inside the hospital to isolation rooms and areas.
Most (93%) hospitals maintained their essential health services, eg. TB, HIV, immunization, and antenatal care active during the pandemic.
More than 80% of the district hospitals reported and entered new cases into the epidemiological analysis within 24 hours.

15
District Hospital key capacities

16
Laboratories
Most (93%) provincial laboratories had an internal control policy for laboratory preparedness (reagents, treatments, PPE, etc.). However, around half of the assessed laboratories did not have policies for specimen referral system, capacity building of the laboratory, and budgeting policy during COVID-19 pandemic.
The weakest scoring area in relation to planning and coordination was coordination of specimen workflow and governance in the investigation of COVID-19 cases. Further, less than half (43%) of provincial laboratories had the ability to examine specimens during holidays.
The survey found a high level (100%) of staff knowledge around routes and mechanisms of COVID-19 transmission, and 80% of surveyed laboratories had Standard Operating Procedures relating to laboratory skills available. Only a few provincial laboratories had not been practicing in accordance with Bio Safety Level standards.
With regards to logistics, most of the provincial laboratories had reserved PPE in case of increased demand. However, one-third of laboratories did not have standardised RT-PCR (TCM) equipment.
Provincial laboratory key capacities

17
Among district laboratories, in relation to the planning and coordination key capacity, the highest score of 88% was obtained in questions about coordination with cross-program laboratories and coordination in emergency situations. The lowest score of less than 50% was attained for coordinated specimen workflow in investigation of cases. Only half of district laboratories reported an ability to return results within a day and conduct examinations during holidays.
More than 80% of district laboratories had personal protective equipment for day-to-day use, or in reserve in case of increased demand. However, only half of the assessed district laboratories had standardized examination equipment for RT-PCR (TCM) and RT-PCR reagents for COVID-19 testing.
For COVID-19 PCR (TCM) testing, more than half of the district laboratories experienced accumulation of specimens, but only one third of them sent backlogged specimens to another examination laboratory for testing.
Most of the laboratories included have met Bio Safety Level for their laboratories. However, less than 80% of the laboratories sent their positive and negative specimens for validity testing to the National Reference Laboratory for COVID-19 (Balitbangkes).
District laboratory key capacities

18
District Health Offices
Coordination capacities of the DHOs were strong, achieving over 90% in four of five criteria. The lowest score was related to whether the provincial task force receives timely and accurate implementation reports at primary and secondary level services.
Only 40% of DHOs responded that there were adequate intensive care services for COVID-19 patients. There were only 62% DHOs which had district level operational plans. There were 62% DHOs which prepared secondary health service facilities for surges of COVID-19 by up to 20% of existing facility capacity.
Only around one-third (37%) of DHOs reported an ability to isolate 90% of suspected and confirmed cases within 48 hours. Around half (52%) of DHOs were able to trace contacts of at least 80% of cases and quarantine them within 72 hours of case confirmation. Finally, two-thirds (67%) of DHOs monitor at least 80% of contacts for at least 14 days.
Half of surveyed DHOs responded that they conduct periodic inarisk survey. Based on the periodic inarisk surveys, only 20% of DHOs responded that more than 50% of people in their area stayed at home and only 53% DHOs responded that more than 80% of people leaving house wear mask.
District Health Office key capacities

19
Puskesmas (Public Health Centres)
Three-quarter of Puskesmas surveyed, responded that monitoring and evaluation have been carried out on existing capacities and priorities for COVID-19 preparedness. Most (80%) of Puskesmas responded that there is budget that can be accessed if there is public health emergency.
Eighty-two percent of Puskesmas have plans for rapid response mobilization. Almost all (93%) Puskesmas were included their regional pandemic preparedness contingency plan.
Just over one-third (37%) of Puskesmas have Standard Operating Procedures for screening of patients with cases related to infectious disease. There were only 37% Puskesmas responded that there is regular pandemic preparedness training for influenza or other emerging disease. Just under half (45%) of Puskesmas responded that they have attended pandemic preparedness training.
Just over two-thirds (68%) of Puskesmas have room which could be converted for observation of a patient suspected of having a pandemic potential disease. The majority (82%) of Puskesmas have Standard Operating Procedures to access Personal Protective Equipment stock at their Health Office
Three quarters (72%) of Puskesmas responded that they have hand hygiene facility within five metres of the toilet. Most (73%) Puskesmas have functional infectious and sharp waste treatment, according to applicable Standard Operating Procedures, and 76% of Puskesmas have water treatment facility with chlorine or any other standardized technology.
Less than one-third (30%) of Puskesmas had a strategy to disseminate health information including dissemination to difficult-to-reach areas. Only 33% of Puskesmas had community empowerment plans for transmission control, including involving community leaders.
Only 60% of Puskesmas conduct swabs for suspect COVID-19 cases.
Twenty percent of Puskesmas reported that the PPI team did not evaluate causes of transmission among officers.
There were 80% of Puskesmas conducted enhanced surveillance in closed residential areas and for vulnerable groups. There were 93% of Puskesmas able to report and enter data into epidemiological analysis of newly identified cases within 24 hours.

20
Puskesmas key capacities
Community
Among community respondents: 41% reported that offices and workplaces had been closed in their local area; 29% reported that places of worship are being used for community social activities and 37% reported places of worship were closed for congregational activities; 18% reported that shopping facilities were closed in their area; 43% reported a reduction in public transport operations and 82% reported public transport services were limiting passenger numbers.
Among public places surveyed: 63% were implementing restricted hours of operation; and 65% implement body temperature checks of patrons.
There were 96% of community members who responded that people in public places wore a face mask. Public health measures which had the highest reported uptake by community members were hand washing and mask wearing.

21
Community key capacities

22
Key findings by Province
Field assessment was conducted at 15 provinces around Indonesia. Aggregated pandemic preparedness and response capacity scores by province are seen in the figure below.
Aggregate pandemic preparedness and response capacity score by province

23
Key capacities by location and province
Location Key capacity
Cent
ral J
ava
Sout
h Su
law
esi
East
Nus
a Te
ngga
ra
East
Java
Bang
ka B
elitu
ng
Jaka
rta
Wes
t Kal
iman
tan
Riau
Isla
nds
Nor
th S
umat
ra
Mal
uku
Cent
ral S
ulaw
esi
Bali
Cent
ral
Kalim
anta
n
Papu
a
Riau
Provincial Command Centre
1. Planning and coordination 92 100 100 100 85 92 100 92 92 85 100 15 77 77 92
2. Surveillance 100 100 100 100 90 100 90 90 60 90 90 80 70 90 90
3. Availability of guidelines, tools & systems 95 95 64 100 59 86 91 100 77 64 95 18 82 86 95 Port Health Authority
1. Policy and resource management 100 100 100 100 100 80 80 60 50 100 60 100 80 40 60
2. Planning and coordination 75 94 100 69 94 69 75 88 94 88 69 63 88 63 69
3. Information and technical management 87 100 92 92 92 63 62 79 92 88 69 90 92 67 63
4. Risk communication 100 100 100 100 100 50 100 67 100 100 50 100 83 50 83 Provincial Health Office
1. Policy and resource management 93 92 89 86 86 75 100 55 85 50 95 64 66 48 50
2. Planning and coordination 100 100 94 94 94 94 89 100 94 89 94 89 83 94 83
3. Information management 86 89 91 84 91 73 91 100 73 73 91 95 68 80 62
4. Logistics 88 81 100 81 50 88 88 50 44 44 88 25 75 75 44
5. Community role 93 86 86 64 86 79 79 86 14 29 64 71 36 79 14
6. School and workplace closure 100 67 100 67 100 100 100 100 100 100 67 67 67 100 67
7. Restrictions of religious activities 100 60 75 63 100 100 100 60 100 75 25 100 20 63 75
8. Restriction of activities in public places 100 75 50 75 100 75 100 50 67 33 75 33 25 63 50
9. Restriction of social and cultural activities 100 50 100 50 100 100 100 50 100 100 100 100 100 100 100
10. Restriction of other activities 100 100 100 100 100 100 100 100 100 100 100 100 100 100 100
11. Epidemiology 33 67 56 33 78 33 89 33 78 56 22 11 44 67 22
12. Health system 95 89 89 89 95 95 95 89 84 58 74 68 89 84 89
13. Public health surveillance 97 100 100 100 93 83 100 87 60 63 67 87 93 97 77 District Health Office
1. Coordination 90 100 100 85 80 100 100 100 100 80 100 100 100 100 100
2. Implementation 91 88 85 92 85 81 89 76 75 63 83 92 75 88 87

24
Location Key capacity
Cent
ral J
ava
Sout
h Su
law
esi
East
Nus
a Te
ngga
ra
East
Java
Bang
ka B
elitu
ng
Jaka
rta
Wes
t Kal
iman
tan
Riau
Isla
nds
Nor
th S
umat
ra
Mal
uku
Cent
ral S
ulaw
esi
Bali
Cent
ral
Kalim
anta
n
Papu
a
Riau
3. Public health surveillance 97 80 87 93 97 70 74 87 68 75 89 81 82 83 80
4. Behaviour change prevention 88 25 50 63 63 50 63 63 75 50 63 50 63 100 50 Provincial Hospital
1. Policy and resource management 92 100 100 85 77 100 100 100 62 69 85 100 100 92
2. Planning and coordination 100 100 64 100 93 100 86 86 100 93 86 79 100 93
3. Information management & risk communication 100 100 75 100 88 94 81 81 94 56 75 100 94 94
4. Health infrastructure and logistics 78 89 67 83 44 89 78 78 72 89 67 67 100 28
5. Prevention and control of infection 87 89 83 96 87 96 96 96 93 87 76 91 87 87
6. Health services 82 92 81 86 75 90 86 78 68 65 81 72 92 83
7. Public health surveillance 100 80 100 100 100 100 100 100 80 60 80 100 100 100 District Hospital
1. Policy and resource management 85 54 85 89 96 89 92 70 96 85 88 93 73 88 89
2. Planning and coordination 90 65 80 100 90 95 85 75 85 80 85 75 80 75 85
3. Information management & risk communication 85 85 63 85 78 91 82 72 81 69 72 69 64 78 85
4. Health infrastructure and logistics 78 44 61 81 84 78 67 67 72 72 78 73 46 70 81
5. Prevention and control of infection 96 82 53 93 94 83 95 83 95 83 80 86 83 95 87
6. Health services 81 69 57 87 69 82 75 68 86 80 75 72 64 70 75
7. Public health surveillance 90 90 100 90 100 90 100 90 100 100 80 80 100 80 100 Provincial Laboratory
1. Regional policy 82 82 100 100 100 64 0 50 82 77 91 64 50 64
2. Planning and coordination 83 100 83 100 100 83 50 83 100 83 100 83 83 67
3. Information and knowledge management 70 93 80 100 87 67 70 63 93 53 93 63 60 75
4. Infrastructure and logistics 75 100 100 100 100 55 80 65 100 40 100 65 35 78
5. COVID-19 PCR testing capacity 50 67 33 33 33 50 50 0 67 100 67 0 0 33
6. Quality assurance 100 100 100 100 67 100 0 100 100 33 100 100 100 100
1. Regional policy 100 91 66 82 57 75 55 55 89 50 77 21

25
Location Key capacity
Cent
ral J
ava
Sout
h Su
law
esi
East
Nus
a Te
ngga
ra
East
Java
Bang
ka B
elitu
ng
Jaka
rta
Wes
t Kal
iman
tan
Riau
Isla
nds
Nor
th S
umat
ra
Mal
uku
Cent
ral S
ulaw
esi
Bali
Cent
ral
Kalim
anta
n
Papu
a
Riau
District laboratory
2. Planning and coordination 83 100 63 50 71 75 83 83 100 83 67 25
3. Information and knowledge management 100 93 85 93 62 93 67 73 90 63 93 42
4. Infrastructure and logistics 100 100 63 100 65 70 85 65 70 65 80 38
5. COVID-19 PCR testing capacity 33 33 50 33 50 50 50 0 17 0 0 33
6. Quality assurance 100 67 100 100 100 50 67 67 0 100 100 84 Primary Health Centre
1. Policy and resource management 94 88 100 81 94 94 94 100 94 69 100 94 50 75 73
2. Planning and coordination 100 100 100 100 94 100 94 88 88 75 100 100 75 94 100
3. Information management and training 92 69 94 83 66 86 89 93 90 67 74 83 75 80 86
4. Health infrastructure and logistics 94 81 100 88 88 94 81 94 81 56 81 81 88 81 69
5. Prevention and control of infection 87 80 93 91 93 89 89 91 93 80 93 91 84 68 91
6. Community capacity and risk communication 70 64 69 73 67 66 63 79 76 56 52 77 43 35 52
7. Health systems 88 84 88 92 93 97 95 98 93 85 82 93 81 83 92
8. Public health surveillance 88 100 100 100 88 88 100 100 100 100 88 75 63 38 75 Community 1. School and workplace closure 72 39 64 36 41 45 59 52 61 45 54 50 66 48 68
2. Restriction of religious activities 67 61 46 17 42 43 22 50 59 17 50 50 62 45 67
3. Restriction of activities in public places 94 92 74 72 78 91 59 63 88 83 73 74 73 89 72
4. Restriction of modes of transportation 75 57 45 63 60 74 44 30 60 67 60 83 58 67 75
5. Restriction of other activities 97 83 82 79 82 76 51 66 68 81 64 79 72 90 69
6. Reception of valid COVID-19 information 100 100 100 100 88 100 89 88 100 83 100 83 50 100 100
7. COVID-19 knowledge, attitudes & behaviour 96 94 83 100 27 100 87 23 100 92 100 100 94 100 100
Table legend No data 0 to 49 50 to 59 60 to 69 70 to 79 80 to 89 90 to 100

26
Average capacity score by location and province

27
Average capacity score by province and location

28

29
Recommendations
Overarching recommendations for strengthening pandemic preparedness and response capacity in Indonesia have been based on addressing the weakest capacities observed in various locations of the field assessment.
Almost all provinces reported an increasing number of cases and deaths during the field assessment period, indicating increasing transmission based on epidemiological assessment of the situation. As such, there is an urgent need to strengthen pandemic preparedness and response activities in Indonesia.
Key overarching recommendations
1. Provincial Operational Plans could be further strengthened through the development of supporting guidelines and standard operating procedures for implementation of the operational plan, involving the veterinary sector in development of operational plans and improving monitoring and evaluation of the operational plans
2. Contingency Plan for pandemic preparedness has been developed at several locations. Contingency plans could be improved by including plans for providing mental health and psychosocial support to patients, patients’ families, and healthcare staff, and through conducting routine simulations of the contingency plan
3. Capacity for the provision of intensive care to patients with COVID-19 should be increased, and health system strengthening activities implemented for hospitals and healthcare facilities, especially at district level
4. A laboratory referrals system is needed to optimise testing capacity across the laboratory network by reducing accumulation of specimens in individual laboratories
5. Timeliness of COVID-19 status among suspect cases must be improved and measures are needed to address the low level of adherence to isolation among suspect cases
6. The community needs to be empowered for community led pandemic preparedness and response. Health Offices and Puskesmas need to develop guidelines to empower the community to support the public health response
7. Risk communication activities could be further enhanced through greater engagement with media and community organisations to disseminate valid COVID-19 information, and improved infodemic monitoring and response
8. Health Offices and Puskesmas perceived that the community did not comply with health protocols. However, based on field assessment at community level, the

30
respondents perceived that there is high compliance of health protocol implementation, such as use of face masks. These findings need to be considered in disseminating public messages to the community to maximise uptake and compliance with health protocols


![Pandemic Preparedness and Response An Open Community Dialogue [Your Name(s) Here]](https://static.documents.pub/doc/80x56/56649d795503460f94a5ca45/pandemic-preparedness-and-response-an-open-community-dialogue-your-names.jpg)


