Journal of Experimental Botany, Vol. 47, No. 304, pp. 1643-1650, November 1996Journal ofExperimentalBotany
Field measurements of xylem cavitation: are acousticemissions useful?
G.E. Jackson1 and J. Grace
Institute of Ecology and Resource Management, University of Edinburgh, Darwin Building, Mayfield Road,Edinburgh EH93JU, UK
Received 8 December 1995; Accepted 6 May 1996
Abstract
Cavitation of water columns within the xylem is dele-terious for plant water relations as it results in embol-ism, so reducing hydraulic conductivity. This cavitationcan be detected as it is accompanied by the productionof acoustic emissions, which can be detected urtra-sonically and logged automatically over periods ofdays. The acoustic emission technique is useful todetermine the threshold water potential at whichdamage to the water-conducting system of the plantis initiated. It can reveal which environmental variablesare deleterious to the plant water relations, and whichparts of the plant are most sensitive to cavitation.Species comparisons, and comparisons of the samespecies in different environments can be made, toobtain indications of drought tolerance. However,acoustic emissions have only a limited use in determin-ing the proportion of embolism in a conducting stem,and other methods are needed to find the percentagereduction in hydraulic conductivity.
Since the discovery that plants produce acoustic emissionswhen water stressed (Milburn and Johnson, 1966) a bodyof literature has developed interpreting this intriguingfeature of plant response to the environment. The presentpaper examines the phenomenon and its relevance to thewater relations of plants. The paper is divided into foursections.
(1) Acoustic emissions are interpreted as the result ofcavitation in the water-conducting pathways of plants
(Sandford and Grace, 1985; Borghetti et ai, 1989). Thephysical process of cavitation is therefore briefly reviewed(for extensive reviews see Tyree and Sperry, 1989a;Milburn, 1993; Oertli, 1993).
(2) The detection of acoustic emissions from plantsrequires sensors, amplification and counting equipment.Only one ultrasonic acoustic detection system is currentlyused by researchers, and the use of that system in practiceis examined.
(3) Cavitation leads to blockages or embolisms in thewater-conducting pathway. The general methods availablefor quantifying embolism are reviewed, and the utility ofthe acoustic emission technique for these determinationsis discussed.
(4) Finally, some of the uses of acoustic emissiondata are detailed, illustrated with examples from ourlaboratory.
The physical process of cavitation
First of all it is necessary to know the origin and causesof acoustic emissions. They are believed to arise as aresult of cavitation of water columns in the vessels andtracheids comprising the water-conducting pathway (thexylem) of plants, but the exact origin of the sound is stillunclear (Ritman and Milburn, 1988). The cohesion theoryof water transport (Dixon and Joly, 1895) states thatwater is moved through the soil—plant-atmosphere con-tinuum under a negative pressure, or tension. If thistension increases above a threshold the continuity of thewater column can no longer be maintained and it breaks.Pure water can sustain enormous tensions (up to 30 MPa,Briggs, 1950), but the observed tensions at which cavita-tion occurs are far lower than this because of the mechan-ism known as 'air seeding'. Tiny air bubbles arise either
from crevices in the cell wall or through the pit membranesand nucleate the cavitation (Zimmermann, 1983). Tensionincreases with transpiration rate as a result of friction inthe pathway, and so cavitation is expected to be observedin the summer under conditions which favour high trans-piration. In the winter, other processes may lead toembolism. During freezing, gas bubbles dissolved in watercome out of solution and embolisms may result (Robsonand Petty, 1993). Also in the winter tensions may occurwhen water in the soil or stem is frozen, yet evergreenleaves continue to transpire.
In the xylem cell (composed of only the outer dead cellwall, and termed a conduit) where the water columnbreakage occurs the previously liquid water becomeswater vapour and fills the now non-conducting vessel ortracheid. It is presumed that air diffuses into the cell insubsequent minutes until it reaches atmospheric pressure,at which point it constitutes an embolism or blockage inthe conducting tissue. Figure 1 shows a blocked cellsurrounded by conducting cells. The air blocking thepreviously conducting cell arises either out of solutionfrom water in surrounding conducting cells, from intercel-lular spaces, or from other surrounding embolized cells.One embolized tracheid, as shown here, is not a seriouslydamaging event since there are many other routes throughwhich water can be drawn and lateral transport is alsopossible (Greenidge, 1957). However, should many cellsbecome embolized, fewer routes for transport exist andthe water potential of distal parts will further decline. Ithas been postulated that this may lead to 'runaway
I t I I t M
i t tun i
cavitation' (Milburn, 1973; Tyree and Sperry, 1988)resulting in the plasmolysis of leaf cells and eventuallythe death of the entire organ. The occurrence of runawaycavitation has not been demonstrated in the xylem ofvascular plants, and may be a rare phenomenon as thepores connecting individual tracheids have a valve-likesystem designed to resist its occurrence. The pores, orpits, consist of a central torus with a net-like margoconnecting it to the overhanging secondary cell wall(Fig. 2). When a cell is embolized the torus is displacedby the difference in pressure on the two sides, and it issealed against the cell wall which, unless the pressuredifference across it increases above a critical level, effec-tively prevents the passage of any further air or waterthrough it.
Once a conduit has embolized can it refill and resumeits role in the conducting system? The answer is yes, butonly under certain circumstances. If the pressure insidethe surrounding conducting vessels and tracheidsapproaches atmospheric, the torus of the pit membranebetween the cells will be released from its position sealedon to the secondary cell wall and, as the air inside thecavitated cell dissolves, water will flow into the embolizedcell. However, water in the xylem is usually transportedunder negative pressure (as a result of the suction gener-ated by evaporation above) and conditions for positivepressures arise only when no transpiration is occurring.A positive root pressure is required if water is to beabsorbed in the absence of transpiration, but positivepressures of any magnitude have only ever been demon-strated in angiosperms. For example, Sperry et al. (1987)demonstrated a large positive root pressure in embolizedwild grape vine, where the air was simply squeezed outof the vessels as the sap rose in the spring. Althoughvarious suggestions have been made as to the mechanismof refilling in conifers (Borghetti et al, 1991) the mechan-
Fig. 1. Tangential section of coniferous wood. The tracheid in thecentre (marked X) is vapour-blocked and does not function; waterflows around it. (Reproduced with permission from Zimmermann,1983, Xylem structure and the ascent of sap. New York: Springer.)
Fig. 2. Cross-section of a bordered pit. (i) Valve open allowing waterto pass through it. (ii) Valve closed, following cavitation preventing theflow of water. T, torus; M, pit membrane; B, bordered pit. (Reproducedwith permission from Zimmermann, 1983, Xylem structure and theascent of sap. New York: Springer.)
ism still remains unknown. The time elapsed since embol-ism occurred is probably crucial to the effective refillingof the cell, since tyloses or growths can occur in theembolized cell, which effectively prevents any furtherconduction (Zimmermann, 1979). The torus of the pitmembrane can also become permanently sealed to thesurrounding secondary cell wall material so preventingany refilling (Comstock and Cot6, 1968).
Detection of acoustic emissions
Milburn and Johnson (1966) were the first to detectacoustic emissions from plants. They were following upthe hypothesis that when the water columns insidedroughted plants come under sufficient tension theyshould cavitate, and this should be accompanied by ashock-wave detectable as sound. Cavitation in physicalsystems, for example, in the water columns of hydraulicpumps, is accompanied by the emission of sound. Theirinnovative idea was to connect a domestic record playerpick-up arm and amplifier to the petiole of a severed leaf.As the leaf dried, the water in the xylem vessels of thepetiole would come under tension and would be expectedto change state, i.e. cavitate. They were proved correct(Milburn and Johnson, 1966), but the noise generatedwas naturally less than that in hydraulic pumps. Theytermed the emissions 'clicks' and noticed that if the leafwas allowed to dehydrate totally, until it produced nomore sounds, roughly the same number of clicks wereproduced as there were conduits within the leaf, in theircase around 3000. They also saw that if they added adrop of water to the cut end of the petiole the clickswould slow or stop. These acoustic emissions wererecorded in a sound-proof room since any extraneousnoise could also be picked up by the record playeramplifier. This limited the technique to laboratory investi-gations. However, in 1983 Tyree and Dixon developed asystem to detect acoustic emissions in the ultrasoundrange. Ultrasound is propagated shorter distances in airand the problem of extraneous noise was therefore minim-ized, and thus it became possible to use the technique inthe natural environment. The original sensors were pro-duced by Bruel and Kjaer (model 8312, DK-2859,Naerum, Denmark) and contained a ceramic materialwhich exploited the piezoelectric effect to convert thesmall mechanical compression of the ceramic crystal intoan electrical signal. Such sensors were originally designedto detect cracking in metallic engineering structures, forexample, ships hulls and bridges, and have subsequentlybeen adapted for use with plants.
The system currently most used by water relationsresearchers is the 4615 DSM (Drought Stress Monitor)with 1151 transducers produced by Physical AcousticSystems in Princeton, New Jersey. This system was foundto have a seven times better signal-to-noise ratio than the
Field measurements of xylem cavitation 1645
Bruel and Kjaer system (Tyree and Sperry, 19896). Italso employs the piezoelectric effect and the electronicsystem amplifies and records the acoustic emissions. Afull system with one transducer can be bought from theBritish agent in Cambridge for $US 7050 (December,1995). This price includes software written by MT Tyreefor use with a personal computer which can be used tointerpret the recorded events. Figure 3 shows an 1151acoustic emission sensor attached to a mature Scots pinetree. It has a band pass filter in the range 100-300 kHzwhich coincides with the typical cavitation-induced AEwhich has a strong frequency component in this range(Tyree and Sperry, 19896). This makes it superior tosensors with higher frequency band pass filters whichhave an increased signal-to-noise ratio. The system allowsamplification of the signal of up to 80 dB. Differentclamping systems have been designed to attach the sensorto the tree, but it is important to standardize the pressurewith which it is attached since this has been shown toaffect the number of AEs recorded. In the system showna calibrated spring is used which, if depressed by 2.54 cm,applies a force of 30 N. A hole is made in the bark, andthe phloem and cambium layers beneath are removed sothat the sensor is attached directly to the xylem (wood)beneath. A thin layer of petroleum jelly is smearedbetween the sensor head and the xylem to improve theacoustic contact, and further jelly is placed in the holesurrounding the sensor to prevent local dehydration ofthe trunk leading to artificially high levels of cavitation.A sensor can be directly attached to the recording systemor attached through a multiplexor, in which case anynumber of sensors can be used and large numbers ofplants can be monitored. Data are recorded sequentiallyand must be analysed later to interpret the events pro-duced by a particular plant. Sensors can be positionedon any part of the plant, including the roots, stems andleaves (Hacke and Sauter, 1995), although stems nar-rower than 3 mm are difficult to work with. The systemcan operate in the field continuously, as long as there isspace in the memory and the batteries are charged.
Quantification of embolism
Acoustic emission production indicates that the plant iscurrently developing embolism and the rate of productionindicates to what extent the current stress level is affectingthe plant. Careful integration of all AEs can give ameasure of 'accumulated embolism', however, beforelooking into how this can be done three other more directmethods of measuring accumulated embolism will bebriefly reviewed.
(1) Wood consists of three main components: thewoody matrix, air and water. The volume fraction of air(i.e. the accumulated embolism) can be found by differ-ence since the volume fractions of water and woody
Fig. 3. Ultrasound acoustic emission sensor (1151) operating on a mature Scots pine tree. A hole is made in the bark, and the phloem and cambiumlayers beneath are removed so that the sensor is attached directly to the xylem (wood) beneath.
matrix can be calculated. The density of many woodytissues can be assumed to be 1.53 g cm"3 (Siau, 1971)and the total wood volume found by Archimedes' prin-ciple, i.e. displacement in water (Borghetti et al, 1991).The volume fraction of air can be calculated from
where Vg is the volume fraction of air, Kf is the freshvolume of the sample, W{ is fresh weight and Wd is dryweight. The density of water is assumed to be 1.00.
The volume fraction of air in whole stem sections canbe found, following the removal of the bark, phloem andcambium layers. Alternatively, cores can be taken frommature trees.
(2) The frequent aim in assessing the proportion ofembolism in a piece of stem is to quantify how much lessthe observed hydraulic conductivity is than the theoreticalmaximum if all the conduits were conducting. This iscalled the percentage reduction in hydraulic conductivityand can be assessed directly by the so-called 'Sperrytechnique' (Sperry et al., 1988). A severed stem section(which must be longer than the longest xylem vesselscontained within it) is mounted and a suitably preparedperfusing solution allowed to pass through it under a lowpressure. The solution is then forced through the samesection under a higher pressure, typically 100 kPa, whichis intended to refill the embolized conduits. The hydraulicconductivity is denned as the mass flow rate of thesolution through the section divided by the pressuregradient across the section. The percentage difference inthe two values is the percentage reduction in hydraulicconductivity. This technique can be combined with the
perfusion method (below) by including a dye in thesolution passing through the stem section.
(3) Perfusion experiments can be conducted by allowinga dye to flow through a section of stem. The resultingstaining pattern of the wood can be analysed; stainedcells are assumed to be conducting and unstained cells areassumed to be non-conducting. For example, Greenidge(1957) perfused a variety of mature temperate tree specieswith acid fuchsin and found, as expected, a layer ofconducting sapwood just under the bark, and a largerarea of non-conducting heartwood in the centre. Lo Gulloand Salleo (1991) found good agreement when theycompared the predicted reduction in hydraulic conduc-tivity on the basis of the proportion of unstained cells(using Safranin dye) with the actual reduction in hydraulicconductivity measured using the Sperry method above.
The above three techniques are all destructive, pre-venting repeated measurements on the same individual.Non-destructive techniques exist, many of which arebased on the attenuation of a beam of radiation, whichis attenuated strongly by water and cell walls, and onlyweakly by air. For example, a collimated beam of gammarays from an Am241 source was passed through a plantstem, and the degree of attenuation could be related tothe accumulated number of acoustic emissions (Dixonet al., 1984). Large trees require a more energetic radiationsource, and X-rays have also been used (Habermehl,1982). This basic technique lends itself to imaging tech-niques developed for use in biomedical applications.Recently, a computer tomograph has been developed(Raschi et al, 1995) which is able sensitively to mapareas of embolism within the stem. NMR can also be
used to measure the resonance and relaxation of protonsin water molecules and an image produced which indicatesthe areas within the stem where water lies (Ratkovic andBack, 1993).
The above non-destructive techniques are very special-ized and require a large investment in equipment. Theacoustic emissions technique, as with these techniques, isalso non-destructive, and also requires careful interpreta-tion if accurate measures of embolism and estimates ofhydraulic conductivity are to be found.
Interpretation of acoustic emission data toestimate hydraulic conductivity
The following points need to be considered before anyestimate of the consequences of the number of acousticemission events can be drawn.
The listening distance
It is necessary to know how far from the sensor acousticemissions can be detected and, therefore, the volume ofwood which is being sampled. Ultrasound is not propag-ated far and events occurring up to a maximum ofbetween 20 and 30 mm are usual, depending on thespecies and the environment from which the individualcame (Tyree and Sperry, 1989ft). The state of hydration,the density of the wood and the orientation of the woodfibres affects the distance the sound is propagated. If thestate of hydration changes significantly during the mon-itoring period recalibration should be undertaken. Thewater content of wood varies throughout the season(Gibbs, 1958; Jackson et al., 1995a) often with valueslower in summer and higher in winter. Higher watercontents attenuate the AEs more effectively and thedifferences in cavitation rates between the seasons could,therefore, be artificially exacerbated. One method todetermine the listening distance is to sample sections offully hydrated stems of various lengths, and to determinethe relationship between length and total acoustic emis-sions during dehydration (Sandford and Grace, 1985).As the sample size increases a greater number of eventsare recorded, but above a certain size no more events arefound, and it is this length which can be assumed to bethe extent of the listening distance of the sensor.
The number of conducting cells within that listeningdistance
Wood of different species and from different environmentshave vessels and tracheids of different sizes and, therefore,within the same listening distance there can be vastlydifferent numbers of cells. If a million cells can potentiallybe detected a thousand events may be unimportant,however in less dense wood a thousand events couldresult in a serious reduction in hydraulic conductivity.
Field measurements of xylem cavitation 1647
For conifers (which have no vessels) the number of cellscan be found by macerating a known volume of tissue inboiling acid and carrying out cell counts (Sobrado et al,1992). It is a little more difficult to count the numberof cells in vessel-bearing species (angiosperms), butfrom knowledge of the vessel length distribution(Zimmermann, 1983) and cell diameters estimates canbe made.
Proportion of non-conducting cells
As well as conducting vessels and tracheids the xylemalso contains non-conducting fibre tracheids and livingparenchyma cells. Fibre tracheids may cavitate at similarfrequencies as the conducting cells, and if there is a highproportion of fibres there will appear to be an artificiallyhigh reduction in hydraulic conductivity. The proportionof fibres can be estimated in the macerate used to estimatethe total number of cells within the listening distance.
The lumen volume, since larger cells conduct more water
The Hagen-Poiseuille equation demonstrates that theconducting ability of a water-conducting pipe with lam-inar flow increases with the 4th power of its radius, sothat a small increase in internal cell diameter leads to alarge increase in water conduction. Cavitation of a largecell is, therefore, hydraulically more significant than thatof a small cell. The proportion of cells of different radiusagain can be estimated from the cell macerate.
Whether one acoustic emission corresponds to one conduitcavitating
There is a possibility of overlapping cavitation events.Two or more events may occur simultaneously, or almostsimultaneously, and may only be recorded as one event.Alternatively, some emissions may not be recordedbecause a so-called 'dead time' is built into the electronicswhich prevents a second event being recorded very shortlyafter a first one. This is because the signal from an AEsensor, in response to a single event, is actually a seriesof oscillations, but only one cavitation event must berecorded per acoustic emission. The dead time preventsgreater than one oscillation of the same cavitation eventbeing counted. A related problem is that some AEs mayoccur outside the frequency range detected. It is difficultto estimate the extent of these events since it is stillunclear exactly where and how the sound originateswithin the plant. Whether one acoustic emission corre-sponds to one conduit cavitating can be calibrated byestimating the number of conducting cells within a fullyhydrated sample of wood (within the listening distanceof the sensor) and recording the number of events pro-duced as it completely dehydrates (Sandford and Grace,1985).
The gain of the signal can be altered by the user frombetween 20 to 80 dB, with higher gains producing a largernumber of acoustic emissions. However, with a high gainmore background noise is detected and so to determinethe highest possible gain, consistent with maximizing thenumber of recorded events, but minimizing the back-ground noise, preliminary trials are needed. The sensormay be attached to a non-cavitating object, such as adowel, or left hanging freely in air. Any recorded eventsare therefore background noise. The amplification gaincan be set so that, for example, less than one spuriousevent per minute is produced. In the field situation 74 dBis often found to fulfil this requirement (Jackson el al.,19956), but in growth rooms where there is other elec-tronic equipment the gain may be as low as 70 dB. Thegain setting should be noted during sensor listeningdistance trials since the higher the gain the larger theeffective listening distance of the sensor. Since decibelsare on a logarithmic scale a difference of one decibel canproduce values of a different order of magnitude.
A further problem in interpreting acoustic emission datain terms of a reduction in hydraulic conductivity is thatunder certain circumstances conduits can refill as well ascavitate, and the extent of refilling can not be easilyquantified. For example, a conduit which cavitated byday, could refill at night and subsequently cavitate thefollowing day. Different conduits have different 'vulnerab-ilities' and the same conduit could cavitate and refill manytimes. Finally, in order to interpret the acoustic emissionsproduced by plants, recordings must be undertaken forextended times since day-to-day meteorological variationcan greatly affect the number of cavitation events.
Uses of acoustic emission data
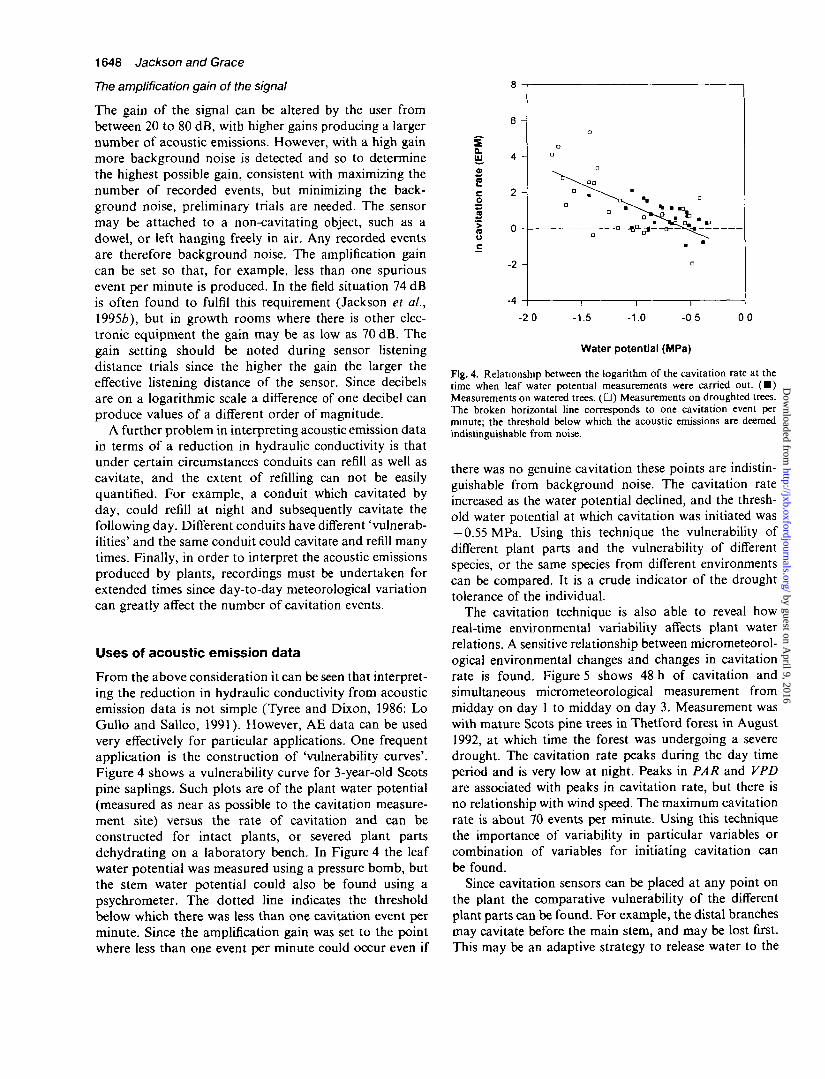
From the above consideration it can be seen that interpret-ing the reduction in hydraulic conductivity from acousticemission data is not simple (Tyree and Dixon, 1986: LoGullo and Salleo, 1991). However, AE data can be usedvery effectively for particular applications. One frequentapplication is the construction of 'vulnerability curves'.Figure 4 shows a vulnerability curve for 3-year-old Scotspine saplings. Such plots are of the plant water potential(measured as near as possible to the cavitation measure-ment site) versus the rate of cavitation and can beconstructed for intact plants, or severed plant partsdehydrating on a laboratory bench. In Figure 4 the leafwater potential was measured using a pressure bomb, butthe stem water potential could also be found using apsychrometer. The dotted line indicates the thresholdbelow which there was less than one cavitation event perminute. Since the amplification gain was set to the pointwhere less than one event per minute could occur even if
sQ.
aE
-2 0 -1.5 -1.0 -0 5
Water potential (MPa)
Fig. 4. Relationship between the logarithm of the cavitation rate at thetime when leaf water potential measurements were carried out. ( • )Measurements on watered trees. ( • ) Measurements on draughted trees.The broken horizontal line corresponds to one cavitation event perminute; the threshold below which the acoustic emissions are deemedindistinguishable from noise.
there was no genuine cavitation these points are indistin-guishable from background noise. The cavitation rateincreased as the water potential declined, and the thresh-old water potential at which cavitation was initiated was— 0.55 MPa. Using this technique the vulnerability ofdifferent plant parts and the vulnerability of differentspecies, or the same species from different environmentscan be compared. It is a crude indicator of the droughttolerance of the individual.
The cavitation technique is also able to reveal howreal-time environmental variability affects plant waterrelations. A sensitive relationship between micrometeorol-ogical environmental changes and changes in cavitationrate is found. Figure 5 shows 48 h of cavitation andsimultaneous micrometeorological measurement frommidday on day 1 to midday on day 3. Measurement waswith mature Scots pine trees in Thetford forest in August1992, at which time the forest was undergoing a severedrought. The cavitation rate peaks during the day timeperiod and is very low at night. Peaks in PAR and VPDare associated with peaks in cavitation rate, but there isno relationship with wind speed. The maximum cavitationrate is about 70 events per minute. Using this techniquethe importance of variability in particular variables orcombination of variables for initiating cavitation canbe found.
Since cavitation sensors can be placed at any point onthe plant the comparative vulnerability of the differentplant parts can be found. For example, the distal branchesmay cavitate before the main stem, and may be lost first.This may be an adaptive strategy to release water to the
Fig. 5. The relationship between cavitation rate and meteorologi-cal variables of mature Scots pine trees in Thetford forest,(a) Photosynthetically active radiation, (b) vapour pressure deficit,(c) wind speed, and (d) cavitation rate per minute.
main stem, or due simply to the lower water potential ofparts closer to the transpiring surfaces.
Acoustic emissions have also been used practically inhorticultural systems, and there is great potential forthese applications. In California AEs were used to controlirrigation systems for grape vines. When the cavitationrate reached a predetermined threshold rate irrigationwas initiated, but this was not at the first sign of cavita-tion, since it was found that the wine had an improvedflavour if the vines experienced some degree of waterstress. A second system was employed in Japan where aparticular cavitation rate initiated sun screens to reduceevapotranspiration and, in turn, prevent an increase inwater stress.
ReferencesBorgfaetti M, Raschi A, Grace J. 1989. Ultrasound emission
after cycles of water stress in Picea abies. Tree Physiology5, 229-37.
Field measurements ofxylem cavitation 1649
Borgbetti M, Edwards WRN, Grace J, Jarvis PJ, Raschi A.1991. The refilling of embolized xylem in Pinus sylvestris L.Plant, Cell and Environment 14, 357-69.
Dixon HH, Joly J. 1895. On the ascent of sap. Royal Society(London) Philosophical Transactions, Series B 186, 563-76.
Dixon MA, Grace J, Tyree MT. 1984. Concurrent measurementsof stem density, leaf and stem water potential, stomatalconductance and cavitation on a sapling of Thuja occidentalsL. Plant, Cell and Environment 7, 615-18.
Gibbs RD. 1958. Patterns in the seasonal water content of trees.In: Thimann KV, ed. The physiology of forest trees. NewYork: Ronald Press, 43-69.
Greenidge KNH. 1957. Studies in the physiology of forest trees.III. The effect of drastic interuption of conducting tissues onmoisture movement. American Journal of Botany 42,482-587.
Habermehl A. 1982. A new non-destructive method fordetermining internal wood condition and decay in livingtrees. II. Results and further developments. ArboriculturalJournal 6, 121-30.
Hacke U, Sauter JJ. 1995. Vulnerability ofxylem to embolismin relation to leaf water potential and stomatal conductancein Fagus sylvaticaf. purpurea and Populus balsamifera. Journalof Experimental Botany 46, 1177-83.
Jackson GE, Irvine J, Grace J. 1995a. Xylem cavitation in twomature Scots pine forests growing in a wet and a dry area ofBritain. Plant, Cell and Environment 18, 1411-18.
Jackson GE, Irvine J, Grace J. 19956. Xylem cavitation inScots pine and Sitka spruce saplings during water stress. TreePhysiology 15, 783-90.
Lo Gollo MA, Salfco S. 1991. Three different methods formeasuring xylem cavitation and embolism: a comparison.Annals of Botany 67, 417-24.
Milburn JA. 1993. Cavitation. A review: past, present andfuture. In: Borghetti M, Raschi A, Grace J, eds. Watertransport in plants under climatic stress. Cambridge UniversityPress, 14-26.
Milburn JA, Johnson RPC. 1966. The conduction of sap. II.Detection of vibrations produced by sap cavitation in Ricinusxylem. Planta 69, 43-52.
Oertli JJ. 1993. Effect of cavitation on the status of water inplants. In: Borghetti M, Raschi A, Grace J, eds. Watertransport in plants under climatic stress. Cambridge UniversityPress, 27-40.
Raschi A, Tognetti R, Ridder H-W, Beres C. 1995. Water in thestems of sessile oak (Quercus petraea) assessed by computertomography with concurrent measurements of sap velocityand ultrasound emission. Plant, Cell and Environment 18,545-54.
Ratkovic S, Bade G. 1993. NMR and water transport in plants.In: Borghetti M, Raschi A, Grace J, eds. Water transport inplants under climatic stress. Cambridge University Press,129-39.
Ritman KT, Milburn JA. 1988. Acoustic emissions from plants:ultrasonic and audible compared. Journal of ExperimentalBotany 39, 1237-48.
Robson DJ, Petty JA. 1993. A proposed mechanism of freezingand thawing in conifer xylem. In: Borghetti M, Raschi A,Grace J, eds. Water transport in plants under climatic stress.Cambridge University Press, 75-85.
Sperry JS, Holbrook NM, Zimmennann MH, Tyree MT. 1987.Spring filling of xylem vessels in wild grapevine. PlantPhysiology 83, 831-6.
Sperry JS, Donelly JR, Tyree MT. 1988. A method formeasuring hydraulic conductivity and embolism in xylem.Plant, Cell and Environment 11, 35-40.
Tyree MT, Dixon MA. 1983. Cavitation events in Thujaoccidentals L. Ultrasonic acoustic emissions from the sap-wood can be measured. Plant Physiology 72, 1094-9.
Tyree MT, Dixon JA. 1986. Water stress induced cavitation
and embolism in some woody plants. Physiologia Plantarum66, 397-405.
Tyree MT, Sperry JS. 1988. Do woody plants operate near thepoint of catastrophic xylem dysfunction caused by dynamicwater stress—answers from a model. Plant Physiology88, 574-80.
Tyree MT, Sperry JS. 1989a. Vulnerability of xylem tocavitation and embolism. Annual Review of Plant Physiologyand Molecular Biology 40, 19-38.
Tyree MT, Sperry JS. 19896. Characterization and propagationof acoustic emission signals in woody plants: towards animproved acoustic emission counter. Plant, Cell andEnvironment 12, 371-82.
Zimmennann MH. 1979. The discovery of tylose formation bya Viennese lady in 1845. IAWA Bulletin 2-3, 51-6.
Zimmermann MH. 1983. Xylem structure and the ascent of sap.Berlin: Springer-Verlag.


![Electrochemical investigations of stable cavitation from bubbles …deymier/deymier_group/refs/cavitation... · 2014. 10. 15. · Rayleigh streaming, and Microstreaming [7]. In acoustic](https://static.documents.pub/doc/80x56/60a7b9340fce1a14d75ca4a9/electrochemical-investigations-of-stable-cavitation-from-bubbles-deymierdeymiergrouprefscavitation.jpg)


