FIELD METHODS FOR THE STUDY OF SLOPE AND FLUVIAL PROCESSES TECHNIQUES DE TERRAIN POUR L'tTUDE DES VERSANTS ET DE LA DYNAMIQUE FLUVIALE A contribution to the International Hydrological Decade Contribution a la Decennie Hydrologique Internationale PREPARED BY THE COMMISSION ON SLOPES AND THE SUBCOMMISSION ON FLUVIAL DYNAMICS OF THE COMMISSION ON APPLIED GEOMORPHOLOGY INTERNATIONAL GEOGRAPHICAL UNION OCTOBER 1967 OCTOBRE 1967 COMMISSION DES VERSANTS ET SOUS-COMMISSION DE DYNAMIQUE FLUVIALE DE LA COMMISSION DE G^OMORPHOLOGIE APPLIQUEE DE L'U. G. I.
Transcript
FIELD METHODS FOR THE STUDY OF SLOPE
AND FLUVIAL PROCESSES
TECHNIQUES DE TERRAIN POUR L'tTUDE
DES VERSANTS ET DE LA DYNAMIQUE FLUVIALE
A contribution to the
International Hydrological Decade
Contribution a la
Decennie Hydrologique Internationale
PREPARED BY THE COMMISSION ON SLOPES AND THE SUBCOMMISSION ON FLUVIAL DYNAMICS
OF THE COMMISSION ON APPLIED GEOMORPHOLOGY INTERNATIONAL GEOGRAPHICAL UNION
OCTOBER 1967 OCTOBRE 1967
COMMISSION DES VERSANTS ET SOUS-COMMISSION DE DYNAMIQUE FLUVIALE
DE LA COMMISSION DE G^OMORPHOLOGIE APPLIQUEE DE L'U. G. I.
NUMERO SPECIAL
pour le Congres de New-Dehli 1968
AVANT-PROPOS
La Commission de Geomorphologie Appli-quee a tenu, en Belgique, en juin 1966, une reunion commune avec la Commission des Versants. A cette occasion, sa Sous-Commission de Dynamique Fluviale, presidee par le Dr. L. B. LEOPOLD, de VU.S. Geological Survey, a prepare une collection de courtes notes ayant pour objet d'exposer des methodes simples d'etude sur le terrain des processus morphogenetiques.
Nous la presentons dans ce numero de la Revue de Geomorphologie Dynamique.
II s'agit d'une premiere tentative, encore bien imparfaite. Certaines notes presentent moins d'interet que d'autres, mais nous nous sommes interdit de faire un choix, contraire-ment a V attitude, habituelle que nous avons adopte a la Direction de cette Revue. En effet, tors d'une tentative preliminaire, il est bon que toutes les orientations soient representees
et que toutes les opinions puissent etre connues. La selection des meilleures ne pent s'operer qu'ensuite.
Conformement a Vun des principes qui a toujours guide la Redaction de la R.G.D., nous avons voulu, comme dans notre rubrique « Techniques de travail », mettre d la disposition du Public des methodes directement applicables. C'est pourquoi nous avons insiste aupres des Auteurs pour qu'ils fassent part de tous les details pratiques, qui conditionnent le succes de Vapplication d'une methode, mais qui, malheureusement, sont trop frequemment negliges dans les publications.
Nous souhaitons recevoir de nos Lecteurs des commentaires critiques sur ces methodes et d'autres contributions du meme genre. Nam les publierons bien volontiers.
J. TRICART.
Foreword
In Belgium during the summer of 1966 the Commission on Slopes and the Commission on Applied Geomorphology of the International Geographical Union sponsored a joint symposium, with field excursions, and meetings of the two commissions. As a result of the conference and associated discussions, the participants expressed the view that it would be a contribution to scientific work relating to the subject area if the Commission on Applied Geomorphology could prepare a small manual des-cribling the methods of field investigation being used by research scientists throughout the world in the study of various aspects of &lope development and fluvial processes. The Commission then assumed this responsibility and asked as many persons as were known to be. working on this subject to contribute whatever they wished in the way of descriptions of methods being employed.
The purpose of the present manual is to show the variety of study methods now in use, to describe from the experience gained the limitations and advantages of different techniques, and to give pertinent detail which might be useful to other investigators. Some details that would be useful to know are not included in scientific publications, but in a manual on methods the details of how best t6 use a method has a place. Various persons have learned certain things which cannot be done, as well as some methods that are successful. It is our hope that comparison of methods tried will give the reader suggestions as to how a particular method might best be applied to his own circumstance.
The manual does not purport to include methods used by all workers. In particular, it does not interfere with a more systematic treatment of the subject (1) or with various papers already published in the present journal. In fact we are sure that there are pertinent research methods that we do not know of and the Commission would be glad to receive additions and other ideas from those who find they have something to contribute.
Also, the manual describes the methods in brief form. If further details are desired we urge that individual scientists correspond with their colleagues whose contributions are included in this little volume.
The Commission thanks all contributors to this manual and hopes that their contributions have been included in a satisfactory way. The Commission also thanks Dr. Luna B. Leopold of the United States Geological Survey, who at our request assumed the task of collecting the contributions, editing them and compiling the present work.
J. TRICART,
President Commission on Applied Geomorphology.
P. MACAR,
President Commission on Slopes.
(1) TRICART (J.), 1965 : Principes et methodes de la geomorphologie, Paris, Masson, 496 p., 36 fig., 8 pi. phot'., 1 carte h.-t. coul.
GAILLEUX (A.) et TRICART (J.), 1963 : Initiation a Vetude des sables et galets, S.E.D.E.S., Paris, 3 vol., 2C 6dit.
2
Table of contents
Table des matieres
Fereword 147 By J. Tricart, Universite de Strasbourg
Table of Contents 148 Measurement of Slopes. MENSURATION DES PENTES 152
Slope Profiles. Profils des pentes.
Field Surveys. Mesures sur le terrain.
Contribution by Anders Rapp, Uppsala, Sweden. 152 Contribution by P. de Bdthune, Louvain, Belgium. 152 Contribution by R.A.G. Savigear, Sheffield, U.K .. 153
Soil Investigations. Etude des sols.
Contribution by Otto Franzle, Bonn, Germany .. 154 Slope values from Aerial Photographs. Valeurs et pentes d'apres les photographies aeriennes.
Contribution by H. Th. Verstappen, Delft 156
A Library of Slope Characteristics. DES ARCHIVES DES DONNEES CARACTERISTI-
QUES. Contribution by Luna B. Leopold, Washington .. 156
Slope Processes, Rates and Amounts. PROCESSUS DE VERSANTS : VITESSES ET BILANS.
Pits, with emplaced rods or plates. Fosses avec jalons ou plaquettes.
Contribution by W. W. Emmett and L. B. Leopold, Washington, D.C 157
Colored sand, marbles, rods, and holes. Sables colores, billes, jalons dons des trous.
Contribution by R. D. Hadley, Denver, Colo. . . . . . 158 Contribution by Jan Rybar, Prague 159
Painted or Marked Rocks. Pierres peintes ou marquees.
Contribution by S. A. Schumm, Denver 160 Contribution by P. Asher Schick, Jerusalem 160 Contribution by L. B. Leopold, W. W. Emmett,
R. M. Myrick, Washington, D.C 160 Contribution by Sten Rudberg, Goteborg, Sweden. 161
Stakes and other Markers; Measurement of Erosion. Mires et autres reperes.
Contribution by S. A. Schumm, Denver 161 Contribution by Anders Rapp, Uppsala, Sweden. 162 Contribution by Josepf Pelisek, Brno, Czechosla-
vakia 163 Contribution by Sten Rudberg, Goteborg, Sweden. 164
Contribution by R. Evans, Sheffield, U.K Contribution by N. J. King and R. F. Hadley,
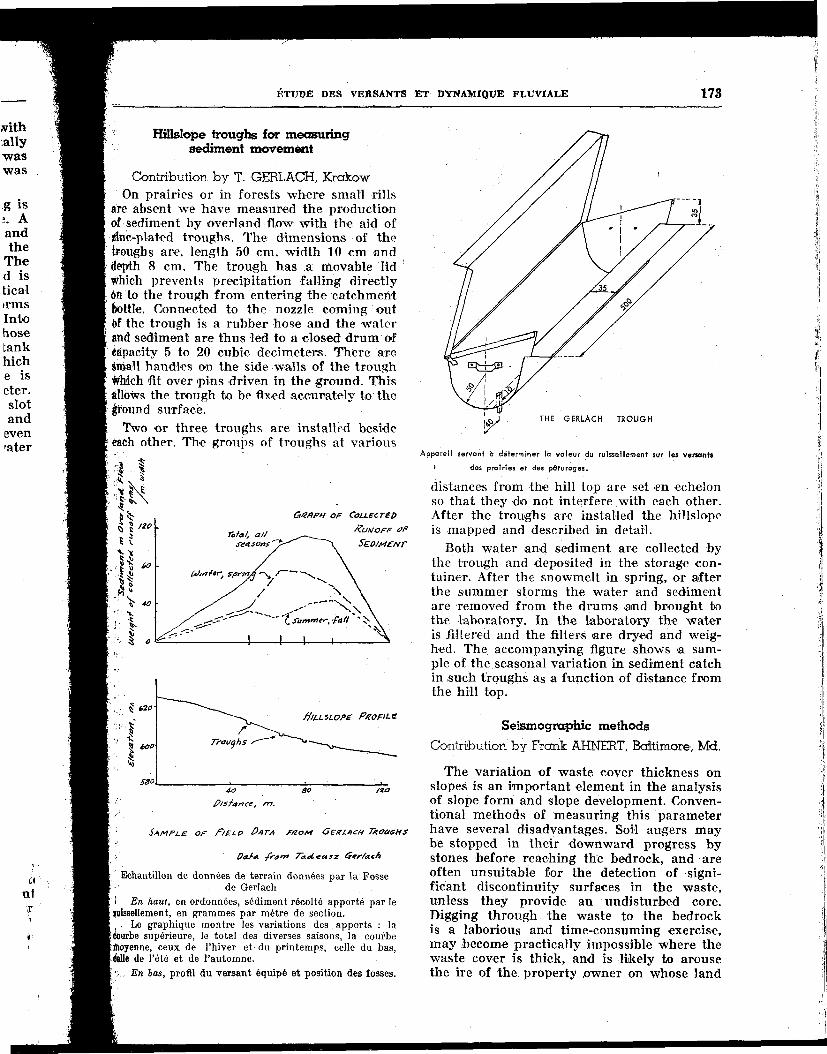
Denver Contribution by T. Gerlach, Krakow
Vegetation. Vegetation.
Contribution by S. A. Schumm, Denver Contribution by S. Rudberg, Goteborg, Sweden .. Contribution by R. Curry, Berkeley, California ..
Movement of Individuals Blocks. Mouvements des blocs individuels.
Contribution by J. Pasek and B. Kostak, Prague. Contribution by Sten Rudberg, Goteborg, Sweden.
Contribution by P. Asher Schick, Jerusalem Contribution by L. B. Leopold and W. W. Emmett,
Washington, D.C Contribution by T. Gerlach, Krakow
Seismographic Methods. METHODES SEISMOGRAPHIQUES.
Contribution by Frank Ahnert, Baltimore, Md. ..
Photography and Stereophotography. PHOTOGRAPHIE ET STEREOPHOTOGRAPHIE.
Contribution by R. Curry, Berkeley, California .. Contribution by R. Curry, Berkeley, California .. Contribution by Otokar Stehlik, Brno, Czecho
slovakia
Inclinometers or T-Bars. INCLINOMETRES ET BARRES EN T.
Contribution by R. Evans, Sheffield, U.K Shift of Rock Fragments. MOUVEMENTS DE FRAGMENTS ROCHEUX.
Contribution by J. Demek, Brno, Czechoslovakia. Contribution by Sten Rudberg, Goteborg, Sweden.
Channel Processes. FACONNEMENT DES LITS FLUVIAUX.
Mapping of River Bank Conditions. Contribution by Walter Tille, Leipzig
Hydraulic Measurements. Mesures hydrauliques.
Crest Stage. Niveau maximum de crue.
Contribution by J. G. Cumming, Sheffield, UJL ..
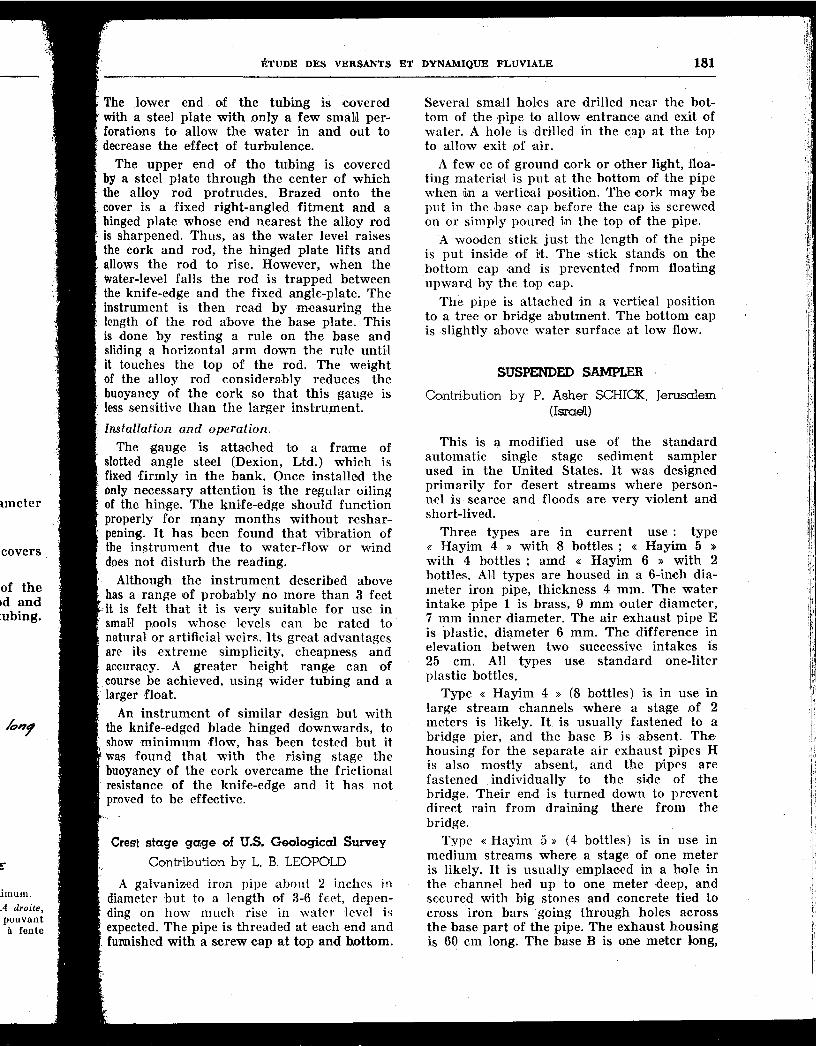
i Contribution by Luna B. Leopold, Washington .. 181 • Suspended Sediment Sampler. i Echantillonage des suspensions.
Contribution by P. Asher Schick, Jerusalem 181 Bedload Trap.
ITrappe pour la charge de fond. I Contribution by P. Asher Schick, Jerusalem 182 I Fluorescent Sand. Sables fluorescents.
t Contribution by P. Asher Schick, Jerusalem 183
ERSES. Measurement of rainfall and associated erosion on f plots. liesures des averses assoctees a l'erosion dans les I parcelles experimentales. t Contribution by Dietrich Werner, Leipzig 183 Rainfall Simulator, pmulateur d'averses.
Contribution by Rorke Bryan, Sheffield, U.K 185
Other Investigations. AUTRES RECHERCHES.
Slides and Mudflows. Glissements et coulees boueuses.
Contribution by Th. Pippan, Salzburg, Austria 185 Contribution by Pasek and Rybar, Prague,
Czechoslovakia 186 Slope Movements and Recent Uplift. Mouvements de versants et soulevement recent.
Contribution by Th. Pippan, Salzburg, Austria 187 Climate control of Mass Movements. Influence cUmatique sur les mouvements de masse.
Contribution by Th. Pippan, Salzburg, Austria 187 Slope Development in Cirque and trough valleys. Developpement des pentes dans les Cirques et vallees.
Contribution by Th. Pippan, Salzburg, Austria 187
Resumes francais
A. RAPP : Methodes de terrain pour les leves de pentes. Mesures au moyen d'un inclinometre tres simple,
neeessitant deux observateurs. Applicables a des denivelees de 50-300 m, avec pente infdrieure a 35°.
P. de BETHUNE : A propos du leve des pentes sur le terrain.
Mesures au niveau Abney, praticables par un observateur seulement. Mise au net sous la forme de profils au 1/1 000".
R. SAVIGEAR : Sur le leve des profils de versants. Considerations generates sur l'interet des leves de
profils de versants. Necessite de decomposer la pente en segments a partir des discontinuites. Necessite d'ajuster la precision du leve de terrain a l'echelle de la carte qu'on en tirera: rien ne sert de mesurer des unites trop petites pour etre figurees.
O. FRANZLE : Sur l'utilisation de profils pour observer les horizons des sols.
Implantation de fosses le long de profils, complet e s par des sondages en etoile permettant d'etudier un cercle de 200 m de rayon. Analyse classique des echantillons. Correlation graphique de la granulo-metrie des horizons et de la profondeur.
H. VERSTAPPEN: Utilisation des photographies ste-rebscopiques pour le calcul des valeurs de pentes.
La methode Zorn donne des resultats precis jus-qu'a 25-30°. La methode Nekel aboutit a des erreurs inferieures a 2° pour les 2/3 des mesures quand les pentes sont inferieures a 40°. On peut les appliquer, en recourant aux lois de Horton, pour la mesure des pentes des talwegs.
L. B. LEOPOLD : Des archives des caractenstiques des pentes.
Definition des normes permettant de caracteriser une pente. II serait souhaitable que ce catalogue s'enrichisse d'observations normalisees portant sur des pays divers.
W. EMMETT et L. B. LEOPOLD : Observation des mouvements du sol dans des fosses.
Excavation d'une fosse pour placer des mires coupees en petits segments. Apres rebouchage, au bout d'un certain temps, on excave de nouveau pour observer les deplacements. La methode est amelioree en utilisant des plaquettes d'aluminium de 5 cm de large et 35 cm de long, verticales, fixees par un ruban adhesif lors de la mise en place et liberees ensuite par la destruction de ce ruban par la pourriture. Mesures au theodolite lors de la reexcavation.
R. HADLEY: Utilisation de trous remplis de sable colored
Utilisation d'un carotteur en acier de 12,5 mm de diametre environ, 0.9 m de long et d'une baguette de 1,2 m en acier. On introduit les billes ou les particules de la meme taille que le materiel naturel au moyen du carotteur qui est ensuite retired On observe les deplacements en creusant des trous.
J. RYBAR: Mesure des mouvements par observation des deformations d'un trou.
Implantation de tubes en matiere plastique dans un glissement. L'observation de leurs deformations est continue. Des segments superposes de 0,5 de
long sont relies par un fil metallique qui sert a mesurer les deformations (aucune precision sur -1st methode, J. T.).
S. SCHUMM: Deplacement de reperes superficieJs. De divers types de materiaux, ce sont les cailloax
de 50 mm de diametre et 5-10 mm d'epaisseur qui constituent les meilleurs reperes. Marquage par une tache de peinture d'aluminium. II faut cependant faire attention a 1'influence possible des oscillations thermiques. Necessite de faire tres attention aux modifications de la pente provoquees par le passage de l'observateur lui-meme (et des autres personnes si la parcelle n'est pas rigoureusement interdite! J. T.).
P. SCHICK: Marquage a la peinture de tous les blocs sur une petite surface-echantillon.
Dans le lit d'un oued, toute une surface nettement delimitee est soumise a une vaporisation de peinture. Prise de photographies-reperes avant et apres une crue pour d&luire les departs de materiaux. Reperage des particules peintes deplacees en aval. L'avantage est de ne pas deranger le materiel (mais la rugosit6 et la cohesion des sables sont modi-flees, J. T.).
L. B. LEOPOLD, W. EMMETT, R. MYRICK : Diverses manieres de peindre des blocs.
Utilisation de peinture a base de ciment, plus resistante que celle a base d'huile. Choix des blocs dont la dimension est un peu inferieure a la dimension maxima moyenne. Les blocs sont places a des distances constantes les uns des autres, le long du talweg, de l'amont vers 1'aval. Chaque ligne transversale de pierres peintes porte un numero correspondant a la distance depuis l'origine.
S. RUDBERG: Utilisation de pierres peintes disposers le long de courbes de niveau.
De preference, on peint des pierres en place, disposers suivant des lignes droites correspondant a des courbes de niveau. La peinture se fait au moyen d'un fil a plomb et d'une ficelle tendue entre deux piquets. Le plus difficile est de trouver des reperes parfaitement immobiles pour mesurer les deplacements. De la peinture a l*huile a resiste jusqu'a 10 ans dans les toundras suedoises. Les billes, par contre, sont detruites par memorisation.
S. SCHUMM: Piquets pour la mesure de l'erosion. La longueur des piquets, leur diametre et leur
rigidity doivent etre adaptes aux conditions locales (profondeur de la reptation, resistance du substratum). La mesure de la longueur de la partie aerienne du piquet n'a. pas grande signification, aussi doit-on la remplacer par celle de la position d'une plaque coulissant dans le piquet, qui donne la surface moyenne du terrain sur une certaine aire. (Les travaux de G. ROUGERIE semblent ignores. L'usage de la plaque ne semble guere convaincant, a cause des irregularites du sol, aussi accidentelles a quelques centimetres du piquet qu'a son contact meme, J. T.)
A. RAPP: Mesure des mouvements de solifluxion. Combinaison de pierres peintes, de jalons en bois
enfonces de 40-50 cm et de mires enfoncees de 15-20 cm, le tout dispose en lignes. Pour les pierres,
ETUDE DES VERSANTS ET DYNAMIQUE FLUVIALE 151
on trace des lignes le long de fils tendus a partir de points fixes avec controle de l'alignement au theodolite.
J. PELISEK : Mouvements du sol sur les pentes mon-tagnardes dus aux activites humaines, et leur mesure.
Etude des mouvements de terre provoques par 1'exploitation forestiere. Utilisation de mires de 2 m enterrees a demi.
S.RUDBERG : Utilisation d'empilements-reperes. On creuse un trou au moyen d'une tige et on y
place un tube d'acier dans lequel on fait descendre des cylindres de 2 cm de diametre et de 2 cm de long, empiles les uns sur les autres et peints de couleurs vives. Les deviations de la verticale du tube d'acier sont prealablement mesurees au moyen d'un fil a plomb. On repere les mouvements, en general apres 3 ans, par excavation.
S. SCHUMM : La vegetation comme indice. Observation du recourbement de la base des
troncs. S. RUDBERG: La vegetation comme indice.
Base des troncs recourbee et enfouie dans un eboulis. Utilisation de la dendrochronologie pour calculer les vitesses.
R. CURRY: Utilisation de la vegetation pour dater les unites geomorphologiques.
Utilisation des anneaux annuels de croissance des arbres et buissons pour dater des phenomenes ayant denude le sol ou des accumulations, et des lichens. Certaines especes exigent une cinquantaine d'anndes pour coloniser la roche nue et meurent dans les trois ans sous un bloc retourne. Valeurs regionales de la vitesse de croissance.
J. PASEK et B. KOSTAK: Sur le deplacement indivi-duel des blocs.
Blocs de roches dures sur materiel meuble ou friable. Mouvements tres faibles. Utilisation d'un extensometre robuste, mecanique.
S. RUDBERG : Fossilisation d'une couche identifiee par un materiel posterieur.
lie de Gotland, Suede. Fossilisation des galets de la plage par des eboulements de falaises. Mesures volumetriques successives.
P. SCHICK : Construction de fosses. Fosses avec deux caniveaux, un dans le fond, inter-ceptant l'ecoulement hypodermique, un en surface, l'ecoulement superficiel. (Methode anterieurement decrite et utilisee par G. ROUGERIE et derivee des parcelles experimentales des stations agronomi-ques, J. T.)
L. B. LEOPOLD et W. EMMETT : Plans d'une fosse de Gerlach.
Details techniques pour 1'installation du caniveau et du tuyau pour recueillir 1'eau de ruissellement.
F. AHNERT : Methodes seismographiques. Utilisation du micro-sismographe Terra-Scout
R-150.- N'est valable que si la compacite des couches superficielles s'accfoit en profondeur. Ainsi, ne peut servir lorsque le sol superficiel est gele. Rend des services pour reperer 1'allure du substratum rocheux coherent sous une formation meuble. T.es resultats sont mouvais quand la formation meuble contient des blocs nombreux disposes au hasard. La nappe phreatique renvoie les ondes.
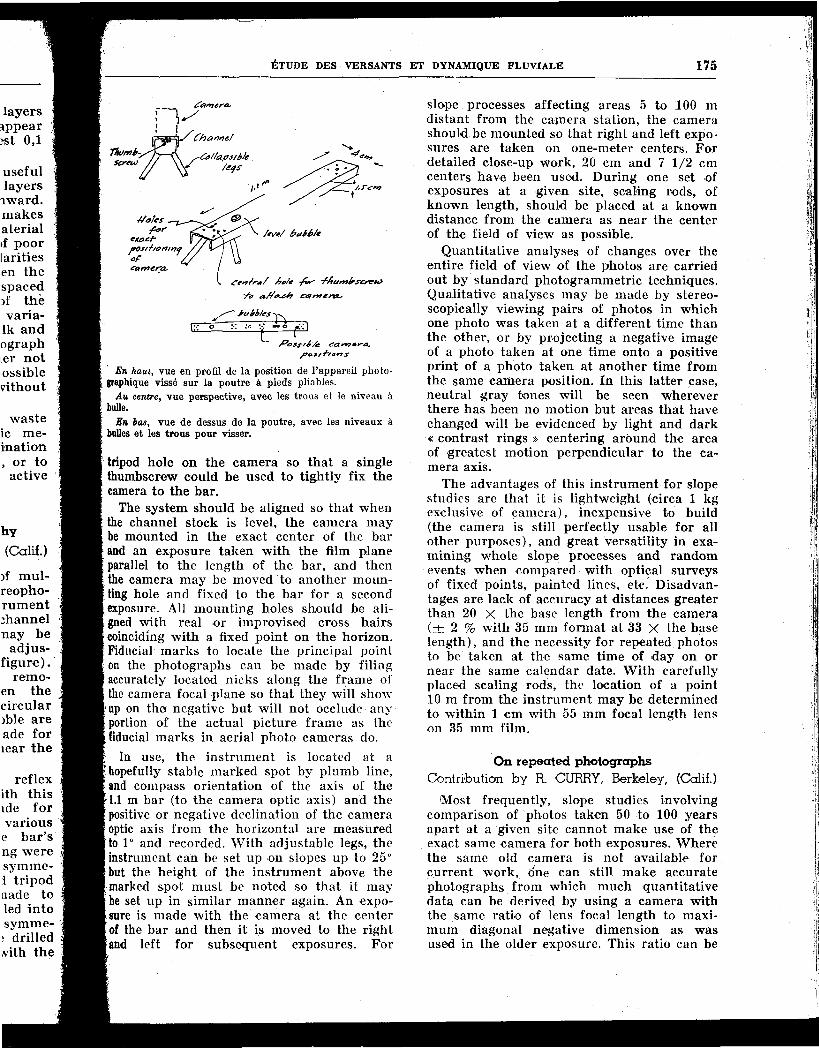
R. CURRY : Photographie et stereophotographie. Systeme de photographies-reperes repetees avec
un appareil "photographique ordinaire legerement adapte. Permet une precision de 1 cm a 10 m de
distance pour une focale de 55 mm. Sert a reperer des deplacements d'objets naturels, des migrations de reperes, des modifications de l'aspect de la surface.
R. CURRY : Photographies repetees. On peut changer d'appareil photographique a
condition que tous aient le meme rapport entre la longueur focale et la diagonale du negatif. On peut ainsi reprendre d'anciennes photographies et faire des mesures de deplacements d'objets.
O. STEHLIK: Methodes de mesure de decapage pelli-culaire et d'erosion en ravineaux.
Utilisation d'un avion modele reduit guide par radio pour prendre des photos stereoscopiques.
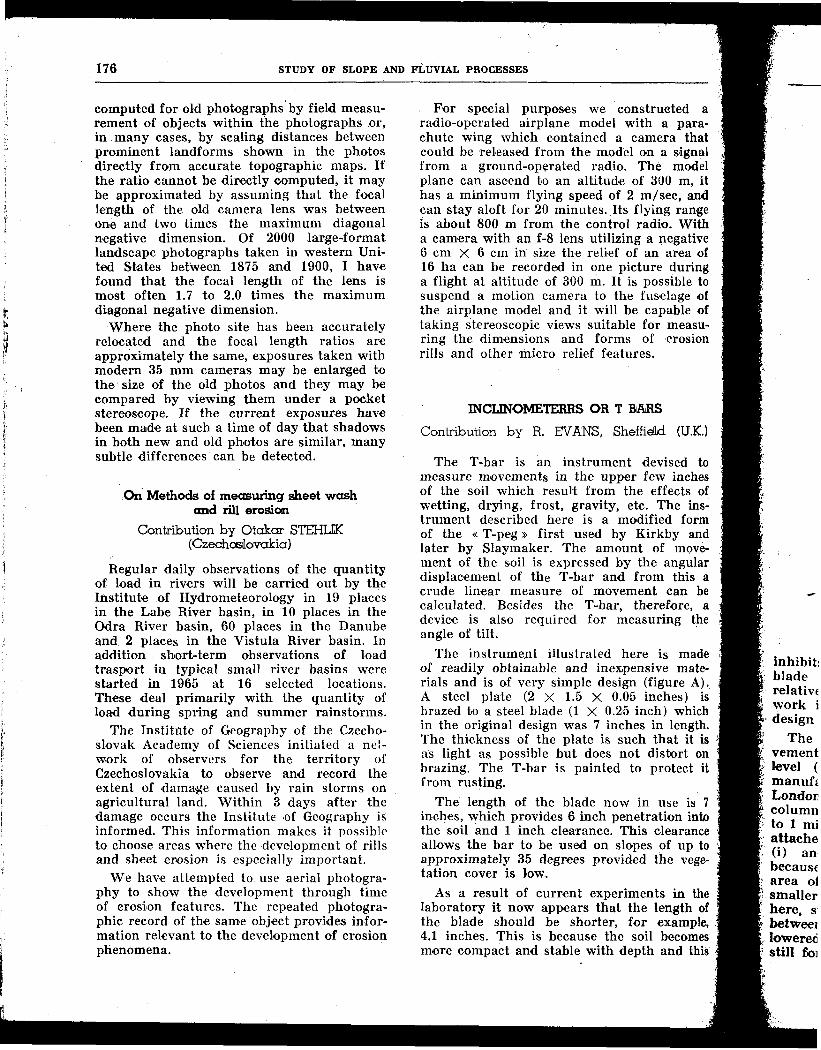
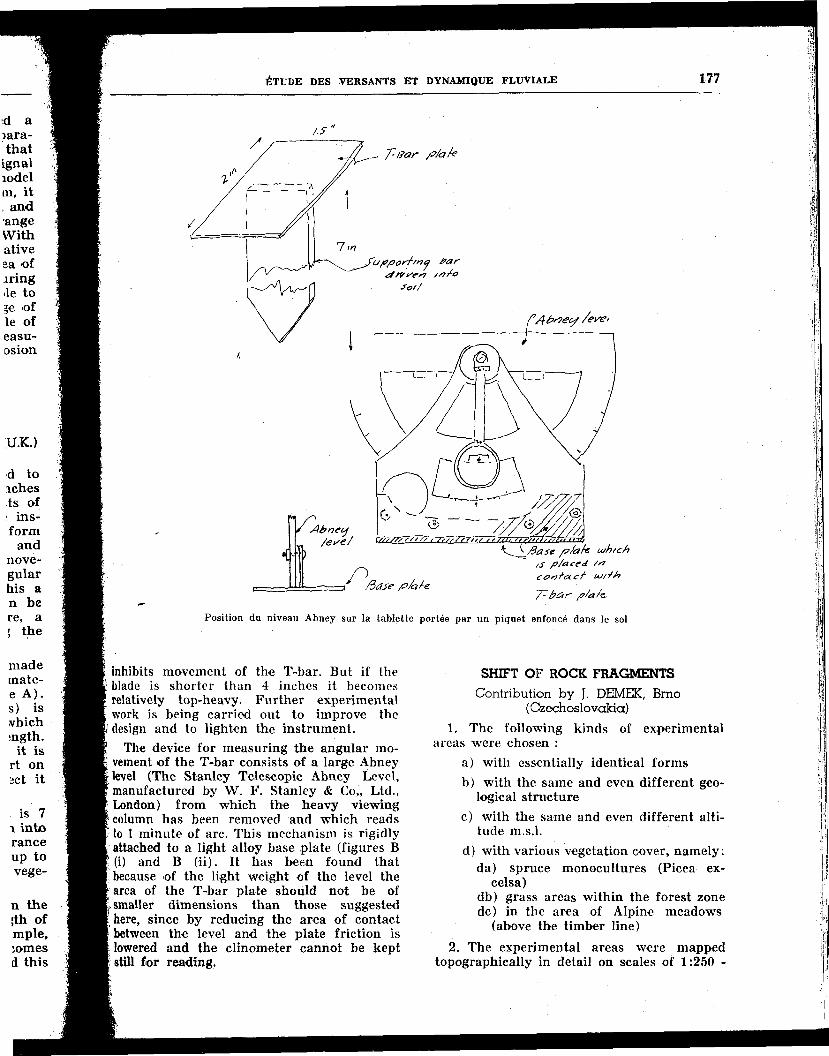
R. EVANS: Inclinometres et barres en T. Methode pour fabriquer des barres en T a bon
marche. La torsion subie par la barre permet de calculer le deplacement a l'aide d'un niveau Abney.
J. DEMEK: Deplacement de pierres. Comparaison de deplacements dans des types
divers milieux. Les deplacements sont mesures au moyen de polygones boucles suivant les methodes topographiques.
S. RUDBERG: Orientation preferentielle des pierres. Mesures a des profondeurs etagees afin de mettre
en evidence l'orientation dans le sens de la pente de la couche suoerficielle solifluee, differente de l'orientation initiale morainique sous-iacente. La couche superficielle atteint generalement 0,5 m de profondeur.
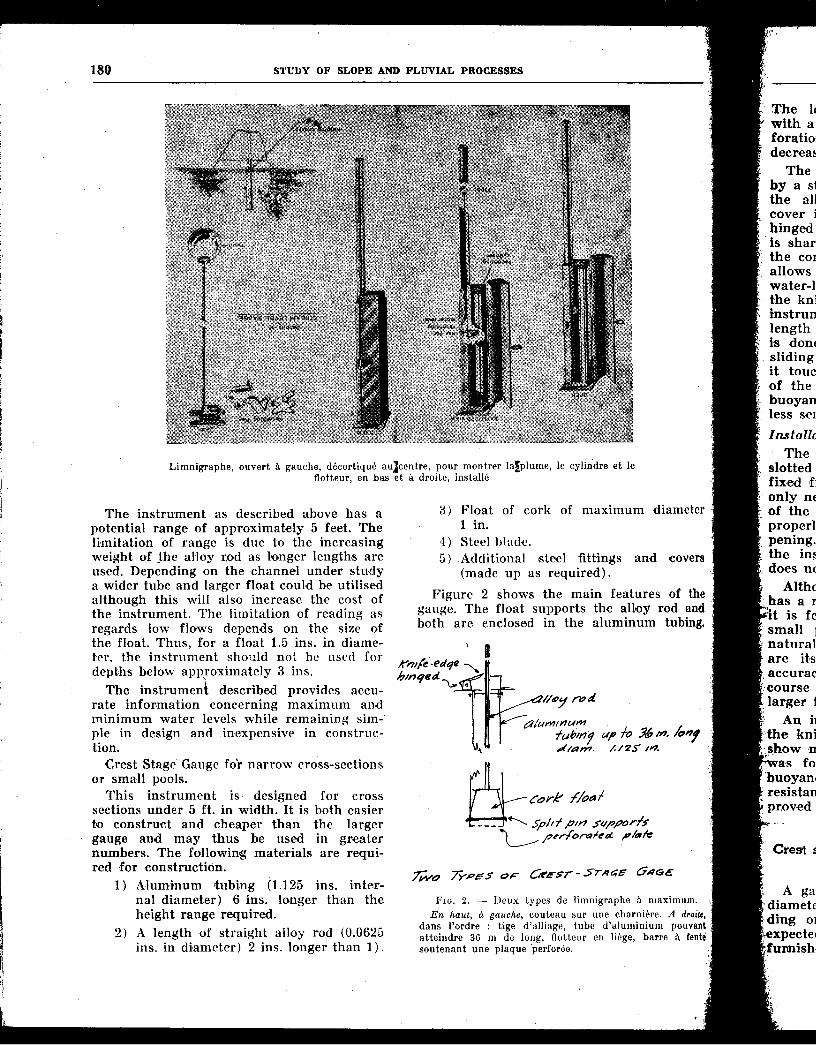
J. CUMMTNG : Limnigraphe a maximum. Mode de construction, peu onereuse, de cet appa
reil. La difference de niveau pour laquelle les mesures sont valables est d'environ 1,5 m.
P. SCHICK : Preleveur de suspensions. Modele simnlifie derive de celui en usage aux
Etats-Unis. Differentes variantes adaptees au type de regime des cours d'eau. Prix de revient allant de 20 a 40 dollars.
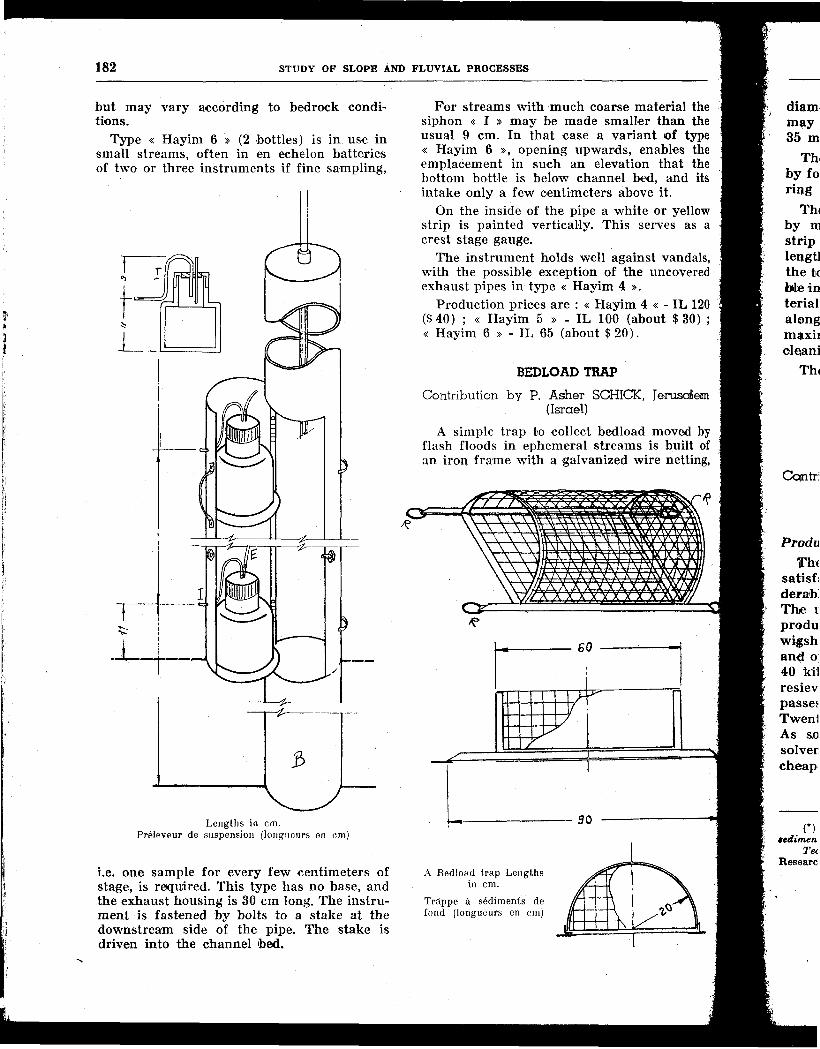
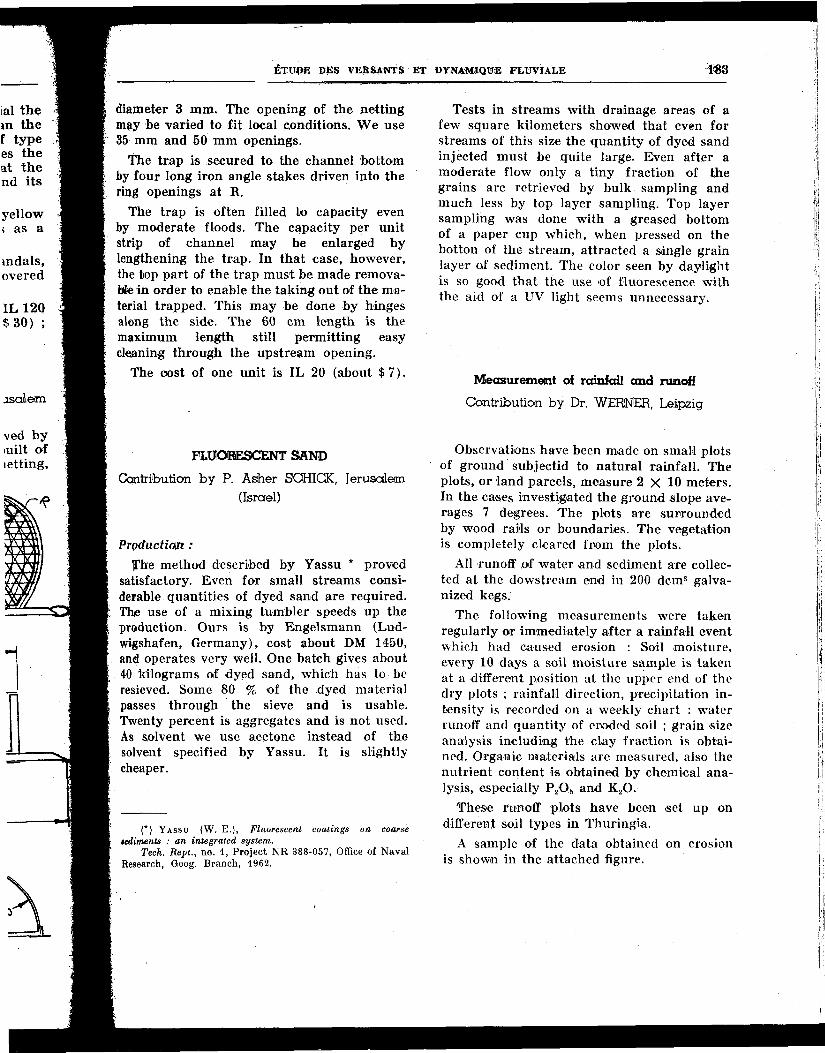
P. SCHICK: Trappe a sediments de fond.
P. SCHICK: Sables fluorescents. Utilisation sur des oueds. Description des mani-
Dulations. La luminescence est reperable sans instruments speciaux.
R. BRYAN : Simulation d'averses. Instrument utilisable au laboratoire. Mode de
construction. Traitement d'echantillons de sol au laboratoire pour determiner leur desagrdgation dans des conditions conventionnelles.
T. PIPPAN: Glissements et coulees boueuses. Releve des renseignements fournis par les archi
ves techniques des services de travaux publics et des chemins de fer, cartogranhie des donnees. Mesure des volumes mis en marche.
J. PASEK et J. RYBAR: Releves technico-geologiques de glissements de terrain en Tchecoslovaquie.
Observations normalisees avec cartographie et mise sur cartes. Observation suivie des phenomenes avec releves periodiques, mise en place de reperes, etc...
T. PIPPAN : Mouvements de versants et soulevement recent.
T. PTPPAN : Influence climatique sur les mouvements de masse.
Etude des conditions climatiques ayant precede les mouvements de masse au moyen des archives. Correlations graphiques.
3
1 5 2 STUDY OF SLOPE AND
MEASUREMENT OF SLOPES Slopes Profiles
Field Surveys On the field survey of hillslopes
Contribution - by Anders RAPP, Uppsala (Sweden)
The following requirements are expected of the method.
1) An accuracy of about ± \° of measured slope gradient.
2) The possibility of measuring a hillslope or valley-side of 50 to 300 m in height, and up to 35° gradient, in not more than 3-4 hours.
3) The measuring should not require more than two men's work in the field.
Equipment : Inclinometer, type « Meridian» (Swiss
made), a simple pendulum type. Scale in 360° degrees, from —43° to + 4 3 ° . Steel tape, 25 m or 50 m long, graded in cm. Field note book. Compass for reading bearing of the profile line.
Procedure :
The profile is generally measured upslope along a straight line following the maximum inclination of the slope. A benchmark or cairn is made at the beginning and at the end of the profile line. The two surveyors make stepwise readings, one measured length after the other, with a fixed interval in between them (generally 5 m or 10 m ) . Or the intervals can be flexible, adjusted to existing breaks in the slope.
The second man is reading the slope angle of each measured length with the Meridian pendulum. The first man is functioning as « eye-mark » in the readings. He also checks the distance of the measured length with the tape and takes the notes in three columns in his notebook. For each measured length he notes : 1) The distance from the starting point. 2) The inclination. 3) Remarks on the slope surface.
Average inclination from the beginning to the end of the profile is also measured with the Meridian pendulum.
The profile line can be reconstructed on paper by means of a protractor and can be combined with an inclination diagram (see Rapp. A., 1959, Avalanche boulder tongues in Lappland : Geiograf. Annaler, n° 1, pp. 34-48).
FLUVIAL PROCESSES
On the field survey of hillslopes
Contribution by P. de BETHUNE, Louvcdn (Belgium)
This method has been developed for measurements in the Condroz region. (P. de B6thu-ne, Le Relief du Condroz. Tijdschr. Kon. Nederl. Aardr. Gen., vol. LXXIV, 1957, pp. 220-233).
In this region of folded structure linear ridges and elongated depressions exhibit a cylindrical type of forms, in which the shape to be defined is the cross profile of the ridges. The method has been extended to non-cylindrical forms and used in various countries (P. de Bethune et J. Mammerickx, Etudes clinometriques du laboratoire geomorpholo-gique de l'Univ. de Louvain, Zeitschrift f. Geomorph., Supplband, 1960, S 93-102). It has been systematically used in the last years to furnish a backbone to areal geomorpholo-gical mapping.
Equipment : Abney hand level reading to 10 min. of arc,
•or Meridian clinimeter, reading to half a degree. Ten meter linen tape, or a string of that length. Staff with target marked at the height of the eyes of the surveyor ; the staff is held by a helper (any schoolboy will do) ; instead of a staff the helper may hold his hand at the exact height, if no helper is available the surveyor may sight at a piece of cloth dragged along the ground at the end of the decameter (and apply a correction on the measured angle, see figure) ; in this case a box of expendable Kleenex napkins may be useful to mark the station points.
Procedure : Choice of traverses. The chosen alignment
must follow the line of greatest slope and pass between obstructions. Slight deviations around an obstacle may be allowed, or else the profile may be interrupted and a new one begun a few meters left (or right) at the same elevation.
The helper proceeds forward ten meters and holds the target a t eye-level for the surveyor to sight at. He then marks the ground and proceeds another ten meters, measured by the decameter held between surveyor and him. When working without helper the surveyor sight backwards at the target pulled after him.
Length of steps — determined by the decameter at hand ; usually ten meter (29 ft
ETUDE DES VERSANTS ET DYNAMIQUE FLUVIALE 153
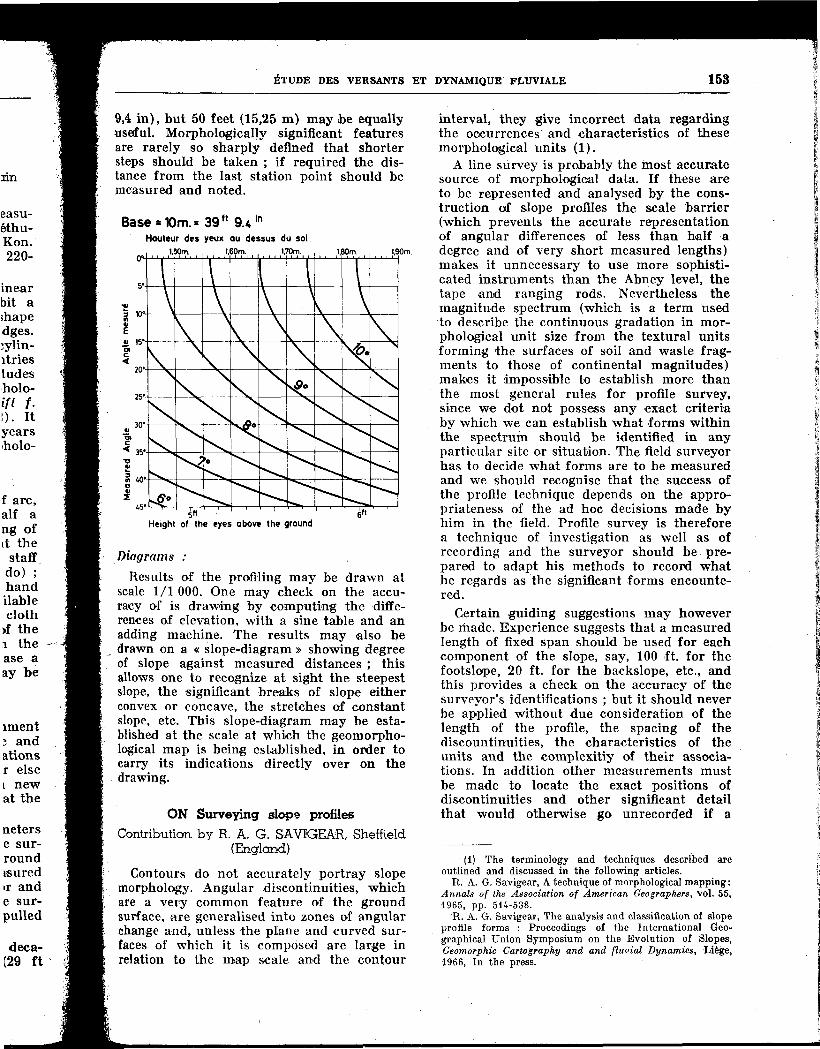
9,4 in ) , but 50 feet (15,25 m) may be equally useful. Morphologically significant features are rarely so sharply denned that shorter steps should be taken ; if required the distance from the last station point should be measured and noted.
Base = K)m.= 39 f t 9.4 in
Hauteur des yeux au dessus du sol
Height of the eyes above the ground
Diagrams :
Results of the profiling may be drawn at scale 1/1 000. One may check on the accuracy of is drawing by computing the differences of elevation, with a sine table and an adding machine. The results may also be drawn on a « slope-diagram » showing degree of slope against measured distances ; this allows one to recognize at sight the steepest slope, the significant breaks of slope either convex or concave, the stretches of constant slope, etc. This slope-diagram may be established at the scale at which the geomorpho-logical map is being established, in order to carry its indications directly over on the drawing.
ON Surveying slops profiles
Contribution by R. A. G. SAVIGEAR, Sheffield (England)
Contours do not accurately portray slope morphology. Angular discontinuities, which are a very common feature of the ground surface, are generalised into zones of angular change and, unless the plane and curved surfaces of which it is composed are large in relation to the map scale and the contour
interval, they give incorrect data regarding the occurrences and characteristics of these morphological units (1).
A line survey is probably the most accurate source of morphological data. If these are to be represented and analysed by the construction of slope profiles the scale barrier (which prevents the accurate representation of angular differences of less than half a degree and of very short measured lengths) makes it unnecessary to use more sophisticated instruments than the Abney level, the tape and ranging rods. Nevertheless the magnitude spectrum (which is a term used to describe the continuous gradation in morphological unit size from the textural units forming the surfaces of soil and waste fragments to those of continental magnitudes) makes it impossible to establish more than the most general rules for profile survey, since we dot not possess any exact criteria by which we can establish what forms within the spectrum should be identified in any particular site or situation. The field surveyor has to decide what forms are to be measured and we should recognise that the success of the profile technique depends on the appropriateness of the ad hoc decisions made by him in the field. Profile survey is therefore a technique of investigation as well as of recording and the surveyor should be prepared to adapt his methods to record what he regards as the significant forms encountered.
Certain guiding suggestions may however be made. Experience suggests that a measured length of fixed span should be used for each component of the slope, say, 100 ft. for the footslope, 20 ft. for the backslope, etc., and this provides a check on the accuracy of the surveyor's identifications ; but it should never be applied without due consideration of the length of the profile, the spacing of the discountinuities, the characteristics of the units and the complexitiy of their associations. In addition other measurements must be made to locate the exact positions of discontinuities and other significant detail that would otherwise go unrecorded if a
(1) The terminology and techniques described are outlined and discussed in the following articles.
R. A. G. Savigear, A technique of morphological mapping: Annals of the Association of American Geographers, vol. 55, 1965, pp. 514-538.
R. A. G. Savigear, The analysis and classification of slope profile forms : Proceedings of the International Geographical Union Symposium on the Evolution of Slopes, Geomorphic Cartography and and fluvial Dynamics, Liege, 1966, In the press.
154 STUDY OF SLOPE AND FLUVIAL PROCESSES
measured length of fixed span were to be used.
The major limitation of profile survey is that it provides information only for the survey line. When therefore a profile is reconstructed for analysis it stimulates more questions than answers. If, however, the morphology of the surface is mapped along the survey line (figure 1) at the same time as
the profile is measured this assists the field surveyor in making his identifications, and it has the important additional advantage that it provides information regarding the areal extent and significance of the discontinuities at the stage of analysis and interpretation. The most accurate results are achieved if three or anore parallel profiles are
surveyed simultaneously and if the morphology of the ground between them is also mapped at the same time so that the exact positions of unit and micro-unit boundaries are located.
The morphological mapping technique re-commented is based on the use of ornamented lines for the representation of the discontinuities (breaks of slope and inflexions) that
i separate the curved and plane units of the i ground surface. The minimum sizes of the e lines (1/50 in.) , line ornamentation (1/16 in.), e arrows and figures (1/8 in) and the scale of
the base map define the minimum ground horizontal equivalents of the discontinuities,
e units and micro-units that can be represen-e ted. If contour or form lines are used to
VERTICAL AND HORIZONTAL SCALES ARE THE SAME
T m w CONVEX BREAK OF SLOPE
CONCAVE BREAK OF SLOPE
FORM LINES (AT AN ESTIMATED | T R U E SLOPE DIRECTION ORDER OF DISCONTINUITY
VERTICAL INTERVAL OF 5 FEET) TRUE SLOPE DIRECTION
Les echelles verticales et horizontales sont les memes. Le trait sur le schema en plan indique le trace du profll. Signes conventionnels, dans l'ordre
Rupture de pente convexe. Rupture de pente concave. Courbes epousant les formes (Equidistance approximative de 1,5 m).
Direction de la pente reelle. — Hera, sur une unite concave. — Idem, sur une unite convexe.
Ordre de discontinuity — Premier. — Second. — Troisieme.
ETUDE DES VERSANTS ET DYNAMIQUE FLUVIALE 155
define the forms of the curved units a very precise statement of morphology can be obtained.
If a morphological map is presented without contours no information is available regarding relative or absolute height. The addition of a limited number of contours is therefore recommended. But the projection of morphological mapping symbols or contours onto the plane horizontal surface of the map gives inaccurate information regarding the shapes and areas of inclined units. These limitations may be part ly overcome by the construction of strip maps of very narrow breadth on which correct inclined distances are represented. The construction of a block diagram based on one or more surveyed profiles (figure 1) is also recommended since it provides an accurate statement of the shape and area relationships of the units if construc
ted in the manner shown (figure 1). The relations of morphology t o so j l , rock waste and rock may also be represented on the face of the block.
SOIL INVESTIGATIONS On the use of cross sections showing
soil horizons Contribution by Otto FRANZLE, Bonn
(Germany)
The separation of recent degradation and aggradation phenomena from older mass movements can be carried out by studies of soil profiles. Usually a series of borings are made or sometimes the soil profile is exposed in a road excavation or a large pit.
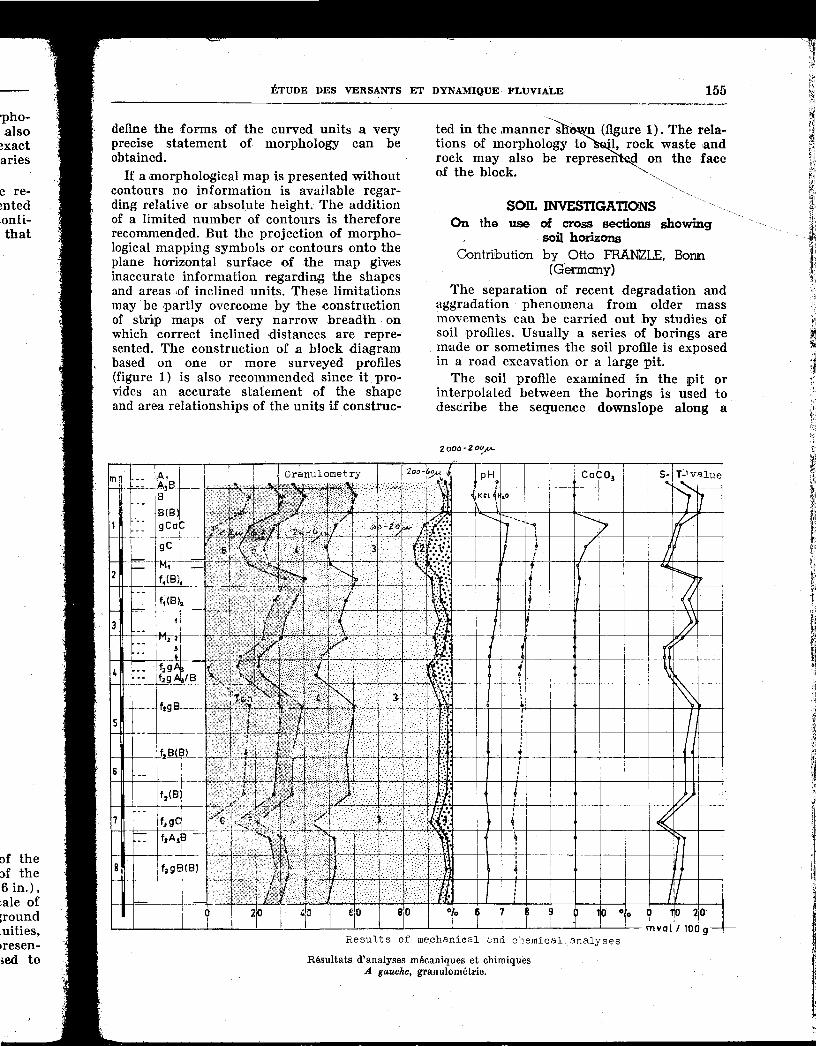
The soil profile examined in the pit or interpolated between the borings is used to describe the sequence downslope along a
2 ooa - 2 OO/A.
Resul t s of mechanical and chemical analyses
Rfeultats d'analyses mecaniques et chimiques A gauche, granulomfitrie.
156 STUDY OF SLOPE AND FLUVIAL PROCESSES
series of traverses emanating from a single central point in the small watershed and going in straight lines to the adjacent watershed divide. For example, from the central boring or pit three or four additional borings will be made to sample a distance of about 200 meters. ' I ) I
Not only is the soil profile described but also samples of various horizons are taken into the laboratory for analysis of grain size distribution and certain chemical characteristics. Samples from each depth are analyzed for grain size in-6 size-categories. The percentage of the soil sample represented in each category is plotted as a profile of size distribution with depth corresponding to these profiles values of pH, calcium carbonate, and cation exchange conditions (ST values).
These vertical profiles of the size distribution and of chemical factors both verify and help explain the horizons seen in the soil profile. |
SLOPE VALUES FROM AERIAL PHOTOGRAPHS
On the use of stereophotos for computing slope gradients
Contribution by H. Th. VERSTAPPEN, Delft (Netherlands)
In the International Training Center for Aerial Survey at Delft there has been developed simple and satisfactory methods for obtaining values of steepness of slope by the use of overlapping aerial photographs (Stereoscopic). There has been published a detailed description of the methods and it is possible to obtain from the International Training Center transparent templates which are needed to apply the methods described. In the publication, which is referred to below, the material on the templates is published and could be copied onto transparent material for actual use. The use of the Zorn method will give results with very small error when the slopes are less than 25 or 30 degrees.
Another method is Nekel's « Slope Comparator », consisting of a small holder which carries a template and can be used under the stereoscope. This method will provide for 2/3 of the observations an error less than 2° provided that the slope gradients are less than about 40°.
Either the Zorn or the Nekel method can also be used to estimate gentle channel slopes from aerial photographs. This is an especially difficult problem when no ground
control is available on the photographs. The method involves the relationship between the angle of bifurcation of the stream channel, the slope of the ground, and the slope of the channel — an equation presented by Horton (1945). Having measured the angle of bifurcation and determined the ground slope by the Zorn method, the slope of the channel can be computed.
REFERENCE
NEKEL J.F., SAVAGE J.F., and ZORN H.C., 1964. Slope measurements and estimates from aerial photographs : Publications of International Training Center for Aerial Survey, Delft, Netherlands, Series B, N° 26.
A LIBRARY OF SLOPE CHARACTERISTICS
A suggestion for compilation of comparable data on hillslopes in various countries and
conditions
Oontrbution by Luna B. LEOPOLD, Washington (D.C.)
Most geomorphologists have seen in the field a great many kinds of hillslopes. Yet when we think back over what we have encountered in our experience, impressions are often more vague than we would desire. It is for this reason that geomorphologists have turned to making measurements because our visual impressions and our memories are so fallible.
My colleagues and I therefore have started to collect a catalog, ,or what might be called a library, of slope characteristics. We plan to have comparable measurement data on a variety of slopes in different physiographic areas, of different relief, on different geology, and in different vegetation zones. How these data will be cataloged and indexed has not yet been determined, but it seems that the idea might have value for other geomorphologists also.
The following is a list of observations for each hillslope which will form a part of the library.
1. Longitudinal profile. With notes made in the field at equally
spaced distances downslope ; on the occurrence of bedrock ; the percentage of surface area covered with rock fragments ; the percentage of area covered with soil material, and with vegetation.
2. Cross profile. Surveyed approximately parallel to a
contour, with notes on bedrock, especially bedrock cropping out in the channels.
ETUDE DES VERSANTS ET DYNAMIQUE FLUVIALE 157
3. A description of the vegetation.
4. Drainage density on different slope segments.
5. Notes on dominant process.
6. Occurrence and nature of tors.
7. One or more photographs.
8. Data derived from the field survey and from maps.
Relief Relief ratio Horton analysis, including bifurcation
ratio and length ratio Concavity of the total slope and of slope
segments Regional data applied to survey area,
including precipitation Geology (rock type and age) ; soil type
As field data are accumulated in this catalog of slopes it will become more apparent what slopes tend to be concave, which convex, the relation of relief ratio to bedrock type, vegetation and climate, and other descriptive factors.
If scientists in various countries also accumulated field survey data on the occurrence of different kinds of hillslopes it may be profitable at some time in the future to combine these individual catalogs into a more comprehensive central repository of data on slope characteristics which could be consulted by any interested scientist.
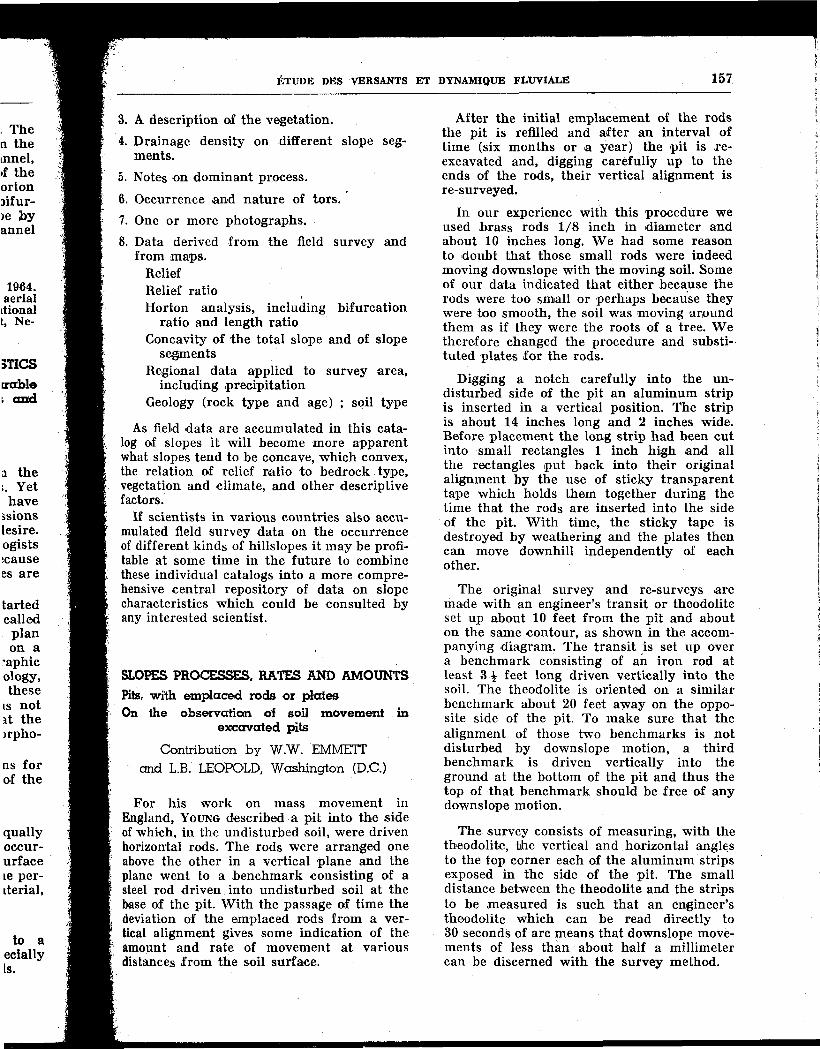
SLOPES PROCESSES. RATES AND AMOUNTS Pits, with emplaced rods or plates On the observation of soil movement in
excavated pits
Contribution by W.W. EMMETT and L.B. LEOPOLD, Washington (D.C.)
For his work on mass movement in England, YOUNG described a pit into the side of which, in the undisturbed soil, were driven horizontal rods. The rods were arranged one above the other in a vertical plane and the plane went to a benchmark consisting of a steel rod driven into undisturbed soil at the base of the pit. With the passage of time the deviation of the emplaced rods from a vertical alignment gives some indication of the amount and rate of movement at various distances from the soil surface.
After the initial emplacement of the rods the pit is refilled and after an interval of time (six months or a year) the pit is re-excavated and, digging carefully up to the ends of the rods, their vertical alignment is re-surveyed.
In our experience with this procedure we used brass rods 1/8 inch in diameter and about 10 inches long. We had some reason to doubt that those small rods were indeed moving downslope with the moving soil. Some of our data indicated that either because the rods were too small or perhaps because they were too smooth, the soil was moving around them as if they were the roots of a tree. We therefore changed the procedure and substituted plates for the rods.
Digging a notch carefully into the undisturbed side of the pit an aluminum strip is inserted in a vertical position. The strip is about 14 inches long and 2 inches wide. Before placement the long strip had been cut into small rectangles 1 inch high and all the rectangles put back into their original alignment by the use of sticky transparent tape which holds them together during the time that the rods are inserted into the side of the pit. With time, the sticky tape is destroyed by weathering and the plates then can move downhill independently of each other.
The original survey and re-surveys are made with an engineer's transit or theodolite set up about 10 feet from the pit and about on the same contour, as shown in the accompanying diagram. The transit is set up over a benchmark consisting of an iron rod at least 3 £ feet long driven vertically into the soil. The theodolite is oriented on a similar benchmark about 20 feet away on the opposite side of the pit. To make sure that the alignment of those two benchmarks is not disturbed by downslope motion, a third benchmark is driven vertically into the ground at the bottom of the pit and thus the top of that benchmark should be free of any downslope motion.
The survey consists of measuring, with the theodolite, the vertical and horizontal angles to the top corner each of the aluminum strips exposed in the side of the pit. The small distance between the theodolite and the strips to be measured is such that an engineer's theodolite which can be read directly to 30 seconds of arc means that downslope movements of less than about half a millimeter can be discerned with the survey method.
1 5 8 STUDY OF SLOPE AND FLUVIAL PROCESSES
A -
/?/lAfV V/£W
7 stake
P/a./e.S
/ran s/a.ke
/ran s/a.tr-e
o
«o»
Secr/ow A-A'
/4-w.
J5V/.A&G££> V/£yv
Shakes •/<: y tape.
P/atcs, /"2 tnches, AteftC /s7 et s/-r/p ou the. -/-ape
En haut, vue en plan du dispositif : Plates = plaquettes. Iron stake = mire en fer.
Au milieu, profil selon la section AA'.
En bas, croquis montrant les plaquettes en aluminium, avec, au milieu, le ruban adhesif qui retient les plaquettes ensemble. Chacune mesure 2,5 x 5 cm.
Pit = fosse.
COLORED SAND, MARBLES, RODS, AND HOLES
On the use of holes filled with colored grains
a t t r i b u t i o n by R.F. HADLEY, Denver (Colo.)
Measurement of soil creep or mass movement on hillslopes has been accomplished using several techniques. The method described here is a simple, inexpensive way of determining downslope soil movement with minimum alteration of the physical environment.
The equipment necessary for this technique consists of four parts :
1) Hollow steel tubing about 3 feet long, 1/2-inch O.D., and 0.035 inch wall thickness. One end of the tube is slightly bevelled as a cutting edge (Part A in figure 1).
2) A solid steel rod about 4 feet long, 3/8-inch diameter pointed at one end for penetrating the soil. (Part B in figure 1).
3) A driving head made of steel that will fit over parts A and B, the tube and rod, for driving them into the soil.
4) Glass beads or colored sand grains having approximately the same median diameter as the soil on the hillslope.
The solid steel rod (part B) is inserted into the hollow-stel tube (part A) and the two parts are driven into the ground to a depth of about 3 feet at an angle normal to the slope. The solid rod is then removed leaving the hollow tube in place. The hollow tube is then filled with glass beads or colored sand grains and the tubing is removed, leaving the column of beads in the soil. A series of holes both on contour and downslope in any grid pattern may be installed but care must be
ETUDE DES VERSANTS ET DYNAMIQUE FLUVIALE 159
6W
S-feps /
t
3
1 : With rod inserted in tube and upper end filled with driving head, tube and rod are driven into ground.
2 : With draw rod. 3 : Fill tube with colored grains 4 : With draw tube. 1 : Avec la baguette inseree dans le tube et munie, en haut,
de la tete pour le foncage, foncage en cours. 2 : Enlevement de la baguette. 3 : Remplissage du tube par des grains colores. 4 : Enlevement du tube.
taken to survey the grid and establish permanent markers so that they can be relocated easily.
0r/<?ina./ form
>S / After- dou/ns/o/pe
«.»
Le trait oblique represente la surface du sol.
A gauche, forme originelle. A droile, deformation par le mouve-
menl.
The time interval between observations is governed by the objectives of the study ; either cold season movement due to freeze and thaw or annual movement can be monitored. When the 'observation is made a hole must be carefully dug near the original installation so that a vertical profile showing the glass beads or sand grains can be exposed. If the soil is very dry at the time of excavation it is helpful to wet the ground so that the walls do not cave. The sketch of a hillslope above shows diagrammatically the
type of movement that might be expected. The straight lines represent the original column of material and the curvei lines represent the downslope movement, which in some cases resembles a vertical velocity profile in a stream.
The major disadvantage of this technique is that it is not repetitive in a single hole. Once the beads have been excavated it is not practical to use the observation site again. However, on a fairly uniform slope a series of holes on the contour will permit observations for several years on the same slope.
On movement measured by survey of a deforming hole
Contribution by Jem RYBAR, Prague
In the vicinity of the Nechranice dam site a detailed investigation of an experimental landslide on an area of 55 X 35 m is taking place. The area is built by pre-consolidated claystone of Miocene age of « fissured clay » character. The excess loading in the upper part of the slope started the slide in 1961. After detailed mapping/1:250/, longitudinal and transversal sections were measured and observations lines plotted across the slide. Individual points of these lines are measured once a month. At irregular intervals the movements are also checked photogrammetri-cally and mechanically, on the strainmeter pirnciple, with the possibility to get a continuous record on a registering device. A system of tubes lowered into bore holes or test pits was used to ascertain the real position of the sliding plane. The 0,5 m long tubes are of plastic material. A wire fixed to each tube leads through all superposed tubes to the registering device on the surface. Movements under the active sliding plane are registered by the shifting of the corresponding wire.
Movements above the sliding plane can hardly be ascertained in this way. Therefore, an inclinometrie measurement in a resistive, flexible tube, placed with one set of the above mentioned tubes, was carried out. In exposing cemented bore holes by tests pits approximate data on the changing velocity of the movements are obtained.
Climatic influences are investigated on the spot in a hydrometeorologie observatory. Hy-drogeologic observations are supplemented by pore-water pressure measurements.
During a standstill period, the investigated slide was artificially revived by an excess loading in the upper part of the slope.
4
1 6 0 STUDY OF SLOPE AND FLUVIAL PROCESSES
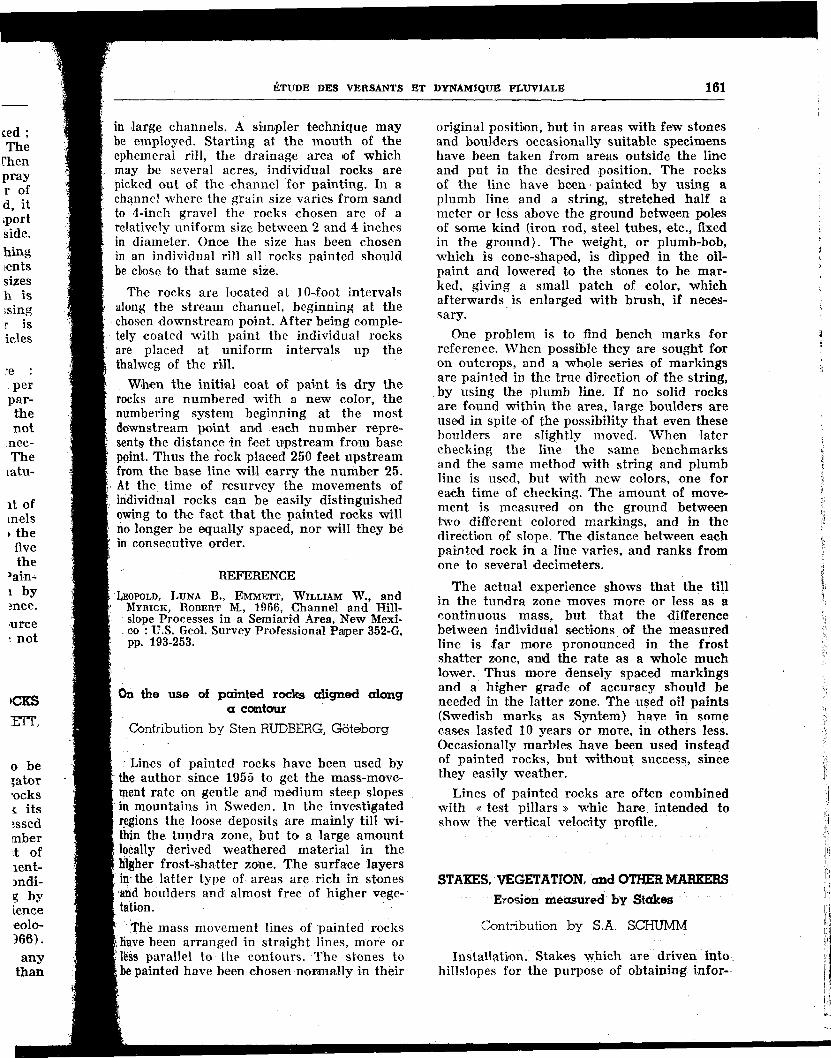
PAINTED OR MARKED ROCKS
On the movement of surface markers
Contribution by S.A. SCHUMM, Denver (Colo)
Many types of objects may be placed on hillslopes in order to obtain information concerning rates of surficial creep. In the author's experience, rocks about 50 mm in diameter and from 5 to 10 mm thick are satisfactory for this purpose. Wooden blocks are too light for this purpose, as they can be moved by raindrop impact. Small objects such as metal washers 20 cm in diameter are easily lost on the slopes, and, because they are thin, they are often buried. In general, one should not average the rates of movement of different types of markers.
The marking of rocks can be easily accomplished by the application of a spot of aluminum paint or other easily recognized marking material. However, in areas where frost action could be important, care should be taken that a liberal application of paint does not change the heat absorption characteristics of the marker and thereby influence its rate of movement.
Where frost action occurs or where rainfall is highly seasonal, it is probably necessary to make measurements at least twice during the year to establish if the rates of movement are also seasonal.
One major problem, especially on the poorly vegetated slopes of semiarid regions, is the possible disturbance of the hillslope surface by the investigator during measurement of marker movement. Under some circumstances, semiannual measurement of markers could induce movement of the soil and markers in excess of their natural annual rates. Extreme care must be taken on unstable hillslopes to prevent acceleration of movement as a result of the investigator's activity on the hillslope.
On the painting of all rocks on a small area of surface
Contribution by P. Asher SCHICK, Jerusalem
Other investigators have painted cobbles taken out of stream channels and have then replaced the rocks after the paint is dry. An alternative here suggested is that in ephemeral stream beds an entire area in the channel be painted.
A reach is selected, its boundaries marked ; it is subdivided into strips or squares. The surface is disturbed as little as possible. Then the whole surface is sprayed with spray paint. Because of the very large number of painted particles obtained by this method, it is immaterial if some are lost after transport due to the stones lying on their painted side.
The counting may be done by photographing the painted reach and making measurements of number of particles of various class sizes in the office. After transport the reach is rephotographed and the number of missing particles is determined. This number is compared with the number of particles actually found downstream.
The advantages of this method are : (1) The number of particles produced . per man-hour is very large. (2) The painted particles more resemble the actual load of the stream and therefore the results apply not only to competence but also have a connection with long term sediment supply. (3) The marked particles stay embedded in their natural milieu.
The disadvantages are : (1) The amount of paint required is large. In sandy channels much of the sprayed paint percolates into the ground. As a rule of thumb, prepare five times the amount of paint specified by the manufacturer per unit area of wall. (2) Painted reaches may attract more attention by passersby and thus invite human interference.
A spray gun with a \ portable power source may be used to cut down costs. W e have not tried it.
ON SOME VARIATIONS IN PAINTING ROCKS
Contribution by L.B. LEOPOLD, WW. EMMETT, R.M. MYRICK, Washington (D.C.)
In painting large rocks which are to be placed in a stream bed, if the investigator wishes to record the movement of the rocks individually he can paint on each rock its weight in grams. This weight, expressed in 3 to 5 digits, gives such a large number of combinations that no individual set of numbers is likely to be repeated. The cement-base paints were more durable under conditions of intense sunshine and tumbling by floods than oil-base paints. Our experience and data have been summarized in U.S. Geological Survey Professional Paper 352 G (1966).
In small upstream rills the distance any individual rock is likely to move is less than
ETUDE DES VERSANTS Et DYNAMIQUE FLUVIALE 161
in large channels. A simpler technique may be employed. Starting at the mouth of the ephemeral rill, the drainage area of which may be several acres, individual rocks are picked out of the channel for painting. In a channel where the grain size varies from sand to 4-inch gravel the rocks chosen are of a relatively uniform size between 2 and 4 inches in diameter. Once the size has been chosen in an individual rill all rocks painted should be close to that same size.
The rocks are located at 10-foot intervals along the stream channel, beginning at the chosen downstream point. After being completely coated with paint the individual rocks are placed at uniform intervals up the thalweg of the rill.
When the initial coat of paint is dry the rocks are numbered with a new color, the numbering system beginning at the most downstream point and each number represents the distance in feet upstream from base point. Thus the rock placed 250 feet upstream from the base line will carry the number 25. At the time of resurvey the movements of individual rocks can be easily distinguished owing to the fact that the painted rocks will no longer be equally spaced, nor will they be in consecutive order.
REFERENCE
LEOPOLD, LUNA B., EMMETT, WILLIAM W., and MYRICK, ROBERT M., 1966, Channel and Hill-
- slope Processes in a Semiarid Area, New Mexico : U.S. Geol. Survey Professional Paper 352-G, pp. 193-253.
On the use of painted rocks aligned along a contour
Contribution by Sten RUDBERG, Goteborg
Lines of painted rocks have been used by the author since 1955 to get the mass-movement rate on gentle and medium steep slopes in mountains in Sweden. In the investigated regions the loose deposits are mainly till within the tundra zone, but to a large amount locally derived weathered material in the higher frost-shatter zone. The surface layers in the latter type of areas are rich in stones and boulders and almost free of higher vegetation.
The mass movement lines of painted rocks ihave been arranged in straight lines, more or less parallel to the contours. The stones to be painted have been chosen normally in their
original position, but in areas with few stones and boulders occasionally suitable specimens have been taken from areas outside the line and put in the desired position. The rocks of the line have been painted by using a plumb line and a string, stretched half a meter or less above the ground between poles of some kind (iron rod, steel tubes, etc., fixed in the ground). The weight, or plumb-bob, which is cone-shaped, is dipped in the oil-paint and lowered to the stones to be marked, giving a small patch of color, which afterwards is enlarged with brush, if necessary.
One problem is to find bench marks for reference. When possible they are sought for on outcrops, and a whole series of markings are painted in the true direction of the string, by using the plumb line. If no solid rocks are found within the area, large boulders are used in spite of the possibility that even these boulders are slightly moved. When later checking the line the same benchmarks and the same method with string and plumb line is used, but with new colors, one for each time of checking. The amount of movement is measured on the ground between two different colored markings, and in the direction of slope. The distance between each painted rock in a line varies, and ranks from one to several decimeters.
The actual experience shows that the till in the tundra zone moves more or less as a continuous mass, but that the difference between individual sections of the measured line is far more pronounced in the frost shatter zone, and the rate as a whole much lower. Thus more densely spaced markings and a higher grade of accuracy should be needed in the latter zone. The used oil paints (Swedish marks as Syntem) have in some cases lasted 10 years or more, in others less. Occasionally marbles have been used instead of painted rocks, but without success, since they easily weather.
Lines of painted rocks are often combined with « test pillars » whic hare intended to show the vertical velocity profile.
STAKES, VEGETATION, and OTHER MARKERS
Erosion measured by Stakes
Contribution by S.A. SCHUMM
Installation. Stakes which are driven into hillslopes for the purpose of obtaining infor-
162 STUDY OF SLOPE AND FLUVIAL PROCESSES
mation on the erosion of the hillslope by progressive exposure of the stake must be placed on the hillslope in such a manner that they do not disturb the ground surface unnecessarily and that they are fixed in position. One needs, therefore, to use stakes of sufficient length so that they will not be affected by surficial creep or frost action.
The stakes should be long (2 ft to 3 ft depending on local conditions), thin (1/4 inch in diameter), smooth and strong. If long, they will not be influenced by surficial creep ; if thin, their effect on surficial runoff and erosion will be minimized ; if smooth, they may resist frost heaving ; if strong, they can be driven into weak bedrock.
The top of each stake should be exposed a few inches above the ground surface, in order that they can be more easily located for repeat measurements. If a portion of each stake is exposed, it is unlikely that they will be buried and lost.
A major problem is that of taking meaningful measurements that can be duplicated by other investigators. Measurement of stake exposure from the top of the stake to the ground surface at the base of the stake is not a good technique, because such a measurement could include any accelerated erosion at the stake base caused by the installation of and the presence of the stake on the hillslope. In addition, the value obtained will vary depending on irregularities of the ground surface. Therefore, one should measure from the top of the stake to the average ground surface. This can be achieved by the use of a plate several centimeters in diameter, which has a hole in its center somewhat larger than the diameter of the stake. This plate can be lowered to the ground surface with the stake projecting through it. A measurement from the top of the stake to the surface of the plate will yield the distance from top of stake to the average ground surface.
On the measurements of solifluction movements
Contribution by Anders RAPP, Uppsala (Sweden)
In Karkevagge (1), solifluction movements were recorded by annual checking of markings
(1) See Rapp, 1961, p- 173. (from Rapp A., 1961 Recent develoment of mountain slopes in Karkevagge and surroundings, northern Scandinavia, Geograf.Annaler, 42 : 2-3, pp. 71-200).
in downslope and transverse test lines. Three types of markings were used : (1) Oil paint on boulders and cobbles. (In many cases the stones more rapidly than the ground itself, probably due to stronger frosMieaving and needle ice action). (2) Wooden stakes driven vertically 40 to 50 cm into the ground. (3) Stakes driven 15 to 20 cm into the ground. To these markings for recording surficial movement, test pillars were later added for checking the vertical velocity profile in the ground.
The stakes form two downslope lines over the talus cone onto the solifluction slope below. The interval between two stakes in each line is about 20 to 40 m. Between the two downslope lines there are several transverse lines of painted markings on stones or small stakes in the ground.
Positions of the markings were checked with a steel tape once every summer. Measurements were started from a fixed point (FO) on the rockwall, 1.5 m above the talus top. By using two plumb bobs the accurate distance between the stakes in the downslope line was measured 30 cm above the ground. Measurements are estimated as accurate to + 0.5 cm per measured length. Lines should be checked from fixed points in bedrock at the lower as well as the upper end of the line. This method is, however recommended chiefly for recording movements in talus slopes, where no fixed points occur on the talus mantle.
A more accurate measuring method was established in a test field arranged by the author and L. TJERNSTROM in 1962 at the Tarfala field station in the Kebnekaise mountains of northern Sweden. Straight and nearly horizontal lines are established by oil paint on the talus slopes and by oil paint, wooden pins, test pillars on the lower till-covered slopes. Wooden pins were driven about 15 cm into the ground. Each test pillar was about 0 .7to 0.9 m long, consisting of wooden cylinders, 1.2 cm in diameter and 2 cm in length. The lines are checked by theodolite readings from fixed points in bedrock combined with straightened, thin wire fastened to bedrock fixes at both endpoints. Wire straightening is checked in the theodolite. On every stone crossed by the fixed wire a line 1 to 2 cm wide is painted and located vertically from the wire by a plumb bob.
ETUDE DES VERSANTS ET DYNAMIQUE FLUVIALE 163
Creep'movements on talus cone and solifluction slope KARKEVAGGE, section C (7) Position of recording lines
(ft) Downslope profiles o f C 1 N o n d C 1 S .
^ H M H W - W H W ^ W I H W H h M
S7 1 9 5 3 - 5 9 - 1 H H H H H - W M - < H H H H H H H H W - W M H M H W H - H - I ^ ^
1953-59 1956-59
(jn) Transverse recording lines of C1.
7 Painted boulder or cobble ° Small stake 15-20cm in the ground
IFormer position of moving ® Big " 30-40 " " "
object 0 Last position of moving i—'—u object
(Horizontal movement)
10 m
sn 1956-59
vv \ \ t t f L
-50cm \^NJ>!_
• V"5?-"'
100cm
Solifluction
tongue
Mouvements de reptation sur c6ne d'eboulis et un lobe de solifluction KARKEVAGGE, Section C
I Position des alignements de reperes. II Profils le long de la pente ClN et CIS. Les valeurs en centimetres indiquent le
mouvement moyen annuel 1955-1959. La petite coupe montre I'eboulis et le lobe de solifluction, avec, en SI, un jalon en bois. I l l Alignement transversaux CI.
- Bloc peint. — Petites mires 15-20 cm dans le sol. - Position anterieure de 1'objet deplace. — Grandes mires 30-40 cm dans le sol. - Derniere position de 1'objet deplace (mou-ment horizontal).
Earth translocation on mountain slopes, due to human activities, and its measurement
Contribution by Josef Pelisek, Brno, (Czechoslovakia)
In the forest regions of the Carpathian Mountains, Central Europe, as a result of hu
man activities there comes translocation of weathered rocks on sloping positions. After felling the trees in a certain forest area the stems are transported by means of horse traction down the hillside as far as the roads in the valleys from where their further transport is effected. In the course of such transport-
164 STUDY OF SLOPE AND FLUVIAL PROCESSES
(?&GWAl COA/0/T/OAf
A^rea SO/L AfoveMEt/r
Upper s/ape Powns/epe i C
A gauche, partie superieure de la pente. A droite (dans l'ordre) : partie basse de la pente.
—^Situation initiale. — Apres mouvement'du sol.
operations down the slopes, appreciable amounts of the top soil material on the upper parts are translocated onto the lower portions of the slopes. This type of soil translocation, artificial in essence, was subjected to studies over the years 1962 to 1964 by a method described below. This method can be used with good advantage for similar cases in other mountain regions. The sloping moutain situations under study ranged from 200 to 250 m in length, with a mean gradient of the slope between 25 and 30 percent, elevation 800 to 1 000 m, southwestern aspect.
The method and its description.
Roughly, one month prior to the planned felling of the chosen forest stand, including subsequent transport of stems down the hillside, two series of iron rods were driven into the ground, following in each case the gradient line, i.e. in the slope direction. Each series consisted of three rods located on the upper par t of the slope and of another three rods fixed at its lower part. Each iron rod was 2 m in length, the distance between each
along the gradient being always 20 m, both in the upper and lower parts of the slope.
Half of the rod was driven into the ground, so that 1 m length of the rod was left projecting above the surface ; this projecting portion was provided with a scale in cm. Considering the contour line, i.e. along circumference of the slope, both series of the iron rods were 50 m away from each other.
This arrangement of iron rods on the slope in two parallel series provided for an estimation, with satisfactory accuracy, of the translocated top-soil material, both of its total amount and thickness as well. Measurements of the material translocated in this way were made in each case as late as after completion of the forest stand cutting, including the transport of stems down into the valley. The operation of timber transport proceeded during the months of |March to May, while measurements of the soil material translocation at the iron rods were made as late as September when the material had settled sufficiently enough and attained the state similar to its environmental soil material being left intact and in its original deposition.
Location of the parallel series of iron rods along the slope and stratigraphy of the soil material thus translocated can be found illustrated in the attached diagram.
On the use of test pillars
Contribution by Sten RUDBERG, Gbteborg (Sweden)
To check the vertical velocity profile in moving masses, a sort of « test pillar » is used. The pillar consists of individual cylinders of plastic or wood and is injected vertically into the ground through a steel pipe, which afterwards is removed. The pillars formed by the individual cylinders are supposed to react in close dependence on differential soil movement. The individual cylinders have a diameter of 2 cm and usually a height of 2 cm, but occasionally more. The plastic is brightly colored, the wood is impregnated in a green color. The steel pipe has an interior diameter 1-2 mm greater than the cylinders ; the walls are thin. The hole in the ground for the pipe is normally prepared by an iron rod. As no boring equipment has been used so far, the test pillars are normally placed not deeper than 0,5 m to 0, 8 m, slightly more. As it is usually not possible to get the iron pipe in a true vertical position the deviation from this position is measured by means of a plumb line. The exact position
ETUDE DES VERSANTS ET DYNAMIQUE FLUVIALE 165
0/sfanee snored Ccm.) /n f/mt /atcrva/
2 4 i
/o • i r
sio " * / * 1 30 1 f | %4o | ^ 1
Z 4 & ro 30
—^~~*
20
30
Jta
I
Distances de deplacement (en cm) pendant le temps unitaire en abscisse.
Profondeur (en cm) en ordonnees. Variations du mouvement du sol suivant la profondeur
en utilisant des pilliers temoins.
of a test pillar is marked on the ground with a short wooden stake, and the distance and direction between the base of this stake is measured to benchmarks, painted on solid rock when necessary on large boulders.
If possible, different benchmarks are used in varying directions from the stake. If, after some years the stake has proved to move, the pillar is dug out by means of a shaft at the side of the pillar and with a vertical wall in the direction of supposed movement. In this wall the pillar is cautiously freed from soil to approximately half the diameter of the cylinders. Then a plumb line is placed in the original position of the stake and is used as a coordinate, to which the horizontal distance of each individual cylinder is constructed in a graph after necessary correction for the original dip of the pillar.
The test pillar method usually requires 3 years before excavation. In some cases only one year is necessary. All localities have so far been in till areas, and all but one above the timber line. The lower part of the pillars often prove not to have moved at all. Therefore this lower part helps to fix the original position of the pillar. Two examples of data in accompanying graph show different profiles of movement. These probably reflect different processes of movement, such as mainly differential frost-heaving at different depths or a sort of surface flow.
Practical problems with the method are the difficulties to inject the pillars by means of simple equipement and to get good marking of the position. The stakes often disappear.
On the use of welding rod for erosion and deposition pins
Contrbution by R. EVANS, Sheffield, U.K.
It has been found that welding rod of 0.125 inch diameter, which does,not rust, is a more satisfactory material to use for erosion and deposition pins than iron .or steel nails. Because of its diameter disturbance of the soil is at a minimum as is resistance to soil movement and, since the rod is manufactured in 3 foot lengths, it may easily be sunk until a rock fragment or bedrock is reached and the appropriate length cut off. Penetration of the rod to a hard surface is very important where frost may occur since in these conditions the rod may be heaved out of the soil and give a false measurement ,of movement. If it can always be pressed back to its original depth the t rue amount of displacement due to heave, and the subsequent loss of waste on thaw, can be measured. The exposed ends of the rod are painted red for ease of location.
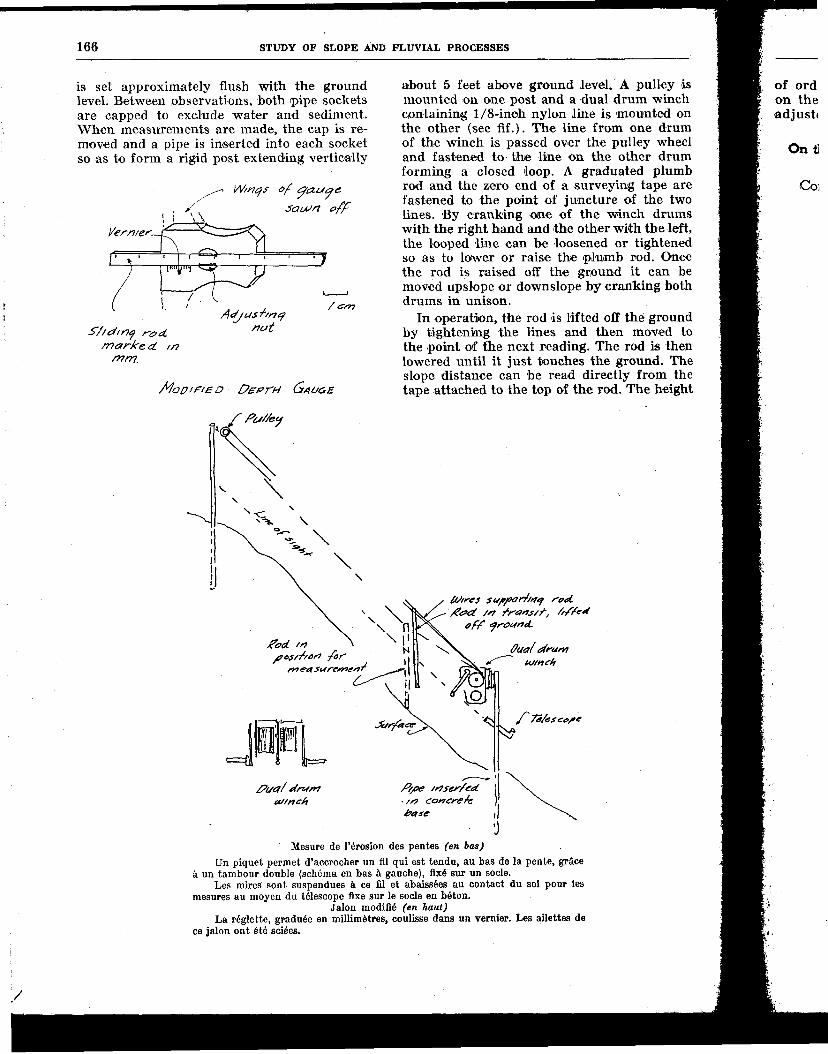
Modified Depth Gauge for Erosion Rod Measurement
Contribution by R. EVANS, Sheffield (England)
Where erosion rods are used the distance between the top of the rod and the washer or the soil may easily and accurately be measured by the use of a modified depth gauge (Rabone Chestermann Ltd., Sheffield). This is easy and quick to use and has a vernier scale which reads to 0.10 mm. (Figure at r ight) . The projecting wings of the original gauge sawn off to make a more compact instrument.
Measuring hUlslope erosion
Contribution by N. J. KING and R. F. HADLEY, Denver (Colorado).
Measurement of aggradation or degradation on steep hililslopes presents problems of either physically altering the land surface during observations by trampling or artificially influencing natural processes if pins or other such devices are used. The erosimeter described here is designed to measure changes on steep hillslopes without physically disturbing the slope in any way during observations.
Fundamentally, the device is a modification of the pulleytype clothesline. Two elongated pipe sockets are mounted permanently in concrete, one at the top and one a t the bottom of each hillslope section to be measured (see fig.). The top of each pipe socket
1 6 6 STUDY OF SLOPE AND FLUVIAL PROCESSES
is set approximately flush with the ground level. Between observations, both pipe sockets are capped to exclude water and sediment. When measurements are made, the cap is removed and a pipe is inserted into each socket so as to form a rigid post extending vertically
W/nqs of atau&e.
5au>n off
Vern/er.
S//ttf/r7<p r-ae£ marke ct m
Ad/US ///7-f /7ut
/ <:rn
Mop/fED /?£PrH GrAOCZE
about 5 feet above ground level. A pulley is mounted on one post and a dual drum winch containing 1/8-inoh nylon line is mounted on the other (see fif.). The line from one drum of the winch is passed over the pulley wheel and fastened to the line on the other drum forming a closed loop. A graduated plumb rod and the zero end of a surveying tape are fastened to the point of juncture of the two lines. By cranking one of the winch drums with the right hand and the other with the left, the looped line can be loosened or tightened so as to lower or raise the plumb rod. Once the rod is raised off the ground it can be moved upslope or downslope by cranMng both drums in unison.
In operation, the rod is lifted off the ground by tightening the lines and then moved to the point of the next reading. The rod is then lowered until it jus t touches the ground. The slope distance can be read directly from the tape attached to the top of the rod. The height
Un piquet permet d'accrocher un fil qui est tendu, au bas de la pente, grace a un tambour double (schema en bas a gauche), fixe sur un socle.
Les mires sont suspendues a ce fil et abaissees au contact du sol pour les mesures au moyen du telescope fixe sur le socle en beton.
Jalon modifie (en haul) La reglette, gradufie en millimetres, coulisse dans un vernier. Les ailettes de
ce jalon ont ete sciees.
ETUDE DES VERSANTS ET DYNAMIQUE FLUVIALE 167
of ord is read through! a telescope mounted on the post below the winch (see fig. 1) and adjusted to a predetermined line of sight.
On the placement of stakes for measuring downhill crepp
Contribution by T. GERLACH, Krakow.
For a network of stakes to measure downhill creep we used oakwood stakes having a dimension of 50 X 4 1/2 X 4 1/2 cm pointed at the end. They are driven into the ground at a depth of 40 cm. We find a rock located at the hill top and there set up a metal reference point A which cannot move. In the same vicinity, also on a permanent rock, we set up a
19990
106 137 111
«42)_20004- i (43)^-20000—(44) 19992 —(45)—200 1 1 -̂(3? 92
second metal reference point B. When the theodolite is set up on A the sight on to ii provides for orientation, i t is necessary that ail points on the hill&lope which are to ho measured can he seen from point A where the instrument is set up. In the direction ox greatest inclining towards the taiweg we set up a permanent •reference point C In the straight line from A to C stakes are driven into the ground at various distances. Some stakes on the line A-C are also end. points for lines of stakes approximately parallel to the contour. What we call the auxiliary points are marked by long stakes, usually 120 cm, driven 110 cm into the ground. Tne regular measurement points are marked with 50 cm stakes driven to a depth of 30 to 40 cm.
The method, as in the case of other stake observations, requires re-surveys in subsequent years initial installation. The measurements depend primarily on the angle measured by theodolite from the instrument set up at A to each individual stake. The new position of stakes are computed by trigonometry. Distances between pairs of stakes on the main line A-C and on the additional lines of stakes parallel to the contour have been measured with a metal tape. For accurate measurements the tape is always stretched with a constant force of 10 kilograms. In addition we measure precisely the height of each stake above the ground surface ; also the angle of inclination from the vertical is recorded for each stake. The methods used allow us to observe a movement which is barely perceptible, that is, it only attains an amount of movement of several millimeters.
VEGETATION
On vegetation as a marker Contribution by S.A. SCHUMM, Denver (Colo)
It is well known ;that on unstable hillslopes the roots of vegetation will show the effects of mass movement. The roots will anchor the plant, but downslope movement of the soil will, nevertheless, carry the plant downslope and the roots will appear to be bent upslope. A sharp bend in the roots of some plants may occur immediately beneath the ground surface. These features indicate in a qualitative way that mass movement is occurring on a slope, but they yield no information concerning the rates of creep or whether the movement is seasonal. However, the distortion of roots of annual plants do yield information of this sort. A plant that commences to grow in the springt of the year and yet shows measurable root
distortion in the summer indicates that mass movement during the spring and early summer is important. In addition, the amount of root distortion may yield a crude measure of the rate of creep during part of the year.
On vegetation as a marker
Contribution by Sten RUDBERG, Gotebarg (Sweden)
In one special site on Axel Heiberg Island, Canada N.W.T., buried willow-tree trunks were tentatively used for measurements of movement on a scree slope. The t runks were bent in a downslope direction from the roots, and par ts were covered by stones belonging . to the ordinary scree cover. The lengths of the buried t runks, measured in the downslope direction from the roots to the superficial parts of the willow, were - 220, 55, and 205 cm in the three examined specimens. Samples from the trunks were taken and the number of rings were calculated in microscope, which gave respectively 64, 40, and 67 years. The amount of movement in a year was respectively 3, 7, 1, 4, and 3,0 cm - which look to be quite reasonable figures.
In the birch forests of the lower mountain slopes in Sweden the t runks of the trees are usually bent. A simple measurement of the direction of the bends indicates, in a specially measured area, a clear maximum in a downslope direction.
On use of vegetation to date land surfaces
Contribution by R. GURRY, Berkeley, (Calif.)
In the Sierra Nevada of California, methods have been established to aid in determining the ages of both depositional and erosional portions of mountain slopes. The ages of trees, determined by counts of assumed annual rings, is not of great value for this purpose since most species can tolerate modest degradational root exposure; or depositional burial without mortality. In alpine, subalpine, and montane vegetational regions, old photographs taken in the 1870's to 1890's have consistently suggested to this author that shrubs, grasses, and lichens are, in many instances more longlived than most tree species and that methods should be sought to date these plants.
Shrubby genera such as Salix, Cercocar-. pus, and Artemisia have proved to add annual rings with at least the fidelity of most, trees and are even less likely to have missingj or double rings than some arboreal genera such as Juniperus. Although rings are too
ETUDE DES VERSANTS ET DYNAMIQUE FLUVIALE 169
close together to count without polishing the section and viewing it under a microscope, some relatively inconspicuous willows less than 1 m high have proved to be 500 years old. Shrubs up to 100 years old can usually be roughly dated directly in the field by counting annual rings with the aid of a pocket hand lens. Alpine cushion plants, as well as sedge Und grass culms have shown little or no change over a period of 90 years but no means has yet been found to date the first appearances of these plants.
Lichens have proved the most useful for dating land surfaces. By measuring the maximum diameter of the largest lichen thallus found on a given physiographic feature (glacial trim-line, mudflow channel or debris, etc.), one can estimate the age of that lichen where the growth rate curve for that particular species growing on that particular substrate in that climate is known.
The lichens that have been found most useful are those crustose and squamuiose species with very slow growth rates that are relatively unaffected by the different rock types upon which they grow. jMost such species colonize a bare rock surface within 50 years and, if that surface is covered or the rock turned over, the lichens will die within three years. For the first 100 to 300 years of growth, the species used in my work grow a t a much faster rate than they do for their total 2000 to 6000 year potential lifespans. Species used in the Sierra Nevada of California are as follows :
„ . Owerall growth rate for P first 1000 to years of life
Sporostatia testudinea 5.0-8.0 mm/century Lecidea aetrobrunnea about 20 mm/century
The values are valid only for the Sierra Nevada above 2400 m elevation and only for lichens growing on non-calcareous metamorphic rocks, granitic rocks, and basalts. Andesites and limestones affect the growth rates very greatly, as does the length of the snow-free season and availability of summer moisture.
Growth rate curves for given areas can be established by measuring the largest thalli of a given species growing upon dated materials and by taking into account the 30 to 50 year initial colonization period typical of many
crustose species. Glacial moraines of known age and periodic alpine mudflow levees that bury turf which can be dated by C14 are excellent features for such use. No licheno-metry should be attempted by the ecologically naive.
On movement of individual blocks
Contribution by Jaroslav Pasek and Blahodav Kostak, Prague, Czechoslovakia
Among different slope movements a special position is that of block-type move-, ments, where blocks of solid rocks resting on softer materials, creep very slowly downwards along the margins of slopes.
In Czechoslovakia, the geologic conditions favor in several cases the development of such deformations. Such phenomena are Known in the first piace Irom valleys in Cretaceous sediments, where claystones or marlstones are ovenain by horizontally bedded solid sandstones. The marginal paria of sandstone tables are dissected by a system of iissures, single large sandstone blocks are shifted and tilted, and the wide fissures form in places bizarre labyrinths. Similarly, in Fiyscii regions large sandstone blocks glide downsiope on the tilted ciayey intercalations ; in open fissures, partially re-closed by smaller blocks, cave systems develop. Widespread movements of this type are known from younger volcanic mountains, where large basal l or andesite blocks move on the underlaying clays, claystones or tuffs. Blocks of volcanic rocks shifted for several hundred metres form conspicuous morphologic elevations.
These movements are supposed to be fossil, Pleistocene in age. As in most cases the same geological and geomorphological conditions still exist, it may be assumed that this process will continue. The movements being almost imperceptible (only mm within 10 years) , they cannot be traced in the customary way. Here aerial phofcogrammetry is one of the possibilities. The comparison of aerial photographs in intervals of 10-20 years and the topographic evaluation of given points should reveal if a shifting has taken place.
For direct measurements of slight deformations a new type of extensometer was developed. It is fixed in a fissure and enables the verification of the relative and arbitrary movements of adjoining blocks. The extensometer works on a pure mechanical principle with an accuracy of ± 0,1 mm. Cantilevers
170 STUDY OF SLOPE AND FLUVIAL PROCESSES
leading the movements of the comparative marks are fixed to the walls of the fissure. For these marks optical grids were used. The relative movement of the marks may be investigated on the basis of the mechanical interference of grids either by direct reading or from a photo of the characteristical interference fringe pattern. Each extensometer works with two pairs of these marks which enables to measure the components of the movement in two concurrent planes. In such a way the resulting vector of movement may be found. The device is relatively simple, and it can be assumed that it will be possible to follow the progress of the deformation for a long time.
Lacking experience, we must suppose that only an extensometer working on a simple mechanical principle is sure to work trust-worthily. That is the reason why electrical extensometers have been avoided so far. On the other hand, the sensivity of the device need not be too gigh, as the influence of the thermal dilatation should anyway be excluded. Thus it is necessary to find for the vertifica-tion of block-type movement dilatations systematically exceeding thermal dilatations.
On the covering of an identifiable layer by new material
Contribution by Sten RUDBERG, Goteborg
The method described is tried at the island of Gotland, Sweden, and may be specially adapted to its conditions. The rock ,of the cliff is limestone and mainly marl , the latter being friable and easily weathered, mainly during late winter. The coast is open in the quadrangle SW-NW. There is no tide, but the non-periodic changes of sea level might be at least a half meter or maybe one meter.
The shore is covered by well rounded gravel, mainly consisting of the rock in place but to a small amount of Precambrian crystalline rock in some places. The cliff is 10-15 m high and its base is situated at about 3 m above sea level. This base is normally covered by talus, consisting of fragments from the wall and to a large part, lumps of clay derived from he weathering clay, these latter constituents brought in their present position partially by mud flows. The breakers normally do not erode the talus. During exceptional storms, however, and especially storms combined with a high water level, the breakers reach the talus, which is more or less removed and replaced by well rounded shore gravel. This shore gravel is then by degrees covered by new talus.
An estimation of the wall retreat is got by measuring the talus covering the gravel in a certain place (e.g. a surface 0,5 m or 1 m long parallel to the cliff). The age of the shore gravel can occasionally be stated (e.g. big storms 1931, 1948, 1954). It is also possible to make estimates on late winter snow, or to get an artificial reference surface by placing a piece of sacking ,on the talus. Still better is to make a volume measurement at a certain time and another one some years later in the same place, provided that no great storm has occurred during the years between. The different measurements have given figures of the same order of the wall retreat, which in most places is 2-5 mm in a year. The figures should according to the methods be regarded as minimum values. The traditional, comparative morphological analysis indicates a somewhat higher speed of the slope retreat.
GERLACH TROUGHS-OVERLAND FLOW TRAPS
On the construction of troughs.
Contribution by P. Asher SCHICK, Jerusalem Israeli
A modification of the Gerlach trough was designed in the Laboratory of Geomorphology of the Hebrew University, and is in use ,by Aharon Yair. The instrument is a double trough, with the top tray collecting overland flow and the bottom one collecting interflow. The material is thin galvanized metal. Uphill of the lower tray the soil is supported by a vertical wire netting with holes eight millimeters square. The top tray is covered by a hinged lid, mainly to prevent damage by animals. Each tray drains into two 4-liter plastic containers, connected with the help of a siphon in such a way that one container fills completely before the other begins to collect water. (Among other things, this helps to find out whether the beginning of the overland flow carries more sediment than its continuation). The bottles are emplaced in a hole in the ground in the same way as in the original Gerlach tray. The hole as well as the surface leading to the entering lip of the upper tray are stabilized by stonework and concrete.
The stabilization of the surface leading to the tray is the critical par t of the instrument. The work has to be executed with great care in order to avoid damming or piping and to ensure as much as possible that boundaries of the unit strip draining into the trough will not be disrupted by the installation.
^£-5 r ? * & o S B> O 9
era » tr cr
= » -,. n>-*ki$^*i 2* » ? « ? » P . 2
D ; ( ( ( 5 ( t 8 ' ' 1 ( t ! e 0 ' 1 h , : t i < < » T S» C ? CL <? << ^ ce »
i f L 2 1 ? 5 < 5 i 3 ! = ! < T > o ; o « i » ; - T ct> ctu o cm P ^
Only minor repairs of the installation are required after moderately severe storms. The netting holds the soil well. After a storm of 50 mm ((2 inches) per*day the interflow collected in the lower tray was quite clean of sediment. I
The unit can be disassembled by sliding the top tray out. The top tray then may serve as the original Gerlach tray for overland flow only.
The cost of production of one complete unit was 1 £ 60 (($20). The top part costs only 1 £30 ($10).
On the design of a Gerlach trough
Contribution by L.B. LEOPOLD and W.W. EMMETT, Washington (D.C.)
0 The problem in the construction of any trough to collect overland flow on a hillslope is to get a lip tightly adhering to the natural soil surface so that the water comes off the hillslope surface on to the lip of the trough.
In earlier trials we have experimented with a metal lip which was pushed horizontally into the soil of the hill, but there was enough disturbance of the soil that it was not satisfactory.
The new method that we are now using is to make the installation out of concrete. A wooden form, about 1/2 meter long and 5 centimeters high, is prepared to hold the downslope edge of the poured concrete. The upper edge of the surface being prepared is cleared of vegetation so that a slight vertical wall of mineral soil is exposed, and that forms the uphill edge of the poured concrete. Into the wet concrete there is inserted a hose which is led downhill to a collecting tank that stores the runoff and the sediment which flowed into the trap. The hose or pipe is made of thick plastic, 1 inch inside diameter. Within the concreted section there is a slot cut in the pipe to allow entrance of water and sediment. The pipe has a slight gradient even within the concreted section so that water will flow toward the collector..
/Valcir-*/ so//
r Poured- concrete
P/asf/c p/pe C/zoSSSfcT/or/
stopper
Cohcrefe
/n p/pe
PlAH V/EW
siIi»A| 7o co//ec-r/na
•fank
A (jeRLACH TXOLKSH
Fosse de Gerlach
En haut, coupe. Bati en bois, gouttiere en ciment avec tuyau en plas-tique, poses sur le sol naturel.
Au milieu, vue eri plan montrant, vers le haut, le bouchon en liege, le massif de beton, la fendtre coupee dans le tuyau et, vers le bas, le depart vers le reservoir.
ETUDE DES VERSANTS ET DYNAMIQUE FLUVIALE 173
Hillslope troughs for measuring sediment movement
Contribution by T. GERLACH, Krakow On prairies or in forests where small rills
are absent we have measured the production of sediment by overland flow with the aid of rinc-plated troughs. The dimensions of the troughs are, length 50 cm, width 10 cm and depth 8 cm. The trough has a movable lid
' Which prevents precipitation falling directly • 6<i to the trough from entering the catchment hottle. Connected to the nozzle coming out <>f the trough is a rubber hose and the water and sediment are thus led to a closed drum of Capacity 5 to 20 cubic decimeters. There are iittall handles on the side walls of the trough Miich fit over pins driven in the ground. This allows the trough to be fixed accurately to the
• ground surface. Two or three troughs are installed beside
* each other. The groups of troughs at various
4o 60 /za
SAMPLE OF FIELD DATA nzoM GEKLACH TKOCKSHS
' Echantillon de donnees de terrain donnees par la Fosse de Gerlach
I En ham, en ordonnees, sediment recolte apporte par le luissellement, en grammes par metre de section. , . Le graphique montre les variations des , apports : la COurbe superieure, le total des diverses saisons, la courbe flioyenne, ceux de l'hiver et du printemps, celle du bas, (felle de l'ete et de l'automne. v. En bas, profll du versant equipe et position des fosses.
THE GERLACH TROUGH
Apporell servanf 6 determiner la valeur du ruissellement sur les versants
> des prairies et des pflturages.
distances from the hill top are set en echelon so that they do not interfere with each other. After the troughs are installed the hillslope is mapped and described in detail.
Both water and sediment are collected by the trough and deposited in the storage container. After the snowmelt in spring, or after the summer storms the water and sediment are removed from the drums and brought to the laboratory. In the laboratory the water is filtered and the filters are dryed and weighed. The accompanying figure shows a sample of the seasonal variation in sediment catch in such troughs as a function of distance from the hill top.
Seismogrctphic methods
Contribution by Frank AHNERT, Baltimore, Md.
The variation of waste cover thickness on slopes is an important element in the analysis of slope form and slope development. Conventional methods of measuring this parameter have several disadvantages. Soil augers may be stopped in their downward progress by stones before reaching the bedrock, and are often unsuitable for the detection of significant discontinuity surfaces in the waste, unless they provide an undisturbed core. Digging through the waste to the bedrock is a laborious and time-consuming exercise, may become practically impossible where the waste cover is thick, and is likely to arouse the ire of the property owner on whose land
174 STUDY OF SLOPE AND FLUVIAL PROCESSES
the digging is done. To bypass these difficulties a successful attempt was made during a field study of slopes in the Appalachians of North Carolina in August of 1966, to use a portable refraction seismograph instead of the more conventional methods.
The instrument used was a Terra-Scout Model R-150, rented from Soiltest, Incorporated, Evanston, Illinois. It consists of an oscilloscope to which a geophone and a « hammer » (better described as a heavy tamper) are connected by cables. Power is supplied by a 6-volt rechargeable battery. Impact of the manually operated hammer producer a shock wave in the ground and sinm1t?.n ously triggers an electrical impulse which is transmitted through the hammer cable to the oscilloscope. The latter measures the time interval between hammer impact and arrival of the shock wave at the p< ophone. and can be set at a sensitivity of cither 0.1 milliseconds or 0.5 milliseconds. Readings are taken by visual inspection of the sweep on the oscilloscope screen (i.e. the instrument is a seismoscope rather than, as adverstised, a seismograph).
The Terra-Scout can be rented for $ 270.00 per month, or bought at about $2,500.00. It is recommended to order a complete set of spare transistorized modules with the instrument. During our field work one of these modules failed and a replacement had to be ordered by air express freight, which caused a delay of several days.
Field operation requires two men, one to pound the hammer on the ground and another to read the oscilloscope. At each observation site, the distance between hammer impact point and geophone is progressively increased, at intervals depending upon the degree of accuracy desired, and upon the thickness to be measured. We started hammering two feet away from the geophone, then increased the hammer distance at two-foot intervals to twenty feet and from there at ten-foot intervals to fifty feet. The depth to which density discontinuities in the ground can be detected equals approximately one-fourth of the maximum hammer distance used. Since the cable connecting the hammer with the oscilloscope is 200 feet long, the instrument is capable of measuring to depths of about 50 feet.
Evaluation of the data begins with the plotting of time-distance graphs, from which the velocities of the shock wave and the hammer distances at which velocity changes occur, are obtained. These values in turn are used to compute the depths of discontinuities according to formulas given in the manual
that accompanies the instrument. For layers a few feet thick, the depths computed appear to be reasonably accurae to the nearest 0,1 foot.
The refraction-seismic method yields useful results only if the density of the layers studied increases from the surface downward. It is unusable, for example, if freezing makes the surface denser than the unfrozen material underneath. Also, the data tend to be of poor quality when there are strong irregularities in the waste bedrock interface, or when the waste contains many irregularly spaced stones ; in both" cases the velocity of the shock waves becomes subject to erratic variations. Another restriction lies in the bulk and weight of the instrument. The oscillograph weighs over thirty pounds, the hammer not much less. This makes it virtually impossible to operate in dense forest or brush without preparation by clearing a path.
Apart from the measurement of waste cover thickness, the refraction-seismic method lends itself well also to determination of the depth of a shallov water table, or to measurement of the thickness of the active layer in periglacial environments.
Photography and Stereophotography
Contribution by R. CURRY, Berkeley, (Calif.)
A simple instrument for analysis of multiple slope processes by repeated stereophotography has been developed. The instrument is basically a piece of Duraluminum channel stock 1.1. m in length to which may be attached four telescoping legs of adjustable length from 1/2 to 1 m (see figure). The legs are threaded and easily removed from the channel stock when the instrument is to be transported. Two circular bubble levels and a standard level bubble are affixed as shown and provision is made for affixing a removable plumb-bob line near the center of the channel.
Any moderately good single-lens reflex camera can be modified for use with this instrument. Provision must be made for fixing the camera to the bar at various accurately located points along the bar's length. Four small pins about 2 mm long were set into the base of the camera body symmetrically disposed around the threaded tripod, mounting hole. These pins were made to exactly correspond to small holes drilled into/ the upper surface of the 1.1 m bar symmetrically disposed around a large hole drilled through the bar which was aligned with the
ETUDE DES VERSANTS ET DYNAMIQUE FLUVIALE 175
• J>abb/es
CL ^V-•a O - -
m
En haut, vue en profit de la position de l'appareil photo-graphique visse sur la poutre a pieds pliables.
Au centre, vue perspective, avec les trous et le niveau a bulle.
En has, vue de dessus de la poutre, avec les niveaux a bulles et les trous pour visser.
tripod hole on the camera so that a single thumbscrew could be used to tightly fix the camera to the bar.
The system should be aligned so that when the channel stock is level, the camera may be mounted in the exact center of the bar and an exposure taken with the film plane parallel to the length of the bar, and then the camera may be moved to another mounting hole and fixed to the bar for a second exposure. All mounting holes should be aligned with real or improvised cross hairs coinciding with a fixed point on the horizon. Fiducial marks to locate the principal point on the photographs can be made by filing accurately located nicks along the frame of the camera focal plane so that they will show up on the negative but will not occlude any portion of the actual picture frame as the fiducial marks in aerial photo cameras do.
In use, the instrument is located at a 'hopefully stable marked spot by plumb line, and compass orientation of the axis of the 1.1 m bar (to the camera optic axis) and the positive or negative declination of the camera Optic axis from the horizontal are measured to 1° and recorded. With adjustable legs, the instrument can be set up on slopes up to 25° but the height of the instrument above the marked spot must be noted so that it may be set up in similar manner again. An exposure is made with the camera at the center of the bar and then it is moved to the right and left for subsequent exposures. For
slope processes affecting areas 5 to 100 m distant from the camera station, the camera should be mounted so that right and left exposures are taken on one-meter centers. For detailed close-up work, 20 cm and 7 1/2 cm centers have been used. During one set of exposures at a given site, scaling rods, of known length, should be placed at a known distance from the camera as near the center of the field of view as possible.
Quantitative analyses of changes over the entire field of view of the photos are carried out by standard photogrammetric techniques. Qualitative analyses may be made by stereo-scopically viewing pairs of photos in which one photo was taken at a different time than the other, or by projecting a negative image of a photo taken at one time onto a positive print of a photo taken at another time from the same camera position. In this latter case, neutral gray tones will be seen wherever there has been no motion but areas that have changed will be evidenced by light and dark « contrast rings » centering around the area of greatest motion perpendicular to the camera axis.
The advantages of this instrument for slope studies are that it is lightweight (circa 1 kg exclusive of camera), inexpensive to build (the camera is still perfectly usable for all other purposes), and great versatility in examining whole slope processes and random events when compared with optical surveys of fixed points, painted lines, etc. Disadvantages are lack of accuracy at distances greater than 20 X the base length from the camera ( ± 2 % with 35 mm format at 33 X the base length), and the necessity for repeated photos to be taken at the same time of day on or near the same calendar date. With carefully placed scaling rods, the location of a point 10 m from the instrument may be determined to within 1 cm with 55 mm focal length lens on 35 mm film.
On repeated photographs Contribution by R. CURRY, Berkeley, (Calif.)
Most frequently, slope studies involving comparison of photos taken 50 to 100 years apart at a given site cannot make use of the exact same camera for both exposures. Where the same old camera is not available for current work, one can still make accurate photographs from which much quantitative data can be derived by using a camera with the same ratio of lens focal length to maximum diagonal negative dimension as was used in the older exposure. This ratio can be
176 STUDY OF SLOPE AND FLUVIAL PROCESSES
computed for old photographs by field measurement of objects within the photographs ,or, in many cases, by scaling distances between prominent landforms shown in the photos directly from accurate topographic maps. If the ratio cannot be directly computed, it may be approximated by assuming that the focal length of the old camera lens was between one and two times the maximum diagonal negative dimension. Of 2000 large-format landscape photographs taken in western United States between 1875 and 1900, I have found that the focal length of the lens is most often 1.7 to 2.0 times the maximum diagonal negative dimension.
Where the photo site has been accurately relocated and the focal length ratios are approximately the same, exposures taken with modern 35 mm cameras may be enlarged to the size of the old photos and they may be compared by viewing them under a pocket stereoscope. If the current exposures have been made at such a time of day that shadows in both new and old photos are similar, many subtle differences can be detected.
On Methods of measuring sheet wash and rill erosion
Contribution by Otakar STEHUK (Czechoslovakia)
Regular daily observations of the quantity of load in rivers will be carried out by the Institute of Hydrometeorology in 19 places in the Labe River basin, in 10 places in the Odra River basin, 60 places in the Danube and 2 places in the Vistula River basin. In addition short-term observations of load trasport in typical small river basins were started in 1965 at 16 selected locations. These deal primarily with the quantity of load during spring and summer rainstorms.
The Institute of Geography of the Czechoslovak Academy of Sciences initiated a network of observers for the territory of Czechoslovakia to observe and record the extent of damage caused by rain storms on agricultural land. Within 3 days after the damage occurs the Institute of Geography is informed. This information makes it possible to choose areas where the development of rills and sheet erosion is especially important.
We have attempted to use aerial photography to show the development through time of erosion features. The repeated photographic record of the same object provides information relevant to the development of erosion phenomena.
For special purposes we constructed a radio-operated airplane model with a parachute wing which contained a camera that could be released from the model on a signal from a ground-operated radio. The model plane can ascend to an altitude of 300 m, it has a minimum flying speed of 2 m/sec, and can stay aloft for 20 minutes. Its flying range is about 800 m from the control radio. With a camera with an f-8 lens utilizing a negative 6 cm X 6 cm in size the relief of an area of 16 ha can be recorded in one picture during a flight at altitude of 300 m. It is possible to suspend a motion camera to the fuselage of the airplane model and it will be capable of taking stereoscopic views suitable for measuring the dimensions and forms of erosion rills and other micro relief features.
INCUNOMETERRS OR T BARS
Contribution by R. EVANS, Sheffield (U.K.)
The T-bar is an instrument devised to measure movements in the upper few inches of the soil which result from the effects of wetting, drying, frost, gravity, etc. The instrument described here is a modified form of the « T-peg» first used by Kirkby and later by Slaymaker. The amount of movement of the soil is expressed by the angular displacement of the T-bar and from this a crude linear measure of movement can be calculated. Besides the T-bar, therefore, a device is also required for measuring the angle of tilt.
The instrument illustrated here is made of readily obtainable and inexpensive materials and is of very simple design (figure A). A steel plate (2 X 1.5 X 0.05 inches) is brazed to a steel blade (1 X 0.25 inch) which in the original design was 7 inches in length. The thickness of the plate is such that it is as light as possible but does not distort on brazing. The T-bar is painted to protect it from rusting.
The length of the blade now in use is 7 inches, which provides 6 inch penetration into the soil and 1 inch clearance. This clearance allows the bar to be used on slopes of up to approximately 35 degrees provided the vegetation cover is low.
As a result of current experiments in the laboratory it now appears that the length of the blade should be shorter, for example, 4.1 inches. This is because the soil becomes more compact and stable with depth and this
ETUDE DES VERSANTS ET DYNAMIQUE FLUVIALE 177
Position du niveau Abney sur la tablette ported par un piquet enfonce dans le sol
inhibits movement of the T-bar. But if the • blade is shorter than 4 inches it becomes relatively top-heavy. Fur ther experimental work is being carried out to improve the design and to lighten the instrument.
The device for measuring the angular mo-) vement of the T-bar consists of a large Abney
level (The Stanley Telescopic Abney Level, i manufactured by W. F. Stanley & Co,, Ltd.,
London) from which the heavy viewing .column has been removed and which reads ;: to 1 minute of arc. This mechanism is rigidly attached to a light alloy base plate (figures B
, (i) and B (ii). It has been found that because of the light weight of the level the area of the T-bar plate should not be of
..smaller dimensions than those suggested here, since by reducing the area of contact between the level and the plate friction is lowered and the clinometer cannot be kept still for reading.
SHIFT OF ROCK FRAGMENTS
Contribution by J. DEMEK, Brno (Czechoslovakia)
1. The following kinds of experimental areas were chosen :
a) with essentially identical forms
b) with the same and even different geological structure
c) with the same and even different altitude m.s.l.
d) with various vegetation cover, namely: da) spruce monocultures (Picea ex-
celsa) db) grass areas within the forest zone dc) in the area of Alpine meadows
(above the timber line)
2. The experimental areas were mapped topographically in detail on scales of 1:250 -
178 STUDY OF SLOPE AND FLUVIAL PROCESSES
1:500. Detailed contour plans were made. The original drawings of the plans are on plastics so that they assure the dimensional stability. The chosen territories cover an area of 2,5 -12, 5 ha.
3. In the chosen territories detailed geological, geomorphological and biogeographical research was carried out and respective geological, geomorphological and biogeographical plans were compiled. Even special observations such as mechanical analyses of products of weathering, of soils, clayey minerals, the bio-mass, the root system, e tc . , were carried out. Even mesoclimatic measurements are to be realized.
4. The polygonal tension on the perimeter of the territory chosen was measured in detail in the experimental areas. The individual •polygonal points were fixed carefully by means of steel tubes and concrete. Besides, fixed points, immobile indeed, were established on bedrock outcrops.
5. A great number of blocks were levelled exactly as to the angles and the distances from the point of the polygonal tension and from the fixed points on the bedrock outcrops.
A great number of blocks were measured by means of a tacheometer with the angle accuracy of 30" and with an accuracy to distance of ± 7,5 cm and to height of ± 5 cm. Farther blocks were measured from the posts (polygonal points) by means of a steel band with the accuracy of ± 1 mm. The height position of these blocks was determined by surface levelling with the accuracy of the order of ± 1 mm.
6. Rock fragments of equal and various size were measured :
a) those lying on the surface ' b) partly buried in sediments and wea
thered mantle c) projecting only with a small part over
the surface of the terrain
7. The experimental areas were established on slopes :
a) where fragments occur but sporadically
b) where fragments occupy 30-40 % of the area
c) covered with block fields (50-100 % of the area covered with fragments)
d) where stone polygone occur e) where block streams are developed
8. Besides the levelling of individual fragments lines parallel to contour lines were
established with color in block fields and block streams. The lines are 1 0 - 3 0 m long. The ends of some lines are fixed in bedrock outcrops. Other lines pass only on free lying fragments.
9. The extent of slope movements will be established :
a) by repeated measuring of the points levelled exactly ; the repeated measurements are planned to be realized every 5 years
b) by observation of the lines ; the observations are carried out in spring and in autumn and serve for giving precision to the periodicity of the movements.
On preferred orientation of stones
Contribution by Sten RUDBERG, Goteborg (Sweden)
Measurements of long axes of stones have been used by the author in till covered areas to show : . 1) whether mass movement has occurred ; 2) the thickness of the moved layer. The surface layers normally show a preferred orientation of stones in the direction of the slope, more pronounced in till rich in fines, but noticeable also in areas poor in fines. In lower layers the slope direction orientation of stones is gradually weaker, and grades towards the direction of the last ice movement. To show this tendency different sets of measurements are made at different depths, e.g., in the layer 0-10 cm, and in the layer 0,45-0,55 cm. In each set a hundred stones are measured as to their direction in a horizontal projection. The results are shown in « rose diagrams ».
The investigations, which are spread also ' outside the mountains, demonstrate that the mass movement, indicated by the preferred orientation of stones in the surface layers, is not restricted to specially cold climates or to areas where the surface layers have been influenced by a cold climate of the past. The depth of the moved layer is normally at least 0,5 m. The orientation in a vertical plane could also be investigated. It would probably show some sort of imbrication. As to the complications, it is necessary to use stones which do not touch each other. The method is restricted to areas wich are not too rich in stones and boulders.
ETUDE DES VERSANTS ET DYNAMIQUE FLUVIALE 179
On mapping of river bank conditions
Contribution by Walter TILLE, Leipzig
Mapping of river bank conditions have been carried out for some years in Thuringia. In addition to the use for hydraulic engineering projects, the data provided information on geomorphologic questions, especially the regional distribution of river bank conditions, excess of river bank damage, and forms of river bank vegetation and their functions.
The mapping is dome in cooperation with the Institute fuer Landesforsehung und Na-turschutz, Halle/S. der Deutschen Akademie der Landwirtschafswissenischaften zu Berlin The categories of observations include morphology of river banks, local conditions of river banks, river width, depth, flood plain level, mean water depth, middle water level, slope conditions of the banks, texture of bank and bed, places of deposition.
Also observed are the state of river construction, degree of regulation, cross sectional profile, occurences of revetments, weirs, levees, or other engineering works. Also observed are the state of erosion, type and degree ,of damage to river banks, particularly through lateral erosion and bank undercutting. The present state of bank vegeation is observed, including types of woods, assemblage of species, occurrence of shrubs and grass, and river border vegetative type.
The ground survey is done by plotting on topographic maps, scale 1:25,000 ; field records are kept on standard forms. There is a place on the former however for additional detail not contained in the usual field observations.
The advantage of the procedure is that one can find from such maps a general view about the status and forms of river banks. A trained map plotter can work out 20 river kilometers per day. The disadvantages of the method are that the plotting has to be adapted differently to the various pecularities of each river reach. Also there are numerous transition types wich permit a large amount of leeway for subjective assessments.
CREST STAGE GAUGE
Contribution by J.G. CUMMING, Sheffield, U.K.
The data acquired from any crest stage gauge is essentially limited and thus both instruments described here have been made with the following factors in mind : i) cheap
\ construction, ii) easy installation, and iii) \ rapid reading.
Crest Stage Gauge for well-formed channels
The following materials are required for construction :
1) Aluminium tubing (1.625 ins. in internal dameter) ; 3 ins. longer than the height range required.
2) Straight alloy rod (0.125 ins. diameter) of the same length as i.
3) Rubber or table-tennis ball (1.5 ins. in diameter) to act as a float.
4") Pen and steel fitment. 5) Steel casing and runners for 4) . 6) Aluminum cylinder for chart.
The main features of the gauge are shown in Figure 1. The float which supports the alloy rods is enclosed in the length of aluminum tubing. A cover over the upper end of the tubing has one central hole through which the alloy rod protrudes. The recording pen on the steel runners is then attached to the end of the alloy rod. Thus as water enters the lower end of the tubing, the float rises and pushes the alloy rod and pen upwards (exploded view). A chart is wrapped around the recording cylinder which is then attached to the instrument so that it presses against the stylus (open view). Thus on the rise and fall of the water-level a vertical line is marked on the chart.
In order to decrease the effect of turbulence on the reading of the instrument the lower end has been covered with a steel plate in which a number of small holes have been drilled. The effect of these restricted openings is to damp down the movement of the float.
When installed the whole of the upper portion of the instrument is protected by a steel casing which shields it from the elements and allows the instrument to be locked (closed view).
Installation and operation.
The instrument may be attached to a steel frame which is firmly driven into the bank. It has been found that comparatively light frames of slotted angle steel (Dexion Ltd.) , secured to one bank withstand high flows. Once installed the instrument requires very little attention. When read, the recording cylinder is merely rotated so that the stylus begins to mark a new vertical line. When one chart is complete both cylinder and chart are removed and replaced by a second cylinder with a new chart. The use of two cylinders is very convenient and saves a great deal of time in the field.
180 STUDY OF SLOPE AND FLUVIAL PROCESSES
"Vv̂ • 'jL^^fS^^^T-'^^^lW^
y
Limnigraphe, ouvert a gauche, decortique aujcentre, pour montrer lafplume, le cylindre et le flotteur, en bas et a droite, installe
The instrument as described above has a potential range of approximately 5 feet. The limitation of range is due to the increasing weight of the alloy rod as longer lengths are used. Depending on the channel under study a wider tube and larger float could be utilised although this will also increase the cost of the instrument. The limitation of reading as regards low flows depends on the size of the float. Thus, for a float 1.5 ins. in diameter, the instrument should not be used for depths below approximately 3 ins.
The instrument described provides accurate information concerning maximum and minimum water levels while remaining simple in design and inexpensive in construction.
Crest Stage Gauge for narrow cross-sections or small pools.
This instrument is designed for cross sections under 5 ft. in width. It is both easier to construct and cheaper than the larger gauge and may thus be used in greater numbers. The following materials are required for construction.
1) Aluminum tubing (1.125 ins. internal diameter) 6 ins. longer than the height range required.
2) A length of straight alloy rod (0.0625 ins. in diameter) 2 ins. longer than 1).
3)
4) 5)
Float of cork of maximum diameter 1 in. Steel blade. Additional steel fittings and covers (made up as required).
Figure 2 shows the main features of the gauge. The float supports the alloy rod and both are enclosed in the aluminum tubing.
b/nejed
//ay rod
alum/Hunt fubina up to 3&/*. Sony
Cork" //oat
Split"pin supports perforated, p/afe
Two Trres or C*e?r-STAGE GAGC
FIG. 2. — Deux types de limnigraphe a maximum. , En haul, a gauche, couteau sur une charniere. A droit*,
dans l'ordre : tige d'alliage, tube d'aluminium pouvant•; atteindre 36 m de long, flotteur en liege, barre a fente soutenant une plaque perforce.
ETUDE DES VERSANTS ET DYNAMIQUE FLUVIALE 181
The lower end of the tubing is covered with a steel plate with only a few small perforations to allow the water in and out to decrease the effect of turbulence.
The upper end of the tubing is covered by a steel plate through the center of which the alloy rod protrudes. Brazed onto the
, cover is a fixed right-angled fitment and a hinged plate whose end nearest the alloy rod is sharpened. Thus, as the water level raises the cork and rod, the hinged plate lifts and allows the rod to rise. However, when the Water-level falls the rod is trapped between the knife-edge and the fixed angle-plate. The instrument is then read by measuring the
. length of the rod above the base plate. This is done by resting a rule on the base and sliding a horizontal arm down the rule until it touches the top of the rod. The weight of the alloy rod considerably reduces the buoyancy of the cork so that this gauge is less sensitive than the larger instrument.
Installation and operation.
The gauge is attached to a frame of slotted angle steel (Dexion, Ltd.) which is fixed firmly in the bank. Once installed the only necessary attention is the regular oiling of the hinge. The knife-edge should function properly for many months without reshar-pening. It has been found that vibration of the instrument due to water-flow or wind does not disturb the reading.
Although the instrument described above has a range of probably no more than 3 feet it is felt that it is very suitable for use in small pools whose levels can be rated to natural or artificial weirs. Its great advantages are its extreme simplicity, cheapness and accuracy. A greater height range can of course be achieved, using wider tubing and a larger float.
An instrument of similar design but with the knife-edged blade hinged downwards, to show minimum flow, has been tested but it was found that with the rising stage the buoyancy of the cork overcame the fractional resistance of the knife-edge and it has not proved to be effective.
Cresl stage gage of U.S. Geological Survey
Contribution by L. B. LEOPOLD
A galvanized iron pipe about 2 inches in diameter but to a length of 3-6 feet, depending on how much rise in water level is expected. The pipe is threaded at each end and furnished with a screw cap at top and bottom.
Several small holes are drilled near the bottom of the pipe to allow entrance and exit of water. A hole is drilled in the cap at the top to allow exit of air.
A few cc of ground cork or other light, floating material is put at the bottom of the pipe when in a vertical position. The cork may be put in the base cap before the cap is screwed on or simply poured in the top of the pipe.
A wooden stick just the length of the pipe is put inside of it. The stick stands on the bottom cap and is prevented from floating upward by the top cap.
The pipe is attached in a vertical position to a tree or bridge abutment. The bottom cap is slightly above water surface at low flow.
SUSPENDED SAMPLER
Contribution by P. Asher SCHICK, Jerusalem (Israel)
This is a modified use of the standard automatic single stage sediment sampler used in the United States. It was designed primarily for desert streams where personnel is scarce and floods are very violent and short-lived.
Three types are in current use : type « Hayim 4 » with 8 bottles ; « Hayim 5 » with 4 bottles ; amd « Hayim 6 » with 2 bottles. All types are housed in a 6-inch diameter iron pipe, thickness 4 mm. The water intake pipe 1 is brass, 9 mm outer diameter, 7 mm inner diameter. The air exhaust pipe E is plastic, diameter 6 mm. The difference in elevation betwen two successive intakes is 25 cm. All types use standard one-liter plastic bottles.
Type « Hayim 4 » (8 bottles) is in use in large stream channels where a stage of 2 meters is likely. It is usually fastened to a bridge pier, and the base B is absent. T h e housing for the separate air exhaust pipes H is also mostly absent, and the pipes are fastened individually to the side of the bridge. Their end is turned down to prevent direct rain from draining there from the bridge.
Type « Hayim 5 » (4 bottles) is in use in medium streams where a stage of one meter is likely. It is usually emplaced in a hole in the channel bed up to one meter deep, and secured with big stones and concrete tied to cross iron bars going through holes across the base part of the pipe. The exhaust housing is 60 cm long. The base B is one meter long,
182 STUDY OF SLOPE AND FLUVIAL PROCESSES
but may vary according to bedrock conditions.
Type « Hayim 6 » (2 bottles) is in use in small streams, often in en echelon batteries of two or three instruments if fine sampling,
For streams with much coarse material the siphon « I » may be made smaller than the usual 9 cm. In that case a variant of type « Hayim 6 », opening upwards, enables the emplacement in such an elevation that the bottom bottle is below channel bed, and its intake only a few centimeters above it.
On the inside of the pipe a white or yellow strip is painted vertically. This serves as a crest stage gauge.
The instrument holds well against vandals, with the possible exception of the uncovered exhaust pipes in type « Hayim 4 ».
Production prices are : « Hayim 4 « - IL 120 ($40) ; « Hayim 5 » - IL 100 (about $30) ; « Hayim 6 » - IL 65 (about $20) .
BEDLOAD TRAP
Contribution by P. Asher SCHICK, Jeruscdeim (Israel)
A simple trap to collect bedload moved by flash floods in ephemeral streams is built of an iron frame with a galvanized wire netting,
Lengths in cm. Preleveur de suspension (longueurs en cm)
i.e. one sample for every few centimeters of stage, is required. This type has no base, and the exhaust housing is 30 cm long. The instrument is fastened by bolts to a stake at the downstream side of the pipe. The stake is driven into the channel bed.
Q £
£0
U^ z
30
A Bedload trap Lengths in cm.
Trappe a sediments de fond (longueurs en cm)
ETIMJE DES VEJRSANTS ET OYNAMIQUE FLOTIALE 1<88
diameter 3 mm. The opening of the netting may be varied to fit local conditions. We use 35 mm and 50 mm openings.
The trap is secured to the channel bottom by four long iron angle stakes driven into the ring openings at R.
The trap is often filled to capacity even by moderate floods. The capacity per unit strip of channel may be enlarged by lengthening the trap. In that case, however, the top part of the trap must be made removable in order to enable the taking out of the material trapped. This may be done by hinges along the side. The 60 cm length is the maximum length still permitting easy cleaning through the upstream opening.
The cost of one unit is IL 20 (about $ 7 ) .
PHIOBESCENT SAND
Cqntribution by P. Asher SCHICK, Jerusalem (Israel)
(*) YASSU (W. E.), Fluorescent coalings on coarse tediments : an integrated system.
Tech. Rept., no. 1, Project NR 388-057, Office of Naval Research, Geog. Branch, 1962.
Tests in streams with drainage areas of a few square kilometers showed that even for streams of this size the quantity of dyed sand injected must be quite large. Even after a moderate flow only a tiny fraction of the grains are retrieved by bulk sampling and much less by top layer sampling. Top layer sampling was done with a greased bottom of a paper cup which, when pressed on the botton of the stream, attracted a single grain layer of sediment. The color seen by daylight is so good that the use of fluorescence with the aid of a UV light seems unnecessary.
Measurement of rainfall and runoff
Contribution by Dr. WERNER, Leipzig
Observations have been made on small plots of ground subjectid to natural rainfall. The plots, or land parcels, measure 2 X 10 meters. In the cases investigated the ground slope averages 7 degrees. The plots are surrounded by wood rails or boundaries. The vegetation is completely cleared from the plots.
All runoff of water and sediment are collected at the dowstream end in 200 dem3 galvanized kegs.
The following measurements were taken regularly or immediately after a rainfall event which had caused erosion : Soil moisture, every 10 days a soil moisture sample is taken at a different position at the upper end of the dry plots ; rainfall direction, precipitation intensity is recorded on a weekly chart : water runoff and quantity of eroded soil ; grain size analysis including the clay fraction is obtained. Organic materials are measured, also the nutrient content is obtained by chemical analysis, especially P2Os and K20.
These runoff plots have been set up on different soil types in Thuringia.
A sample of the data obtained on erosion is shown in the attached figure.
SAMPLE OF RAINFALL ANJ? FUMOFF PArA fi-got* M/4.{.stPE PLOTS
Exemple de donn^es de pluviometrie et de ruissellement a partir de parcelles sur une pente
Colonnes, dans l'ordre : Date. Intensite des precipitations en millimetres/minute. Coefficient d'6coulement. Precipitations en millimetres. Ecoulement en millimetres. Materiel entrafne en kilogramme par 20 metres carrfe.
On rainfall simulation Contribution by Rorke BRYAN, Sheffield, U.K.
A compact rainfall simulator has been designed for use in laboratories where fall-height is limited. Experiments had shown that a
water-drop of 4.0 mm diameter could attain 83 % of the terminal velocity of a raindrop of the same diameter in a fall-height of 1.66 m, and the instrument was based on this fall-height. The unit is built around a framework of angle steel measuring 216 X 121 X
ETUDE DES VERSANTS ET DYNAMIQUE FXUVIALE 185
63 cms. At a height of 38 cms in this framework a 121 X 63 X 15 cm galvanized tank is suppported on a rubber lined mounting. At one end of this tank a 38 X 38 X 10 cm tray is mounted, fitted with movable splash screens. This tray is mounted on a pivot and by use of a worm assembly its inclination can be varied from - 1° to + 32°. The base of the tray is angled to form a gutter leading to a 2.5 cm exit pipe. Inside the splash tray a removable 30 X 30 X 10 cm sample pan is mounted on raised studs. In this pan a 7.5 cm deep sample is placed above a 2.5 cm layer of glass beads and filter paper which prevent the sample sliding at high inclinations. The base of the sample pan is perforated to allow free drainage of the soil sample. Soil splashed and washed off the sample passes with the runoff through the exit pipe to a container beneath the galvanized tank. A separate drainage pipe in the galvanized tank carries away water falling outside the splash tray.
A number of commercially obtainable spray heads were tested, but were found to be unsuitable. Subsequently a series of spray units were built out of 9.5 mm diameter copper piping. The unit finally incorporated consists of two pipes set horizontally in staggered formation, from each of which six 1.25 cm lengths of 4.7 mm diameter copper piping project upwards. The ends of these short lengths are brazed, then drilled with 1/64 th and 1/32 nd inch drills. This gives two banks of jets of different sizes which produce two ranges drop-size. The 1/32 inch jets give a range1 from 0.84 mm to 3.98 mm diameter, while the 1/64 inch jets give a range from 0.67 mm to 2.87 mm diameter. From the jets water is projected upwards in an arc the apex of which is 1.66 m above the surface of the soil in the sample pan.
The 9.5 mm diameter copper pipes are brazed at one end, while water is supplied from mains through polythene piping at the other end. The pipes are set in greased «Nylotron » bearings so that they are free to rotate. The actuating mechanism for rotation is a piston and bell-crank linkage driven by an electric motor geared to 6 r-p.m. The mechanism rotates the pipes through an arc of 5° allowing the rainfall to cycle on and off the sample six times per minute, giving a rainfall intensity of 5 inches per hour.
The steel framework is sheathed on three sides by sheet aluminum, while a perspex screen on the fourth side allows observation of the sample. A 71 X 71 cm door on one
side allows access to the sample, and also serves as a rainfall shut-off mechanism. A splash-hood built above the main framework to a height of 46 cms also serves as a da tum for adjustment of the apical height of the water arc.
The testing of soil samples on the rainfall simulator follows a standard procedure, which the soil sample is first air-dried, then passed through a 6.35 mm diameter sieve. Each sample is first subjected to a 30 minute period of rainfall, then after an interval of one hour, to a one-hour period of rainfall. After a further interval of 15 minutes, the sample is subjected to a final hour of rainfall before drying under infra-red lamps. Soil removed from the sample is collected, and after separation from runoff is oven dried and weighed.
This instrument was designed and built by Mr. C. Fletcher, Senior Technician in the Department of Geography, Sheffield University, to comply with specified research requirements.
OTHER INVESTIGATIONS
Slides and Mudflows
Contribution by Th. PIPPAN, Salzburg
By collecting numerous data from historic and present sources a possibility is opened to trace processes of slope development through long periods of time and to comprehend them quantitatively to a certain degree. Slides and mudflows as the most important factors of recent relief forming have been studied in the Alps of Salzburg. To comprehend their effects as to quantity, information has been collected from the River Control Authorities, the Austrian Federal Railways, from scientific papers, newspaper articles, and from the Record Office covering the period from 1567 to 1961. In this way more than 100 items concerning slides and mudflows have been filed. The author marked the localities at which such processes occurred by symbols on a map of the Federal Country of Salzburg 1. This way the areas in which mass movements have been checked ra ther often stand out conspicuously. Considering the geological conditions of these places is could be stated that such processes show a maximum recorded
(1) PIPPAN (Th.), « Beitrage zur Frage der jungen Hangformung und Hangabtragung in den Salzburger Alpsen », Nachrichten d. Akademie der Wissenschaften in Gottingen. II. Mathemat.-Physikal. Klasse no. 11, Jabrg. 1965, pp. 163-183.
tm STUD* CT SWFE*AN* FfctrVfAE. PROCESSES
frequency where soft, teetonically shattered* thiniy bedded to foliated rocks as slate and phyUite occur, which is the case at the northern edge of the Hohe Tauern and in the Palaeozoic Greywack Zone. At places where permeable limestone is located upon impermeable slate or phyllite which rocks, when intensively soaked by rains provide a sliding chute, mudflows and slides develop easily. Such conditions prevail at the southern slopes of the High Calcareous Alps above the Greywacke Zone.
From the exploitation of more than 100 data from the period between 1794 to 1961 it resulted that a total identifiable mass of about 15*5 mill, cbm has been moved during this time. The highest values of rock waste transported by slides and mudflows occur where large screes at the foot of rock faces are ready to be removed, as in the High Calcareous Alps or a considerable reservoir of fluviatile loose sediment is available as for example the Riss-Wiirm Interglacial gravels at the slides of Embach E of Zell am See. In the soft phyllites at the northern margin of the Hohe Tauern too a vast quantity of scree develops in a short time.
Investigations as described above could be extended over additional areas and exploited by comparative research.
Oh engineering-geological survey of landslides1 in Czechoslovakia
CoHfribtition by JarosHav P'ASEK, Jan RYBAR,
Prague
The study of landslides has a long tradition in Czechoslovakia, On our territory there exist exceptionally favorable conditions influencing the development of landslides. The areas of Cretaceous and Neogene deposits, volcanic mountains, and lignite basins are all affected by landslides. Most commonly, however, landslides occur in the Flysch sediments of the Carpathian System.
Some heavy disasters caused by landslides, the la-si and largest one in Handlova in 1960, showed the necessity of a preventive survey of all Czechoslovak landslide areas.
In the years 1962-1963 the registration of all important landslides and landslide areas was undertaken. Field research was carried out by about 30 research workers from several engineering-geological institutes on the basis of prepared methodical instruc
tions. More than 9000 landslides in a total extent of nearly 600 square km/i.e. 0,47 % of the Czechoslovak territory were ascertained. Every landslide was entered onto the topographic map 1 : 25,000 in given colors and symbols. The mapped landslides wefe numbered and their description was filed on registering cards containing tfttf most important data on the slide, as its situaJ
tion and type, the geologic, geomorphologid and hydrogeologic features. The results of this research - the maps and the register - are deposited in the Central Geological Archives (GEOFOND) in Praha and Bratislava and serve as basis for country planning and for the design of constructions.
The landslide registration was followed by a systematic thorough investigation of the problems connected with the origin and development of landslides. This task was pursued by the Engineering-Geological Department of the Geological Institute of the Czechoslovak Academy of Sciences on the following lines. Several typical landslide areas were chosen in differing geologicail units for continuous! investigation. This was accompanied by an evaluation of the plentiful data that were entered on the registering cards during the registration, and by the study of some theoretical problems in the laboratories.
The field research is based on the engineering-geological mapping on the scales 1:10 000, 1 :5 000, 1 :2 000, or even on lesser scales. If possible, aerial stereoscopic photographs are made use of. The results of the mapping are supplemented by geodetic measurements that enable to obtain longitudinal and transversal sections of the area. Surficial movements are geodetically measured on all the investigated slopes. The geologic features and the mode of disposition of the slide masses are studied in test pits or bore holes and by geophysical methods.
Investigations of the deformation of shores of future water reservoirs in areas of weakly consolidated clayey sediment have also been started.
In Tertiary clayey sediments fossil slope movements, exposed in the walls of opencast coal mines, are studied to compare them with recent slides.
The influence of climatic factors, as well; as the changes in the physico-mechanical and geo-electrical properties of rocks and their dependence on the mineralogical and petro* graphical composition are also investigated*
ETUDE DES VERSANTS ET DYNAMIQUE FLUVIALE 187
Slope movements and recent uplift
Contribution by Th. PIPPAN, Salzburg
In areas of recent uplift, as in the Narrows of Taxenbach in the Salzach Valley E of Zell am See where tectonic movements have been active since the Preglacial slope and river bank slides, mudflows, slope pressure and rock falls happen frequently. Such processes are indicated by tilted and stilted tree t runks at moving slopes as in the slides area of Embach, by bulges at the valley sides produced by sliding, by sagging of the federal road checked by the position of ancient curbstones now located 4 m below the present road level, and by the shifting of berms (made of concrete) up to 1,5 towards the bed of the Salzach. Further symptoms of recent slope movements are fissures and soil subsidence at the upper edge of the slides of Embach. The annual transport of the gravel mass at the foot of this unsettled area attains some dm. By the advance of the sediment body towards the Salzach its bed has been reduced by half .of its original width. Morphologically the recent uplift area of Taxenbach is marked by parmenent fluvial downward erosion, slope disturbance, over-steepened valley sides even in soft rocks and by a narrow gorge section of the valley.
According to the technical report 1961 of the River and Avalanche Control Authority for the Lower Pinzgau in Zell am See the Salzach gauge at Lend showed an average annual downward erosion by 5,3 c m . from 1886 to 1925 and a permanent erosion of 2,1 cm since 1911. At the uplift center of Embach this value attains up to 4 cm, at the foot of the slides up to 5 cm.
On climatic control of mass movements
Contribution by Th. PIPPAN, Salzburg
Generally south-facing strongly desiccating slopes as well as valley sides exposed towards rain-wind from west and northwest and located above the timber line are especially attacked by denudative processes. This fact points to the importance of precipitation for sliding and mud flows. These relations have been investigated by tracing 107 cases covering the period from 1567 to 1961. As far as possible the amount of precipitation for the days on which such mass transport occured has been checked for the place concerned or the nearest climatic station. Generally it could be stated that mudflows and slides often are associated with heavy rains caused by thunderstorms or eventually
with permanent rains which produce floods. The comparison of the graph of precipitation with that of mudflow activity (Pippan Th., 1963, p. 178, fig. 8) shows that the maximum of this process occurs in the month with the maximum amount of precipitation which is July, when 15 % of the annual precipitation and 28 % of mudflowing are reported. A secondary maximum can be stated in August. These two months are often marked by thunderstorms with heavy rains and sometimes by permanent precipitation and floods. Usually mudflows occur in summer after a hot dry period during heavy rains caused by thunderstorms.
On slope development in cirques and trough •alleys
Contribution by Th. PIPPAN, Salzburg
The tectonic and lithologic control of cirque and trough wall development has been investigated by comparative studies in the mountains of the English Lake District and Norway, in the Bohemian Forest .of Germany and Austria and the Hohe Tauern in Salzburg. Besides the results of field work numerous large scaled maps have been exploited. By a great number of cross sections drawn in areas varied as to lithological and tectonical conditions the different slope angles have been compared, the data utilised by way of statistics and represented by many graphs. The present writer had the honor to report on this research at the VII Inqua Congress in 1965 (Tectonic and lithologic control on cirque and trough shaping in Caledonian, Hereynian, and Alpine Mountains of Europe. Abstracts, Internat. Assoc, for Quatern. Research, VII Internat. Congr., General Sessions, Boulder and Denver, Col. U. S.A., 1965. Paper in extenso in print at the Proceedings, Volume 10, VII Inqua Congress, published by the Indiana University Press, 1967). As results of these studies the following facts could be stated.
1. Steep cirque walls occur especially in areas of young tectonic culmination where the valley heads retreated upwards quickly and have been reshaped by local glaciers. Particularly high slope angles are represented where the cirque faces coincide at places with steeply dipping slab-, joint-, or movement-planes of the rock. With tectonically shattered material the slopes are disguised by scree. In fold bends conspicuously semicircular cirque walls develop. In the Bohemian Forest which experienced moderate young uplift and therefore slight glaciation
188 STUDY OF SLOPE AND FLUVIAL PROCESSES
only few real cirques with walls of a relatively low gradient developed.
The lithologic conditions too control the slope features of the cirques. Especially favorable for the shaping of steep faces is uniform hard rock, e.g. granite, gneiss, basic green rocks or limestone. In soft material the slope angles are much lower.
2. Concerning the slope development in trough-shaped valleys comparative investigations had the following results :
Where by immediate preglacial uplift the last valley floor had been cut by streams as in the Hohe Tauern and marginal areas of the Norwegian mountains, troughs with shoulders originated which developed from the remnants of the dissected earlier valley floor. If a shallow furrow-like cross section upon an old land surface had been redissec-ted shoulderless troughs originated, e.g. in central Jotunheimen. In tectonic depressions being occupied by broad valleys of a low bottom gradient the trough features are not well developed because the flow speed of the Pleistocene glaciers was too low. With mylo-nitie zones too no steep trough walls develop. The glaciation of the Bohemian Forest was too insignificant as to produce U-shaped valleys.
In troughs whose walls parallel the strike of steeply tilted joint-, bedding-, or movement-planes, the slope angles are especially high and the sides glacially polished. If
steeply dipping, tectonically shattered, foliated rocks cross the course of a valley the glacial polish is insignificant. With a series of flags representing an imbricated structure of high dip and striking across the river the trough shape shows only at bastions which project from the valley sides. Between the bastions caused by the tectonic change of rocks of variable resistance deep gullies can be eroded whose sides may follow joint- or movement-planes. Under such tectonic conditions no uniform smooth trough wall is formed. With flatly bedded rocks of changing resistance rough, stepped valley sides developed.
The lithologic control on the shaping of trough walls has been studied by many cross sections of various areas. The narrowest troughs with steepest faces develop with uniform, hard granite, gneiss, gabbro, limestone, and quartzose rocks. With increasing metamorphosis the resistance of the different rocks is uniformised to a great degree which fact favors the origin of typical troughs. An example provides the old rocks of Jotunhei-memt. In areas of soft materail nearly always slopes of low gradients occur if young uplift has not rejuvenated fluvial downward erosion as is the case in the Taxenbacher Narrows.
On these problems concerning the development of trough and cirque slopes controlled by lithologic and tectonic conditions further research in other areas of the world would be instructive.
La table des matieres pour Ycaua&e 1867
paraftra dans le prochcrin numero
Le Gerant: R. CONSTANS.
Imprimerie Jacques et Demontrond, Besangon. — N" 2202. — Depdt tegal 2° trimestre 1968: n" 7703.