Field Study Evaluation of Cepstrum Coefficient Speech Analysis for Fatigue in Aviation Cabin Crew Harold P. Greeley, 1 *Peter G. Roma, 2 Melissa M. Mallis, 2 Steven R. Hursh, 2 Andrew M. Mead, 3 Thomas E. Nesthus 3 1 Response Applications, LLC Hanover, NH 03755 2 Institutes for Behavior Resources Baltimore, MD 21218 *Corresponding Author ([email protected]) 3 Civil Aerospace Medical Institute Federal Aviation Administration Oklahoma City, OK 73125 October 2013 Final Report DOT/FAA/AM-13/19 Office of Aerospace Medicine Washington, DC 20591 Federal Aviation Administration
Transcript
Field Study Evaluation of Cepstrum Coefficient Speech Analysis for Fatigue in Aviation Cabin CrewHarold P. Greeley,1 *Peter G. Roma,2
Melissa M. Mallis,2 Steven R. Hursh,2
Andrew M. Mead,3 Thomas E. Nesthus3
1Response Applications, LLCHanover, NH 037552Institutes for Behavior ResourcesBaltimore, MD 21218*Corresponding Author ([email protected])3Civil Aerospace Medical InstituteFederal Aviation AdministrationOklahoma City, OK 73125
October 2013
Final Report
DOT/FAA/AM-13/19Office of Aerospace MedicineWashington, DC 20591
Federal AviationAdministration
NOTICE
This document is disseminated under the sponsorship of the U.S. Department of Transportation in the interest
of information exchange. The United States Government assumes no liability for the contents thereof.
___________
This publication and all Office of Aerospace Medicine technical reports are available in full-text from the
Civil Aerospace Medical Institute’s publications website: www.faa.gov/go/oamtechreports
i
Technical Report Documentation Page1. Report No. 2. Government Accession No. 3. Recipient's Catalog No.DOT/FAA/AM-13/194. Title and Subtitle 5. Report DateField Study Evaluation of Cepstrum Coefficient Speech Analysis for Fatigue in Aviation Cabin Crew
9. Performing Organization Name and Address 10. Work Unit No. (TRAIS)1Response Applications, LLCHanover, NH 03755
2Institutes for Behavior ResourcesBaltimore, MD 21218
3FAA Civil Aerospace Medical InstituteP.O. Box 25082
Oklahoma City, OK 73125
11. Contract or Grant No.
12. Sponsoring Agency name and Address 13. Type of Report and Period Covered
Office of Aerospace MedicineFederal Aviation Administration800 Independence Ave., S.W.Washington, DC 20591 14. Sponsoring Agency Code
15. Supplemental Notes
Work was accomplished under approved task AM-A-08-HRR-52116. Abstract
Impaired neurobehavioral performance induced by fatigue may compromise safety in 24-hr operational environments such as aviation. As such, non-invasive, reliable, and valid methods of objectively detecting compromised performance capacity in operational settings could be valuable as a means of identifying, preventing, and mitigating fatigue-induced safety risks. One approach that has attracted attention in recent years is quantitative speech analysis, but the extent of its operational feasibility, validity of the metrics, and sensitivity to operationally-relevant factors in aviation remains unknown. To this end, the present report offers an initial proof-of-concept evaluation of a speech analysis method based on Cepstrum Coefficient modeling,using voice files from a broad sample of 195 cabin crew personnel collected during the 2009-2010 U.S. Civil Aerospace Medical Institute-sponsored Flight Attendant Field Study (Roma et al., 2010).
Using a personal digital assistant device, participants recited five standardized phrases in random order before and after each workday and sleep episode throughout their respective 3-4 week study periods.Operational acceptability of the procedure was high, as indicated by high protocol compliance and, despite the inherent variability of the timing and environments in which the test sessions occurred, the 13,975 files from 2,795 valid sessions were of sufficient quality for formal analysis. Individualized “baseline” speech models were built from the files collected during test sessions coinciding with optimal neurobehavioral performance, as determined by 5-min Psychomotor Vigilance Test (PVT) reaction times (RT), then speech deviation scores relative to individual baseline models were calculated for the test sessions that preceded and concluded each “trip” of multiple consecutive work days. Regarding validity, speech scores correlated significantly with PVT RTs and Lapses (RTs > 500 msec), with a stronger relationship to Lapses, but high variability at the low range of both performance variables suggests the influence of other factors. Regarding sensitivity to operational factors, average Pre-Trip vs. Post-Trip speech scores differed significantly, although scores unexpectedly decreased from Pre to Post, an artifact attributable to the composition of the baseline session pool.Nonetheless, the pattern of speech data echoed performance data from our previous report in which scores were most affected in crew of Regional carriers, with Junior seniority, and in Domestic operations.
These initial results reveal promising validity and sensitivity of Cepstrum Coefficient modeling for speech signal analysis of fatigue in dynamic operational environments. Remaining questions underscore the need to further explore the dataset to determine the precise relationship between speech production and neurobehavioral performance capacity, the parameters for constructing individualized models, and standardized quantitative speech-based definitions of fatigue.17. Key Words 18. Distribution StatementFatigue, Speech, Aviation, Cepstrum, Reaction Time, Neurobehavioral Performance, Safety, Sleep
Document is available to the publicthrough the Internet:
www.faa.gov/go/oamtechreports19. Security Classif. (of this report) 20. Security Classif. (of this page) 21. No. of Pages 22. Price
Unclassified Unclassified 16Form DOT F 1700.7 (8-72) Reproduction of completed page authorized
iii
ACKNOWLEDGMENTS
We thank all of our flight attendant participants for their time, contributions to the project, and dedication to their
profession. We also thank Wendy Krikorian and Dr. Francine James for conducting informed consent interviews, as well
as Lena Dobbins and Kali Holcomb at the Civil Aerospace Medical Institute, and Carrie Roberts and Suzanne Thomas at
Xyant Technology for their contributions to participant training. We are especially indebted to Marta Genovez and Zabecca
Brinson for the quantity and quality of their manual data processing work.
v
Field Study Evaluation of Cepstrum Coefficient Speech Analysis for Fatigue in Aviation Cabin Crew
CONTENTS
Introduction --------------------------------------------------------------------------------------------------------------- 1Method ---------------------------------------------------------------------------------------------------------------------- 1 Participants, Materials, and Data Collection ------------------------------------------------------------------------- 2 Data Selection ------------------------------------------------------------------------------------------------------------ 2 Cepstrum Coefficient Speech Analysis -------------------------------------------------------------------------------- 3 Statistical Analysis -------------------------------------------------------------------------------------------------------- 5Results ----------------------------------------------------------------------------------------------------------------------- 6 Operational Feasibility -------------------------------------------------------------------------------------------------- 6 Relationship With Neurobehavioral Performance Measures ------------------------------------------------------- 6 Sensitivity to Operationally-Relevant Factors ------------------------------------------------------------------------ 7Discussion ------------------------------------------------------------------------------------------------------------------- 9References -----------------------------------------------------------------------------------------------------------------10
1
Field Study evaluation oF CepStrum CoeFFiCient SpeeCh analySiS For Fatigue in aviation Cabin Crew
INTRODUCTION
Numerous factors can affect safety, performance, and quality of life in individuals working in 24-hr operational en-vironments such as industrial shift-work, military, health care, law enforcement, space exploration, and transportation. One issue receiving increasing attention in commercial aviation is fatigue (Mallis, Banks, & Dinges, 2010). Fatigue is generally defined as a state of tiredness due to prolonged wakefulness, extended work periods, and/or circadian misalignment, and is characterized by decreased alertness, diminished neurobehavioral performance, and impaired decision-making (Åkerstedt, 1995; Dinges, 1995). The very nature of 24-hr operational environ-ments superimposed against human circadian physiology all but guarantees the systematic production of fatigue. As such, non-invasive, reliable, and valid methods of objectively detecting compromised performance capacity in applied settings could be valuable as a means of identifying, preventing, and mitigating fatigue-induced safety risks.
One approach to assessing fatigue that has attracted interest in recent years is quantitative speech analysis. To clarify, the terms “voice,” “language,” and “speech” are often used interchangeably in everyday conversation, but they are not synonymous and must be differentiated when considered in a scientific context. As sum-marized by the U.S. National Institute on Deafness and Other Communication Disorders (NIDCD; http://www.nidcd.nih.gov/health/voice/whatis_vsl.html), voice is the sound produced by simultaneous use of the lungs and vocal folds in the larynx (i.e., “voice box”), whereas language is the use of spoken or written symbols (i.e., words) to express, experience, describe, and share knowledge, beliefs, and behaviors. Speech per se is the oral pro-duction of language through precisely coordinated muscle actions in the head, neck, chest, and abdomen to shape the resulting tones created by the voice into any number of specific decodable sounds. Simply put, speech is how voice becomes language. For those interested in fatigue assessment, speech production is an appealing candidate variable for analysis in operational settings because it is a naturally occurring and virtually universal behavior in adults, it requires no workplace-specific training, and data collection is inherently non-invasive. Moreover, because speech is the principal mode of communication in aviation and other operations leads to the exciting prospect of developing broadly applicable tools not only for pre-work “fitness for duty” tests, but also completely unobtrusive, real-time on-duty assessments for centrally monitored or autonomous use.
With these long-range goals in mind, several innovative speech analysis methods are in the early stages of development. The leading methods as summarized by Polejaeva (2009) include acoustic analysis (e.g., Krajewski, Batline, & Golz, 2009), the Brown Lab Interactive Speech System (BLISS; e.g., Lieberman,
Morey, Hochstad, Larson, & Mather, 2005), Cepstrum Coef-ficient analysis (Greeley, Berg, Friets, Wilson, Greenough, Picone, Whitmore, & Nesthus, 2007), chaotic analysis (e.g., Shiomi, 2008), and landmark analysis (e.g., Boyce, S, MacAu-slan, Bradlow, & Smiljanic, 2008). Although a comprehensive technical review is beyond the scope of this report, we note that these methods all use the same input (recorded speech) but dif-fer from each other in required content and how the speech is mathematically analyzed, thus yielding method-specific quan-titative definitions of fatigue. Importantly, each method has its own constellation of features, advantages, and limitations, but all approaches have empirically demonstrated orderly variations as a function of fatigue, mostly in controlled laboratory studies of sleep deprivation and/or extended workload.
As with any science-based technology, developing fatigue-sensitive speech analysis methods and advancing them from the laboratory to dynamic operational settings are separate but equally challenging tasks. While the approaches outlined above have shown promise in laboratory and limited field applications, some critically important but unresolved issues include the extent of long-term operational feasibility, the validity of the metrics, and the sensitivity of those metrics to operationally-relevant factors. These issues apply as much to commercial aviation as to any operational context; hence, the purpose of the present report is to systematically address these issues in aviation context. Our technical focus for this initial effort is the Cepstrum Coefficient analysis approach, selected because of (1) its inherent ability to accommodate individual differences in speech production and (2) successful early development efforts demonstrated in FAA- and Air Force-sponsored sleep deprivation and restriction studies (Greeley et al., 2007). The source material for the study includes objective neurobehavioral performance data and >13,000 voice recordings from a broad and representative sample of 195 cabin crew personnel collected during the 2009-2010 Civil Aerospace Medical Institute-sponsored Flight Attendant Field Study (Roma, Mallis, Hursh, Mead & Nesthus, 2010). To the best of our knowledge, this is the first systematic large-scale field study evaluation of any fatigue-specific speech analysis method applied to 24-hr commercial aviation operations, and thus represents a seminal step in the development of this technology.
METHOD
All procedures described in this report were independently reviewed and approved by the Institutional Review Boards of both the FAA and the Institutes for Behavior Resources. The formal letters of approval from each institution are available upon request from the corresponding author. All data have been de-identified to protect the privacy of those involved in the project.
2
Participants, Materials, and Data CollectionWe refer the reader to Roma et al. (2010) for extensive
details on participants, materials, and data collection protocol for the CAMI Flight Attendant Field Study. Briefly, all eligible applicants were active U.S.-based flight attendants categorized according to three broad factors serving as the organizing frame-work for the study’s design and some of the results presented herein. These factors are Carrier Type (Network, Low-Cost, or Regional), Seniority (self-identified Senior 1/3, Mid 1/3, or Junior 1/3), and majority of Flight Operations (Domestic or International). The study was designed for a total of 210 flight attendants according to the schematic presented below in Figure 1, and a total of 195 flight attendants contributed analyzable speech and performance data for the present report.
Each participant was issued a custom-programmed touchscreen-based personal digital assistant device (PDA) for daily data collection (AT&T Tilt™, HTC Corporation, Taiwan). Participants were required to complete up to four test sessions per day throughout their individual 3-4- week study periods: Pre-Sleep, Post-Sleep, Pre-Work, and Post-Work. Participants were instructed to complete the Pre- and Post-Sleep sessions within ~15 min of going to bed and waking up, respectively. In addition, on work days, participants were instructed to complete the Pre- and Post-Work sessions within ~1 hr of “check-in” and “check-out” (the beginning and end of the entire duty day, respectively).
Each test session consisted of several core components, including a 5-min touchscreen-based Psychomotor Vigilance Test (PVT) programmed under the same parameters as the Palm-based PVT previously developed at the Walter Reed Army Institute for Research (Thorne, Hampton, Morgan, Skene, Arendt, 2005; Lamond, Dawson, & Roach, 2005) and effectively utilized for various field studies in 24-hr operational environments (Lamond, Petrilli, Dawson, & Roach, 2006; Ferguso, Lamond, Kandelaars, Jay, & Dawson, 2008). Each session also included standardized speech recordings, which were stored in uncompressed WAV
format on the PDA’s internal SD memory card. The speech sessions required recitation of five randomly ordered phrases designed for the study by H. P. Greeley (Response Applications, LLC; Hanover, NH, USA). These phrases were designed to limit “sing song” articulation often observed with phrases that are repeated over time. In alphabetical order, they are:• Go up the street to the shop and buy a pen and a map.• Mike drives the truck for a hundred miles without stopping.
But he radios two times a day to papa.• Patty has a multitude of sheep and a flock of geese so Mike
always has meat pie for supper.• The bed is new and will provide you with some good sleep.
The mattress and pillow are better than mine.• The child broke the toy with a pipe and put it in her mouth.
To maintain consistency across days, locations, and condi-tions, all participants were instructed to take their test sessions in a comfortable, normally lit environment with as few sensory distractions as possible. All participants were informed that safety and fulfilling their professional duties supersede all research requirements, and were explicitly instructed to never engage in study-related activities while actively engaged in or responsible for any work-related activities.
Data SelectionPVT. Each 5-min PVT session yields a number of output
variables, including mean reaction time per trial (RT, msec) and total lapses (RTs > 500 msec), which we used as objective neurobehavioral performance metrics against which to validate the speech analysis data.
Audio files. Throughout the course of the project, the study participants contributed approximately 10,000 complete test sessions yielding approximately 50,000 audio files. For each individual, we identified the top 10% mean RTs of all PVT ses-sions, and those sessions were used to define that individual’s optimum baseline neurobehavioral performance capacity. We then processed the audio files from those optimum baseline
Figure 1. Stratified field study design and target sample sizes.
[NSD] [NSI] [NMD] [NMI] [NJD] [NJI]
[LS] [LM] [LS] [RS] [RM] [RJ]
3
PVT sessions using Cepstrum Coefficient analysis methods (described below) to construct individualized speech models whose parameters served as the reference models against which all other selected speech was compared. For comparisons, we returned to the master session pool, selected those sessions mark-ing the beginning and end of each period of consecutive days in the field, and designated them as “Pre-Trip” and “Post-Trip,” respectively. Most Pre-Trip files were originally Post-Sleep or Pre-Work sessions (i.e., early in the day), and most Post-Trip files were originally Post-Work or Pre-Sleep sessions (i.e., late in the day). Most participants completed at least 3 trips during their respective study period.
Given the current lack of automated high-throughput analysis tools and the enormous number of audio files and po-tential comparisons, we focused on Pre-Trip vs. Post-Trip for this proof-of-concept study on the premise that Pre-Trip generally represents the work-related sessions of least fatigue whereas Post-Trip generally represents the work-related sessions of most fatigue, and thus comparisons between the two were the most likely of all comparisons directly influenced by field operations to yield effects. Ultimately, and in light of our previously reported field study data (Roma et al., 2010), we reasoned that if Cepstrum Coefficient analysis cannot detect at least a main effect of several consecutive duty days, then it would not warrant an investment in more detailed analyses.
Cepstrum Coefficient Speech AnalysisUsing the selected audio files described above, we ap-
plied voice comparison software to quantify changes in speech production as a possible result of work-related fatigue. Our ap-proach was based on the more broadly used Speaker Validation software algorithms used to verify the identity of the speaker. Conceptually, evaluating Pre-Trip and Post-Trip sessions relative to individualized baseline models in this way creates a process for quantifying the degree to which the affected individual is “not him/herself.”
Types of sounds versus individual phonemes. While there are 44 speech sounds (phonemes) that comprise Ameri-can English, we note that the speaker models do not identify specific sounds, only clusters of multi-dimensional data point pairings (described below). Speech sounds originate from a number of different physiological conditions and, as such, present as families of frequency range combinations or clusters. As reviewed in Lagefoged (2001), the two major divisions of speech sounds are (1) vowels, which are produced primarily by the vibration of the vocal cords, and (2) consonants, which are produced by the turbulent flow of air through constricted parts of the vocal tract (articulators such as the lips or tongue). These
can be further divided into pure vowels (such as /e/ in bed), diphthong vowels (such as /ai/ in time), which are chains of two vowels strung together, fricative consonants (such as /f/ in fish), produced by steady turbulent flow of air, and stop consonants or plosives (such as /p/ in push), produced by the buildup and sudden release of air. Consonants may also be voiced where the vocal cord is involved (such as /z/ in zip) or unvoiced where the vocal chord is not involved (such as /s/ in sip). Even these sound groups can be further divided. For example, fricative consonants may be categorized according to how an articulator is used to make the sound: A voiced dental fricative (such as /th/ in then) is created by putting the tongue between the upper and lower teeth, whereas a voiced postalveolar fricative (such as /ε/ in vision) requires a high-frequency component produced by placing the tongue directly over the sharp edge of the teeth. The model we ultimately developed was set to identify 16 “sound type” clusters, although this number is arbitrary and may be adjusted in future analyses to identify finer or coarser groupings, as suggested by the myriad speech sounds described above.
Speaker modeling. The speaker modeling algorithm is a variation of the classical Gaussian mixture model (GMM) structure originally described by Dempster and colleagues (Dempster, Laird, & Rubin,1977). GMMs are among the most statistically mature methods for clustering and have been widely implemented in applications ranging from financial modeling to medical image analysis. Access to the voice files from the top 10% PVT performance sessions allowed us to individually model each participant’s voice in a state of maxi-mum performance capacity and to use those models to quantify changes in speech production before and after work trips. This approach is a more integrated extension of the sound-by-sound (phoneme) approach used in our previous work (Greeley et al., 2007), although both processes begin with a quantification of voice by way of Mel-frequency Cepstral Coefficients (MFCC; Bridle & Brown, 1974; Mermelstein, 1976). For our purposes, clusters of MFCC components in multidimensional space are identified as unique speech sound types (see above). For our analysis configuration, the relative amplitude distributions of each of 20 MFCC coefficients were determined and grouped into one of 16 clusters for each sound uttered by the speaker’s voice, thereby generating an individualized model of sound versus distribution for each speaker. Individual sound types are recognized as unique clusters of MFCC combinations, and the MFCC bounds of these clusters (centroids and variances) define the model for each individual. Comparison of one model to an-other is accomplished by calculating least mean square distances between the two models.
4
Although we used 20 MFCC coefficients to dictate a model in 20-dimensional space, illustrative 2-dimensional examples (2nd and 3rd MFCC components) are shown in Figure 2. As seen in the upper left panel, three very different instruments playing the same note still yield different clusters of MFCC 2 versus MFCC 3 amplitudes. These translate to probability distributions (lower-left panel) based on MFCC readings that functionally define each instrument. In the right panel, we see a 2-dimensional distribution of MFCC coefficients for six
different speakers uttering the same phoneme (adapted from Chen, Huang, Chang, & Wang, 2002). As with the instrument example, we see that a different model would be generated for each speaker, and the least mean square distances between two model clusters would determine the degree to which the two models were different or the same, or in our case, the degree to which speech production during the Pre-Trip or Post-Trip sessions differed from baseline.
Figure 2. A simplified 2-D example of speaker modeling. The upper left scatter plot shows the combinations of MFCC2 and MFCC3 component amplitudes for each sound recorded. Because these sounds are generated by three different instruments, these combinations cluster in distinct regions of the 2-D space. From this a distribution model (lower left illustration) is generated and can be used to estimate which instrument was played for any MFCC 2 vs MFCC 3 pair. The same process is employed for human voice to identify unique sounds (phonemes) from MFCC combinations. As shown in the right panel, showing MFCC pairs for 6 different speakers uttering the same sound, different people will have unique models that define their speech production.
5
Voice File Processing. Figure 3 illustrates the three major components of the software that we configured to implement subject-by-subject voice change quantification: (1) Cepstral Co-efficient quantification of the voice signal, (2) speaker modeler, and (3) speaker comparator. Each component was developed using MATLAB modeling language and publicly available speech processing function libraries.
The Cepstral Coefficient Quantification component uses a series of discrete Fourier transforms to continuously extract the MFCC coefficients from speech segment windows of 256 points each (with a 128-point overlap). For our 11 kHz input signals, this is a 23-msec window with 11.5-msec overlap. The Speaker Model Generation component generates GMMs from input training data (the speaker’s voice recordings taken dur-ing the top 10% PVT sessions), in this case grouping multi-dimensional MFCC coefficients into clusters associated with the different sound types. The training method is based on the classic Expectation-Maximization algorithm (Dempster et al., 1977). The Speaker Model Comparator component is an implementation of a sequential forward search and sequential backward searching scheme introduced by Baum, Petrie, Soules, & Weiss, (1970). Forward search starts with the empty set of cluster points, then cluster points are added to the selected subset one by one. At each step, the added cluster point is selected from the remaining subset such that the already selected subset, plus the added one, gives the best combination performance (such as least mean square distance from the cluster center errors). By this procedure, a series of subsets and criterion measures are given, and we can eventually choose the subset (total cluster) of highest criterion. Backward searching starts from the set of all possible
points, and the constituent data points are iteratively deleted. At each step, a cluster point is deleted such that the remaining subset gives the best combination performance.
Statistical AnalysisAs described above, our use of Cepstrum Coefficient analy-
sis involves constructing individualized 20-dimensional speech models based on voice recordings from sessions coinciding with optimal baseline PVT performance, then comparing the Pre-Trip and Post-Trip sessions to the respective individual baseline model, yielding what we call the “speech deviation score” for that session relative to baseline. Because model construction is so agile, the units of the speech deviation scores are essentially arbitrary; however, for any given Pre- or Post-Trip session, a value of zero indicates identical speech production to that individual’s baseline model, whereas a larger score indicates more deviation and thus less similarity to baseline, thereby quantifying the extent to which that individual is “not him/herself ” in terms of speech production at that time.
Descriptive statistics were used to evaluate operational feasibility. Validity of the speech deviation score metric was as-sessed through separate linear regression analyses with speech as the predictor variable and PVT RT and Lapses as the outcome variables. For sensitivity analyses, we used descriptive statistics to characterize the distributions of Pre- and Post-Trip speech deviation scores, and main effects of trip on speech and PVT performance were evaluated via independent samples t tests. Finally, the sensitivity of Cepstrum Coefficient analysis to the operationally-relevant factors of Carrier Type, Seniority, and Flight Operations was evaluated by assessing Pre vs. Post speech
Figure 3. The Components of the voice change quantifier. The software consists of a speech quantification section, a model generator, and a speaker model comparator. As speech is input into the system, a continuous stream of speaker match scores are output, indicating how the speech production has changed relative to his or her baseline state.
Voice Change Analyzer
Score Vs. NormalState Model
Voice Input Cepstral CoefficientQuantification
Speaker ModelGenerator
Speaker ModelComparator
Mode Select
6
scores within each sub-group via independent samples t tests. Additional details and other analyses are described in-text. Rather than using summary statistics such as individual means across the entire study, we chose to maximize the statistical power af-forded by our large sample size and multiple trips worth of data by using all applicable sessions for all analyses. Unless otherwise noted, all data are presented as mean + SEM per session, with speech deviation scores expressed in their native units, PVT RTs expressed in msec, and PVT Lapses expressed as frequency counts. All analyses were two-tailed as applicable, and statistical significance was set at α = .05.
RESULTS
Operational FeasibilityNo matter how well-conceived or well-intended, speech
analysis in operational settings can neither be credibly evaluated nor subsequently implemented if the subjects of the analysis cannot or will not provide adequate data. This is particularly true for assessments requiring active participation such as the explicit recitation of five phrases for this study, and all the more challenging in demanding and highly variable operational envi-ronments such as aviation. Fortunately, the high compliance rate
and successful collection of ~10,000 test sessions suggest that brief but standardized speech sampling is operationally acceptable in commercial aviation. Our subject pool was broadly representa-tive of the flight attendant profession, so it is encouraging that participants successfully completed up to four sessions per day for 21-30 consecutive days in a wide variety of settings, across dozens of time zones, and in all phases of their endogenous circadian rhythms, regardless of gender, age, employer, or schedule. At the technical level, the uncompressed WAV files (PCM, signed 16 bit mono at 11,025 Hz) were of adequate quality for analysis.
Relationship With Neurobehavioral Performance MeasuresEven when acquiring data is operationally feasible, assess-
ment approaches such as speech analysis are of little value unless they predict safety-relevant performance outcomes. To this end, linear regression analyses of all baseline, Pre-Trip, and Post-Trip test sessions (n = 2,795) revealed modest but significant positive correlations between speech deviation scores and PVT RTs and Lapses (R2s > .013, ps < .001). As seen in Figure 4, poor PVT performance was more consistently associated with higher speech scores, but there was tremendous variability in speech scores at the low end of both PVT variables.
Figure 4. Relationship between Speech Deviation Score (x-axis) and PVT outcomes (y-axes).Total N = 2,795 sessions.
7
Organizing the PVT data into bins and re-analyzing the rela-tionships with the apparent functional range of speech scores yielded much more favorable statistical outcomes (Spearman’s rho R2s > .881, ps < .01), which are illustrated in Figure 5. Here we see that speech deviation scores more reliably predict Lapses than RTs, although we still see non-linear clustering and less reliable predictive power at the low end of the speech score and PVT ranges.
Sensitivity to Operationally-Relevant FactorsIf conducting voice recordings in the field is acceptable
and quantitative speech analysis of those recordings correlates with objective performance metrics, then a final issue worth considering is the sensitivity of speech analysis to variations in operationally-relevant factors. Indeed, if flight operations reli-
ably produce changes in speech scores, and those speech scores predict performance, then the practical value of Cepstrum Coef-ficient analysis for commercial aviation rests largely on its ability to detect work-induced fatigue and to discriminate between groups who may be differentially exposed to fatigue-inducing operational variations.
Effects of work trips. We first compared all Pre-Trip (n = 800) to Post-Trip (n = 765) sessions to determine if our measures were generally sensitive to the fatiguing effects of consecutive work days. Independent samples t tests with equal variances not assumed, revealed significant Pre-Post increases in PVT RTs (299 + 3.2 vs. 321 + 4.9, t(1320) = 3.78, p < .001) and Lapses (3.3 + 0.20 vs. 4.2 + 0.24, t(1502) = 2.97, p < .01; see Figure 6), thereby confirming the appropriateness of the sessions used for subsequent speech analyses.
Figure 5. Relationship between Speech Deviation Score (x-axis) and mean binned PVT outcomes (y-axes).
Figure 6. Mean PVT Reaction Times (left panel) and Lapses (right panel) per session before and after work trips.
8
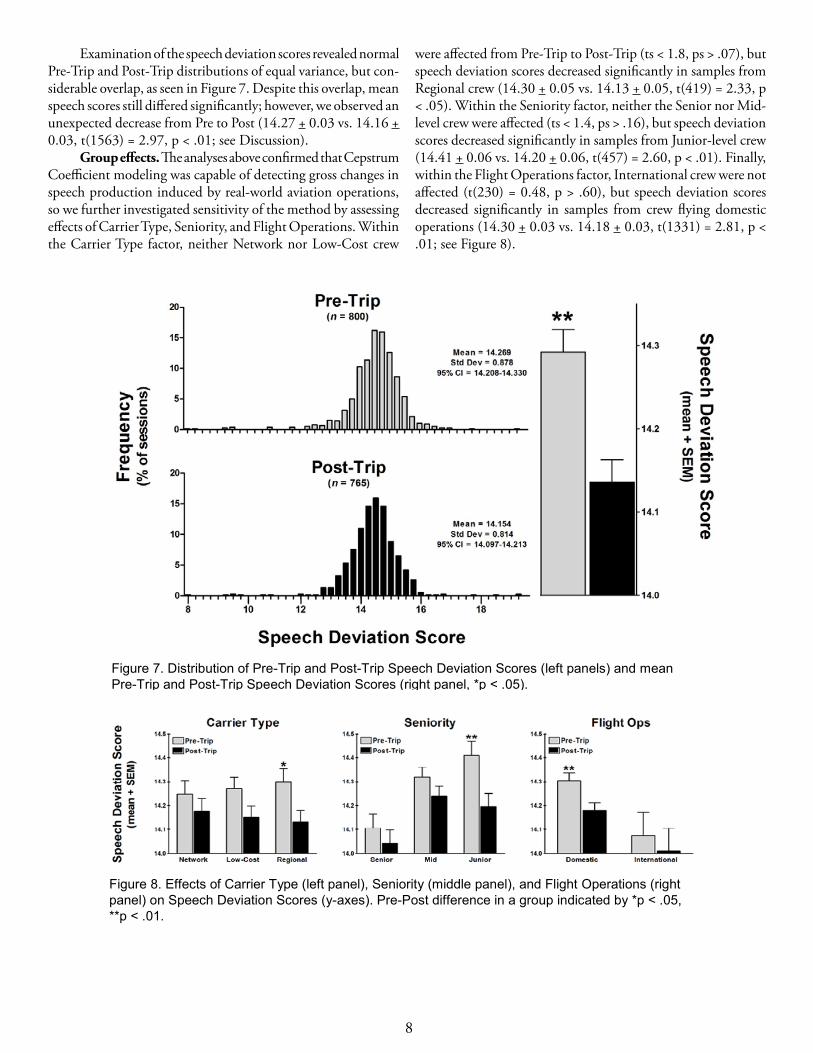
Examination of the speech deviation scores revealed normal Pre-Trip and Post-Trip distributions of equal variance, but con-siderable overlap, as seen in Figure 7. Despite this overlap, mean speech scores still differed significantly; however, we observed an unexpected decrease from Pre to Post (14.27 + 0.03 vs. 14.16 + 0.03, t(1563) = 2.97, p < .01; see Discussion).
Group effects. The analyses above confirmed that Cepstrum Coefficient modeling was capable of detecting gross changes in speech production induced by real-world aviation operations, so we further investigated sensitivity of the method by assessing effects of Carrier Type, Seniority, and Flight Operations. Within the Carrier Type factor, neither Network nor Low-Cost crew
were affected from Pre-Trip to Post-Trip (ts < 1.8, ps > .07), but speech deviation scores decreased significantly in samples from Regional crew (14.30 + 0.05 vs. 14.13 + 0.05, t(419) = 2.33, p < .05). Within the Seniority factor, neither the Senior nor Mid-level crew were affected (ts < 1.4, ps > .16), but speech deviation scores decreased significantly in samples from Junior-level crew (14.41 + 0.06 vs. 14.20 + 0.06, t(457) = 2.60, p < .01). Finally, within the Flight Operations factor, International crew were not affected (t(230) = 0.48, p > .60), but speech deviation scores decreased significantly in samples from crew flying domestic operations (14.30 + 0.03 vs. 14.18 + 0.03, t(1331) = 2.81, p < .01; see Figure 8).
Figure 7. Distribution of Pre-Trip and Post-Trip Speech Deviation Scores (left panels) and mean Pre-Trip and Post-Trip Speech Deviation Scores (right panel, *p < .05).
Figure 8. Effects of Carrier Type (left panel), Seniority (middle panel), and Flight Operations (right panel) on Speech Deviation Scores (y-axes). Pre-Post difference in a group indicated by *p < .05, **p < .01.
9
DISCUSSION
The present study examined operational feasibility, predic-tive validity with neurobehavioral performance, and sensitivity to operational factors of Cepstrum Coefficient speech analysis for work-induced fatigue in a large sample of commercial avia-tion cabin crew that collected data throughout 3-4 continuous weeks of work. Although clear limitations and opportunities for improvement emerged from this initial proof-of-concept study, the results were quite promising and nonetheless represent a critical step in the development of speech analysis methods for fatigue detection in operational environments.
Regarding feasibility, the high compliance rate and suc-cessful completion of ~10,000 test sessions suggest that brief but standardized speech sampling is operationally acceptable in the complex and stressful world of commercial aviation. One potential limitation, as indicated through our informal communications with study participants, is the occasional embarrassment caused by reading the peculiarly worded phrases out loud in the presence of others (e.g., shuttle bus, crew lounge); however, we received no communications of any kind that data collection compromised safety or affected operations. Although these feasibility results provide no technical insight on how speech analysis methods would be integrated into company infrastructure or formal fatigue risk management systems at the corporate or federal levels, they do indicate that (1) at least a subset of end-users in commercial aviation is willing to regularly provide standardized speech data before, during, and after work days, (2) they can do so without compromising passenger safety or any other aspect of job per-formance, and (3) readily available audio recording technology is suitable for informative speech analysis in operational settings.
The validity data, while not comprehensive, are nonetheless encouraging. Specifically, speech deviation scores generally pre-dicted neurobehavioral performance deficits as one would expect, i.e., higher speech scores significantly correlating with higher PVT RTs and Lapses. But even with this orderly statistical relationship, examination of the data still revealed tremendous variability in the low range of the speech-PVT continuum. Practically speak-ing, this pattern suggests some kind of detection threshold, i.e., the high range of speech scores has more predictive value than the low range. In our dataset, a speech deviation score of 14.5 appears to be a functional cutoff (see Fig. 5). At worst, this ap-proach suggests the possible safety risk of “false negatives” since some relatively low speech scores (< 14.5) were still associated with impaired performance capacity. It is uncertain whether these caveats are an inherent feature of speech analysis or simply the result of the methods and parameters we employed, which were only a subset from a virtually infinite variety of options worthy of future investigation. Speech model parameters notwithstanding, other considerations for future work include newly published innovations from leading fatigue scientists on methods for maxi-mizing the sensitivity of PVT data (Basner & Dinges, 2011), and indeed subsequent analyses with the massive Flight Attendant Field Study dataset may yield even more promising results with novel PVT-derived metrics beyond mean RTs and total Lapses,
perhaps normalized relative to individual baselines as was done with the speech data.
The sensitivity analyses confirmed that despite considerable overlap in response distributions, Cepstrum Coefficient analysis is indeed capable of distinguishing the Pre-Trip from the Post-Trip speech sessions. In addition, and similar to the objective sleep and performance data from our original report (Roma et al., 2010), all groups differed from baseline at both time points, and the most affected sub-groups of flight attendants were from Regional carriers (vs. Network or Low-Cost), of Junior-level seniority (vs. Senior or Mid), and worked Domestic flight operations (vs. International). In principle, these data support the sensitivity of Cepstrum Coef-ficient speech analysis and reveal operationally relevant effects, but as with our previously reported data, still beg the question of exactly what renders these particular sub-groups more vulnerable to fatigue than their counterparts. To this end, ongoing follow-up analyses of the field study database are examining the effects of commute time on work readiness, while analysis of other key operational variables such as total length of duty day, number of flight legs/segments per day, recovery time in the hotel during a trip, consecutive duty days (trip length), and number of days off in between trips may inform the original dataset, as well as any future speech analyses.
Perhaps our most interesting finding, and certainly the most unexpected, was that speech deviation scores decreased from Pre-Trip to Post-Trip in all groups. Comparison of average Pre-Trip and Post-Trip PVT variables confirmed the expected decline in neurobehavioral performance capacity (higher RTs and Lapses; see Figure 6), and the validity analyses revealed significant posi-tive correlations between speech scores and PVT variables, so how could several days of work render someone more similar to their baseline state? Although speculative, we believe this outcome to be an artifact of the composition of the session pool used to define baseline performance, coupled with the presumption of a direct correlation between neurobehavioral function and speech produc-tion. Specifically, there was a disproportionate number of Post-Sleep PVT sessions in the Top 10% optimal baseline session pool. A Chi-squared analysis confirmed unequal distribution of session types (Χ2(3) = 107.89, p < .001), and at 35%, there were significantly more Post-Sleep sessions than the three other types (Χ2(1)s > 6.88, ps < .01). By its very nature, sleep restores cognitive performance capacity upon wakening, so it is not surprising that many of the best PVT performances were from Post-Sleep sessions; however, several continuous hours of inactivity does not necessarily facilitate optimal speech production. Considerable clinical research exists on the relationship between speech and various components of the vocal apparatus in sleep-disordered patients (e.g., Davidson, 2003), and virtually all experimental investigations of fatigue-induced speech deficits rely on sleep deprivation, heavy workload, or time-on-task manipulations, but the exact nature of speech production upon awakening in healthy individuals is unclear. Given the involvement of so many muscle groups in vocal communication, it is reasonable to see how sessions recorded upon wakening, when the brain was well-rested but before the vocal apparatus was “warmed up,” could simultaneously yield maximized neurobehavioral performance
10
capacity but compromised speech production. Consequently, it appears that despite optimal PVT performances, the speech models we treated as baseline did not reflect optimal speech production, so the effects of workload-induced fatigue during a trip were manifest in compromised speech similar to that produced upon wakening.
Although unexpected, we welcome this complication, particularly at this early stage of development in speech-based operational fatigue analysis, because it underscores the impor-tance of clearly understanding the precise nature of the relation-ship between the predictor and outcome variables. In this case, while speech production and vigilant attention share overlapping neurobiological mechanisms, they are not one in the same pro-cess, and ironically, it seems the two ends of the sleep-mediated fatigue spectrum apparently produce similar patterns of speech production. Indeed, this interaction may account for some of the variability observed in the speech-PVT relationship in our dataset. Ultimately, speech analysis for fatigue may be best utilized as but one component of a more multi-dimensional assessment battery, thus providing quantitative convergent evidence to support but not dictate safety-based operational decisions. In addition to the issues described above, our results also highlight the broader issue of how to appropriately define an individual’s “baseline” in complex real-world settings, which would most certainly be required for any regulated implementation of fitness-for-duty tests or other prospective speech-based fatigue measures. We note that in Cepstrum Coefficient analysis, we operationally defined fatigue as deviation from baseline, but we emphasize that “different” in this context is purely quantitative with no inherent indication of quality (i.e., “better” or “worse”). As such, the sensitivity of the method is still apparent regardless of the direction, and thus our goals for a proof-of-concept assessment have been successfully realized. Of course, future work with this dataset and any system-atic applications would benefit from testing several approaches to baseline model construction, such as with speech produced during Post-Sleep sessions only (when the subjects should be most rested), Pre-Sleep sessions only (when they should be most fatigued), a fixed time of day (e.g., at circadian peak), or during multiple consecutive rest days.
In conclusion, these initial results reveal promising valid-ity and sensitivity of Cepstrum Coefficient modeling for speech signal analysis of fatigue in commercial aviation. Remaining questions underscore the need to further explore the dataset to determine the precise relationship between speech production and neurobehavioral performance capacity, the parameters for constructing individualized models, and standardized quantita-tive speech-based definitions of fatigue. We view this field work as a critically important first step toward the long-term goal of implementing sensitive and non-invasive measures of fatigue in dynamic operational environments. We encourage further investigation of the Flight Attendant Field Study dataset and the development of Cepstrum Coefficient analysis for fatigue in the spirit of science-based technologies for improving safety, performance, health, and quality of life for those who work in and rely on 24-hr operations.
REFERENCES
Åkerstedt, T. (1995). Work hours and sleepiness. Neurophysi-ologie Clinique, 25, 367-375.
Baum, L.E., Petrie, T., Soules, G., & Weiss, N. (1970). A maxi-mization technique occurring in the statistical analysis of probabilistic functions of Markov chains. The Annals of Mathematical Statistics, 41(1), 164–171.
Basner, M., & Dinges, D.F. (2011). Maximizing sensitivity of the psychomotor vigilance test (PVT) to sleep loss. Sleep, 34(5), 581-591.
Bridle, J.S., & Brown, M.D. (1974). An Experimental Automatic Word-Recognition System. JSRU Report No. 1003, Joint Speech Research Unit, Ruislip, England.
Boyce, S., MacAuslan, J., Bradlow, A., & Smiljanic, R. (2008, June). Landmark-based analysis of sleep-deprived speech. Paper presented the 155th meeting of the Acoustical Society of America, Paris, EU.
Chen, T., Huang, C., Chang, E., Wang, J. (2002, October). On the use of Gaussian mixture model for speaker variability analysis. Paper presented at the 7th International Confer-ence on Spoken Language Processing, Boulder, CO, USA.
Davidson, T.M. (2003). The great leap forward: The anatomic basis for the acquisition of speech and obstructive sleep apnea. Sleep Medicine, 4(3), 185-194.
Dempster, A.P., Laird, N.M., & Rubin, D.B. (1977). Maximum likelihood form incomplete data via the EM algorithm. Journal of the Royal Statistical Society. Series B (Meth.), 39(1), 1-38.
Dinges, D.F. (1995). An overview of sleepiness and accidents. Journal of Sleep Research, 4(suppl.2), 4-14.
Ferguson, S.A., Lamond, N., Kandelaars, K., Jay, S.M., & Dawson, D. (2008). The impact of short, irregular sleep opportunities at sea on the alertness of marine pilots working extended hours. Chronobiology International, 25(2), 399-411.
Greeley, H.P., Berg, J., Friets, E., Wilson, J., Greenough, G., Picone, J., Whitmore, J., & Nesthus, T. (2007). Fatigue estimation using voice analysis. Behavior Research Meth-ods, 39(3), 610-619.
Krajewski, J., Batliner, A., & Golz, M. (2009). Acoustic sleepiness detection: Framework and validation of a speech-adapted pattern recognition approach. Behavior Research Methods, 41(3), 795-804.
Ladefoged, P. (2001). A Course in Phonetics (4th Ed.). Boston, MA: Heinle & Heinle.
11
Lamond, N., Dawson, D., & Roach, G. D. (2005). Fatigue assessment in the field: Validation of a hand-held elec-tronic psychomotor vigilance task. Aviation, Space, and Environmental Medicine, 76(5), 486-489.
Lamond, N., Petrilli, R.M., Dawson, D., & Roach, G. D. (2006). Do short international layovers allow sufficient opportunity for pilots to recover? Chronobiology Inter-national, 23(6), 1285-94.
Lieberman, P., Morey, A., Hochstadt, J., Larson, M., & Mather, S. (2005). Mount Everest: A space analogue for speech monitoring of cognitive deficits and stress. Aviation, Space, and Environmental Medicine, 76(6 Suppl), B198-207.
Mallis, M.M., Banks, S., & Dinges, D.F. (2010). Aircrew fatigue, sleep need and circadian rhythmicity. In E. Salas and D. Maurino (Eds.), Human Factors in Aviation, 2nd Edition (pp. 401-436). Burlington, MA: Academic Press.
Mermelstein, P. (1976). Distance measures for speech recogni-tion, psychological and instrumental. In C.H. Chen (Ed.), Pattern Recognition and Artificial Intelligence, (pp. 347-388). New York: Academic Press.
Polejaeva, E. (2009, November). Speech under conditions of sleep loss: A preliminary review. Paper presented at the 62nd meeting of the U.S. Department of Defense Human Factors Engineering Technical Advisory Group, Key West, FL, USA.
Roma, P.G., Mallis, M.M., Hursh, S.R., Mead, A.M., & Nesthus, T.E. (2010). Flight Attendant Fatigue Recommendation II: Flight Attendant Work/Rest Patterns, Alertness, and Per-formance Assessment (Report No. DOT/FAA/AM-10/22). Washington, DC: U.S. Federal Aviation Administration, Office of Aerospace Medicine.
Shiomi, K. (2008, October). Voice processing technique for human cerebral activity measurement. Paper presented at the IEEE International Conference on Systems, Man and Cybernetics, Singapore.
Thorne, H., Hampton, S., Morgan, L., Skene, D. J., Arendt, J. (2008). Differences in sleep, light, and circadian phase in offshore 18:00-06:00 h and 19:00-07:00 hr shift workers. Chronobiology International, 25(2&3), 225-235.
Thorne, D R., Johnson, D.E., Redmond, D.P., Sing, H.C., Belenky, G., & Shapiro, J.M. (2005). The Walter Reed palm-held psychomotor vigilance test. Behavior Research Methods, 37(1), 111-118.