Faculty & Staff Scholarship 2021 Field Test of a Passive Infrared Camera for Measuring Trail-Based Field Test of a Passive Infrared Camera for Measuring Trail-Based Physical Activity Physical Activity Christiaan G. Abildso West Virginia University Vaike Haas West Virginia University Shay M. Daily West Virginia University Thomas K. Bias West Virginia University Follow this and additional works at: https://researchrepository.wvu.edu/faculty_publications Part of the Behavioral Medicine Commons Digital Commons Citation Digital Commons Citation Abildso, Christiaan G.; Haas, Vaike; Daily, Shay M.; and Bias, Thomas K., "Field Test of a Passive Infrared Camera for Measuring Trail-Based Physical Activity" (2021). Faculty & Staff Scholarship. 2993. https://researchrepository.wvu.edu/faculty_publications/2993 This Article is brought to you for free and open access by The Research Repository @ WVU. It has been accepted for inclusion in Faculty & Staff Scholarship by an authorized administrator of The Research Repository @ WVU. For more information, please contact [email protected].
Transcript
Faculty & Staff Scholarship
2021
Field Test of a Passive Infrared Camera for Measuring Trail-Based Field Test of a Passive Infrared Camera for Measuring Trail-Based
Physical Activity Physical Activity
Christiaan G. Abildso West Virginia University
Vaike Haas West Virginia University
Shay M. Daily West Virginia University
Thomas K. Bias West Virginia University
Follow this and additional works at: https://researchrepository.wvu.edu/faculty_publications
Part of the Behavioral Medicine Commons
Digital Commons Citation Digital Commons Citation Abildso, Christiaan G.; Haas, Vaike; Daily, Shay M.; and Bias, Thomas K., "Field Test of a Passive Infrared Camera for Measuring Trail-Based Physical Activity" (2021). Faculty & Staff Scholarship. 2993. https://researchrepository.wvu.edu/faculty_publications/2993
This Article is brought to you for free and open access by The Research Repository @ WVU. It has been accepted for inclusion in Faculty & Staff Scholarship by an authorized administrator of The Research Repository @ WVU. For more information, please contact [email protected].
Field Test of a Passive InfraredCamera for Measuring Trail-BasedPhysical ActivityChristiaan G. Abildso 1*, Vaike Haas 2, Shay M. Daily 1,3 and Thomas K. Bias 1,3
1West Virginia University School of Public Health, Morgantown, WV, United States, 2West Virginia University Davis College of
Agriculture, Natural Resources, and Design, Morgantown, WV, United States, 3West Virginia University Office of Health
Affairs, Morgantown, WV, United States
Introduction: Trails are ubiquitous and far-reaching, but research on the impact trails
have on physical activity is limited by the lack of resource-efficient, accurate, and practical
systematic observation tools. Commonly used infrared trail sensors count trail use and
may broadly differentiate activity (i.e., bicyclist vs. pedestrian), but cannot detect nuances
needed for outcomes research such as frequency, intensity, time, and type of activity.
Motion-activated passive infrared cameras (PICs), used in ecological research and visitor
management in wildlife areas, have potential applicability as a systematic observation
data collection tool.
Materials and Methods: We conducted a 7-month field test of a PIC as a systematic
observation data collection tool on a hiking trail, using photos to identify each trail user’s
physical activity type, age, sex, and other characteristics. We also tallied hourly trail
use counts from the photos, using Bland–Altman plots, paired t-tests, Concordance
Correlation Coefficient, Kendall’s Tau-b, and a novel inter-counter reliability measure to
test concordance against concurrent hourly counts from an infrared sensor.
Results: The field test proved informative, providing photos of 2,447 human users of
the trail over 4,974 h of data collection. Nearly all of the users were walkers (94.0%) and
most were male (69.2%). More of the males used the trail alone (44.8%) than did females
(29.8%). Concordance was strong between instruments (p < 0.01), though biased (p <
0.01). Inter-counter reliability was 91.1% during the field study, but only 36.2% when
excluding the hours with no detectable trail use on either device. Bland–Altman plots
highlighted the tendency for the infrared sensor to provide higher counts, especially for
the subsample of hours that had counts >0 on either device (14.0%; 694 h).
Discussion: The study’s findings highlight the benefits of using PICs to track trail
user characteristics despite the needs to further refine best practices for image coding,
camera location, and settings. More widespread field use is limited by the extensive
amount of time required to code photos and the need to validate the PICs as a trail
use counter. The future potential of PICs as a trail-specific PA research and management
tool is discussed.
Keywords: physical activity, systematic observation of behavior, passive infrared camera, field test, trail use
The many physical and mental health benefits of daily physicalactivity (PA) are well-documented (1). Increasing population-level PA by “creating or improving places for physical activity”has for decades been recommended by the CommunityPreventive Services Task Force as an evidence-based community-level intervention (2). Despite the important contribution thattrails may serve as public spaces for PA, “places for physicalactivity” has been narrowly defined in the scholarly literatureas “public open spaces” such as parks or green spaces to theexclusion of trails (3, 4). In addition, Koohsari et al. (4) suggestthat the correlational evidence between public open spaces andPA is mixed and due, in part, to insufficient measurement ofPA in specific environmental contexts, reiterating a measurementdeficiency acknowledged in the original Guide to CommunityPreventive Services (2).
Trails are vital, far-reaching places for achieving daily PAthat should be considered in a more inclusive definition ofpublic open space. Moreover, trails are a diverse and valuablecommunity asset, accommodating many types of users andextending throughout much of the US. For instance, the trailnetwork established by the National Trails System Act of 1968is over 88,600 miles in length and extends to within 60 milesof 230 million residents (5). Rails-to-trails, spurred by a 1983amendment to the National Trails SystemAct that allowed for therepurposing of abandoned rail-beds as multipurpose trails, nowcover over 24,300 miles (6). There are also 52,600 miles of trailsin the state parks system (7), and many more miles managed bycity and county parks and recreation agencies.
Research of the effect of trails on users’ PA is limited because ofthe lack of an efficient systematic observation method, however.Instead, most studies focus exclusively on trail usage—“traffic” —as the primary outcome. Methods most often used to collect trailusage include: (a) infrared sensor counters (8), (b) survey self-report of nearby residents (9–13), and (c) in-person systematicobservations (14). Like vehicular traffic counts, trail usage countsare used to estimate annual volume of traffic on trails basedon a sample of daily counts, resulting in an estimated averageannual daily traffic (AADT) on a trail (15, 16). While requiringfew resources, infrared sensors are limited in the output theyproduce to counts or “uses,” systematically undercount groupsof users as a single “use,” may mistakenly count animals, and—importantly for public health researchers—cannot identify trailuser characteristics or PA type (15, 17, 18).
Trail usage counts lack the specificity needed to assessand quantify PA frequency, intensity, time, and type (FITT)(19) of each trail use and user. Systematic observation isgenerally considered the “gold standard” for collecting place-based PA data in public open spaces. Applied conceptually tothe context of a trail, a systematic observation would allow forthe identification of specific trail users so that the PA type ofeach user could be assessed at an observation location (i.e., trailaccess point), in addition to the quantification of total trail use,or traffic counts. A systematic observation can also be used toquantify each user’s characteristics (e.g., age, sex, group usage,helmet use) for research and management purposes. However,
in-person systematic observation studies require substantialhuman and financial resources (18). For example, systematicobservations require a long data collection period—or a samplewith extrapolation to a longer period to estimate AADT. Usingin-person observation to assess the PA time and intensity of a trailuser further requires the capability to identify and track specificindividual users while on the trail, exacerbating the resourceneeds and making such an observation untenable, particularly onlonger distance trails and/or trails with numerous access points.
Because of the resources required to conduct in-personsystematic observations, most trail-based PA studies to date haveused cross-sectional surveys to capture samples of residents livingnear a trail (9, 11, 13, 20) or individuals intercepted while usingthe trail (21–23). Surveys are beneficial for gathering trail-basedPA data that are needed to quantify individual-level impactssuch as sociodemographic information of users and details of thePA FITT. However, cross-sectional surveys are often subject torecall, selection, and temporal biases. Moreover, implementingin-person surveys often requires more time and coordinationto ensure fidelity to research protocols which may lead tohigher costs. In an attempt to bridge research gaps, studies havecombined trail use sensor count data with trail user interceptsurvey responses to estimate population-level impacts. However,these methods rely heavily on assumptions about frequency oftrail use to calculate user-specific PA (24). These efforts highlightthe need to identify and test a resource-efficient solution thatcan be used over an extended period of time to simultaneouslyquantify trail use and each individual user’s trail-specific PA FITT.
An accurate assessment of PA type, time, and intensity of eachtrail user requires the ability to observe each user’s entry andexit from the trail. For example, a 24-h systematic observation atevery access point of a trail could be used to track the time eachindividual user spends on a trail and the PA type and intensityat each observation point. Additionally, assessing PA frequencyrequires repeating this observation over multiple days or weeks.Thus, an accurate assessment of all dimensions of FITT requiresthe ability to track each uniquely identified trail user at each trailuse and determine if each trail user returns, but raises scalability,ethical, and data processing concerns as noted in the literature(25). Even if accomplished, assumptions that each user’s time onthe trail was spent on one PA type and at a consistent intensitywould still need to be made. Conducting an in-person systematicobservation at every minute of every day over multiple weekswould further intensify the resource needs, but it may be possiblewith technological advances.
Remote cameras have been used as a systematic observationdata collection tool in ecological research and visitormanagement in wildlife areas to: (1) quantify animal andhuman visitors and/or interactions (26–28), (2) protect wildlife(29, 30), and (3) monitor for park policy violations (31).These passive infrared cameras (PICs)—also known as wildlifecameras, game cameras, or camera traps—take photos and/orvideos when activated by motion or a heat source, providingdetails in each photo that could be used to detect individualusers’ PA type (26, 27). While PICs eliminate the need forhumans to conduct in-person counts, coding of images or videosto glean information is still required. Only recently, however,
Frontiers in Public Health | www.frontiersin.org 2 March 2021 | Volume 9 | Article 584740
have researchers attempted to demonstrate the applicabilityof using the photos from PICs to quantify PA of human usersof trails (27, 32). Developing best practices has been difficultbecause there have been very few studies, protocols vary, thereare numerous PIC brands and models, and PIC technologyand device features are constantly improving. Despite suchlimitations, PICs may be an efficient and practical data collectiontool for systematic observation over long periods at multiple siteson a trail. A key initial step is to field test PICs to determine thefeasibility and dependability of PICs as a data collection tool forassessing PA type of trail users. Thus, the purpose of this studywas to field test a PIC on a hiking trail and evaluate its use as atool for identifying the PA type and characteristics of individualtrail users. A secondary purpose of this study was to field testa PIC as a trail usage counter by comparing it with concurrentcounts from an infrared sensor.
MATERIALS AND EQUIPMENT
InstrumentsData for this study were collected using a PIC concurrently withan infrared trail count sensor at the main entrance to a hikingtrail in a newly established urban woodland park. The protocolwas reviewed by the West Virginia University InstitutionalReview Board (protocol number 1905572292) and deemed Non-Human Subjects Research because it was an observation ofpublic behavior.
Passive Infrared Camera
A Moultrie M-888i Mini Game Camera, mounted in acamouflaged protective case (CAMLOCKbox) and secured withadjustable (Python) cable lock, was tested. The M-888i triggerswith motion or heat within a 15-m range using a passive infraredsensor. It has the capability to capture photos or videos. Forthis study, it was used to take photos. It captures night imagesby using an infrared flash. This M-888i uses eight AA batteries,intended to capture and store up to 17,000 images on a removableSD-card (33). This camera is no longer manufactured (retail$126) but has been replaced by the M-40i model (retail $160).The cost of the case, cable lock, SD-card and initial set of batteriesadded $78 to each camera setup.
For this study, important camera settings included: (1)detection delay and (2) multi-shot option. Detection delay refersto the amount of time between pictures when an object is detectedand remains in range. Options are 0, 10, or 30 s, or 1, 5, 10, or30min.Multi-shot refers to howmany pictures are captured oncethe camera is triggered. Options are: (1) “off” for a single photoper triggered event; (2) “burst” for three photos within 1 s pertriggered event; or (3) “triggered” for up to three photos, witha slight delay between each (if the subject continues to movein view of the camera after the first photo triggering event).To protect anonymity of trail users photographed in a publicspace, faces were obscured in images selected as illustrations,and we only selected photos of trail users from whom we had amedia release.
Infrared Trail Count Sensor
For our comparison, we used a TRAFx infrared trail counter,which detects the “infrared wavelength that people emit” (34).The sensor uses an infrared scope connected to hardware insidea weatherproof case. The unit runs on three AA batteries, withan estimated battery life of up to 3 years. Settings for the infraredcounter include the: (1) Period and (2) Delay. Period allows theuser to choose between timestamps for each triggering event(“sensor hit”) or a summary count of sensor hits per hour orper calendar day. The Delay setting establishes the minimumtime between each triggering event in 0.25-s increments. Whenpurchased in 2015, this counter and weatherproof case cost $520.A dock to download the data cost an additional $550 and optionalonline software to view and manage the data can be addedfor approximately $100 per year. Batteries and a steel electricaldisconnect box ($15) in which to lock the equipment cost extra.
METHODS
Data CollectionData were collected from November 19, 2016 to June 30, 2017at the main entrance of a hiking trail accessing the WestVirginia University (WVU) Falling Run Greenspace/OrganicFarm, a 60-acre wooded park in Morgantown, West Virginia,USA (Figure 1). This trail is designed for foot traffic only; bicyclesare not allowed but were observed occasionally in the presentstudy. Preliminary instrument set up and mounting angle testswere conducted prior to full data collection to ascertain thatphotos captured bi-directional walking and jogging along thetrail concurrently with infrared sensor timestamps. The PIC wascable-locked within a metal security box, mounted to a 10-cmdiameter grapevine 3m from the edge of a 0.6-m wide hikingtrail. The camera had an unobstructed view perpendicular to thetrail from the uphill slope at roughly 1.8m above the trail surface.The camera was angled downward to parallel the steep hillslope(59%) to capture trail users’ full-body lengths (Figure 2). Thesespecifications are slightly different than the recommendationssuggested by Miller et al. (32), but were found to most accuratelycapture walkers and runners of different heights and differentspeeds during preliminary tests, accounting for the width of thetrail and topography, where prevailing hillslopes are often 30%or more. The camera was set to 10-s delay with a “burst” ofthree exposures per triggering event. Images contained a dateand timestamp, and were downloaded to a password-protectedlaptop from the removable SD card monthly. Batteries needed tobe replaced roughly every 2–4 weeks.
The TRAFx infrared sensor was mounted to a tree in a lockedmetal box about 1m from the trail’s edge with an unobstructedview (Figure 2). The Delay option was set at 1.5 s and the Periodoption was set to provide hourly trail usage counts. Hourlytrail usage counts were downloaded monthly through a wiredconnection to a password-protected laptop as text files andconverted to a Microsoft Excel spreadsheet. Batteries did notneed to be replaced during our data collection period. The dateand time were synchronized on the PIC and infrared sensor atinitial setup, and verified during each visit to the instruments todownload data.
Frontiers in Public Health | www.frontiersin.org 3 March 2021 | Volume 9 | Article 584740
FIGURE 1 | Map of the Falling Run Greenspace/WVU Organic Farm, study site and trail count location in Morgantown, West Virginia, USA.
FIGURE 2 | Image depicting the field test location, looking toward the trail entrance, with the location of the PIC (A) and infrared trail sensor (B) noted. The PIC was
3m from the trail edge and the sensor was 1m from the trail edge. The inset photo is an image of the PIC mounted to sturdy grape vine at location (A). PIC, passive
infrared camera. Bold line shows cross section of topography at infrared sensor location (foreground). Horizontal lines denote 0.6-m contours.
Frontiers in Public Health | www.frontiersin.org 4 March 2021 | Volume 9 | Article 584740
AnalysisThe second author reviewed all photos from the PIC to codethe characteristics of each user. Codes included: (1) the type ofPA being performed (running, walking, bicycling) based on bodylean, stride length, and equipment (NB: bicycling not permitted,but was detected); (2) biological sex (male, female) based oncultural cues such as dress and hair style, and/or by visiblephysical features such as facial hair or body proportions; (3) agegroup (child or adult) based on individual height and features andaccompanying caregivers; (4) dog walking (yes, no); (5) mobilephone use, either viewing the screen or holding it up to theear; and (6) date and time of day from the timestamp on thephoto. Group size was coded by counting the number of uniquetrail users photographed during the multiple photos for eachtriggered event. Photos triggered by animals (unaccompaniedpets, wildlife) were coded, but excluded from our analyses. Whensome distinguishing item of clothing, a distinctive pet, or otherfeatures made it possible to recognize a unique human trail user,the duration of that persons’ visit was noted and incidents of theirrepeat trail use were noted as was feasible. The date and timefrom the timestamp of each photo were used for aggregation intohourly trail user counts for comparison with the hourly countsfrom the infrared sensor data.
In addition, an inter-counter reliability (ICR) was used tocalculate the percent agreement between the hourly user countsderived from coding of PIC photos and infrared sensor hourlycounts. This method, albeit exploratory, was chosen as anequivalent to interrater reliability measurement that is usedto assess agreement for observational measures in qualitative
research (45). To calculate ICR, hourly counts were firstmatched by date and hour from each device and coded aseither agreement (sensor count = PIC count) or disagreement(sensor count 6= PIC count) for each hour. Then, the percentof hourly trail use counts in agreement (number of hourlyagreements/[number of hourly agreements + number of hourlydisagreements]) was calculated. An agreement of 80% or higherwas considered “acceptable” using the ICR method based onstandards from content analysis and other qualitative codingmethodologies (46–49).
RESULTS
In sum, 4,974 h of matched data from both instruments werecollected during the field test, excluding an interval when thePIC’s batteries expired (384 h from January 26 to February 11,2017). Coding the PIC images (see examples, Figure 3) tookroughly 30 s per triggering event. The camera also capturedmanyphotos with no discernible trail user, many of which we attributedto wildlife, wind-induced movement in background vegetation,and insects triggering the camera at close range. Some unknowntriggers could have been due to high-speed users, such as runnersor cyclists.
Trail user PA and demographic characteristics derived fromthe photos are presented in Table 1. The PIC recorded 2,447 trailusers and 253 animals. Nearly all of the 2,447 human users werewalkers (94.0%), 3.6% were children, 2.4% were using a mobilephone, and 59.6% were in a group of two or more. The majorityof trail users were male (69.2%). Females had a lower rate of solotrail use (29.8%) than did males (44.8%).
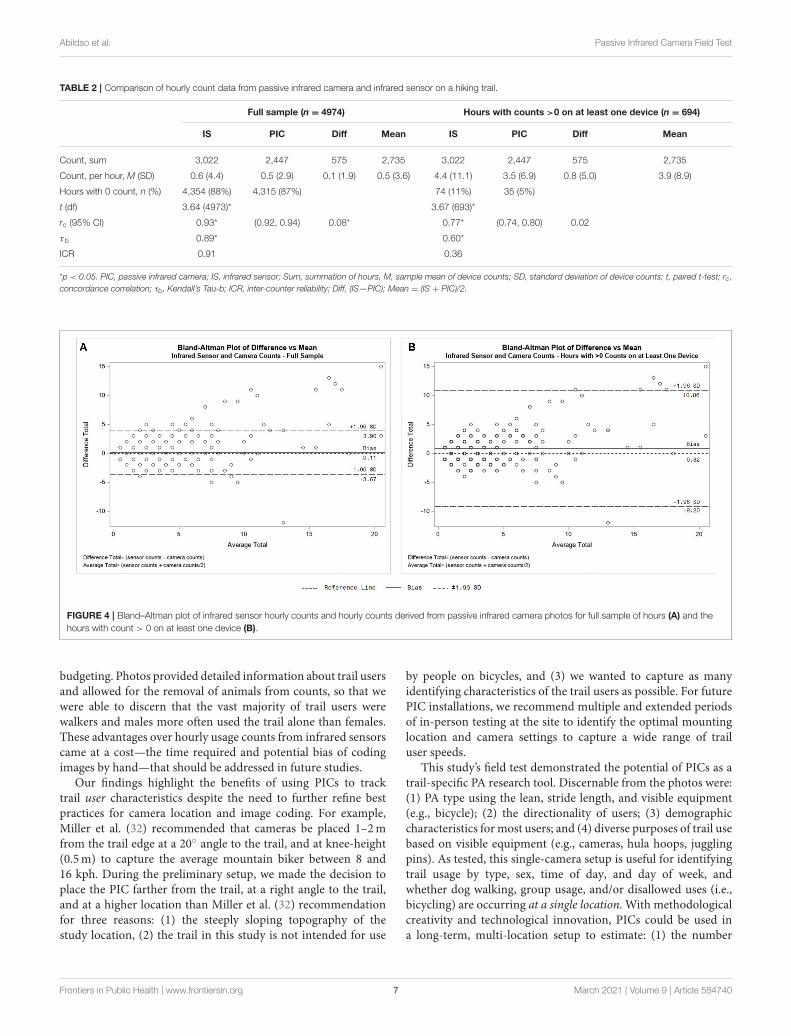
Comparison statistics between infrared sensor and PIC areavailable in Table 2. Counts demonstrated a substantial numberof hours matched with zero counts on both devices (86.1%).With zero count hours included, the infrared sensors recordeda summary count of 3,022 and a mean of 0.6 (SD = 4.4) perhour. The PIC recorded a sum of 2,447 users and a meanof 0.5 (SD = 2.9) trail users per hour. The test for minimalbias using a paired t-test was significant (t4973 = 3.64, p <
0.01), revealing bias between the counts. The concordance testshowed very large agreement between counts (rc = 0.93, 95% CI:0.92–0.94, p < 0.01). Kendall’s Tau-b demonstrated a significantrelationship between counts (τ b = 0.89, p < 0.01). The inter-counter reliability with zeros included was 91.1% (ICR= 0.91).
For the subset of hours that excluded the hours with matchedzero counts (n = 694) the infrared sensors recorded a summarycount of 3,022 and a mean of 4.4 (SD = 11.1) per hour. The PICrecorded a sum of 2,447 users and a mean of 3.5 (SD = 6.9)users per hour. The test for minimal bias using a paired t-testwas significant (t693 = 3.67, p < 0.01), revealing bias between thecounts. The concordance test showed large agreement betweencounts (rc = 0.77, 95%; CI: 0.74–0.80, p < 0.01). Kendall’s Tau-b demonstrated a significant relationship between counts (τ b= 0.60, p < 0.01). The inter-counter reliability for this subsetof hours with zero counts excluded was 36.2% (ICR = 0.36).Lastly, the Bland–Altman plots (Figure 4) show the error andbias, outliers, and difference trends relative to the mean for the
Frontiers in Public Health | www.frontiersin.org 5 March 2021 | Volume 9 | Article 584740
FIGURE 3 | Example images from passive infrared camera field test.
TABLE 1 | Trail user characteristics based on coding of images from a PIC on a hiking trail.
Total (n = 2,447) Male (n = 1,600) Female (n = 711)
Sample characteristic n % n % n %
Activity type
Walking 2,299 94.0 1,512 94.5 677 95.2
Running 116 4.7 78 4.9 35 4.9
Bicycling 31 1.3 18 1.1 5 0.7
Trail users
Groups 606 *214 *62
Users in groups 1,457 59.5 482 30.1 133 18.7
Solo 989 40.4 717 44.8 212 29.8
Walkers
Groups 578 *205 *57
Users in groups 1,391 56.8 464 29.0 123 17.3
Solo 908 37.1 660 41.3 199 28.0
Runners
Groups 17 *7 *5
Users in groups 36 1.5 14 0.9 10 1.4
Solo 68 2.8 50 3.1 15 2.1
Bicyclists
Groups 4 – –
Users in groups 8 0.3 *n/a *n/a
Solo 21 0.9 14 0.6 3 0.1
PIC, passive infrared camera; *unique number of groups composed exclusively of a single biological sex.
full sample and for the subsample of hours with non-zero countson at least one device. These plots visually represent the findingthat the infrared sensor had higher counts for 34.9% of the hoursof non-zero counts.
DISCUSSION
Among the research needs for public open spaces, Koohsariet al. (4) identified the need to establish “open space-specificmeasures of physical activity” (p. 80). Based on an extensive
review of the literature, this appears to be the second field testof PICs as a systematic observation data collection tool for trail-specific PA (32). We were able to collect 4,974 h of concurrentdata with one period of missing data due to battery expirationin the PIC, highlighting a logistical concern to consider in thefield. Newer versions of the camera can be connected to acellular network for a monthly fee that also allows users to usea smartphone application to get low battery, low storage space,and other warning notifications. Regardless, peripheral expensessuch as batteries and storage space should be accounted for when
Frontiers in Public Health | www.frontiersin.org 6 March 2021 | Volume 9 | Article 584740
*p < 0.05. PIC, passive infrared camera; IS, infrared sensor; Sum, summation of hours, M, sample mean of device counts; SD, standard deviation of device counts; t, paired t-test; rc,
FIGURE 4 | Bland–Altman plot of infrared sensor hourly counts and hourly counts derived from passive infrared camera photos for full sample of hours (A) and the
hours with count > 0 on at least one device (B).
budgeting. Photos provided detailed information about trail usersand allowed for the removal of animals from counts, so that wewere able to discern that the vast majority of trail users werewalkers and males more often used the trail alone than females.These advantages over hourly usage counts from infrared sensorscame at a cost—the time required and potential bias of codingimages by hand—that should be addressed in future studies.
Our findings highlight the benefits of using PICs to tracktrail user characteristics despite the need to further refine bestpractices for camera location and image coding. For example,Miller et al. (32) recommended that cameras be placed 1–2mfrom the trail edge at a 20◦ angle to the trail, and at knee-height(0.5m) to capture the average mountain biker between 8 and16 kph. During the preliminary setup, we made the decision toplace the PIC farther from the trail, at a right angle to the trail,and at a higher location than Miller et al. (32) recommendationfor three reasons: (1) the steeply sloping topography of thestudy location, (2) the trail in this study is not intended for use
by people on bicycles, and (3) we wanted to capture as manyidentifying characteristics of the trail users as possible. For futurePIC installations, we recommend multiple and extended periodsof in-person testing at the site to identify the optimal mountinglocation and camera settings to capture a wide range of trailuser speeds.
This study’s field test demonstrated the potential of PICs as atrail-specific PA research tool. Discernable from the photos were:(1) PA type using the lean, stride length, and visible equipment(e.g., bicycle); (2) the directionality of users; (3) demographiccharacteristics for most users; and (4) diverse purposes of trail usebased on visible equipment (e.g., cameras, hula hoops, jugglingpins). As tested, this single-camera setup is useful for identifyingtrail usage by type, sex, time of day, and day of week, andwhether dog walking, group usage, and/or disallowed uses (i.e.,bicycling) are occurring at a single location. With methodologicalcreativity and technological innovation, PICs could be used ina long-term, multi-location setup to estimate: (1) the number
Frontiers in Public Health | www.frontiersin.org 7 March 2021 | Volume 9 | Article 584740
and characteristics of each distinct trail user; (2) the PA intensityand time of each user while on the trail; (3) the PA typeand trip type of each user (round-trip or one-way); and/or (4)demographic differences in PA FITT and use preferences. Forexample, with cameras located at every entry point of a trailsystem, it becomes possible to track each user and estimate PAFITT in that setting by using unique features (e.g., facial features,clothing) to distinguish individual trail users. Identifying specificpeople and coding images will require technological innovation,such as using computer vision algorithms (36, 37). By achievingthis capability, researchers could answer Koohsari et al. (4) callfor evidence of causal inferences. That is, researchers could tracksetting-specific PA over a period of time when trail improvementsoccur such as building additional trailheads or installing lighting,during a specific event on a trail (e.g., National Trails Day), or asa result of a specific intervention that encourages trail use amonga demographic group (e.g., children, females, people of color).
Despite limitations in coding based on superficialcharacteristics in photos that may introduce coder bias,such as age and sex, our field test also demonstrated the potentialthat PICs have for trail and park management through theidentification of particular user and group characteristicsincluding trail use preferences. Future studies of inter-coderreliability are necessary to overcome coder bias and help developimage recognition capabilities for fast, accurate coding usingemerging technologies. While demographic characteristics suchas age and sex of users were not always discernable from thephotos, we observed in the codable images that the majorityof users were male, and females tended to use the trail moreoften in groups. Such details about user characteristics, possiblyin combination with trail user survey data, could help landmanagers identify programming or infrastructure improvementsto promote inclusivity for users.
There are three important barriers to overcome to make itfeasible to use PICs as a systematic observation data collectiontool to quantify trail-based PA and trail usage. First, is thetime required to do the manual coding of the images. Thiscould be informed by the evolution that has occurred in thesystematic observation instrumentation of PA in public spacesand parks/recreation areas. The methods for assessing pedestrianand bicyclist usage of public spaces such as plazas and on-streettransportation infrastructure could be particularly informative.Through progressive studies using the Archive of Many OutdoorScenes (AMOS) project (50), researchers have used historicalwebcam images to quantify pedestrian/bicyclist use over time atplazas or as street infrastructure changed. Originally a laboriousprocess of manually counting and coding behavior in crowd-sourced photographs (51, 52), AMOS has evolved to now usemachine learning to reduce the labor required to code data (53).
Second, is the need to reduce the burden of collectingthe data. Systematic observation to assess PA in parks andrecreation areas has evolved through the often-used System forObserving Play and Recreation in Communities (SOPARC) (54–57). Initially reliant on in-person observers using hand-writtenforms, SOPARC has evolved to incorporate iPads (iSOPARC)(58), wearable video detection devices (37), wide-angle cameras
mounted on an elevated tripod (36), and remotely controlledaerial vehicles (drones) for data collection (59).
Third is the need to determine the validity of the PIC as atrail usage counter. Although this field test has limitations, ourseries of analyses suggest a moderate to strong concordance andagreement between the instruments. However, the significantpaired t-tests suggest there is bias between the infrared sensorand PIC, with the infrared sensor demonstrating higher hourlycounts. This bias is shown in the Bland–Altman plots (Figure 4),especially by the wide variance of the mean hourly differences(±10.0) in Figure 4B relative to the overall mean difference(Bias line; 0.82). This shows that for about one third of theobserved hours when counts weren’t zero, the PIC and sensordiffered by 5–10 counts in an hour, with the sensor generallyregistering higher counts. For example, if a count of 15 wasregistered by the sensor, the count from the PIC could vary from5 to 25. Also worth noting in Figure 4 is that the differencebetween the senor and camera counts (y-axis) increased as trafficincreased on the trail (x-axis). Thus, even though the differencebetween measures for entire sample was small (mean bias of 0.8),individual-level (hourly) accuracymay need to be improved. Thismay be due to the detection delay settings of the instrumentsthat may have led to a count of multiple uses on the infraredsensor from what would be coded as a single count of one userin PIC photos and/or an animal that is only detectable throughPIC photos. An interesting finding, albeit exploratory, was thecrude calculation of the ICR (percent agreement). We adaptedagreement measures from SOPARC studies (36, 37) to fit our datacollection methods which are continual over a period of timerather than snapshots of scanned target areas of a larger setting(i.e., park) (54). With limited guidance on the “best practice” ofhow to establish agreement and concordance among the devices,this study’s findings suggest there is a need to establish a methodto assess the validity of PIC counts against infrared sensorwith concurrent in-person counts in controlled and real-worldscenarios, following guidance of similarly purposed SOPARCstudies (32, 36, 37). Calculating agreement based on a modifiedtechnique often used in qualitative methods demonstrated tobe insufficient. Future studies should also consider a cadre ofequivalence tests for evaluatingmeasurement agreement betweeninstruments [see (60)].
There are limitations to this study worth noting, includingthe use of only one type of PIC. Comparisons between cameramodels and manufacturers will be important to identify the “bestperformer” for trail use counts; however, this will change asnew models become available. Secondly, we used hourly countsfrom the infrared sensor. Timestamp data from the sensor wouldhave provided more precise information about each sensor hitto compare with the camera photos’ timestamp, though in-person systematic observation is necessary to determine thetrue accuracy of both methods. We recommend this timestampcomparison between instruments and in-person observation inany future validation study. The use of the PIC photos, whiletaken in a public park where trail users anticipate potentialobservation, also poses potential ethical issues (25, 53). Lastly,camera theft, battery or storage malfunction, and tampering are
Frontiers in Public Health | www.frontiersin.org 8 March 2021 | Volume 9 | Article 584740
also a potential concern thatmay disrupt the research process andincrease cost.
CONCLUSIONS
The impact of new or improved trail infrastructure is fertileground for acquiring insights on PA pattern and usage changes.Dependable, user-friendly, resource-efficient instruments formeasuring PA frequency, intensity, time, and type (PA FITT)are critical to influence what is known about the benefits of trailinfrastructure improvements. For example, natural experimentstudies that explore changes in PA as a response to changesin the built environment often are restricted to self-reportedmeasures of PA which may lack the objectivity and specificityto accurately assess on-trail PA FITT (61–63). This studysuggests PICs may be a viable solution to (1) overcome manyof these measurement limitations listed above, (2) provide atool for trail-specific systematic observation of PA FITT, and(3) observe trail usage patterns over time in lieu of resourceheavy research designs. Although slightly speculative, PICs mayprovide opportunities for community engagement by providingvirtual public feedback, which may help planners prioritizetrail improvement based on actual trail use and behaviors.In addition, PICs may also be applicable to other setting-specific natural experiments such as Open Streets events (64)or temporary street closures such as those enacted during theCOVID-19 pandemic (65). Future studies that focus on thereliability of camera settings, installation criteria, and improvedanalysis of data are critical to establish a best practice forfuture research.
DATA AVAILABILITY STATEMENT
The raw data supporting the conclusions of this article will bemade available by the authors, without undue reservation.
ETHICS STATEMENT
The protocol was reviewed and approved by the WestVirginia University Institutional Review Board (protocol number1905572292) and deemed Non-Human Subjects Researchbecause it was an observation of public behavior. A writtenmedia release was collected from the participants or their legalguardians/next of kin depicted in any images used for publicpresentation. To protect anonymity, faces were obscured inimages selected as figures in this manuscript.
AUTHOR CONTRIBUTIONS
CA and VH conceptualized the study, collected and cleanedthe data, and drafted the manuscript. SD analyzed thedata, and drafted the methods and results sections. TBhelped conceptualize and edit the manuscript. All authorshave approved the final version and take responsibility forthe content.
FUNDING
Partial funding was provided to VH by the United StatesDepartment of Agriculture’s National Institute of Food andAgriculture (WVA00685).
REFERENCES
1. United States Department of Health and Human Services. 2018 Physical