U.S. Department of the Interior U.S. Geological Survey Sound Waves Volume FY 2010, Issue No. 127 August/September 2010 Fieldwork http://soundwaves.usgs.gov/ (Arctic Seafloor continued on page 2) Scientists Set Sail to Map the Arctic Seafloor By: Jessica Robertson, Deborah Hutchinson, Jonathan Childs, and Brian Edwards American and Canadian scientists set sail this summer to map the Arctic seafloor and gather data to help define the outer limits of the continental shelf. Each coastal nation may exercise sov- ereign rights over the natural resources of their continental shelf, which includes the seabed and subsoil. These rights include control over minerals, hydrocarbons, and sedentary organisms such as clams and coral. Under international law, specifically the United Nations Convention on the Law of the Sea, every coastal nation automati- cally has rights over a continental shelf out to 200 nautical miles or to a maritime boundary. The Convention also states that a nation is entitled to continental shelf be- yond 200 nautical miles if certain criteria are met—an area that is referred to as the “extended continental shelf.” The U.S. Geological Survey is the lead science agency for the United States in the 2010 U.S.-Canada Extended Continental Shelf survey. “In this expedition, Canada and the U.S. are working together to delin- eate the extended continental shelf in the Arctic to better determine where the Con- vention’s criteria can be met,” said USGS scientist Brian Edwards, chief scientist on the U.S. Coast Guard Cutter Healy. The Healy will sail the Arctic from Au- gust 2 to September 6, 2010, meeting up with the Canadian Coast Guard Ship Louis S. St-Laurent at sea. The ships will alternately break through the Arctic sea ice for each other. The Healy will map the shape of the seafloor using a multibeam echo sounder, and the Louis S. St-Laurent will collect multichan- nel seismic reflection and refraction data to determine sediment thickness. This is the third year the United States Planned tracklines for the 2010 U.S.-Canada Extended Continental Shelf survey. “EEZ” stands for Exclusive Economic Zone, which extends from a nation’s coastline out 200 nautical miles (or to a maritime boundary with another nation). nm, nautical miles; km, kilometers.
Transcript
U.S. Department of the InteriorU.S. Geological Survey
Scientists Set Sail to Map the Arctic Seafl oorBy: Jessica Robertson, Deborah Hutchinson, Jonathan Childs, and Brian Edwards
American and Canadian scientists set sail this summer to map the Arctic seafl oor and gather data to help defi ne the outer limits of the continental shelf.
Each coastal nation may exercise sov-ereign rights over the natural resources of their continental shelf, which includes the seabed and subsoil. These rights include control over minerals, hydrocarbons, and sedentary organisms such as clams and coral.
Under international law, specifi cally the United Nations Convention on the Law of the Sea, every coastal nation automati-cally has rights over a continental shelf out to 200 nautical miles or to a maritime boundary. The Convention also states that a nation is entitled to continental shelf be-yond 200 nautical miles if certain criteria are met—an area that is referred to as the “extended continental shelf.”
The U.S. Geological Survey is the lead science agency for the United States in the 2010 U.S.-Canada Extended Continental Shelf survey. “In this expedition, Canada and the U.S. are working together to delin-eate the extended continental shelf in the Arctic to better determine where the Con-vention’s criteria can be met,” said USGS scientist Brian Edwards, chief scientist on the U.S. Coast Guard Cutter Healy.
The Healy will sail the Arctic from Au-gust 2 to September 6, 2010, meeting up with the Canadian Coast Guard Ship Louis S. St-Laurent at sea.
The ships will alternately break through the Arctic sea ice for each other. The Healy will map the shape of the seafl oor using a multibeam echo sounder, and the Louis S. St-Laurent will collect multichan-nel seismic refl ection and refraction data to determine sediment thickness.
This is the third year the United States
Planned tracklines for the 2010 U.S.-Canada Extended Continental Shelf survey. “EEZ” stands for Exclusive Economic Zone, which extends from a nation’s coastline out 200 nautical miles (or to a maritime boundary with another nation). nm, nautical miles; km, kilometers.
and Canada have collaborated in extended continental shelf data collection in the Arctic. The United States has indepen-dently been collecting single ice-breaker data in the Arctic since 2003 in further-ance of the U.S. Extended Continental Shelf Project.
“The Arctic Ocean is an area of great interest for science, resource conservation, and possible economic development,” said USGS scientist Deborah Hutchinson. “Because there is an area with consider-able overlap between the U.S. and Canadi-an extended continental shelves, it makes sense to share data sets and work together in the remote and challenging environ-ments of the Arctic Ocean.”
“This is the last year working in the Canada Basin north of Alaska, and in 2011, we’ll collect data together with Can-ada in the area north of the Canada Basin around the Alpha Ridge,” said USGS scientist Jonathan Childs, who is leading the U.S. Interagency Task Force Seismic Data Operations Team.
Research is coordinated by the U.S. Extended Continental Shelf Task Force, a government-wide group headed by the U.S. Department of State. Participants in this Task Force include the U.S. Depart-ment of the Interior; U.S. Geological
The Coast Guard Cutter Healy. Photo credit: U.S. Coast Guard.
Survey; National Oceanic and Atmos-pheric Administration; U.S. Coast Guard; National Science Foundation; Joint Chiefs of Staff; U.S. Navy; U.S. Department of Energy; U.S. Environmental Protection Agency; Executive Offi ce of the President; Bureau of Ocean Energy Management, Regulation, and Enforcement; and the Arctic Research Commission.
Watch a video podcast about this expe-dition at http://www.usgs.gov/corecast/details.asp?ep=131.
For additional information on this ex-pedition as well as photographs and video from past cruises, visit the Extended Con-tinental Shelf Project at http://continentalshelf.gov/.
3 Sound Waves August/September 2010Fieldwork
Fieldwork, continued
(Ocean Acidifi cation continued on page 4)
The oceans currently absorb approxi-mately one-third of total emissions of carbon dioxide (CO2) generated by fossil-fuel combustion. As CO2 is absorbed by the ocean, it forms carbonic acid and lowers the slightly alkaline (basic) pH of seawater. This suite of chemical changes is known collectively as ocean acidifi ca-tion. Lowered ocean pH alters the ability of many calcifying marine organisms to produce calcium carbonate skeletons and shells. Ocean acidifi cation is an emerging global problem because, as CO2 emissions continue, so will the lowering of ocean pH that may cause profound changes in marine food webs and global ecosys-tems. (See related Sound Waves articles at http://soundwaves.usgs.gov/2009/11/, http://soundwaves.usgs.gov/2009/04/fi eldwork2.html, and http://soundwaves.usgs.gov/2008/03/research.html.)
The U.S. Geological Survey (USGS), along with other federal agencies, is working with the international scientifi c community to help standardize and compile information that adequately describes ocean chemistry trends and analyzes relations between these trends and carbon sources, cycles, and hu-man activities. The USGS has been pioneer-ing work to improve capabilities in measur-ing marine carbonate species and metabolic cycles that affect carbon compounds (http://coastal.er.usgs.gov/fl ash/), as well as char-acterizing CO2 concentrations in a wide vari-ety of marine environments (http://coastal.er.usgs.gov/crest/).
As part of that effort, USGS scientists are participating in a unique opportunity to sample the remote waters of the Arctic Ocean during the 2010 U.S.-Canada Ex-tended Continental Shelf Survey research expedition on board the U.S. Coast Guard vessel Healy from August 2 to September 6, 2010. (See related article “Scientists Set Sail to Map the Arctic Seafl oor,” this issue.) By collecting CO2 data and related chemi-cal samples in the largely uncharted Arctic waters, scientists will fi ll important gaps of knowledge that will contribute to better un-derstanding of the impacts of CO2 on ocean chemistry, trends in ocean acidifi cation, and
Ocean Acidifi cation: Research on Top of the WorldBy Ann Tihansky
USGS and University of South Florida (USF) scientists will be aboard the U.S. Coast Guard Cutter Healy, which is designed to conduct a wide range of research activities.
Scientists use a rosette off the deck of the Healy to take Arctic Ocean water samples.
4August/September 2010 Sound Waves
Fieldwork, continued
Fieldwork
(Ocean Acidifi cation continued on page 5)
implications for climate change. “Models suggest that the Arctic is already under-saturated with respect to carbonate min-erals during part of the year,” said Lisa Robbins, USGS oceanographer. “Our data will provide important baseline informa-tion about this region that looks at marine carbonate chemistry; saturation states, dis-solution potential and the role microbial communities play in carbon cycling.”
“Shiptime research is very expensive, so ‘piggy-backing’ science missions is always a good idea if it can be arranged to the benefi t of all parties,” said Robbins. Working together in the Arctic region and collecting such robust datasets will likely serve multiple uses and lines of research. “When scientists coordinate science ac-tivities in close proximity to one another, it creates a rich environment for dialogue and exchange. As we work together, ideas are cross-pollinated and everyone in-volved develops improved understanding. These are the kind of synergistic benefi ts that will take place during this research cruise,” said Robbins. It is likely that these benefi ts will continue to be realized long after the data have been collected.
A highly specialized, collaborative team has been assembled for the Arctic cruise and includes USGS senior scientists Lisa Robbins and Kim Yates, and University of South Florida’s (USF) College of Ma-rine Science Professor Bob Byrne, along with technicians Chris Dufore (USGS), and Mark Patsavas (USF), and research associate Xuewu Liu (USF). During the cruise, discrete water samples will be col-lected along track lines and through the water column. They will be analyzed both on board the Healy and back in the USGS laboratory in St. Petersburg, Florida. Ad-ditionally, state-of-the-art equipment pio-neered by Byrne’s laboratory will provide “fl ow-through” data on the concentrations of total carbon and carbon dioxide in seawater, measured as the partial pres-sure expressed as pCO2, since it is in gas form. The system will also measure pH using highly precise spectrophotometric methods. For the fi rst time, in-place mea-surement of carbonate ion concentrations will be attempted. Bacterial community samples will also be collected, along
with nutrients, dissolved organic carbon, and oxygen and carbon isotope samples. USGS microbiologist John Lisle will ana-lyze microbial samples. The team has been working for months preparing analytical and sampling equipment for the extended time at sea.
The USGS ocean acidifi cation team–Lisa Robbins, Kim Yates, and Chris Dufore–participated in a high profi le, fi rst-of-its-kind, National Science Foundation (NSF)-sponsored short course on ocean acidifi cation in November 2009 at Woods Hole Oceanographic Institution. Yates and Dufore demonstrated and taught spectro-photometric pH and alkalinity techniques, experimental techniques, and data analysis methods. Robbins, an invited member of the organizing committee for this unique short course, worked with the other mem-bers to develop the course content and agenda. Yates was chosen as one of 20 international expert scientists to lecture on specifi c topics in ocean acidifi cation. Yates discussed manipulation of carbonate system parameters in ocean acidifi cation experiments. The state-of-the-art analyti-cal methods that she and Dufore demon-strated are used in the USGS laboratory in St. Petersburg, Florida.
This dataset will fi ll knowledge gaps in the global map of ocean carbon species and will be shared with the international scientifi c community. For more than 10 years, the USGS team has been working to characterize carbon species found in different marine environments. “We have detailed information from tropical waters,
temperate waters, and open ocean as well as continental shelves. The data from the Arctic Ocean will give us the ability to compare trends from the equator to those observed at the Earth’s poles,” said Kim Yates, research oceanographer.
Understanding climate change in the Arctic, including ocean acidifi cation, is of high priority to the U.S. Department of the Interior’s Secretary Salazar. Potential impacts from observed trends will have broad global infl uence affecting the sea-food industry, coral reef health, sedimenta-tion patterns, carbon management policies and related economic impacts, as well as future climate. USGS science is critical for making informed policy decisions and in developing strategies to address ocean acidifi cation with the global community.
Robbins participates on the Interagency Working Group on Ocean Acidifi ca-tion (IWG-OA) (http://www.nopp.org/committees/iwg-op/, http://www.nopp.org/2010/newly-established-ocean-acidi-fi cation-task-force-holds-fi rst-meeting/). The IWG-OA was formed as a result of the Federal Ocean Acidifi cation Research and Monitoring (FOARAM) Act of 2009, which calls for an interagency working group (IWG) under the Joint Subcom-mittee on Ocean Science and Technology (JSOST) to develop a strategic research plan and to coordinate Federal ocean acidifi cation activities. This Act also calls for the establishment of a Federal ocean acidifi cation program. An initial report from the IWG-OA was sent to Congress in
USGS scientist Kim Yates (right) instructs students during a laboratory demonstration on ocean-acidifi cation techniques in Woods Hole, Massachusetts.
(Ocean Acidifi cation continued from page 3)
5 Sound Waves August/September 2010Fieldwork
Fieldwork, continued
(Ocean Acidifi cation continued from page 4)
(Coral Larvae continued on page 6)
March 2010, and the Strategic Plan is cur-rently being written, with intent to deliver it to Congress in 2011.
The USGS also participates in the Arc-tic Mapping and Assessment Program, part of the Nordic Council (http://www.arctic-portal.org/science/). Robbins and Yates worked with other scientists to co-author an Arctic Ocean Acidifi cation Scoping pa-per. Robbins presented the Scoping paper to the Arctic Monitoring and Assessment Program (AMAP) in February 2010.
The data from this research cruise will be shared with AMAP and the rest of the global scientifi c community. They will help expand knowledge and capabilities of scientists worldwide to understand future ocean and climate trends and impacts.
Follow the research team on the Healy at http://continentalshelf.gov/.
More information about the expedition can be found at http://www.icefl oe.net/
USGS technician Chris Dufore dem-onstrates pH and alkalinity techniques at the ocean-acidifi cation class in Woods Hole, Mas-sachusetts.
reports_healy.html and http://www.uscg.mil/pacarea/cgcHealy/.
Further information on interagency science bodies and committees address-
ing the ocean acidifi cation problem can be found at http://www.us-ocb.org/ and http://www.nopp.org/committees/iwg-op/.
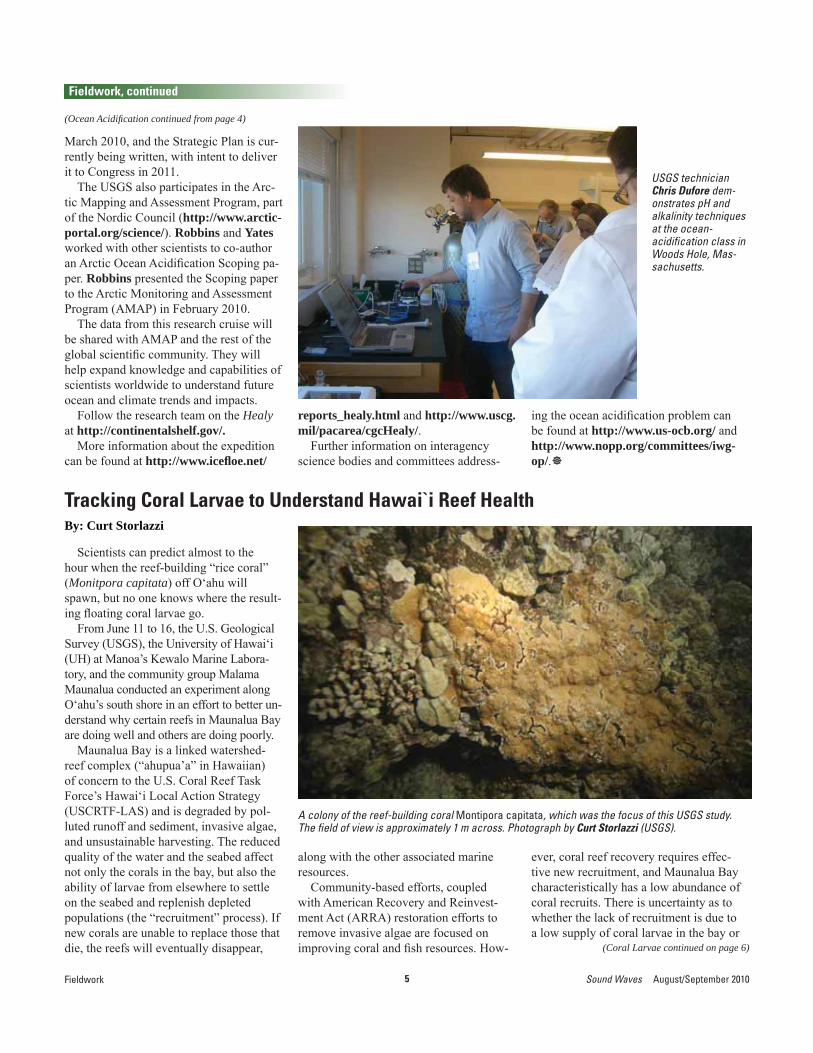
Scientists can predict almost to the hour when the reef-building “rice coral” (Monitpora capitata) off O‘ahu will spawn, but no one knows where the result-ing fl oating coral larvae go.
From June 11 to 16, the U.S. Geological Survey (USGS), the University of Hawai‘i (UH) at Manoa’s Kewalo Marine Labora-tory, and the community group Malama Maunalua conducted an experiment along O‘ahu’s south shore in an effort to better un-derstand why certain reefs in Maunalua Bay are doing well and others are doing poorly.
Maunalua Bay is a linked watershed-reef complex (“ahupua’a” in Hawaiian) of concern to the U.S. Coral Reef Task Force’s Hawai‘i Local Action Strategy (USCRTF-LAS) and is degraded by pol-luted runoff and sediment, invasive algae, and unsustainable harvesting. The reduced quality of the water and the seabed affect not only the corals in the bay, but also the ability of larvae from elsewhere to settle on the seabed and replenish depleted populations (the “recruitment” process). If new corals are unable to replace those that die, the reefs will eventually disappear,
Tracking Coral Larvae to Understand Hawai`i Reef HealthBy: Curt Storlazzi
along with the other associated marine resources.
Community-based efforts, coupled with American Recovery and Reinvest-ment Act (ARRA) restoration efforts to remove invasive algae are focused on improving coral and fi sh resources. How-
ever, coral reef recovery requires effec-tive new recruitment, and Maunalua Bay characteristically has a low abundance of coral recruits. There is uncertainty as to whether the lack of recruitment is due to a low supply of coral larvae in the bay or
A colony of the reef-building coral Montipora capitata, which was the focus of this USGS study. The fi eld of view is approximately 1 m across. Photograph by Curt Storlazzi (USGS).
6August/September 2010 Sound Waves Fieldwork
Fieldwork, continued
(Coral Larvae continued from page 5)
to anthropogenic stressors that impair the recruitment success.
To help resolve this question, a mul-tipartner experiment to investigate coral spawning and recruitment in Maunalua Bay was conducted this past June. The study focused on the coral species Monit-pora capitata. It is a major reef builder in Hawai‘i, and the large size of the plan-ula (free-swimming) larvae (0.75–1.50 mm) allows optical and acoustic detection of the larvae during the spawning event. The peak spawning periods for Monitpora capitata in Hawai‘i are around the summer new moon between 9:00 and 11:00 PM Hawaiian Standard Time (HST). This year, Monitpora capitata spawning began the evening of Saturday, June 12th.
Scientists Curt Storlazzi, Josh Lo-gan, Kathy Presto, Tom Reiss, and Pete Dal Ferro (all USGS, Santa Cruz) collected information on circulation and water-column properties of Maunalua Bay during summer spawning conditions, complementing a dataset collected during the 2008-2009 winter. They were hosted by and collaborated with Robert Rich-mond (UH Kewalo Marine Laboratory), his students, and other staff at the Kewalo Marine Laboratory. Team members us-ing scuba equipment conducted nightly fi xed-station monitoring of select coral colonies before, during, and after spawn-
ing to determine the proportion of coral colonies spawning during the event. Sat-ellite-tracked Global Positioning System (GPS) drifters were deployed above select reefs after spawning each night to track the movement of the buoyant coral larvae to determine if they are being retained in or carried out of Maunalua Bay. The team also surveyed current speeds and direc-tions along more than 20 km of transects and water-column properties at more than 15 locations daily by boat before, during, and following the June spawning event. These surveys will provide information on hydrography of the bay during sum-mer conditions and will allow scientists to identify the presence of eddies and shear zones in the bay that help to retain larvae or sediment, nutrients, or contaminants.
The relatively short-duration ves-sel surveys are being supplemented by longer-term measurements of currents and water-column properties at a number of fi xed stations in the bay from June through the end of September. For the June ves-sel surveys and the four longer-term fi xed stations, the team used 600-kHz acoustic Doppler current profi lers (ADCPs) to col-lect acoustic backscatter data. These data allowed them to image the Monitpora capitata larvae and quantify the relative intensity of spawning events. Collectively, the combination of mobile vessel surveys and fi xed instrument deployments put the intensive June measurement efforts in the context of the full June-September Monit-
pora capitata spawning season. Once scientists understand the circulation, larval dispersal patterns, and “connectivity” be-tween reefs, areas where reef recovery ef-forts should be focused can be identifi ed.
While on-the-reef studies were tak-ing place, Renee Takesue (USGS, Santa Cruz) worked with staff and volunteers from Malama Maunalua to collect sedi-ment samples from the coral reef fl at and the adjacent watersheds to determine the source(s) of the terrestrial sediment on the reef fl at using geochemical means. Re-nee was joined on the reef fl at by Cheryl Hapke (USGS, Woods Hole), who was collecting ground-truthing information for her effort to use historical aerial imagery to detect and map changes on the reef fl at over the past 70 years.
At a reception hosted by Malama Maunalua, USGS scientists gave a public lecture for the community. The USGS and UH researchers were also interviewed by the local CBS affi liate (a nightly news “top story”), Hawaiian Public Radio, and the Star-Advertiser, Hawai‘i’s largest newspa-per. See “Scientists seek data as corals get frisky” (http://www.staradvertiser.com/news/20100611_Scientists_seek_data_as_corals_get_frisky.html), “Secret love lives of Oahu’s reefs unveiled” (http://www.hawaiinewsnow.com/Global/story.asp?S=12638586), and “Tracking Coral Larvae to Understand Hawai‘i Reef Health” (http://www.sciencedaily.com/releases/2010/06/100609092658.htm).
Pete Dal Ferro (left) and Curt Storlazzi (right) preparing to enter the water at 9 PM HST to monitor the coral spawning in Maunalua Bay. Photograph by Kathy Presto (USGS).
A satellite-tracked GPS drifter off Diamond Head, O`ahu, just before recovery. The elec-tronics are housed in the orange sphere, the large white diamond is the drogue that is cali-brated to make the entire package drift at the same speed as the currents. Photograph by Josh Logan (USGS).
7 Sound Waves August/September 2010
Fieldwork, continued
Fieldwork
(New Zealand continued on page 8)
Fieldwork on the North Island of New Zealand is contributing to a more global view of how wetlands function and how they may respond to climate change and other human-driven impacts. USGS sci-entist Karen McKee spent 5 months con-ducting research alongside New Zealand colleagues and other collaborators.
From January 10 to May 25, 2010, Mc-Kee participated in two projects aimed at a better understanding of wetlands in both the Southern and Northern Hemispheres. One project focused on freshwater wetlands in New Zealand and their vulnerability to nutrients; the other investigated the southernmost populations of mangrove, a subtropical/tropical coastal tree, and how climate change and other factors may affect mangrove expansion where their distribu-tion overlaps with temperate salt marsh.
Where is New Zealand and What Was it Like to Do Fieldwork There?
New Zealand, which consists of two main islands and numerous smaller is-lands, is located in the Southern Hemi-sphere about 1,250 miles southeast of Aus-tralia and 1,500 miles north of Antarctica. The country is characterized by dramatic topography (from low-lying coastal areas to the peaks of the Southern Alps) and a complex climate (warm subtropical in the north, cool temperate in the south, severe alpine in mountainous regions). This var-ied landscape is contained within only 103,483 square miles (about the size of Oregon) and has a human population of just over 4 million. New Zealand straddles the Pacifi c and Australian tectonic plates and is characterized by periodic earth-quakes and volcanism. Because of its long isolation from the rest of the world, New Zealand boasts an extraordinary biota—about 80 percent of its plant species are endemic. However, since European settle-ment, much of the native forest has been cleared, and many nonnative species of plants and animals have been introduced.
Fieldwork in New Zealand was often challenging. Researchers had to traverse
Fieldwork in New Zealand: Comparisons Between Northern and Southern Hemisphere WetlandsBy Karen L. McKee
large expanses of pasture and dodge graz-ing livestock to access freshwater wet-lands, which were often located in isolated pockets far from roads and navigable waterways. Access to mangrove study sites along the coast required consider-able hiking and was complicated by the large (6-9 ft) tide range—researchers had to plan carefully to avoid being stranded. Fortunately, there are few dangerous ani-mals in New Zealand, ticks and tick-borne diseases are rare, and there is only one species of venomous spider. Except for stinging nettles (Urtica species), there are few poisonous plants.
Why Study Wetlands in New Zealand? Temperate wetlands in the Northern
Hemisphere have been well studied, and this research underlies much of what is known about wetland structure and function. In contrast, much less is known about wetlands in the Southern Hemisphere, particularly in geographically isolated locations such as New Zealand. New Zealand wetlands contain unique indigenous fl ora and fauna, which are found nowhere else. These wet-lands provide many of the same goods and services as do northern, temperate wetlands and are consequently important natural re-
Left: location map modifi ed from U.S. Central Intelligence Agency locator map of New Zea-land (https://www.cia.gov/library/publications/the-worldfactbook/geos/nz.html); right: satel-lite image from Visible Earth, NASA (http://visibleearth.nasa.gov/view_rec.php?id=6743).
USGS scientist Karen McKee (right) and Scott Bartlam (left) of Landcare Research trek across pastures and steep slopes to reach their destination—the Toreparu freshwater wetland (arrow) on the North Island of New Zealand. The Tasman Sea is just visible on the horizon.
8August/September 2010 Sound Waves
Fieldwork, continued
Fieldwork
(New Zealand continued from page 7)
(New Zealand continued on page 9)
sources. Also, as in many other locations worldwide, New Zealand has lost a sub-stantial portion of its wetlands to fragmen-tation, conversion to other uses, nutrient enrichment, and invasive species.
This study will help determine to what extent our understanding of biodiversity and ecosystem processes, based on north-ern, temperate wetlands, can be applied to New Zealand and other Southern Hemi-sphere locations. Of perhaps greater impor-tance, information from Southern Hemi-sphere wetlands can be used in conjunction with that from Northern Hemisphere to develop a broader database with which questions regarding resilience and impacts of global change can be addressed at a broader scale. This type of information is particularly needed to predict how wetlands worldwide will respond to climate change, sea-level rise, and eutrophication (the proc-ess by which a body of water becomes en-riched in dissolved nutrients that stimulate the growth of aquatic plant life, commonly resulting in excessive algal blooms and the depletion of dissolved oxygen).
Effects of Nutrients on New Zealand Freshwater Wetlands
McKee joined an international team of scientists led by Landcare Research, one of several Crown (government) Research Institutes in New Zealand, to investigate effects of nutrient enrichment on freshwa-ter wetlands. Recent land-use conversion to dairy farming has greatly promoted
polluted runoff into wetlands and inva-sion by weeds. Wetlands in the United States are similarly threatened by nutrient enrichment and invasive species, although the species involved as well as pollution sources and extent of infl uence may differ.
According to Bev Clarkson of Landcare Research, the goal of the New Zealand re-search program is to “improve management and restoration strategies for landowners, managers, and policymakers.” To address this goal, research is focused on gaining a “functional understanding of how modifi ca-tion of water and nutrient regimes impacts biodiversity, cultural values, and ecosystem services in a range of wetland types.” A unique aspect of this research program is its explicit involvement of native Māori in restoration case studies, development of cultural indicators, training of emerging researchers, and development of end-user products, such as a Web-based handbook on restoration of cultural wetlands.
McKee is participating in a study of freshwater wetlands to determine if they are functionally similar to temperate wet-lands in the Northern Hemisphere, despite fl oristic differences. The study involves ex-perimental additions of nutrients (nitrogen
New Zealand and USGS scientists are studying how nutrient inputs are affecting freshwater bogs, especially peat formation. Scott Bar-tlam (inset) is holding a root ingrowth bag, which will be used to measure belowground (root) production.
Locations (red dots) of mangrove (Avicennia ma-rina subsp. australacasica) populations in New Zealand (modifi ed from Morrisey and others, 2007). Near the southernmost limits of distribu-tion, mangrove growth is stunted owing to more frequent frost and shorter growing season.
9 Sound Waves August/September 2010Fieldwork
Fieldwork, continued
(New Zealand continued from page 8)
Restoration of peat mine areas in New Zealand is being encouraged by scientists in partnership with private land owners. Researchers are investigating ways to promote rapid revegetation by na-tive peat-forming species and to discourage weed invasion. Clockwise from top left: satellite view (Google Earth) of the Hauraki Plains (red dot on inset index map) with extensive peat deposits (dark brown = active peat mine); ground view of peat mining operation; initiation of restoration by seed-ing; restored bog with native plants.
and phosphorus) to wetlands at different successional stages and hypothesized sen-sitivity to enrichment.
McKee’s role is to provide expertise in assessing belowground (roots) responses to nutrients by wetland plants of New Zealand and to participate in and advise on other aspects of the research. During this initial fi eldwork, McKee and other proj-ect participants began measurements of belowground productivity, which will be completed in 2011.
A Comparison of Mangroves at North-ern and Southern Limits of Distribution
McKee also participated in a second project, which focused on coastal wetlands and involved colleagues from the National Institute for Water and Atmospheric Re-search (NIWA) (New Zealand), the Uni-versity of Queensland (Australia) and the Smithsonian Institution (United States). Fieldwork on this project was initiated several years ago and assessed nutrient controls on mangroves in the Southern Hemisphere (Australia and New Zealand).
New Zealand has a single indigenous species of mangrove, Avicennia marina subsp. australacasica, which is restricted to the North Island of New Zealand, New Caledonia, Lord Howe Island, and the southern tip of Australia. Its Northern Hemi-sphere counterpart, Avicennia germinans (black mangrove), grows at its northernmost limits in Louisiana, where McKee also has study sites. At their northern and southern limits, mangroves intergrade with temperate marsh plants, with which they compete for space, light, and nutrients. In both settings, mangroves are expanding in area, although the causes for expansion appear to differ.
In previous research, McKee has ex-amined effects of elevated carbon dioxide on A. germinans in Louisiana and effects on competition with salt marsh species; she and her colleague Jill Rooth pub-lished a paper on this subject in Global Change Biology (2008, vol. 14, p. 971-984, http://dx.doi.org/10.1111/j.1365-2486.2008.01547.x). In addition, McKee coauthored a book chapter on salt marsh-mangrove interactions in Australia and the Americas for inclusion in Coastal Wetlands, An Integrated System Approach,
published in 2009 by Elsevier (http://www.elsevier.com/wps/fi nd/bookdescrip-tion.cws_home/716674/description).
During fi eldwork in New Zealand, McKee examined characteristics of man-groves for comparison with mangroves at their northern limits along the Gulf of Mexico. She traveled along both coasts of the North Island in New Zealand conduct-ing measurements and making observa-tions of mangroves and associated marsh vegetation.
Wetland Restoration in New Zealand McKee also visited wetland restoration
sites to observe methods and learn about cooperative efforts between government researchers and private companies. Peat mining, which involves surface excavation of peat bogs, is an important industry in New Zealand. Some mining companies are cooperating with New Zealand scientists to restore the native bog vegetation in mined areas to allow for future peat formation. McKee visited one mine in the Hauraki Plains region, where researchers had con-ducted a study to determine the best plant-
ing, fertilization, and cultivation techniques to promote rapid revegetation by the pri-mary peat-forming plants and to minimize invasion by weeds. The results of this study will assist the mining operation in design-ing protocols for postharvest restoration.
By studying and comparing diverse wetlands, USGS scientists can develop more accurate models to predict future changes due to human activities as well as to natural disturbances. Research on wetlands outside of the United States, especially with respect to global change factors, is necessary to fully understand and predict how wetlands in general may respond in the future. By identifying how differences and similarities in structure and function infl uence wetland resilience, scientists can better predict how specifi c wetlands in the United States will fare in the future and to design appropriate man-agement and restoration plans. In addition, participation in international research projects leads to new ideas and methods for protecting and conserving the Nation’s natural resources.
10August/September 2010 Sound Waves Research
Research
(Dry Tortugas continued on page 11)
This is the fi rst in a series of articles looking at Coral Reef Ecosystem Studies research projects taking place in Dry Tortu-gas National Park. Stay tuned for the next edition of Sound Waves in which we look at ocean acidifi cation and coral calcifi cation.
About 70 miles west of Key West, at the terminus of the Florida Keys, lies a cluster of tiny islands. These islands and the 100 square miles of surrounding water consti-tute Dry Tortugas National Park. Protected by the U.S. National Park Service since 1935, this isolated area in the southeast-ern Gulf of Mexico is rich in marine life, making it a valuable location for scientifi c research. Scientists from the U.S Geologi-cal Survey (USGS) Coral Reef Ecosystem Studies (CREST) Project in St. Petersburg, Florida, conduct fi eld studies in the Dry Tortugas to monitor and study the health of shallow-water reef environments and to improve our understanding of global issues such as climate change and ocean acidifi cation.
The various research activities and re-mote location of the National Park require detailed coordination and logistical plan-ning. Research teams spend days travel-ing and rely on the National Park Service for accommodations—often on board the 110-ft M/V Fort Jefferson, operated by Captains Clayton “Blue” Douglass, Janie Douglass, and John Spade. With the ex-cellent support of the vessel’s crew, scien-tists eat, sleep, and work round the clock setting up equipment, collecting data, and conducting surveys for as much as two weeks at a time.
“Tortugas work takes a lot of logistical planning,” said USGS research ecologist Kristen Hart. “We use the National Park Service ship a lot. We work with the cap-tains; we plan out our schedules, and they work to accommodate our needs and crazy work hours. We often need to have all our equipment and permits in place, some-times months in advance.”
The Dry Tortugas offers a unique re-search setting away from human activi-ties. This makes it an ideal control site to compare to other areas where signifi cant
Dry Tortugas National Park: a Unique Setting for USGS Marine ResearchBy Matthew Cimitile
local-scale impacts on natural resources have taken place. Scientists with the CREST project have been working in the area for several years. Current tasks in-clude research on coral calcifi cation rates, monitoring coral reef community metabo-lism, investigating coral disease causes and processes, using historical coral core data to assess past ocean chemistry and temperature, and mapping and monitoring benthic habitats. This last task is overseen by USGS oceanographer Dave Zawada.
Detailed maps are essential to efforts for conserving and managing ecosystems. Characterizing the composition and condi-tion of benthic habitats provides a basis for assessing changes and monitoring the progress of restoration efforts. To collect such data, Zawada developed and oper-ates a noninvasive observing system called the Along-Track Reef-Imaging System (ATRIS), which simultaneously acquires geo-located, color digital images and water-depth measurements. ATRIS can be deployed either from an adjustable pole mounted to the side of a boat (“shallow” confi guration) or from a towed vehicle at
depths of 27 m (“deep” confi guration). The same camera and acquisition software are used for both operating modes.
“ATRIS provides us with information about the condition and type of substrate. From transects over an area, we can start to obtain estimates of the percent coverage and abundance of corals, sponges, vegeta-tion, and other organisms on the seafl oor. We can also get information pertaining
Consisting mostly of water and submerged land, Dry Tortugas National Park is home to abundant wildlife and important aquatic ecosystems and is a valuable location for scientifi c research.
Index map showing the location of Dry Tortugas National Park.
11 Sound Waves August/September 2010Research
Research, continued
(Dry Tortugas continued from page 10)
(Coral Records continued on page 12)
to the physical state of the habitat,” said Zawada.
ATRIS images can be combined to cre-ate an image mosaic, allowing compari-sons to previous ATRIS datasets of the same area to track changes over time. This capability is particularly useful with the possibility of oil impacting marine habitats. In 2009, Zawada and his team used ATRIS to map 163 km of seafl oor in Dry Tortugas National Park, yielding nearly 460,000 color digital images. Should oil from the Deepwater Horizon leak reach the Park, this pre-event image collection establishes a baseline for evaluating oil impacts.
In the Dry Tortugas, ATRIS images are also being used to study and monitor the forag-ing, grazing, and transiting of threatened and endangered sea turtles. Green, hawksbill, and loggerhead sea turtles are being tagged and tracked to determine spatial and temporal hab-itat-use patterns. ATRIS data are used to deter-
mine the amount of time sea turtles spend in and around various habitats and zones. Blood and tissue samples are also collected from turtles to gain important dietary and genetic material. Together, the information is used to track the whereabouts and conditions of these endangered marine species.
Zawada and Hart recently submitted their fi rst manuscript, using ATRIS to map areas Hart had determined were core-use
zones for loggerhead females during the time in between successive nests, called the internesting period. Females usually lay a nest every two weeks during a nest-ing season, which typically occurs from May through early August in the Dry Tor-tugas. This year, Zawada and Hart will continue their ongoing research, making observations and captures near the end of the nesting season in late July.
Deep ATRIS is a critical tool used in characterizing the preferred habitat of endan-gered and threat-ened turtles in the Dry Tortugas.
A green sea turtle, captured photographically with deep ATRIS, navigates through vegetation on the seafl oor in the Dry Tortugas in 2009.
This sandy beach is a prime spot for turtle nesting in Dry Tortu-gas National Park.
Coral Records of Sediment Input to the Fringing Reef of Moloka`i, Hawai`iby: Nancy G. Prouty
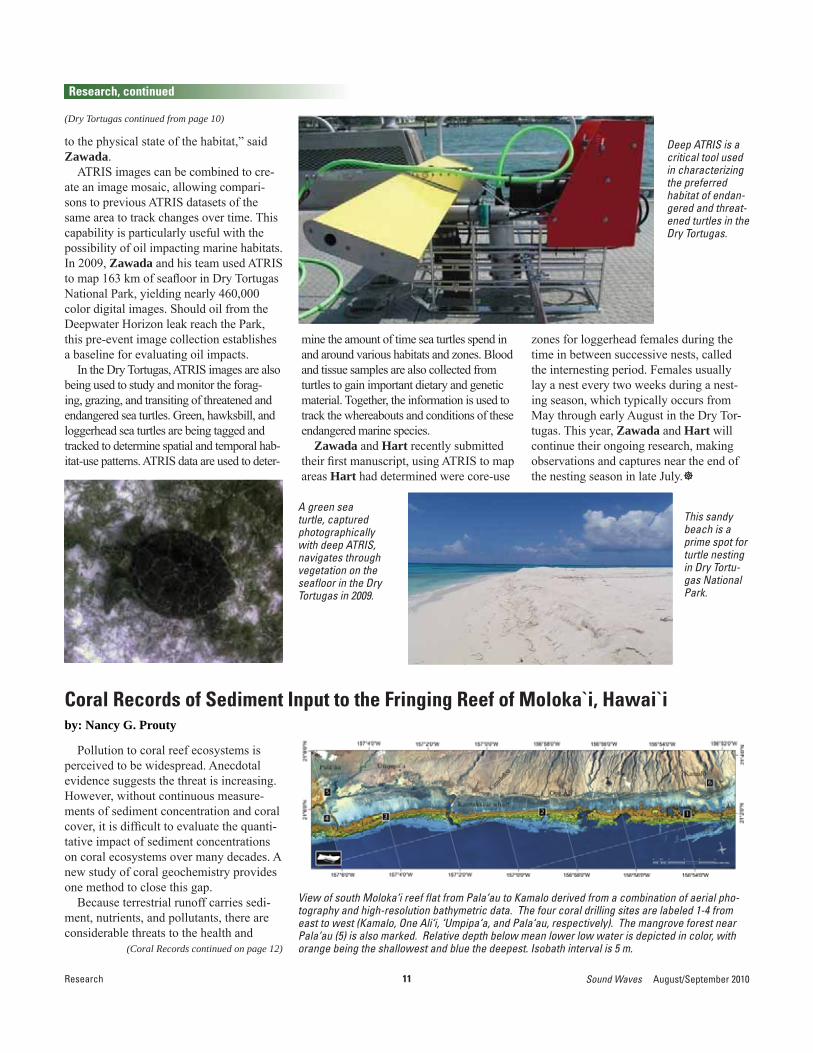
View of south Moloka‘i reef fl at from Pala‘au to Kamalo derived from a combination of aerial pho-tography and high-resolution bathymetric data. The four coral drilling sites are labeled 1-4 from east to west (Kamalo, One Ali‘i, ‘Umpipa‘a, and Pala‘au, respectively). The mangrove forest near Pala‘au (5) is also marked. Relative depth below mean lower low water is depicted in color, with orange being the shallowest and blue the deepest. Isobath interval is 5 m.
Pollution to coral reef ecosystems is perceived to be widespread. Anecdotal evidence suggests the threat is increasing. However, without continuous measure-ments of sediment concentration and coral cover, it is diffi cult to evaluate the quanti-tative impact of sediment concentrations on coral ecosystems over many decades. A new study of coral geochemistry provides one method to close this gap.
Because terrestrial runoff carries sedi-ment, nutrients, and pollutants, there are considerable threats to the health and
12August/September 2010 Sound Waves
Research, continued
(Coral Records continued on page 13)
Research
of Moloka‘i is widely recognized as one of the most impacted large coral ecosystems in Hawai‘i. Anecdotal evidence sug-gests the level of sediment on the reef has increased over the past several de-cades. This has prompted several U.S. Geological Survey (USGS) studies aimed at understanding the dynamics of sediment transport and its impact on coral reef health. See “The Coral Reef of South Moloka‘i, Hawai‘i—Por-trait of a Sediment-Threat-ened Fringing Reef,” U.S. Geological Survey Scien-tifi c Investigations Report 2007-5101, edited by Mi-chael Field, Susan Co-chran, Josh Logan, and Curt Storlazzi (http://
Coral records of Ba/Ca, Fe/Ca, and Al/Ca from the ‘Umpipa‘a record (1921-2005) capture the increase of terrigenous input during the mid-1930s (shaded region), presumably linked to a rapid mangrove expansion from 1915 to 1940 as a result of the Hawaiian Homestead lands opened to farming.
Theoretical model indicating gradients of sediment loading (coral Ba/Ca variance) and sediment storage capacity (mean coral Ba/Ca) and relative coral response (inverse of average coral growth rates). Those sites with elevated sediment loading and low sediment storage (for example, One Ali‘i) yield a higher coral response, whereas coral growth rates from sites with a greater capacity to store sediment (for example, Pala‘au) will not be as greatly impacted.
resilience of corals. Increased sediment concentrations in the water and on the seabed may bury coral in place, reduce its ability to recruit (add new corals to the population), reduce the amount of light available for photosynthesis, and promote harmful algal growth—ultimately leading to changes in species composition and re-duced coral growth.
The watersheds of the Hawaiian Is-lands have experienced land-use changes over the past 200 years. Cultivation, overgrazing, and wildfi res have exposed fi ne volcanic sands, silts, and clays to ero-sion. The fringing reef off the south coast
(Coral Records continued from page 11)
rivers. The coral Ba concentration was used to calculate the Ba EREM concen-trations from the closest point of river discharge, the Kawela Gulch. This value was consistent with upstream Kawela storm runoff samples collected in Novem-ber 2007 following peak river discharge. Baseline Ba EREM calculations were also consistent with dissolved Ba concentra-tions in seawater measured offshore from the Kawela Gulch during a nonstorm sampling event. Comparable values of the coral calculated Ba EREM concentra-tions relative to both empirical storm and baseline Ba concentrations suggest that coral Ba/Ca ratios proportionately record nearshore dissolved Ba concentrations off the South Moloka‘i reef fl at.
Second-order processes such as resus-pension, however, can signifi cantly alter the barium budget in the nearshore envi-ronment. Field observations by USGS sci-entists Curt Storlazzi, Kathy Presto, and Mike Field and academic colleague An-drea Ogston (University of Washington) suggest that during windy afternoons and evenings, suspended sediment concentra-tions can be in excess of those reported to be injurious to corals. This is particularly
pubs.usgs.gov/sir/2007/5101/).To test the hypothesis that sedimenta-
tion has increased over time, the present study used barium-to-calcium (Ba/Ca) ra-tios as a measure of sediment input to the reef on timescales of decades to centuries. Ba is desorbed and incorporated into the coral skeleton upon contact with seawater in amounts that depend on the concentra-tion of clay and silt particles in the water column. Because Ba is sourced from the fi ne-grained components of terrestrial soil, it is a proxy for the amount of land-based sediment in the coral environment.
Working with Malcolm McCulloch and Stacy Jupiter (Australian National University), USGS scientists Nancy Prouty, Mike Field, Curt Storlazzi, and Josh Logan drilled and recovered coral cores from four sites along the fringing reef of the south-shore of Moloka‘i from living scleractinian (stony) corals (Porites lobata). The cores were analyzed for their chemical content to determine if the level of sediment on the reef has increased over the last several decades.
The Effective River End-Member (EREM) concentration was calculated to gain information about the dissolved or solid Ba concentration in the contributing
13 Sound Waves August/September 2010
(Coral Records continued from page 12)
Research, Meetings
Research, continued
true during storms and under swell condi-tions when waves propagating onto the reef fl at during high tide resuspend large amounts of sediment and subsequently al-ter the marine Ba budget.
This study shows that controls on coral Ba/Ca ratios are a combination of sedi-ment supply (upslope sources), sediment accommodation space (storage capacity), and resuspension. For example, coral Ba/Ca ratios were found to vary inversely to growth rate if sediment supply was relatively constant. If sediment storage capacity is suffi cient (for example, via mangrove forest) and allows for periods of “recovery” when turbidity levels are reduced, then coral Ba/Ca values return to baseline values and overall growth rates are not reduced. Therefore, variability in coral Ba/Ca along the south shore of Moloka‘i can be explained by differences in sinks as well as sources.
For example, coral Ba/Ca variability at ‘Umpipa‘a, a coring site on the western side of the reef fl at, is sensitive to pulses of sediment discharge associated with nearby coastal modifi cation and episodic releases of sediment from the mangroves when its carrying capacity is breached. In particu-lar, Ba/Ca ratios increased signifi cantly in the mid-1930s and were accompanied by elevated Fe/Ca and Al/Ca ratios during that time, as well as a reduction in growth rate. Historical aerial photographs show a rapid mangrove expansion from 1915 to
1940, when shoreline progradation rates (rates at which the shoreline was being built seaward) reached a maximum of 27 m/year (read more about mangroves and their effects on coastal change in chapter 16 of “The Coral Reef of South Moloka‘i, Hawai‘i—Portrait of a Sediment-Threat-ened Fringing Reef”). Accelerated pro-gradation rates from 1915 to 1940 are not surprising because, by the 1920s, much of the Ho‘olehua Saddle was set aside as Ha-waiian Homestead lands and was opened to farming. With the muds enriched in metals such as Fe and Ba, progradation of the shoreline most likely acted as a mobile mud-belt source to the reef.
With this information, a theoretical model can be constructed indicating gradi-
ents of sediment loading (source) and sedi-ment storage (sink) and relative response of coral growth. This information can help resource managers calculate trajectories of coral reef health related to future land-use change and climate change, because both processes will affect the supply and stor-age of sediment to the reef fl at.
The complete reference for the new publication is: Prouty, Nancy G., Field, Michael E., Stock, Jonathan D., Jupiter, Stacy D., and McCulloch, Malcolm D., in press, Coral Ba/Ca records of sediment in-put to the fringing reef of the southshore of Moloka‘i, Hawai‘i over the last several de-cades: Marine Pollution Bulletin, 10.1016/j.marpolbul.2010.05.024 [http://dx.doi.org/10.1016/j.rpolbul.2010.05.024].
USGS Scientists (left to right) Josh Logan, Nancy Prouty, and Curt Storlazzi recovering coral cores from Moloka‘i, Hawai‘i in order to reconstruct sediment impacts to the fringing reef over the last cen-tury.
Meetings
Coastal Zone 2011 will be held July 17-21, 2011, at the Hyatt Regency in Chi-cago, Illinois. In keeping with the location and acknowledging the changing coastal and ocean landscape, the overall confer-ence theme is “Winds of Change: Great Lakes, Great Oceans, Great Communi-ties.” Sessions will be organized around four conference tracks: Planning for Resil-ient Great Lakes, Coasts, and Ecosystems; Healthy Habitats, Healthy Coastal and Great Lakes Communities; Observing, Modeling, and Monitoring; and Vibrant
Save the Date for Coastal Zone 2011!
Coastal, Great Lakes, and Marine Econo-mies. Abstracts for panel and oral presen-tations, posters, cafe conversations, and training workshops are due on October 8, 2010, and must be submitted online.
U.S. Geological Survey (USGS) sci-entists have participated in this meeting in the past (see related article in Sound Waves, September 2007, http://sound-waves.usgs.gov/2007/09/meetings.html) and USGS scientists Ann Tihansky, Norm Granneman, and Susan Russell-Robinson are members of the Coastal
Zone 2011 planning team.Conference partners include the Na-
tional Oceanic and Atmospheric Adminis-tration, the Department of the Interior, the U.S. Environmental Protection Agency, the U.S. Army Corps of Engineers, and the Illinois Department of Natural Resources. As it becomes available, more information about the conference program and abstract submission will be posted at http://www.doi.gov/initiatives/CZ11/index.htm.
14August/September 2010 Sound Waves
The Science Center of Pinellas (http://www.sciencecenterofpinellas.org/) in-vited U.S. Geological Survey (USGS) scientists from the Coastal Change Haz-ards Project to participate in their second annual Hurricanes and Other Natural Disasters Expo held on June 5, 2010, in St. Petersburg, Florida. Three hundred and fi fty people attended. The event was held to coincide with the beginning of hur-ricane season, which began June 1st and lasts until November 30th.
Oceanographer Hilary Stockdon gave a presentation on Coastal Change Hazards research, including what could happen to Pinellas County and its beaches if a hur-ricane were to strike. Karen Morgan, Joseph Long, and Kara Doran set up and staffed a booth that featured the “Shifting Sands” tank, an interactive model that dem-onstrates the dramatic coastal erosion that can occur during a hurricane or extreme storm event. Representatives from the National Weather Service, American Red Cross, Pinellas County Emergency Man-agement Services, Pinellas County Com-munications Department, and Bay News 9, who also held information seminars at the event, joined the USGS at the Expo.
“The goal of the Expo is to provide awareness, so that the public does not be-come complacent and is prepared for the unexpected,” said Pam Bittaker, project manager for the Science Center of Pinel-las. “USGS has a lot to do with our envi-ronment, and the hurricanes actually do quite a bit of damage to our environment, so I thought it would be a great idea to in-vite USGS to participate.”
Stockdon focused on the extreme dam-age previously wrought by severe storms and the changes they can bring to the coastal environment. Her presentation used numerous prestorm and poststorm photos of areas that had been hit by hurri-canes to show the audience that structural damage during hurricanes is not only due to hurricane-force winds but also to sedi-ment movement from coastal erosion.
“People always think of hurricane haz-ards as wind and fl ooding, but it’s also important for them to understand that land
USGS Scientists Raise Coastal Change Awareness at Community Hurricane ExpoBy Allison Wilkinson
moves during hurricanes; waves and cur-rents move sand, covering roads and erod-ing beaches,” said Stockdon. Stockdon also defi ned concepts such as inundation, when an island is completely submerged under the rising storm surge, and over-wash, when waves exceed the elevation of the dune and sand is transported across the island. Images and lidar (light detec-tion and ranging) graphics were used to show areas where sediment eroded or ac-cumulated because of overwash, as well as other storm-induced coastal changes, such as how the shape of a barrier island can change as a result of a storm. (Lidar is an aircraft-based remote sensing system that determines distance to an object or
surface using laser pulses.) These data en-able scientists to understand why diffferent beaches respond differently to storms, and to provide people with information as to why certain areas are better than others at accumulating sand.
“Interacting with the public at these events is vital,” said Morgan. “We need to do as much as we can to educate our neighbors about the impacts of hurricanes on our beaches and changes to coastal en-vironments due to extreme storms.”
At the booth, the display and shifting sands tank were a big hit. USGS scientists talked to visitors constantly throughout the day. Pinellas County residents were most
Outreach
Kara Doran rebuilds the beach of the Shifting Sands tank, a model that dem-onstrates coastal erosion.
Hilary Stockdon (left) explains a model that shows what would hap-pen to Pinellas County if a Category 3 hurricane were to make landfall in the region.
Outreach
(Coastal Change Awareness continued on page 15)
15 Sound Waves August/September 2010
Outreach
interested in the storm-surge-inundation potential graphic that illustrates what could happen if a Category 3 hurricane were to make landfall in the Pinellas County re-gion, looking for their homes and favorite beaches to see how they would be affected. “It turned a light on in some people’s minds when they saw maps of overwash and inundation and then saw their house,” said Stockdon. Booth visitors gained in-formation about previous hurricanes, saw examples of coastal change, and learned about scientifi c models that predict what might happen as a result of a hurricane.
An additional area of interest for at-tendees at the Expo was how a hurricane could affect where oil from the Deepwater Horizon spill could be deposited on beach-es. One of the USGS models presented showed the possible oiling of Pinellas County during a hurricane. Tides, surge,
waves, and topography all play a part in where and how far inland water, and what-ever is in the water, will move along the Gulf coastline. These factors were all in-cluded during scientifi c modeling efforts. The models are tools that scientists use to compare the island elevation with the el-evation of hurricane-induced water levels to create maps of where oil might be de-posited during a storm. In Pinellas County, the model shows that almost the entire barrier-island system would be inundated by storm surge, and if oil were in the area, the islands would be covered.
This was the fi rst year in which USGS participated in the Expo, but we hope to return next year to share this information and any new fi ndings with the public. Through participation in local events, we are contributing to public awareness about coastal vulnerability and hazards.
Hilary Stockdon shows the storm-surge-inun-dation potential for Pinellas County beaches.
(Coastal Change Awareness continued from page 14)
Publications
(Recently Published continued on page 16)
Conzelmann, C., and Romañach, S.S., 2010, Visualizing NetCDF Files by Using the EverVIEW Data Viewer: U.S. Geological Survey Fact Sheet 2010–3046 [http://pubs.usgs.gov/fs/2010/3046/].
Grossman, E.E., Logan, J.B., Presto, M.K., and Storlazzi, C.D., 2010. Submarine groundwater discharge and fate along the coast of Kaloko-Honokohau National Historical Park, Island of Hawai‘i; Part 3, Spatial and temporal patterns in nearshore waters and coastal groundwater plumes, December 2003-April 2006: U.S. Geological Survey Scientifi c Investigations Report 2010-5081, 76 p. [http://pubs.usgs.gov/sir/2010/5081/].
Gutzwiller, K.J., Barrow, W.C., Jr., White, J.D., Johnson-Randall, L., Cade, B.S., and Zygo, L.M., 2010, Assessing conservation relevance of organism-environment relations using predicted changes in response variables: Methods in Ecology and Evolution, Early View, June 18, 2010, 8 p., doi:10.1111/j.2041-210X.2010.00042.x [http://dx.doi.org/10.1111/j.2041-210X.2010.00042.x].
Hinderstein, L.M., Marr, J.C.A., Martinez,
Recently Published ArticlesF.A., Dowgiallo, M.J., Puglise, K.A., Pyle, R.L., Zawada, D.G., and Appeldoorn, R., 2010, Mesophotic coral ecosystems: Characterization, ecology, and management: Coral Reefs, v. 29, p. 247-251, doi: 10.1007/s00338-010-0614-5 [http://dx.doi.org/10.1007/s00338-010-0614-5].
Huxham, M., Kumara, M.P., Jayatissa, L.P., Krauss, K.W., Kairo, J., Langat, J., Mencuccini, M., Skov, M.W., and Kirui, B., 2010, Intra- and interspecifi c facilitation in mangroves may increase resilience to climate change threats: Philosophical Transactions of the Royal Society B: biological sciences, v. 365, no. 1549 (July), p. 2127-2135, doi:10.1098/rstb.2010.0094 [http://dx.doi.org/10.1098/rstb.2010.0094].
Kalnejais, L.H., Martin, W.R., and Bothner, M.H., 2010, The release of dissolved nutrients and metals from coastal sediments due to resuspension: Marine Chemistry, v. 121, p. 224-235.
Lavoie, D., Sallenger, A., Flocks, J., Kindinger, J., and Twichell, D., 2010, Effects of building a barrier berm to
mitigate the effects of oil on Louisiana marshes from the Deepwater Horizon oil spill: U.S. Geological Survey Open-File Report 2010-1108 (DVD) [http://pubs.usgs.gov/of/2010/1108/].
Locker, S.D., Armstrong, R., Battista, T., Rooney, J.J., Sherman, C., and Zawada, D.G., 2010, Geomorphology of mesophotic coral ecosystems: Current perspectives on morphology, distribution and mapping strategies: Coral Reefs, v. 29, p. 329-345, doi: 10.1007/s00338-010-0613-6 [http://dx.doi.org/10.1007/s00338-010-0613-6].
Morton, R.A., and Bernier, J.C., 2010, Recent subsidence-rate reductions in the Mississippi Delta and their geological implications: Journal of Coastal Research, v. 26, p. 555-561, doi: 10.2112/JCOASTRES-D-09-00014R1.1 [http://dx.doi.org/10.2112/JCOASTRES-D-09-00014R1.1].
Nayegandhi, A., Bonisteel-Cormier, J.M., Brock, J.C., Sallenger, A.H., Wright, C.W., Nagle, D.B., Vivekanandan, S., Yates, X, and Klipp, E.S., EAARL
Outreach, Publications
16August/September 2010 Sound Waves
Coastal topography—Chandeleur Islands, Louisiana, 2010: Bare Earth: U.S. Geological Survey Data Series 511 [http://pubs.usgs.gov/ds/511/].
Pendleton, E.A., Barras, J.A., Williams, S.J., and Twichell, D.C., 2010, Coastal vulnerability assessment of the Northern Gulf of Mexico to sea-level rise and coastal change: U.S. Geological Survey Open-File Report 2010-1146 [http://pubs.usgs.gov/of/2010/1146/].
Poppe, L.J., Danforth, W.W., McMullen, K.Y., Parker, C.E., Lewit, P.G., and Doran, E.F., 2010, Integrated multibeam and LIDAR bathymetry data offshore of New London and Niantic, Connecticut: U.S. Geological Survey Open-File Report 2009-1231 [http://pubs.usgs.gov/of/2009/1231/].
Ritchie, Andrew C., Finlayson, David P., and Logan, Joshua B., 2010, Swath bathymetry surveys of the Monterey Bay area from Point Año Nuevo to Moss Landing, San Mateo, Santa Cruz, and Monterey Counties, California: U.S. Geological Survey Data Series 514 [http://pubs.usgs.gov/ds/514/].
Regionally coherent Little Ice Age cooling in the Atlantic Warm Pool: Geophysical Research Letters, v. 36, L21703, doi:10.1029/2009GL040445 [http://dx.doi.org/10.1029/2009GL040445].
Steyer, G.D., 2010, Coastwide Reference Monitoring System (CRMS): U.S. Geological Survey Fact Sheet 2010-3018, 2 p. [http://pubs.usgs.gov/fs/2010/3018/].
Steyer, G.D., Cretini, K.F., Piazza, S., Sharp, L.A., Snedden, G.A., and Sapkota, S., 2010, Hurricane infl uences on vegetation community change in coastal Louisiana: U.S. Geological Survey Open-File Report 2010–1105, 21 p. [http://pubs.usgs.gov/of/2010/1105/].
Todd, B.J., Kostylev, V.E., and Valentne, P.C., 2010, Shaded seafl oor relief, backscatter strength, surfi cial geology, and benthic habitat; German Bank, Scotian Shelf, offshore Nova Scotia: Geological Survey of Canada, Open File 6124, sheet 1, Shaded seafl oor relief, scale 1:100,000 [http://apps1.gdr.nrcan.gc.ca/mirage/mirage_list_e.php?id=261833].
Todd, B.J., Kostylev, V.E., and Valentne, P.C., 2010, Shaded seafl oor relief, backscatter strength, surfi cial geology, and benthic habitat; German Bank, Scotian
Shelf, offshore Nova Scotia: Geological Survey of Canada, Open File 6124, sheet 2, Shaded seafl oor relief, scale 1:100,000 [http://apps1.gdr.nrcan.gc.ca/mirage/mirage_list_e.php?id=261833].
Todd, B.J., Kostylev, V.E., and Valentne, P.C., 2010, Shaded seafl oor relief, backscatter strength, surfi cial geology, and benthic habitat; German Bank, Scotian Shelf, offshore Nova Scotia: Geological Survey of Canada, Open File 6124, sheet 3, Shaded seafl oor relief, scale 1:100,000 [http://apps1.gdr.nrcan.gc.ca/mirage/mirage_list_e.php?id=261833].
Twichell, D., Edmiston, L., Andrews, B., Stevenson, W., Donoghue, J., Poore, R., and Osterman, L., 2010, Geologic controls on the recent evolution of oyster reefs in Apalachicola Bay and St. George Sound, Florida: Estuarine, Coastal and Shelf Science, v. 88, p. 385-394.
Waddle, J.H., Dorazio, R.M., Walls, S.C., Rice, K.G., Beauchamp, Schuman, M.J., and Mazzotti, F.J., 2010, A new parameterization for estimating co-occurrence of interacting species Ecological Applications: Vol. 20, No. 5, pp. 1467-1475, doi:10.1890/09-0850.1 [http://dx.doi.org/10.1890/09-0850.1].
Boswell, Ray, Collett, Tim, Anderson, B., and Ruppel, C., Relative gas volume ratios for free gas and gas hydrate accumulations: Fire in the Ice, U.S. Department of Energy/National Energy Technology Laboratory Newsletter.
Draut, Amy E., Logan, Joshua B., and Mastin, Mark C., Channel evolution on the dammed Elwha river, Washington, USA: Geological Society of America Bulletin.
Lidz, B.H., Maps of the Shallow Shelf off the Florida Keys (Subsurface Bedrock Topography, Overlying Reefs and Sediments, Benthic Habitats), in Gallagher, D. (ed), The Florida Keys Environmental Story: SeaCamp, Inc., Publisher, Big Pine Key, Fla.
Lidz, B.H., Outlier reefs off the Florida Keys, in Gallagher, D. (ed), Florida Keys Environmental Story: SeaCamp, Inc., Publisher, Big Pine Key, Fla.
Publications, continued
(Recently Published continued from page 15)
(Publications Submitted continued on page 17)
Publications Submitted for Director’s ApprovalLidz, B.H., Sand grains: Indicators of coral
status, in Gallagher, D. (ed), The Florida Keys Environmental Story: SeaCamp, Inc., Publisher, Big Pine Key, Fla.
Miller, S.L., Shinn, E.A., and Lidz, B.H., Corals: The building blocks of reefs, in Krucnynski, W.L., and Fletcher, P.J., South Florida Marine Environments: An Ecological Synthesis: University of Maryland Press.
Nayegandhi, A., Wright, C.W., and Brock, J.C., Fluvial channel and coastal wetland mapping using small-footprint, waveform-resolving, green lidar: 11th Annual JALBTCX Coastal Mapping and Charting Workshop Logistics, 24-29 May 2010, Mobile, AL.
Olabarrieta, M., and Warner, J.C., Wave-current interaction in Willapa Bay: Journal of Geophysical Research - Oceans.
Palaseanu-Lovejoy, M., Kranenburg, C., and Brock, J.C., Recent wetland land loss due
to hurricanes: Improved estimates based upon multi-temporal and multi-source images: Coastal Sediments 2011, 2-6 May 2011, Miami, Fla.
Raabe, E.A., and Bialkowska-Jelinska, E., Thermal imaging project Waccasassa Bay Springs: Phase I image acquisition and processing: U.S. Geological Survey Open-File Report.
Raabe, E., and Robbins, L., Response of Florida shelf ecosystems to climate change: from region to organism: U.S. Geological Survey Fact Sheet, 2 p.
Richmond, Bruce M., Watt, Steve, Buckley, Mark, Jaffe, Bruce E., Gelfenbaum, Guy, and Morton, Robert A., Recent storm and tsunami coarse-clast deposit characteristics, southeast Hawai‘i: Marine Geology.
Robbins, L.L., Knorr, P.O., Liu, X., Byrne, R., and Raabe, E., USGS Field Activity
Publications
17 Sound Waves August/September 2010
(Publications Submitted continued from page 16)
08FSH01 on the West Florida Shelf, Gulf of Mexico, August 2008: U.S. Geological Survey Data Series.
Schreppel, H., and Cimitile, M, Coastal change hazards research bookmarks: U.S. Geological Survey General Information Product.
Wang, X., Hutchinson, D.R., Wu, S., Yang, S., and Guo, Y., High gas hydrate
Publications, continued
saturations estimated from fi ne-grained reservoirs at site SH2, Shenhu area, South China Sea: Journal of Geophysical Research.
Watt, Steven G., Jaffe, Bruce E., Morton, Robert A., Richmond, Bruce M., and Gelfenbaum, Guy, Comparison of extreme-wave deposits on the northern
coast of Bonaire, Netherlands Antilles: U.S. Geological Survey Open-File Report.
Yates, K.K., and Moyer, R., Effects of ocean acidifi cation and sea level rise on coral reefs: U.S. Geological Survey Fact Sheet.
Publications
Sound Waves U.S. Geo log i cal Survey345 Middlefi eld Road, MS 999Menlo Park, CA 94025