13
Fig. 53-14
| Date post: | 31-Dec-2015 |
| Category: |
Documents |
| Upload: | sonya-beck |
| View: | 21 times |
| Download: | 0 times |

Fig. 53-14

Fig. 53-4
(a) Clumped
(b) Uniform
(c) Random
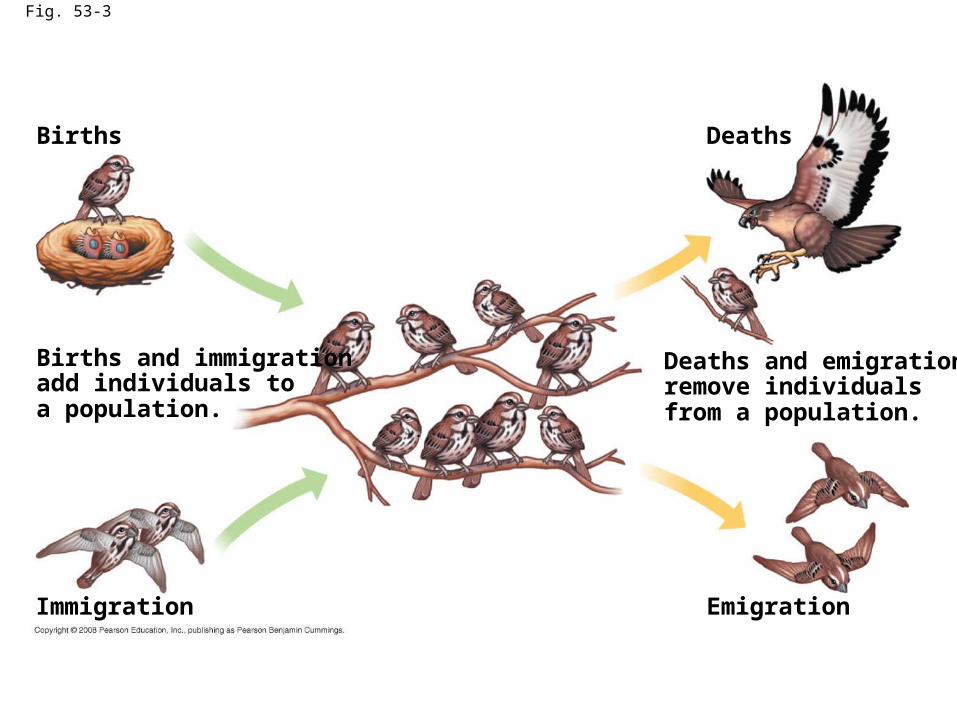
Fig. 53-3
Births
Births and immigrationadd individuals toa population.
Immigration
Deaths and emigrationremove individualsfrom a population.
Deaths
Emigration

Fig. 53-11
8,000
6,000
4,000
2,000
01920 1940 1960 1980
Year
Ele
ph
ant
po
pu
lati
on
1900

Fig. 53-10
Number of generations
0 5 10 150
500
1,000
1,500
2,000
1.0N =dNdt
0.5N =dN
dt
Po
pu
lati
on
siz
e (N
)

Fig. 53-12
2,000
1,500
1,000
500
00 5 10 15
Number of generations
Po
pu
lati
on
siz
e (N
)
Exponentialgrowth
1.0N=dN
dt
1.0N=dN
dt
K = 1,500
Logistic growth1,500 – N
1,500

Fig. 53-13a
1,000
800
600
400
200
00 5 10 15
Time (days)
Nu
mb
er
of Paramecium
/mL
(a) A Paramecium population in the lab

Fig. 53-15
(a) Both birth rate and death rate vary.
Population density
Density-dependentbirth rate
Equilibriumdensity
Density-dependentdeath rate
Bir
th o
r d
eath
ra
tep
er c
ap
ita
(b) Birth rate varies; death rate is constant.
Population density
Density-dependentbirth rate
Equilibriumdensity
Density-independentdeath rate
(c) Death rate varies; birth rate is constant.
Population density
Density-dependentdeath rate
Equilibriumdensity
Density-independentbirth rate
Bir
th o
r d
eath
ra
tep
er c
ap
ita
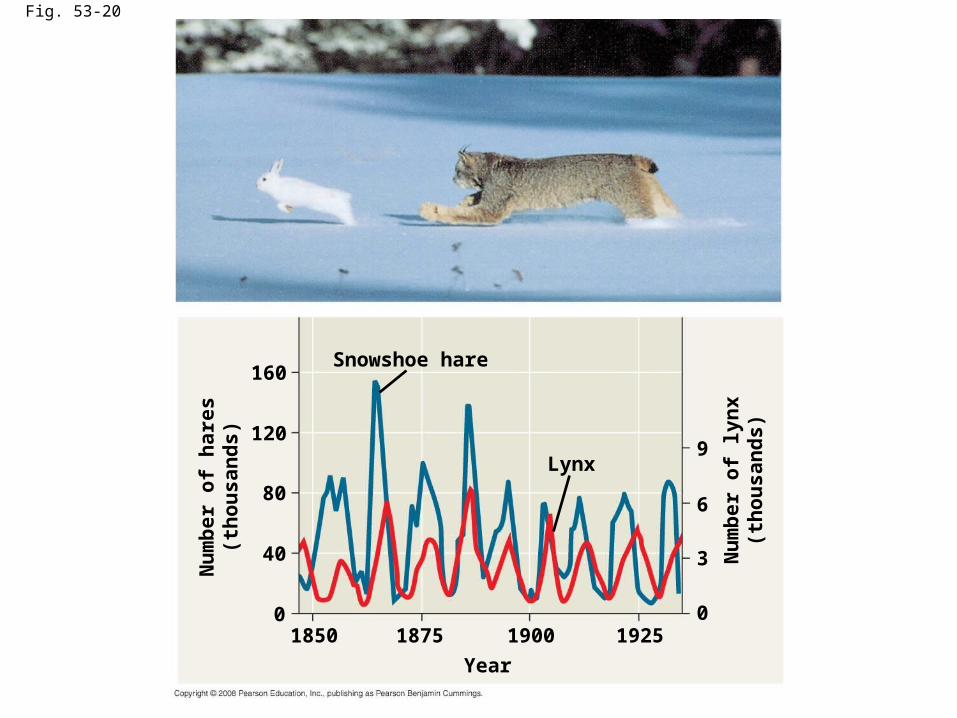
Fig. 53-20
Snowshoe hare
Lynx
Nu
mb
er
of
lyn
x(t
ho
us
an
ds
)
Nu
mb
er
of
ha
res
(th
ou
sa
nd
s)
160
120
80
40
01850 1875 1900 1925
Year
9
6
3
0

Table 53-1

Fig. 53-6
1,000
100
10
10 50 100
II
III
Percentage of maximum life span
Nu
mb
er
of
su
rviv
ors
(lo
g s
ca
le)
I

Fig. 53-25
Rapid growthAfghanistan
Male Female Age AgeMale Female
Slow growthUnited States
Male Female
No growthItaly
85+80–8475–7970–74
60–6465–69
55–5950–5445–4940–4435–3930–3425–2920–2415–19
0–45–9
10–14
85+80–8475–7970–74
60–6465–69
55–5950–5445–4940–4435–3930–3425–2920–2415–19
0–45–9
10–14
10 10 8 866 4 422 0Percent of population Percent of population Percent of population
66 4 422 08 8 66 4 422 08 8

Fig. 53-22
8000B.C.E.
4000B.C.E.
3000B.C.E.
2000B.C.E.
1000B.C.E.
0 1000C.E.
2000C.E.
0
1
2
3
4
5
6
The Plague
Hu
man
po
pu
lati
on
(b
illio
ns)
7


![img04543[1] - fivb.org€¦ · Chapt. 14 Basic Team Formations in Volleyball Alphabet System Used By Japanese Teams (Fig. 14-9, 14-D19, 14-10) Fig. 14-D19 This formation is effective](https://static.documents.pub/doc/80x56/60140a51454f0e2a8635cc32/img045431-fivb-chapt-14-basic-team-formations-in-volleyball-alphabet-system.jpg)


