29
Figure 1-1. Land use and cover in the Queenstown Planning Area. Modified from the Maryland Department of Planning by the Queen Anne’s County (2002)
| Date post: | 01-Jan-2016 |
| Category: |
Documents |
| Upload: | georgia-duran |
| View: | 15 times |
| Download: | 0 times |
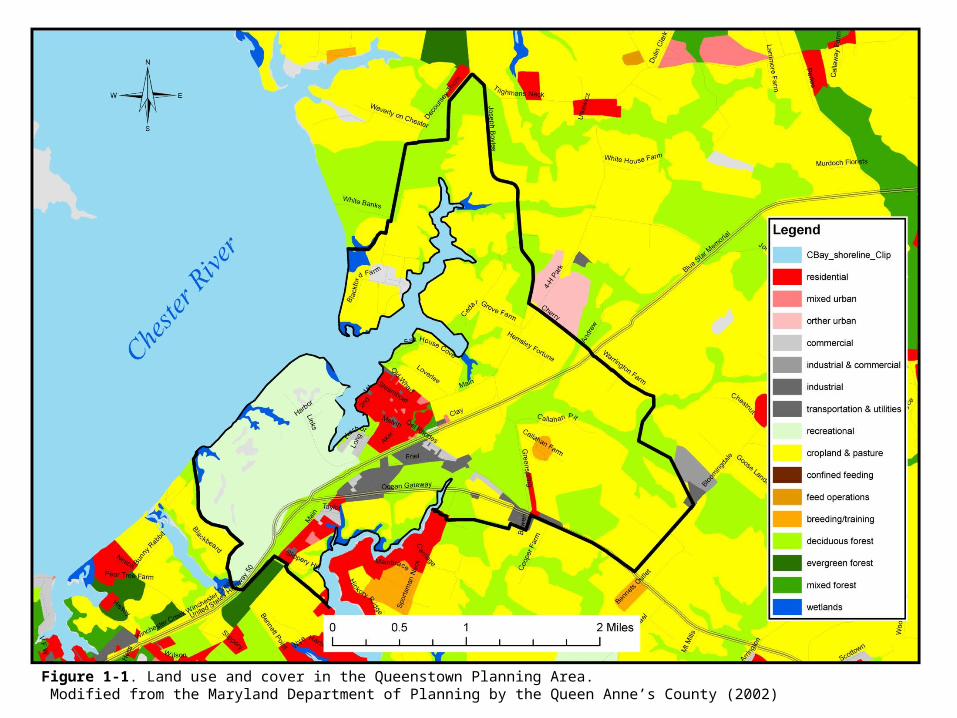
Figure 1-1. Land use and cover in the Queenstown Planning Area. Modified from the Maryland Department of Planning by the Queen Anne’s County (2002)
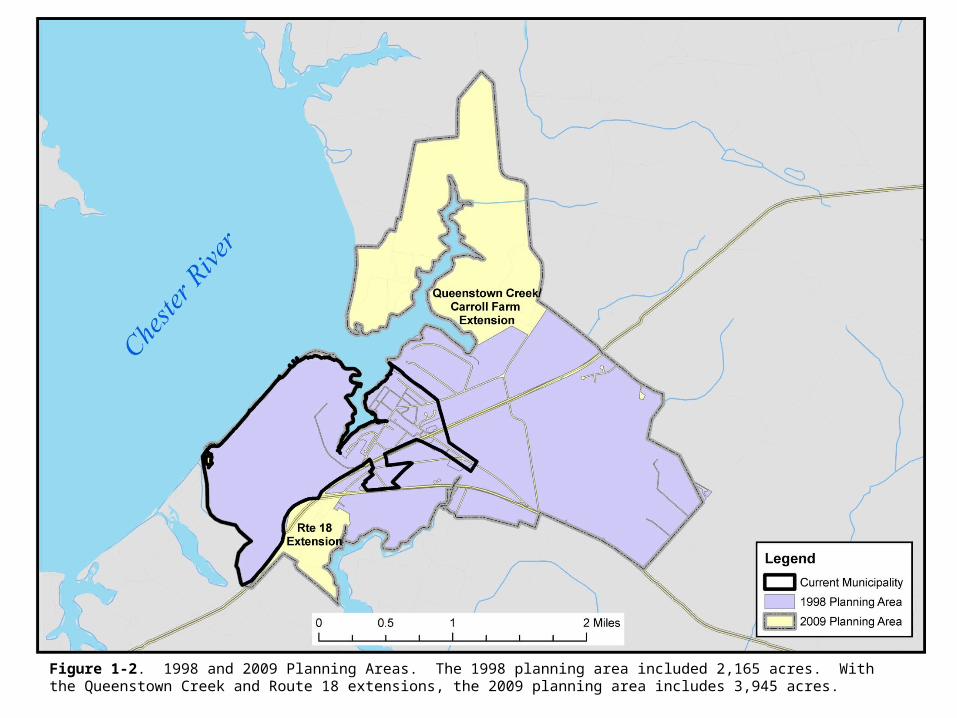
Figure 1-2. 1998 and 2009 Planning Areas. The 1998 planning area included 2,165 acres. With the Queenstown Creek and Route 18 extensions, the 2009 planning area includes 3,945 acres.
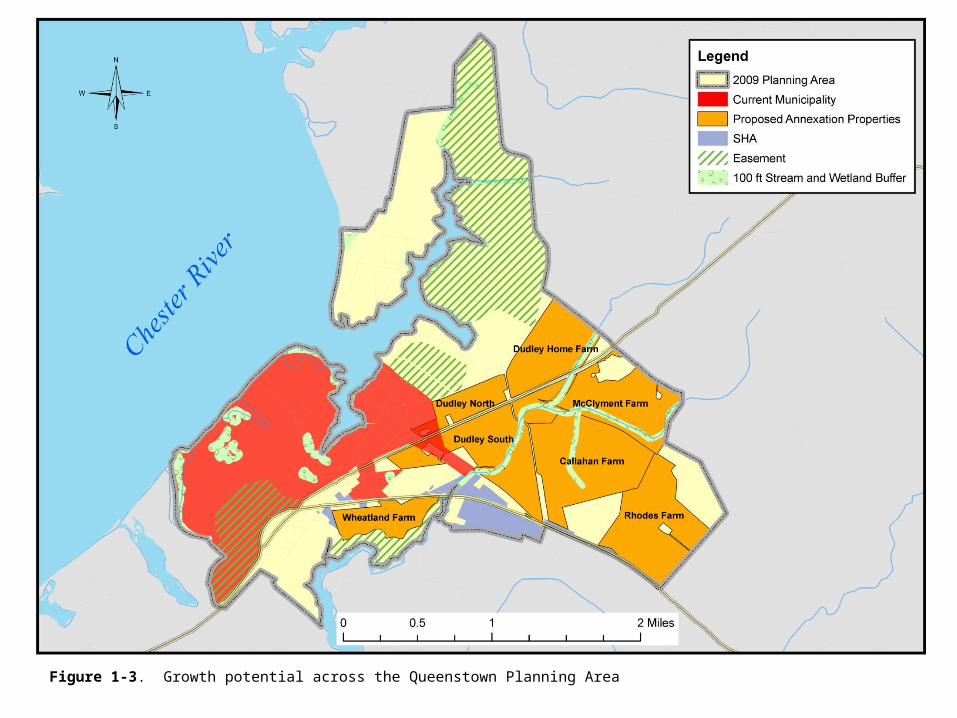
Figure 1-3. Growth potential across the Queenstown Planning Area
A new town
Intense commercialon Dudley South
Mixed use on Dudley North
Wheatlands Farmdevelopment
Regional andlocal commerce
along 301
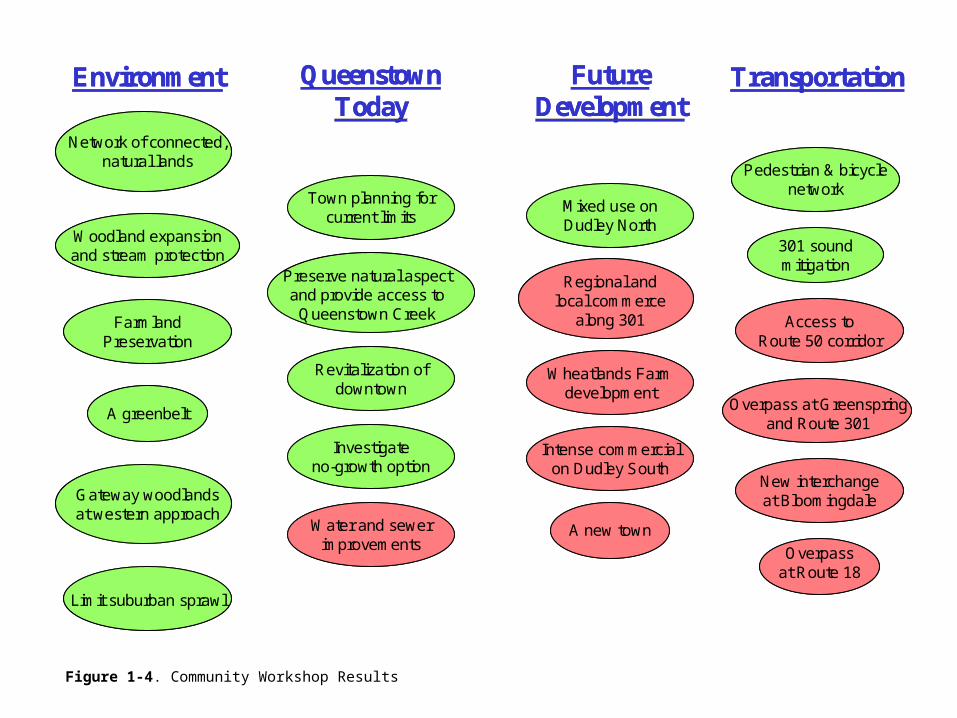
Network of connected, natural lands
A greenbelt
Limit suburban sprawl
Gateway woodlandsat western approach
FarmlandPreservation
Woodland expansionand stream protection
Revitalization of downtown
Town planning forcurrent limits
Water and sewerimprovements
Investigateno-growth option
Preserve natural aspect and provide access to
Queenstown Creek
Pedestrian & bicycle network
Overpassat Route 18
New interchangeat Bloomingdale
301 soundmitigation
Access toRoute 50 corridor
Overpass at Greenspringand Route 301
Environment Future Development
TransportationQueenstown Today
A new town
Intense commercialon Dudley South
Mixed use on Dudley North
Wheatlands Farmdevelopment
Regional andlocal commerce
along 301
Network of connected, natural lands
A greenbelt
Limit suburban sprawl
Gateway woodlandsat western approach
FarmlandPreservation
Woodland expansionand stream protection
Revitalization of downtown
Town planning forcurrent limits
Water and sewerimprovements
Investigateno-growth option
Preserve natural aspect and provide access to
Queenstown Creek
Pedestrian & bicycle network
Overpassat Route 18
New interchangeat Bloomingdale
301 soundmitigation
Access toRoute 50 corridor
Overpass at Greenspringand Route 301
Environment Future Development
TransportationQueenstown Today
Figure 1-4. Community Workshop Results
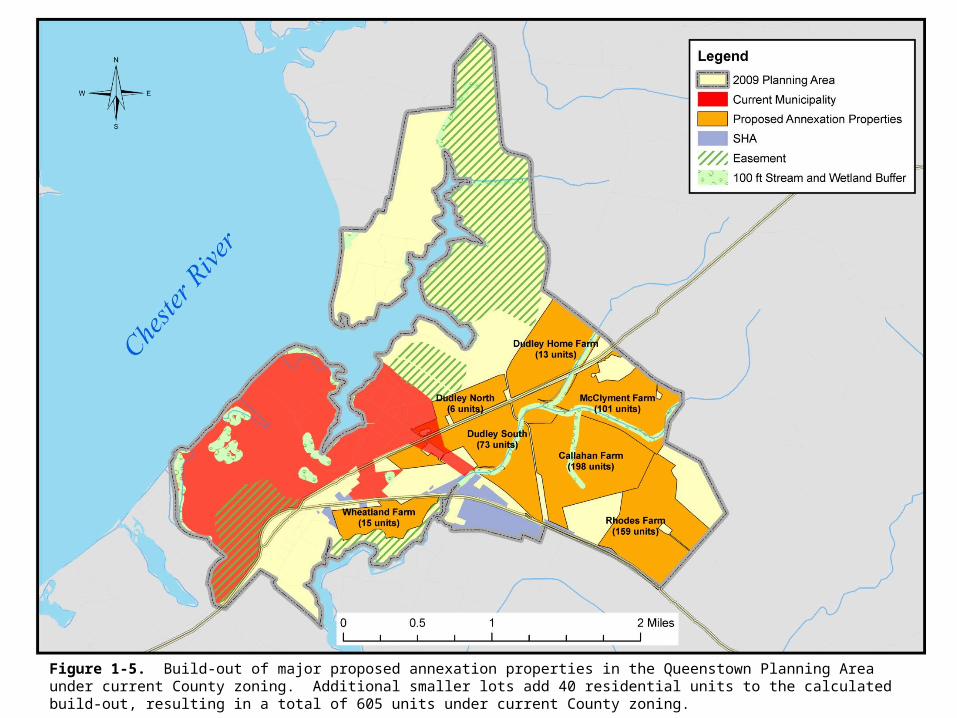
Figure 1-5. Build-out of major proposed annexation properties in the Queenstown Planning Area under current County zoning. Additional smaller lots add 40 residential units to the calculated build-out, resulting in a total of 605 units under current County zoning.
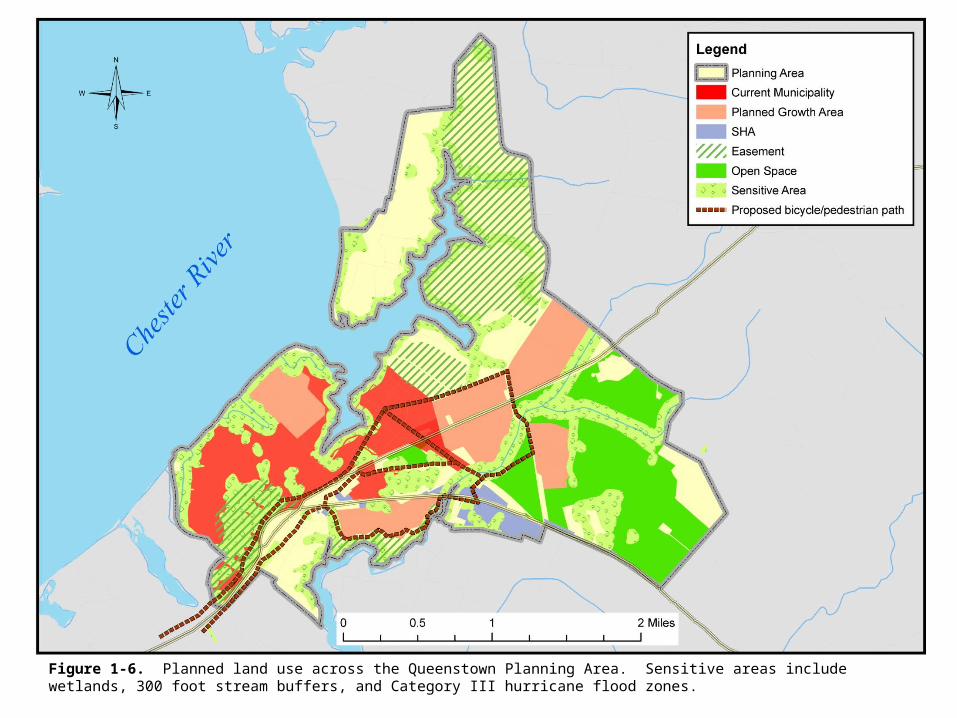
Figure 1-6. Planned land use across the Queenstown Planning Area. Sensitive areas include wetlands, 300 foot stream buffers, and Category III hurricane flood zones.

Figure 1-7. Queenstown lot sizes (acres).
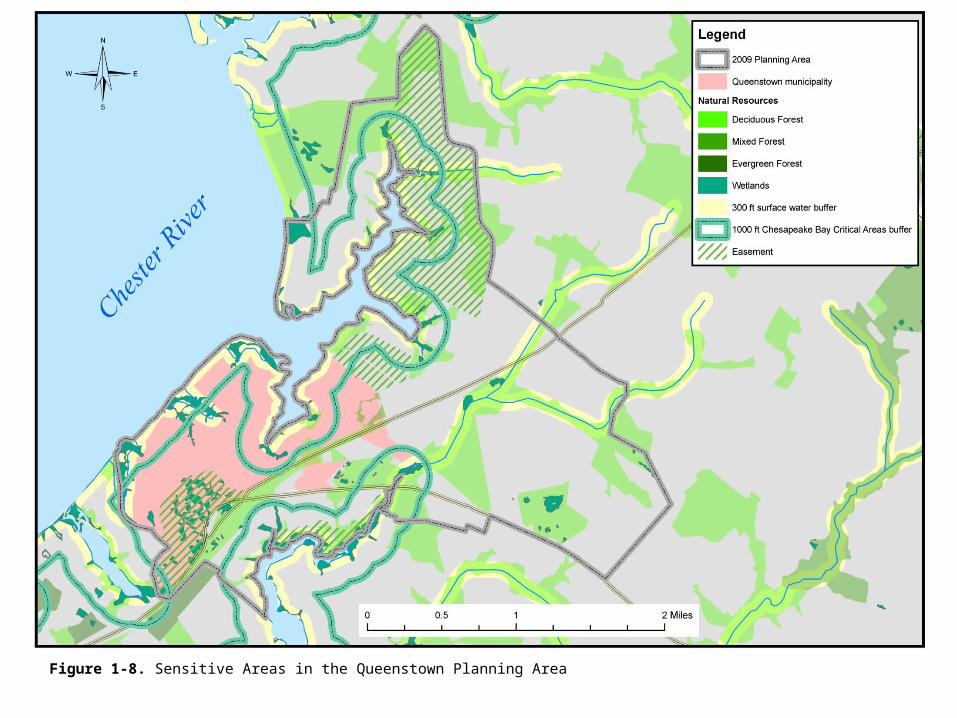
Figure 1-8. Sensitive Areas in the Queenstown Planning Area
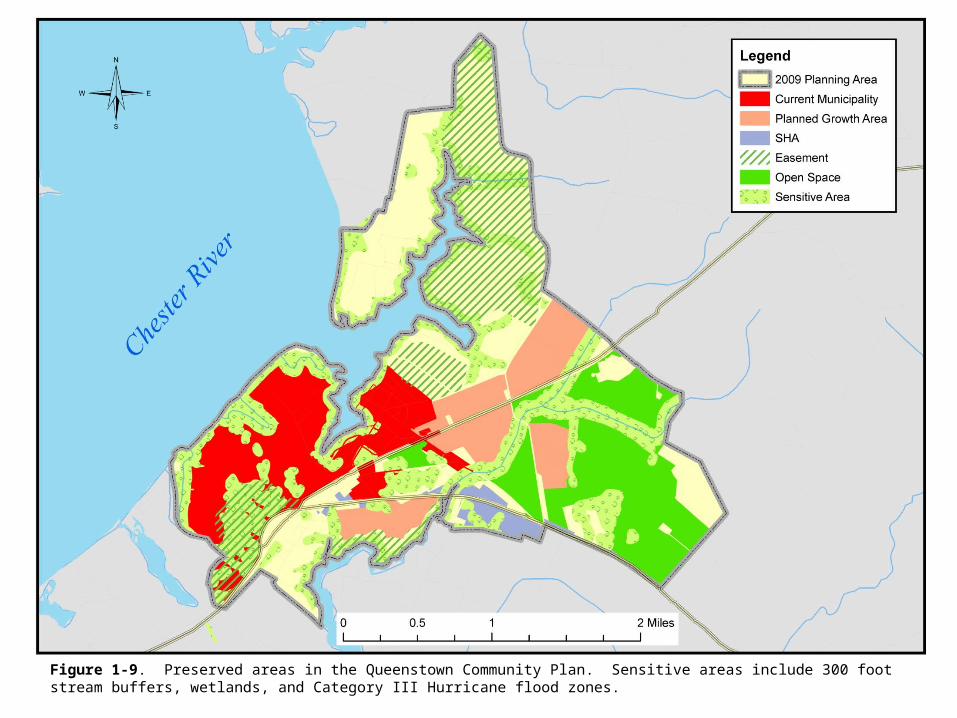
Figure 1-9. Preserved areas in the Queenstown Community Plan. Sensitive areas include 300 foot stream buffers, wetlands, and Category III Hurricane flood zones.
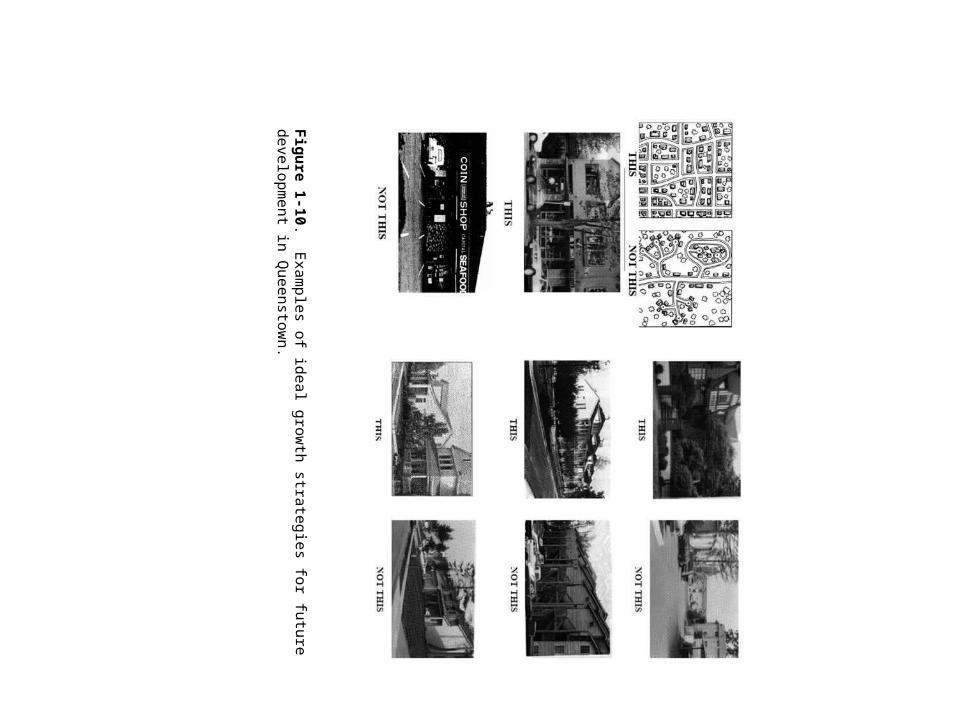
Figu
re 1-10. Exam
ples of ideal growth strategies for future developm
ent in Queenstow
n.

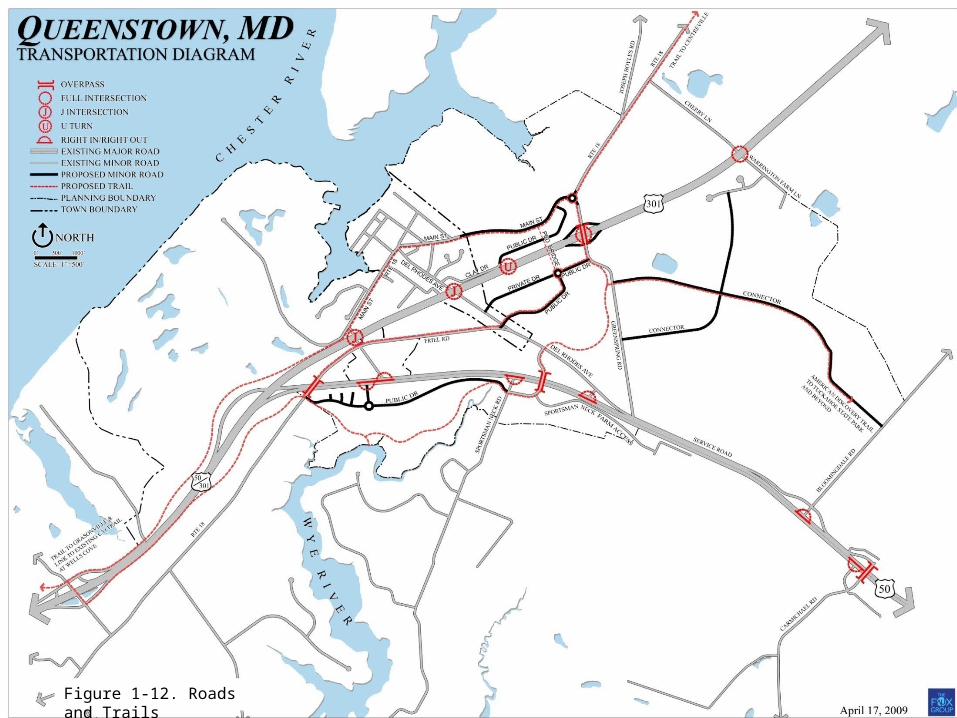
Figure 1-12. Roads and Trails
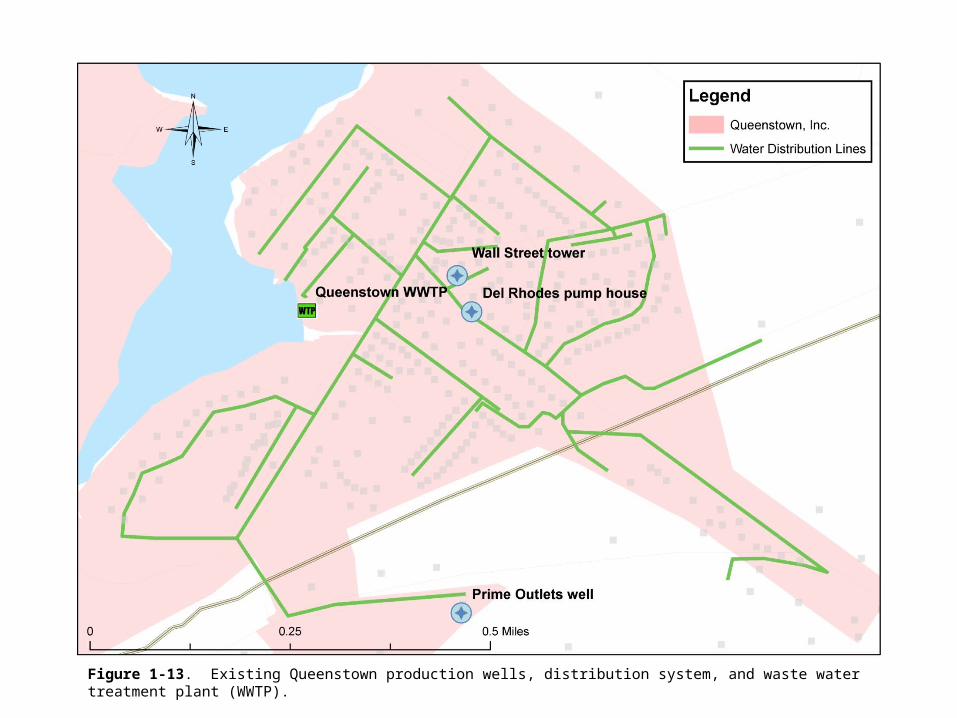
Figure 1-13. Existing Queenstown production wells, distribution system, and waste water treatment plant (WWTP).

Figure 1-14. Watersheds in the Queenstown Planning Area. Each watershed was divided into hydrologic subunits defined based on topographic flowpath analyses.
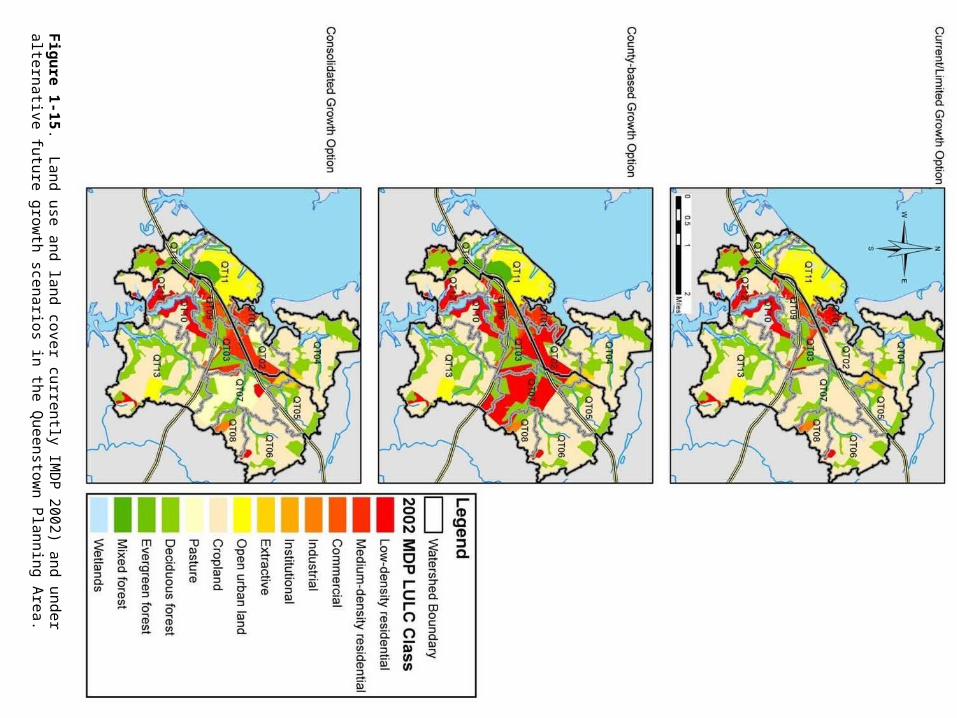
Figu
re 1-15. Land use and land cover currently IM
DP
2002) and under alternative future growth scenarios in
the Queenstow
n Planning A
rea.
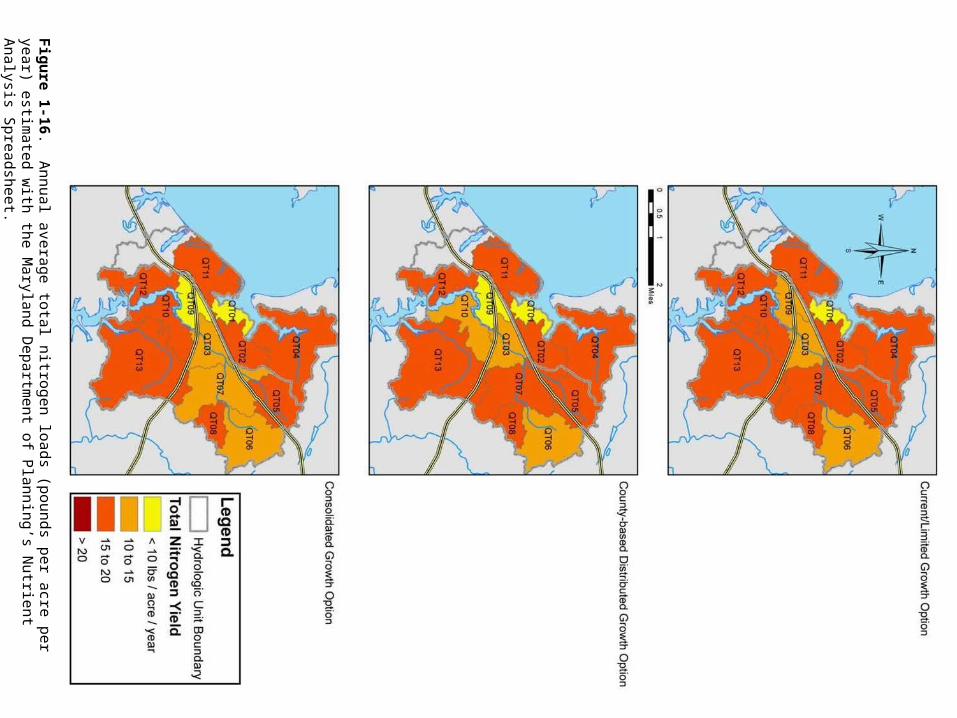
Figu
re 1-16. Annual average total nitrogen loads (pounds per acre per year) estim
ated with the M
aryland D
epartment of P
lanning’s Nutrient A
nalysis Spreadsheet.
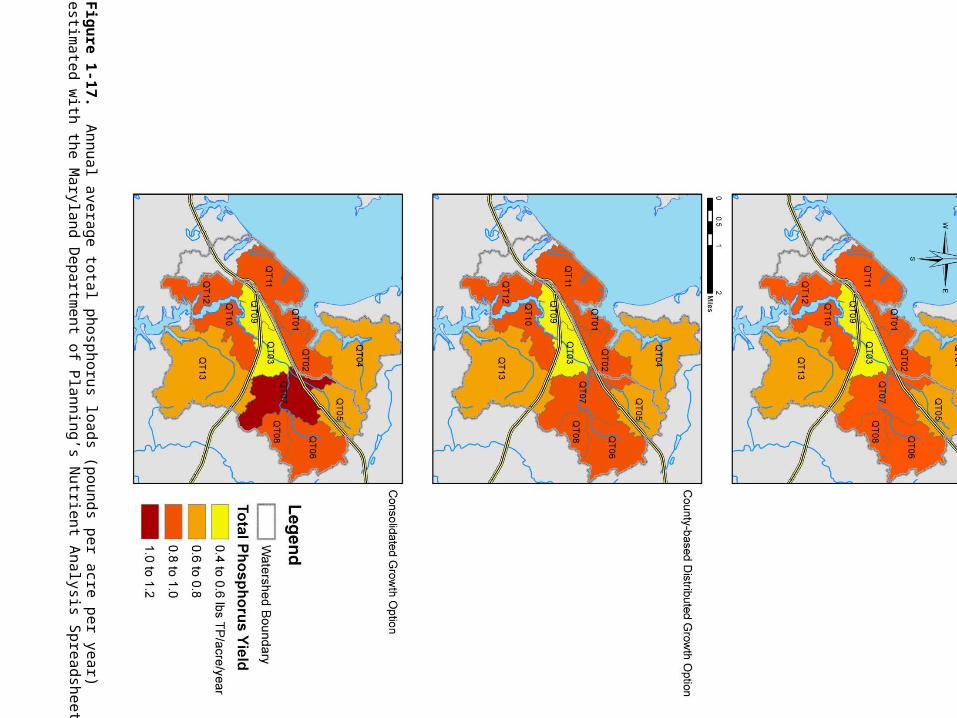
Fig
ure 1-17. A
nnual average total phosphorus loads (pounds per acre per year) estim
ated with the M
aryland Departm
ent of Planning’s N
utrient Analysis S
preadsheet
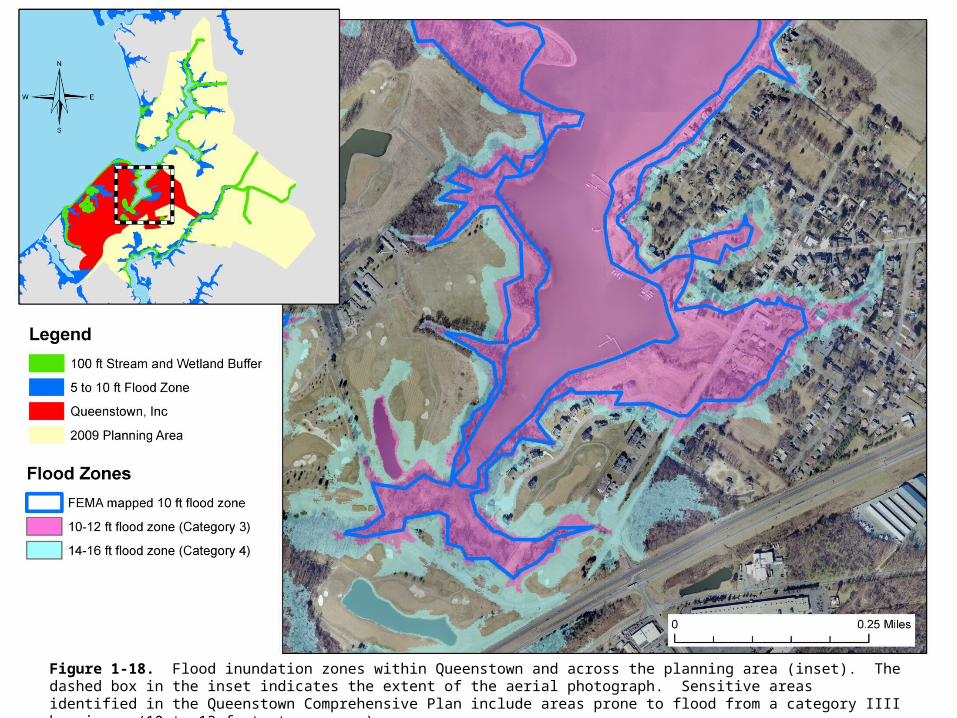
Figure 1-18. Flood inundation zones within Queenstown and across the planning area (inset). The dashed box in the inset indicates the extent of the aerial photograph. Sensitive areas identified in the Queenstown Comprehensive Plan include areas prone to flood from a category IIII hurricane (10 to 12 foot storm surge).

Figure 1-19. Timeline of potential build-out and infrastructure improvements in the Queenstown Planning Area. Green numbers indicate a supply surplus, and red numbers indicate a supply deficit.

Figu
re 2-1. Regional m
ap and physiographic provinces of the E
ast Coast.
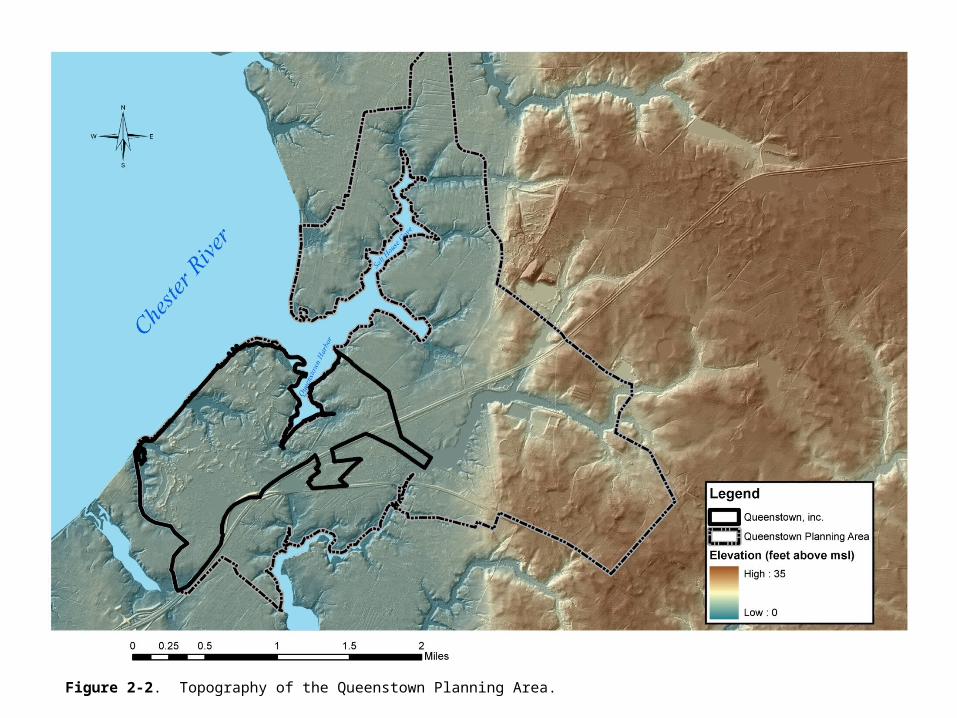
Figure 2-2. Topography of the Queenstown Planning Area.
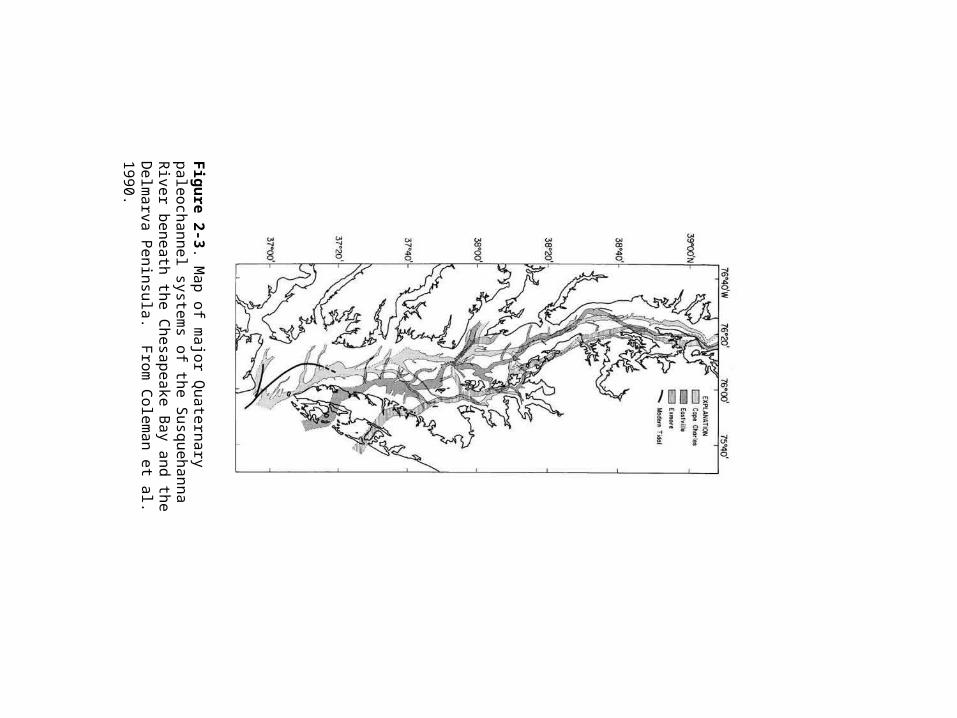
Figu
re 2-3. Map of m
ajor Quaternary paleochannel system
s of the S
usquehanna River beneath the C
hesapeake Bay and
the Delm
arva Peninsula. F
rom C
oleman et al. 1990.
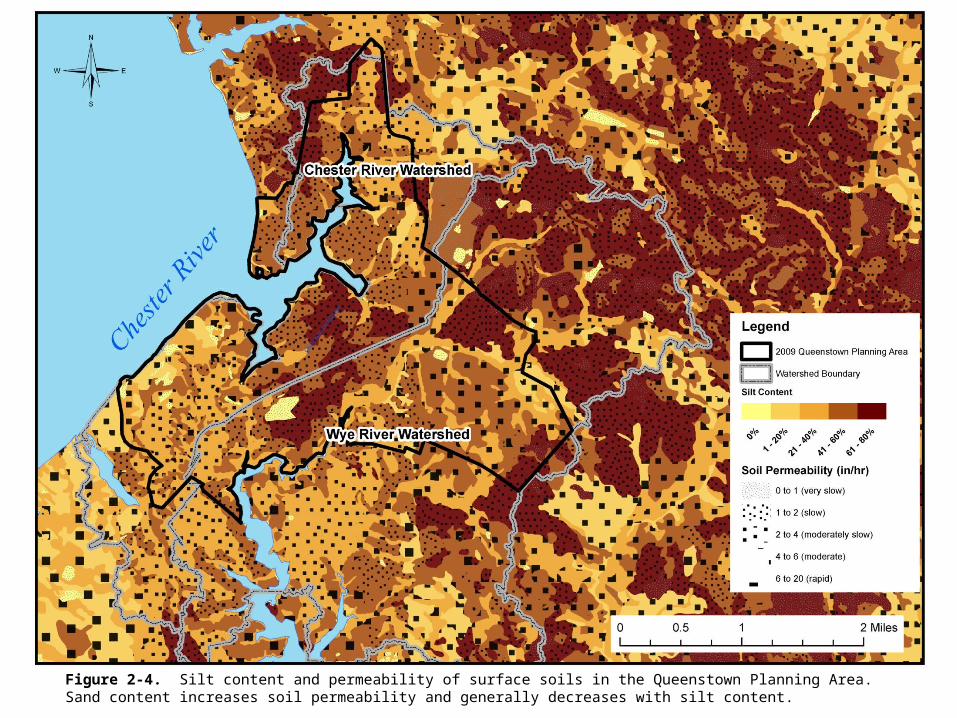
Figure 2-4. Silt content and permeability of surface soils in the Queenstown Planning Area. Sand content increases soil permeability and generally decreases with silt content.
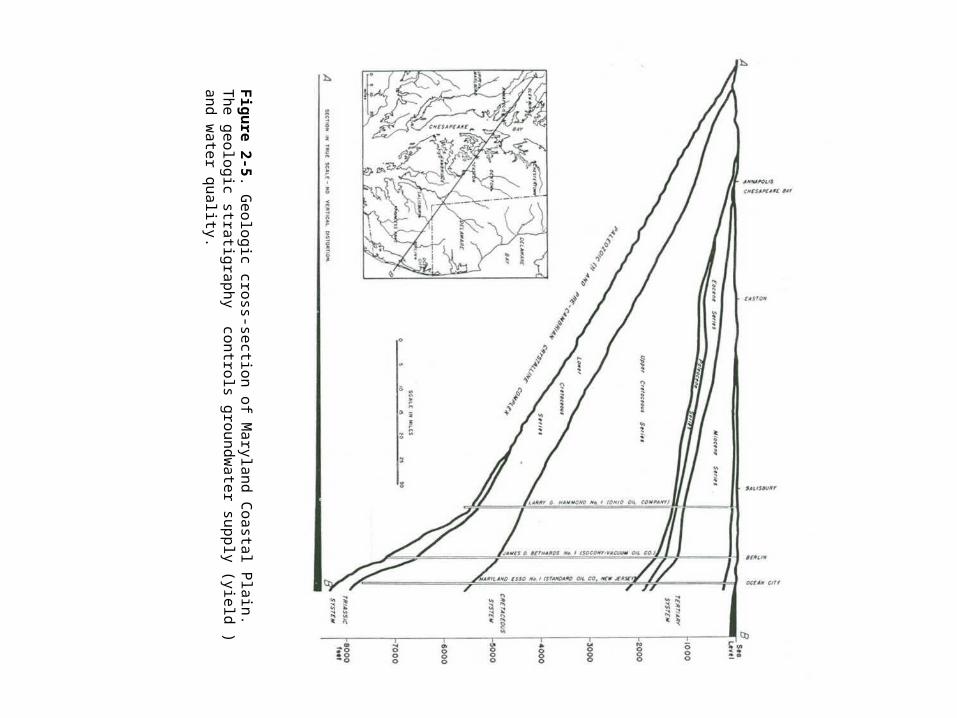
Figu
re 2-5. Geologic cross-section of M
aryland Coastal P
lain. The geologic stratigraphy
controls groundwater supply (yield ) and w
ater quality.
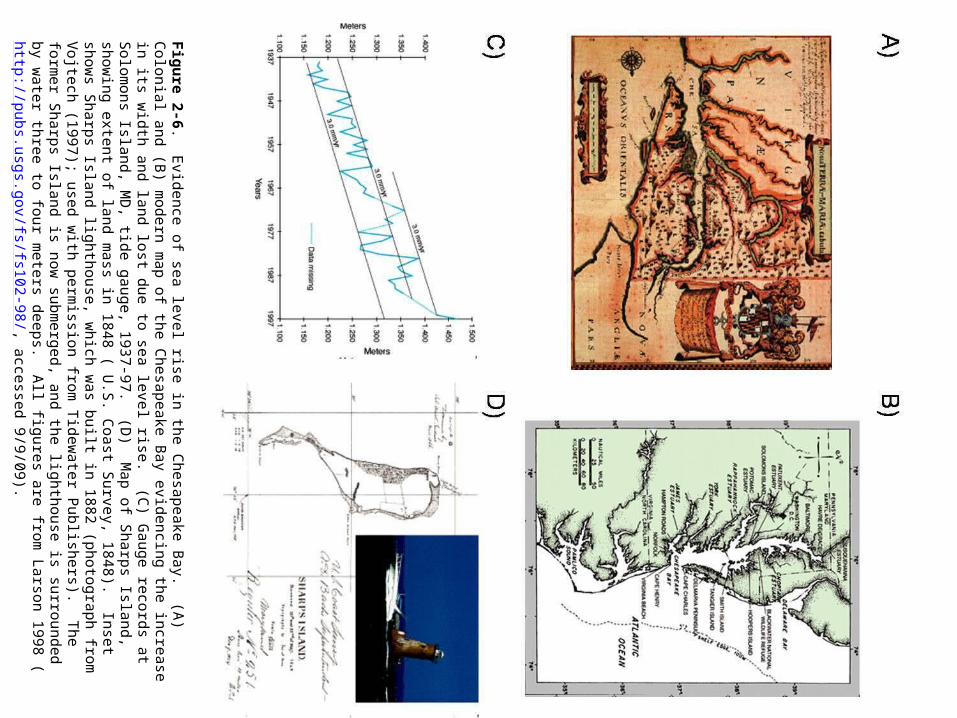
Figu
re 2-6. Evidence of sea level rise in the C
hesapeake Bay. (A
) Colonial and (B
) modern m
ap of the C
hesapeake Bay evidencing the increase in its w
idth and land lost due to sea level rise. (C) G
auge records at S
olomons Island, M
D, tide gauge, 1937-97. (D
) Map of S
harps Island, showing extent of land m
ass in 1848 ( U
.S. C
oast Survey, 1848). Inset show
s Sharps Island lighthouse, w
hich was built in 1882 (photograph
from V
ojtech (1997); used with perm
ission from T
idewater P
ublishers). The form
er Sharps Island is now
subm
erged, and the lighthouse is surrounded by water three to four m
eters deeps. All figures are from
L
arson 1998 (http://pubs.usgs.gov/fs/fs102-98/, accessed 9/9/09).

Figure 2-7. Natural resource areas in the Queenstown Planning Area.

Figure 2-8. Comparison of 100 foot stream buffers (thin black line) and 300 foot stream buffers (thick blue line).
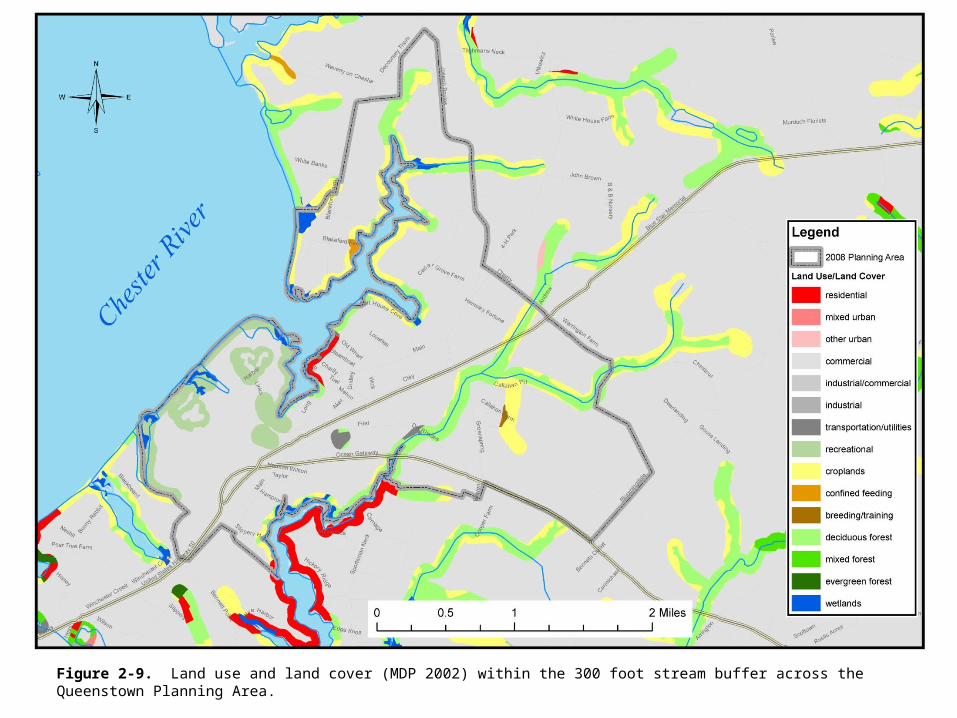
Figure 2-9. Land use and land cover (MDP 2002) within the 300 foot stream buffer across the Queenstown Planning Area.
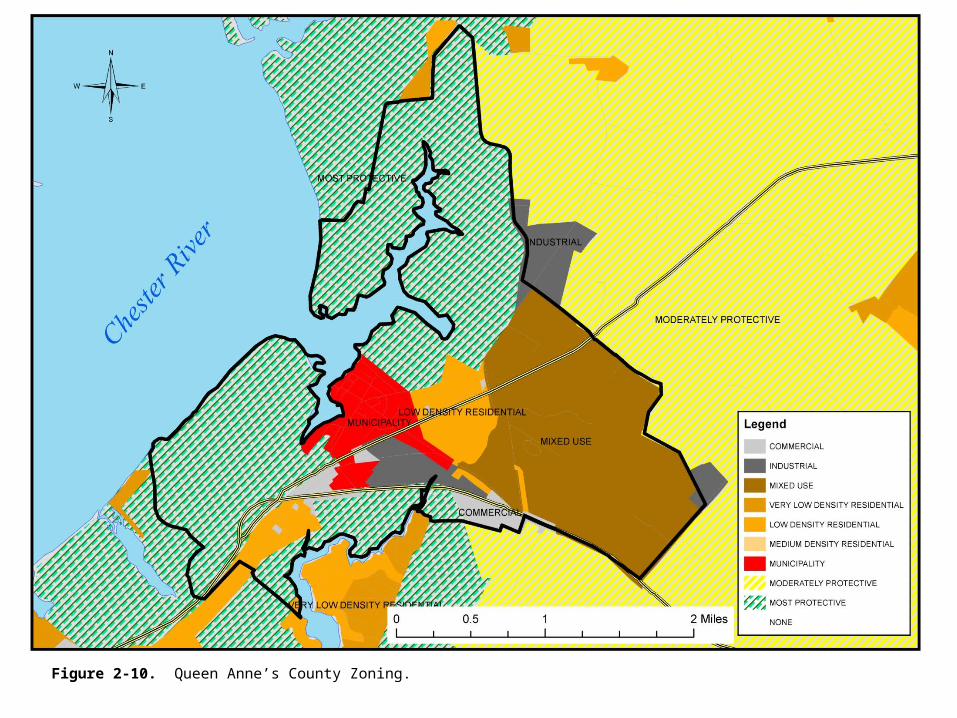
Figure 2-10. Queen Anne’s County Zoning.


