Figure 1: Basic principle of LIBS system in a sorting system (shown here with pneumatic separation). Inlay: photography of laser‐penetration of surface contamination Table 1: Properties of 8 types of refractories studied in REFRASORT Group Type Composition MgO‐based Fired MgO High MgO, no C, low CaO MgO‐C with antioxidant High MgO, 5 – 15 wt‐% C, low CaO, antioxidant ~3% MgO‐C without antioxidant High MgO, 5 – 15 wt‐% C, low CaO, no antioxidant Doloma‐ based Fired doloma High MgO, high CaO, no C Doloma carbon High MgO, high CaO, 5‐15 wt‐%C Alumina‐ based Fired bauxite High Al, Al/Si ~8/1, low CaO/MgO/C Fired andalusite High Al, Al/Si ~2/1, low CaO/MgO/C Fired chamotte High Al, Al/Si ~1/1, low CaO/MgO/C
Transcript
Figure 1: Basic principle of LIBS system in a sorting system (shown here with pneumatic separation). Inlay: photography of laser‐penetration of surface contamination
Table 1: Properties of 8 types of refractories studied in REFRASORT
Group Type Composition
MgO‐based Fired MgO High MgO, no C, low CaO
MgO‐C with antioxidant High MgO, 5 – 15 wt‐% C, low CaO, antioxidant ~3%
MgO‐C without antioxidant High MgO, 5 – 15 wt‐% C, low CaO, no antioxidant
Doloma‐based
Fired doloma High MgO, high CaO, no C
Doloma carbon High MgO, high CaO, 5‐15 wt‐% C
Alumina‐based
Fired bauxite High Al, Al/Si ~8/1, low CaO/MgO/C
Fired andalusite High Al, Al/Si ~2/1, low CaO/MgO/C
Fired chamotte High Al, Al/Si ~1/1, low CaO/MgO/C
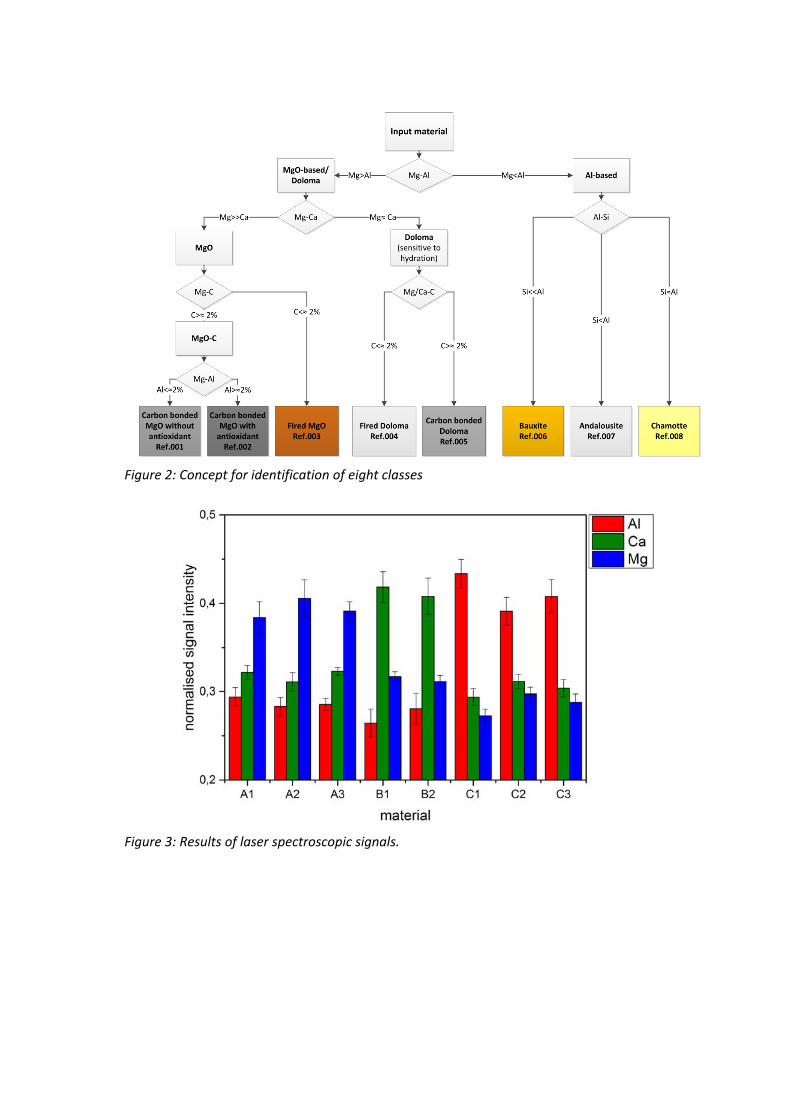
Figure 2: Concept for identification of eight classes
Figure 3: Results of laser spectroscopic signals.
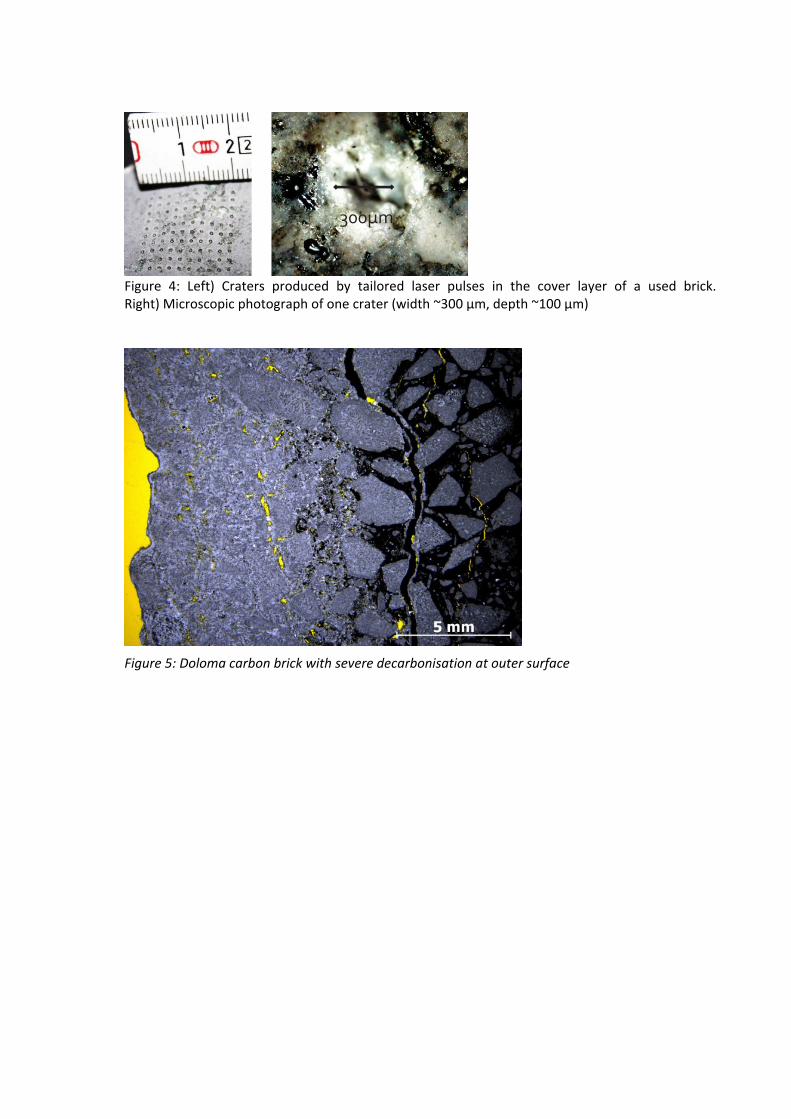
Figure 4: Left) Craters produced by tailored laser pulses in the cover layer of a used brick. Right) Microscopic photograph of one crater (width ~300 µm, depth ~100 µm)
Figure 5: Doloma carbon brick with severe decarbonisation at outer surface
300µm
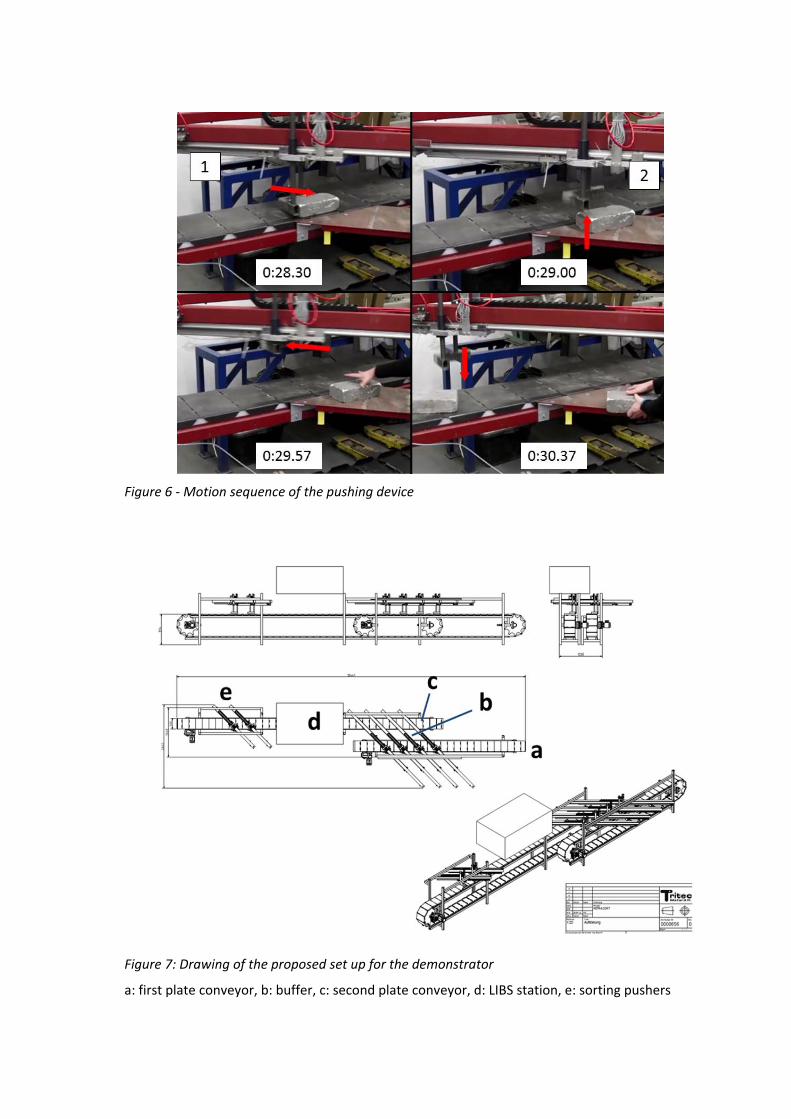
Figure 6 ‐ Motion sequence of the pushing device
Figure 7: Drawing of the proposed set up for the demonstrator
a: first plate conveyor, b: buffer, c: second plate conveyor, d: LIBS station, e: sorting pushers
Figure 8: Temperature after microwave heating with different metal contents
Figure 9: Metal detector results for artificial samples with metal
0
20
40
60
80
100
120
0.0 1.0 2.0 3.0 4.0 5.0
Temperature [°C]
Metal content [wt%]
Average temperature
FM
MC
MCA
FD
DC
FA
FC
FB
MCr
0.0
200.0
400.0
600.0
800.0
1000.0
1200.0
1400.0
1600.0
1800.0
2000.0
0.0 1.0 2.0 3.0 4.0 5.0 6.0
Amplitude [V]
Metal content [wt%]
Amplitude
FM
FD
DC
FA
FB
FC
MC
MCA
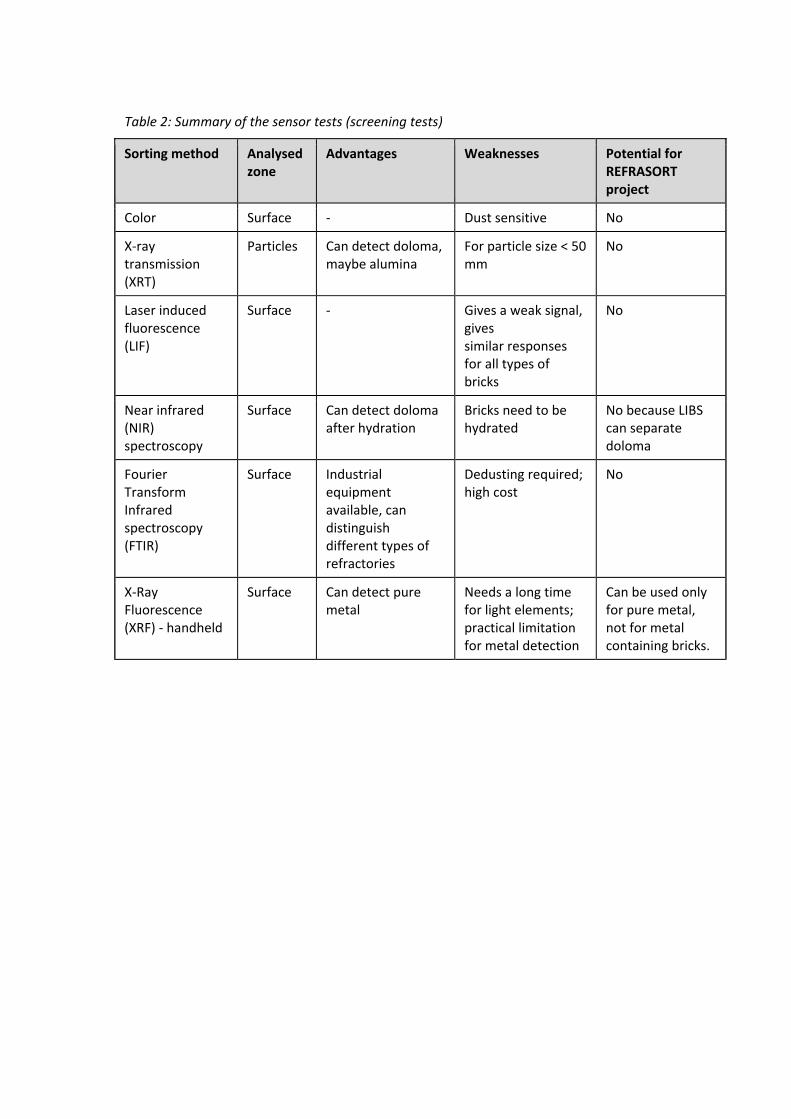
Table 2: Summary of the sensor tests (screening tests)
Sorting method Analysed zone
Advantages Weaknesses Potential for REFRASORT project
Color Surface ‐ Dust sensitive No
X‐ray transmission (XRT)
Particles Can detect doloma, maybe alumina
For particle size < 50 mm
No
Laser induced fluorescence (LIF)
Surface ‐ Gives a weak signal, gives similar responses for all types of bricks
No
Near infrared (NIR) spectroscopy
Surface Can detect doloma after hydration
Bricks need to be hydrated
No because LIBS can separate doloma
Fourier Transform Infrared spectroscopy (FTIR)
Surface Industrial equipment available, can distinguish different types of refractories
Dedusting required; high cost
No
X‐Ray Fluorescence (XRF) ‐ handheld
Surface Can detect pure metal
Needs a long time for light elements; practical limitation for metal detection
Can be used only for pure metal, not for metal containing bricks.
Table 3: Summary of the sensor tests focused on metal and carbon detection
Sorting method
Analysed zone Advantages Weaknesses Potential for Refrasort project
Metal detection portal
Volume Can detect metal and C
Gives a signal which depends on the size of the brick
Promising technique for metal and/or C detection, to be tested further to determine its limitations (metal concentration, metal amount, C concentration, C amount)
Magnetic susceptibility
Volume Can detect MgCr and antioxidant
No available industrial sensor suited for Refrasort tests. Can be used only for bricks with same size and same weight.
No
Microwave heating
Heating of the whole brick; measurement of the surface temperature
Can detect C in fresh bricks with no influence of the metal content.
Gives different responses for same kind of bricks. No correlation observed between C content and heating behavior for magnesia based spent bricks.
To be tested further for C detection
Terahertz Volume Can detect conductive materials
Influenced by the thickness of the brick and the roughness of the surface
Cannot be applied at industrial scale because the size of the spent bricks vary a lot and their surface is rough.
Figure 10: Concept of the sorting system. The conveying direction is indicated by red arrows, beginning on the right hand side. The numbers denote the sections of the system decribed in the text.
Figure 11: Schematic of the integration of the laser‐based identification system with the conveyor (with opened service access). Measurement areas are shown in yellow (3D) and red (LIBS).
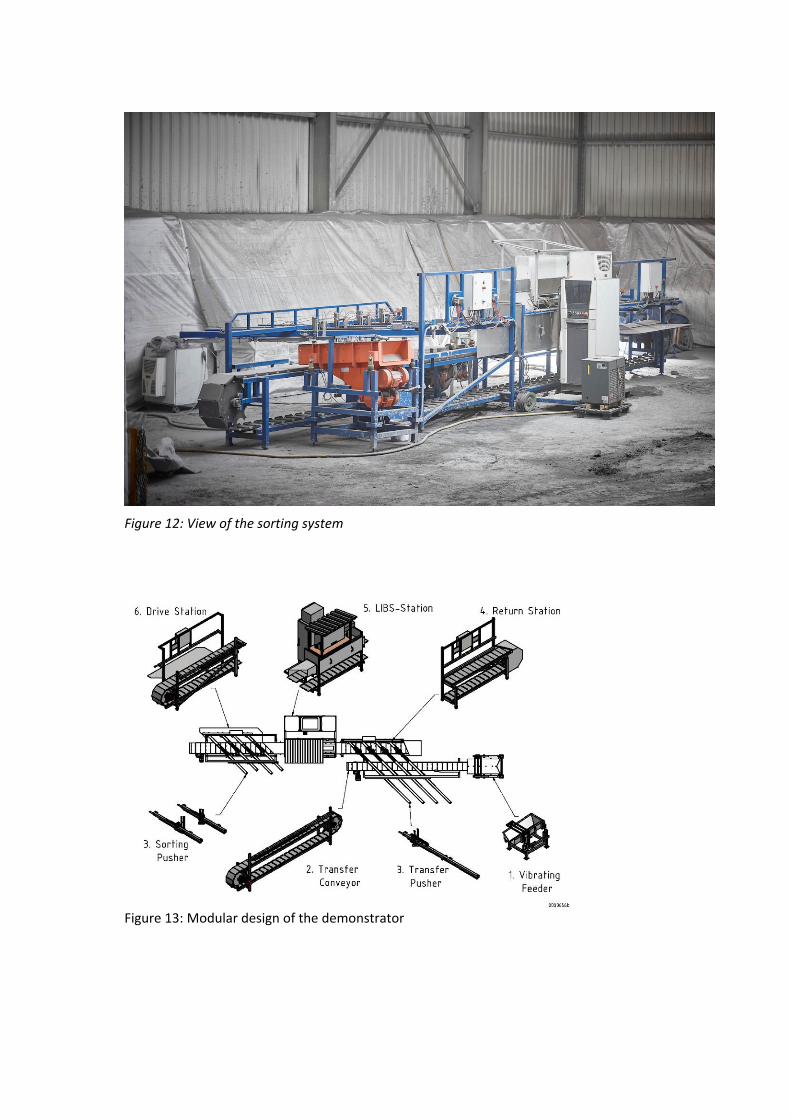
Figure 12: View of the sorting system
Figure 13: Modular design of the demonstrator
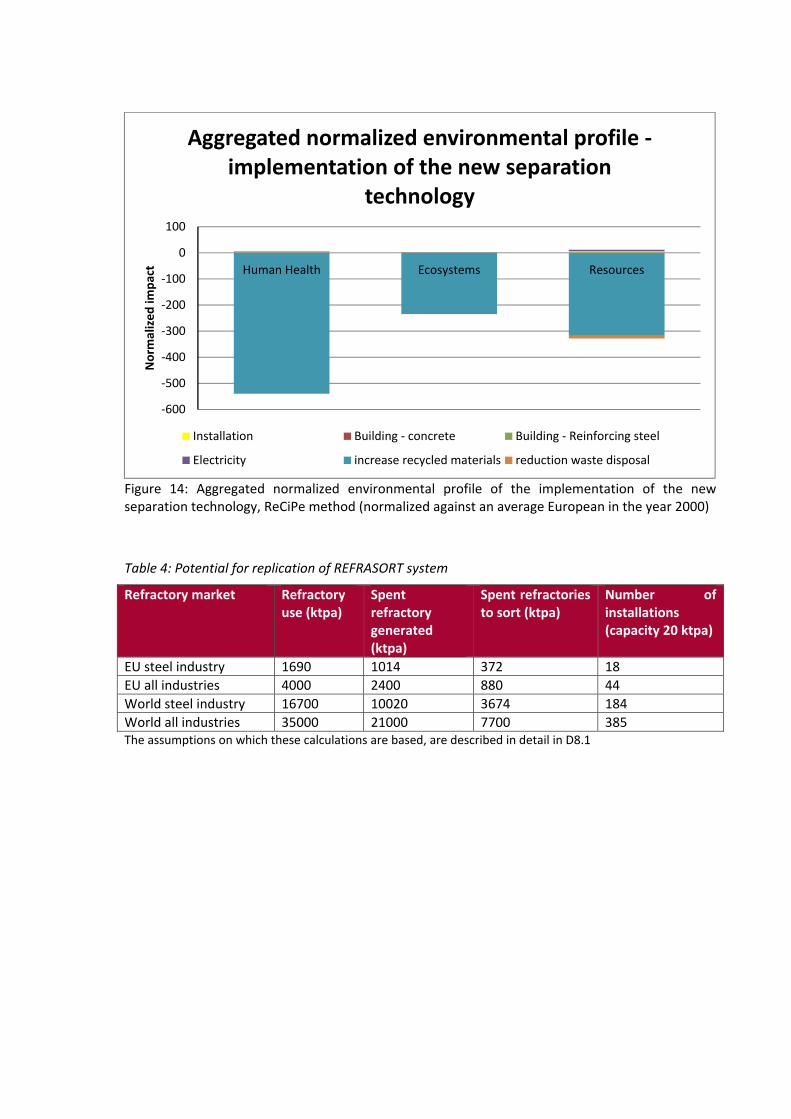
Figure 14: Aggregated normalized environmental profile of the implementation of the new separation technology, ReCiPe method (normalized against an average European in the year 2000)
Table 4: Potential for replication of REFRASORT system
Refractory market Refractory use (ktpa)
Spent refractory generated (ktpa)
Spent refractories to sort (ktpa)
Number of installations (capacity 20 ktpa)
EU steel industry 1690 1014 372 18
EU all industries 4000 2400 880 44
World steel industry 16700 10020 3674 184
World all industries 35000 21000 7700 385 The assumptions on which these calculations are based, are described in detail in D8.1
‐600
‐500
‐400
‐300
‐200
‐100
0
100
Human Health Ecosystems Resources
Norm
alized im
pact
Aggregated normalized environmental profile ‐implementation of the new separation
technology
Installation Building ‐ concrete Building ‐ Reinforcing steel


![BTS3X TM System Principle[1]](https://static.documents.pub/doc/80x56/577ccfe81a28ab9e7890e612/bts3x-tm-system-principle1.jpg)


