I n the interest of preservationists performing field operations who are most familiar with documenting historical architecture by hand, I’d like to emphasize the emergence of 3D laser scanning as a new methodology for documenting measurements leading to Historic American Buildings Survey (HABS), Historic American Engineering Record (HAER), and Historic American Landscapes Survey (HALS) drawings. ese are the oldest preservation programs in the United States Federal Government and, being the largest national archive for architectural and engineering and landscape documenta- tion, it would stand to reason that 3D documentation technology is the next logical archival step for our heritage. Coupled with new discoveries in analysis for said subjects, it would seem that we are collectively on the edge of a new era in preservation. Because the technology is relatively new to mainstream preservation work— in many cases due to smaller budgets than are typical of the construction industry, for example—it is worth investigating the analytical potential that scan data can offer. It may be noted as well that the value of a typical preserva- tion scan project far exceeds initial cost concerns when considering the ability to accurately create as-built drawings and perform various forms of analysis. As I’ve considered the future of 3D data visualization for the AEC indus- tries, of which historical preservation is a close cousin, it has become clear to me that this technology is among the most useful and profound tools of our generation, saving time and money to Figure 1. Front view: Laser scan intensity backscatter image. BY PAUL TICE FROM THE TOOLSHED Intensity Backscatter in Historical Preservation Displayed with permission • LiDAR Magazine • Vol. 4 No. 1 • Copyright 2014 Spatial Media • www.lidarnews.com
Transcript
I n the interest of preservationists performing field operations who are most familiar with documenting
historical architecture by hand, I’d like to emphasize the emergence of 3D laser scanning as a new methodology for documenting measurements leading to Historic American Buildings Survey (HABS), Historic American Engineering Record (HAER), and Historic American Landscapes Survey (HALS) drawings. These are the oldest preservation
programs in the United States Federal Government and, being the largest national archive for architectural and engineering and landscape documenta-tion, it would stand to reason that 3D documentation technology is the next logical archival step for our heritage. Coupled with new discoveries in analysis for said subjects, it would seem that we are collectively on the edge of a new era in preservation.
Because the technology is relatively new to mainstream preservation work—in many cases due to smaller budgets than are typical of the construction
industry, for example—it is worth investigating the analytical potential that scan data can offer. It may be noted as well that the value of a typical preserva-tion scan project far exceeds initial cost concerns when considering the ability to accurately create as-built drawings and perform various forms of analysis.
As I’ve considered the future of 3D data visualization for the AEC indus-tries, of which historical preservation is a close cousin, it has become clear to me that this technology is among the most useful and profound tools of our generation, saving time and money to
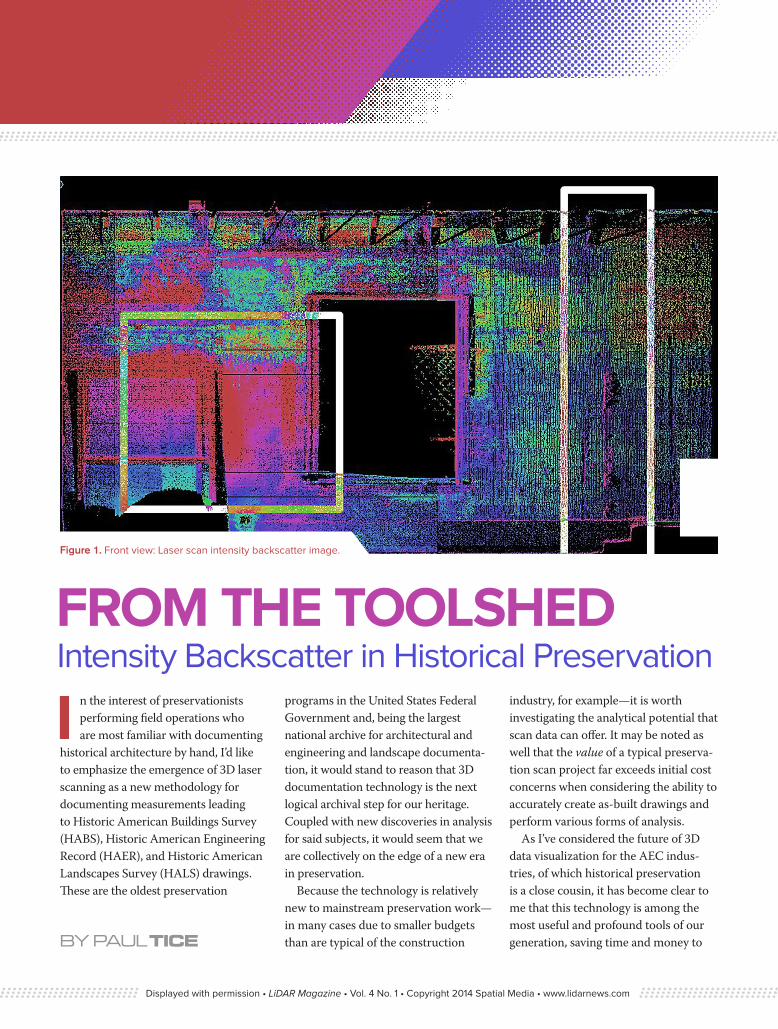
Figure 1. Front view: Laser scan intensity backscatter image.
By Paul Tice
From the toolshedIntensity Backscatter in Historical Preservation
Displayed with permission • LiDAR Magazine • Vol. 4 No. 1 • Copyright 2014 Spatial Media • www.lidarnews.com
allow designers and preservationists to focus on the outcome of their preserva-tion efforts rather than the somewhat labor intensive mechanisms to get there.
discovering the not-so-obviousIn physics, backscatter (or backscatter-ing) is the reflection of waves, particles, or signals back to the direction from which they came (Wiki). It is essentially an “echo” of the emitted light wave signal. The value of the signal intensity backscatter and its RGB visualization derived from scan data first came to my awareness through a small scanning project at a mausoleum named Hope Abbey, located on the Eugene Masonic Cemetery grounds in Eugene, Oregon. A point of interest is that this site is listed on the National Register of Historic Places and is best known for its Civil War cemetery behind the Egyptian Revival style architecture of the Abbey itself.
Having a personal curiosity for the various visual settings with point cloud data in the CAD environment, I was
flipping through the intensity settings with the Abbey scans using Bentley’s MicroStation V8i platform one day, when I noticed bright red/pink colors on certain areas of the building facade. A brief visual demonstration with Dr. Lauren Allsopp, an architectural con-servator and instructor at the University of Oregon, revealed that these RGB values were indicative of efflorescence on the building—the mineral leeching of the stonework.
What is important to understand about this visual analysis is that a portion of this efflorescence informa-tion was not actually visible to the human eye. Bearing this fact in mind, we were learning that this sort of analysis for historical infrastructure, and the knowledge that scan data can be leveraged for more than just metrological applications, could provide a means to draw more interest from the preservation community to start using this technology; perhaps creating more efficiency with their workflows.
A multitude of intensity variablesWhile efflorescence was a fairly straight-forward discovery in the previous example, there are many other ways one can read intensity data, but it is not quite as simple as turning on the “intensity button,” unfortunately—at least at the present moment with commercial software.
Since the Hope Abbey project, I have spoken with many researchers on this subject and have studied several papers on methods for predicting material types through normalization of intensity RGB values produced from scanners. Variables that are considered with intensity backscatter visualizations include scanner distance from the subject, moisture content, geometry and reflectivity of the material. Recently, I had the privilege to meet Camille Bryan, a geomatics professional from the Brampton, Ontario, Canada area. She shared some of her research with intensity backscatter through a paper entitled: “Deducting Surface Material
Displayed with permission • LiDAR Magazine • Vol. 4 No. 1 • Copyright 2014 Spatial Media • www.lidarnews.com
Characteristics from Terrestrial Laser Scan Data” (Bryan). Her findings noted that:
“According to Fowles (1975) and Jelalian (1992) (see article by Lichti et al in Geomatica 56 (1), 2002) the physical factors include the reflecting material’s electric permittivity, mag-netic permeability and conductivity which all depend on wavelength. These parameters determine the amount of energy absorbed by the reflecting material. The geometric fac-tors include the angle of incidence and surface roughness, which determine the scatter of incident radiation (Lichti, Gordon & Stewart, 2002).”
Other factors that can induce anomalies with laser returns include atmospheric variables such as humidity, dust, and Rayleigh scatter (atmospheric conditions which scatter short wave-lengths of light based on the density of air molecules—hence our beautiful red/orange Oregon sunsets) which may be difficult to account for in intensity RGB normalizations, yet do play a factor in
general scanning operations for overall visualization quality. For vegetation, characteristics such as water intake, carbon dioxide levels and chlorophyll levels may contribute to the intensity difference [as well] (Bryan). Further, intensity readings can show patterns in weathering, indicate material color (hue), and have a correlation with absorption of the laser on various materials, indicative of material density as well.
In the images below of a historic build-ing renovation project I recently worked on, one can see that the intensity reading, when compared to the topography of the wall surface in these laser scans, can tell us a few things about what is happening with this surface. Normalization in this case-study is simply defined as a ‘compar-ison’ to determine whether the intensity is reading a change in topography, the distance from the scanner to the wall, a material type, or other such anomaly. Science teaches us that when performing any sort of analysis, variables must be eliminated in a methodical way to burrow down to the truth of the circumstance. And, it may be said that no scan analysis is flawless to be sure since there are so many variables that can affect light wave travel. This simple example however, does provide useful information once some of the variables are accounted for.
In Figure 1, the rectangle to the left depicts a red area or “hot spot”. We do not have enough information to deter-mine what this is reading and the same goes for the rectangle to the right where a sort of vertical seam line appears.
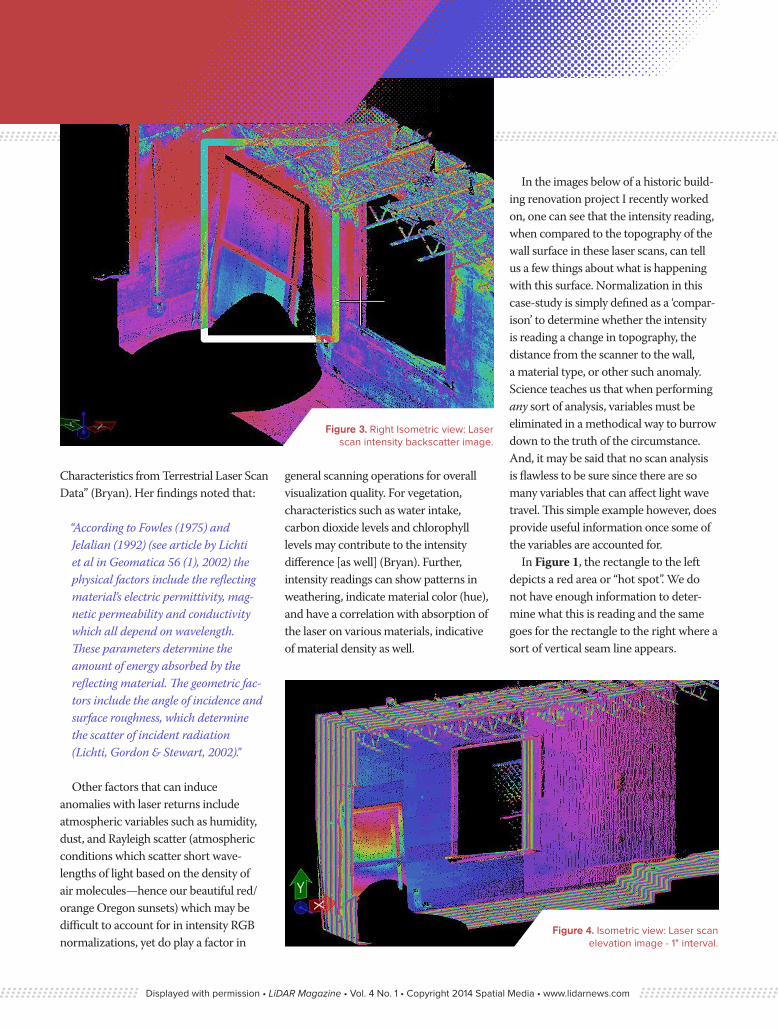
Figure 3. Right Isometric view: Laser scan intensity backscatter image.
Displayed with permission • LiDAR Magazine • Vol. 4 No. 1 • Copyright 2014 Spatial Media • www.lidarnews.com
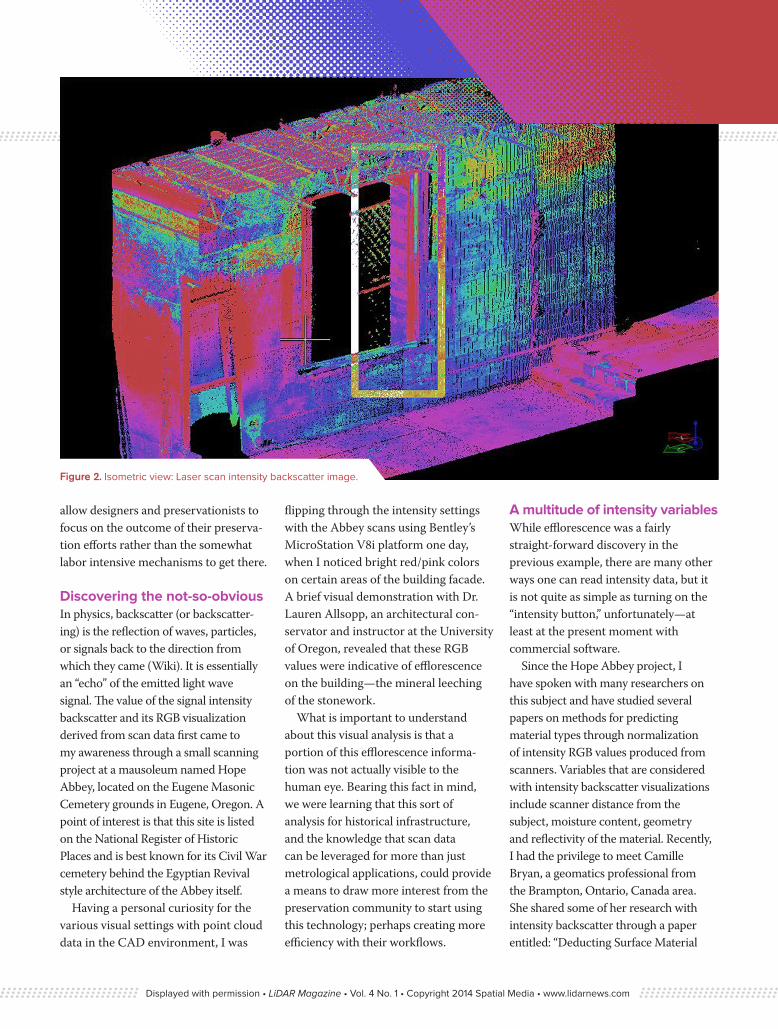
Figure 2 provides a little more context on this point cloud. We can see the scanner occlusion to the lower left created from the tripod, which explains the red area there. The distance variable for intensity is in play here. The area within the rectangle on the window casing also shows red, yet the wall itself shows green/blue. We may deduce that this is the angle of incidence for the laser returns.
Because there was a window pane lean-ing against the wall in Figure 3, we can observe some gradation on the intensity due to the refraction of the laser and its angle of incidence against the glass.
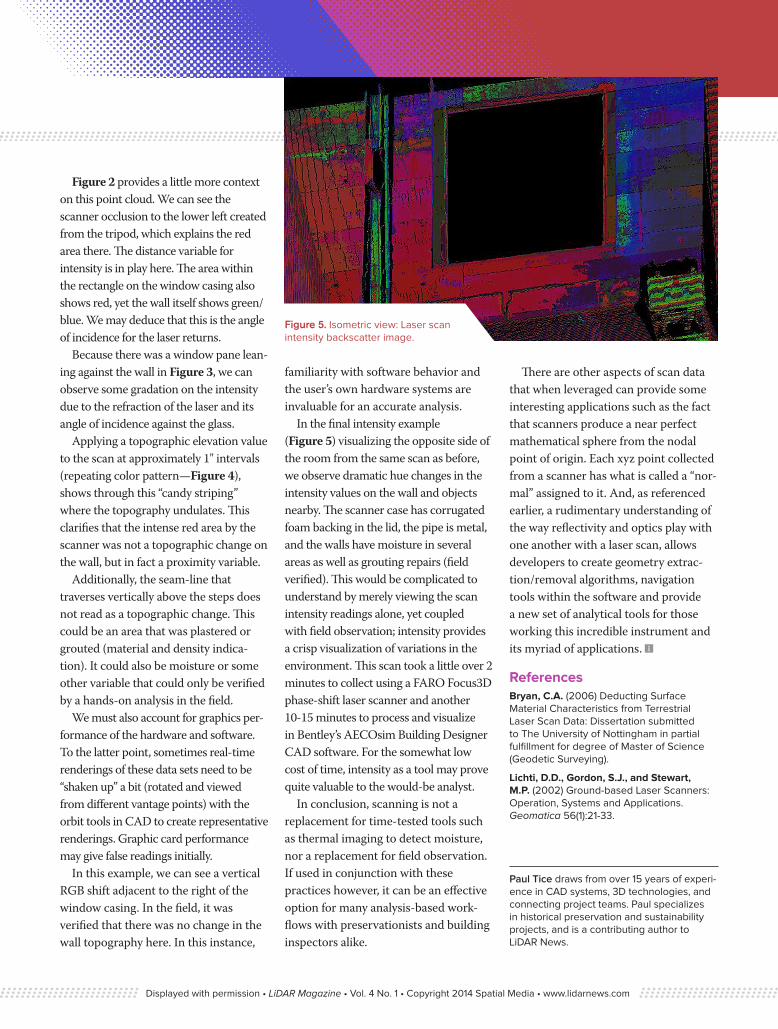
Applying a topographic elevation value to the scan at approximately 1" intervals (repeating color pattern—Figure 4), shows through this “candy striping” where the topography undulates. This clarifies that the intense red area by the scanner was not a topographic change on the wall, but in fact a proximity variable.
Additionally, the seam-line that traverses vertically above the steps does not read as a topographic change. This could be an area that was plastered or grouted (material and density indica-tion). It could also be moisture or some other variable that could only be verified by a hands-on analysis in the field.
We must also account for graphics per-formance of the hardware and software. To the latter point, sometimes real-time renderings of these data sets need to be “shaken up” a bit (rotated and viewed from different vantage points) with the orbit tools in CAD to create representative renderings. Graphic card performance may give false readings initially.
In this example, we can see a vertical RGB shift adjacent to the right of the window casing. In the field, it was verified that there was no change in the wall topography here. In this instance,
familiarity with software behavior and the user’s own hardware systems are invaluable for an accurate analysis.
In the final intensity example (Figure 5) visualizing the opposite side of the room from the same scan as before, we observe dramatic hue changes in the intensity values on the wall and objects nearby. The scanner case has corrugated foam backing in the lid, the pipe is metal, and the walls have moisture in several areas as well as grouting repairs (field verified). This would be complicated to understand by merely viewing the scan intensity readings alone, yet coupled with field observation; intensity provides a crisp visualization of variations in the environment. This scan took a little over 2 minutes to collect using a FARO Focus3D phase-shift laser scanner and another 10-15 minutes to process and visualize in Bentley’s AECOsim Building Designer CAD software. For the somewhat low cost of time, intensity as a tool may prove quite valuable to the would-be analyst.
In conclusion, scanning is not a replacement for time-tested tools such as thermal imaging to detect moisture, nor a replacement for field observation. If used in conjunction with these practices however, it can be an effective option for many analysis-based work-flows with preservationists and building inspectors alike.
There are other aspects of scan data that when leveraged can provide some interesting applications such as the fact that scanners produce a near perfect mathematical sphere from the nodal point of origin. Each xyz point collected from a scanner has what is called a “nor-mal” assigned to it. And, as referenced earlier, a rudimentary understanding of the way reflectivity and optics play with one another with a laser scan, allows developers to create geometry extrac-tion/removal algorithms, navigation tools within the software and provide a new set of analytical tools for those working this incredible instrument and its myriad of applications.
references Bryan, C.A. (2006) Deducting Surface Material Characteristics from Terrestrial Laser Scan Data: Dissertation submitted to The University of Nottingham in partial fulfillment for degree of Master of Science (Geodetic Surveying).
lichti, d.d., Gordon, s.J., and stewart, m.P. (2002) Ground-based Laser Scanners: Operation, Systems and Applications. Geomatica 56(1):21-33.
Paul Tice draws from over 15 years of experi-ence in CAD systems, 3D technologies, and connecting project teams. Paul specializes in historical preservation and sustainability projects, and is a contributing author to LiDAR News.