20
Figure I.1 Driver’s Payoffs and Bad Customer’s Payoffs Customer Behave Exploit Pick up Driver Refuse 3, 1 0, 0 –3, 4 0, 0 Source: Authors’ compilation.
| Date post: | 23-May-2018 |
| Category: |
Documents |
| Upload: | hoangquynh |
| View: | 215 times |
| Download: | 1 times |

Introduction 5
Figure I.1 Driver’s Payoffs and Bad Customer’s Payoffs
Figure I.2 Driver’s Payoffs and Good Customer’s Payoffs
Customer
Behave Exploit
Pick upDriver
Refuse
3, 1
0, 0
–3, 4
0, 0
Source: Authors’ compilation.
Customer
Behave Exploit
Pick upDriver
Refuse
–3, –2
0, 0
–3, –4
0, 0
Source: Authors’ compilation.
The primary trust problem for the truster-driver lies in identifyingwhich type the hailer or caller is—a genuine customer or a villain. Thisdilemma epitomizes countless situations in which we find ourselves inthe position of either the truster or the trustee. However, there is noth-ing in the game as such that suggests a solution; the game simply describesa situation of uncertainty about the true nature of a trustee with whomit is to the truster’s advantage to deal only if the trustee is of a good sort.The dilemma lies in the uncertainty over the real payoffs of the trustee-customers. Once the truster knows the type of trustee he is facing, thesolution of the game is trivial. But how does the truster find out, andcan the trustee do anything to inform him, truthfully or otherwise,about his type?
Trust and Signs
Michael Bacharach and Diego Gambetta (2001; see also Gambetta 2005)have articulated a new theoretical framework that can answer thatquestion, and this study was inspired by, and aims to test, some of theideas they developed.
The theory’s crucial step is to establish a link between the trustdilemma and signaling theory, a branch of rational choice theory. How-

22 Streetwise
Table I.1 Belfast Interviewee Codes
Characteristics of Interviewees Codes
Job or roleDriver —Customer CustDispatcher DBouncer B
ReligionCatholic CProtestant P
Type of taxi drivenPublic hire PHPrivate hire —
Area in which driver, dispatcher, or bouncer worked
City Center CCWest Belfast WBEast Belfast EBNorth Belfast NB
GenderMale —Female F
Source: Authors’ compilation.
tomers, particularly from late-night customers, many of whom thoughtshe was the driver’s untrusting wife or girlfriend. We were not surewhether this assumption was due to Belfast taxi drivers’ reputations inmatters of money or matrimony, or perhaps both.
We then interviewed customers and mimics: forty ordinary cus-tomers, ten “bad-looking” customers, and ten runners and three robberswho posed as good customers.14 We also arranged a group discussionwith eight of the “bad-looking” customers. Finally, we took a large num-ber of taxi rides posing as customers in a variety of locations and timesof day and night.
The Belfast drivers’ fondness for, and skill in, storytelling providedus with very rich data. Acting on information from one of our inter-viewees, we learned that staff from the Department of Environment(DOE) enforcement department, which polices the taxi industry, wereposing as passengers in order to catch unlicensed “pirate” drivers andprivate-hire drivers illegally picking up fares off the street. We met withthe head of the DOE’s enforcement team to learn more about the strate-gies of these unexpected mimics.

26 Streetwise
interview number 1. Dispatchers are coded by area in which theyworked, identified as a dispatcher, coded by gender (if female), andgiven a number. “BRD2” is the code for a male dispatcher who workedin Brooklyn and was interview number 2.
Outline of the Book
The book is divided into two parts, one for each city, beginning withBelfast. Within each part we follow the same sequence of chapters. In thefirst chapter of each part, we describe the city and the toll that taxiinghas taken on drivers. We give an account of the origins and motivationsof the drivers and of the general dangers they face when driving in theircity. Finally, we describe how they become knowledgeable about thecity in which they work and how they exchange information about thedangers they face. In the next chapters (chapters 2 and 7), we give anaccount of the various types of mimics who pose as bona-fide passen-gers in order to harm the drivers in some way and describe the strate-gies that mimics use to persuade drivers to pick them up. In chapters 3and 8, we describe the vast array of general precautions, deterrents, and
Table I.2 New York Interviewee Codes
Characteristics of Interviewees Codes
Job or roleDriver —Customer CustDispatcher D
Skin colorBlack BWhite WHispanic S
Type of taxi drivenYellow cab YCLivery cab —
Area in which driver or dispatcher workedBronx BXBrooklyn BRQueens QNorth Manhattan NM
GenderMale —Female F
Source: Authors’ compilation.

40Streetw
ise
Figure 1.1 Proportion of Catholic Residents in Belfast Electoral Wards, 1991
Source: The Ireland Story website (www.irelandstory.com), “Maps of Ireland.” Available at:www.wesleyjohnston.com/users/Ireland/maps/towns/belfast_religion.gif (accessed April 25, 2005).
CollinGlen
Derryaghy
Dunmurry Finaghy
Musgrave
Malone
Kilwee
Twin-brook
Poleglass
Glencolin
Ladybrook
Andersonstown
Glen Road
Falls Park Blackstaff Windsor
UpperMalone
SeymourHill Drumbo
Stranmillis
Botanic
Bally-nafeigh
Rosetta
Newtownbreda
BeechillMinnowburn
Galwally
Cairnshill
Knock-braken
Wynchurch
Cregagh
Ravenhill
WoodstockShaftesbury
Hillfoot
Moneyreagh
Upper Braniel
LowerBranielDown-
shire
Lisnasharragh
Orangefield
Knock
Cherryvalley
Gilnahirk Tully-carnet
BloomfieldTheMount
Ballyhanwood
Enler
Graham’sBridge
Dundonald
Carrow-reagh
Stormont
Belmont
Ballyhackamore
Sydenham
Island
Ballymacarrett
Loughview
HolywoodDemesne
BELFAST LOUGH
Whiterock Beech-mount
ClonardFalls
Shankill
Crumlin
NewLodge
DuncairnWaterWorks
Highfield
Glencairn
Woodvale
Ardoyne
UpperSpringfield
Cliftonville
LegonielBallysillan
Cavehill
Castleview
FortwilliamChichesterPark
NOTE
These Ward boundaries date from 1992, whereas the figures used to derive the colours are from the 1991 census. Between 1991 and 1992 the Ward boundaries changed slightly. Therefore, while it is highly likely that the colours are correct, it cannot be guaranteed 100%. The ward of Musgrave did not exist at the time of the Census, so its colour is a 'guestimate' derived from knowledge of the area and analysis of the nearby Wards.
exceptionally large number of firms. In Oxford, England, for instance,where the population is half that of Belfast, the number of private-hiretaxi firms is only about one-tenth of that in Belfast. This is probably oneof the reasons why taxis in Belfast are much less expensive than else-where in the United Kingdom.
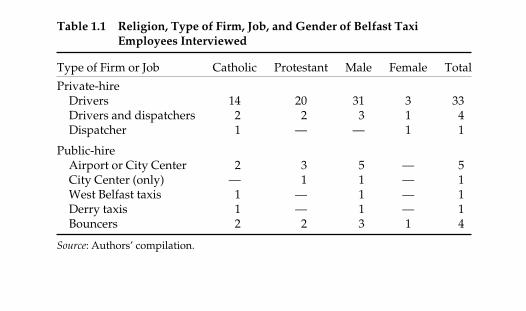
The public-hire vehicles are all London hackney-style taxis withmeters, and they are allowed to pick up hailing customers off the streetwithin a five-mile radius of Belfast’s City Center. These drivers are self-employed and own their vehicles. There are approximately 220 public-hire taxis in Belfast. Included in this group are thirteen public-hire taxidrivers who operate from Belfast City Airport.4 Both Catholics andProtestants drive these taxis (see table 1.1). Although these taxi dri-vers only pick up customers off the street and would seem to be a bet-ter group to study, they are more protected from potential attackersbecause there is a dividing screen between the front and back seats intheir cars. The partition is not bullet-proof, but it provides the driverswith some protection, making them less vulnerable than the private-hiredrivers. Nevertheless, we did interview six drivers who drove public-hire taxis based at Belfast City Airport and the City Center.
A third group of public-hire taxis operate a shuttle system: they travelup and down set routes and pick up and drop off passengers at anypoint, charging a set fare for the journey. This service operates in Northand West Belfast, where it is divided into taxis that work in Catholic areasunder the West Belfast Taxi Association (approximately 250 taxis) andtaxis that work in Protestant areas under the Shankill Taxi Association(approximately 80 taxis).5 We chose not to interview this group of taxidrivers because of the special nature of their service, which is closer to anunscheduled bus service. They have little choice in terms of the routes
Belfast and Its Taxi Drivers 33
Table 1.1 Religion, Type of Firm, Job, and Gender of Belfast Taxi Employees Interviewed
Type of Firm or Job Catholic Protestant Male Female Total
Private-hireDrivers 14 20 31 3 33Drivers and dispatchers 2 2 3 1 4Dispatcher 1 — — 1 1
Public-hireAirport or City Center 2 3 5 — 5City Center (only) — 1 1 — 1West Belfast taxis 1 — 1 — 1Derry taxis 1 — 1 — 1Bouncers 2 2 3 1 4
Source: Authors’ compilation.

Robbers
Drivers are much more worried, of course, about robbers than aboutrunners, but robbery appears to occur less frequently in Belfast than inother parts of the United Kingdom or in New York (see table 2.1). Onlytwo (4 percent) of our interviewees had been robbed: “There’s very fewtaxi drivers robbed. In all the time that I’ve been here, I’ve never beenrobbed, and I can’t really say there’s any drivers that I know—and Iknow some drivers over the years, like, thousands—I’ve never known ataxi driver to be robbed” (driver C-WB6).
Driver P-CC7 said:
There is only about 3 percent of your working day that you would ever bein that position, and the majority of that would be at night—if you wereworking at night. Very seldom during the day would you be in a predica-ment like that, but certainly at night, especially at weekends. There is oneguy in our place who I think was stabbed twenty-seven times. Another onehad a knife stuck through the back of his seat. It just goes on. There are dif-ferent cases, but it wouldn’t be a consistent thing—it wouldn’t happen allthe time. Personally, no, I have never been in a position [of danger].
Driver P-CC2 stressed that it is very hard to see a robbery coming:“You just don’t know, there is no guarantee.” Maybe this was his ownproblem in particular given that he had been robbed several times:
They are as skilled as what you are. They get into the car, and they can bequite nice to you until they get you into the area they want you . . . or theycan be silent till they reach the destination where they want you. If theyare silent, there is not much you can tell about them.
Those you can tell are the useless ones, [whereas] the ones that you arelooking for, the robbers—the violent ones—are very, very hard to tell.These people are walking about year after year never going to prison, and
50 Streetwise
Table 2.1 Drivers’ Bad Encounters in Belfast and New York
Bad Encounters Belfast (N = 45) New York (N = 50)
Had runners 73% (33) 100% (50)Was threatened 69 (31) 100 (50)Was attacked 29 (13) 50 (25)Was robbed 4 (2) 18 (9)Was hijacked 16 (7) N/A
Source: Authors’ compilation.Note: N/A = not applicable.
Drivers
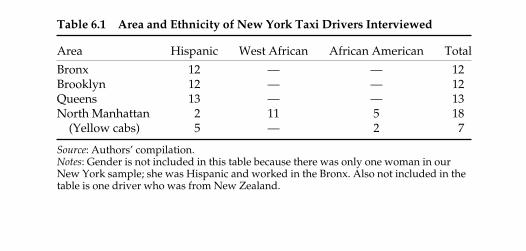
The NYSFTD estimates that of the city’s forty-one thousand liverydrivers, three-quarters are Latino, and three-quarters of those are fromthe Dominican Republic.10 In total, we interviewed sixty-three drivers.Twenty-eight (44 percent) originated in the Dominican Republic, sixteen(25 percent) were from other parts of South and Central America(Ecuador, Mexico, Puerto Rico, Peru, Colombia, and Argentina), eleven(17 percent) were from West Africa (Senegal, Ivory Coast, Ghana), andfive (10 percent) were African American (see table 6.1).11
Finding work in New York is difficult even for skilled, educatedimmigrants, and driving a taxi has always been a popular choice amongimmigrants to the United States.12 However, for many immigrants inNew York the yellow cab requirements are prohibitively tough and amedallion’s cost is well above their means. Driving a livery is a muchmore accessible and flexible option:
I feel that it’s better, this type of cab, than the yellow cabs. Yellow cabs,you know, it’s more hectic than this. They are obligated to work thosetwelve hours. And this cab here, this is my cab. I can work whatever hoursI want, and I can go home whenever I want. I can refuse a passenger if Iwant. In yellow cabs you can’t do that. Although we are regulated by theTLC to oblige the customers . . . we do that. We get a call—we have to takethem to where they want to go. But if that passenger gives us a hard time,we are also obliged to get them out, you know. (driver BX5)
Not to mention the traffic in Manhattan: “ ’Cause in yellow taxis down-town [Manhattan] you got to be in a hurry all the time. Life is too com-plicated downtown. You got to hustle too much to make money there”(driver BX8).
New York and Its Taxi Drivers 113
Table 6.1 Area and Ethnicity of New York Taxi Drivers Interviewed
Area Hispanic West African African American Total
Bronx 12 — — 12Brooklyn 12 — — 12Queens 13 — — 13North Manhattan 2 11 5 18
(Yellow cabs) 5 — 2 7
Source: Authors’ compilation.Notes: Gender is not included in this table because there was only one woman in ourNew York sample; she was Hispanic and worked in the Bronx. Also not included in thetable is one driver who was from New Zealand.

and Brooklyn contain a higher concentration of government housing,and drivers have grown wary of certain buildings in these neighbor-hoods: “The projects, the government projects—you got to be carefulwith them” (driver BX10).
Time and Season of Attack
In 95 of the 128 cases we collected from our search of the newspapers,the article reports the time of day the attack occurred. Sixty-four percentof the 95 drivers killed or injured were attacked between ten o’clock inthe evening and six o’clock in the morning.3 Drivers are aware of this:“You know in the night shift you deal with the delinquent” (driver BR1).Driver BX5 told us: “If a bad person really want to do something bad toyou, they’ll do it at night. The majority of time is at night. They also doit at daytime, but not as much. At night they have too much cover. Andthen, not only that, but they jump out of a cab, [and] nobody can gettheir description ’cause it’s dark.” Yet more than 50 percent of our New
130 Streetwise
Brooklyn29%
Bronx31%
Queens13%
NorthManhattan
16%
DowntownManhattan
3%Other
7%
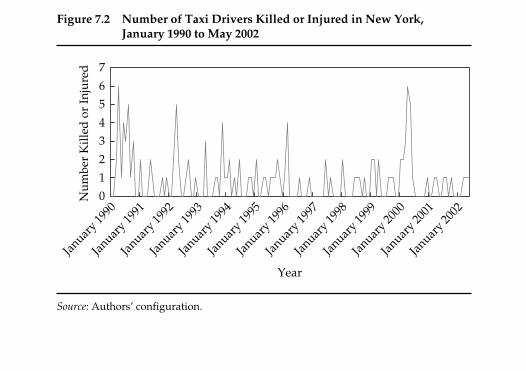
Source: Authors’ configuration.Note: n = 128
Figure 7.1 Areas of New York in Which Livery Drivers Were Murdered orViolently Assaulted, 1990 to May 2002
York interviewees chose to work at night because, with less traffic, theycan make more money (see chapter 10).
We were also able to plot the number of attacks by month for all the128 cases we found described in the newspapers (see figure 7.2). We didnot find a particular month or months in which attacks were systemati-cally (and statistically significantly) higher or lower than in others. Thissuggests that we are not witnessing a seasonal effect (although we didfind that in 1990, 1992, 1993, and 1999 the largest number of monthlyattacks took place in April, “proving” that for livery drivers, as for T. S. Eliot, April can be “the cruelest month”). Rather, we found thatattacks took place in waves, with a sharp increase followed by a steepdecline (see figure 7.2). The pattern is reminiscent of the short-livedadjustment effect of a prey-predator dynamic cycle: drivers in themonths following an increased number of attacks raise their guard andbecome more selective of passengers, thereby lowering the number ofattacks by foiling more attempts until they relax their guard again andthe number of attacks soars.
The number of attacks has declined somewhat in recent years along-side the general decline in violent crime in New York, as we noted inchapter 6. This decline is visible in the increasingly longer intervalsbetween the peaks (the longest being between 1996 and 2000) and in thefact that after the bad peak in 2000 there has never been more than oneattack a month. This decline may be due to the fact that drivers take longer
Mimics in New York 131
0
1
2
3
4
5
6
7
Januar
y 1990
Januar
y 1991
Januar
y 1992
Januar
y 1993
Januar
y 1994
Januar
y 1995
Januar
y 1996
Januar
y 1997
Januar
y 1998
Januar
y 1999
Januar
y 2000
Januar
y 2001
Januar
y 2002
Year
Num
ber
Kill
ed o
r In
jure
d
Source: Authors’ configuration.
Figure 7.2 Number of Taxi Drivers Killed or Injured in New York, January 1990 to May 2002
chapter 6—and partly because violent crimes are more likely to be pur-sued by law enforcers and to be reported in the press. Still, if we assumethat robberies are equally underrepresented in all age categories, thefinding that the younger the deadlier still holds.1
There is a further feature to be considered. Some of the fifty-nineattackers were charged for the same attack, which they carried outjointly. Table 7.4 shows that twenty-eight were charged for a solo attack,while thirty-one were charged for a group attack, of which fifteeninvolved two individuals and sixteen involved three or more individu-als. In addition, the proportion of group attacks is higher the youngerthe age of the attackers: 69 percent of those twenty-six or older actedalone, as opposed to only 33 percent of teenagers.
These data closely reflect the finding of the National Center for Juve-nile Justice that in the United States juveniles are twice as likely as adults to commit serious violent crimes in groups (Snyder andSickmund 1999). In 1999 homicides involving multiple offenders represented 28 percent of the homicides committed by offenders agefourteen to seventeen, 23 percent of the homicides committed byoffenders age eighteen to twenty-four, and 10 percent of the homicidescommitted by offenders age twenty-five or older (U.S. Department ofJustice 2001).
Mimics in New York 127
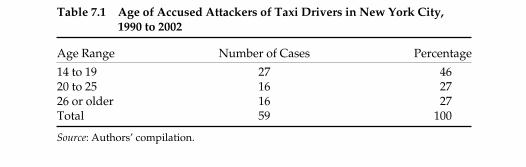
Table 7.1 Age of Accused Attackers of Taxi Drivers in New York City, 1990 to 2002
Age Range Number of Cases Percentage
14 to 19 27 4620 to 25 16 2726 or older 16 27Total 59 100
Source: Authors’ compilation.
Table 7.2 Number of Attacks Against Taxi Drivers in New York City, byType of Offense and Age of Accused Attacker, 1990 to 2002
Murder or Age Range Attempted Murder Assault Robbery Total
14 to 19 19 (70%) 1 (4%) 7 (26%) 27 (100%)20 to 25 10 (63%) 5 (31%) 1 (6%) 16 (100%)26 or older 10 (62%) 3 (19%) 3 (19%) 16 (100%)Total 39 (66%) 9 (15%) 11 (19%) 59 (100%)
Source: Authors’ compilation.

chapter 6—and partly because violent crimes are more likely to be pur-sued by law enforcers and to be reported in the press. Still, if we assumethat robberies are equally underrepresented in all age categories, thefinding that the younger the deadlier still holds.1
There is a further feature to be considered. Some of the fifty-nineattackers were charged for the same attack, which they carried outjointly. Table 7.4 shows that twenty-eight were charged for a solo attack,while thirty-one were charged for a group attack, of which fifteeninvolved two individuals and sixteen involved three or more individu-als. In addition, the proportion of group attacks is higher the youngerthe age of the attackers: 69 percent of those twenty-six or older actedalone, as opposed to only 33 percent of teenagers.
These data closely reflect the finding of the National Center for Juve-nile Justice that in the United States juveniles are twice as likely as adults to commit serious violent crimes in groups (Snyder andSickmund 1999). In 1999 homicides involving multiple offenders represented 28 percent of the homicides committed by offenders agefourteen to seventeen, 23 percent of the homicides committed byoffenders age eighteen to twenty-four, and 10 percent of the homicidescommitted by offenders age twenty-five or older (U.S. Department ofJustice 2001).
Mimics in New York 127
Table 7.1 Age of Accused Attackers of Taxi Drivers in New York City, 1990 to 2002
Age Range Number of Cases Percentage
14 to 19 27 4620 to 25 16 2726 or older 16 27Total 59 100
Source: Authors’ compilation.
Table 7.2 Number of Attacks Against Taxi Drivers in New York City, byType of Offense and Age of Accused Attacker, 1990 to 2002
Murder or Age Range Attempted Murder Assault Robbery Total
14 to 19 19 (70%) 1 (4%) 7 (26%) 27 (100%)20 to 25 10 (63%) 5 (31%) 1 (6%) 16 (100%)26 or older 10 (62%) 3 (19%) 3 (19%) 16 (100%)Total 39 (66%) 9 (15%) 11 (19%) 59 (100%)
Source: Authors’ compilation.

as that of the twenty-five- to thirty-four-year-old group (see table 7.3). Thehomicide offending rates of fourteen- to seventeen-year-olds exploded after1985, surpassing the rates of twenty-five- to thirty-four-year-olds and thirty-five- to forty-nine-year-olds and reaching a staggering peak in 1993. Sincethen, offending rates for teens and young adults have declined but remainhigher than levels prior to the mid-1980s. The rate for the eighteen- totwenty-four-year-old category was still nearly three times as high as for thenext highest category of twenty-five- to thirty-four-year-olds in 1999.
Furthermore, Charles Rathbone’s (1994/2002) study of 280 taxi driversmurdered in North America between 1980 and 1994 showed that two-thirdsof the assailants were teenagers.
2. Five of them were twenty-three, twenty-one, nineteen, eighteen, and four-teen, and three were seventeen.
3. In Rathbone’s (1994/2002) study, 82 percent of 280 drivers murdered between1980 and 1994 in the United States and Canada were attacked at night.
4. We tried to find out the success rate of this operation but met with a com-plete lack of cooperation from the TLC. Although the commission neverrefused outright to provide the information or interviews we requested, wewere continually fobbed off.
5. This appears to be a universal ploy. One respondent from a taxi Internetnewsgroup who works in Melbourne, Australia, told us: “One pretty femaleequals possible danger. Lurking in the shadows could be a group of three orfour gorillas/morons intent on having some fun at my expense” (email com-munication, November 11, 2002).
Chapter 81. Bullet-resistant partitions are not fully bullet-proof, but they do offer con-
siderable protection to the driver.
2. Some drivers appear to prefer to rely on their screening skills rather than onpartitions. For example, in San Francisco in 1994 drivers overwhelminglyopposed the proposal that their cars should be fitted with partitions(Dougan and Glover 1998).
Notes 227
Table 7.3 Homicide Trends in the United States: Homicide OffendingRates per 100,000 Population, by Age in Selected Years
Year Under 14 14 to 17 18 to 24 25 to 34 35 to 49 50 or Older
1985 0.2% 9.8% 21.4% 16.0% 9.4% 3.0%1993 0.3 30.2 41.3 15.9 7.4 2.41999 0.2 10.7 27.7 11.0 5.0 1.5
Source: FBI, Supplementary Homicide Reports, 1976 to 2002, compiled at website forU.S. Department of Justice, Bureau of Justice Statistics (2004c).

Gender
Attackers are overwhelmingly male. According to the National Centerfor Juvenile Justice, between 1980 and 1997 the large majority (93 per-cent) of known juvenile homicide offenders in the United States weremale (Snyder and Sickmund 1999). Once again, this finding is reflectedby our data: fifty-one (86 percent) of the fifty-nine individuals accused ofan offense against a taxi driver in the cases gathered from the newspaperarchive were male. Furthermore, almost all of the drivers we interviewedwho had been attacked or robbed had been the victims of men. Twodrivers told us their stories:
I had actually two major bad experiences. First it was four men tried to robme, and they had knives with them, and they try to attack me. They didrob me, but they ran away. The second one, one guy tried to rob me, andwe started fighting because the guy wasn’t armed, and the police endedup arresting him. (driver Q1)
Once, I was attacked by two men. One was white and the other was black.They had a gun, and they put it to my head. They were trying to shoot me.They were gonna rob me. But I was mad, and I started fighting againstthem, and the car had an accident with another car because I was fightingwith the guy. [When the car crashed,] one of them got out of the car andcame round the car and attacked me in the neck. I don’t know how I hadthe strength to push them away so that they couldn’t shoot the gun. Andthen the police came, but the robbers took all my money and got away,and the police didn’t catch them.
The second time I was attacked by two white men. They just put a knifeto my neck. They didn’t do anything, they didn’t harm me in any way,they just took the money and ran off. (driver Q2)
Driver Q7 was robbed by a group of men and had to plead for his life:“In 1990 I was attacked by a whole bunch of men. I was taken to a build-
128 Streetwise
Table 7.4 Percentage of Multiple Attackers Against Taxi Drivers in New York City, by Age Range, 1990 to 2002
Offense Committed . . . 14 to 19 20 to 25 26 or Older All Ages
Alone 33% (9) 50% (8) 69% (11) 48% (28)With one other 30 (8) 25 (4) 19 (3) 25 (15)With two others 26 (7) 19 (3) 12 (2) 20 (12)With three others 11 (3) 6 (1) 0 (0) 7 (4)Total 100 (27) 100 (16) 100 (16) 100 (59)
Source: Authors’ compilation.

areas being dominated by particular religious, ethnic, or other groupsdoes not raise safety concerns for them. Their concern is mostly withneighborhood crime rates. As we described their experience in the pre-ceding chapter, they worry about petty crime turning violent, a possi-bility that is of only partial concern to Belfast drivers. Several otherdifferences in the precautionary and remedial practices adopted by taxidrivers in the two cities are discussed in detail in this chapter.
Choice of Locations
Because yellow cabs control the market in the choice locations inManhattan, livery drivers have to make do with servicing the otherneighborhoods—the Bronx, Brooklyn, Queens, and north of 125thStreet in Manhattan, where the vast majority of attacks occur (seefigure 7.1). “The first guy who robbed me, robbed me in the Bronx ina place where nobody was around. In the city usually they can’t robyou in Manhattan in daytime, they try to take you to a remote area”(driver NM17). Livery drivers quickly learn which neighborhoods aredangerous, but they cannot afford to be too picky and to avoid thoseareas entirely. Many drivers accept pickups in a dangerous area pro-vided it is their area, while refusing to pick up or drop off in other dan-gerous areas. Detailed knowledge of their turf refines their screeningfeelers:
138 Streetwise
Table 8.1 Precautions and Deterrents Practiced by Taxi Drivers in Belfast and New York
Belfast New York Precautions and Deterrents (N = 45) (N = 50)
Do not wear a seat belt 98% (44) 100% (50)Mask cues that give away their religion 91 (41) N/ADrive only in their local area 58 (26) N/ADo not display a TAXI sign 51 (23) 100 (50)Work for a religiously anonymous firm 40 (18) N/ACarry a weapon 36 (16) 0 (0)Look fierce, make threats, or match aggression 36 (16) 0 (0)Do not work at night 16 (7) 38 (19)Drop off cash takings 9 (4) 24 (12)Avoid provocation or prevent violent escalation 20 (9) 98 (49)Have a partition 18 (8) 68 (34)Be selective about pickup location and destination 60 (27) 52 (26)Have a camera N/A 28 (14)
Source: Authors’ compilation.Note: N/A = not applicable.
tion, though. Driver NM13 had bypassed the dispatch base and givenhis cell phone number to favored customers, who called him direct.When we interviewed him, he was waiting for one such regular pas-senger at the Metro North station at 125th Street and Lexington Avenuein Harlem. The interview ended when his white, professional-looking,middle-aged male customer arrived.
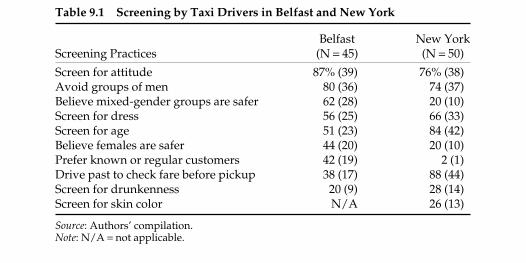
Table 9.1 allows us, at a glance, to see that there are a number of otherdifferences between Belfast and New York—above all, differences ofrace and age.
Street Etiquette
Appearances, even at a distance, reveal a wide range of information,some of which is good enough to form a considered judgment of thequality of the fare. One can see whether a hailer looks disheveled, hasbruises or wears rags, or shows signs of being mentally or socially dis-possessed by how he walks or looks and whether he behaves in an agi-tated way on the sidewalk. Drivers do, of course, avoid picking uppeople who display these signs of severe social marginality or cognitiveimpairment: “See, when the hail stands in the middle of the street, wav-ing at any car and acting stupid, I don’t stop for them. But if they see meand [calmly] wave me over, and they look normal, I’ll pull over and pickthem up” (driver BX5).
Although taxi drivers cruise the streets looking for people who wanta ride, they are wary of people who seem too keen or desperate for themto stop. Driver NM7 explained: “Sometimes the person who is waitingfor the cab isn’t even paying attention to you, he’s just waving his hand.
156 Streetwise
Table 9.1 Screening by Taxi Drivers in Belfast and New York
Belfast New YorkScreening Practices (N = 45) (N = 50)
Screen for attitude 87% (39) 76% (38)Avoid groups of men 80 (36) 74 (37)Believe mixed-gender groups are safer 62 (28) 20 (10)Screen for dress 56 (25) 66 (33)Screen for age 51 (23) 84 (42)Believe females are safer 44 (20) 20 (10)Prefer known or regular customers 42 (19) 2 (1)Drive past to check fare before pickup 38 (17) 88 (44)Screen for drunkenness 20 (9) 28 (14)Screen for skin color N/A 26 (13)
Source: Authors’ compilation.Note: N/A = not applicable.

change the time of day or their destination, which would of coursedefeat the purpose. An obliging granny or a reassuring female co-haileris not always at hand, and a church whose holy halo they might exploitis not always nearby.
In conclusion, like their Belfast counterparts, New York’s mostlyimmigrant livery drivers appear extremely adroit at negotiating andreflecting upon their world. Unlike Belfast, however, the New Yorkmetropolis is a much more unfamiliar environment for them, as reflectedin the differences in their probing strategies (see table 10.1).
New York drivers have to face the additional challenges of a new lan-guage and culture, a much greater anonymity and diversity of cus-tomers, and a higher propensity of assailants to become violent. Inseeking a better life for themselves and their families, these drivers endup taking serious risks and playing a complex series of daily trust gamesin which picking up the wrong passenger can be fatal. Making the rightdecision is not a luxury but is driven by necessity. It is the only way inwhich they can survive the perils of a job that supports their familieswhile making sure that, as driver NM2 put it, “the incidents that havehappened to me do not outweigh the good ones.” In the concludingchapter, we dissect the exact nature of their reasoning and discuss theextent to which that reasoning is informed by an intuitive application ofsignaling theory.
184 Streetwise
Table 10.1 Probing by Taxi Drivers in Belfast and New York
Belfast New YorkProbing Practices (N = 45) (N = 50)
Notice choice of seating 87% (39) 34% (17)Consult gut feelings 40 (18) 34 (17)Probe for local knowledge 31 (14) N/ANotice body posture or general demeanor 13 (6) 36 (18)Probe passenger’s eyes 11 (5) 14 (7)Probe for the passenger’s tone of voice 9 (4) 13 (6)Probe location of pickup and destination 100 (45) 52 (26)Notice facial expression 11 (5) 38 (19)Test passenger’s response to being told cost of journey 0 (0) 18 (9)Is wary of inquisitive passengers 27 (12) 18 (9)
Source: Authors’ compilation.Note: N/A = not applicable.

196 Streetwise
Table 11.1 Taxi Drivers’ Perceived Risk Versus Actual Risk, by Passengers’ Properties
Perceived Higher-Risk Properties Actual Risk: Belfast Actual Risk: New York
Younger versus older person
Male versus female
Black versus white
No data on age of attackersof taxi drivers, but in1997 the rate of convic-tion was highest formales age nineteen andfemales age eighteen(O’Mahoney and Deazley2000, 10). In 2001, 52 per-cent of the averageimmediate custody pop-ulation in prison wasbetween the ages of sev-enteen and twenty-nine(Northern Ireland Statis-tics and Research Agency2001, 77).
In all forty-nine cases ofdrivers being attacked inthe sample from 1972 to2002, the attackers weremen. In only three ofthese cases was a femalean accomplice. In 1997the conviction rate forjuvenile males was 400per 10,000, while that ofjuvenile females was 48per 10,000 (O’Mahoneyand Deazley 2000, 10). Ineach year between 1992and 2001, the averagetotal prison populationwas 98 percent male(Northern Ireland Statis-tics and ResearchAgency 2001, 76–77).
Irrelevant—nearly everyone is white.
Forty-six percent of thoseaccused of attackingdrivers in the samplewere teenagers. Eighteen- to twenty-four-year-olds between1976 and 2000 had thehighest homicide rate in the United States(U.S. Department ofJustice 2004a).
Eighty-six percent of thoseaccused of attackingdrivers in the samplewere male. In 2000 inthe United States maleswere ten times morelikely than females tocommit murder (U.S.Department of Justice2004a).
In 2000 in the UnitedStates blacks were seventimes more likely tocommit murder thanwhites (U.S. Departmentof Justice 2004a).
(Table continues on p. 197.)

Street Wisdom Appraised 197
Table 11.1 Continued
Perceived Higher-Risk Properties Actual Risk: Belfast Actual Risk: New York
Different versus same ethnic group
Multiple versus single customers
Poorer or lower-status versus wealthier or higher-status
Stranger versus known customer
(Table continues on p. 198.)
Irrelevant—there is verylittle ethnic difference.
Twenty-six percent of theattacks we reviewed inour study involvedmore than one attacker.
Ninety-one percent of theattacks in our sampletook place in poorerworking-class areas.
Eighteen percent of sectar-ian attacks involved
No specific data on taxi drivers, but most mur-ders in the United Statesare intraracial. From1976 to 2000, 86 percentof white victims werekilled by whites, and 94 percent of black victims were killed byblacks (U.S. Departmentof Justice 2004a).
Fifty-five percent of liveryrobberies between January and April 2000in northern Brooklynneighborhoods occurredin taxis carrying multiplepassengers. Of all homi-cides between 1976 and 2000, 46.1 percentcommitted by whitesand 51.6 percent commit-ted by blacks involvedmultiple offenders (U.S. Department of Justice 2004a).
Sixty-five percent of theattacks on drivers tookplace in the poorer neigh-borhoods of the Bronxand Brooklyn, implyingthat the customers werealso poor. In 2002 per-sons in households withan annual income under$75,000 were robbed at asignificantly higher ratethan persons in house-holds earning more (U.S. Department ofJustice 2004b).
Drivers make efforts to getregular known fares.
inductive reasoning is applied to observable features of people ratherthan to locations or times of the day or week.
Statistical discrimination warrants a short ethical digression. One canfault drivers (or anyone else) for adopting it on two counts: for wronglyattributing probabilities to the categories they discriminate for or against;and for engaging in category-based discrimination at all, namely,assigning positive or negative values to individuals on the basis of thetrue probabilistic properties of the group to which they belong. Consid-ering first the second reason for finding fault, suppose beliefs are wellfounded; then, in the case of both police and employers, the stereotyp-ing can be deemed to be “rational,” and it has in fact been so defined byeconomists. However, the fact that it is rational does not make it fair.
198 Streetwise
Table 11.1 Continued
Perceived Higher-Risk Properties Actual Risk: Belfast Actual Risk: New York
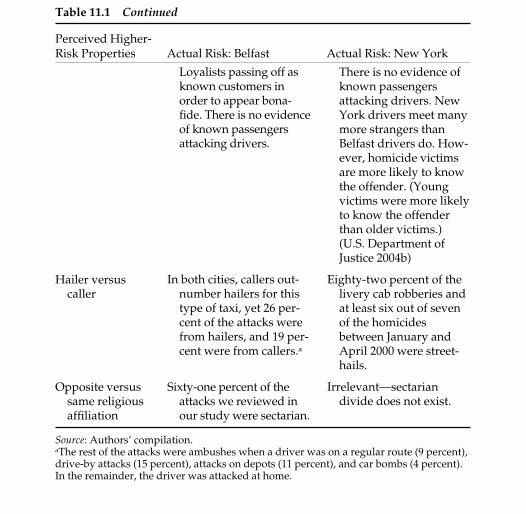
Hailer versus caller
Opposite versus same religious affiliation
Source: Authors’ compilation.aThe rest of the attacks were ambushes when a driver was on a regular route (9 percent),drive-by attacks (15 percent), attacks on depots (11 percent), and car bombs (4 percent).In the remainder, the driver was attacked at home.
There is no evidence ofknown passengersattacking drivers. NewYork drivers meet manymore strangers thanBelfast drivers do. How-ever, homicide victimsare more likely to knowthe offender. (Youngvictims were more likelyto know the offenderthan older victims.)(U.S. Department of Justice 2004b)
Eighty-two percent of thelivery cab robberies andat least six out of sevenof the homicidesbetween January andApril 2000 were street-hails.
Irrelevant—sectariandivide does not exist.
Loyalists passing off asknown customers inorder to appear bona-fide. There is no evidenceof known passengersattacking drivers.
In both cities, callers out-number hailers for thistype of taxi, yet 26 per-cent of the attacks werefrom hailers, and 19 per-cent were from callers.a
Sixty-one percent of theattacks we reviewed inour study were sectarian.


