Figure S1. Neighbour joining tree reconstructed based upon the concatenated sequences of 2822 core genes of the 25 citrus canker causing Xanthomonas strains using MEGA6. A total of 100 bootstrap replicates were made, and bootstrap values were indicated at the branch points MN10 MN12 MN11 JX4 JX5 GD2 GD3 UI6 UI7 A306 NT17 FB19 Miami BL18 MF20 A*270 As9 As8 Aw12879 Aw13 Aw16 Aw14 Aw15 XauB XauC 100 96 92 86 100 100 100 100 100 100 100 91 100 100 99 100 100 100 95 95 68 100 XacA w & XacA* XacA
Transcript
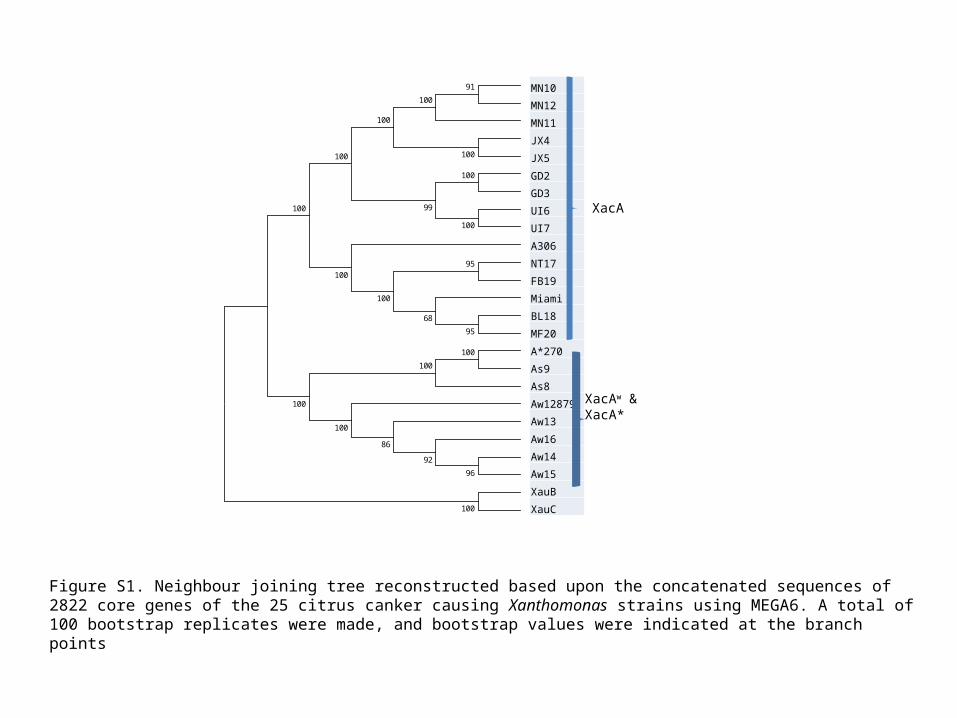
Figure S1. Neighbour joining tree reconstructed based upon the concatenated sequences of 2822 core genes of the 25 citrus canker causing Xanthomonas strains using MEGA6. A total of 100 bootstrap replicates were made, and bootstrap values were indicated at the branch points
MN10
MN12
MN11
JX4
JX5
GD2
GD3
UI6
UI7
A306
NT17
FB19
Miami
BL18
MF20
A*270
As9
As8
Aw12879
Aw13
Aw16
Aw14
Aw15
XauB
XauC
162
164
163
156
157
154
155
158
159
151
169
171
152
170
172
058
161
160
XCAW
165
168
166
167
xauB
xauC100
96
92
86
100
100
100
100
100
100
100
91
100
100
99
100
100
100
95
95
68
100
XacAw &XacA*
XacA
XacAw & XacA*
XacA
Figure. S2. 3D view of the genome features of the 23 Xac strains. The red triangles denote XacA* strains, the pink circles denote XacAw strains and the yellow diamond denote XacA strains.
Core genome Pan-genome
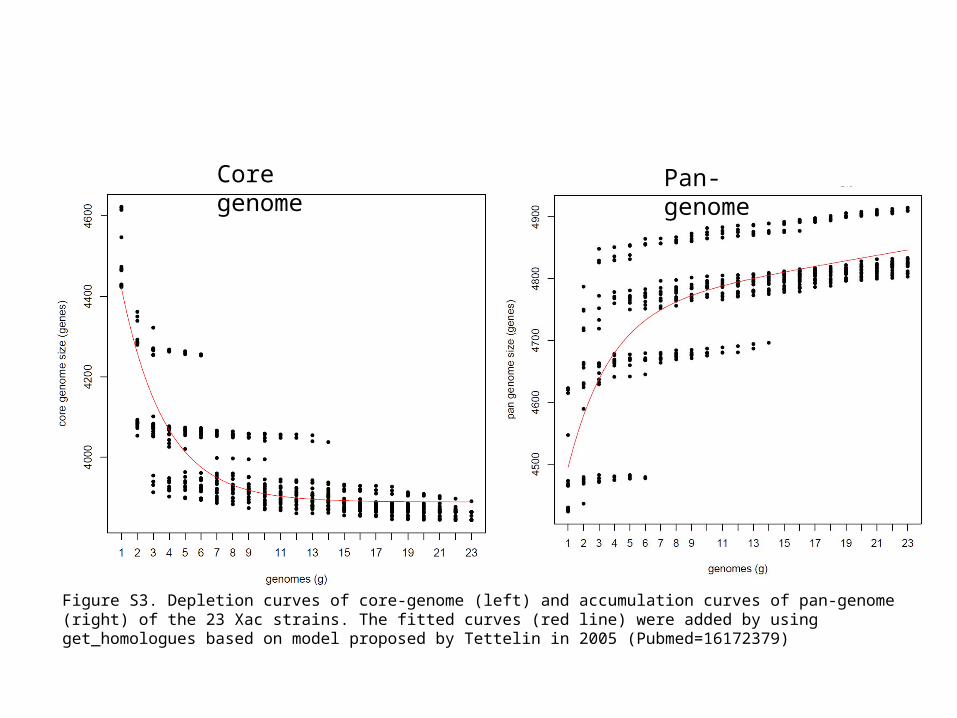
Figure S3. Depletion curves of core-genome (left) and accumulation curves of pan-genome (right) of the 23 Xac strains. The fitted curves (red line) were added by using get_homologues based on model proposed by Tettelin in 2005 (Pubmed=16172379)
Figure S4. Results of the ClonalFrame analysis on the basis of un-gapped sequences of the longest 9 aligned blocks of 23 Xac genomes generated by progressiveMAUVE. The inferred clonal genealogy was shown on the left and the distribution of the recombination (red) and mutation (green) events estimated by ClonalFrame on the corresponding branches were shown on right. The distribution of the 9 blocks were indicated according to the start and end position on XacA306 chromosome. All possible events revealed by ClonalFrame were shown, and the relationship between event panels and their corresponding nodes were indicated with dash lines. The recombination events (red in the event panels) only occurred in XacA node and Aw & A* node (red dash lines).