Solar tide Lunar tide f) Moon Earth Earth Moon Earth f) Moon Moon 3rd quarter New moon phase: () • Tides: Neap Spr ing Combined tide f) Moon 1st quarter () Neap Sun .... Sun .... Sun .... Sun .... Full moon 0 Spring Water In"" j level MSL iU'' ijij_i ijij ij 5 10 15 20 25 30 Legend : V Earth rotation N North Pole Notes: (a) New Moon At new Moon, spring tides occur as the M oon's and Sun's bulges are aligned with their maKima at the same locations. (b) First Quarter At first quarter Moon, neap tides occur as the Moon's and Sun's bulges are aligned at 90° to each other and the maxima of the Moon's tide coincide with the minima of the Sun's tide (c) Full Moon At full Moon, spring tides with a greater tidal range (higher high and lower low tides) occur because the tidal bulges caused by the Moon and the Sun a re aligned with their maxima at the same locations. (d) Third (or Last) Quarter Atthi rd quarter Moon, neap t ides occur because the Moon's bulge and Sun's bulge are aligned at 90° to each other and the maxima of the Moon's tide coincide with the minima of the Sun's tide. (e) Monthly tidal records show the twice monthly occurrence of spr ing tides associated with new M oon a nd lull Moon, and the twice monthly occurrence of neap tides associated wrth the quarter Moons. r4 V HLW V LLW 0 24h 48h Days Semi-<jiurnal Tide HHW = Higher high water LLW Lower low water LHW Lower High wa ter HLW = Higher low water 1. The observed spring and neap sequences on Earth are more complicated for reasons that the orbits of the Moon and Sun are not in the same plane as this simp lified figure depicts. These orbits are inclined to each other and the inclination changes with time. 2. Lunar Tide : Tide due to Moon only Solar Tide : Tide due to Sun only 129 Figure 1 - Simplified Earth / Moon/ Sun System for Spring and Neap Tides
(a) New Moon At new Moon, spring tides occur as the Moon's and Sun's bulges are aligned with their maKima at the same locations.
(b) First Quarter At first quarter Moon, neap tides occur as the Moon's and Sun's bulges are aligned at 90° to each other and the maxima of the Moon's tide coincide with the minima of the Sun's tide
(c) Full Moon At full Moon, spring tides with a greater tidal range (higher high and lower low tides) occur because the tidal bulges caused by the Moon and the Sun are aligned with their maxima at the same locations.
(d) Third (or Last) Quarter Atthi rd quarter Moon, neap tides occur because the Moon's bulge and Sun's bulge are aligned at 90° to each other and the maxima of the Moon's tide coincide with the minima of the Sun's tide.
(e) Monthly tidal records show the twice monthly occurrence of spring tides associated with new Moon and lull Moon, and the twice monthly occurrence of neap tides associated wrth the quarter Moons.
::~ r4 V HLW V LLW
0 24h 48h
Days Semi-<jiurnal Tide
HHW = Higher high water LLW Lower low water LHW Lower High water HLW = Higher low water
1. The observed spring and neap sequences on Earth are more complicated for reasons that the orbits of the Moon and Sun are not in the same plane as this simplified figure depicts. These orbits are inclined to each other and the inclination changes with time.
2. Lunar Tide : Tide due to Moon only Solar Tide : Tide due to Sun only
129
Figure 1 - Simplified Earth/ Moon/ Sun System for Spring and Neap Tides
1. The coas11ine is 1he coas11ine in 1996. 2. Description of each wave region is given in Table 35.
Legend :
~ Wave Region 1
F/+j Wave Region 2
H·:?d Wave Region 3
0 Wave Region 4
KOWLOON
Figure 9 - Wave Regions in the Harbour Area
E
:E
"' -, :I: m > "' ;;:
E ~
E 't,j
"' 'C ~
"' :E
"' ·;;; :I: m > "' ;;: 'E "' 0 ~ -, "' "'
Wave Height Variation During a Typical Weekday Measured at Point A (See Figure 9)
1.6
1.4
1.2
0.8
0.6
0.4 Morning Peak
Afternoon Peak 0.2
0
<0 <0
:ll$ :ll$ ci~ N~
Time on a Typical Weekday
Figure 10 - Daily Wave Variation around a Harbour Wave Station close to Busy Fairways
-w 00
2000
1000
500
200
~ tOO "' m ~
-g 50 -~
tO
5
2
/ / / / //
/
/
/ / /
/ / / '/ / / / V/
/ / V /
/ ~ /
Probabili1y, P per cent
/ 5 tO
/
/ / / 25
V / / 50
/
~ / / 63
/ ~ V
T = t
t- Jt- _P_ tOO
2 5 tO 20 50 tOO 200
Design life, N years
Legend: T return period of a particular extreme wave condition p = the probability of a particular extreme wave condition occurring during design life N years
Source: BSI (2000)
139
Figure 11 - Relationship between Design Life, Return Period and Probability of Exceedence
5uo)l 5UOH JO A.~dBJD!lBJlS AJEUJSJBnO aJo~suo JO WBJDB!O ~!JBWali~S -£~ aJnD!:I
r paving
I assumed
\1 water level
\1 SWL ~
lAh -
- -flow from landward sources ~ 0
Minimum tidallag (Ah) to be :
0.7m for Normal Loading Conditions f.Om for Extreme Loading Conditions
Note:
1. Assumptions - land behind seawall is paved. - flow from landward sources is negligible. - adequate surtace and back drainage are provided.
142
Figure 14 - Ground Water Profile behind Seawalls - Area Paved
Note:
/I / I
/ I / I
~· /
I /
Ha h,
breakwater /jetty
SWL
d' dm d
P, a,
(hydrostatic pressure and buoyancy not shown)
The elevation la which wave pressure is exerted
~· = 0.75 ( t + cos~ ) Ho
Where ~ is the nominal angle between the direction of wave approach and a line normal to the structure. When the actual angle between the direction of approach and the normal is 15°or less,~ =0. When the actual angle exceeds 15 °, fj =actual angle of 15°
Wave pressure on the front face of the structure (Hydrostatic pressure not included) :
p., = i<t+ cos~)(a 1 +<X 2 cos 2 ~)Y.H 0
Uplift pressure at the toe of the structure (buoyancy not included) :
Pu = ia, a, ( t + cos~) YwHo
where 2
t [ 41Tdll J = 0.6 + -2 sinh(41Td I L)
a,
a, is the lesser of.!.( do dm ) ( ~ ,' 3 d 0 dm
=t-.Q:(t- t ) d cosh (21T d I L)
2dm or a=--' Ho
t. a, , a 2 and a3 may also be estimated from design curves in Figure t6
Source: BSI (2000)
143
Figure 15 - Maximum Wave Pressure on Vertical Structures (Breaking and Non-breaking Waves) - Pressure Distribution
1.1
\ 1.0
0.9
0.8
0.7
1.0
0.8
0.6
0.4
0.2
Legend:
\
1\ \
"--.__ 0.1 0.2 0.3 0.4 0.5 0.6
d L
le--r:::----~........_
- l\. ~,'--~\\ "-.
....__ r-
1\'\ '"""
-...... 1--
\ ""' ' t---\'' t---
" t---['-r-0.2 0.4 0.6
d L
a,
0.0
0.1
0.2
0.3
0.4
0.5 d' d
0.6
0.7
0.8
0.9
1.0 0.8 1.0
L wavelength ot design wave in depth d corresponding to T, H D = design wave height
Note:
1. See Figure 15 ford, d', d. and d,
Source : BSI (2000)
..'!!!! db
144
Figure 16 - Maximum Wave Pressure on Vertical Structures (Breaking and Non-breaking Waves) - Alpha Values
Crest of clapotis
Mean level of clapotis
Seawall
H0 <0.7d d Trough of clapotis
Notes:
Uplift due to combined effect of buoyancy and
Pressure at the toe of the structure (Effect of hydrostatic pressure included) :
Pm;, = Ywd-YwH 0 /cosh(27rd/L) under trough condition
Height of clapotis "' 2 times height of free incident wave
Clapotis set-up, Hoc = 7rHo' coth (27rd/L) L
d'
1. The wave pressure distribution on the wall, based on the theory of Sainflou, is assumed to be linear with depth.
2. The figure of 0.7 might not be correct for steep wave conditions, steeply sloping seabeds and composite structures.
Source: BSI (2000)
145
Figure 17 - Wave Pressure under Wave Trough
z -I=
-~~-y----;;;---i'--k,+-z='l)= ~ cos[2"if-+l)
Jm"= ~ ' "'-~ I "" f +ve z ---+--t- -,--+---X
__./ du ""-......__ 1! --ve z - u,df ---
'"l_ Z;
flii:J.Z ·-
Wave height: H- d I 72<~
f01 .o.z p : Water density
Wave length: L : Height of water surface 1)
above still water level Wave period: T
Notes:
- f---D lz=-d
Se abed
= C pg1TD 2 H f..!. cosh [21T(z+d)/L] fr;m" 1 4 l L cosh [27Td/L]
1 . _ C pgDH2 (~[cosh [21T(z+d)/L]
0• m" - 0 2 4L2 cosh [21Td/L]
)
]') Where f li = inertia force per unit length at depth z 1 ; 'max' denotes its maximum value.
101 = drag force per unit length at depth z1 ; 'max' denotes its maximum value. Cr = inertia coefficient C 0 = drag coefficient D = pile diameter g = acceleration due la gravity
For DtW, >0.2, inertia force is dominant: Wave Force on Pile = 1.4 x [Summation off 11 max from water surface to seabed]
= 1.4 X L f11 max 6.Z ;
For DtW, <0.2, drag force is dominant: Wave Force on Pile = 1.4 x [Summation off 01 m" from water surface to sea bed]
= 1.4 X ~~Dimaxh.Z ;
and W p = orbit width of water particles at the surface H
tanh(~)
1. For inclined piles, the maximum force per unit length perpendicular to the actual inclined pile is taken to the horizontal force per unit length of a fictitious vertical pile at the same location.
2. The pile diameter should include an allowance for wave growth.
3. The above expression is based on linear wave (Airy) theory.
Source: BSI (2000)
146
Figure 18 - Wave Forces on Piles
1.2
Q
<..>
c 0.8 m . ., ~ 0 0
~ 0.6 ~ 0
0.4
0.2
0
Legend:
D Diamater of cylinder/pile U Velocity normal to member ll Kinematic viscosity of water k Roughness
Source : BSI(2000)
Rough ki0=11200
W23
10'
V476 V714
10'
Reynolds number Re (UD/ll)
---- -----
Figure 19 - Drag Coefficient Values for Circular Cylinders
-... ._,
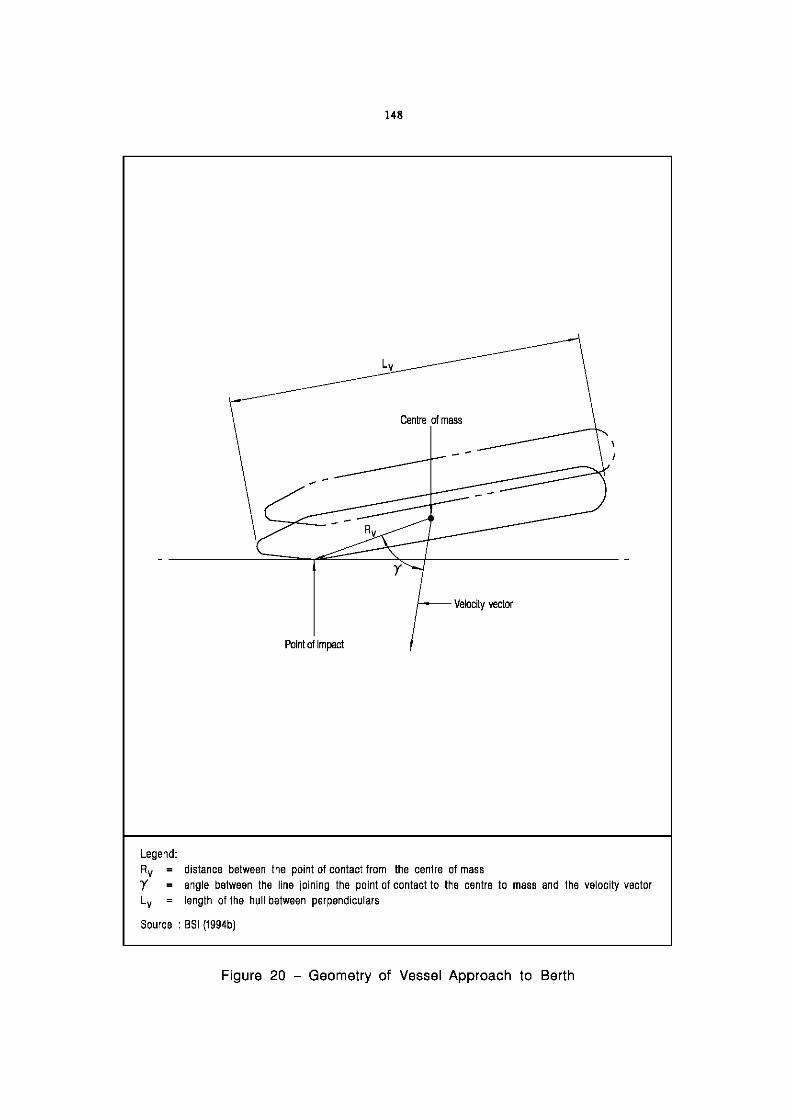
Legend:
Rv y Lv
Centre of mass
Velocity vector
Point of impact
distance between the point of contact from the centre of mass angle between the line joining the point of contact to the centre to mass and the velocity vector length of the hull between perpendiculars
Source : BSI (t994b)
148
Figure 20 - Geometry of Vessel Approach to Berth
Hull line at impact level
Face of cope
Deflections !> 1 , !>, , !>a etc. to be determined to establish the angle of application of loads
Note:
I I I I bo....J
Fender unit
(a) Horizontal Geometry
(b) Vertical Geometry
1. 1> 1 , 1> 2 , !>a are deflections of the fender unit.