INITIATION | COMMENT JULY 24, 2012 Federated Investors, Inc. (NYSE: FII) Liquidity at a 'Buck', But for How Long? Underperform Above Average Risk Price: 19.69 Shares O/S (MM): 104.2 Dividend: 0.96 Price Target: 19.00 Implied All-In Return: 1% Market Cap (MM): 2,052 Yield: 4.9% Priced as of market close, July 24, 2012 ET. Investment Conclusion We view recent regulatory efforts to introduce new rules for money market funds as the biggest challenge the company has faced. Any of the new money market rules proposed by the Chairman of the SEC Ms. Schapiro — floating NAVs, capital buffers, or deterrents to redemptions — could lead to significant outflows, in our view. Sure, there have been encouraging developments with positive flows into Federated's equities business and continued strong flows into its fixed-income funds. However, the shares are trading at an in-line multiple with its peers despite facing a potential risk to its core money market franchise. We provide sensitivity tables to demonstrate the effect of outflows on our price target were the new rules adopted. The following lead us to our investment conclusion: • Federated is leveraged to money markets: With 75% of its total AuM in money market funds contributing to 40% of net revenues, we would expect an adoption of new rules as proposed by the SEC to affect earnings negatively. • Tougher money market rules could be introduced despite strong opposition: While there has been widespread resistance to new rules proposed by the SEC's Chairman, investors should not dismiss this initiative yet. Ms. Schapiro will put her proposal to a vote in late July. If the proposal fails, tougher rules could still be introduced with the Financial Stability Oversight Council (FSOC) gaining regulatory oversight over money market funds by declaring them to be 'systemically important'. • Large outflows a possibility: If passed, any of the proposals put forth by the SEC will make money market funds especially desirable and could lead to industry-wide outflows, we believe. The risk to Federated is not to be ignored. Federated's CEO has emphasized on various occasions that the money market industry could be changed significantly if the proposed rules were to pass. • Limited upside potential, fairly valued: With the stock trading at 12x 2013E P/E, which is in line with its peers, we see limited upside potential. Historically, Federated has traded at a discount to its peers. We see potential downside risk, should money market reforms be approved. We apply a 15% discount to the peer multiple. Priced as of prior trading day's market close, EST (unless otherwise noted). 125 WEEKS 12MAR10 - 23JUL12 16.00 18.00 20.00 22.00 24.00 26.00 28.00 M A M J J A S O N 2010 D J F M A M J J A S O N 2011 D J F M A M J J 2012 HI-28JAN11 28.57 HI/LO DIFF -49.74% CLOSE 20.44 LO-23DEC11 14.36 5000 10000 15000 PEAK VOL. 20787.9 VOLUME 838.0 60.00 70.00 80.00 90.00 100.00 Rel. S&P 500 HI-12MAR10 100.00 HI/LO DIFF -47.95% CLOSE 66.46 LO-23DEC11 52.05 RBC Capital Markets, LLC Bulent Ozcan, CFA (Associate Analyst) (212) 863-4818; [email protected]Eric N. Berg, CPA, CFA (Analyst) (212) 618-7593; [email protected]Kenneth S. Lee (Associate) (212) 905-5995; [email protected]FY Dec 2010A 2011A 2012E 2013E Adj EPS - FD 1.73 1.45 1.70 1.80 P/AEPS 11.4x 13.6x 11.6x 10.9x Net Flows (B) (35.8) 10.2 0.7 15.3 AUM (B) 358.2 369.7 375.4 395.2 Adj EPS - FD Q1 Q2 Q3 Q4 2010 0.38A 0.46A 0.42A 0.45A 2011 0.32A 0.41A 0.37A 0.36A 2012 0.41A 0.42E 0.43E 0.45E 2013 0.44E 0.45E 0.46E 0.46E Net Flows (B) 2010 (40.8)A 79.1A (89.3)A 15.2A 2011 (4.9)A (6.2)A 5.8A 15.4A 2012 (9.3)A 3.3E 3.3E 3.4E 2013 3.8E 3.8E 3.9E 3.9E AUM (B) 2010 349.9A 426.8A 341.3A 358.2A 2011 354.9A 349.4A 351.7A 369.7A 2012 363.6A 366.1E 370.9E 375.4E 2013 380.2E 385.1E 390.1E 395.2E All values in USD unless otherwise noted. For Required Conflicts Disclosures, see Page 35.
Transcript
INITIATION | COMMENTJULY 24, 2012
Federated Investors, Inc. (NYSE: FII)
Liquidity at a 'Buck', But for How Long?
UnderperformAbove Average RiskPrice: 19.69
Shares O/S (MM): 104.2Dividend: 0.96
Price Target: 19.00Implied All-In Return: 1%Market Cap (MM): 2,052Yield: 4.9%
Priced as of market close, July 24, 2012 ET.
Investment Conclusion
We view recent regulatory efforts to introduce new rules for money market fundsas the biggest challenge the company has faced. Any of the new money marketrules proposed by the Chairman of the SEC Ms. Schapiro — floating NAVs,capital buffers, or deterrents to redemptions — could lead to significant outflows,in our view. Sure, there have been encouraging developments with positive flowsinto Federated's equities business and continued strong flows into itsfixed-income funds. However, the shares are trading at an in-line multiple with itspeers despite facing a potential risk to its core money market franchise. Weprovide sensitivity tables to demonstrate the effect of outflows on our price targetwere the new rules adopted.
The following lead us to our investment conclusion:
• Federated is leveraged to money markets: With 75% of its total AuM inmoney market funds contributing to 40% of net revenues, we would expect anadoption of new rules as proposed by the SEC to affect earnings negatively.
• Tougher money market rules could be introduced despite strongopposition: While there has been widespread resistance to new rules proposedby the SEC's Chairman, investors should not dismiss this initiative yet. Ms.Schapiro will put her proposal to a vote in late July. If the proposal fails,tougher rules could still be introduced with the Financial Stability OversightCouncil (FSOC) gaining regulatory oversight over money market funds bydeclaring them to be 'systemically important'.
• Large outflows a possibility: If passed, any of the proposals put forth by theSEC will make money market funds especially desirable and could lead toindustry-wide outflows, we believe. The risk to Federated is not to be ignored.Federated's CEO has emphasized on various occasions that the money marketindustry could be changed significantly if the proposed rules were to pass.
• Limited upside potential, fairly valued: With the stock trading at 12x 2013EP/E, which is in line with its peers, we see limited upside potential.Historically, Federated has traded at a discount to its peers. We see potentialdownside risk, should money market reforms be approved. We apply a 15%discount to the peer multiple.
Priced as of prior trading day's market close, EST (unless otherwise noted).
125 WEEKS 12MAR10 - 23JUL12
16.00
18.00
20.00
22.00
24.00
26.00
28.00
M A M J J A S O N2010
D J F M A M J J A S O N2011
D J F M A M J J2012
HI-28JAN11 28.57HI/LO DIFF -49.74%
CLOSE 20.44
LO-23DEC11 14.36
5000
10000
15000
PEAK VOL. 20787.9VOLUME 838.0
60.00
70.00
80.00
90.00100.00 Rel. S&P 500 HI-12MAR10 100.00
HI/LO DIFF -47.95%
CLOSE 66.46
LO-23DEC11 52.05
RBC Capital Markets, LLC
Bulent Ozcan, CFA (Associate Analyst)(212) 863-4818; [email protected]
Coop. Centr. Raiffeisen-Boerenleenbank BA 2,388 51 2.3
Source: FactSet
Exhibit 4: Ownership by Region
Position Mkt Val
Global Region ('000) (MM) % OS
North America 86,994 1,847 83.5
Europe 3,983 85 3.8
Asia 154 3 0.1
Pacific 47 1 0.0
Middle East 0 0 0.0
Source: FactSet
Federated Investors, Inc.July 24, 2012
5
Investment Thesis & Analysis
We are initiating coverage on Federated Investors with an Underperform and Above Average Risk rating.
We believe that the company is facing a significant threat to its business model and earnings, despite
progress in its equity and fixed-income businesses, and a continued push to grow organically and through
acquisitions. We believe that considerations such as the low interest rate environment, fee waivers, or
improving fund performance, i.e., fundamental value drivers, are inconsequential at this point. With the
backdrop of shares trading in line with its peers and the potential threat of new money market regulations
transforming the industry, we regard the push for new rules as the main driver of valuation. We see risks in
that respect. Thus, we made this subject the main topic of this initiation report because we believe that the
market has fully priced in positive developments, yet it seems to assign a low probability to new money
market rules being adopted.
We Believe that Tougher Rules are Coming Despite Strong Opposition
There are two potential paths as how this could happen despite widespread resistance against new regulations. One possibility could be that Luis Aguilar, a Democratic SEC Commissioner, votes in favor of new rules in late July. Another possibility would be that the FSOC could gain regulatory oversight over money market funds by designating them as
‘systemically important’.
We felt it necessary to provide some recent history to explain our view on the matter.
In our opinion, the events leading to the financial crisis have affected the money market industry
profoundly. Following the collapse of Lehman Brothers in the fall of 2008, one of the older money market
funds, the Reserve Primary Fund, with $62 billion of assets, faced $40 billion of redemption requests. The
fund had invested $785 million in commercial papers issued by Lehman Brothers, when the investment
bank filed for bankruptcy. This was only the second time in history that a money market fund had ‗broken
the buck‘, that is, net asset values fell below $1.00. Ironically, the Reserve Fund, the parent of the Reserve
Primary Fund, was the first money market fund to be sold. It was established in 1971 by Bruce Bent and
Henry Brown.
The other fund, which had ‗broken the buck‘, was the Community Bankers US Government Money Market
Fund in 1994. That fund had 25% of its assets in derivatives and was caught in the derivatives meltdown
that year.
Since money market funds are used as an alternative to savings accounts, the implications of ‗breaking the
buck‘ can be alarming. Clients who invest in the money market fund are likely to withdraw all their money
if a money market fund declares that it has suffered large losses on investments. The product design
incentivizes investors to redeem their share sooner rather than later. In a sense, an analogy would be with
musical chairs—no one wants to be left standing when the music stops playing.
Here is why: Since the first investors to withdraw their assets could get 100% of their investments, there
might not be any resources left to satisfy the funds obligation to the last investor. If the fund had to
liquidate its investments to meet redemption requests, then it might have to do so at depressed market
values and at a loss. Hence, at the first sign of a loss, investors try to get their capital out of the fund.
Before the financial crisis, there was a general perception that money market funds were superior to savings
accounts. Money market funds were preserving the value of an investment while providing overnight
liquidity. At the same time, money market funds were yielding more than savings account could. Investors
expected to receive 100 cents on the dollar when they redeemed them.
The events after Lehman Brothers‘ collapse were a wake up call to investors and regulators as the musical
chairs scenario played out. The President‘s Working Group on Financial Markets (PWG), tasked to prepare
a report on fundamental changes needed to address systemic risk and reduce the susceptibility to runs on
money market funds, found that investors withdrew $310 billion from prime money market funds during
the week of September 15, 2008—when the Reserve Primary Fund broke the buck. Within two weeks of
Lehman Brother‘s collapse, $400 billion was pulled out of money markets and invested into government
securities.
Federated Investors, Inc.July 24, 2012
6
The commercial-paper market came to an abrupt stop with corporations struggling to meet their short-term
cash needs. The Federal Reserve and the US Treasury had to backstop the entire money market industry in
order to calm investors. The government promised that it would guarantee all money market funds against
losses of up to $50 billion per fund if a money market fund ‗broke the buck‘. This guarantee was kept in
place for one year, and both retail and institutional money market funds could participate in this insurance
program for a fee, which they did. Given recent history, we believe regulators could argue that money
market funds pose systemic risk.
Why would regulators care if there were only two failures since money markets were introduced? Because data suggest that it could have been more.
Of course, money market fund managers will suggest that there have been only two failures in the 40-year
history of money market funds and that implying money market funds pose systemic risk is wrong. We are
not convinced because recent data suggest that while there were only two cases of failures, the rate could
have been much higher if it were not for the fund managers stepping in or the government providing
guarantees.
Moody‘s estimated that at least 36 of the 100 largest US prime money market funds had to receive funding
from their parents to survive after Lehman Brothers collapse. According to Moody‘s, at least 20 firms that
manage money market funds in Europe and the US had to contribute more than $12 billion into their funds
so that these would not ‗break the buck‘. This was done either as direct capital contribution or by buying
troubled securities from the funds. Moody‘s estimated that from 1980 to 2010, about 200 funds had to rely
on their parents‘ aid in order not to ‗break the buck‘.
A recent SEC study, completed in June 2012, concluded that money market mutual funds have been
rescued from financial trouble by their parent company more than 300 times over the past 40 years and
raising Moody‘s estimates by another 100 funds. This was accomplished by the funds‘ parent company
buying troubled debt out of the fund or by getting support from a bank, according to the SEC.
We believe that regulators will disagree with the money market fund industry on this topic and argue that a
run on money market funds could happen again as it is not such a rare incident.
But have not existing rules been strengthened already? Why is there the need for additional rules? Because regulators will argue that these amendments have not addressed the main issue, namely product design flaw.
Sure, in response to the events of 2008 and 2009, the SEC made amendments to Rules 2a-7 and 17a-9 in
February 2010. Rule 2a-7 of the SEC‘s Investment Company Act of 1940 regulates the quality, maturity,
and diversity of investments while Rule 17a-9 deals with purchases of assets from a money market fund by
an affiliate or parent. A series of rules was adopted to make money markets less susceptible to a run, such
as tightened credit quality standards, shortened maturities of funds investments, and enhanced liquidity.
Federated Investors, Inc.July 24, 2012
7
Exhibit 5: Rule 2a-7 Amendments
Focus Enhancements
Credit Quality Reduced exposure limit for second-tier securities. *
Funds not permitted to acquire second-tier securities with remaining maturities of over 45 days.
Diversification More restrictive single-issuer limits.
More restrictive collateral requirements for repurchase agreements qualifying for ‘look through’ treatment.
Liquidity Reduced exposure limit for illiquid securities. **
At least 10% of total assets in Daily Liquid Assets *** (not applicable to tax-exempt funds).
At least 30% of total assets Weekly Liquid Assets. ****
Maturity Reduced Weighted Average Maturity (WAM) limit.
Weighted Average Life (WAL) calculated without reference to any provision that would permit a fund to shorten the maturity of an adjustable-rate security by reference to its interest rate reset dates.
Portfolio Stress Testing
Performance of stress testing (simulated shocks such as interest rate changes, higher redemptions, and changes in credit quality of the fund) as required by new policies and procedures adopted by the fund board.
Transparency Monthly disclosure of all portfolio holdings on the fund’s website.
Monthly filings of portfolio and additional information (‘shadow’ NAV) with SEC.
Additional Board Power
Fund board permitted to suspend redemptions and postpone payment of redemption proceeds if a fund will ‘break the buck’ and if the fund will irrevocably liquidate.
* A second-tier security is defined as a security rated in the second-highest short-term rating category by rating agencies. ** An illiquid security is defined as one that cannot be sold or disposed of within seven days at approximately the value ascribed to it by the fund. *** Daily liquid assets include cash, US Treasury securities, and securities readily convertible to cash within one business day. **** Weekly liquid assets include daily liquid assets (convertible to cash within five business days rather than one) as well as US government agency discount notes with remaining maturities of 60 days or less.
Source: BlackRock
While the money market fund industry argues that these amendments made in 2010 are sufficient to reduce
the risk of a run on money markets, Ms. Schapiro disagrees. She points out that further steps need to be
taken in order to prevent occurrences such as the one witnessed in 2008. Ms. Schapiro believes that more is
needed as current amendments have not addressed the main issue—namely structural flaws in product
design.
These are Ms. Schapiro‘s three suggestions to fix the product design problem:
1) Floating Net Asset Values: This proposal would eliminate the ‗stable NAV‘ rule, which allows funds
to carry investments at book value. Money market funds argue that they hold the securities until
maturity, and mark-to-market would create unnecessary noise. The current rule allows money market
fund shares to trade at $1, unless investment losses result in a decline of more than $0.005 in NAV.
Under the new proposal, NAV would be calculated using actual market values of assets held by the
fund; thus, the NAV would fluctuate.
2) Creation of a capital buffer to absorb fund losses to sustain a stable NAV: A small amount from
portfolio income would be set aside as a cushion. Regulators would establish this ‗fee‘ (three to five
basis points), which could be suspended once a predetermined minimum capital requirement has been
met. Shareholders would have rights to this cushion, which essentially results in higher NAV for funds.
3) Introduction of deterrents to redemptions: When an investor redeems money market fund shares, a
specified portion of the proceeds would remain in the fund and absorb first losses over the next 30
days. The hold-back provision has been very controversial within the money market industry. As a
result, and Ms. Schapiro proposed a fee that would be imposed on customers who take out their money
during a liquidity crisis instead of holding back assets.
Federated Investors, Inc.July 24, 2012
8
With so much opposition, why do we think new rules could be introduced? Because Ms. Schapiro has influential supporters.
To be sure, recent news flow would suggest that Ms. Schapiro‘s proposals would not succeed because a
large number of industry experts, trade groups, and, increasingly, politicians is arguing that a ‗run on the
bank‘ scenario would be more likely with the new proposals. For instance, Bloomberg published an article
on June 21, 2012, saying that the SEC faced ―skeptical lawmakers from both parties,‖ as Ms. Schapiro
defended her campaign to overhaul the regulation of money market funds the day that she appeared before
the Senate Banking Committee.
We would not write-off the possibility of Ms. Schapiro‘s ideas becoming new rules because she seems to
have influential supporters. Treasury Secretary Timothy Geithner and Federal Reserve Chairman Ben
Bernanke share her view that a future run on money market funds is a real threat. This could damage the
economy if it were to happen.
Likewise, former Treasury Secretary Henry Paulson, who served under President Bush from 2006 to 2009,
offered Ms. Schapiro the use of excerpts from his 2010 book titled On the Brink, if it helps push through
her proposals. The book provides Mr. Paulson‘s perspective on the financial crisis. He recounts that billions
in money market fund redemption requests were made by investors from solid institutions, such as Bank of
New York Mellon, BlackRock and Northern Trust.
Several Federal Reserve officials continue to raise the issue of a possible run on money market funds in
public forums, saying that money market funds remain vulnerable during a crisis despite steps to bolster the
industry in 2010. The Federal Reserve Bank of Richmond President, Jeffrey Lacker, said at a Bloomberg
event that the system is broken and that the money market fund product design ―provides an artificial
incentive to run fast for the exits if a fund gets in trouble.‖ Federal Reserve Board Governor, Daniel
Tarullo, expressed his support for Ms. Schapiro in a speech given in May 2012. He said that ―the
combination of fixed NAV, the lack of loss absorption capacity, and the demonstrated propensity for
institutional investors to run together make clear that Chairman Schapiro is right to call for additional
measures.‖
The fear is real, in our view. Current ICI data suggest that the size of the industry is about $2.6 trillion as of
May 2012. Concerns that money market funds could damage the economy if there were a run on money
market funds in the future are defensible, in our view. Some academics even suggest that this product
should not exist at all.
Money market funds provide the same degree of liquidity as cash in a saving account, yet money market
funds yield returns above what one could earn by depositing cash at a bank. We could see why these funds
ignore the relationship between risk and return. After all, money market fund assets were artificially
boosted through Regulation Q when saving accounts in the late 1970s and early 1980s were forbidden from
offering an interest rate above 5.25%. Money market funds successfully competed against banks for
deposits, since they were not ruled by Regulation Q and could offer double-digit yields. Exhibit 6 makes it
clear why money market funds were able to accumulate assets and to compete against savings accounts: It
is hard to attract assets for banks if the inflation rate is significantly in excess of inflation.
Exhibit 6: US Inflation Rate
-2.0%
0.0%
2.0%
4.0%
6.0%
8.0%
10.0%
12.0%
14.0%
16.0%
1970
1973
1976
1979
1982
1985
1988
1991
1994
1997
2000
2003
2006
2009
2012
Source: InflationData
Federated Investors, Inc.July 24, 2012
9
Money market funds started losing share to banks after 1982, when banks were allowed to offer higher
interest rates on deposits. However, the money market fund industry reacted to increased competition by
convincing the SEC to let the industry adopt a new accounting rule that allowed it to show NAV of the
funds as a fixed NAV per share. With this, money market funds could value their investments at amortized
cost and would not have to mark the assets to market. Thus, the NAV remains around $1. Our point:
Fluctuating net asset values are not a new invention but were used before current accounting rules
changed that. Could we go back to floating NAVs? It is not inconceivable, in our opinion.
With the introduction of these accounting rules leading to fixed NAVs, investors may have had the
impression that their investments are as safe as holding cash. This proved to be a fallacy as the events of
2008 showed. Money market funds take risk, as we have seen in the case of the Reserve Prime Fund. The
erroneous belief that one will get back every dollar of investment was driven by the accounting changes of
1983.
Some question why money market funds should be treated differently from other 1940 Act funds, which
have to show their NAV at market prices. Floating NAVs would allow investors to realize that they could
lose money. Thus, having floating NAVs could eliminate the ‗run on the bank‘ risk because investors
would receive what their shares are worth when they surrender their shares. After all, a ‗run on the bank‘
risk arises when investors try to redeem their shares at $1, with investors remaining in the fund absorbing
the losses. A fixed NAV would give investors an incentive to surrender their shares when a money market
fund reports losses on investments—at an inopportune time.
And the Federal Reserve Bank might have its own reasons why a reform is needed. After all, if Ms.
Schapiro‘s proposal turns into new regulation, then banks should see an influx of deposits. Currently, while
money market funds are included in the Fed‘s M2 classification of the money supply because of the
checking privileges granted by money market funds to their investors, the Fed has limited control over
money markets. We have heard many individuals argue that making money market funds less attractive
would result in funds being reverted to savings accounts, effectively giving the Federal Reserve greater
control over the money supply. This begs the question of why the SEC would propose new regulation that
would shrink the size of the money market fund industry, which it currently controls. The verdict on this
argument is outstanding.
There are good arguments on both sides of the discussion as to why and why not Ms. Schapiro‘s proposals
should be accepted. Nonetheless, we believe that the proposed regulation, if accepted, would greatly reduce
demand for money market funds. Regulators are concerned about a potential run on money market funds.
We believe that there is systemic risk and that it is more likely than not that new regulations will be
introduced. Even if these new regulations are a less stringent than what Ms. Schapiro is proposing, we
could see potential outflows.
Our call is that if we were to assume that there would be no new regulations, then we believe that there
would be limited upside potential with the stock trading at 12x 2013E P/E. Historically, Federated‘s shares
have traded at a discount to its peers or about 15% on average over the past 10 years.
Given the risk of the industry, one would expect this discount to be larger not smaller. Potential rules could
significantly change the industry, thereby making the product offering unattractive. This could lead to
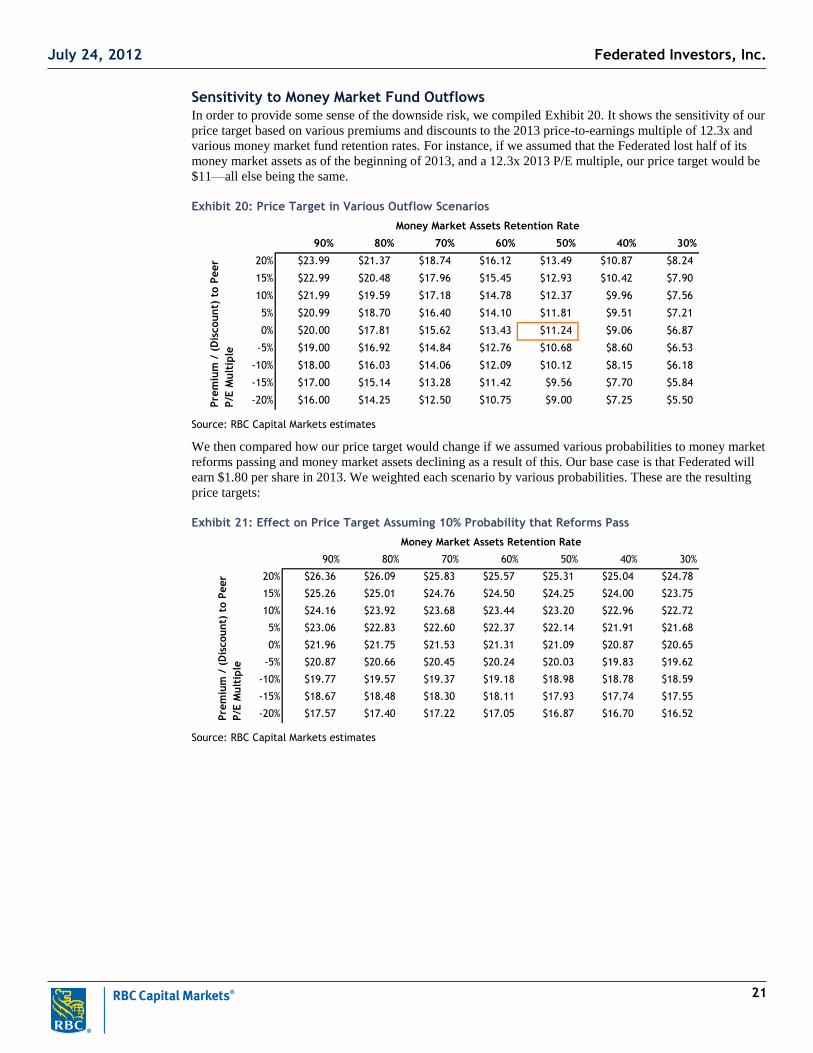
sizeable outflows. We provide a sensitivity analysis in the Valuation section that shows the effect of
outflows on our price target.
Our price target of $19 assumes no changes to the money market rules. We did not deem this necessary to
assign probabilities to various scenarios to arrive at our price target because the shares are currently trading
above our price target. This is why we initiate coverage with an Underperform and Above Average Risk
rating.
Federated Investors, Inc.July 24, 2012
10
With Shares Fully Priced, We see Potential Downside Risk
Our call is that given current valuation, we see little upside potential in owning the shares. The shares are trading at 12x 2013E P/E, which is in line with its peers. We believe the risk of potential regulatory changes could significantly transform the industry, thereby turning money market funds unattractive. This could lead to sizeable outflows, in our view. A quick analysis reveals that if rules, as suggested by Mary Schapiro, were implemented and investors, therefore, redeemed assets, Federated’s valuation could decline significantly. We provide various scenarios.
Some investors may have brushed aside the subject of potential money market reforms. This could be one
of the factors explaining the performance put forth by Federated, with its shares rising by 46% year to date.
As a comparison, the broader S&P 400 Mid Cap Asset Management and Custody Banks Index moved
‗only‘ 15% during the same period. Below, we will discuss what might have fueled the rally in Federated‘s
shares.
We believe that a sense of optimism may have been created by the media suggesting that it is very unlikely
that any new rules could be passed. Indeed, recent news, such as Call to Leave Money Market Funds Alone
Grows Louder, published by the Wall Street Journal on May 31, 2012, may have fostered this optimism.
Certainly, Ms. Schapiro does not seem to have managed to gain the support of the majority of SEC
commissioners yet. Their support is needed to pass her proposals into law. In a news release published by
Reuters on May 11, 2012, the author wrote that Democratic SEC Commissioner Luis Aguilar and
Republican SEC Commissioners Troy Paredes and Dan Gallagher issued a joint statement saying a report
critical of the money market fund industry did not reflect the views and inputs of a majority of the SEC
commissioners.
This report published by the International Organization of Securities Commissions (IOSCO) on April 27,
2012, analyzed the risk that money market funds pose to financial stability. The IOSCO report sought
comments on a number of potential regulatory options—including introducing a floating NAV, which is
part of Ms. Schapiro‘s suggested solution, as well.
Obviously, all three commissioners do not seem to have changed their opposition to Ms. Schapiro‘s
proposals. Investors‘ optimism that new rules would not be introduced was probably strengthened by the
commissioner‘s issued statement. Interestingly, the statement by the three commissioners was given on the
day the Investment Company Institute convened for its annual conference in Washington.
Then in late in May 2012, Ms. Schapiro indicated that she was open to a compromise on money market
rules, thereby giving the impression that she was willing to shy away from her agenda and find a middle
ground that would be acceptable to all—or at least, it might have been perceived as such by investors.
And more recently, the US Chamber of Commerce published a white paper that warned of the dangers of
money market fund reform in the current environment, because any new rule would ―undermine the utility
and effectiveness of money market mutual funds.‖ The concern is that issuers of commercial paper, in
which money market funds invest, could face significantly higher interest costs. The Chamber‘s view is
that new money market rules could affect corporations‘ ability to raise short-term debt and finance their
liquidity needs. The result would be the opposite of what regulators are trying to achieve, namely an
increase in systemic risk. There could potentially be a run on money market funds, as investors start
withdrawing their cash in search for alternatives to ‗unattractive‘ money market funds. This is the opposite
of what the reform intends to achieve.
Ultimately, corporations, as well as governments, could face higher financing costs. As usual, we believe
that these higher costs would most likely be borne by the end consumer. New money market rules would,
therefore, lead to higher prices and higher taxes, thereby curbing demand for goods and services at a time
when the economy is struggling to gain any meaningful momentum.
There is more. Another research report published in April 2012 by Treasury Strategies probed the level of
acceptance of new money market rules by corporate treasurers. In our view, its findings are sobering.
Money market funds would potentially suffer significant outflows if any of Ms. Schapiro‘s three proposals
were adopted. Here are the results of their survey:
If fund NAV were to float, Treasury Strategies estimates that money market fund assets held by
corporate, government, and institutional investors would see a net decrease of 61%.
Federated Investors, Inc.July 24, 2012
11
If money market funds were required to institute a 30-day holdback of 3% of all redemptions, there
could be a net decrease of 67% in money market fund assets held by corporate, government, and
institutional investors.
If a loss reserve or a capital buffer was required, 36% of respondents said they would either decrease the
use of money market funds or discontinue their use altogether. However, the other 64%, who said that
they would continue using money market funds, changed their answers when asked if they would be
willing to accept lower yields resulting from implementing a loss reserve or a capital buffer.
o About half of these respondents (53%) said they would decrease or stop using money market funds
if the loss reserve or capital buffer rule resulted in a cost of two basis points, and
o 92% would stop or decrease usage of money market funds if the costs were five basis points.
Thus, we believe that recent news and reports have raised hopes among investors that the likelihood of
enacting new rules is very low and that business will continue as usual. We think this has led to a strong
rally in Federated‘s shares.
Exhibit 7 shows the performance of Federated‘s stock over the past six months and compares the
performance versus the S&P 500 Mid Cap Asset Manager and Custody Bank Index.
Exhibit 7: Indexed Six Months Performance
80%
90%
100%
110%
120%
130%
140%
150%
160%
01/02/2012
01/16/2012
01/30/2012
02/13/2012
02/27/2012
03/12/2012
03/26/2012
04/09/2012
04/23/2012
05/07/2012
05/21/2012
06/04/2012
06/18/2012
FI I S&P Mid Cap 400 / AM & Custody Banks
Source: FactSet
Bottom line: While the broader index was up 15%, Federated‘s shares increased 46% year to date. The
shares are trading in line with its peer multiples, and we just do not see why the shares could be trading at a
premium to its peers. It has historically traded at a discount to its peers; therefore, we see limited potential
upside.
There could actually be some potential downside risk because earnings could come under pressure if new
money market rules were to be adopted. We will explain later why money market rules could be tightened.
Ms. Schapiro is preparing to set a vote by late July; after which, all commissioners have to take a public
position on money market rules. While some investors might have hoped that Ms. Schapiro was backing
away from her initiative to reform the sector, her testimony at the Senate Banking Committee hearing in
June 2012 should be a clear signal that she continues to view money market funds as a source of systemic
risk.
Federated Investors, Inc.July 24, 2012
12
Financial Analysis
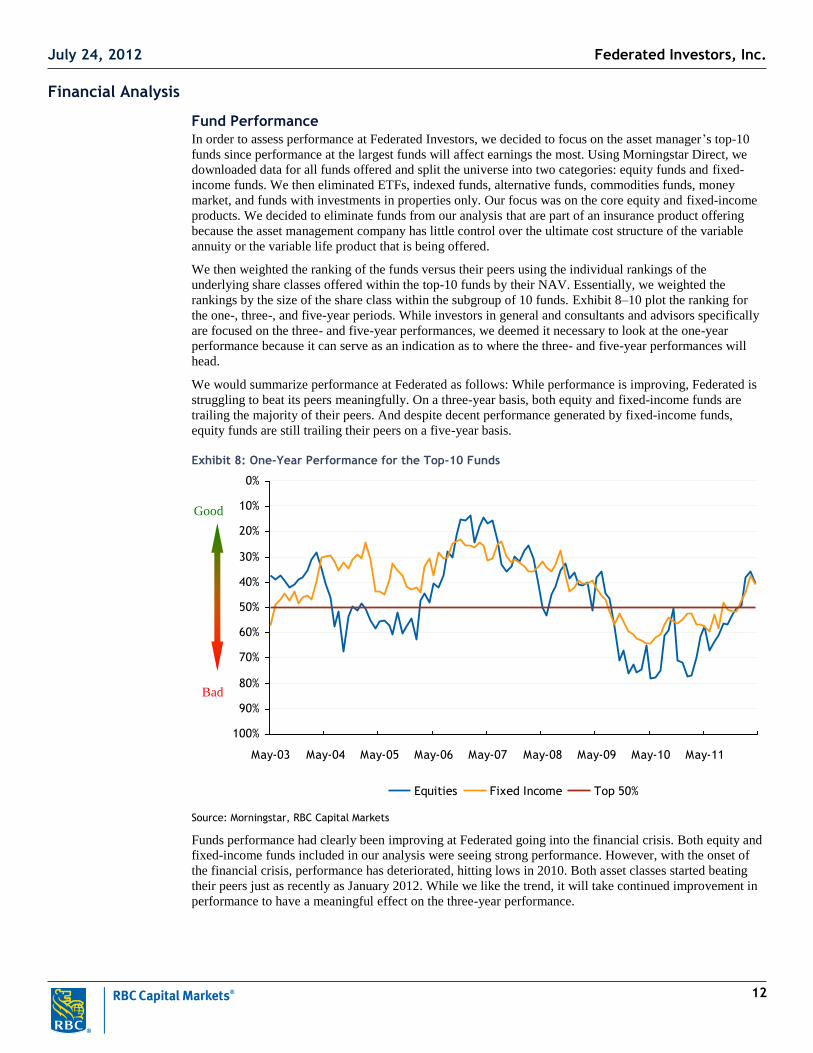
Fund Performance
In order to assess performance at Federated Investors, we decided to focus on the asset manager‘s top-10
funds since performance at the largest funds will affect earnings the most. Using Morningstar Direct, we
downloaded data for all funds offered and split the universe into two categories: equity funds and fixed-
income funds. We then eliminated ETFs, indexed funds, alternative funds, commodities funds, money
market, and funds with investments in properties only. Our focus was on the core equity and fixed-income
products. We decided to eliminate funds from our analysis that are part of an insurance product offering
because the asset management company has little control over the ultimate cost structure of the variable
annuity or the variable life product that is being offered.
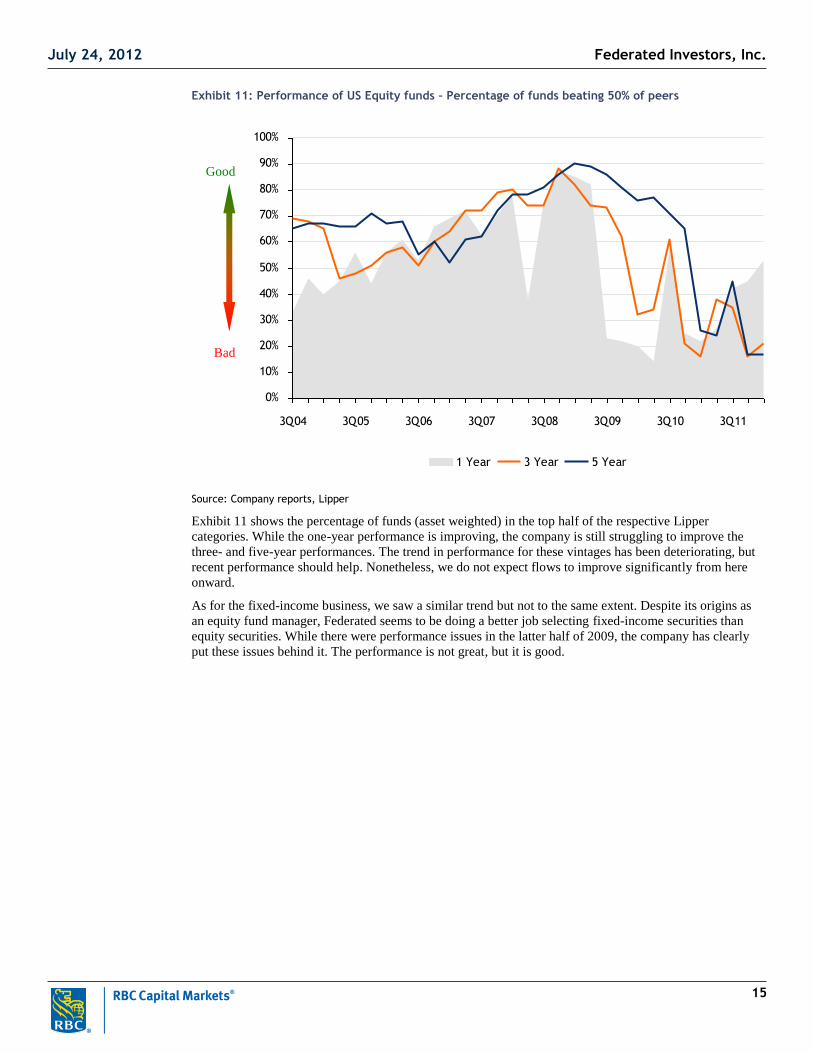
We then weighted the ranking of the funds versus their peers using the individual rankings of the
underlying share classes offered within the top-10 funds by their NAV. Essentially, we weighted the
rankings by the size of the share class within the subgroup of 10 funds. Exhibit 8–10 plot the ranking for
the one-, three-, and five-year periods. While investors in general and consultants and advisors specifically
are focused on the three- and five-year performances, we deemed it necessary to look at the one-year
performance because it can serve as an indication as to where the three- and five-year performances will
head.
We would summarize performance at Federated as follows: While performance is improving, Federated is
struggling to beat its peers meaningfully. On a three-year basis, both equity and fixed-income funds are
trailing the majority of their peers. And despite decent performance generated by fixed-income funds,
equity funds are still trailing their peers on a five-year basis.
Exhibit 8: One-Year Performance for the Top-10 Funds
Source: FactSet (Priced as of market close July 20, 2012 ET)
Federated Investors, Inc.July 24, 2012
24
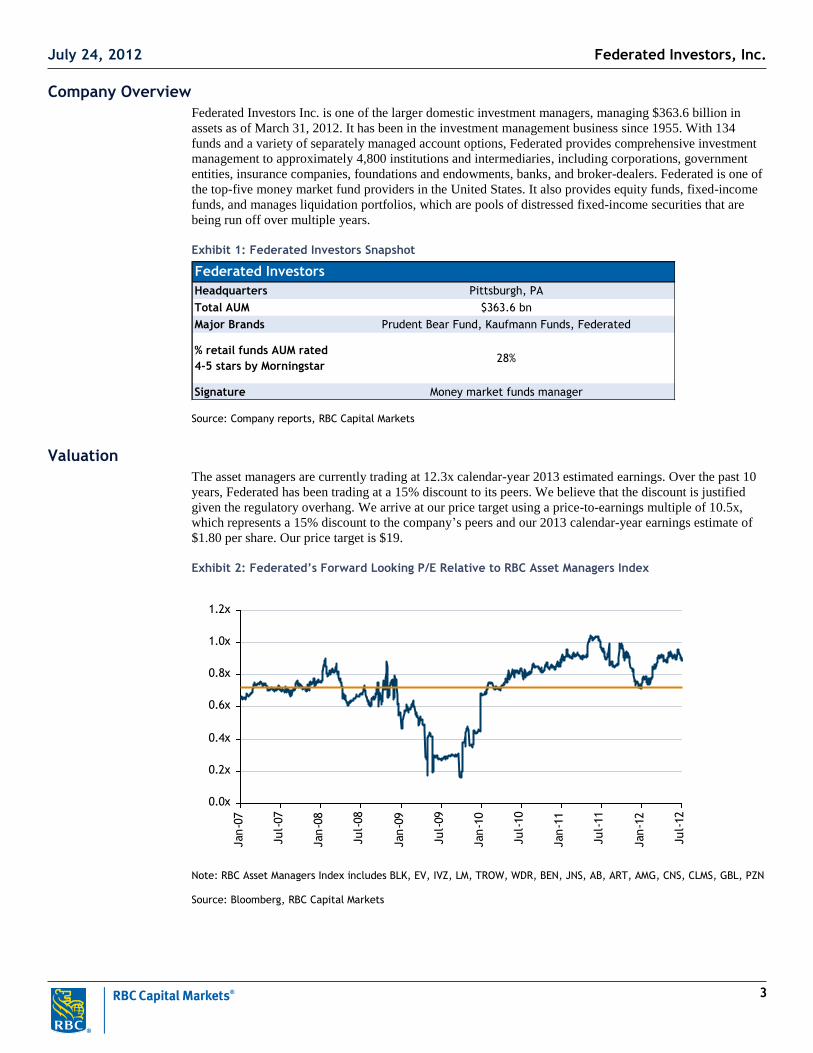
Company Description
Founded in 1955 and headquartered in Pittsburgh, Pennsylvania, Federated Investors Inc. (NYSE:FII) is a
global-investment manager. It provides investment-management products and related financial services
through its subsidiaries with US$363.6 billion of total managed assets as of March 31, 2012. Investment
offerings include domestic and international equities, fixed-income, and alternative strategies. However, the
company is best known for its money market products.
Out of the 134 Federated-sponsored funds the company provides, 48 are money market funds, 51 are fixed-
income funds, and 35 are equity funds. Federated markets these funds to banks, broker-dealers, registered
investment advisors, and other financial intermediaries. The company maintains relationships with some
4,700 client institutions. The ultimate clients include retail investors, corporations, and retirement plans. In
addition to advising and administrating Federated mutual funds and separate accounts, the company derives
its earnings from other mutual fund-related services such as distribution, shareholder servicing, and
retirement plan recordkeeping services.
All Federated-sponsored funds are domiciled in the US, except for the Federated International Funds Plc
and Federated Unit Trust, which are domiciled in Dublin, Ireland. Federated earned revenue worth $878.5
million from domestic operations and a mere $16.6 million from its foreign operations in the financial year
ended December 2011. The domestic market continues to be the main driver of Federated‘s revenues.
Exhibit 26: Revenue by Region
Revenues by Region (Dec 31, 2011)
Domestic
98%
Foreign
2%
Source: Company reports
Federated Investors, Inc.July 24, 2012
25
Milestones
Federated Investors has gone public twice since its founding in 1955. The company issued its shares to the
public for the first time, after just four years of operation, in 1959. In 1982, Federated was sold to Aetna
Life & Casualty Co. In 1989, management repurchased 75% of the firm and the remainder of the company
in 1996. The company came out with an IPO in 1998 and emerged as a publicly traded company on the
New York Stock Exchange once again. Federated‘s growth has been helped by some notable acquisitions
in recent years. In 2001, Federated acquired the US$3.2 billion Kaufmann Fund; in 2005, Federated
acquired US$19.3 billion in cash management assets from Alliance Capital Management LP; in 2010,
Federated acquired more than US$15 billion in money market assets through transactions with SunTrust
Banks Inc. and Hilliard-Lyons. The table below summarizes the company‘s history.
Date Milestone
1955 John F. Donahue and Richard B. Fisher founded Federated Investors with the assistance of legal counsel Thomas J. Donnelly.
1956 Federated bought the Income Foundation Fund, entering the investment management business. This fund was the first to be registered under the Investment Company Act of 1940.
1959 Federated went public at $4.75 a share.
1964 Federated shifted to selling funds exclusively through brokers and institutions.
1974 Federated started promoting its first money market mutual fund, the Money Market Management fund (EAG).
1976 The company created industry’s first institutional-only money market fund and one of the first municipal bond funds.
1982 Federated sold to Aetna Life & Casualty Company. The company developed Multi Trust Systems to help institutions streamline investing for trust clients.
1989 Federated management bought out Aetna for $345 million, establishing majority control in the company.
1991 The company established Federated International Management Limited, a wholly owned subsidiary in Dublin, Ireland. Federated became the first US company to be approved to sell money market funds to European clients.
1993 Federated formed an institutional sales force to distribute its products to corporations, government entities, insurance companies, and other investment advisors.
1995 The company expanded international and global-investment research capabilities with an office in New York City.
1998 Federated went public, emerging as a publicly traded company on the New York Stock Exchange.
2001 The firm bought Edgemont Asset Management, the advisor of the Kaufmann Fund.
2003 Federated’s stock was added to the S&P 500 Index.
2005 The company completed the acquisition of $19.3 billion in cash management assets from Alliance Capital Management LP.
2006 Federated added $6.7 billion to its AuM by acquiring MDT Advisers, a quantitative equity manager.
2007 The company added $366 million in mutual fund assets through the acquisition of assets related to the management of the Rochdale Atlas Portfolio.
2008 Federated added two value mutual funds and two alternative funds to its offering through the acquisition of Prudent Bear Funds and assets related to Clover Capital Management.
2010 The firm added $15 billion to its money market assets through the transactions with SunTrust Bank and Hilliard-Lyons.
2012 Federated announced the acquisition of certain money market assets owned by Fifth Third Asset Management. This is expected to add about $5 billion in money market AuM.
Sources: Company reports
Federated Investors, Inc.July 24, 2012
26
Strategy
Despite its origin as an equity fund, Federated has always been a strong fixed-income manager. While
others wrestled during the financial crisis with bond prices that fell sharply in value—the more extreme
examples included bonds of Lehman and Fannie Mae—Federated says it had hardly any major credit issues
during the crisis. It says there were no allegations leveled against it that Federated‘s fixed-income portfolio
managers were departing from the mandates in their prospectuses. To this day, while Federated has some
well known equity funds, including the Kaufmann Funds and the Prudent Bear fund, it is our sense that the
company is best known for its bond funds, including Federated Total Return Bond fund and Federated
Muni Ultra-short fund.
If Federated has been a leader in fixed-income investing, it is a reflection of the company‘s culture and
history. Centered in Pittsburgh, with hardly any fixed-income professionals working outside that city, the
fixed-income business at Federated traces its roots to the 1970s, when the company was one of the first to
offer money funds to institutions. As a result of this heritage, the professionals working in fixed income at
Federated are very tenured. The typical analyst or portfolio manager has 16 years of total work experience,
14 of which have been spent at Federated. It is usual to find individuals at Federated who have been
working in the investments area at the firm for 20 years or longer. Over the years, Federated has been
successful in recruiting recent MBA graduates from two local universities, which happen to have highly
rated MBA programs: Carnegie Mellon and the University of Pittsburgh.
At the heart of Federated‘s culture is the idea of doing intense fundamental analysis on the companies in
whose bonds Federated invests. This is an outgrowth of the company‘s huge money-fund business. From
the start of that business, Federated has had an ethos around not losing money—always important but
especially important given the customer base that Federated has catered to over the years, led by highly
conservative and risk-averse bank trust departments. Determined not to be blindsided by a default of a bond
that had been rated highly by one of the rating agencies, Federated has become well known in fixed-income
circles for its own internal rating system. As part of that system, bonds receive their own Federated rating
of 1 to 5, with 1 being the weakest and 5 the strongest.
This same culture of conservativeness has been extended to Federated‘s equity department. While the
firm‘s equity staff is measured against various benchmarks, the client base that these stock investors cater
to is largely the same as Federated‘s fixed-income investors‘ clients: bank trust departments. While equity
managers at Federated are expected to exceed their benchmark, there is, according to a Federated official,
no ‗shoot out the lights‘ mission. In contrast, e.g., to Fidelity or Putnam, which some would say works on a
star system with extensively media-exposed portfolio managers, Federated does not permit its portfolio
managers to have their photos in the press. It talks about having a team orientation and of having literally
no stars in its galaxy of portfolio managers. That is largely but not entirely true. Back in 2001, Federated
acquired The Kaufmann Funds, a New York-based organization that, despite recent performance
difficulties, is still one of the better known growth managers in America. In 2008, Federated acquired The
Prudent Bear Fund, a fund whose manager, Doug Nolan, is considered by many to be one of the better
known managers of ‗short‘ funds in the country.
Finally, we would say that Federated, like so many of the other fund managers on whom we are beginning
coverage, describes its strategy as being centered on diversification. To paraphrase one senior Federated
executive, Federated does not want to be in a position of selling flavor A while the only thing that is
working in the market is flavor B. The result has been a slow but steady broadening of Federated‘s product
line up, so today, while the company is still heavily dependent on money funds, Federated is generating the
majority of its net revenues from equity and fixed-income investing.
Federated Investors, Inc.July 24, 2012
27
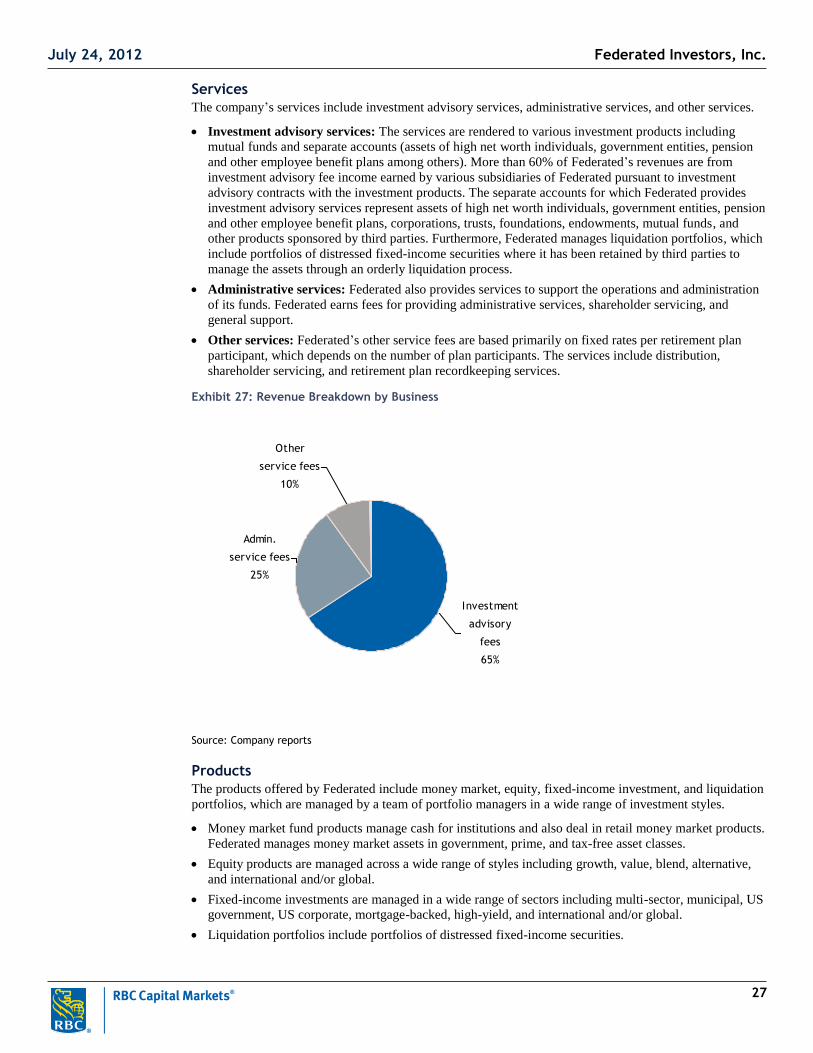
Services
The company‘s services include investment advisory services, administrative services, and other services.
Investment advisory services: The services are rendered to various investment products including
mutual funds and separate accounts (assets of high net worth individuals, government entities, pension
and other employee benefit plans among others). More than 60% of Federated‘s revenues are from
investment advisory fee income earned by various subsidiaries of Federated pursuant to investment
advisory contracts with the investment products. The separate accounts for which Federated provides
investment advisory services represent assets of high net worth individuals, government entities, pension
and other employee benefit plans, corporations, trusts, foundations, endowments, mutual funds, and
other products sponsored by third parties. Furthermore, Federated manages liquidation portfolios, which
include portfolios of distressed fixed-income securities where it has been retained by third parties to
manage the assets through an orderly liquidation process.
Administrative services: Federated also provides services to support the operations and administration
of its funds. Federated earns fees for providing administrative services, shareholder servicing, and
general support.
Other services: Federated‘s other service fees are based primarily on fixed rates per retirement plan
participant, which depends on the number of plan participants. The services include distribution,
shareholder servicing, and retirement plan recordkeeping services.
Exhibit 27: Revenue Breakdown by Business
Other
service fees
10%
Admin.
service fees
25%
Investment
advisory
fees
65%
Source: Company reports
Products
The products offered by Federated include money market, equity, fixed-income investment, and liquidation
portfolios, which are managed by a team of portfolio managers in a wide range of investment styles.
Money market fund products manage cash for institutions and also deal in retail money market products.
Federated manages money market assets in government, prime, and tax-free asset classes.
Equity products are managed across a wide range of styles including growth, value, blend, alternative,
and international and/or global.
Fixed-income investments are managed in a wide range of sectors including multi-sector, municipal, US
government, US corporate, mortgage-backed, high-yield, and international and/or global.
Liquidation portfolios include portfolios of distressed fixed-income securities.
Federated Investors, Inc.July 24, 2012
28
Exhibit 28:Federated’s Offering by Product Type and Class
Source: 2011 Company 10-K filing
Federated‘s products are primarily distributed in three markets: Wealth management and trust (51% of
AuM), broker-dealer (30% of AuM), and global institutional (17% of AuM).
Wealth Management and Trust: The company uses a dedicated sales force to meet the demands of this
market. Federated serves the needs of bank trust departments, institutional cash management, treasury
professionals, and financial professionals with a range of products including money market, equity and
fixed-income funds, and separate accounts. The majority of the assets are invested in money market funds.
Money markets are a popular vehicle for maintaining a portion of the portfolio in cash and cash equivalent
products.
Broker-Dealers: The company distributes its products through a group of 1,500 national, regional,
independent broker-dealers, and bank broker-dealers. Broker-dealers use Federated‘s products to address
their retail clients‘ investment needs.
Global Institutional: Through a dedicated sales force, Federated provides its products to corporations,
corporate and public pension funds, government entities, foundations, endowments, hospitals, and non-
Federated investment companies. Federated‘s international operations are included in this market.
Exhibit 29: AuM Breakdown by Business
Wealth Mgmt & Trust AuM (Dec 31, 2011)
Equities
4%
Fixed-
income
8%Money
markets
88%
Broker/Dealers AuM (Dec 31, 2011)
Money
markets
68%
Fixed-
income
16%
Equities
16%
Global Institutional AuM (Dec 31, 2011)
Equities
15%
Fixed-
income
19%Money
markets
66%
Source: Company reports
Federated Investors, Inc.July 24, 2012
29
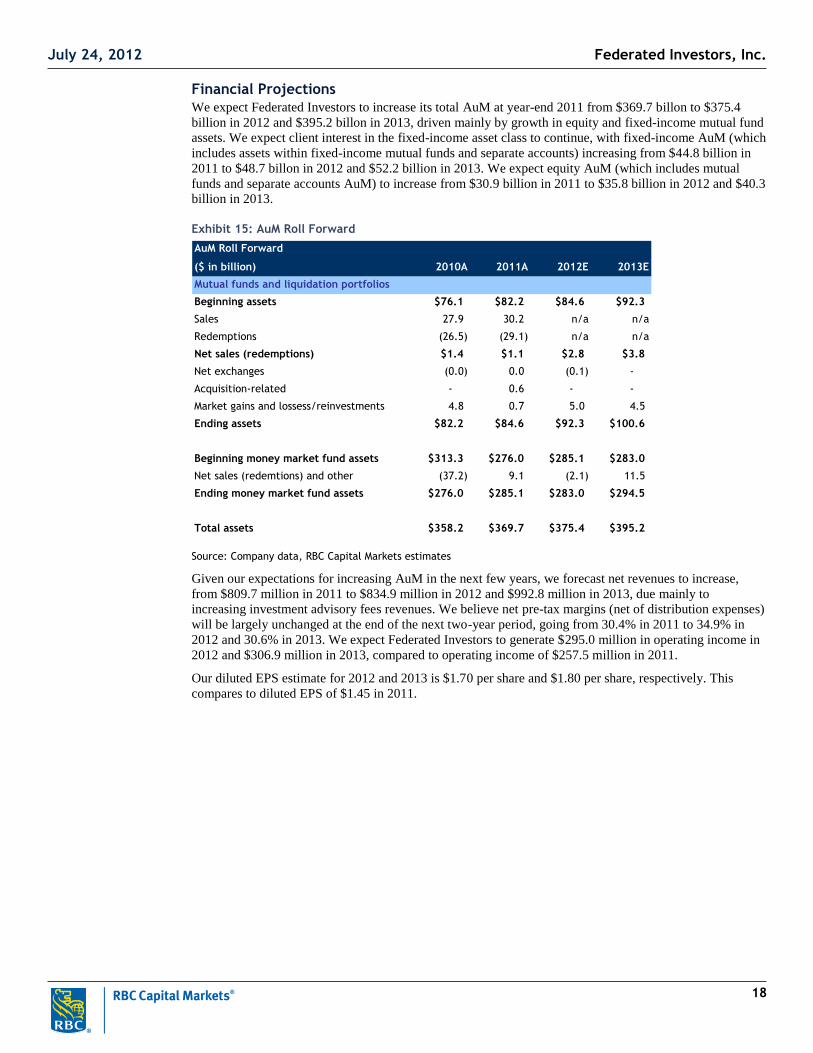
Asset under Management (AuM)
As of December 31, 2011, Federated had total AuM of US$369.7 billion. The vast majority of assets, about
85% of total assets, were allocated to mutual funds. Approximately 13% were held in separate accounts,
and 2% of assets were in liquidation portfolios. Exhibit 30 provides a breakdown of assets by asset class,
with money market funds comprising the vast majority of AuM.
Exhibit 30: AuM Breakdown by Asset Class
Equities
8%
Cash
78%
Alternatives /
Other
2%
Fixed Income
12%
Note: Money market assets classified as Cash. Alternatives/Other includes liquidation portfolios. Source: Company reports, RBC Capital Markets
Exhibit 31: Breakdown of AuM by Investor Type
Institutional
17%
Retail / HNW
83%
Note: Retail/HNW category includes assets sourced from the following distribution channels: wealth management and trusts, and broker-dealers. Source: Company reports, RBC Capital Markets
Federated Investors, Inc.July 24, 2012
30
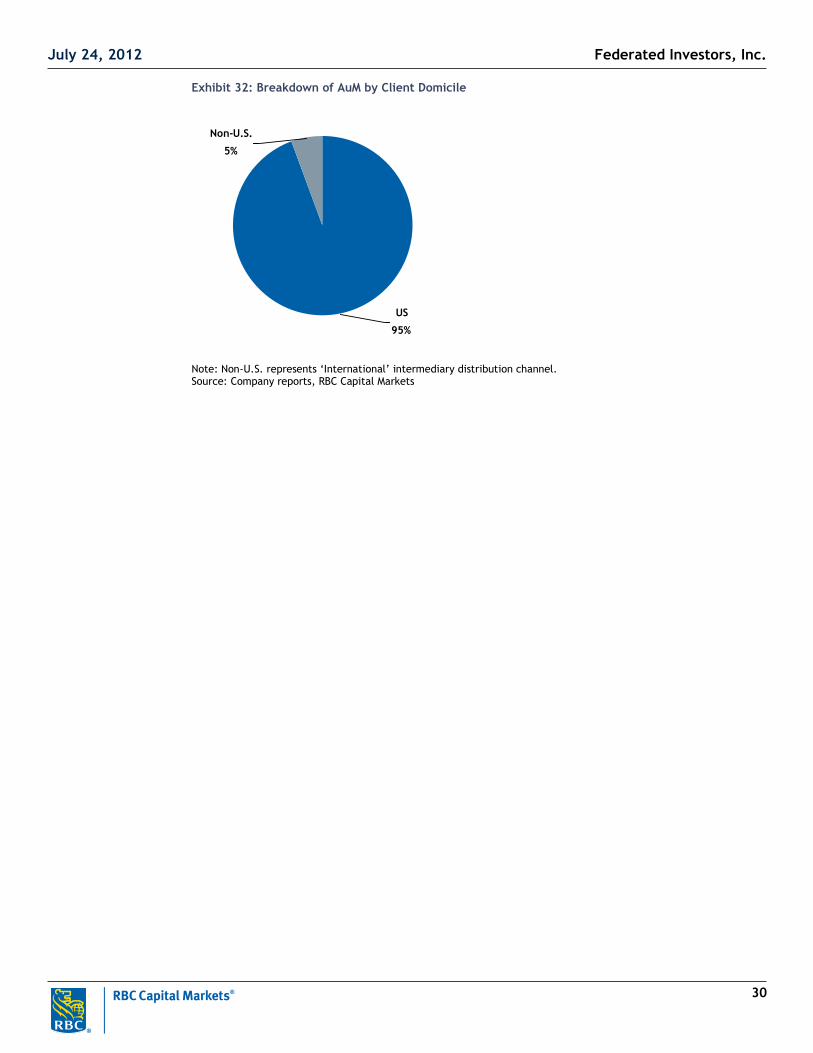
Exhibit 32: Breakdown of AuM by Client Domicile
Non-U.S.
5%
US
95%
Note: Non-U.S. represents ‘International’ intermediary distribution channel. Source: Company reports, RBC Capital Markets
Federated Investors, Inc.July 24, 2012
31
Management Team
The table below summarizes the management team‘s experience.
Name Title Background
John F. Donahue Chairman and Director Mr. Donahue is a co-founder of Federated. He has served as director and chairman of Federated since Federated’s initial public offering in May 1998. He is a director or trustee of 40 investment companies managed by subsidiaries of Federated. Mr. Donahue is the father of J. Christopher Donahue, who serves as president, chief executive officer, and director of Federated, and Thomas R. Donahue, who serves as vice president, treasurer, and chief financial officer of Federated.
J. Christopher Donahue President, Chief Executive Officer & Director
Mr. Christopher Donahue has served as director, president and chief executive officer of Federated since 1998. He is president of 40 investment companies managed by subsidiaries of Federated. He is also director or trustee of 43 investment companies managed by subsidiaries of Federated.
Thomas R. Donahue VP, Treasurer, CFO and President, FII Holdings Inc.
Mr. Thomas Donahue has served as vice president, treasurer, and chief financial officer of Federated since 1998. He is president of FII Holdings, Inc., a wholly owned subsidiary of Federated.
Gordon J. Ceresino Vice Chairman & President, Federated International Management Limited
Mr. Ceresino has served as vice chairman of Federated since 2007. He is president of Federated International Management Limited and vice chairman of Federated MDTA LLC, both of which are wholly owned subsidiaries of Federated.
John B. Fisher VP & CEO, Federated Advisory Companies
Mr. Fisher has served as vice president of Federated since 1998. He has also been president and chief executive officer of Federated Advisory Companies since 2006 and serves as a board member for each of those wholly owned subsidiaries. Prior to that, he served as president of the Institutional Sales Division of Federated Securities Corp., a wholly owned subsidiary of Federated.
Eugene F. Maloney Executive VP Federated Investors, Inc. & Executive VP Federated Investors Management Company
Mr. Maloney has served as executive vice president of Federated since March 2009. Prior to that time, he served as vice president of Federated since 1998. He is also executive vice president of Federated Investors Management Company, a wholly owned subsidiary of Federated. Mr. Maloney provides certain legal, technical and management expertise to Federated’s sales divisions, including regulatory and legal requirements relating to a bank’s use of mutual funds in both trust and commercial environments.
Thomas E. Territ VP & President, Federated Securities Corp.
Mr. Territ has served as vice president of Federated since 2006. He is president of Federated Securities Corp., a wholly owned subsidiary of Federated. As president of Federated Securities Corp., Mr. Territ is responsible for the marketing and sales efforts of Federated. Mr. Territ had previously served as senior vice president of Federated Securities Corp. since 1995, and held the position of National Sales director for several of Federated’s sales divisions during that time.
Source: Company reports
Federated Investors, Inc.July 24, 2012
32
Investment Risks and Price Target Impediments
Regulatory changes could result in significant reduction in money market AuM
A large portion of Federated‘s total revenues are attributable to money market assets. About 46% of
Federated‘s 2011 total revenues were attributable to money market assets, compared to 50% in 2010 and
65% in 2009. Any new money market regulation or amendments to Rule 2a-7 could lead to outflows
because it could reduce the attractiveness of money market funds and ultimately affect Federated‘s
earnings. We have not modeled out large declines in AuM because it is difficult to project the final
outcome of various proposals. Other new proposals could increase operating expenses, thereby leading to
lower earnings. Our price target would have to be revised downward if money market AuM were to
decrease based on new rules or if compliance expenses should increase dramatically. On the other hand, we
would likely raise our price target if new money market regulation were to be rejected and the funds were
allowed to continue business as usual.
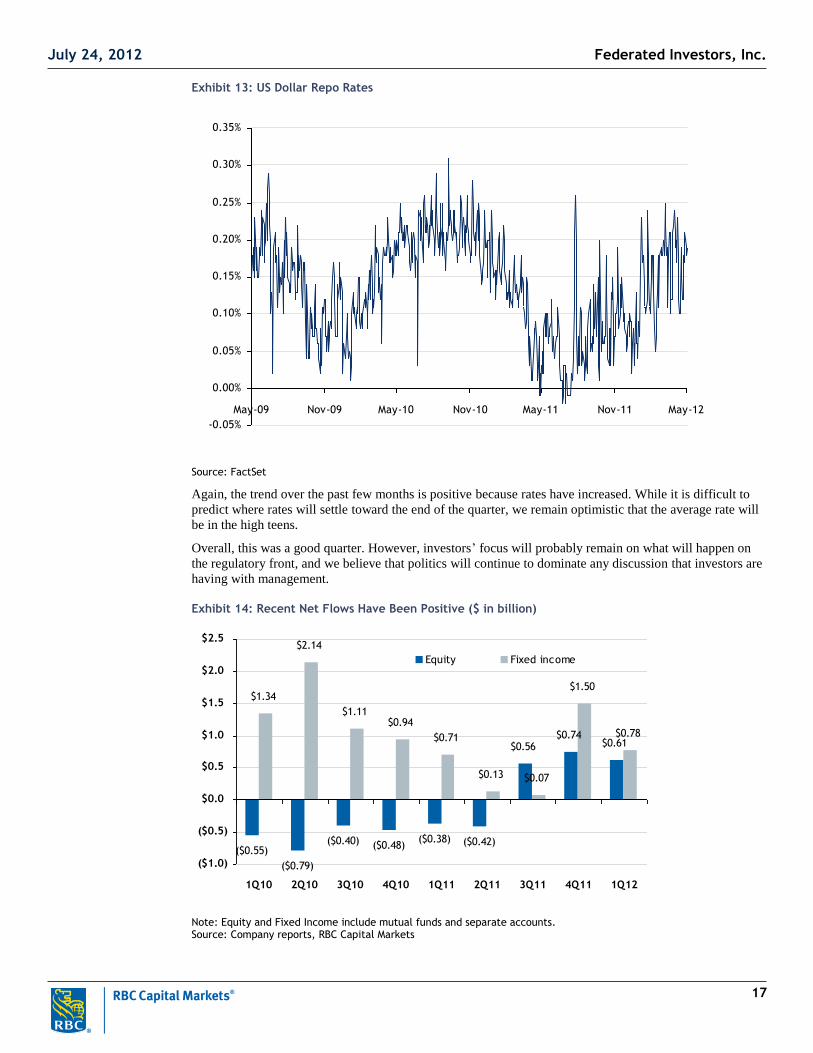
Prolonged period of low interest rates could affect earnings growth
Money market yields, especially for the treasury and government agency money market funds, are affected
by the federal funds target rate. The Federal Reserve cut rates in December 2008 close to zero to stimulate
the economy. This affected Federated‘s ability to maintain positive yields for investors, because fund
expenses are deducted from returns on short-term investments. In order to maintain zero or positive net
yields, Federated voluntarily waived certain fees or assumed expenses. We model a reduction of the effect
of the fee waiver on revenues. Should the federal funds rate or other short-term interest rates such as repo
rates remain low throughout 2013, we would likely have to lower our earnings estimates, which would
have a negative effect on the price target.
Outflows could increase in a rising rate environment affecting earnings growth
In an economic environment of rising interest rates, Federated could experience significant outflows
because investors could chose to invest directly in the assets underlying money market funds. Outflows
could occur as investors shift their investments to direct investments in search of higher yields than those
offered by money market funds. We would likely have to lower our earnings estimates, which would
negatively affect our price target if interest rates increased quickly.
Decline in asset values could affect Federated’s earnings
Growth of AuM is driven by inflows and market performance. A decline in asset values would result in
lower AuM, potentially offsetting any new money into the various funds. The value of investments can be
driven by macro economic events over which the company has no control. As short-term interest rates
increase, security values could decline. A reduction in asset levels could lead to lower earnings as
management fees would be applied to lower AuM. Our price target would likely have to be revised
downward if AuM were to decrease.
A reduction in risk appetite could lead to lower earnings
A potential adverse effect of a decline in financial markets or further deterioration of the economy could be
an increase in risk aversion. A political, economic or business crisis could lead to an increase in
redemptions and lower AuM. An increase in redemption requests by investors could lead to liquidity
problems as money market funds start disposing their assets, further magnifying the effect of the crisis.
This could lead to Federated not being able to maintain a stable $1.00 NAV. We do not model a scenario
like this because it is difficult to determine extreme events. As such, we would have to revise our earnings
forecast and reduce our price target if such an event were to occur.
Weak fund performance could lead to outflows and lower earnings
Federated‘s ability to attract assets and grow earnings is dependent on the performance it generates. Weak
performance, especially in its equity fund offerings, could increase redemptions and lower inflows of new
money. This could negatively affect our revenue and earnings forecast as higher investment advisory fees
are earned with equity products. Our price target would have to be revised downward if performance
deteriorated.
Federated Investors, Inc.July 24, 2012
33
Competition could pressure margins
The asset management business is very competitive. Federated competes in the management and
distribution of mutual funds, and separate accounts with other fund management companies, national and
regional broker-dealers, commercial banks, and other financial institutions. A number of these competitors
has greater financial, technical, marketing, and other resources than Federated. A large portion of assets
managed by Federated is held by institutional investors. Most institutional investment products are sold
without a sales commission, which makes it costly to the clients to switch asset managers. Were
competition to intensify, we would need to reduce our earnings assumption. Margins could decline as
economies of scale might not be realized to the same degree with cash flowing out of Federated‘s funds.
This could negatively affect our price target.
Federated Investors, Inc.July 24, 2012
34
Source: Financial Supplements; RBC Capital Markets Estimate
Pre-tax margins - net of distribution expenses 33.7% 35.0% 34.9% 35.9% 32.2% 31.4% 29.8% 29.3% 30.4% 34.9% 30.6%
After-tax margins - net of distribution expenses 21.4% 22.1% 22.0% 22.6% 20.3% 19.8% 18.8% 18.5% 19.2% 22.0% 19.3%
2012 2013
2013E2012E
Federated Investors, Inc.July 24, 2012
35
Required Disclosures
Conflicts Disclosures
The analyst(s) responsible for preparing this research report received compensation that is based upon various factors, including totalrevenues of the member companies of RBC Capital Markets and its affiliates, a portion of which are or have been generated byinvestment banking activities of the member companies of RBC Capital Markets and its affiliates.
RBC Capital Markets, LLC makes a market in the securities of Federated Investors, Inc. and may act as principal with regard to salesor purchases of this security.
A member company of RBC Capital Markets or one of its affiliates received compensation for products or services other thaninvestment banking services from Federated Investors, Inc. during the past 12 months. During this time, a member company of RBCCapital Markets or one of its affiliates provided non-investment banking securities-related services to Federated Investors, Inc..
A member company of RBC Capital Markets or one of its affiliates received compensation for products or services other thaninvestment banking services from Federated Investors, Inc. during the past 12 months. During this time, a member company of RBCCapital Markets or one of its affiliates provided non-securities services to Federated Investors, Inc..
RBC Capital Markets has provided Federated Investors, Inc. with non-investment banking securities-related services in the past 12months.
RBC Capital Markets has provided Federated Investors, Inc. with non-securities services in the past 12 months.
The author is employed by RBC Capital Markets, LLC, a securities broker-dealer with principal offices located in New York, USA.
Explanation of RBC Capital Markets Equity Rating System
An analyst's 'sector' is the universe of companies for which the analyst provides research coverage. Accordingly, the rating assigned toa particular stock represents solely the analyst's view of how that stock will perform over the next 12 months relative to the analyst'ssector average.RatingsTop Pick (TP): Represents analyst's best idea in the sector; expected to provide significant absolute total return over 12 months with afavorable risk-reward ratio.Outperform (O): Expected to materially outperform sector average over 12 months.Sector Perform (SP): Returns expected to be in line with sector average over 12 months.Underperform (U): Returns expected to be materially below sector average over 12 months.Risk Qualifiers (any of the following criteria may be present):Average Risk (Avg): Volatility and risk expected to be comparable to sector; average revenue and earnings predictability; nosignificant cash flow/financing concerns over coming 12-24 months; fairly liquid.Above Average Risk (AA): Volatility and risk expected to be above sector; below average revenue and earnings predictability; maynot be suitable for a significant class of individual equity investors; may have negative cash flow; low market cap or float.Speculative (Spec): Risk consistent with venture capital; low public float; potential balance sheet concerns; risk of being delisted.
Distribution of Ratings
For the purpose of ratings distributions, regulatory rules require member firms to assign ratings to one of three rating categories - Buy,Hold/Neutral, or Sell - regardless of a firm's own rating categories. Although RBC Capital Markets' ratings of Top Pick/Outperform,Sector Perform and Underperform most closely correspond to Buy, Hold/Neutral and Sell, respectively, the meanings are not the samebecause our ratings are determined on a relative basis (as described above).
Distribution of RatingsRBC Capital Markets, Equity Research
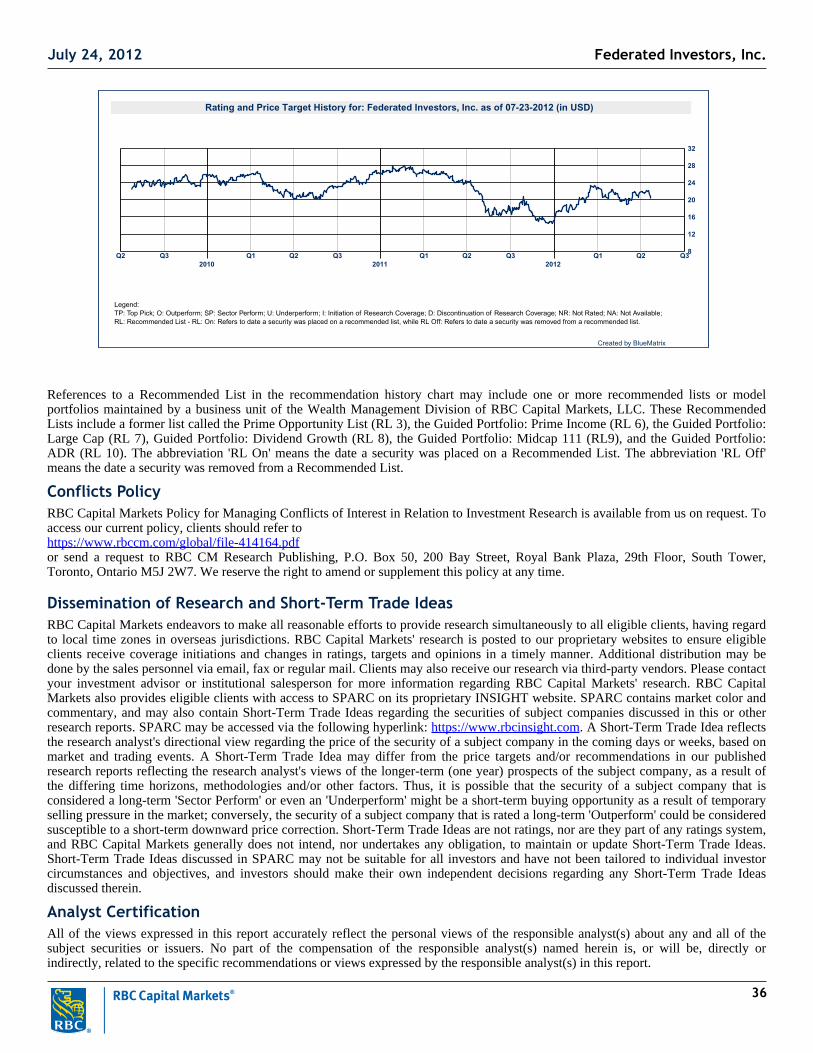
Rating and Price Target History for: Federated Investors, Inc. as of 07-23-2012 (in USD)
Legend:
TP: Top Pick; O: Outperform; SP: Sector Perform; U: Underperform; I: Initiation of Research Coverage; D: Discontinuation of Research Coverage; NR: Not Rated; NA: Not Available;
RL: Recommended List - RL: On: Refers to date a security was placed on a recommended list, while RL Off: Refers to date a security was removed from a recommended list.
Created by BlueMatrix
References to a Recommended List in the recommendation history chart may include one or more recommended lists or modelportfolios maintained by a business unit of the Wealth Management Division of RBC Capital Markets, LLC. These RecommendedLists include a former list called the Prime Opportunity List (RL 3), the Guided Portfolio: Prime Income (RL 6), the Guided Portfolio:Large Cap (RL 7), Guided Portfolio: Dividend Growth (RL 8), the Guided Portfolio: Midcap 111 (RL9), and the Guided Portfolio:ADR (RL 10). The abbreviation 'RL On' means the date a security was placed on a Recommended List. The abbreviation 'RL Off'means the date a security was removed from a Recommended List.
Conflicts Policy
RBC Capital Markets Policy for Managing Conflicts of Interest in Relation to Investment Research is available from us on request. Toaccess our current policy, clients should refer tohttps://www.rbccm.com/global/file-414164.pdfor send a request to RBC CM Research Publishing, P.O. Box 50, 200 Bay Street, Royal Bank Plaza, 29th Floor, South Tower,Toronto, Ontario M5J 2W7. We reserve the right to amend or supplement this policy at any time.
Dissemination of Research and Short-Term Trade Ideas
RBC Capital Markets endeavors to make all reasonable efforts to provide research simultaneously to all eligible clients, having regardto local time zones in overseas jurisdictions. RBC Capital Markets' research is posted to our proprietary websites to ensure eligibleclients receive coverage initiations and changes in ratings, targets and opinions in a timely manner. Additional distribution may bedone by the sales personnel via email, fax or regular mail. Clients may also receive our research via third-party vendors. Please contactyour investment advisor or institutional salesperson for more information regarding RBC Capital Markets' research. RBC CapitalMarkets also provides eligible clients with access to SPARC on its proprietary INSIGHT website. SPARC contains market color andcommentary, and may also contain Short-Term Trade Ideas regarding the securities of subject companies discussed in this or otherresearch reports. SPARC may be accessed via the following hyperlink: https://www.rbcinsight.com. A Short-Term Trade Idea reflectsthe research analyst's directional view regarding the price of the security of a subject company in the coming days or weeks, based onmarket and trading events. A Short-Term Trade Idea may differ from the price targets and/or recommendations in our publishedresearch reports reflecting the research analyst's views of the longer-term (one year) prospects of the subject company, as a result ofthe differing time horizons, methodologies and/or other factors. Thus, it is possible that the security of a subject company that isconsidered a long-term 'Sector Perform' or even an 'Underperform' might be a short-term buying opportunity as a result of temporaryselling pressure in the market; conversely, the security of a subject company that is rated a long-term 'Outperform' could be consideredsusceptible to a short-term downward price correction. Short-Term Trade Ideas are not ratings, nor are they part of any ratings system,and RBC Capital Markets generally does not intend, nor undertakes any obligation, to maintain or update Short-Term Trade Ideas.Short-Term Trade Ideas discussed in SPARC may not be suitable for all investors and have not been tailored to individual investorcircumstances and objectives, and investors should make their own independent decisions regarding any Short-Term Trade Ideasdiscussed therein.
Analyst Certification
All of the views expressed in this report accurately reflect the personal views of the responsible analyst(s) about any and all of thesubject securities or issuers. No part of the compensation of the responsible analyst(s) named herein is, or will be, directly orindirectly, related to the specific recommendations or views expressed by the responsible analyst(s) in this report.
The Global Industry Classification Standard (“GICS”) was developed by and is the exclusive property and a service mark of MSCI Inc. (“MSCI”) and Standard & Poor’s Financial ServicesLLC (“S&P”) and is licensed for use by RBC. Neither MSCI, S&P, nor any other party involved in making or compiling the GICS or any GICS classifications makes any express or impliedwarranties or representations with respect to such standard or classification (or the results to be obtained by the use thereof), and all such parties hereby expressly disclaim all warranties oforiginality, accuracy, completeness, merchantability and fitness for a particular purpose with respect to any of such standard or classification. Without limiting any of the foregoing, in no eventshall MSCI, S&P, any of their affiliates or any third party involved in making or compiling the GICS or any GICS classifications have any liability for any direct, indirect, special, punitive,consequential or any other damages (including lost profits) even if notified of the possibility of such damages.
Disclaimer
RBC Capital Markets is the business name used by certain branches and subsidiaries of the Royal Bank of Canada, including RBC Dominion Securities Inc., RBCCapital Markets, LLC, RBC Europe Limited, RBC Capital Markets (Hong Kong) Limited, Royal Bank of Canada, Hong Kong Branch and Royal Bank of Canada,Sydney Branch. The information contained in this report has been compiled by RBC Capital Markets from sources believed to be reliable, but no representation orwarranty, express or implied, is made by Royal Bank of Canada, RBC Capital Markets, its affiliates or any other person as to its accuracy, completeness or correctness.All opinions and estimates contained in this report constitute RBC Capital Markets' judgement as of the date of this report, are subject to change without notice and areprovided in good faith but without legal responsibility. Nothing in this report constitutes legal, accounting or tax advice or individually tailored investment advice. Thismaterial is prepared for general circulation to clients and has been prepared without regard to the individual financial circumstances and objectives of persons whoreceive it. The investments or services contained in this report may not be suitable for you and it is recommended that you consult an independent investment advisor ifyou are in doubt about the suitability of such investments or services. This report is not an offer to sell or a solicitation of an offer to buy any securities. Pastperformance is not a guide to future performance, future returns are not guaranteed, and a loss of original capital may occur. RBC Capital Markets research analystcompensation is based in part on the overall profitability of RBC Capital Markets, which includes profits attributable to investment banking revenues. Every province inCanada, state in the U.S., and most countries throughout the world have their own laws regulating the types of securities and other investment products which may beoffered to their residents, as well as the process for doing so. As a result, the securities discussed in this report may not be eligible for sale in some jurisdictions. RBCCapital Markets may be restricted from publishing research reports, from time to time, due to regulatory restrictions and/or internal compliance policies. If this is thecase, the latest published research reports available to clients may not reflect recent material changes in the applicable industry and/or applicable subject companies.RBC Capital Markets research reports are current only as of the date set forth on the research reports. This report is not, and under no circumstances should be construedas, a solicitation to act as securities broker or dealer in any jurisdiction by any person or company that is not legally permitted to carry on the business of a securitiesbroker or dealer in that jurisdiction. To the full extent permitted by law neither RBC Capital Markets nor any of its affiliates, nor any other person, accepts any liabilitywhatsoever for any direct or consequential loss arising from any use of this report or the information contained herein. No matter contained in this document may bereproduced or copied by any means without the prior consent of RBC Capital Markets.
Additional information is available on request.
To U.S. Residents:This publication has been approved by RBC Capital Markets, LLC (member FINRA, NYSE, SIPC), which is a U.S. registered broker-dealer and which acceptsresponsibility for this report and its dissemination in the United States. Any U.S. recipient of this report that is not a registered broker-dealer or a bank acting in a brokeror dealer capacity and that wishes further information regarding, or to effect any transaction in, any of the securities discussed in this report, should contact and placeorders with RBC Capital Markets, LLC.To Canadian Residents:This publication has been approved by RBC Dominion Securities Inc.(member IIROC). Any Canadian recipient of this report that is not a Designated Institution inOntario, an Accredited Investor in British Columbia or Alberta or a Sophisticated Purchaser in Quebec (or similar permitted purchaser in any other province) and thatwishes further information regarding, or to effect any transaction in, any of the securities discussed in this report should contact and place orders with RBC DominionSecurities Inc., which, without in any way limiting the foregoing, accepts responsibility for this report and its dissemination in Canada.To U.K. Residents:This publication has been approved by RBC Europe Limited ('RBCEL') which is authorized and regulated by Financial Services Authority ('FSA'), in connection withits distribution in the United Kingdom. This material is not for general distribution in the United Kingdom to retail clients, as defined under the rules of the FSA.However, targeted distribution may be made to selected retail clients of RBC and its affiliates. RBCEL accepts responsibility for this report and its dissemination in theUnited Kingdom.To Persons Receiving This Advice in Australia:This material has been distributed in Australia by Royal Bank of Canada - Sydney Branch (ABN 86 076 940 880, AFSL No. 246521). This material has been preparedfor general circulation and does not take into account the objectives, financial situation or needs of any recipient. Accordingly, any recipient should, before acting onthis material, consider the appropriateness of this material having regard to their objectives, financial situation and needs. If this material relates to the acquisition orpossible acquisition of a particular financial product, a recipient in Australia should obtain any relevant disclosure document prepared in respect of that product andconsider that document before making any decision about whether to acquire the product.To Hong Kong Residents:This publication is distributed in Hong Kong by RBC Investment Services (Asia) Limited, RBC Investment Management (Asia) Limited and RBC Capital Markets(Hong Kong) Limited, licensed corporations under the Securities and Futures Ordinance or, by the Royal Bank of Canada, Hong Kong Branch, a registered institutionunder the Securities and Futures Ordinance. This material has been prepared for general circulation and does not take into account the objectives, financial situation, orneeds of any recipient. Hong Kong persons wishing to obtain further information on any of the securities mentioned in this publication should contact RBC InvestmentServices (Asia) Limited, RBC Investment Management (Asia) Limited, RBC Capital Markets (Hong Kong) Limited or Royal Bank of Canada, Hong Kong Branch at17/Floor, Cheung Kong Center, 2 Queen's Road Central, Hong Kong (telephone number is 2848-1388).To Singapore Residents:This publication is distributed in Singapore by the Royal Bank of Canada, Singapore Branch and Royal Bank of Canada (Asia) Limited, registered entities grantedoffshore bank and merchant bank status by the Monetary Authority of Singapore, respectively. This material has been prepared for general circulation and does not takeinto account the objectives, financial situation, or needs of any recipient. You are advised to seek independent advice from a financial adviser before purchasing anyproduct. If you do not obtain independent advice, you should consider whether the product is suitable for you. Past performance is not indicative of future performance.If you have any questions related to this publication, please contact the Royal Bank of Canada, Singapore Branch or Royal Bank of Canada (Asia) Limited.To Japanese Residents:Unless otherwise exempted by Japanese law, this publication is distributed in Japan by or through RBC Capital Markets (Japan) Ltd., a registered type one financialinstruments firm and/or Royal Bank of Canada, Tokyo Branch, a licensed foreign bank.