FINESCE D4.7 v.0.1 Page 1 (42) FI.ICT-2011.1.8 FINESCE D4.7 v.0.1 Trial Results Contractual Date of Delivery to the CEC: September 30th 2015 Actual Date of Delivery to the CEC: September 16th 2015 Author(s): José Sanchez Torres;Raphaël Caire;P. Andriani;L. Briguglio;L. Lombardo;M. Nigrelli;D. Pellegrino;M.Simonov;F. Rizzo;G. Zanetto;M. Cresta;M. Paulucci;A. Mengi;M. Wächter Participant(s): INP, ASM, DEVOLO, ENG, ISMB, SYN, TW Workpackage: WP4 – FI building the Energy Marketplace Estimated person months: 44 PM Security: PU Nature: R = Report Version: 0.1This is intended for the abstract. Total number of pages: 42 Abstract: In the context of FINESCE as a Phase II use case project of the FI-PPP program, this report represents the seventh deliverable of Work Package 4 (WP4). It presents the Trial Results for the WP4 Energy Marketplace trial located in Terni (Italy). Keyword list: Marketplace, Trial site, Energy, Future Internet, FI-PPP, Generic Enabler, Architecture, Integration, API, Metering, Issue Resolution Plan, Power losses, Voltage drops, Simulator. Disclaimer: N/A
Transcript
FINESCE D4.7 v.0.1
Page 1 (42)
FI.ICT-2011.1.8 FINESCE
D4.7 v.0.1 Trial Results
Contractual Date of Delivery to the CEC: September 30th 2015
Actual Date of Delivery to the CEC: September 16th 2015
Workpackage: WP4 – FI building the Energy Marketplace
Estimated person months: 44 PM
Security: PU
Nature: R = Report
Version: 0.1This is intended for the abstract.
Total number of pages: 42
Abstract: In the context of FINESCE as a Phase II use case project of the FI-PPP program, this report represents the seventh deliverable of Work Package 4 (WP4). It presents the Trial Results for the WP4 Energy Marketplace trial located in Terni (Italy).
Executive Summary In the context of FINESCE as one of the use case projects in Phase II of the FI-PPP program, this internal deliverable presents the results of the developments performed in task 4.4 “Trial Implementation” and results of simulations from task 4.5 “Emulation, Simulation and Evaluation.”
The trial was operated in Terni municipality by ASM Terni, as the local DSO, on a MV/LV branch network with high presence of distributed energy resources (difficult to be managed due to the variability of external factors as weather conditions and social events) that consequently, as side effects, give rise to both reverse power flows through the secondary substations and reduced operational efficiency of the involved components (e.g. power losses in MV/LV transformers and reduced lifecycle). The main objective of the marketplace trial application is to enable through a demand response mechanism the minimization of the effect of the reverse power flows, by properly shifting the energy demand in the time domain in order to be aligned to the production, through active consumers’ participation in the overall Grid management processes. This report documents and discusses the main groups of results of the implementation of the energy marketplace trial in Terni, which are:
• Usage on generic enablers and FIWARE technologies for Smart Energy utilities, which is mainly the experience by a DSO and a few tangible results of the large number of FIWARE GEs integrated during this project.
• Results on AMR2AMI, which are the results of using new technologies for communicating smart meters and how this solution contributes to the amelioration of the quality of the DSO services.
• Simulations of Energy Networks performed in order to compute in real time and predict in the near future the voltage drops and power losses in the network. This information is used in the “Issue detector Processor”. Power consumption/generation values are achieved by means of continuous simulations, allowing for the anticipation of the energy dynamics in order to make meaningful decisions in the energy marketplace domain. These results validate the use of GE on Smart Energy.
Last, this deliverable includes user experiences, learning from results and market potential of the trial, by each partner from its expertise, either as a utility, a University or a SME.
2. Trial Results on usage of Generic Enablers and FIWARE ....................... 7
2.1 The energy marketplace pilot application ...................................................................... 7 2.2 Energy marketplace conceptual architecture ................................................................. 7 2.3 FIWARE in the design and development of the energy marketplace ............................ 9 2.4 Advantages of using FIWARE GEs compared to selected “alternatives” ...................... 9 2.5 Lessons learnt from using FIWARE ............................................................................. 11 2.6 How FIWARE helps company products ....................................................................... 11 2.7 Tangible results ............................................................................................................ 11
3. Trial Results on AMR2AMI ....................................................................... 16
3.1 G3-PLC performance result into the trial ..................................................................... 16 3.2 DLMS/COSEM Client extension to communicate metering data to FIWARE
infrastructure ................................................................................................................ 18 3.2.1 An interoperable solution ..................................................................................... 19 3.2.2 Advantages of locally deployed solution at secondary substation premises ....... 19 3.2.3 Independence on legacy systems ........................................................................ 19 3.2.4 Scalability ............................................................................................................. 19 3.2.5 Resulting benefits from push data model ............................................................. 19 3.2.6 Remote maintenance ........................................................................................... 20
3.3 How the AMR2AMI solution contributes to improve DSO services ............................. 20
4. Trial Results on Simulation ...................................................................... 24
4.1 Simulator in the Market Place architecture .................................................................. 24 4.2 Results on Power losses and Voltage drops computation .......................................... 25
4.2.1 Methodology ......................................................................................................... 25 4.2.2 Results on Trial Site ............................................................................................. 26
4.3 Results on Power Consumption and Production short-term prediction ....................... 30 4.3.1 Methodology ......................................................................................................... 30 4.3.2 Results on Trial Site ............................................................................................. 32
7. List of Abbreviations ................................................................................ 36
Appendix - A List of Publications ............................................................. 37
Appendix - B Load Flow algorithm ........................................................... 38
Appendix - C Prediction Algorithms ........................................................ 40
FINESCE D4.7 v.0.1
Page 6 (42)
1. Introduction The Energy market landscape is characterized by a large deployment of Distributed Energy Resources (DERs), mostly based on renewable energy sources. This is helping to reduce greenhouse gas emissions and thus to contribute to the European Union target of 20% reduction in these emissions for 2020. However, DERs introduce a new challenge for grids as injected electricity from DER largely depends from the variable weather conditions. As such, DER energy presents extreme variations over time, creating supply/demand imbalances, power losses and instability in the grid; those critical conditions stress electrical components, consequently reducing their operational lifecycle. Many solutions from the state of the art, mostly based on controlling power generation, are characterized by being too expensive to adopt on a practical basis. The FINSENY project [1] analyzed a new promising approach as a combination of Demand Side Management and new Market mechanisms. FINESCE WP4 aims to instantiate a marketplace for Energy, enabled by Future Internet technologies (FI-WARE Generic Enablers), so as to demonstrate the advantages of such an approach. In this framework, the scope of WP4 developments is to design, implement, test and evaluate a trial for demonstrating how and to what extent Future Internet technologies are able to fully support the operations of a near real time energy marketplace, as a practical example of a set of smart grid services based on real time communications between many different stakeholders through a high performance, scalable, information exchange infrastructure. The trial site operates 12 smart meters and has the follow characteristics:
• Fully functioning energy marketplace application with 13 FIWARE Generic Enablers integrated and deployed using FIWARE Lab facilities.
• Access to near-real-time anonymized data via FINESCE API (subject to authorization issued by the DSO).
• DSEs (in combination with related GEs) available as open source software allowing SMEs to smooth the learning curve when joining the FIWARE ecosystem applied to the energy domain.
This deliverable aims at presenting the main results obtained in tasks 4.4: “Trial Implementation” and task 4.5: “Emulation, Simulation and Evaluation”. The rest of the document continues as follows
Chapter 2 provides the main results concerning the usage Generic Enablers of FIWARE, including a comparison between FIWARE and other “alternatives”, lessons learnt from using FIWARE. As well, this chapter presents the DSEs developed and the FINESCE WP4 API as tangible results to show to what extent FIWARE technologies allow scalable yet effective operation of a near-real time virtual marketplace for energy Chapter 3 presents the results on AMR2AMI. This chapter is divided in three sections: The first one presents the integration of Smart Metering Systems into a communication infrastructure, using G3-PLC, analyzing the performance of G3-PLC in combination to a data concentrator and the scalability possibility on larger networks. The second one discusses about the DLMS/COSEM energy meters integration into the FIWARE infrastructure and its main advantages. And the third part provides different arguments to show how the use of both technologies contributes to DSO services. Chapter 4 introduces the simulation activities performed in task 4.5 and its integration in the e-market place as part of the DSE “Issue Detector Processor”, interacting with the GE’s ORION and COSMOS. Many results are presented in order to demonstrate how the Simulator exploits the near real-time data from the smart meters and the weather forecasting, to provide to the DSO the power losses, voltage drops and consumption/production prediction. Main activities’ conclusions are given in Chapter 5. Appendix A lists the publications made by WP4 partners on different international conferences and workshops. Appendices B and C extends the simulation algorithms description, for further understanding.
FINESCE D4.7 v.0.1
Page 7 (42)
2. Trial Results on usage of Generic Enablers and FIWARE The main results of the marketplace trial can be outlined as follows: a) a relevant architecture has been designed, b) relevant stakeholders have been identified and c) an IT solution based on this architecture has been implemented. The IT solution for the marketplace is based on FIWARE technologies and deployed on the cloud facilities offered by FIWARE. FIWARE has been compared to alternative existing products and what has been learnt while using FIWARE for the FINESCE WP4 trial implementation is finally presented.
2.1 The energy marketplace pilot application One of the smart grid promises is to improve the efficiency of power grid systems and reduce greenhouse gas emissions by securely integrating power generation from renewable sources. Such generation including solar and wind is greatly affected by external factors, such as the weather conditions, which may fluctuate significantly. Thus, the efficient utilization of green energy sources requires that demand at smart grid level is appropriately shaped, possibly through incentives, to match the supply. As a result, the power grid system becomes highly dynamic, constantly requiring operational adjustments. These adjustments can greatly impact the efficiency and reliability of power grid systems bearing significant innovation opportunities. Several works in literature deal with the objective of optimizing the usage of the power grid assets [1],[3]-[4], without deeply considering the challenge of using, managing and transforming into valuable insights the enormous amount of data acquired through the power grid sensors. Moreover, additional challenges arise from the constraints of real-time data delivery to applications. In this continuously evolving environment, the Terni trial is a real field pilot in which an energy marketplace (based on FIWARE technologies) gathers data from the mid-low voltage network. Leveraging on big data analytics technologies, its business level objective is mainly twofold: providing insights to grid operators which allow demand response actions to be enabled by personalized incentives [3] and giving customers the possibility to choose how to modify their consumption habits, following the renewable energy sources production patterns.
2.2 Energy marketplace conceptual architecture The marketplace architecture shown in Figure 1 consists of five different main elements. Each element represents a different scope of the energy marketplace business case:
• IoT connectors, which are in charge of acquiring data from different external sources (such as the smart meters installed at the pilot application site);
• a Publish/Subscribe messaging system, which manages the ingestion of the acquired data into the marketplace;
• a Complex Event Processing system, which compares “incoming” streams of events (e.g. weather forecast information, consumption/production measurements) against pre-defined patterns in order to detect issues such as power losses or voltage drops along the grid lines;
• a Data Management system, which is focused on storing, processing and analyzing the acquired data;
• a “Visual analytics” application, which represents the customized “visual” tool that each involved stakeholder would use to perform their respective actions in the marketplace.
FINESCE D4.7 v.0.1
Page 8 (42)
Figure 1 - Energy marketplace conceptual architecture
There are five types of stakeholders (categorized according to Expert Group 3 “Roles and responsibilities of Actors involved in the Smart Grids” [6]) with different roles within the marketplace:
• Aggregator, who mediates between the DSO business needs of reducing grid power losses and the business needs of the Energy Retailer of selling the energy at the best price;
• DSO, who distributes electricity to the actual end-users, balances electricity demand with supply, maximizes the consumption of electricity produced locally, for instance by renewable energy providers, minimizes the flow of electricity through the secondary substations, monitors and operates the Distribution System, participates in negotiations with Aggregators and/or Energy Retailers, approves/rejects an issue resolution plan (submitted by the Aggregator);
• Energy Retailer, who defines price policies and develops sets of incentives and/or disincentives for their own customers based on the content of the issue resolution plan(s);
• Market Regulator, who marks an incentive plan as compliant to national regulation; • Final customer, either retail or industrial, who is connected to the electricity distribution
systems. S/he may be both consumer (consumes energy) and prosumer (a user who, on top of acting as a consumer, also generates electricity and provides it back to the distribution system). S/he is the beneficiary of a contract proposal which is automatically created by the marketplace from an incentive plan marked as “compliant” to the existing national regulation.
Table 1 presents the benefits arising from the adoption of the energy marketplace per stakeholder group.
Stakeholder Benefits
Aggregator Develop and sell new kind of services, as a third party mediating business interests of DSO and Energy Retailer.
DSO Enhance the grid operational efficiency; reduce power losses.
Energy Retailer Implement a customer retention strategy by offering “smart contracts” to customer.
Market Regulator
Reduce the time needed to validate compliance to existing national regulation.
Final customer Reducing the monthly bill without losing control on the desired comfort.
Table 1 - Benefits for marketplace stakeholders
FINESCE D4.7 v.0.1
Page 9 (42)
2.3 FIWARE in the design and development of the energy marketplace With respect to the design of the generic architecture presented in Figure 1, FIWARE plays the role of an integrated architecture covering concepts ranging from IoT sensors readings (smart metering) to data storage, analysis and visualization. FIWARE’s contribution to the development of the marketplace pilot application (based on the above mentioned architecture) is represented by its technological platform consisting of a set of Generic Enablers (GEs) offering functionalities (in the form of APIs) belonging to different areas such as Data/Context Management, Internet of Things (IoT), Applications and Data Delivery and Cloud Hosting. In the implemented solution, four different FIWARE GEs (together with seven minor ones) and FIWARE Lab [5] cloud facilities map the main components of the marketplace architecture and cover its functionalities (as shown in Table 2). Architecture component
FIWARE Chapter
FIWARE GEs / cloud architecture
Required functionalities
Cloud-based Big Data infrastructure
Cloud Hosting FIWARE Lab Cloud-based infrastructure for deploying software components
Publish/Subscribe messaging system
Data/Context Management
Orion Context Broker
acquire data coming from different “external” sources and deliver it to “interested” parties
Complex Event Processing
Data/Context Management
Proton Detect issues based on the acquired data
Data management system
Data/Context Management
Cosmos (Big Data Analysis)
Store, process and analyses data
“Visual analytics” application
Applications and Data Delivery
Wirecloud Accessing data
Table 2 - How FIWARE GEs map marketplace architecture component
2.4 Advantages of using FIWARE GEs compared to selected “alternatives” “Alternatives” to FIWARE GEs have been identified among those offering the same functionalities/services. The following table shows the results of this analysis:
FIWARE GEs “Alternatives” products/services Cloud GEs Cloud services from TELCO and IT companies (e.g.
Amazon AWS, Google Cloud, Microsoft Azure) COSMOS Big Data Analysis GE Cloudera’s Hadoop dist, HortonWorks’s Hadoop dist,
MapR’s Hadoop dist, EMC-spinoff PIVOTAL, IBM InfoSphere BigInsights
ORION Context Broker GE Message Brokers - Distributed publish-subscribe Messaging System [8], [9], [10] such as: Redis, RabbitMQ, Apache Kafka, Apache ActiveMQ, and Kestrel
FINESCE D4.7 v.0.1
Page 10 (42)
PROTON Complex Event Processing GE
Event Processing Software [11] such as: Oracle Event Processing, Tibco Streambase, Esper, Drools and IBM Infosphere
OBJECT STORAGE GE Cloud storage products/services based on CDMI such as those listed in [12]
KEYROCK Identity Management GE
Different implementation of the OAuth2 standard [13]
IDAS (Backend) Device Management GE
IoT Device Management products such as: Oracle’s Internet of Things platform, Axeda Ready M2M, Device Cloud by Etherion and Wind River® Intelligent Device Platform XT
Table 3 - FIWARE GEs vs. alternative products/services
The approach used for filling in Table 4 below is based on defining a series of “advantages” that a user may consider "appealing” when choosing to go for a FIWARE GE instead of an “alternative” product/service available on the market (either Open Source or COTS).
Table 4 - "Advantages" of using FIWARE GEs
From the above table, a couple of considerations can be made: • the key factor of choosing a GE would definitely be the availability of a contact person
(the “GE owner”) who can eventually help a user in sorting out issues during both set-up and operation;
• set-up an entire infrastructure would not imply costs of hardware, hosting and licensing in the context of FI-PPP program [14];
• most of the GEs are natively integrated each with the other thus representing a Future Internet “ecosystem” through which data can be acquired, stored, processed/analyzed and, finally, exposed;
• GEs are based on “open standards” and so can easily “work” in conjunction with other products both open source and COTS.
FINESCE D4.7 v.0.1
Page 11 (42)
2.5 Lessons learnt from using FIWARE From a technological point of view what has been achieved for Terni trial demonstrates how an implementation of a marketplace architecture enabled by Future Internet technologies can be developed. The usage of FIWARE technological layer which allows developers to rely on support, have no cost of infrastructure, have an open standard and interoperable platform, reduces the effort needed to setup a relevant, comprehensive IT solution (as in the case of the energy marketplace). Operational efficiency of the involved energy stakeholders (listed in Table 1) can be improved by providing them with an energy marketplace dashboard in the context of which demand response and issue solving actions can be put in place. Easy to understand and responsive user interfaces allow final customers to better understand dynamic energy offerings (translating the identified issue solving actions) and at the same time to have a direct communication channel with the Energy Retailer.
2.6 How FIWARE helps company products ASM believes to use FIWARE platform also in new calls of H2020 program and to put the bases for the implementation of a smart city in its municipality. After, ASM would like to suggest its business model to neighboring towns in the middle of Italy area. In this way ASM believes to enhance its role of multi-utility at national level. ASM would like to be a best practice example for public companies who invest in R&D. From the technological point of view ASM very soon will extend P2 near real time reading for his main LV customers. In this way will be possible the integration of MV SCADA system already on and LV near real time reading. Thanks this implementation ASM will implement automatic DR power factor management based on FIWARE marketplace technology. The last step of this roadmap will be the start a new aggregator company, one of the first in Italy. With the experience about G3-PLC and DLMS/COSEM ASM hopes to be ready in a fast deployment of second generation Italian smart meters. Moreover ASM as multi-utility want to start to test multiservice AMI with DLMS/COSEM standard applied to: electrical energy, drinking water distribution, natural gas distribution and waste management.
2.7 Tangible results FINESCE WP4 has produced tangible results in designing, testing and evaluating a trial site for demonstrating how and to what extent FIWARE technologies allow scalable yet effective operation of a near-real time virtual marketplace for energy. For such an objective, software components (DSEs) and services (FINESCE WP4 API) have been developed. The DSEs put in place the integration between the marketplace and its different data sources (metering data, weather forecast, social events, etc.); the API allow “interested parties” to retrieve aggregated data from the trial site.
2.7.1 WP4 DSEs The marketplace architecture described in D4.3, D4.3.2 and D4.4 not only consists of thirteen “integrated” FIWARE GEs but also of seven DSEs which mainly represent software services that can be used to “publish” content on the Context Broker GE. The table below summarizes which DSEs have been developed within the activities of WP4:
DSE Name DSE brief description Status FINESCE WP4 Module Name
Issue Detector Processor
Detects issues related to power losses and voltage drops (in the lines of a smart LV grid) and then sends it to an instance of ORION
Implemented Published in the FINESCE DSE Catalogue
Cosmos2SCILAB + INP-SCILAB + Scilab2ORION
FINESCE D4.7 v.0.1
Page 12 (42)
Context Broker GE
Social Events Interface
A REST service (developed in Java) which allows clients (e.g. Social Events Information Providers) to register data about social events (affecting consumption/production in a specific area such as a concert or a football match) in an instance of ORION Context Broker GE
Implemented Published in the FINESCE DSE Catalogue
Social2Orion
Weather Condition Interface
It consists of: a REST service (developed in Java) which allow clients (e.g. Weather Condition Information Providers) to register data about weather conditions and predictions in a specific area onto an instance of ORION Context Broker GE; a Java client which retrieves weather conditions and predictions from an external service (forecast.io in our implementation) and then “passes” the data to the above mentioned REST service.
Implemented Published in the FINESCE DSE Catalogue
WeaFor2Orion
Contract Information
A REST service (developed in Java) which allows clients (e.g. Retailers) to register data about cost of energy produced from the DERs, costs of transmission system and power plants, energy costs in an instance of ORION Context Broker GE.
Implemented Published in the FINESCE DSE Catalogue
ContractInformation2Orion
Metering It consists of: a REST service (developed in Java) which allow clients (e.g. DSOs) to register data about metering and load profile in a specific area into an instance of ORION Context Broker GE; a Java client which accepts data about metering and load profile coming from the smart meters (via either an IoT gateway or an existing legacy system) and then “passes” the data to the above mentioned REST service.
Implemented Published in the FINESCE DSE Catalogue
Metering2Orion
Protocol Adapter AMM
This component will retrieve DLMS/COSEM data from
Implemented
AMR2AMI (Sensor2AMI)
FINESCE D4.7 v.0.1
Page 13 (42)
meters installed at the trial site (metering and load profile) and then feeds an instance of IDAS (Backend) Device Management GE with the data (which, on its turn, forwards data to an instance of ORION Context Broker GE
Published in the FINESCE DSE Catalogue
Contract Tailor Processor
This component will be responsible to calculate a new contract for a specific customer based on an incentive plan (issued by a Retailer and approved by a Market Regulator Authority).
Implemented Published in the FINESCE DSE Catalogue
ContractManager
Total number of “published” DSEs 7
Table 5 – WP4 DSEs
The FINESCE DSE catalogue (http://finesce.github.io) includes the details regarding the functionalities, the configuration and the source code of the DSEs. WP4 DSEs source code has been released under the Apache License, version 2.0 [15], with an exception for the Protocol Adapter AMM which has been released under the GPLv2 license, as it depends on the Gurux GPLv2 library. For the DSEs in Table 5 marked with the tag “Implemented”, the following table provides the links to the respective section in the FINESCE DSE catalogue.
DSE Name (as in D4.1) FINESCE DSE catalogue link Issue Detector Processor http://finesce.github.io/DSE.html?id=Issue_Detector_Processo
r_(Cosmos2SCILAB___INP-SCILAB___SCILAB2Orion_**)_ Social Events Interface http://finesce.github.io/DSE.html?id=Social_Events_Interface_
Table 6 - WP4 DSEs published into the FINESCE DSE Catalogue
2.7.2 FINESCE WP4 API As already documented in the previous paragraph, the DSEs presented in the previous paragraph are exposing RESTful interfaces to enable access either to external services (e.g. the Weather2Orion DSE) or to the trial data. These sets of data exhibit the trial result from an information generation perspective. A detailed description of the trial APIs has been provided in the internal report D4.6 entitled “Finesce API and Handbook (Terni Trial)”, hence, only a summary of these APIs will be provided in this report, for reasons of brevity. The FINESCE WP4 APIs comprise a total of eleven (11) different service endpoints, tackling the following functionality groups:
• Weather Forecast • Customer Electricity Consumption and Production • Customer Profile of Electricity Consumption and Production
• Sector Profile of Electricity Consumption and Production • Metering devices • Sectors • Social Events • Energy Costs • Issue Resolution Plans • Incentive Plans • Contracts
In all cases, only GET operations are allowed producing XML-formatted responses and the respective error codes are tabulated in the following table:
Code Description 200 OK 401 Not authorized 404 Not found 405 Method not allowed 406 Not acceptable 500 Internal server error
Table 7 - FINESCE WP4 API Status Codes
All the aforementioned APIs can be configured through appropriately setting relevant query parameters, such as the customer time, the start and end time of the time period of interest etc. Moreover, authorization in all API endpoints is achieved by including the user name and password in the set of their query parameters. The interested user is requested to refer to D4.6 for details on these API specifications. The internal WP4 API was also translated to the global FINESCE API one, offering the services tabulated in Table 8.
Method Service URL POST /Terni/tokens GET /Terni/contracts/customer/{customer}/state/{state} GET /Terni/contracts/prices GET /Terni/contracts/state/{state} GET /Terni/dsm/ip/author/{author} GET /Terni/dsm/ip/author/{author}/state/{state} GET /Terni/dsm/ip/state/{state} GET /Terni/dsm/irp/author/{author} GET /Terni/dsm/irp/author/{author}/state/{state} GET /Terni/dsm/irp/state/{state} GET /Terni/energy/consumption/profile/sector/{sector}/{from}/{to} GET /Terni/energy/consumption/profile/user/{customer_id}/{from}/{to} GET /Terni/energy/consumption/total/user/{customer_id}/{from}/{to} GET /Terni/energy/production/profile/sector/{sector}/{from}/{to} GET /Terni/energy/production/profile/user/{customer_id}/{from}/{to} GET /Terni/energy/production/total/user/{customer_id}/{from}/{to} GET /Terni/meters GET /Terni/meters/sectors GET /Terni/meters/{search_options} GET /Terni/power/demand/user/{customer_id}/{from}/{to} GET /Terni/power/supply/user/{customer_id}/{from}/{to} GET /Terni/simulation/prediction/power/demand/sector/{sector_id}
FINESCE D4.7 v.0.1
Page 15 (42)
GET /Terni/simulation/prediction/power/demand/user/{customer_id} GET /Terni/simulation/prediction/power/supply/sector/{sector_id} GET /Terni/simulation/prediction/power/supply/user/{customer_id} GET /Terni/social GET /Terni/social/{events_number} GET /Terni/weather/available_descriptors GET /Terni/weather/{descriptor}/{from}/{to} GET /Terni/weather/{from}/{to}
Table 8 - The Terni trial-related FINESCE API endpoints
WP4 partners implemented the translation by offering API adapters from all WP4-specific APIs. An indicative example of these adapters is provided in table Table 9.
/** * Converts a HistLoadData object (FINESCE WP4) referring to the energy * production of a single user into a FINESCE API compatible one * * @param data The data to parse * @return The EnergyConsumptionMeasurement report, according to the * data model defined by FINESCE API */ @SuppressWarnings("rawtypes") @Converter public MeasurementReport energyProduction(HistLoadData data) { MeasurementReport<EnergyProductionGridMeasurement> mr = new MeasurementReport<>("EnergyProductionGrid", Desc.API_VERSION, Desc.NAME); EnergyProductionGridMeasurement ecgm = new EnergyProductionGridMeasurement(); ecgm.setIdentifier(data.getSmType()); ecgm.setType(new EnergyProductionGrid()); ecgm.setEndTime(Utilities.dateFromSeconds(data.getEndDateTime())); ecgm.setStartTime(Utilities.dateFromSeconds(data.getStartDateTime())); if (data.getLoaddataList() != null) { for (HistLoadDataList value : data.getLoaddataList()) { ecgm.add(new EnergyProductionGridValue(null, Utilities.dateFromSeconds(value.getLoadSampleDate()), value.getUpstreamActivePowerEUA())); } } mr.setMeasurements(ecgm); return mr; }
Table 9 - Indicative API conversion
FINESCE D4.7 v.0.1
Page 16 (42)
3. Trial Results on AMR2AMI The main-requirement for the Smart Grid applications is the integration of smart metering systems into a reliable and economically attractive communication infrastructure. In the context of the FINESCE project, a trial has been conducted in a small portion of the power grid managed by ASM in Terni. Terni has a history of a high industrial development that started in the nineteenth century, when the first steel mills were built. Even today Terni is one of the main poles of the steel industry in Italy. In this trial, we evaluate the G3-PLC for the Smart Grid applications.
3.1 G3-PLC performance result into the trial Powerline is the key technology for IP-based data communication via existing powerline networks. The technology offers many advantages for the smart grid applications, from cost-effective installation to stable and secure data transmission. Therefore, the 500 kHz G3-Power Line Communications (PLC) and the G3-PLC DINRail modem have been developed during the FINESCE Project to meet the industry's need for a Power Line Communication that will enable the smart grid vision. The technology has been successfully tested on the field in Terni, Italy within the framework of WP4. Currently, the smart meters equipped with G3-PLC DINRail technology are being installed and operated in Terni, Italy. The following figure shows the inside view of the installed meter cabinet with the G3-PLC DINRail modems (on the left) connected to the smart meter (on the right).
Figure 2 - Meter cabinet with the G3-PLC DINRail modem (on the left) connected to the
smart meter (on the right)
The smart meters provide load profile every fifteen minutes. The main meter output interface for automatic readout is Ethernet, which is connected to the PLC modems. The G3-PLC technology is designed to provide a set of services to create and maintain a tree type topology where the root of the tree is a Network Coordinator located at the distribution station and “the body and leaves” of the tree-like topology of the grid are remote modems connected to the smart meters. The G3-PLC network coordinator collects the smart meter data from the network and forwards them to the data concentrator. G3-PLC supports meshed network structure. Any meter can act as a router (forwarder) to establish a route between two meters that are not neighbors, see Figure 3 . The process of finding routes in the network is done automatically. This allows easy connection of new PLC modems into the network to create larger networks, without any scalability issue.
FINESCE D4.7 v.0.1
Page 17 (42)
G3-PLC technology is scalable as both required central server capacity and read out times are acceptable. Particularly, there are two main determining factors for scalability of the G3-PLC application:
• Read out times of the meters connected to one Network Coordinator
• Required central server capacity
Figure 3 - The G3-PLC network topology: A Network Coordinator located at the
distribution station and “the body and leaves” of the tree-like topology of the grid are remote modems connected to the smart meters
During the deployment of the G3-PLC network, several channel and data rate measurements have been conducted and the results have been analyzed. The conclusion is that G3-PLC technology in combination with a data concentrator is scalable to a larger network due to a multitude of reasons; the average read out time per meter is about 30 seconds and the average number of retries per successful read out is <1.25. The total estimated session time for read out of 200 meters connected to one network coordinator would be 200 x 30s x 1.25 ~ 2 hours; this is acceptable as read out time is far shorter than one day. In Terni, 5 ZXF smart meters have been installed in the test site, see Figure 4.
Figure 4 - Field Trial in ASM Terni, Italy
FINESCE D4.7 v.0.1
Page 18 (42)
With these meters WP4 achieves the following results:
• reading in near real time (every 5 minutes) by PLC; • usage of a Standard Protocol DLMS; • no interference between conventional PLC and G3-PLC.
During the field trials, the data transfer rates above 50 kbps at the application layer are achieved on average at each meter. Table 10 summarizes data rate measurements related to the modems as shown in Figure 4.
Modem Nr. Distance to Coordinator
Average Data Rate on application layer
1 60 m 76,9 kb/s
2 70 m 76,4 kb/s
3 110 m 66,5 kb/s
4 100 m 77,1 kb/s
5 450 m 46,6 kb/s
Table 10 – The data rates corresponding to the G3-PLC modems
It has been concluded that the 500 kHz G3-PLC access technology is a suitable technology for IP-based data communication fulfilling the requirements of collecting “raw” data from the meters every five minutes and transferring via PLC to a concentrator.
3.2 DLMS/COSEM Client extension to communicate metering data to FIWARE infrastructure The SENSOR2AMI implemented extension realizes a logical link between field installed DLMS/COSEM energy meters and the FIWARE infrastructure. The data-provider IAMReader module encapsulates all the DLMS/COSEM specific tasks to collect data items from meters, while the IAMServer and IAM-BackendGE are responsible to aggregate measures along defined intervals and transmit them to IDAS Generic Enable of FIWARE.
Figure 5 - Building blocks and data flows in SENSOR2AMI
CONCENTRATOR G3-PLC
ETHERNET
SENSOR2AMI Server
Inside the Secondary Substation
IAM-Data Providers
(example: IAMReader COSEM/DLMS client)
IAM-Server Relay
IAM-Backend GE
TO FI-WARE GEs
TO METER DEVICES
(PLC)
OTHER DATA SOURCES
FINESCE D4.7 v.0.1
Page 19 (42)
3.2.1 An interoperable solution The major advantage of the FINESCE implementation is the improved interoperability between the AMR (Automated Meter Reading; remote meters) and the AMI (Advanced Metering Infrastructure; the hosts) counterparts, which is achieved by adhering to the DLMS/COSEM standard already adopted by several vendors and by adhering to the new ETSI M2M standard based on the use of SensorML. The use of SensorML adds the compatibility with business information systems that adhere to the ETSI M2M specifications and standards. The FINESCE software is fully compatible with the M2M standard that uses SensorML v. 1.0 (the current implementation of the IDAS Generic Enabler supports SensorML 1.0).
3.2.2 Advantages of locally deployed solution at secondary substation premises The SENSOR2AMI solution is deployed locally and runs on a concentrator server located directly at the secondary substation, which connects, on two distinct network paths, to energy meters through G3-PLC transceivers and to external FINESCE platform through a specific routing of the ASM Terni networking infrastructure. The quantified benefit achieved by this implementation is the increased speed of data processing. Compared with the Legacy approach in which the AMI hosts – deputed to the polling of timer-based meters - are remote, the FINESCE components IAM Reader and Server are running at the premises of the same substation. The communication between the “polling” host (IAM Reader) and the “event-based” host (IAM Server) is more immediate. The distributed and parallelized modality of the data processing appears more optimal. It makes faster the data processing. It reduces the cost of the maintenance procedures. There is no need to interface with external 3rd parties because the FINESCE hosts handle the whole data value chain.
3.2.3 Independence on legacy systems One of the major advantages of the adopted approach is to be independent on the existing billing oriented Automatic Reading System of the utility, which continues to operate normally, allowing a seamless installation and minimizing the impact over the legacy systems. The SENSOR2AMI concentrator server acts totally independent from other existing systems in the utility, without requiring interfacing to proprietary database management systems and/or special add-ons from external supplier of ITC solutions. Moreover, the local processing of data items performed by the SENSOR2AMI server (i.e. integration of measure along different periods for load samples and metering data) permits to keep the meters configuration independent from the constraints imposed by billing purpose, which normally requires a fixed rate (typical 15 minutes) for load profiles and as simple as possible. Actually the data collection task adopted in SENSOR2AMI utilizes a very basic implementation of DLMS/COSEM protocol (essentially it requires only the energy counters data objects), which is expected to be available in all commercially available meters.
3.2.4 Scalability In terms of scalability, the local SENSOR2AMI HW/SW architecture and resources enable interfacing from few units up to several tents of meter devices (depending only on practical limits imposed by the G3-PLC channel bandwidth), by instantiating multiple instances of IAM-Reader process. This is confirmed by the performance indexes assessed in the ASM Terni trial, which reveal that minimal percentage of the system resources are currently used (few percent of CPU and less than 10% of memory usage).
3.2.5 Resulting benefits from push data model The currently implemented solution is based on a pull model for data item collection, where the DLMS/COSEM client running on the SENSOR2AMI concentrator continuously asks the meter devices for specific data objects containing the energy/power information needed for processing. The quantified benefit achieved by the FINESCE implementation is the increased speed of data processing. Compared with the pure polling approach in which the AMI host asks for data and waits until the response, the IAM Server pushes the most recent available data to
FINESCE D4.7 v.0.1
Page 20 (42)
the AI host. It halves the data traffic and eliminates unproductive waiting time. In terms of the data traffic, the achieved gain is equal to 50%. Even if this model has some undeniable advantages, because it can be applied to any DLSM meter - even those implementing minimal part of the protocol - and it allows an immediate detection of communication problem with meters, since all of them are continuously polled by the concentrator, it nevertheless implies higher data traffic and band usage over PLC. A possible further experimentation could be to implement and assess a push model either for data collection level, where directly the meters send information to the concentrator, without specific requests. The most recent definition of the DLMS/COSEM standard (2014) introduces the "push setup" interface class supporting the modeling of the data push operation: defined sets of data can be pushed by the meter to defined destinations, at a given schedule or event, using defined message formats and media. This model, which implies an adaptation to IAM-Reader process (it will change its nature from client to server), looks naturally matching the event-driven public/subscribe architecture of FIWARE ecosystem and it should maximize the bandwidth utilization over PLC. On the contrary, this new approach implies a more complex setup of the system and it is not immediate, because it needs the availability of the protocol upgrade by the manufacturers of energy meters (this will require time and probably not all devices will feature the push-mode operation). Also, some modified features to detect communication troubles with meters (examples timeout on expecting pushed data or extracting specific network status information from G3-PLC coordinator, etc...) should be implemented as well.
3.2.6 Remote maintenance By using VPN to access the SENSOR2AMI machine made available by of ASM Terni, it has been possible to have remote control both to G3-PLC coordinator and to the concentrator server, ensuring remote and secure monitoring of the operation of the system and allowing the performance of tuning / maintenance / upgrade operations, with great benefits in terms of efficiency and cost savings.
3.3 How the AMR2AMI solution contributes to improve DSO services The challenging objective of the WP4 is to collect the reading from the meter every 5 minutes. It could be really complex with the currently used meters. In order to deploy a 5 minutes near-real time reading the fastest way is usage of a meter with a modem GSM/GPRS. WP4 envisions two different time plans in order to experiment and operate the trial with the usage of different meters. The first meter selected for the implementation of the pilot is called Lennt P2. The manufacturer is Landis + Gyr. The main features of this meter are: • GSM/GPRS communication; • collection of the load profile curves every 15 minutes with the possibility of implementing
on-the-spot readings every 5 minutes; • partial integration in the Advanced Meter Management. • main conformities are CE Directive, IEC EN 62052-11, EN 50570 series The partial integration within the current AMM existing in ASM Terni makes faster and cheaper the starting phase of pilot experimentation.
FINESCE D4.7 v.0.1
Page 21 (42)
Figure 6 - LENNT P2 AS-E
At the time, a number of 8 P2 smart meters have been installed in the test site. With these meters WP4 collects the goal of reading in near real time (every 5 minutes). The following figure shows the architecture implemented for this type of meters.
The main critical issue of this solution is the need to use a GPRS modem for each meter. A large scale deployment of "GPRS smart meters" would be expensive and would require a large amount of SIM card.
Figure 7 - AMI architecture for P2 meters
The second model of meter under test in the trial site is ZXF. It is a smart meter, which provides load profile curves every 5 minutes. The main meter output interface for automatic readout is
FINESCE D4.7 v.0.1
Page 22 (42)
Ethernet. ZXF has a module that uses the DLMS protocol (Device Language Message Specification) according to IEC 62056 for data readout, service functions and parameterisation. The objective of DLMS is to use a common language for data exchange in the energy measurement and other sectors. In addition to end units such as devices, tariff units, etc., DLMS also concerns the interfaces, transmission channels and system software.
Figure 8 - E350 meter (left side) and ZXF module (right side)
E350 (also the ZXF) meters and DLMS protocol aren't integrated in the Advanced Meter Management of ASM TERNI. A new objective of WP4 has been therefore to deploy a new Automatic Meter Reading for near real-time reading for ZXFs. This issue has been archived by the new partners of the WP4 (IAM and FIPONET proposals). Specific G3-PLC modems have been used between meters and a central system. The main feature for G3-Powerline is the integration of smart metering into a reliable and cost-effective attractive communication infrastructure. G3-Powerline communication (G3-PLC) is the key technology for IP-based data communication via existing power line networks. A section of clusters in a typical urban environment consisting of family homes, solar energy production facilities and electrical vehicle chargers have been chosen to perform the field tests. The network topology of the G3-PLC access technology is constructed in a way that every meter will communicate with the distribution station via power lines. The network coordinator is installed in the distribution station. Each G3-PLC modem on the LV network has been connected by Ethernet to a smart meter that relays the measurement data across the network using the IP communication. At the time, 5 ZXF smart meters have been installed in the test site. With these meters WP4 achieves the following results:
• reading in near real time (every 5 minutes) by PLC; • usage of a Standard Protocol DLMS; • no interference between conventional PLC and G3-PLC.
Figure 9 depicts the architecture implemented for this type of meters.
FINESCE D4.7 v.0.1
Page 23 (42)
Figure 9 - AMI architecture for ZXF meters
The FINESCE solution increased the frequency of metering data (from 15 to 5 minutes). It makes possible the adoption of better efficient Demand Response Management schemes.
FINESCE D4.7 v.0.1
Page 24 (42)
4. Trial Results on Simulation In the context of the FINESCE project, and following the experiences that have been collected on the field in past years, the main objective of the trial experimentation is to realize and test a local energy marketplace with the specific purpose of reducing power losses due to the reverse power flow effect by aligning in near-real-time the energy demand with the energy production. The reverse power flow effect is mostly due to the high and growing presence of DER on the power distribution network and, in the field of Terni it is expected to continue to grow up to 40% of the total demand in next years. Voltage regulation and grid efficiency could both be obtained by employing Demand Response; if consumers are incited to use local power whenever and wherever possible, voltage from the PV plants could be regulated at the maximum admissible set-point, achieving grid efficiency and limiting currents in power line and consequently power losses. Furthermore, the higher the energy produced by PV plants is, the lower energy price becomes, and consumers are encouraged to use energy during these time periods. As a result, they have to participate in the Energy Marketplace in order to buy this cheap energy, generated locally. An aside consequence is that their consumption profile will be changed. Thereafter, they will have less need of energy when the production of PV plants will be low and less power will have to be supplied by the transmission network. In this way, power losses will decrease, leading to the conclusion that this is a real indicator to measure the participation of customers to the energy marketplace. The Simulator developed in task 4.5 lies in the core of the WP4 marketplace, most specifically in the Issue Detector Processor, and its objective is to provide key information to the Aggregator in order to issue a proper “Resolution Plan”. “Resolution plans” in energy market help DSO to achieve grid stability and minimize power flow/losses, and help Energy Retailers to maximize incomes from energy selling. Main information that will help to create “Resolution plans” is: Social Events, Weather forecasting, Metering Data, forecasting of production and consumption of energy, contracts and regulation. INP-SCILAB simulator is a critical component of the “Issue Detector Processor” module on the Terni Trial Site architecture, since it provides information about production and consumption of energy on near real time and provides as well a short-term prediction (between 1h and 24h). This section presents the methodology to develop the simulator and the results obtained off-line and online, highlighting its interaction with other GE’s in the e-marketplace.
4.1 Simulator in the Market Place architecture As said in the last section, INP Simulator is part of the DSE “Issue Detector Processor”, and depends on the information from the meters in the Trial Site and the Weather information. INP-SCILAB reads a .csv file created by Cosmos2SCILAB, containing the energy consumption and generation by every customer of Terni Grid and weather information including current temperature, maximum/minimum temperature, probability of rain and cloudiness. INP-SCILAB analyzes the data set; computes the unbalanced load flow in order to get the voltages drops (VD) and power losses (PL) of the current state of the grid and forecast the power consumption/production for the short-term (1h, 3h, 6h, 12h and 24h ahead). SCILAB2Orion has access to the results through two .csv files that contain the voltage drops, power losses and predictions for every customer in the grid. Figure 10 summarizes how INP-SCILAB interacts with the other GE’s.
FINESCE D4.7 v.0.1
Page 25 (42)
Figure 10 - INP-SCILAB Simulator in the E-Market Place (summarized version)
Therefore the INP-SCILAB is part of a DSE and was published in the FINESCE DSE Catalogue http://finesce.github.io/DSE.html?id=Issue_Detector_Processor_(Cosmos2SCILAB___INP-SCILAB___SCILAB2Orion_**)_. Next sections present a few examples of the integration of the simulator in the Terni Trial, including the power losses, voltage drops and consumption/generation prediction. Results were obtained from near real time applications in the cloud facilities offered by FIWARE.
4.2 Results on Power losses and Voltage drops computation The first part of the simulator corresponds to the Power losses and Voltage drops computation, in order to supply the near-real time information to the GE’s. This section details the methodology used in order to develop the first part of the simulator and the main results (extended version) can be found in Appendix - B.
4.2.1 Methodology As mentioned before, the main objective of this trial is to realize and test a local energy marketplace with the specific purpose of reducing power losses due to the reverse power flow effect. Those power losses are the main cause for the following main side effects: Technological and Economic:
• Losses in Energy Commercialization: power loss is not transactionable power in the market domain. This impacts all the actors of the energy marketplace;
• Reduced lifecycle of Grid Equipment: Reduction of power losses in the grid improves its lifecycle and consequently increases the level of QoS in energy provision. This impacts mainly the DSO;
Environmental: • Avoidable Carbon Footprint – carbon footprint, related to generation of “power loss”,
could have been avoided. This impacts all the actors of the energy marketplace. Voltage Drops have similar impact on the network and can create unbalances in the system, those voltage drops are less critical on transmission networks due to the voltage level. DSO can reduce voltage drops by reducing the reactive portion of the current, but it has a negative impact on the power losses that will increase. For that reason it is important to control both variables. Off-line simulations will be necessary especially at the beginning of the trial for the estimation of the power flows through the trial grid and of the power losses. This kind of information will be derived mainly by the using of topological data and of load profiles from Terni trial site In order to choose the correct methodology, it is important to know that the electric Distribution Systems are characterized by:
• Radial or weakly meshed structure, • Multiphase and unbalanced operation, • Unbalanced distributed load,
• Extremely large number of branches and nodes, • Wide-ranging resistance and reactance values.
All of these characteristics have to be considered, because traditional load flow calculation methods used for transmission systems, e.g. Newton-Raphson methods, fail to meet the requirements in performance and robustness aspects in the distribution system networks [16]-[18]. Additionally, WP4 Trial Site has dispersed generation nodes, which is another deviation from classic load flows for distribution networks. For that reason, Grenoble INP explored two methods, the classic balanced load flows and the unbalanced load flow algorithms. It was found that with just one matrix representing the bus-branch data, which is widely used by utilities; two matrices can be derived, representing the bus-injection to branch-current and the branch-current to bus-voltage. Both matrices are used for the unbalanced three-phase algorithm. An unbalance load flow takes into account the loads and generation on the different phases of the three-phase network. Figure 11 presents how WP4-Trial Site is configured. As it can be seen, many loads are connected to different phases. An unbalance load flow algorithm analyses and computes the current on every line.
Figure 11 - Three-phase Terni Network
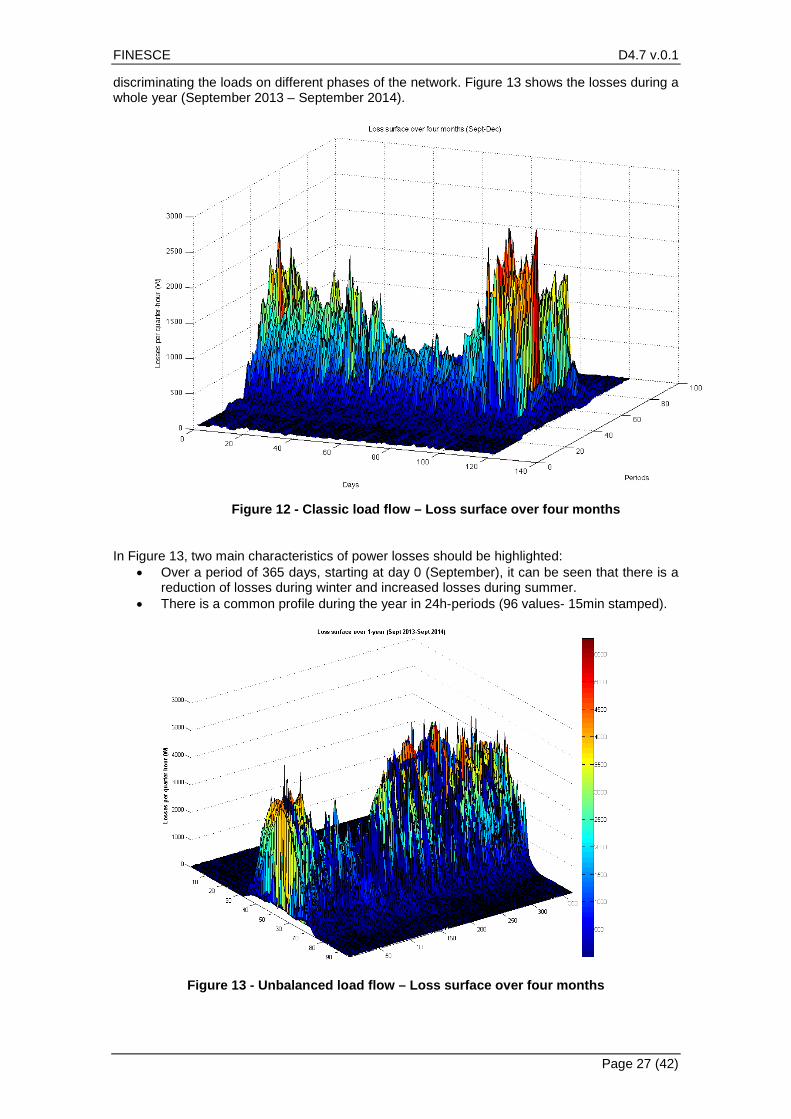
4.2.2 Results on Trial Site The proposed three-phase load flow algorithm was implemented on Scilab 5.5.1, and the simulation of 1-year of data (35040 values, 96 values per day) consumed 15 minutes. That means that every simulation took 25ms; which is very efficient for near real-time applications, such as WP4 Trial Site. Figure 12 presents the surface of losses in the Trial Site from September 2013 to December 2013, obtained at the beginning of the project, when a classic methodology was used, assuming balanced loads. However, because of the nature of the network and in order to develop an algorithm for future distribution networks, it was decided to apply an unbalanced load flow,
FINESCE D4.7 v.0.1
Page 27 (42)
discriminating the loads on different phases of the network. Figure 13 shows the losses during a whole year (September 2013 – September 2014).
Figure 12 - Classic load flow – Loss surface over four months
In Figure 13, two main characteristics of power losses should be highlighted:
• Over a period of 365 days, starting at day 0 (September), it can be seen that there is a reduction of losses during winter and increased losses during summer.
• There is a common profile during the year in 24h-periods (96 values- 15min stamped).
Figure 13 - Unbalanced load flow – Loss surface over four months
FINESCE D4.7 v.0.1
Page 28 (42)
Figure 14 - Unbalanced load flow – Hourly Mean and Max values
Figure 15 - Unbalanced load flow – Hourly Mean and Max values
FINESCE D4.7 v.0.1
Page 29 (42)
Power losses and voltage drops thresholds can be defined using results from off-line power flows, information very useful for the market, which will compare these thresholds with the real time values and the predicted values, which will give parameters for demand response functions. Figure 17 presents the Voltage Drops computed for the Trial Site. It can be seen that the trial site presents low voltage drops (less than 0,25%). However, as mentioned before, it is important to monitor the voltage drops when reducing the electric current flow or the consumed/produced power.
Figure 16 – Mean Voltage Drops
FINESCE D4.7 v.0.1
Page 30 (42)
4.3 Results on Power Consumption and Production short-term prediction Short-term forecasting plays an important role for an e-marketplace and the accuracy of the prediction may affect the operation of the distribution network, since its main objective is to bring information to balance the power supply and the demand, taking into account distributed energy sources and residential and industrial energy consumptions. There are many methods to perform short-term forecast, divided in two big families: Time-series methods [19] and Neural Networks [20]. For the purposes of this project, Grenoble INP developed an algorithm based on Support Vector Machines (SVM) a Time-series method, using the power consumed and produced in Terni Trial Site, the historical data of weather conditions and the prediction of weather conditions obtain from GE’s. Next sections will present the main methodology applied and the results obtained.
4.3.1 Methodology There exist many time series prediction techniques for real-world applications such as financial market prediction, electric utility load forecasting, weather and environmental state prediction. The underlying system models and time series data generating processes are generally complex for these applications and the models for these systems are usually not known a priori. ASM-Terni customers, including: commercial, domestic, industrial and office sectors have very different consumption and production patterns. This characteristic demanded a 1-year historic data in order to process and create a predictor model for their non-linear pattern. Support Vector Machine (SVM) is a novel machine learning approach that is able to accurately forecast time series data when the underlying system processes are typically non-linear, non-stationary and not defined a priori. The developed algorithm, presented in Figure 17, predicts the power consumption/generation, power losses and the voltages drops every hour, using the current grid values that are updated in in the .csv file from COSMOS2Scilab, the forecasted weather conditions, 1-year historical data and the near historical data (i.e. data from the last hours or weeks). Prediction is performed in three main parts:
1. Training: This step uses the historical data and creates a regression model. 2. Testing: This step uses the forecasted weather values and the regression model to
predict the energy consumption/generation. 3. Load flow: Using the algorithm presented in last section and the predicted values, the
power losses and voltage drops are computed for every predicted hour. The forecast model is evaluated by calculating the forecast error. This error is the difference between the actual and the predicted or forecasted value. For the sake of this simulator, the Mean Average Percentage Error (MAPE) was used as an accuracy indicator for the forecast model. MAPE is defined as:
∑=
−=
n
i i
ii
yyf
nMAPE
1
1
iy is the true value, if is the predicted value and n the number of values in the data set.
An extended explanation of this methodology is presented in Appendix - C.
FINESCE D4.7 v.0.1
Page 31 (42)
1-year Historical Load Data
1-year Historical PV Data
1-year Historical Weather
ConditionsData
Initial Training using historical
data
Initial Testing using historical
data
Good accuracy?
NO
Implement Regression Model
YES
Load/Generation Forecasting using Regression model
Real-time PV
Production
Real-time Users Loads
Real-time Weather
Conditions
Online Training
Send Forecasted Load/Generation
Figure 17 - Forecasting schematic algorithm
FINESCE D4.7 v.0.1
Page 32 (42)
4.3.2 Results on Trial Site Table 11 presents the main results concerning the accuracy of the model, for every user. As it can be seen, most of the predicted values have an acceptable error. As expected, a few users have high MAPE mostly because of the nature of their sector (User 15 – Residential and User 4 Commercial). This error can be reduced with a more experienced model, i.e. with more historical data.
MAPE Active Power
MAPE Reactive Power 1
MAPE Reactive Power 2
User 1 0,49% 0,61% - User 2 4,40% 6,57% 88,34% User 3 0,09% 0,31% 98,26% User 4 99,26% 99,25% - User 5 0,11% 0,71% 13,01% User 6 0,14% 3,56% 9,45% User 7 0,03% 0,02% - User 8 0,08% 0,05% 76,17% User 9 0,31% 0,08% - User 10 0,14% 0,20% - User 11 0,09% 0,14% - User 12 0,05% 12,60% 88,70% User 13 0,21% 54,78% 21,42% User 14 2,67% 76,96% 7,97% User 15 77,85% 98,14% 96,89% User 16 31,09% 58,24% - User 17 0,03% - 0,02% User 18 0,59% 0,37% - User 19 34,62% 34,60% -
Table 11- MAPE Results
The difference between the predicted and real values of some loads, including the multiple sectors, is presented from Figure 18 to Figure 25. As it can be seen, the developed algorithm is able to predict the future power consumption in the Trial Site with a good accuracy.
Figure 18 - Domestic User Active Power
Difference Real – Forecasted values
Figure 19 - Domestic User Reactive Power
Difference Real – Forecasted values
FINESCE D4.7 v.0.1
Page 33 (42)
Figure 20 - Commercial User Active
Power Difference Real-Forecasted values
Figure 21 - Commercial User Reactive
Power Difference Real-Forecasted values
Figure 22 - Industrial User Active Power
Difference Real-Forecasted values
Figure 23 - Industrial User Reactive Power
Difference Real-Forecasted values
Figure 24 - Office User Active Power Difference Real-Forecasted values
Figure 25 - Office User Reactive Power
Difference Real-Forecasted values
FINESCE D4.7 v.0.1
Page 34 (42)
5. Conclusions The main objective of WP4 was to design, implement and validate a trial site in the city of Terni (Italy) which will demonstrate how FI Core Platform (i.e. the set of FI-WARE Generic Enablers and its cloud-based infrastructure) can enable scalable yet effective operation of a near-real time virtual marketplace for energy. The field devices of WP4 have been installed and the task of reading in near real time (every 5 minutes) has been completed. This goal has been reached thanks two new models of smart meters, the first one is based on GPRS communication, the second one uses G3 PLC communication. Both are working on the field. Standard protocol is implemented inside GEs. Conventional AMI and new FINESCE AMI are working together and no interference has been fond (conventional PLC and G3 PLC are working together in the same LV grid). This aspect is an important test bed for the coexistence of different PLC in the same communication means. An API was defined and was integrated into the FINESCE API in order to let third parties and SMEs to interface with the trial infrastructure, in a consistent and a coherent manner, by providing risk-free recipes for using the FIWARE GEs and FINESCE DSEs in a structured and business-oriented manner. As well, a simulator was implemented on the market place and interacts with several WP4-GE’s developed during FINESCE Project. The main tasks of the simulator are: a) compute power losses and voltage drops of an unbalanced distribution network with the insertion of distributed energy sources, and b) Predict the power consumption and production of every user in the Trial Site, 1h, 3h, 6h, 12h and 24h ahead. The Emulation, Simulation and Evaluation task highlighted the importance of computing the power losses for a distribution network as decision factor for the Market Place, and it can be easily done with the interaction of GE’s and DSE’s, including the simulator developed. Many different information and communication technologies have been integrated into FIWARE e.g. G3-PLC, DLMS/COSEM smart meters, as well several DSE were developed in order to create an e-marketplace based in FIWARE. This deliverable has shown to what extend it is possible to apply those technologies in a real Trial Site.
FINESCE D4.7 v.0.1
Page 35 (42)
6. References [1] FINSENY Future Internet For Smart EnergY, http://www.fi-ppp-finseny.eu/ [2] L. Briguglio, F. Eichinger, M. Nigrelli, and J. L. Ruiz-Andino, “Marketplaces for energy
demand-side management based on future internet technology” 2013. [Online]. Available: http://arxiv.org/abs/1304.5346
[3] P. Palensky and D. Dietrich, “Demand side management: Demand response, intelligent energy systems, and smart loads” Industrial Informatics, IEEE Transactions on, vol. 7, no. 3, pp. 381–388, 2011.
[4] Y. Chen, Z. Huang, P.-C. Wong, P. Mackey, C. Allwardt, J. Ma, and F. Greitzer, “An advanced decision-support tool for electricity infrastructure operations” in Critical Infrastructure Protection IV. Springer, 2010, pp. 245–260.
[5] FIWARE LAB, the open innovation lab, https://www.fiware.org/lab/ [6] EU, “Commission task force for smart grids (2011), expert group 3: Roles and
responsibilities of actors involved in the smart grids deployment” 2011. http://ec.europa.eu/energy/gaselectricity/smartgrids/doc/expert group3.pdf
http://java.dzone.com/articles/exploring-message-brokers [10] RabbitMQ vs Kafka - http://www.quora.com/RabbitMQ/RabbitMQ-vs-Kafka-which-one-
for-durable-messaging-with-good-query-features [11] An Overview of Event Processing Software -
http://www.complexevents.com/2014/08/25/an-overview-of-event-processing-software/ [12] CDMI Server Implementations - http://www.snia.org/technology-communities/cloud-
storage-initiative/snia-cloud-technology-community/list-cdmi-server-imp [13] OAuth open standard to authorization - http://en.wikipedia.org/wiki/OAuth [14] Future Internet PPP. http://www.fi-ppp.eu [15] Apache2 License - http://www.apache.org/licenses/LICENSE-2.0 [16] J. Teng, “A Direct approach for distribution system load flow solutions,” IEEE
Transactions on Power Delivery, vol 18, no. 3, pp. 882-887, 2003. [17] C. Cheng and D. Shirmohammadi, “A three-phase power flow method for real-time
distribution system analysis,” IEEE Transactions on Power Systems, vol. 10, no. 2, pp. 671-679, 1995.
[18] R-M. Ciric, A. Padilha, L. Ochoa, “Power Flow in Four-wire distribution Networks-General Approach,” IEEE Transactions on Power Systems, vol. 18, no. 4, pp. 1283-1290, 2003.
[19] N. Sapankevych and R. Sankar, “Time Series Prediction Using Support Vector Machines: A Survey,” IEEE Computational Intelligence Magazine, vol. 4, no. 2, pp. 24-38, 2009.
[20] M. Simonov, M. Mussetta, F. Grimaccia, S. Leva and R. Zich, “Artificial Intelligence Forecast of PV Plant Production for Integration in Smart Energy Systems” International Review of Electrical Engineering (I.R.E.E.), vol.7, n.1, pp. 3454-3460, 2012.
[21] C.-C. Chang and C.-J. Lin, “LIBSVM: a library for support vector machines” ACM Transactions on Intelligent Systems and Technology.vol. 2, no. 3 2011.
[22] H.S. Hippert, C.E. Pedreira and R.C. Souza, Neural networks for short-term load forecasting: A review and evaluation. IEEE Transactions on Power Systems, vol. 16, n.16, pp. 44-55, 2001.
[23] B.-J. Chen, M.-W. Chang and C.-J. Lin, Load Forecasting Using Support Vector Machines: A Study on EUNITE Competition 2001, IEEE Transactions on Power Systems, vol. 19, no. 4, 2004.
7. List of Abbreviations AMI Advanced Metering Infrastructure AMM Advanced Metering Management API Application Programming Interface FI-PPP Future Internet Public Private Partnership FIWARE Future Internet Core Platform COSEM Companion Specification for Energy Metering COTS Commercial Off-The-Shelf products DLMS Device Language Message Specification DSE Domain Specific Enabler DSO Distribution System Operator GE Generic Enabler GPL General Public License IoT Internet of Things MAPE Mean Average Percentage Error QoS Quality of Service SCILAB Scientific Laboratory SVM Support Vector Machines
FINESCE D4.7 v.0.1
Page 37 (42)
Appendix - A List of Publications Title Authors Status Category "Computing the Energy and the Momentum in Smart Grid," Industrial Electronics Society, IECON 2014 - 40th Annual Conference of the IEEE , pp. 1-6
"Symplectic numeric integration for coarse-grained event-driven electricity metering", IEEE Power Electronics Society, ISGT 2014, pp.1-5
M. Simonov Published Conference paper
“Smart Meters using the Architecture of Future Internet”, IEEE Powertech-2015 Int.l Conf., 2015, pp-1-6
M. Simonov, G. Daltoè, G. Zanetto, R. Conti
Published Conference paper
“Knowledge Representation for Event-Driven Metering”, CISIS-2015 Int.l Conf., 2015, pp. 1-6,
M. Simonov, G. Chicco, G. Zanetto
Published Conference paper
“Event-based hybrid metering feeding AMI and SCADA”, 1st IEEE EBCCSP-2015 conference, 2015, pp.1-8
M. Simonov, G. Zanetto
Published Conference paper
“Underlying concepts for event-driven energy metering”, 1st IEEE EBCCSP-2015 conference, 2015, pp.1-8,
M. Simonov, G. Chicco
Published Conference paper
FINESCE D4.7 v.0.1
Page 38 (42)
Appendix - B Load Flow algorithm The load flow or power flow computer program is a basic tool that analyses the flow of electric power (active and reactive) in a power grid, either at the transmission or distribution level. Load flow focuses on various aspects of power systems, such as voltage magnitudes, currents, voltage angles at each bus, real power and reactive power. It analyzes the three-phase power systems in normal steady-state conditions. Performing a load flow study on an existing system provides insight about the system operation and optimization of control settings to obtain maximum capacity while minimizing the operating costs. For instance, when planning new distribution grids, adding new customers or fixing voltage problems the total system losses, individual line losses and voltage drops can be calculated. The load flow is formulated as a set of nonlinear algebraic equations that represent the power grid. The starting point for a load flow is a single-line diagram of the power system, from which the bus data, transmission line characteristics (cable conductor resistance R and reactance X), transformer characteristics, distributed generation power and customers consumptions. Usually, for transmission grids a Newton-Raphson algorithm is used to compute load flows. Newton-Raphson is an efficient algorithm to find a numerically accurate approximation of a series of nonlinear equations. However, unbalanced and radial nature of distribution grids demands other type of algorithms. Unbalance loads means that load are connected to different phases in a three-phase system, creating an unbalance in the grid and that can cause more voltage drops because of higher loop impedance and higher current on the loaded phases. Therefore, a direct approach for distribution system load flow was applied; this approach was developed for unbalanced three-phase distribution grids, where the only input data is the conventional bus-branch oriented data. The main algorithm is divided in 6 steps: STEP 1: Creation of Zabcn bus according to equation (1), in this matrix the different matrices should be taken into account.
[ ]
=
nnncnbna
cncccbca
bnbcbbba
anacabaa
abcn
ZZZZZZZZZZZZZZZZ
Z (1)
STEP 2: The initial voltage is equal to the root node voltage, according to equation (2)
Figure 26 - Three-phase line section [16]
FINESCE D4.7 v.0.1
Page 39 (42)
⋅⋅
⋅⋅
=
⋅
⋅
0
32
2
32
refjj
refjj
ref
in
ic
ib
ia
Vee
Vee
V
VVVV
π
π
(2)
STEP 3: Bus-injection to branch current matrix (BIBC) is created, according to the network to be analyzed. This matrix is an upper triangular matrix that takes into account the current injections in the system, and contains values of 0 or 1. STEP 4: Definition of branch currents (B) according to equation (3): [ ] [ ] [ ]IBIBCB ⋅= (3) Where:
[ ]*
ki
iiki
VjQPI
+= (4)
Pi and Qi are the active and reactive power produced/generated by customers. STEP 5: Definition of Branch-Current to Bus-Voltage using to Z matrix. STEP 6: Voltage drops can be calculated using the BIBC matrix, see equation (5): [ ] [ ] [ ]BBIBCV ⋅=∆ (5) The solution for the load flow is obtained after solving equations (4), (5) and (6) iteratively. [ ] [ ] [ ]101 ++ ∆+= kk VVV (6) k is the iteration number. The iteration is finished when the difference between the voltage drop at iteration k and k+1 is less than a certain value, for our case 0,001. This algorithm is based on the paper “A direct approach for distribution system load flow solutions” Jen-Hao Teng. IEEE Transactions on Power Delivery, vol. 18, no. 3, 2003. It was developed in SCILAB and the code (loadFlow_INP.sce) can be downloaded from GitHub (http://finesce.github.io/DSE.html?id=Issue_Detector_Processor_(Cosmos2SCILAB___INP-SCILAB___SCILAB2Orion_**)_
Appendix - C Prediction Algorithms There exist many time series prediction techniques for real-world applications such as financial market prediction, electric utility load forecasting, weather and environmental state prediction. The underlying system models and time series data generating processes are generally complex for these applications and the models for these systems are usually not known a priori. ASM-Terni customers, including: commercial, domestic, industrial and office sectors have very different consumption and production patterns. This characteristic demanded a 1-year historic data in order to process and create a predictor model for their non-linear pattern. Support Vector Machine (SVM) is a novel machine learning approach that is able to accurately forecast time series data when the underlying system processes are typically non-linear, non-stationary and not defined a priori, such as the data sets retrieved from Terni Site customers. This appendix presents the main algorithm for prediction purposes, using SVM methodology on a Virtual Machine, using Lib-SVM library. Package Lib-SVM is a third-user library for Support Vector Machines and one of the most used software [21]. This package includes the training data set that is developed to obtain a regression model, and the testing data set that allows obtaining the predict information using the regression model. This library has many options to perform the prediction, including:
• -s Svm_type: which could be c-svc, nu-SVC, one-class SVM, epsilon-SVR and nu-SVR. • -t Kernel_type: Defines the type of kernel to be used, there are four options:
o 0: linear u’*v o 1: Polynomial d
ji cxx +∗∗j
o 2: Radial Basis Function
−∗− 2vu
ej
o 3: Sigmoid ( )Cvutqnh +′j .
• -c Cost • -g Gamma j for the Kernel function • -p epsilon
Based on the experience from other users and many tests on the data set obtained from Terni Trial Site, it was decided to use the epsilon-SVR regression and the Radial Basis Function (RBF) as the kernel function. Input data set was chosen based on experience from other projects [22]-[23] and tested for Terni Trial data. Table 12 presents the variables used for training and testing the data sets.
Variables Min Value Max Value Hour 0 23 Day/Night 0 1 Week of the year 1 53 Day of the week 1 7 Weekday 0 1 Weather Season 0 1 Temperature -10 40
Table 12 - Prediction model formation
The process of choosing the variables and creating the model is the most important and time-consuming, for that reason it was created a code to perform grid search, which basically tested different SVM parameters, for different input variables, for every user in the Terni Trial Site. Best
FINESCE D4.7 v.0.1
Page 41 (42)
parameters were those that best fit the relationship between the variables and the predicted variables, i.e. power consumption and generation. Results were validates using WEKA software, which is a free-license and open source tool that contains codes for data pre-processing, classification, regression, clustering and visualization. Figure 27 presents the general algorithm developed to obtain the short-term prediction of Consumption and Generation for 1h, 3h, 6h, 12h and 24h ahead.
Figure 27 - Prediction algorithm
Finally, in order to training results it is of paramount importance to select an accuracy measure according to the data sets. Accuracy measures are based mainly on the true value iy , the
FINESCE D4.7 v.0.1
Page 42 (42)
predicted value if and the number of values in the data set n . There are many accuracy measures, some of them are:
• Root Mean Square Error (RMSE) is given by (8)
( )∑=
−=n
iii yf
nRMSE
1
21 (7)
• Mean Absolute Error (MAE) is given by (8)
∑=
−=n
iii yf
nMAE
1
1 (8)
• Mean Percentage Error (MPE) is given by (9)
∑=
−=
n
i i
ii
yyf
n%MPE
1
100 (9)
• Mean Absolute Percentage Error (MAPE) is given by (10)
∑=
−=
n
i i
ii
yyf
nMAPE
1
1 (9)
Developed codes include many of these accuracy measures, but it was decided to use the MAPE because it is easy to compare the results, because it offers values between 0 and 1, were 0 means perfect fit. Prediction algorithm implemented in SCILAB and the code (predictor_INP.sce) can be downloaded from GitHub site, as well, Lib-SIM package can be downloaded for SCILAB. (http://finesce.github.io/DSE.html?id=Issue_Detector_Processor_(Cosmos2SCILAB___INP-SCILAB___SCILAB2Orion_**)_