31
Fiji Visitors Bureau Marketing Summit February 2006 Namale Resort
| Date post: | 18-Dec-2015 |
| Category: |
Documents |
| Upload: | lily-green |
| View: | 215 times |
| Download: | 1 times |
Fiji Visitors BureauMarketing Summit
February 2006
Namale Resort

A look at weddings and MICE from the Australian marketplace

Topics for today
2004 International Visitor Survey
Key performance measures for Australia
2005 presentation by Tebbutt Research on Friday 10th February
in Nadi @ Tanoa International
Fiji Visitors Bureau research projects
MICE
Weddings

Visitors
2004 was a 16.1% increase in visitors on 2003
A 15.2% increase in ‘person days’
Most improved countries are
New Zealand up 32.3%
Canada up 19.8%
Australia up 18.5%
USA up 14.2%
Australia and New Zealand make up 52.4% of
all visitors

Travel group
0%
10%
20%
30%
40%
50%
60%
AUS 18% 2% 10% 2% 15% 53%
NZ 17% 4% 9% 1% 16% 53%
USA 29% 0% 11% 2% 3% 55%
Self Alone Other Composition Self And Friend Self And Children Self, Partner And
Children Self And Partner

How the booking was made
0%
10%
20%
30%
40%
50%
60%
70%
80%
90%
AUS 81% 7% 1% 4% 3% 1% 1% 2%
NZ 83% 7% 1% 4% 3% 1% 1% 0%
USA 61% 14% 3% 16% 4% 1% 1% 0%
Travel Agent Direct With
Hotel No Booking
Made Internet Airline
Hotel Booking Service
Relatives In Fij i
Other

Reasons for visiting
Two questions
Main reason for your
visit
Holiday
Business
Conference
Education/training
VFR
Other
When the answer is
‘holiday’, what type of
holiday
Rest and relaxation
Honeymoon
Wedding
Wedding anniversary
Sports
Other

Expenditure by ‘main reason for visiting
Total expenditure Australia RatioTotal $ 602,813,051 $ 234,358,364 39%Holiday 543,948,302$ 220,466,302$ 41%Business 28,223,434$ 5,650,929$ 20%Conference 9,721,394$ 3,530,111$ 36%Education/training 3,014,503$ 830,459$ 28%VFR 9,702,710$ 3,337,059$ 34%Other 8,202,707$ 543,505$ 7%
Total average expenditure Australia Ratio
Average $ 1,396.45 $ 1,568.89 112%Holiday 1,433.66$ 1,593.99$ 111%Business 1,557.66$ 1,043.61$ 67%Conference 1,411.35$ 1,493.86$ 106%Education/training 1,624.94$ 1,344.89$ 83%VFR 1,035.77$ 1,182.04$ 114%Other 443.05$ 247.20$ 56%

Expenditure by ‘type of holiday’
Total expenditure Australia RatioTotal 543,948,302$ 220,466,302$ 41%Rest and relaxation 408,881,461$ 160,121,308$ 39%Honeymoon 87,220,186$ 46,574,588$ 53%Wedding 9,456,986$ 8,354,740$ 88%Wedding anniversary 265,416$ 0%Sports 27,637,014$ 672,517$ 2%Other 10,487,239$ 4,743,179$ 45%
Total average expenditure Australia Ratio
Average holiday 1,433.66$ 1,594$ 111%Rest and relaxation 1,356$ 1,514$ 112%Honeymoon 1,925$ 2,032$ 106%Wedding 1,530$ 1,281$ 84%Wedding anniversary 1,891$ -$ 0%Sports 2,251$ 1,918$ 85%Other 1,144$ 1,737$ 152%
MICEMeetingsIncentivesConferencesExhibitions

A work in progress…
Previous research completed in 2001
2006 qualitative stage completed
A ‘first look’ at findings
Quantitative stage to complete
Issues will be quantified
The outcome of this research is to
provide a ‘roadmap’ for further
development of the Fijian MICE
market.
Allows efficient, economical, relevant and on-target
promotion of Fiji to PCOs
Definitions; PCO / DMC / BDM
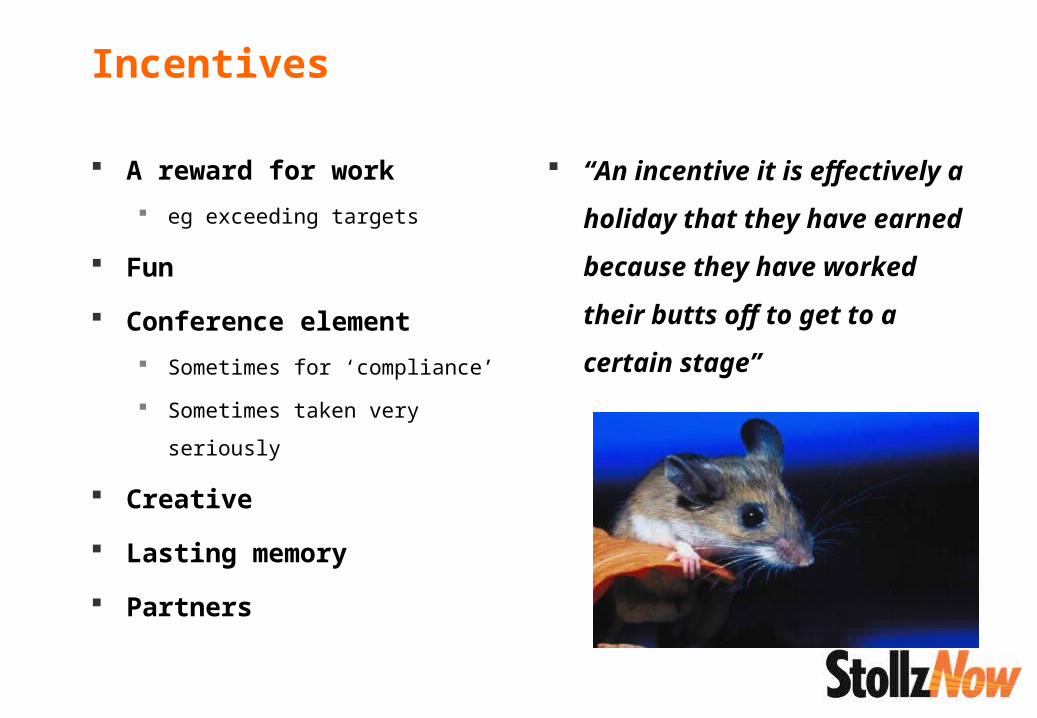
Incentives
A reward for work
eg exceeding targets
Fun
Conference element
Sometimes for ‘compliance’
Sometimes taken very seriously
Creative
Lasting memory
Partners
“An incentive it is
effectively a holiday that
they have earned
because they have
worked their butts off to
get to a certain stage”

Conferences
Much more complex and
challenging than incentives
Tend to be larger
Serious business
All day
Tight timing
Delegates from everywhere
Equipment
Break-out spaces
Interesting food
Easy access to food
Quality wine list
Service, service, service,
service

What must a destination/property offer?
Safety
High quality audio visual Staging Connections critical to success
Service
Excitement
Business services Data projector
Good sound
Sound proof rooms
Broadband internet
Photocopier
Airlines Quality and schedule
Activities

Issues for PCOs
Safety
Paramount
Budgets
Everyone is pressured
Destinations
Flight schedules
Conference delegates come
from many places

Issues for Fiji
Lack of PCO confidence
Little things not right in quotes
Lack of follow up on quotes What will happen at the event?
“Sometimes I don't think they see
the big picture and the importance
of the group in the hotel”
Activities
“Twenty pages of the same things”
Limited shopping
Limited spas
Limited partner activities
Political stability
Recent cancellation of groups
Safety is paramount Can’t lose key executives
Food & beverage
Not exciting
Never Indian food PCOs wonder why?

Issues for Fiji
Service levels
Feel these are lower than they
should be
Want ‘snappy service’ …but still like Fiji relaxation
Expensive destination
Perceived high cost of
accommodation
PCOs hoped Denarau development
would lead to lower costs
Island economy can’t be the same
as Asia…but that is the competition

Opportunities for Fiji
Be hungry for business Can’t follow up too often
Aggressive sales
Ask; why did we lose this
event?
Promotional items Small promo pieces for building
excitement These can be charged for
Lots of pictures High quality / high resolution
Important for PCOs and their clients
Sell the experience Activities that integrate into
community
Be careful that events don’t feel
‘manufactured’
PCO famils “Make sure you do your
homework and abide by the
‘Golden Rule’ – never select a
venue without having seen it in
person!” Main Event February 2006

Situation
Fiji not ‘on the map’ in 2001
In 2006 Fiji is a serious
player
Asian safety issues have helped
Room to grow and prosper
…also room to lose business to Asia
FVB known and respected
Plant in place
Key deliverables in place

Weddings

Some statistics on marriage from Australia
In Australia in 2004 $4.5
billion was spent on
weddings.
Average wedding spend is $36,234
This figure has grown by 19% since
2001
Source Cost of Love, Bride to Be
In 2003 there were 106,400
marriages in Australia
Source ABS

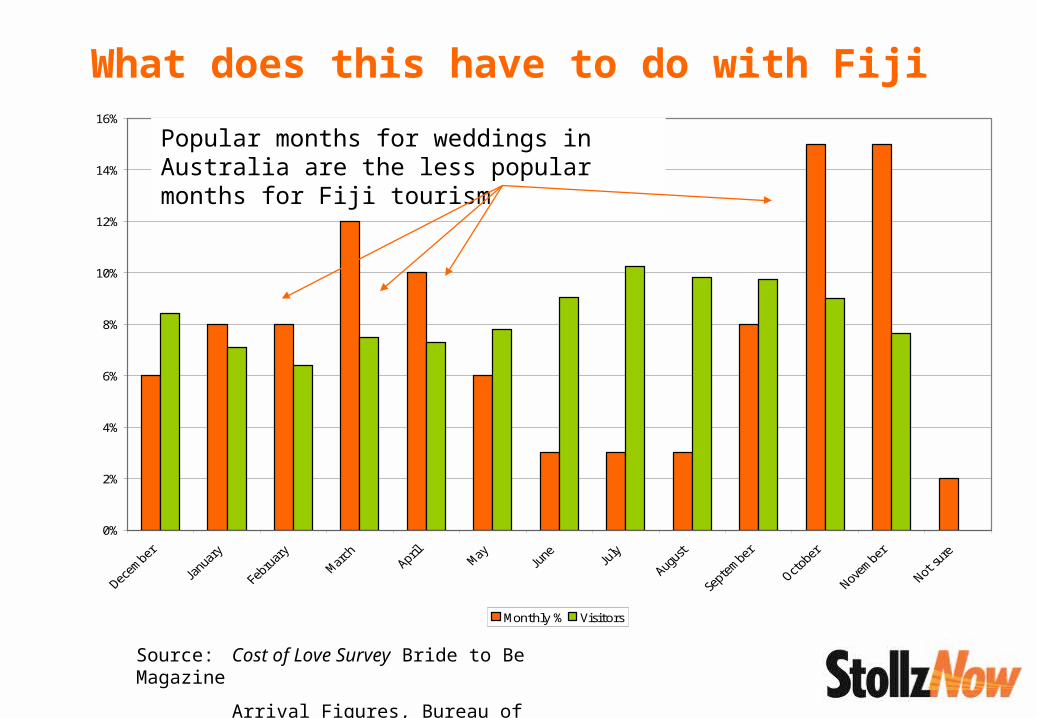
What does this have to do with Fiji
Source: Cost of Love Survey Bride to Be Magazine
Arrival Figures, Bureau of Statistics (Fiji)
0%
2%
4%
6%
8%
10%
12%
14%
16%
Monthly % Visitors
What does this have to do with Fiji
Source: Cost of Love Survey Bride to Be Magazine
Arrival Figures, Bureau of Statistics (Fiji)
0%
2%
4%
6%
8%
10%
12%
14%
16%
Monthly % Visitors
Popular months for weddings in Australia are the less popular months for Fiji tourism

Why go overseas?
Avoid the hassles
Simple and easy
Organised for you
Organising a wedding is usually
very time consuming
Lots of meetings
Avoid people
The extended family
Dubious friends
Hangers on
Its much cheaper
Average cost Bride to Be
$36,000
Average cost respondents
$16,000
No pressure
No compromises

Who comes / who pays?
Who comes
Close family
Real friends
The unvitation
Who pays
Bride and groom pay for close
family
Friends and others pay for
themselves

How a destination is chosen
Previous visit
Particularly if seen a wedding
Offered as a service by
properties
Easy to understand package
Internet is critical
Las Vegas very successful
Many bypassing travel agents
completely
An independent spirit
No one used Bridal Shows
No one used bridal magazines
Bridal Shows successful for Fiji,
Is there a huge untapped market
All research participants
avoided travel agents
All booking done online
NB: Qualitative research
is not representative

What can we learn from this?

Key findings
MICE and weddings require special
services
Can’t be an afterthought
Are these markets for you?
Both need special attention and focus
Incentives the entry point to MICE
Conferences more demanding
Can you support a conference?
Unsuccessful MICE events can be damaging to your
reputation

Contact details
Neil Stollznow
PO Box 16
Level 2/156 Military Rd
Neutral Bay NSW 2089
T +61 2 9953 7543
F +61 2 9953 7563
M +61 412 200 235
www.stollznow.com.au


