1 MANAGEMENT’S DISCUSSION AND ANALYSIS OF FINANCIAL CONDITION AND RESULTS OF OPERATIONS You should read the following discussion and analysis of our financial condition and results of operations for the three months ended 30 June 2011 and 2010 together with our unaudited consolidated interim condensed financial information as of and for the three months ended 30 June 2011. The unaudited consolidated interim condensed financial information has been prepared in accordance with International Accounting Standard 34, Interim Financial Reporting. This consolidated interim condensed financial information should be read together with the audited consolidated financial statements for the year ended 31 December 2010 prepared in accordance with International Financial Reporting Standards (IFRS). The financial and operating information contained in this “Management’s Discussion and Analysis of Financial Condition and Results of Operations” comprises information of OAO “NOVATEK” and its consolidated subsidiaries (hereinafter jointly referred to as “we” or the “Group”). OVERVIEWWe are Russia’s largest independent natural gas producer and the second-largest producer of natural gas in Russia after Gazprom, in each case according to the Central Dispatch Administration of the Fuel and Energy Complex (the “CDU-TEK”) for the respective 2011 and 2010 reporting periods. In terms of proved natural gas reserves, we are the second largest holder of natural gas resources in Russia after Gazprom, under the Petroleum Resources Management System (“PRMS”) reserve reporting methodology. Our exploration, development, production and processing of natural gas, gas condensate and crude oil have been conducted primarily within the Russian Federation, and in accordance with Russian law, we sell our natural gas volumes exclusively in the Russian domestic market. We export our stable gas condensate directly to international markets, while our liquefied petroleum gas (“LPG”) and crude oil are generally delivered to both international (including CIS) and domestic markets. RECENT DEVELOPMENTSIn June 2011, the Group took part in a tender organized by the Federal Agency of Mineral Resources for four licenses in the Yamal Nenets Autonomous Region ( “YNAO”). The tender included exploration and development licenses for the Utrenniy (Salmanovskiy) and Geofizicheskiy license areas, which have estimated recoverable reserves, according to the Russian reserve classification category C1+C2, of 979 billion cubic meters of natural gas and 46 million of liquid hydrocarbons as well as exploration and production licenses for the North-Obskiy and East-Tambeyskiy license areas, which have combined resources, according to the Russian reserve classification D1+D2, of 1,763 billion cubic meters of natural gas and 221 million tons of liquid hydrocarbons. The minimum bid which we paid for the licenses amounted to RR 6.9 billion. A final resolution regarding the outcome of the above license areas will be taken by the Russian government at the end of the third quarter 2011. In June 2011, we dispatched a consignment of stable gas condensate to China via the Northern Sea Route (“NSR”) using a new route north of the New Siberian Islands making us the first company to utilize the NSR in the 2011 navigational period, and we plan to ship six or seven cargos of stable gas condensate, produced by the Purovsky Gas Condensate Plant (“Purovsky Plant”), to markets in the Asian-Pacific region via the NSR in 2011. In September 2010, we organized the historic voyage of a high-tonnage tanker which travelled from the Russian port of Murmansk to the Chinese port of Ningbao, via the NSR, in just 22 days, approximately half the time required by the traditional shipping route through the Suez Canal. The use of the NSR for hydrocarbon transportation is an integral part of our logistical strategy to develop prospective fields in the Yamal peninsula. Our ongoing exploration work at existing fields in the second quarter 2011 resulted in the discovery of two new gas condensate deposits at the Severo-Khancheyskiy license area and two new oil deposits at the East- Tarkosalinskoye field. In February 2011, the Group issued a debut Eurobond in an aggregate amount of USD 1,250 million. The bond was issued at par in two tranches, a five-year USD 600 million bond with a coupon rate of 5.326 percent per annum and a ten-year USD 650 million bond with a coupon rate of 6.604 percent per annum. The proceeds from the Eurobonds were used to repay a bridge facility and a portion of the costs associated with the acquisition ofOAO “Sibneftegas” (“Sibneftegas”).
MANAGEMENT’S DISCUSSION AND ANALYSIS OF FINANCIAL CONDITION
AND RESULTS OF OPERATIONS
You should read the following discussion and analysis of our financial condition and results of operations for the
three months ended 30 June 2011 and 2010 together with our unaudited consolidated interim condensed financial
information as of and for the three months ended 30 June 2011. The unaudited consolidated interim condensed
financial information has been prepared in accordance with International Accounting Standard 34, InterimFinancial Reporting. This consolidated interim condensed financial information should be read together with the
audited consolidated financial statements for the year ended 31 December 2010 prepared in accordance with
International Financial Reporting Standards (IFRS).
The financial and operating information contained in this “Management’s Discussion and Analysis of Financial
Condition and Results of Operations” comprises information of OAO “NOVATEK” and its consolidated
subsidiaries (hereinafter jointly referred to as “we” or the “Group”).
OVERVIEW
We are Russia’s largest independent natural gas producer and the second-largest producer of natural gas in
Russia after Gazprom, in each case according to the Central Dispatch Administration of the Fuel and Energy
Complex (the “CDU-TEK”) for the respective 2011 and 2010 reporting periods. In terms of proved natural gasreserves, we are the second largest holder of natural gas resources in Russia after Gazprom, under the Petroleum
Resources Management System (“PRMS”) reserve reporting methodology.
Our exploration, development, production and processing of natural gas, gas condensate and crude oil have been
conducted primarily within the Russian Federation, and in accordance with Russian law, we sell our natural gasvolumes exclusively in the Russian domestic market. We export our stable gas condensate directly to
international markets, while our liquefied petroleum gas (“LPG”) and crude oil are generally delivered to both
international (including CIS) and domestic markets.
RECENT DEVELOPMENTS
In June 2011, the Group took part in a tender organized by the Federal Agency of Mineral Resources for four
licenses in the Yamal Nenets Autonomous Region (“YNAO”). The tender included exploration and development
licenses for the Utrenniy (Salmanovskiy) and Geofizicheskiy license areas, which have estimated recoverable
reserves, according to the Russian reserve classification category C1+C2, of 979 billion cubic meters of natural
gas and 46 million of liquid hydrocarbons as well as exploration and production licenses for the North-Obskiy
and East-Tambeyskiy license areas, which have combined resources, according to the Russian reserve
classification D1+D2, of 1,763 billion cubic meters of natural gas and 221 million tons of liquid hydrocarbons.
The minimum bid which we paid for the licenses amounted to RR 6.9 billion. A final resolution regarding the
outcome of the above license areas will be taken by the Russian government at the end of the third quarter 2011.
In June 2011, we dispatched a consignment of stable gas condensate to China via the Northern Sea Route
(“NSR”) using a new route north of the New Siberian Islands making us the first company to utilize the NSR in
the 2011 navigational period, and we plan to ship six or seven cargos of stable gas condensate, produced by the
Purovsky Gas Condensate Plant (“Purovsky Plant”), to markets in the Asian-Pacific region via the NSR in 2011.
In September 2010, we organized the historic voyage of a high-tonnage tanker which travelled from the Russian
port of Murmansk to the Chinese port of Ningbao, via the NSR, in just 22 days, approximately half the time
required by the traditional shipping route through the Suez Canal. The use of the NSR for hydrocarbon
transportation is an integral part of our logistical strategy to develop prospective fields in the Yamal peninsula.
Our ongoing exploration work at existing fields in the second quarter 2011 resulted in the discovery of two new
gas condensate deposits at the Severo-Khancheyskiy license area and two new oil deposits at the East-
Tarkosalinskoye field.
In February 2011, the Group issued a debut Eurobond in an aggregate amount of USD 1,250 million. The bond
was issued at par in two tranches, a five-year USD 600 million bond with a coupon rate of 5.326 percent per
annum and a ten-year USD 650 million bond with a coupon rate of 6.604 percent per annum. The proceeds from
the Eurobonds were used to repay a bridge facility and a portion of the costs associated with the acquisition of
In December 2010, the Group acquired 51 percent of the outstanding ordinary shares of Sibneftegas, an oil and
gas company, which holds exploration and production licenses for the development of oil and gas condensate at
the Beregovoye, Pyreinoye, Zapadno-Zapolyarnoye and Khadyryakhinskoye fields located in the YNAO.
Sibneftegas’ proved reserves, appraised by “DeGolyer and MacNaughton” (“D&M”) under the Securities and
Exchange Commission (SEC) and PRMS reserves methodologies, as of 31 December 2010, totaled
approximately 200 billion and 282 billion cubic meters of natural gas and 0.7 million and 2.0 million tons of
liquid hydrocarbons, respectively.
In December 2010, the Group acquired 100 percent of the outstanding ordinary shares of
OOO “Yamalgasresource-Chelyabinsk”, a regional gas trader, to expand natural gas sales in the Chelyabinsk
Region. The company was renamed, OOO “NOVATEK-Chelyabinsk”, in February 2011.
In July 2010, we created a 50/50 joint venture, OOO “Yamal Development” (“Yamal Development”), withOAO “Gazprom Neft” to jointly develop potential hydrocarbon assets in the YNAO. In November 2010, Yamal
Development acquired a 51 percent participation interest in OOO “SeverEnergia” (“SeverEnergia”).
SeverEnergia holds 100% of the shares of OAO “Arctic Gas”, ZAO “Urengoil Inc.” and
OAO “Neftegaztechnologia”, which hold licenses for the development of oil and gas condensate fields in the
YNAO. SeverEnergia’s proved reserves as appraised by D&M under the SEC and PRMS reserves
methodologies, as of 31 December 2010, totaled approximately 224 and 245 billion cubic meters of natural gasand 39 and 42 million tons of liquid hydrocarbons, respectively.
In October 2010, we launched the third stage of the second phase development at our Yurkharovskoye field,
which includes two additional processing trains for separating natural gas, thus increasing the field’s annual
productive capacity to approximately 33 billion cubic meters of natural gas and approximately three million tons
of unstable gas condensate.
In September 2010, the Group disposed of its 100 percent participation interest in OOO “NOVATEK-Polymer”,
a non-core subsidiary representing the segment “polymer production and marketing”, to JSC SIBUR Holding.
In August 2010, we acquired 100 percent of the outstanding ordinary shares of “Intergaz-System Sp.z.o.o.”
(“Intergaz-System”), an LPG trader located in the South-East of Poland, and in December 2010 it was mergedwith our wholly-owned Polish subsidiary “Novatek Polska Sp.z.o.o.” (“Novatek Polska”). Intergaz-System owns
and operates a discharging and transhipment facility at the wide track (Russian) and narrow track (European)
railroad junction. The acquisition enables us to continue developing our commercial activities within Poland andother European countries.
In August 2010, we launched an unstable gas condensate de-ethanization facility at our Yurkharovskoye field
and completed the unstable gas condensate pipeline connecting the Yurkharovskoye field to the Purovsky Plant.
The launch of this infrastructure allows us to process and transport all of the unstable gas condensate produced at
the Yurkharovskoye field to the Purovsky Plant without utilizing third party facilities.
In July 2010, the Group acquired 100 percent of the outstanding ordinary shares of OAO “Tambeyneftegas”, an
oil and gas company, which holds the license for exploration and development of the Malo-Yamalskoye field
(license expiry date 2019) located in the southern part of the Yamal peninsula, in the YNAO, with estimated
natural gas and gas condensate reserves according to Russian reserve classification categories C1+C2 of
161 billion cubic meters and 14.4 million tons, respectively.
In May 2010, we established a wholly-owned subsidiary, OOO “NOVATEK Perm”, to support the Group’s
current natural gas deliveries to the Perm region, as well as to expand potential sales opportunities in the region.
CERTAIN FACTORS AFFECTING OUR RESULTS OF OPERATIONS
Current financial market conditions
The economic events that have negatively impacted the domestic and global capital markets over the past couple
of years have somewhat receded despite isolated economic uncertainties in several European countries and the
possibility of a credit default in the USA due to the inability to raise the debt ceiling caused by bi-partisan
political negotiation. As a result, this uncertainty may continue to negatively affect all borrowers by limitingaccess to capital markets, despite the financial markets willingness to price recent transactions.
Prior to the publishing of this financial information, the US government has agreed on a compromise plan to
increase the debt ceiling and other fiscal measures. Unfortunately, on 5 August 2011, Standard & Poor’s
downgraded the US long-term debt rating from AAA to AA+, which has significantly increased market volatility
across all markets.
We will continue to monitor the credit situation very closely and take various measures, we deem necessary, to
ensure the integrity of our financial condition and mitigate counter-party credit exposure from our natural gas
and liquid hydrocarbon sales. In addition, we continue to take proactive steps to ensure the safety of our excess
funds deposited with both domestic and international banks, as well as limit our risk exposure from prepayments
to various service providers. Presently, our cash and deposits are diversified and maintained in banks that we
believe are well capitalized in accordance with international capital adequacy rules.
We have reviewed our capital expenditure program for the remainder of 2011 and have concluded that we have
sufficient liquidity, through current internal cash flows and short-term borrowing facilities, to adequately fund
our core natural gas business operations and planned capital expenditure program.
Management will continue to closely monitor the economic environment in Russia, as well as the domestic and
international capital markets to determine if any further corrective and/or preventive measures are required tosustain and grow our business. In addition, we will continue to assess the trends in the capital markets for
opportunities to access long-term funding at a reasonable cost to the Company commensurate with our
investment grade credit ratings and our capital requirements.
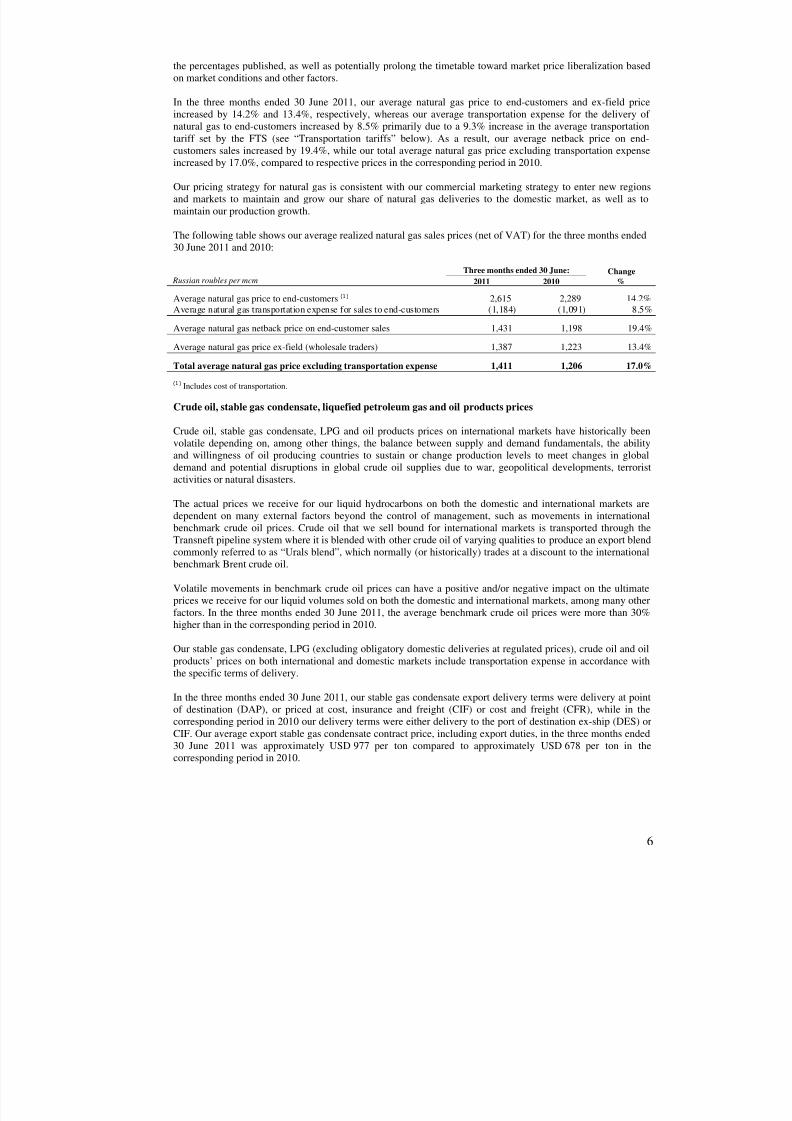
Natural gas prices
As an independent natural gas producer, we are not subject to the Russian government’s regulation of natural gas
prices. Historically, we have sold most of our natural gas at prices higher than the regulated prices set by the
government for Gazprom’s domestic gas sales, although the prices we can achieve on the domestic market are
strongly influenced by the prices regulated by the Federal Tariffs Service (FTS), a governmental agency, and
present market conditions. In the three months ended 30 June 2011, the weighted average FTS price for the
primary regions where we delivered our natural gas increased by RR 326 per mcm, or 14.3%, to RR 2,611 per
mcm compared to RR 2,285 per mcm in the 2010 period.
The specific terms for delivery of natural gas affect our average realized prices. Natural gas sold “ex-field” is
sold primarily to wholesale gas traders, in which case the buyer is responsible for the payment of gas
transportation tariffs. Sales to wholesale gas traders allow us to diversify our natural gas sales without incurring
additional commercial expenses. Historically, we have realized higher prices and net margins for natural gas
volumes sold directly to end-customers, as the gas transportation tariff is included in the contract price and no
retail margin is lost to wholesale gas traders. However, the historical norm may or may not prevail in the present
or future market situations.
In November 2006, the FTS approved and published a plan to liberalize the price of natural gas sold on the
Russian domestic market by the year 2011. As part of the liberalization plan, the FTS approved the increases in
the regulated price for natural gas by 15% effective from 1 January 2010 and 2011.
In February 2011, the government of the Russian Federation announced certain revisions to the domestic natural
gas market liberalization plan. According to the revised plan, the target date for full liberalization of the domestic
natural gas market is 1 January 2015. The regulation of the domestic natural gas price prior to 2015 will be based
on the netback parity of natural gas prices on the domestic and export markets, while taking into account the cost
of alternative fuels. We expect further increases in the regulated price for natural gas as part of the RussianFederation government’s efforts to liberalize the price of natural gas on the Russian domestic market. We expect
that the FTS will continue to approve the effective increase on an annual basis and reserves the right to modify
In the three months ended 30 June 2011, our crude oil export delivery terms were DAP Feneshlitke, Hungary,
while in the corresponding period in 2010 our delivery terms were delivery at frontier (DAF, Feneshlitke,
Hungary). Our average crude oil export contract price, including export duties, was approximately USD 821 per
ton compared to USD 546 per ton in the 2010 period.
The following table shows our average realized stable gas condensate and crude oil sales prices (net of VAT and
export duties, where applicable) for the three months ended 30 June 2011 and 2010 (prices in US dollars were
translated from Russian roubles using the average exchange rate for the period):
Russian roubles or US dollars per ton
Three months ended 30 June: Change
2011 2010 %
Stable gas condensate
Net export price, RR per ton 15,708 11,936 31.6%
Net export price, USD per ton 561.3 394.7 42.2%
Domestic price, RR per ton 13,818 9,915 39.4%
Crude oil
Net export price, RR per ton 10,321 7,719 33.7%
Net export price, USD per ton 368.8 255.2 44.5%
Domestic price, RR per ton 9,822 7,262 35.3%
Our LPG export delivery terms during the three months ended 30 June 2011, were DAP at the border of the
customer’s country, carriage paid to (CPT) the Port of Temryuk (southern Russia) and free carrier (FCA) at the
terminal points in Poland, compared to DAF (at the border of the customer’s country), CPT (the Port of
Temryuk) and FCA (the terminal points in Poland) in the corresponding period in 2010. In the three months
ended 30 June 2011, our average export contract price for LPG produced at the Purovsky Plant, including export
duties, was approximately USD 904 per ton compared to USD 583 per ton the corresponding period in 2010.
In the three months ended 30 June 2011, as well as in the corresponding period in 2010, we were obliged to sell
a portion of our LPG sales volumes on the domestic market at regulated prices, while the remaining portion of
our sales was sold under commercial terms. In the three months ended 30 June 2011, we sold a total of
14 thousand tons of LPG on the domestic market at the regulated price of RR 7,605 per ton, while in the
corresponding period in 2010, we sold 14 thousand tons at the regulated price of RR 6,613 per ton. In the three
months ended 30 June 2011, we sold 89 thousand tons at an average commercial price of RR 12,439 per ton,including volumes sold through our wholly-owned subsidiary OOO “NOVATEK-Refueling Complexes”,compared to 102 thousand tons at an average commercial price of RR 10,750 per ton in the corresponding period
in 2010.
The following table shows our average realized LPG and oil products sales prices excluding trading activities
(net of VAT and export duties, where applicable) for the three months ended 30 June 2011 and 2010 (prices in
US dollars were translated from Russian roubles using the average exchange rate for the period):
Russian roubles or US dollars per ton
Three months ended 30 June: Change
2011 2010 %
LPG
Net export price, RR per ton 21,965 15,905 38.1%
Net export price, USD per ton 784.9 525.9 49.2%Domestic commercial price, RR per ton 12,439 10,750 15.7%
Domestic regulated price, RR per ton 7,605 6,613 15.0%
We transport our natural gas through our own pipelines into the Unified Gas Supply System (“UGSS”), which is
owned and operated by OAO “Gazprom”, a Russian government controlled monopoly. Transportation tariffs for
the use of the UGSS by independent producers are set by the FTS. In accordance with the methodology of calculating transportation tariffs for natural gas produced in the Russian
Federation for shipments to consumers located within the customs territory of the Russian Federation and the
member states of the Customs Union Agreement (Belarus, Kazakhstan, Kyrgyzstan and Tajikistan), thetransportation tariff consists of two parts: a rate for the utilization of the trunk pipeline and a transportation rate
per mcm per 100 kilometers (km). The rate for utilization of the trunk pipeline is based on an “input/output”
function, which is determined by where natural gas enters and exits the trunk pipeline and includes a constant
rate for end-customers using Gazprom’s gas distribution systems. The constant rate is deducted from the
utilization rate for end-customers using non-Gazprom gas distribution systems.
In December 2009, the FTS approved a 12.3% average increase for the 2010 transportation tariff for natural gas
effective 1 January 2010. Effective from 1 January 2010, the rate for utilization of the trunk pipeline had a range
of RR 32.92 to RR 1,818.37 (excluding VAT) per mcm and the transportation rate was RR 10.27 (excluding
VAT) per mcm per 100 km.
In December 2010, the FTS approved a 9.3% average increase for the 2011 transportation tariff for natural gas
effective 1 January 2011, which is 0.5% higher than the Russian Federation’s official inflation rate for 2010.
Effective from 1 January 2011, the rate for utilization of the trunk pipeline had a range of RR 44.97 to
RR 1,964.13 (excluding VAT) per mcm and the transportation rate was RR 11.23 (excluding VAT) per mcm per
100 km.
The increases in regulated transportation tariffs are passed on to our end-customers pursuant to delivery terms in
the majority of our contracts.
Crude oil
We transport most of our crude oil through the pipeline network owned and operated by Transneft, Russia’sstate-owned monopoly crude oil pipeline operator. Our transportation tariffs for the transport of crude oil
through Transneft’s pipeline network are also set by the FTS. The overall expense for the transport of crude oil
primarily depends on the length of the transport route from the producing field to the ultimate destination.
Stable gas condensate, LPG and oil products
Our stable gas condensate (to the Port of Vitino on the White Sea), LPG and oil products are transported by rail
which is owned and operated by Russian Railways, Russia’s state-owned monopoly railway operator. Our
transportation tariffs for transport by rail are also set by the FTS and vary depending on product and length of
transport route.
In January 2010, the FTS approved the discount co-efficients to existing rail road transportation tariffs related to
export deliveries of LPG and stable gas condensate shipped from the Limbey rail station, located in closeproximity to our Purovsky Plant. The discount co-efficient for stable gas condensate was set at 0.89 for annual
volumes shipped to export markets of 2,235 thousand tons or more and the discount co-efficient for LPG was set
at 0.35 for export volumes in excess of 105 thousand tons which we reached in the middle of April 2010. The
discount co-efficients remained in effect throughout 2010.
In December 2010, the FTS revised the discount co-efficients to existing rail road transportation tariffs related to
export deliveries of LPG and stable gas condensate shipped from the Limbey rail station in 2011. The discount
co-efficient for stable gas condensate is set at 0.89 for companies with annual shipped volumes of
2,600 thousand tons or more, and the discount co-efficient for LPG is set at 0.68 for delivered annual volumes of
415 thousand tons or more. The revised discount co-efficients are expected to remain in effect throughout 2011.
We deliver our stable gas condensate to international markets using the loading and storage facilities at the Port
of Vitino on the White Sea and tankers for transportation to US, European, South American and countries of the
Asian-Pacific region. The costs associated with tanker transportation are determined by the distance to the final
destination, as well as tanker availability, seasonality of deliveries and standard shipping terms.
Our tax burden
We are subject to a wide range of taxes imposed at the federal, regional, and local levels, many of which are
based on revenue or volumetric measures. In addition to income tax, significant taxes to which we are subject
include VAT, unified natural resources production tax (UPT), export duties, property tax, payments to non-
budget funds (formerly known as social taxes) and other contributions.
According to amendments to the Russian Tax Code the UPT rate for natural gas was increased from RR 147 toRR 237 per mcm, or by 61.2%, effective from 1 January 2011. In addition, effective from 1 January 2012 and
1 January 2013 the UPT rate for natural gas is expected to be increased by 5.9% and by 5.6% respectively, as of
the reporting date.
In practice, Russian tax authorities often have their own interpretation of tax laws that rarely favours taxpayers,
who have to resort to court proceedings to defend their position against the tax authorities. Differinginterpretations of tax regulations exist both among and within government ministries and organizations at the
federal, regional and local levels, creating uncertainties and inconsistent enforcement. Tax declarations, togetherwith related documentation such as customs declarations, are subject to review and investigation by a number of
authorities, each of which may impose fines, penalties and interest charges. Generally, taxpayers are subject to
an inspection of their activities for a period of three calendar years immediately preceding the year in which the
audit is conducted. Previous audits do not completely exclude subsequent claims relating to the audited period.In addition, in some instances, new tax regulations have been given retroactive effect.
We have not employed any tax minimization schemes using offshore or domestic tax zones in the Russian
Our natural gas sales volumes increased primarily due to a combination of increased production at the
Yurkharovskoye and East-Tarkosalinskoye fields and purchases from our associated company, Sibneftegas.
Liquids sales volumes increased primarily due to an increase in unstable gas condensate production at the
Yurkharovskoye field and, to a lesser extent, a buildup in liquids inventory balances in the 2010 period.
Natural gas sales volumes
millions of cubic meters
Three months ended 30 June: Change
2011 2010 %
Production from:
Yurkharovskoye field 7,903 5,737 37.8%
East-Tarkosalinskoye field 2,149 1,783 20.5%
Khancheyskoye field 626 752 (16.8%)
Other fields 18 18 0.0%
Total natural gas production 10,696 8,290 29.0%
Purchases from:Sibneftegas, the Group’s associate 1,313 - n/a
Total production and purchases 12,009 8,290 44.9%
Purovsky Plant and own usage (22) (24) (8.3%)
Decrease (increase) in UGSF, UGSS and own pipeline infrastructure (157) (357) (56.0%)
Total natural gas sales volumes 11,830 7,909 49.6%
Sold to end-customers 6,448 5,196 24.1%
Sold ex-field 5,382 2,713 98.4%
In the three months ended 30 June 2011, our total natural gas production (including our share in production of our associate, Sibneftegas) increased by 3,719 mmcm, or 44.9%, compared to the 2010 period primarily due to
an increase in production at our Yurkharovskoye field resulting from the launch of the third stage of the field’s
second phase development in October 2010, the utilization of more production capacity at the East-
Tarkosalinskoye field, and consolidation of our share in production of the Group’s associate.
In the three months ended 30 June 2011, we used 12 mmcm of natural gas as feedstock for the production of
methanol compared to 14 mmcm in the corresponding period in 2010. A significant portion of the methanol we
The following table sets forth our sales (net of VAT and export duties, where applicable) for the three months
ended 30 June 2011 and 2010:
millions of Russian roubles
Three months ended 30 June: Change
2011 2010 %
Natural gas sales 24,325 15,209 59.9% End-customers 16,859 11,8
Ex-field sales 7,466 3,318 1
Stable gas condensate sales 11,868 6,424 84.7% Export 11,822 6,398
Domestic 46 26
Liquefied petroleum gas sales 3,725 3,024 23.2% Export 2,516 1,831
Domestic 1,209 1,193
Crude oil sales 530 354 49.7% Export 244 116
Domestic 286 238
Oil and gas products sales 53 40 32.5% Domestic 53 40
Total oil and gas sales 40,501 25,051 61.7%
Sales of polymer and insulation tape - 611 n/a
Other revenues 75 44 70.5%
Total revenues 40,576 25,706 57.8%
Natural gas sales
In the three months ended 30 June 2011, our revenues from sales of natural gas increased by RR 9,116 million,
or 59.9%, compared to the corresponding period in 2010 largely due to an increase in sales volumes and, to alesser extent, an increase in natural gas prices.
Our proportion of natural gas sold to end-customers to total natural gas sales volumes decreased from 65.7% in
the 2010 reporting period to 54.5% in the three months ended 30 June 2011. The decrease was due to the
increase of contractual sales volumes to one of our main gas traders and the commencement from January 2011
of natural gas sales, ex-field, to “ITERA”, a Russian oil and gas company, under a long-term contract signed in
April 2010 for annual volumes of approximately four billion cubic meters. There were no corresponding sales of
natural gas to “ITERA” in the 2010 reporting period.
The average realized prices of our natural gas sold directly to end-customers (including transportation expense)
and sold ex-field were higher by 14.2% and 13.4%, respectively, in the three months ended 30 June 2011
compared to the same period in 2010. In the three months ended 30 June 2011, as well as in the corresponding
period in 2010, our sales of natural gas to end-customers were primarily to energy utility companies and largeindustrial companies.
Stable gas condensate sales
In the three months ended 30 June 2011, our revenues from sales of stable gas condensate increased by
RR 5,444 million, or 84.7%, compared to the corresponding period in 2010 due to both an increase in our
average realized prices resulting from an increase in the underlying benchmark crude oil prices used in the price
formulation and an increase in volumes sold.
In the three months ended 30 June 2011, our total stable gas condensate sales volumes increased by
216 thousand tons, or 40.1%, due to an increase in our unstable gas condensate production and a slight decrease
in stable gas condensate inventory balances in the 2011 period compared to an increase in the 2010 period (see
“Change in natural gas, liquid hydrocarbons, and polymer products and work-in-progress” below). In the threemonths ended 30 June 2011, we exported 752 thousand tons of stable gas condensate, or 99.6% of our total sales
volumes, to Europe, the United States and Asian-Pacific region. In the three months ended 30 June 2010, we
sold 539 thousand tons of stable gas condensate, of which approximately 99.4% were exported to the United
States, South America and Asian-Pacific region.
In the three months ended 30 June 2011, our average realized price, excluding export duties, for stable gas
condensate sold on the export market increased by USD 166.6 per ton, or 42.2%, to USD 561.3 per ton (CIF,
CFR and DAP) from USD 394.7 per ton (DES and CIF) in the 2010 period due to a 44.1% increase in our
average export contract price that was partially offset by a 45.4% increase in the average export duty per ton.
The increase in our average realized contract price was due to an overall increase in crude oil and related
commodity prices on international markets in the 2011 period compared to the corresponding period in 2010.
Liquefied petroleum gas sales
In the three months ended 30 June 2011, our revenues from the sales of LPG increased by RR 701 million, or
23.2%, compared to the corresponding period in 2010, due to an increase in our average realized prices that was
partially offset by a decrease in volumes sold.
Our LPG sales volumes decreased by 14 thousand tons, or 6.1%, to 217 thousand tons in the three months ended
30 June 2011 from 231 thousand tons in the corresponding period in 2010 due to a decrease in the output of LPGfrom our Purovsky Plant. Previously, our unstable gas condensate from the Yurkharovskoye field was mixed
with that of other producers, which degraded the quality. With the completion and launching in August 2010 of our own pipeline network from the Yurkharovskoye field to the Purovsky Plant, we improved the quality of
unstable gas condensate which reduced the output of LPG post processing.
In the three months ended 30 June 2011, we sold 114 thousand tons of LPG, or 52.5% of our total LPG salesvolumes, to the export markets for an average price of USD 784.9 per ton (DAP, CPT and FCA excluding export
duties), representing an increase of USD 259.0 per ton, or 49.2%, compared to the corresponding period in 2010.
The increase in our average realized export prices (excluding export duties) was primarily due to a 55.1%
increase in our average contract price that was partially offset by a 91.3% increase in the average export duty per
ton.
In the three months ended 30 June 2011, we sold 103 thousand tons of LPG, or 47.5% of our total LPG sales
volumes on the domestic market at an average price of RR 11,798 per ton (FCA, excluding VAT) representing
an increase of RR 1,540 per ton, or 15.0%, compared to the 2010 period.
In the three months ended 30 June 2010, we sold 49.8% of our LPG volumes to the export markets and 50.2% to
the domestic markets.
Crude oil sales
In the three months ended 30 June 2011, our revenues from the sales of crude oil increased by RR 176 million,
or 49.7%, compared to the 2010 period, due to an increase in our average realized prices and, to a lesser extent,
an increase in sales volumes.
In the three months ended 30 June 2011, our crude oil sales volumes increased by five thousand tons, or 10.4%,
to 53 thousand tons from 48 thousand tons in the corresponding period in 2010 due primarily to an increase in
crude oil production. In the three months ended 30 June 2011, 54.7% of our crude oil volumes were solddomestically at an average price of RR 9,822 per ton (excluding VAT) representing an increase of RR 2,560 per
ton, or 35.3%, compared to the corresponding period in 2010. The remaining 45.3% of our crude oil volumes
were sold to the export markets at an average price of USD 368.8 per ton (DAP, excluding export duties)
representing an increase of USD 113.6 per ton, or 44.5%, compared to the corresponding period in 2010. The
increase in the average realized export price (excluding export duties) was the result of a 50.4% increase in our
average export contract price that was partially offset by a 52.4% increase in the average export duty per ton.
The increase in our average realized contract price was due to an overall increase in crude oil and related
commodity prices on international markets in the 2011 period compared to the corresponding period in 2010.
In the three months ended 30 June 2011, our revenue from the sales of oil and gas products increased by
RR 13 million, or 32.5%, to the RR 53 million from RR 40 million in corresponding period in 2010.
Our revenues from oil products trading operations through our retail stations on the domestic market increased
by RR 17 million to RR 42 million in the three months ended 30 June 2011, compared to RR 25 million in the
2010 period primarily due to the expansion of operations of our subsidiary OOO “NOVATEK-Refueling
Complexes”, as well as an increase in sales prices. In the three months ended 30 June 2011 and 2010, we sold
approximately 1.56 thousand tons and 1.07 thousand tons of oil products (diesel fuel and petrol) for an average
price of RR 26,637 per ton and RR 22,959 per ton, respectively.
In the three months ended 30 June 2011, our revenues from oil products produced at the Surgutsky refinery andsold on the domestic market decreased by RR 15 million, or 100.0% due to the cessation of deliveries of our
unstable gas condensate to the refinery starting in September 2010 as a result of the launch of our own unstable
gas condensate pipeline from the Yurkharovskoye field to the Purovsky Plant in August 2010.
In the three months ended 30 June 2011, we sold approximately one thousand tons of methanol to our associated
company, Sibneftegas, and recorded revenues of RR 11 million from such sale.
Sales of polymer and insulation tape
In the three months ended 30 June 2011, our revenues from the sales of polymer and insulation tape decreased
by RR 611 million, or 100.0%, due to the disposal of our polymer and insulation tape production subsidiary
OOO “NOVATEK–Polymer” in September 2010.
Other revenues
Other revenues include geological and geophysical research services, rent, transportation, handling, storage and
other services. In the three months ended 30 June 2011, other revenues increased by RR 31 million, or 70.5%, to
RR 75 million from RR 44 million in the corresponding period in 2010. The increase in other revenues wasprimarily related to a RR 20 million increase in revenues from transportation, handling and storage services. The
remaining increase of RR 11 million in other revenues was composed of various immaterial items.
General and administrative expenses 2,117 5.2% 1,631 6.3%
Depreciation, depletion and amortization 1,987 4.9% 1,549 6.0%
Materials, services and other 1,540 3.8% 1,740 6.8%
Purchases of natural gas and liquid hydrocarbons 932 2.3% 21 0.1%
Net impairment expense 619 1.5% 9 n/m
Exploration expenses 273 0.7% 335 1.3%
Change in natural gas, liquid hydrocarbons, and
polymer products and work-in-progress (128) n/m (264) n/m
Total operating expenses 22,439 55.3% 15,717 61.1%
Non-controllable expenses
A significant proportion of our operating expenses are characterized as non-controllable expenses since we are
unable to influence the increase in regulated tariffs for transportation of our hydrocarbons or the rates imposedby federal, regional or local tax authorities. In the three months ended 30 June 2011, non-controllable expenses
of transportation and taxes other than income tax increased by RR 4,403 million, or 41.2%, to RR 15,099 million
from RR 10,696 million in the corresponding period in 2010. The change in transportation expenses was
primarily due to an increase in natural gas and liquids sales volumes, as well as the increase in the natural gas
transportation tariff. Taxes other than income tax increased primarily due to an increase in the natural gas
production tax rate by 61.2% effective from 1 January 2011, as well as higher natural gas and liquids production
volumes. As a percentage of total revenues, our non-controllable expenses decreased to 37.2% in the three
months ended 30 June 2011 from 41.6% in the corresponding period in 2010.
Transportation expenses
In the three months ended 30 June 2011, our total transportation expenses increased by RR 2,617 million, or
31.0%, compared to the corresponding period in 2010.
millions of Russian roubles
Three months ended 30 June: Change
2011 2010 %
Natural gas transportation to customers 7,633 5,669 34.6%
Liquids transportation by rail 2,402 1,811 32.6%
Liquids transportation by tankers 940 785 19.7%
Unstable gas condensate transportation from the fields to the
processing facilities through third party pipelines - 124 n/m
In the three months ended 30 June 2011, our transportation expenses for natural gas increased by
RR 1,964 million, or 34.6%, to RR 7,633 million from RR 5,669 million in the corresponding period in 2010.
The change was due to a 24.1% increase in our sales volumes of natural gas delivered directly to end-customers,
where the cost of transportation is included in the sales price, as well as an increase in the natural gas
transportation tariff (see “Transportation tariffs” above). Our average transportation distance for natural gas sold
to end-customers fluctuates period-to-period and depends on the location of end-customers and the specific
routes of transportation.
In the three months ended 30 June 2011, total expenses for liquids transportation by rail increased by
RR 591 million, or 32.6%, to RR 2,402 million from RR 1,811 million in the corresponding period in 2010 due
primarily to an increase in stable gas condensate volumes sold. In the three months ended 30 June 2011, our
combined liquids volumes sold and transported via rail increased by 201 thousand tons, or 26.6%, to
958 thousand tons from 757 thousand tons in the corresponding period in 2010.
In the three months ended 30 June 2011, our weighted average transportation tariff for liquids delivered by rail
increased by 4.6% to RR 2,503 per ton from RR 2,392 per ton in the corresponding period in 2010 primarily due
to an increase in rail tariffs set by FTS by 8.0% effective 1 January 2011 that was partially offset by an increase
in the share of stable gas condensate volumes in our combined liquids volumes sold and transported via rail. The
change in the share of stable gas condensate volumes in our total liquids volumes delivered by rail will affect ourweighted average rail tariff due to the relatively low transportation expense for stable gas condensate compared
to other liquids.
The rail tariffs set by the FTS increased by 8.0%, compared to the 2010 period, effective from 1 January 2011. In
the three months ended 30 June 2011, as well as in the corresponding period in 2010, we applied a co-efficient of
0.89 to the existing rail tariff for stable gas condensate deliveries to export markets. In addition, in the threemonths ended 30 June 2011, we applied a co-efficient of 0.68 to the existing rail tariff for LPG export deliveries
at the cross-border points of the Russian Federation compared to the co-efficient of 0.35 in the corresponding
period in 2010 applied from the middle of April 2010 (see “Transportation tariffs” above).
Total transportation expense for liquids delivered by tankers to international markets increased by
RR 155 million, or 19.7%, to RR 940 million in the three months ended 30 June 2011 from RR 785 million inthe 2010 period. The change was due to a 40.3% increase in volumes sold that was partially offset by a decrease
in average freight rates. In the three months ended 30 June 2011, we delivered 51.7% of our total stable gas
condensate export volumes to Europe, 32.2% to the Asian-Pacific region and 16.1% to the United States,whereas in the corresponding period in 2010, we exported 33.2% to the Asian-Pacific region, 44.8% to the
United States and 22.0% to South America.
Starting from the middle of August 2010, we no longer incur expenses related to unstable gas condensate
transportation from the fields to the processing facilities through third party pipelines as we commenced
operation of our own unstable gas condensate pipeline from the Yurkharovskoye field to the Purovsky Plant (see
Total taxes other than income tax 4,046 2,260 79.0%
In the three months ended 30 June 2011, taxes other than income tax increased by RR 1,786 million, or 79.0%,
primarily due to an increase in the unified natural resources production tax expense.
In the three months ended 30 June 2011, our UPT for natural gas increased by RR 1,336 million, or 109.8%, due
to a 61.2% increase in the natural gas production tax rate effective 1 January 2011 (from RR 147 to RR 237 per
mcm), and an increase in our natural gas production volumes. The remaining increase in UPT expenses of
RR 192 million related to the UPT for gas condensate and crude oil and was primarily due to an increase inproduction volumes, as well as an increase in the crude oil tax rate. Our average UPT rate for crude oil is linked
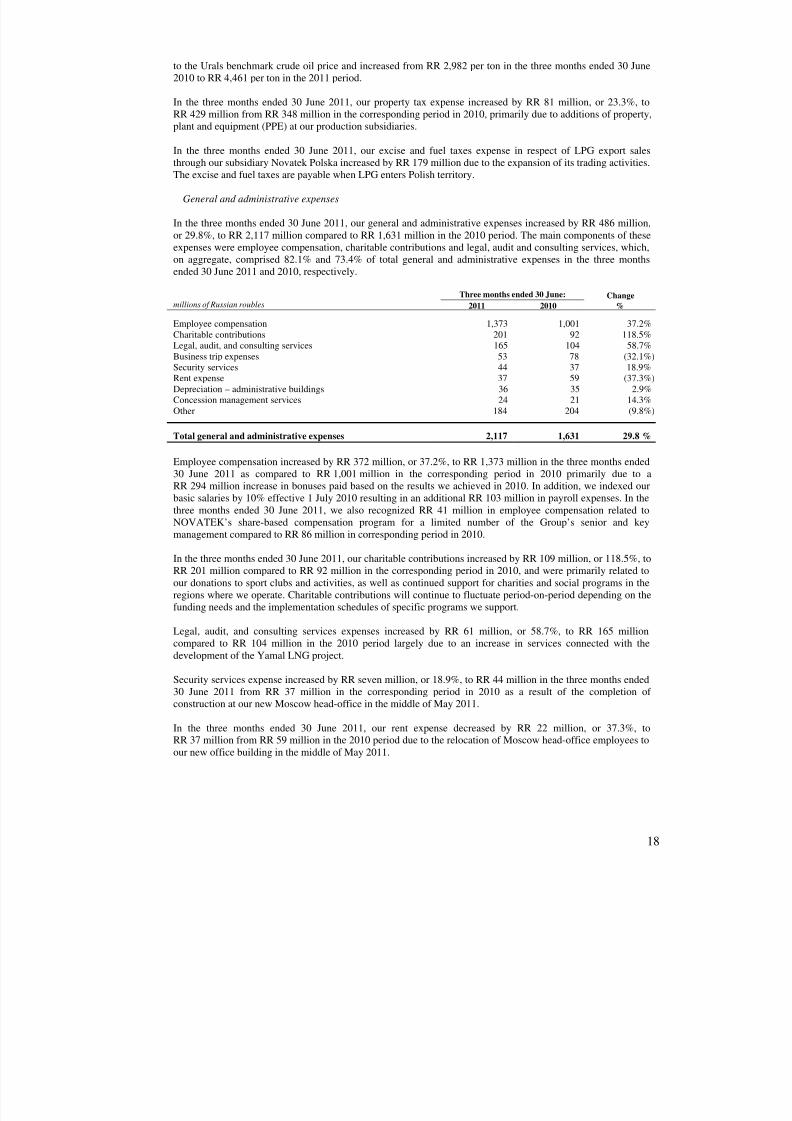
Total general and administrative expenses 2,117 1,631 29.8 %
Employee compensation increased by RR 372 million, or 37.2%, to RR 1,373 million in the three months ended
30 June 2011 as compared to RR 1,001 million in the corresponding period in 2010 primarily due to a
RR 294 million increase in bonuses paid based on the results we achieved in 2010. In addition, we indexed our
basic salaries by 10% effective 1 July 2010 resulting in an additional RR 103 million in payroll expenses. In the
three months ended 30 June 2011, we also recognized RR 41 million in employee compensation related to
NOVATEK’s share-based compensation program for a limited number of the Group’s senior and key
management compared to RR 86 million in corresponding period in 2010.
In the three months ended 30 June 2011, our charitable contributions increased by RR 109 million, or 118.5%, to
RR 201 million compared to RR 92 million in the corresponding period in 2010, and were primarily related to
our donations to sport clubs and activities, as well as continued support for charities and social programs in the
regions where we operate. Charitable contributions will continue to fluctuate period-on-period depending on the
funding needs and the implementation schedules of specific programs we support.
Legal, audit, and consulting services expenses increased by RR 61 million, or 58.7%, to RR 165 million
compared to RR 104 million in the 2010 period largely due to an increase in services connected with the
development of the Yamal LNG project.
Security services expense increased by RR seven million, or 18.9%, to RR 44 million in the three months ended
30 June 2011 from RR 37 million in the corresponding period in 2010 as a result of the completion of
construction at our new Moscow head-office in the middle of May 2011.
In the three months ended 30 June 2011, our rent expense decreased by RR 22 million, or 37.3%, toRR 37 million from RR 59 million in the 2010 period due to the relocation of Moscow head-office employees to
our new office building in the middle of May 2011.
Concession management services represent administrative expenses incurred by Tharwa Petroleum Company
S.A.E (the operator of the El-Arish concession area located in Egypt). In the three months ended 30 June 2011,
our expenses related to concession management services slightly increased by RR three million, or 14.3%,
compared the corresponding period in 2010.
In the three months ended 30 June 2011, other general and administrative expenses decreased by RR 20 million,
or 9.8%, compared to the 2010 period, of which RR 21 million related to the remuneration of the Board of
Directors and payment to members of the Company’s revision committee and RR six million related to insurance
expense. The remaining increase of RR seven million was allocated amongst different expense categories within
other general and administrative expenses which, taken individually, changed immaterially.
Depreciation, depletion and amortization
In the three months ended 30 June 2011, our depreciation, depletion and amortization (“DDA”) expense
increased by RR 438 million, or 28.3%, to RR 1,987 million from RR 1,549 million in the corresponding period
in 2010 as a result of an increase in our depletable cost base, as well as a 27.8% increase in our total hydrocarbon
production in barrels of oil equivalent (boe). The Company accrues depreciation and depletion using the “units
of production” method for producing assets and straight-line method for other facilities.
In the three months ended 30 June 2011, our DDA per boe was RR 21.6 compared to RR 22.0 in the
corresponding period in 2010. The decrease in our DDA charge calculated on a boe basis was primarily due toan increase in our proved developed reserves as of 31 December 2010.
Our reserve base used as the denominator in the calculation of the DDA charge under the “units of production”
method is only appraised on an annual basis as of 31 December and does not fluctuate during the year, whereasour depletable cost base does change each quarter due to the ongoing capitalization of our costs throughout the
year.
Materials, services and other
In the three months ended 30 June 2011, our materials, services and other expenses decreased byRR 200 million, or 11.5%, to RR 1,540 million compared to RR 1,740 million in the 2010 period. The main
components of this expense category were employee compensation and repair and maintenance services, which
comprised 53.8% and 22.4%, respectively, of total materials, services and other expenses in the 2011 period.
millions of Russian roubles
Three months ended 30 June: Change
2011 2010 %
Employee compensation 829 691 20.0%
Repair and maintenance services 345 138 150.0%
Electricity and fuel 113 98 15.3%
Security services 59 40 47.5%
Materials and supplies 43 484 (91.1%)
Transportation costs 42 16 162.5%
Processing fees 25 213 (88.3%)
Other 84 60 40.0%
Total materials, services and other 1,540 1,740 (11.5%)
Our employee compensation increased by RR 138 million, or 20.0%, to RR 829 million compared to
RR 691 million in the 2010 period due primarily to a 10% indexation of base salaries effective 1 July 2010.
Repair and maintenance services increased by RR 207 million, or 150.0%, to RR 345 million in the three months
ended 30 June 2011 compared to RR 138 million in the 2010 period. The increase was primarily related to the
current repair works at our production assets and was consistent with our on-going maintenance schedules.
In the three months ended 30 June 2011, electricity and fuel expenses increased by RR 15 million, or 15.3%, to
RR 113 million from RR 98 million in the corresponding period in 2010 primarily due to an increase in energy
consumption at the Yurkharovskoye field resulting from the commencement of operations of new production
assets that was partially offset by a disposal of our subsidiary OOO “NOVATEK-Polymer” in September 2010.
Security services expense increased by RR 19 million, or 47.5%, to RR 59 million in the three months ended
30 June 2011 from RR 40 million in the corresponding period in 2010 largely due to additional security related
to recently completed infrastructure projects at our production subsidiaries.
Materials and supplies expense decreased by RR 441 million, or 91.1%, mainly due to a decrease in purchases of
raw materials required for the production of polymer and insulation tape products as a result of the disposal of
OOO “NOVATEK-Polymer” in September 2010, which accounted for RR 414 million, or 93.9%, of the total
decrease in materials and supplies expense.
In the three months ended 30 June 2011, our transportation costs related to the delivery of materials and goods to
our fields increased by RR 26 million, or 162.5%, to RR 42 million compared to RR 16 million in the
corresponding period in 2010 primarily due to an increase in third party services provided to our production
subsidiaries.
Processing fees decreased by RR 188 million, or 88.3%, to RR 25 million in the three months ended 30 June
2011, from RR 213 million in the 2010 period due primarily to the launch of our own unstable gas condensate
de-ethanization facility at the Yurkharovskoye field in August 2010, which resulted in savings of approximately
RR 181 million on third-party processing fees.
Purchases of natural gas and liquid hydrocarbons
Purchases of natural gas and liquid hydrocarbons increased by RR 911 million to RR 932 million in the three
months ended 30 June 2011, from RR 21 million in the corresponding period in 2010, of which RR 893 million
and RR 18 million of the increase related to the purchases of natural gas from our associated company
Sibneftegas and purchases of oil products from third parties for resale, respectively.
Net impairment expense
Our net impairment expense increased from RR nine million in the three months ended 30 June 2010 to
RR 619 million in the three months ended 30 June 2011. During the 2011 reporting period, we wrote off assets at
the Sredne-Chaselskiy license area in the amount of RR 499 million due to negative future cash flows expectedto be derived from those assets, and RR 119 million resulted to the impairment of our investment at the El-Arish
project.
Exploration expenses
In the three months ended 30 June 2011, our exploration expenses decreased by RR 62 million, or 18.5%, to
RR 273 million from RR 335 million in the corresponding period in 2010 primarily due to a decrease in
exploration expenses at the West-Yurkharovskoye field and Yarudeyskiy license area that were partially offset
by an increase in exploration expense at the West-Urengoiskiy and Olimpiysky license areas and the North-
Khancheyskoye field.
Change in natural gas, liquid hydrocarbons, and polymer products and work-in-progress
In the three months ended 30 June 2011, we recorded a reversal of RR 128 million to change in inventory
expense as compared to a reversal of RR 264 million in the corresponding period in 2010:
millions of Russian roubles
Three months ended 30 June:
2011 2010
Natural gas (81) (126)
Stable gas condensate 4 (154)
Other (51) 16
Increase (decrease) in operating expenses due to
change in inventory balances and work-in-progress (128) (264)
In the three months ended 30 June 2011, we recorded a reversal to our operating expenses of RR 81 million due
to a 157 mmcm increase in our natural gas inventory balance. Our volumes of natural gas injected into
Gazprom’s underground gas storage facilities (UGSF) fluctuate period-to-period depending on market
conditions, storage capacity constraints and our development plans to sustain and/or grow production duringperiods of seasonality.
including stable gas condensate 274 282 (8) 332 277 55
Other operating income (loss)
In the three months ended 30 June 2011, we recognized other operating loss of RR 65 million compared to other
operating income of RR 29 million in the corresponding period in 2010, both of which were primarily related to
different immaterial items, including profit (loss) on disposal of materials, fixed assets, equipment and other
similar transactions.
Profit from operations
As a result of the factors discussed above, our profit from operations increased by RR 8,054 million, or 80.4%,
to RR 18,072 million in the three months ended 30 June 2011, compared to RR 10,018 million in the
corresponding period in 2010. In the three months ended 30 June 2011, our profit from operations as a
percentage of total revenues increased to 44.5% compared to 39.0% in the 2010 period primarily due to higher
hydrocarbon sales volumes and prices.
Finance income (expense)
In the three months ended 30 June 2011, we recorded net finance income of RR 1,073 million due primarily to
an increase in interest income on loans issued and a foreign exchange gain from the appreciation of the Russianrouble relative to the US dollar compared to a net finance expense of RR 1,078 million in the corresponding
period in 2010 due to a foreign exchange loss from the depreciation of the Russian rouble relative to the USdollar.
In the three months ended 30 June 2011, our total accrued interest expense increased to RR 1,423 million
compared to RR 542 million in the corresponding period in 2010 as a result of an increase in our average
borrowings. In the three months ended 30 June 2011 and 2010, we capitalized RR 920 and RR 459 million,
respectively, of interest expense to the cost of additions in our property, plant and equipment account inaccordance with the Group’s accounting policy.
Interest income increased to RR 810 million in the three months ended 30 June 2011 from RR 123 million in the
2010 period primarily due to an increase in interest income on loans provided to our associated companies.
In the three months ended 30 June 2011, we recorded a net foreign exchange gain of RR 766 million comparedto a net foreign exchange loss of RR 1,118 million in the 2010 period due primarily to the revaluation of our
foreign currency denominated borrowings. The Russian rouble appreciated by 1.2% against the US dollar during
the three months ended 30 June 2011 compared to Russian rouble depreciation of 6.3% in the corresponding
period in 2010. We will continue to record foreign exchange gains and losses each period based on the
movements between exchange rates and the currency denomination of our debt portfolio.
Share of profit (loss) of equity investments, net of income tax
In the three months ended 30 June 2011, our proportionate share in loss of equity investments increased to
RR 991 million compared to RR nine million in the 2010 period, of which a significant portion was related to
Sibneftegas and Yamal Development. The losses we recognized in our equity investees were primarily due to the
revaluation of oil and gas properties acquired to fair value and the subsequent amortization of those costs under
Our overall consolidated effective income tax rates (total income tax expense calculated as a percentage of our
reported IFRS profit before income tax) were 20.1% and 20.9% for the three months ended 30 June 2011 and
2010, respectively. Our effective income tax rate, after excluding the effect of foreign subsidiaries, was 20.3%
and 21.3% in the 2011 and 2010 periods, respectively. The Russian statutory income tax rate for both periods
was 20%. The difference between our effective and statutory income tax rates is primarily due to certain non-
deductible expenses.
Profit attributable to shareholders and earnings per share
As a result of the factors discussed above, profit for the period increased by RR 7,234 million, or 102.4%, to
RR 14,300 million in the three months ended 30 June 2011 from RR 7,066 million in the corresponding periodin 2010. The profit attributable to shareholders of OAO “NOVATEK” increased by RR 7,282 million, or
102.0%, to RR 14,421 million in the three months ended 30 June 2011 from RR 7,139 million in the
corresponding period in 2010.
Our weighted average basic and diluted earnings per share, calculated from the profit attributable to shareholders
of OAO “NOVATEK”, increased by approximately RR 2.40 per share, or 101.9%, to RR 4.75 per share in the2011 period from RR 2.35 per share in corresponding period in 2010.
The following table shows our net cash flows from operating, investing and financing activities for the three
months ended 30 June 2011 and 2010:
millions of Russian roubles
Three months ended 30 June: Change
2011 2010 %
Net cash provided by operating activities 15,118 6,340 138.5%
Net cash used in investing activities (14,012) (5,009) 179.7%Net cash provided by (used in) financing activities (2,395) 3,258 n/a
Liquidity ratios 30 June 2011 31 December 2010 Change, %
Current ratio 2.16 0.51 323.5%
Total debt to equity 0.52 0.49 6.1%
Long-term debt to long-term debt and equity 0.31 0.24 29.2%
Net debt to total capitalization (1 ) 0.26 0.25 4.0%
(1 ) Net debt represents total debt less cash and cash equivalents. Total capitalization represents total debt, total equity and deferred income tax
liability.
Net cash provided by operating activities
In the three months ended 30 June 2011, our net cash provided by operating activities increased by
RR 8,778 million, or 138.5%, to RR 15,118 million compared to RR 6,340 million in the corresponding period
in 2010. The increase was primarily due to an increase in hydrocarbon sales volumes and prices, as well as a
decrease in accounts receivable and prepayments, that was partially offset by an increase in income tax
payments.
Net cash used in investing activities
In the three months ended 30 June 2011, our net cash used in investing activities increased by RR 9,003 million,
or 179.7%, to RR 14,012 million as compared to RR 5,009 million in the corresponding period in 2010 due
primarily to prepayments made by the Group in May 2011 to participate in a tender for new exploration andproduction licenses in the amount of RR 6,870 million (see “Recent developments” above).
Net cash provided by (used in) financing activities
In the three months ended 30 June 2011, our net cash used in financing activities amounted to RR 2,395 million
due to dividends paid and repayments of borrowings that were partially offset by proceeds from borrowings. In
the three months ended 30 June 2010, our net cash provided by financing activities amounted to
RR 3,258 million due to proceeds from long-term borrowings that was partially offset by repayments of
borrowings and dividends paid.
Working capital
Our net working capital position (current assets less current liabilities) at 30 June 2011 was positiveRR 25,410 million compared to a negative RR 27,876 million at 31 December 2010. The change in our net
working capital position during the six months ended 30 June 2011 was mainly due to a significant decrease in
accounts payable and our short-term debt, as well as an increase in prepayments and other current assets.
The improvement of our net working capital position was primarily due the successful refinancing of our short-
term payables through the issuance of long-term Eurobonds in February 2011 (see “Recent developments”
above).
The Group’s management believes that it presently has and will continue to have the ability to generate
sufficient cash flows (from operating and financing activities) to repay all current liabilities and finance the
loan facility USD 800 million April 2011 LIBOR+1.5% - 6,952
Nordea Bank USD 200 million November 2013 LIBOR+1.9% 5,615 6,095
UniCredit Bank USD 200 million October 2012 LIBOR+3.25% (1) 5,606 6,082
Sumitomo Mitsui
Banking Corporation
Europe Limited USD 300 million December 2013 LIBOR+1.45% 8,358 -
Bridge loan facility (2 ) USD 600 million November 2011 LIBOR+1% - 18,200
Total 89,339 72,226
(1 ) – interest rates were changed during the periods
(2 ) – bridge loan repaid in February 2011 ahead of maturity schedule
Scheduled maturities of our long-term debt outstanding (net of unamortized transaction costs) at 30 June 2011
were as follows:
Maturity schedule: RR million
1 July 2012 to 30 June 2013 23,373
1 July 2013 to 30 June 2014 19,385
1 July 2014 to 30 June 2015 -
1 July 2015 to 30 June 2016 16,735
After 30 June 2016 18,108
Total long-term debt 77,601
At 30 June 2011, the Group had available funds under short-term credit lines in the form of bank overdrafts withvarious international banks in the aggregate amount of RR 5,475 million (USD 195 million) at either fixed or
variable interest rates subject to the specific type of credit facility.
The Group also has funds available under credit facilities with Credit Agricole Corporate and Investment Bank
in the amount of USD 100 million until June 2012 and ZAO “UniCredit Bank” in the amount of
USD 150 million until August 2012, with the interest rates applicable under the aforementioned credit facilities
to be negotiated at the time of each withdrawal, as well as funds available under credit facility with ZAO “BNP
PARIBAS Bank” in the amount of USD 100 million until August 2012 with predetermined interest rates
depending on the period of debt.
Management believes it has sufficient internally generated cash flows, as well as access to available external
borrowings (both short- and long-term) to fund its capital expenditure program, service its existing debt and meet
QUALITATIVE AND QUANTITATIVE DISCLOSURES AND MARKET RISKS
We are exposed to market risk from changes in commodity prices, foreign currency exchange rates and interest
rates. We are exposed to commodity price risk as our prices for crude oil and stable gas condensate destined for
export sales are linked to international crude oil prices. We are exposed to foreign exchange risk to the extent
that a portion of our sales revenues, costs, receivables, loans and debt are denominated in currencies other than
Russian roubles. We are subject to market risk from changes in interest rates that may affect the cost of our
financing. From time to time we may use derivative instruments, such as commodity forward contracts,commodity price swaps, commodity options, foreign exchange forward contracts, foreign currency options,
interest rate swaps and forward rate agreements, to manage these market risks, and we may hold or issue
derivative or other financial instruments for trading purposes.
Foreign currency risk
Our principal exchange rate risk involves changes in the value of the Russian rouble relative to the US dollar. As
of 30 June 2011, RR 47,684 million, or 61.4%, of our long-term debt was denominated in US dollars (out of
RR 89,339 million of our total borrowings at that date). Changes in the value of the Russian rouble relative to the
US dollar will impact our foreign currency-denominated costs and expenses and our debt service obligations for
foreign currency-denominated borrowings in Russian rouble terms, as well as receivables at our foreign
subsidiaries. We believe that the risks associated with our foreign currency exposure are mitigated by the fact
that a portion of our total revenues, approximately 32.8% in the three months ended 30 June 2011, isdenominated in US dollars. As of 30 June 2011, the Russian rouble appreciated by approximately 7.9% against
the US dollar since 31 December 2010.
A hypothetical and instantaneous 10% strengthening in the Russian rouble in relation to the US dollar as of
30 June 2011 would have resulted in an estimated foreign exchange gain of approximately RR 5,442 million on
foreign currency denominated borrowings held at that date.
Commodity risk
Substantially all of our crude oil, stable gas condensate and LPG export sales are sold under spot contracts. Our
export prices are linked to international crude oil prices. External factors such as geopolitical developments,
natural disasters and the actions of the Organization of Petroleum Exporting Countries affect crude oil prices and
thus our export prices.
The weather is another factor affecting demand for and, therefore, the price of natural gas. Changes in weather
conditions from year to year can influence demand for natural gas and to some extent gas condensate and oil
products.
From time to time we may employ derivative instruments to mitigate the price risk of our sales activities. In our
consolidated financial statements all derivative instruments are recorded at their fair values. Unrealized gains or
losses on derivative instruments are recognized within other operating income (loss), unless the underlying
arrangement qualifies as a hedge.
Pipeline access
We transport substantially all of our natural gas through the Gazprom owned UGSS. Gazprom is responsible forgathering, transporting, dispatching and delivering substantially all natural gas supplies in Russia. Under existing
legislation, Gazprom must provide access to the UGSS to all independent suppliers on a non-discriminatory
basis provided there is capacity not being used by Gazprom. In practice, however, Gazprom exercises
considerable discretion over access to the UGSS because it is the sole owner of information relating to capacity.
There can be no assurance that Gazprom will continue to provide us with access to the UGSS, however, we have
not been denied access in prior periods.
Ability to reinvest
Our business requires significant ongoing capital expenditures in order to grow our production. An extended
period of reduced demand for our hydrocarbons available for sale and the corresponding revenues generated
from these sales would limit our ability to maintain an adequate level of capital expenditures, which in turn could
limit our ability to increase or maintain current levels of production and deliveries of natural gas, gas condensate,crude oil and other associated products; thereby, adversely affecting our financial and operating results.