34
Interim Report at March 31, 2018 1 F.I.LA. GROUP INTERIM REPORT AT MARCH 31, 2018 F.I.L.A. – Fabbrica Italiana Lapis ed Affini S.p.A. Via XXV Aprile 5 Pero (MI)
Interim Report at
March 31, 2018
1
F.I.LA. GROUP
INTERIM REPORT
AT MARCH 31, 2018
F.I.L.A. – Fabbrica Italiana Lapis ed Affini S.p.A.
Via XXV Aprile 5 Pero (MI)
Interim Report at
March 31, 2018
2
Contents
I - Directors’ Report ............................................................................................................................. 4
Board of Directors ............................................................................................................................... 4 Overview of the F.I.L.A. Group.......................................................................................................... 5 Significant events in the first quarter .................................................................................................. 6 Key Financial Highlights .................................................................................................................... 7 F.I.L.A Group Key Financial Highlights ............................................................................................ 9
Adjusted operating results ............................................................................................................... 9 Business seasonality ...................................................................................................................... 12 Statement of Financial Position .................................................................................................... 13 Financial overview ........................................................................................................................ 15
Disclosure by operating segment ...................................................................................................... 18 Business Segments – Statement of Financial Position .................................................................. 19 Business Segments – Income Statement ....................................................................................... 20 Business Segments – Other Information ....................................................................................... 21
Subsequent events to the first quarter ............................................................................................... 22 Treasury shares ................................................................................................................................. 23
II - Consolidated Financial Statements of the F.I.L.A. Group at March 31, 2018 ........................ 24
Consolidated Financial Statements ................................................................................................... 24 Statement of Financial Position .................................................................................................... 24 Statement of Comprehensive Income ........................................................................................... 25 Statement of Changes in Equity .................................................................................................... 26 Condensed Consolidated Statement of Cash Flow ....................................................................... 27
Attachments ...................................................................................................................................... 29 List of companies included in the consolidation and other investments ....................................... 29 Change of accounting standards ................................................................................................... 30
Transactions relating to Atypical and/or Unusual Operations .......................................................... 33 Declaration of the Executive Officer for Financial Reporting .......................................................... 34
Interim Report at
March 31, 2018
3
DIRECTORS’ REPORT
AT MARCH 31, 2018
Interim Report at
March 31, 2018
4
I - Directors’ Report
Board of Directors
Board of Directors
Chairman Gianni Mion
Honorary Chairman Alberto Candela
Chief Executive Officer Massimo Candela
Executive Director Luca Pelosin
Director (**) Filippo Zabban
Director (**) Annalisa Barbera
Director (*) Sergio Ravagli
Director (*)(***) Gerolamo Caccia Dominioni
Director (*) Francesca Prandstraller
Director (*) Paola Bonini
(*) Independent director in accordance with Article 148 of the CFA and Article 3 of the Self-Governance Code.
(**) Non-Executive Director.
(***) Lead Independent Director.
Control and Risks Committee
Gerolamo Caccia Dominioni
Paola Bonini
Filippo Zabban
Sergio Ravagli
Board of Statutory Auditors
Chairman Gianfranco Consorti
Statutory Auditor Elena Spagnol
Standing Auditor Pietro Villa
Alternate Auditor Stefano Amoroso
Alternate Auditor Sonia Ferrero
Interim Report at
March 31, 2018
5
Overview of the F.I.L.A. Group
The F.I.L.A. Group operates in the creativity tools market, producing colouring, design, modelling,
writing and painting objects, such as pencils, crayons, modelling clay, chalk, oil colours, acrylics,
watercolours, paints and paper for the fine arts, school and leisure.
The F.I.L.A. Group at March 31, 2018 operates through 19 production facilities and 36 subsidiaries
across the globe and employs over 8,400, becoming a pinnacle for creative solutions in many
countries with brands such as GIOTTO, DAS, LYRA, CANSON, MAIMERI, DALER & ROWNEY
LUKAS and TICONDEROGA.
Founded in Florence in 1920, F.I.L.A. has achieved strong growth over the last twenty years,
supported by a series of strategic acquisitions: the Italian Company Adica Pongo in 1994, the US
Group Dixon Ticonderoga in 2005, the German Group LYRA in 2008, the Mexican Company
Lapiceria Mexicana in 2010 and the Maimeri business unit in 2014. In addition to these operations, on
the conclusion of an initiative which began with the acquisition of a minority stake in 2011, control
was acquired in 2015 of the Indian company DOMS Industries Pvt Ltd.
In 2016, the F.I.L.A. Group has focused upon development on strategic art & craft sector acquisitions,
seeking to become the leading market player. On February 3, 2016, F.I.L.A. S.p.A. acquired control
of the Daler-Rowney Lukas Group, an illustrious brand producing and distributing since 1783
materials and accessories on the arts & crafts market, with a direct presence in the United Kingdom,
the Dominican Republic, Germany and the USA.
In September 2016, the F.I.L.A. Group acquired St. Cuthberts, a highly-renowned English paper mill,
founded in 1907, located in the south-west of England and involved in the production of high quality
artist’s papers.
In October 2016, F.I.L.A. S.p.A. acquired the Canson Group, founded in 1557 by the Montgolfier
family, with headquarters in Annonay in France, production facilities in France and conversion and
distribution centres in Italy, France, the USA, China, Australia and Brazil. Canson products are
available in over 120 countries and the brand is the most respected globally involved in the production
and distribution of high added value paper for the fine arts, design, leisure and schools, but also for
artists’ editions and technical and digital drawing materials.

Interim Report at
March 31, 2018
6
Significant events in the first quarter
On January 18, 2018, F.I.L.A. S.p.A., on the basis of strong operating and financial
developments both at company and Group level, negotiated with the lending banks a number
of amendments to the medium/long-term loan, contracted on May 12, 2016 for a total
maximum amount of Euro 236,900 thousand and agreed with Intesa Sanpaolo S.p.A.,
Mediobanca – Banca di Credito Finanziario S.p.A., Banca Nazionale del Lavoro S.p.A. and
UniCredit S.p.A..
The amendments and supplements to the Loan Contract currently under negotiation with the
lending banks related to the approval of improved conditions and terms for the company and
the other Group companies, both in terms of reducing the financial charges on the loan and
with regards to lessening the commitments in terms of the associated financial documentation
and covenants. In addition, these amendments included the undertaking by the company
F.I.L.A. S.p.A. of an additional debt of a total maximum amount of Euro 30 million from
Banca Popolare di Milano, maturing on February 2, 2022, increasing the total amount set out
under the loan contract to Euro 266.9 million.
On March 7, 2018, 51% of the share capital of FILA Art and Craft Ltd (Israel) was acquired,
a company involved in the sale of F.I.L.A. Group writing, art and design products in Israel;
Interim Report at
March 31, 2018
7
Key Financial Highlights
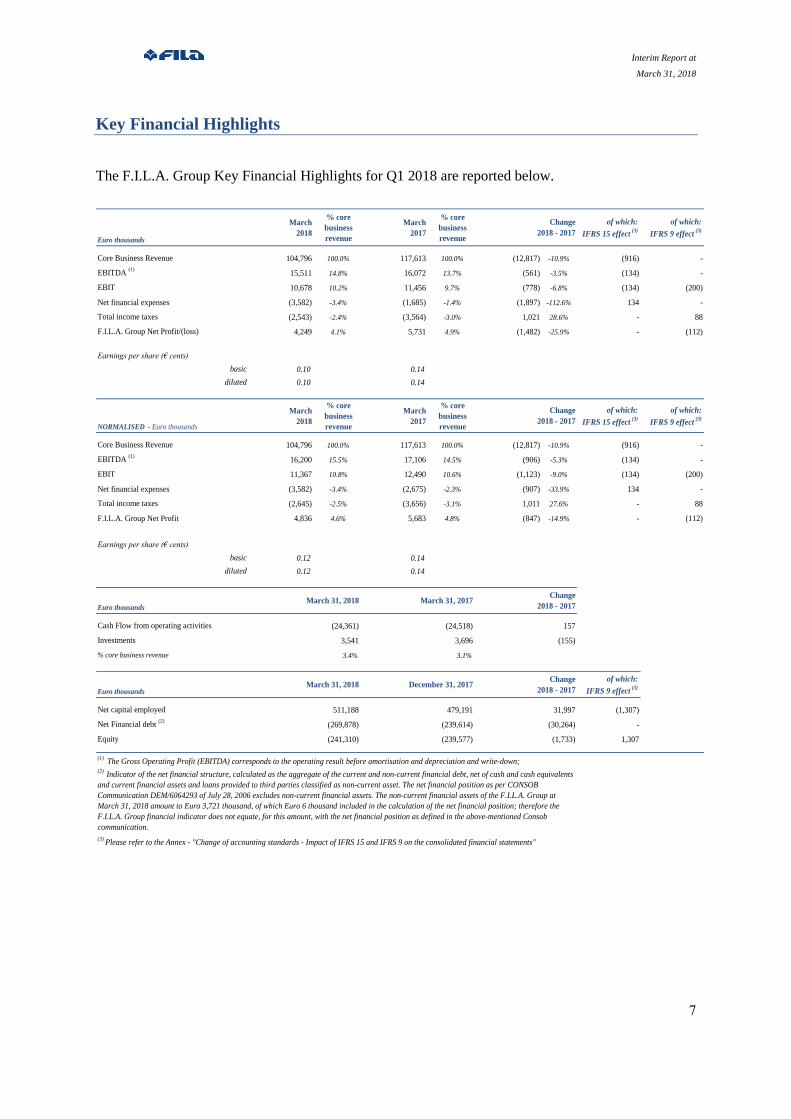
The F.I.L.A. Group Key Financial Highlights for Q1 2018 are reported below.
Euro thousands
March
2018
% core
business
revenue
March
2017
% core
business
revenue
of which:
IFRS 15 effect(3)
of which:
IFRS 9 effect(3)
Core Business Revenue 104,796 100.0% 117,613 100.0% (12,817) -10.9% (916) -
EBITDA (1)
15,511 14.8% 16,072 13.7% (561) -3.5% (134) -
EBIT 10,678 10.2% 11,456 9.7% (778) -6.8% (134) (200)
Net financial expenses (3,582) -3.4% (1,685) -1.4% (1,897) -112.6% 134 -
Total income taxes (2,543) -2.4% (3,564) -3.0% 1,021 28.6% - 88
F.I.L.A. Group Net Profit/(loss) 4,249 4.1% 5,731 4.9% (1,482) -25.9% - (112)
Earnings per share (€ cents)
basic 0.10 0.14
diluted 0.10 0.14
NORMALISED - Euro thousands
March
2018
% core
business
revenue
March
2017
% core
business
revenue
of which:
IFRS 15 effect(3)
of which:
IFRS 9 effect(3)
Core Business Revenue 104,796 100.0% 117,613 100.0% (12,817) -10.9% (916) -
EBITDA (1)
16,200 15.5% 17,106 14.5% (906) -5.3% (134) -
EBIT 11,367 10.8% 12,490 10.6% (1,123) -9.0% (134) (200)
Net financial expenses (3,582) -3.4% (2,675) -2.3% (907) -33.9% 134 -
Total income taxes (2,645) -2.5% (3,656) -3.1% 1,011 27.6% - 88
F.I.L.A. Group Net Profit 4,836 4.6% 5,683 4.8% (847) -14.9% - (112)
Earnings per share (€ cents)
basic 0.12 0.14
diluted 0.12 0.14
Euro thousands
Cash Flow from operating activities
Investments
% core business revenue
Euro thousands
of which:
IFRS 9 effect(3)
Net capital employed (1,307)
Net Financial debt (2)
-
Equity 1,307
(1) The Gross Operating Profit (EBITDA) corresponds to the operating result before amortisation and depreciation and write-down;
(3)Please refer to the Annex - "Change of accounting standards - Impact of IFRS 15 and IFRS 9 on the consolidated financial statements"
(2) Indicator of the net financial structure, calculated as the aggregate of the current and non-current financial debt, net of cash and cash equivalents
and current financial assets and loans provided to third parties classified as non-current asset. The net financial position as per CONSOB
Communication DEM/6064293 of July 28, 2006 excludes non-current financial assets. The non-current financial assets of the F.I.L.A. Group at
March 31, 2018 amount to Euro 3,721 thousand, of which Euro 6 thousand included in the calculation of the net financial position; therefore the
F.I.L.A. Group financial indicator does not equate, for this amount, with the net financial position as defined in the above-mentioned Consob
communication.
(269,878) (239,614) (30,264)
(241,310) (239,577) (1,733)
511,188 479,191 31,997
3.4% 3.1%
March 31, 2018 December 31, 2017Change
2018 - 2017
3,541 3,696 (155)
(24,361) (24,518) 157
Change
2018 - 2017
Change
2018 - 2017
March 31, 2018 March 31, 2017Change
2018 - 2017
Interim Report at
March 31, 2018
8
2018 Adjustments:
The adjustments to the Q1 2018 EBITDA relates to non-recurring operating costs of approx.
Euro 0.7 million, principally for Group reorganisation plans and the Stock Grant Plan for
specific Group employees.
The adjustments of the Q1 2018 Group Result concerns the above-stated adjustments, net of
the tax effect.
2017 Adjustments:
The adjustment of the Q1 2017 EBITDA relates to non-recurring operating costs of approx.
Euro 1 million, principally for Group reorganisation plans.
The adjustment of the financial items relates to the financial income of the company Lyra KG
(Germany) and deriving from the sale of the 30% stake held in FILA Nordic AB (Sweden)
amounting to approx. Euro 1 million.
The adjustment of the Q1 2017 Group Result concerns the above-stated adjustments, net of
the tax effect.
Interim Report at
March 31, 2018
9
F.I.L.A Group Key Financial Highlights
The F.I.L.A. Group Key Financial Highlights for Q1 2018 are reported below.
Adjusted operating results
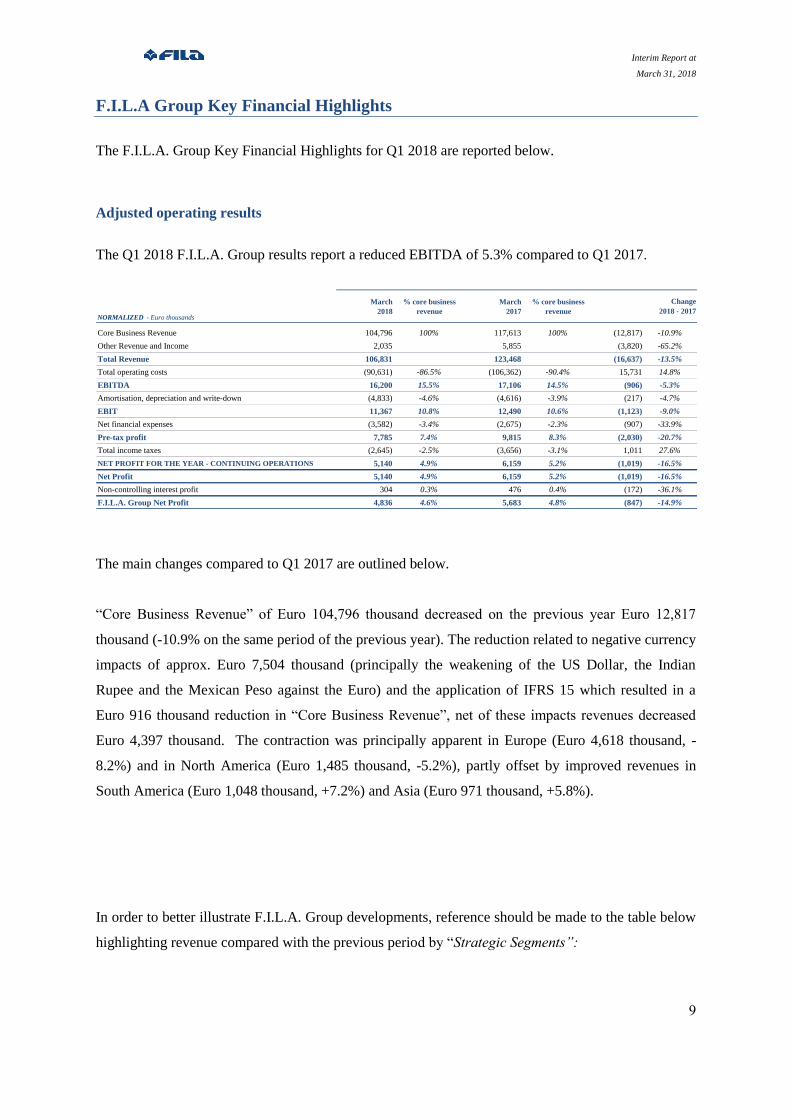
The Q1 2018 F.I.L.A. Group results report a reduced EBITDA of 5.3% compared to Q1 2017.
NORMALIZED - Euro thousands
March
2018
% core business
revenue
March
2017
% core business
revenue
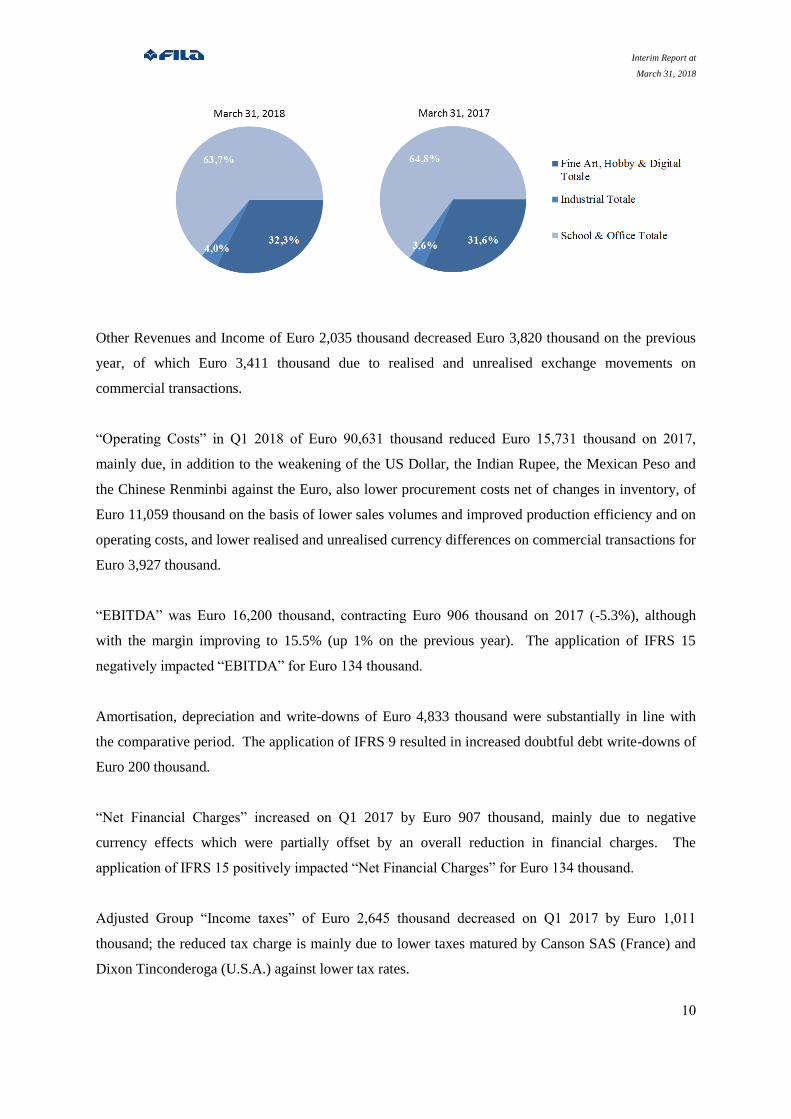
Core Business Revenue 104,796 100% 117,613 100% (12,817) -10.9%
Other Revenue and Income 2,035 5,855 (3,820) -65.2%
Total Revenue 106,831 123,468 (16,637) -13.5%
Total operating costs (90,631) -86.5% (106,362) -90.4% 15,731 14.8%
EBITDA 16,200 15.5% 17,106 14.5% (906) -5.3%
Amortisation, depreciation and write-down (4,833) -4.6% (4,616) -3.9% (217) -4.7%
EBIT 11,367 10.8% 12,490 10.6% (1,123) -9.0%
Net financial expenses (3,582) -3.4% (2,675) -2.3% (907) -33.9%
Pre-tax profit 7,785 7.4% 9,815 8.3% (2,030) -20.7%
Total income taxes (2,645) -2.5% (3,656) -3.1% 1,011 27.6%
NET PROFIT FOR THE YEAR - CONTINUING OPERATIONS 5,140 4.9% 6,159 5.2% (1,019) -16.5%
Net Profit 5,140 4.9% 6,159 5.2% (1,019) -16.5%
Non-controlling interest profit 304 0.3% 476 0.4% (172) -36.1%
F.I.L.A. Group Net Profit 4,836 4.6% 5,683 4.8% (847) -14.9%
Change
2018 - 2017
The main changes compared to Q1 2017 are outlined below.
“Core Business Revenue” of Euro 104,796 thousand decreased on the previous year Euro 12,817
thousand (-10.9% on the same period of the previous year). The reduction related to negative currency
impacts of approx. Euro 7,504 thousand (principally the weakening of the US Dollar, the Indian
Rupee and the Mexican Peso against the Euro) and the application of IFRS 15 which resulted in a
Euro 916 thousand reduction in “Core Business Revenue”, net of these impacts revenues decreased
Euro 4,397 thousand. The contraction was principally apparent in Europe (Euro 4,618 thousand, -
8.2%) and in North America (Euro 1,485 thousand, -5.2%), partly offset by improved revenues in
South America (Euro 1,048 thousand, +7.2%) and Asia (Euro 971 thousand, +5.8%).
In order to better illustrate F.I.L.A. Group developments, reference should be made to the table below
highlighting revenue compared with the previous period by “Strategic Segments”:
Interim Report at
March 31, 2018
10
Other Revenues and Income of Euro 2,035 thousand decreased Euro 3,820 thousand on the previous
year, of which Euro 3,411 thousand due to realised and unrealised exchange movements on
commercial transactions.
“Operating Costs” in Q1 2018 of Euro 90,631 thousand reduced Euro 15,731 thousand on 2017,
mainly due, in addition to the weakening of the US Dollar, the Indian Rupee, the Mexican Peso and
the Chinese Renminbi against the Euro, also lower procurement costs net of changes in inventory, of
Euro 11,059 thousand on the basis of lower sales volumes and improved production efficiency and on
operating costs, and lower realised and unrealised currency differences on commercial transactions for
Euro 3,927 thousand.
“EBITDA” was Euro 16,200 thousand, contracting Euro 906 thousand on 2017 (-5.3%), although
with the margin improving to 15.5% (up 1% on the previous year). The application of IFRS 15
negatively impacted “EBITDA” for Euro 134 thousand.
Amortisation, depreciation and write-downs of Euro 4,833 thousand were substantially in line with
the comparative period. The application of IFRS 9 resulted in increased doubtful debt write-downs of
Euro 200 thousand.
“Net Financial Charges” increased on Q1 2017 by Euro 907 thousand, mainly due to negative
currency effects which were partially offset by an overall reduction in financial charges. The
application of IFRS 15 positively impacted “Net Financial Charges” for Euro 134 thousand.
Adjusted Group “Income taxes” of Euro 2,645 thousand decreased on Q1 2017 by Euro 1,011
thousand; the reduced tax charge is mainly due to lower taxes matured by Canson SAS (France) and
Dixon Tinconderoga (U.S.A.) against lower tax rates.
Interim Report at
March 31, 2018
11
Excluding the non-controlling interest result, the F.I.L.A. Group adjusted net profit in Q1 2018 was
Euro 4,836 thousand, compared to Euro 5,683 thousand in the previous year.
Interim Report at
March 31, 2018
12
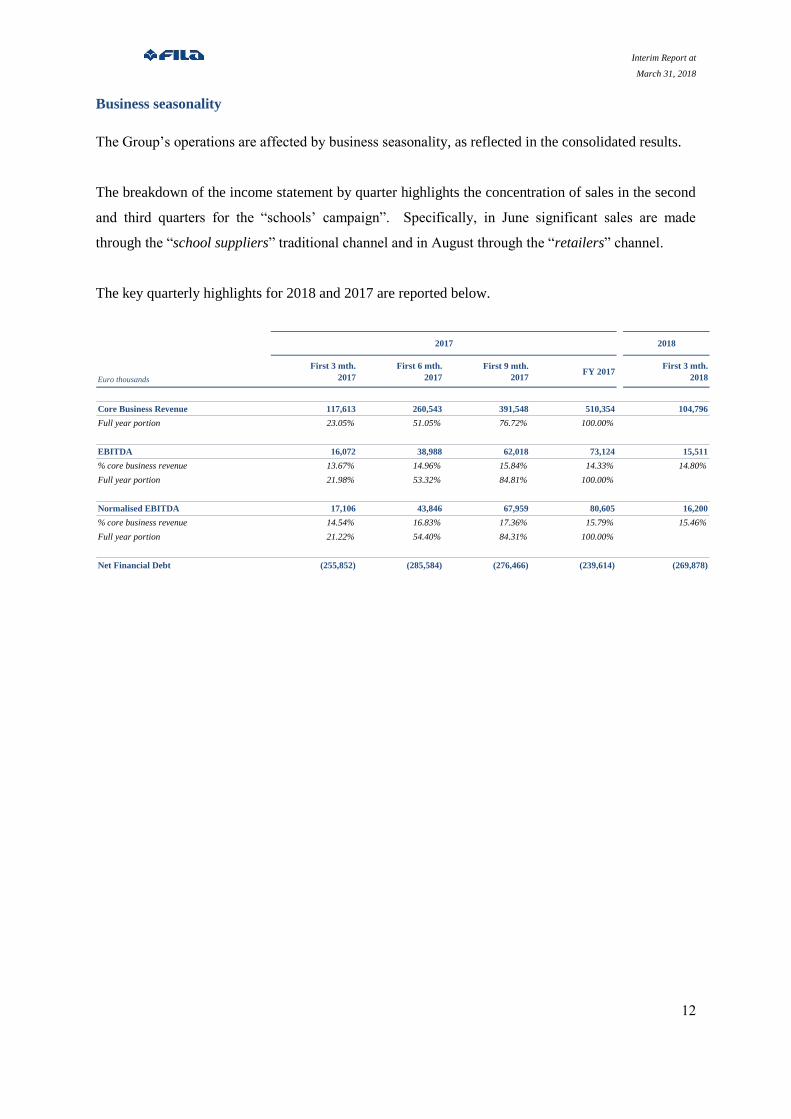
Business seasonality
The Group’s operations are affected by business seasonality, as reflected in the consolidated results.
The breakdown of the income statement by quarter highlights the concentration of sales in the second
and third quarters for the “schools’ campaign”. Specifically, in June significant sales are made
through the “school suppliers” traditional channel and in August through the “retailers” channel.
The key quarterly highlights for 2018 and 2017 are reported below.
Euro thousands
First 3 mth.
2017
First 6 mth.
2017
First 9 mth.
2017FY 2017
First 3 mth.
2018
Core Business Revenue 117,613 260,543 391,548 510,354 104,796
Full year portion 23.05% 51.05% 76.72% 100.00%
EBITDA 16,072 38,988 62,018 73,124 15,511
% core business revenue 13.67% 14.96% 15.84% 14.33% 14.80%
Full year portion 21.98% 53.32% 84.81% 100.00%
Normalised EBITDA 17,106 43,846 67,959 80,605 16,200
% core business revenue 14.54% 16.83% 17.36% 15.79% 15.46%
Full year portion 21.22% 54.40% 84.31% 100.00%
Net Financial Debt (255,852) (285,584) (276,466) (239,614) (269,878)
2017 2018
Interim Report at
March 31, 2018
13
Statement of Financial Position
The statement of financial position of the F.I.L.A. Group at March 31, 2018 is reported below.
Euro thousands
March
2018
December
2017
Change
2018 - 2017
Intangible Assets 205,945 208,091 (2,146)
Property, plant & equipment 88,187 88,355 (168)
Financial Assets 4,530 4,725 (195)
Net Fixed Assets 298,662 301,171 (2,509)
OTHER ASSETS/NON-CURRENT LIABILITIES 15,176 15,564 (388)
Inventories 200,396 178,699 21,697
Trade and Other Receivables 144,738 132,768 11,970
Trade and Other Payables (96,904) (96,263) (641)
Other Current Assets and Liabilities 700 241 459
Net Working Capital 248,930 215,445 33,485
Provisions (51,580) (52,989) 1,409
Net Capital Employed 511,188 479,191 31,997
Equity (241,310) (239,577) (1,733)
Net Financial Debt (269,878) (239,614) (30,264)
Net Funding Sources (511,188) (479,191) (31,997)
The “Net Capital Employed” of the F.I.L.A. Group at March 31, 2018 of Euro 511,188 thousand is
principally comprised of “Net Fixed Assets” of Euro 298,662 thousand (decreasing on December 31,
2017 Euro 2,509 thousand) and the “Net Working Capital” totalling Euro 248,930 (increasing on
December 31, 2017 Euro 33,485 thousand).
The decrease in “Intangible Assets” on December 31, 2017 of Euro 2,146 thousand substantially
relates to negative translation differences of Euro 753 thousand and the amortisation of intangible
assets (Euro 1,743 thousand), particularly with regards to “Trademarks” and “Development
Technology” by the Group companies Daler-Rowney Lukas, St. Cuthberts Mill (United Kingdom),
the Canson Group and DOMS Industries Pvt Ltd (India), valued during their respective acquisitions.
The reduction was partly offset by investments of Euro 350 thousand, principally by the parent
F.I.L.A. S.p.A.
“Property, plant and equipment” decreased Euro 168 thousand on December 31, 2017. Overall net
investments of Euro 3,219 thousand mainly concerned DOMS Industries Pvt Ltd (India), Canson SAS
(France) and Grupo F.I.L.A.-Dixon, S.A. de C.V. (Mexico) to extend and develop local production
sites. The overall movement also stems from negative currency differences for Euro 654 thousand
and depreciation of Euro 2,731 thousand.
Interim Report at
March 31, 2018
14
“Financial assets” decreased Euro 195 thousand compared to December 31, 2017, principally due to
the Fair Value adjustment of the Carrying amount of hedging derivatives of F.I.L.A. S.p.A. for Euro
169 thousand.
The increase in “Net Working Capital” on December 31, 2017 of Euro 33,485 thousand relates to the
following:
“Inventories” - the increase was Euro 21,697 thousand and mainly concerned the business
seasonality in the run up to the school’s campaign and continued development of the “Arts &
Craft” business. The increase in stock levels is principally concentrated at Dixon Ticonderoga
Company (U.S.A.), Grupo F.I.L.A.-Dixon, S.A. de C.V. (Mexico), Canson SAS (France), Canson
Inc. (U.S.A.) and at Daler Rowney Ltd (United Kingdom);
“Trade and Other Receivables” - increased Euro 11,970 thousand principally due to F.I.L.A.
Group seasonality and concerns in particular F.I.L.A. S.p.A., South American subsidiaries Grupo
F.I.L.A.-Dixon, S.A. de C.V. (Mexico), F.I.L.A. Chile Ltda (Chile) and Omyacolor S.A. (France).
The application of IFRS 9 in addition resulted in lower “Trade and Other Receivables” for Euro
2,300 thousand;
“Trade and Other Payables” - increased Euro 641 thousand, principally concerning payables for
the procurement of raw materials and investments by DOMS Industries Pvt Ltd (India).
The decrease in “Provisions” on December 31, 2017 of Euro 1,409 thousand principally concerns
reduced “Deferred tax liabilities” (Euro 934 thousand), “Employee benefits” (Euro 203 thousand),
mainly due to actuarial gains recorded in the first quarter by the company Daler Rowney Ltd (United
Kingdom) and of “Risks and Charges Provisions” (Euro 272 thousand).
The “Equity” of the F.I.L.A. Group, amounting to Euro 241,310 thousand, increased on December 31,
2017 Euro 1,733 thousand. Net of the period profit of Euro 4,553 thousand (of which Euro 304
thousand concerning non-controlling interest), the residual movement principally concerns negative
currency effects of Euro 1,798 thousand, the “fair value adjustment” of derivative hedging
instruments held by F.I.L.A. S.p.A. and Canson SAS (negative for Euro 194 thousand), the increase in
the “Share Based Premium” reserve of Euro 131 thousand, the increase in the IAS 19 reserve for Euro
236 thousand and the negative effects from application of IFRS 9 for Euro 1,195 thousand.
The F.I.L.A. Group “Net Financial Position” at March 31, 2018 was a net debt of Euro 269,878
thousand, increasing Euro 30,264 thousand on December 31, 2017 in line with business seasonality.
For greater details, reference should be made to the “Financial Overview” paragraph.
Interim Report at
March 31, 2018
15
Financial overview
The overview of the Q1 2018 Group operating and financial performance is completed by the Group
Net Financial Position and Statement of Cash Flow reported below.
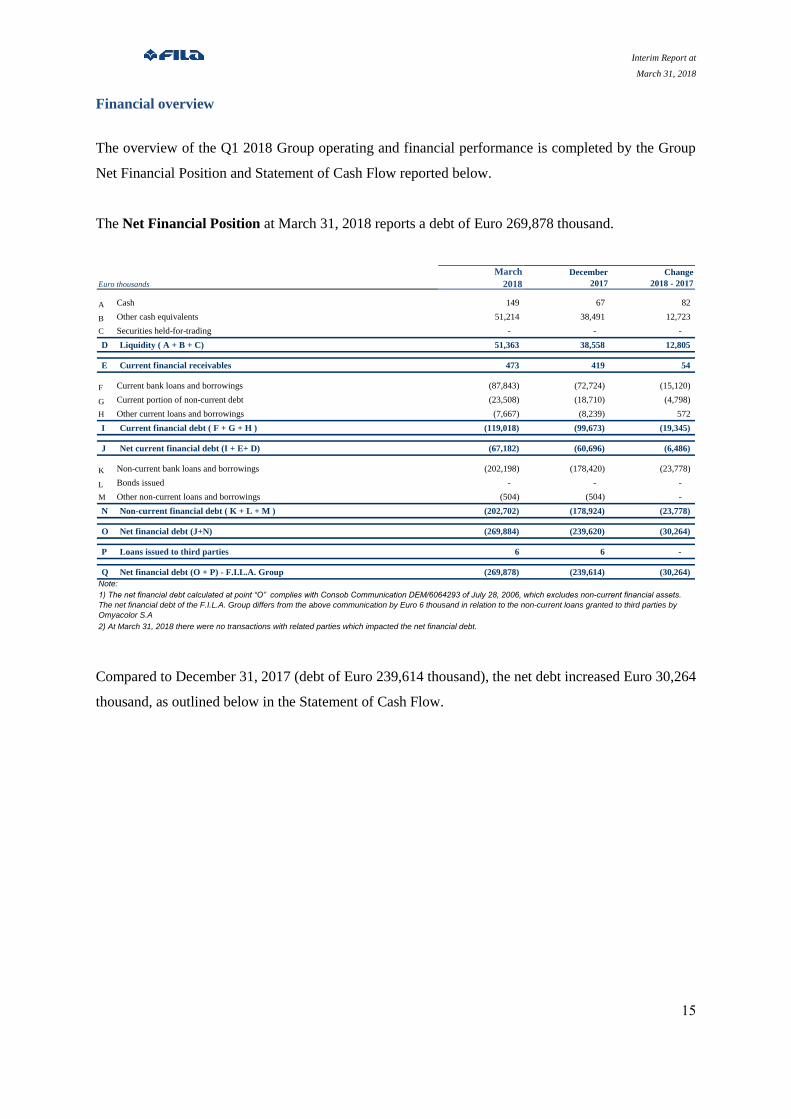
The Net Financial Position at March 31, 2018 reports a debt of Euro 269,878 thousand.
March
2018
December
2017
Change
2018 - 2017
A Cash 149 67 82
B Other cash equivalents 51,214 38,491 12,723
C Securities held-for-trading - - -
D Liquidity ( A + B + C) 51,363 38,558 12,805
E Current financial receivables 473 419 54
F Current bank loans and borrowings (87,843) (72,724) (15,120)
G Current portion of non-current debt (23,508) (18,710) (4,798)
H Other current loans and borrowings (7,667) (8,239) 572
I Current financial debt ( F + G + H ) (119,018) (99,673) (19,345)
J Net current financial debt (I + E+ D) (67,182) (60,696) (6,486)
K Non-current bank loans and borrowings (202,198) (178,420) (23,778)
L Bonds issued - - -
M Other non-current loans and borrowings (504) (504) -
N Non-current financial debt ( K + L + M ) (202,702) (178,924) (23,778)
O Net financial debt (J+N) (269,884) (239,620) (30,264)
P Loans issued to third parties 6 6 -
Q Net financial debt (O + P) - F.I.L.A. Group (269,878) (239,614) (30,264)
Note:
2) At March 31, 2018 there were no transactions with related parties which impacted the net financial debt.
Euro thousands
1) The net financial debt calculated at point “O” complies with Consob Communication DEM/6064293 of July 28, 2006, which excludes non-current financial assets.
The net financial debt of the F.I.L.A. Group differs from the above communication by Euro 6 thousand in relation to the non-current loans granted to third parties by
Omyacolor S.A
Compared to December 31, 2017 (debt of Euro 239,614 thousand), the net debt increased Euro 30,264
thousand, as outlined below in the Statement of Cash Flow.
Interim Report at
March 31, 2018
16
Euro thousandsMarch 2018 March 2017
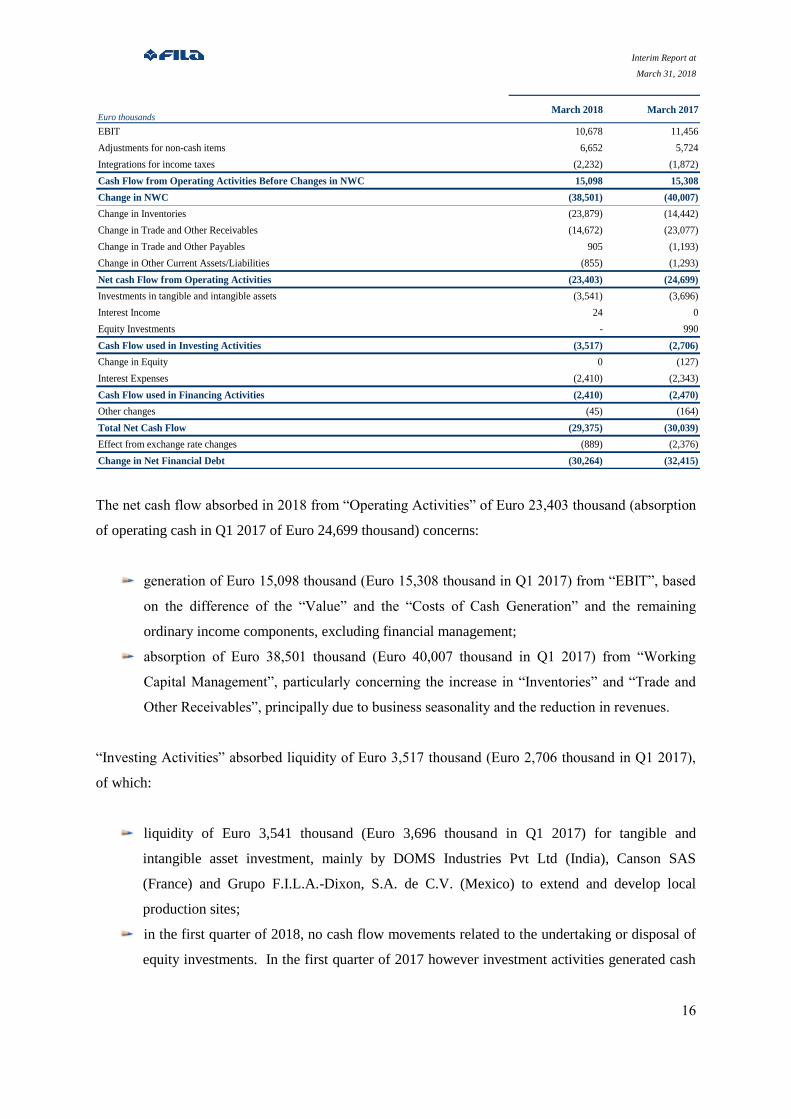
EBIT 10,678 11,456
Adjustments for non-cash items 6,652 5,724
Integrations for income taxes (2,232) (1,872)
Cash Flow from Operating Activities Before Changes in NWC 15,098 15,308
Change in NWC (38,501) (40,007)
Change in Inventories (23,879) (14,442)
Change in Trade and Other Receivables (14,672) (23,077)
Change in Trade and Other Payables 905 (1,193)
Change in Other Current Assets/Liabilities (855) (1,293)
Net cash Flow from Operating Activities (23,403) (24,699)
Investments in tangible and intangible assets (3,541) (3,696)
Interest Income 24 0
Equity Investments - 990
Cash Flow used in Investing Activities (3,517) (2,706)
Change in Equity 0 (127)
Interest Expenses (2,410) (2,343)
Cash Flow used in Financing Activities (2,410) (2,470)
Other changes (45) (164)
Total Net Cash Flow (29,375) (30,039)
Effect from exchange rate changes (889) (2,376)
Change in Net Financial Debt (30,264) (32,415)
The net cash flow absorbed in 2018 from “Operating Activities” of Euro 23,403 thousand (absorption
of operating cash in Q1 2017 of Euro 24,699 thousand) concerns:
generation of Euro 15,098 thousand (Euro 15,308 thousand in Q1 2017) from “EBIT”, based
on the difference of the “Value” and the “Costs of Cash Generation” and the remaining
ordinary income components, excluding financial management;
absorption of Euro 38,501 thousand (Euro 40,007 thousand in Q1 2017) from “Working
Capital Management”, particularly concerning the increase in “Inventories” and “Trade and
Other Receivables”, principally due to business seasonality and the reduction in revenues.
“Investing Activities” absorbed liquidity of Euro 3,517 thousand (Euro 2,706 thousand in Q1 2017),
of which:
liquidity of Euro 3,541 thousand (Euro 3,696 thousand in Q1 2017) for tangible and
intangible asset investment, mainly by DOMS Industries Pvt Ltd (India), Canson SAS
(France) and Grupo F.I.L.A.-Dixon, S.A. de C.V. (Mexico) to extend and develop local
production sites;
in the first quarter of 2018, no cash flow movements related to the undertaking or disposal of
equity investments. In the first quarter of 2017 however investment activities generated cash
Interim Report at
March 31, 2018
17
of Euro 990 thousand, due to the disposal of the minority stake (30%) held in FILA Nordic
AB (Sweden) by the German subsidiary Lyra KG.
Cash flow from “Financing Activities” absorbed liquidity of Euro 2,410 thousand (Euro 2,470
thousand in Q1 2017), mainly due to interest paid on loans and credit lines granted to Group
companies, mainly F.I.L.A. S.p.A., Grupo F.I.L.A. – Dixon, S.A. de C.V. (Mexico) and Dixon
Ticonderoga Company (U.S.A.).
Excluding the currency effect from the translation of the net financial positions in currencies other
than the Euro, absorbing cash of Euro 889 thousand, the increase in the net debt was therefore Euro
30,264 thousand (Euro 32,415 thousand at March 31, 2017).
“Net Liquidity” movements are reported below.
Euro thousandsMarch 2018 December 2017
Opening Cash and Cash Equivalents 20,425 53,973
Cash and cash equivalents 38,558 59,519
Bank overdrafts (18,133) (5,546)
Closing Cash and Cash Equivalents 35,374 20,425
Cash and cash equivalents 51,363 38,558
Bank overdrafts (15,989) (18,133)
Interim Report at
March 31, 2018
18
Disclosure by operating segment
In terms of segment reporting, the F.I.L.A. Group has adopted IFRS 8, obligatory from January 1,
2009.
IFRS 8 requires an entity to base segment reporting on internal reporting, which is constantly
reviewed by the highest level of management in order to allocate resources to the various segments
and to analyse performance.
Geographic region is the primary basis of analysis and of decision-making by F.I.L.A. Group
Management, therefore fully in line with the internal reporting prepared for these purposes.
The products of the F.I.L.A. Group are similar in terms of quality and production, target market,
margins, sales network and clients, even with reference to the different brands which the Group
markets. No diversification is therefore deemed to be present within the Segment, in consideration of
the substantial uniformity of the risks and benefits relating to the products produced by the F.I.L.A.
Group.
The segment disclosure accounting standards are in line with those utilised for the consolidated
financial statements.
Segment disclosure was therefore based on the location of operations (“Entity Locations”), broken
down as follows: “Europe”, “North America”, “Central and South America” and “Rest of the World”.
The “Rest of the World” includes the subsidiaries in South Africa and Australia.
The “Business Segment Reporting” of the F.I.L.A. Group aggregates companies by region on the
basis of the “operating location”.
For disclosure upon the association between the regions and F.I.L.A. group companies, reference
should be made to the attachments to the report in the “List of companies included in the
consolidation scope and other investments” paragraph.
The segment reporting required in accordance with IFRS 8 is presented below.
Interim Report at
March 31, 2018
19
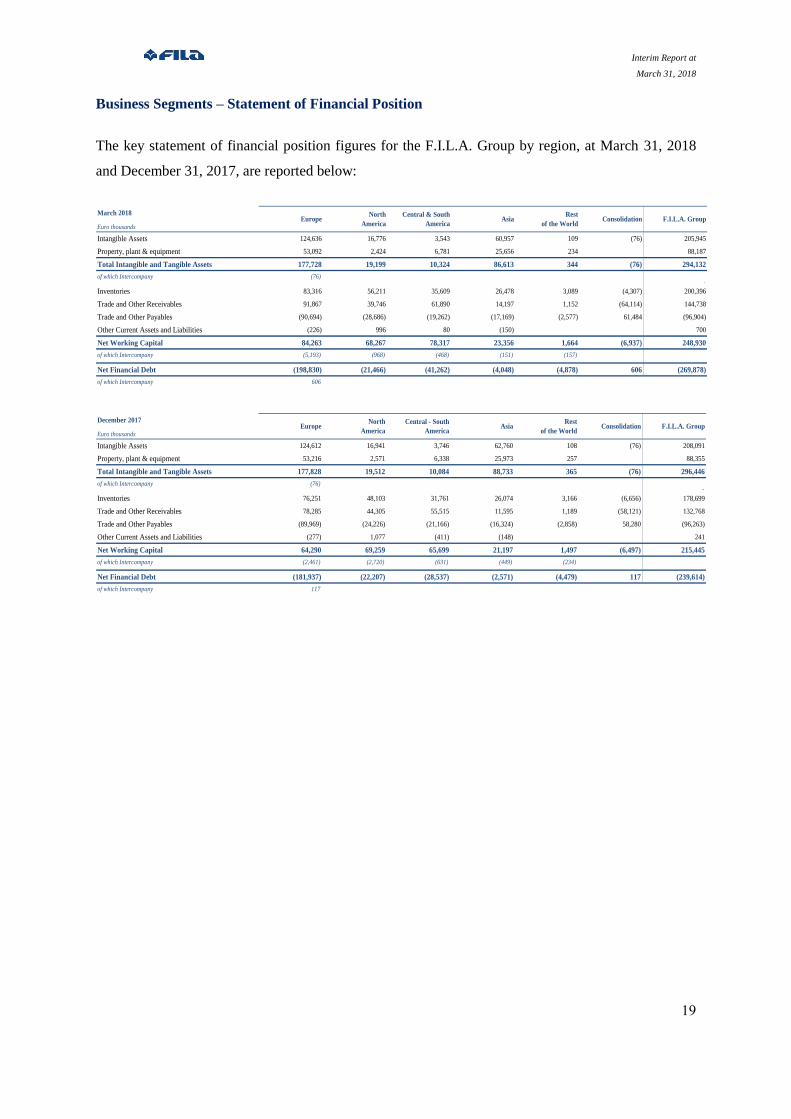
Business Segments – Statement of Financial Position
The key statement of financial position figures for the F.I.L.A. Group by region, at March 31, 2018
and December 31, 2017, are reported below:
March 2018
Euro thousands
Intangible Assets 124,636 16,776 3,543 60,957 109 (76) 205,945
Property, plant & equipment 53,092 2,424 6,781 25,656 234 88,187
Total Intangible and Tangible Assets 177,728 19,199 10,324 86,613 344 (76) 294,132
of which Intercompany (76) 0
Inventories 83,316 56,211 35,609 26,478 3,089 (4,307) 200,396
Trade and Other Receivables 91,867 39,746 61,890 14,197 1,152 (64,114) 144,738
Trade and Other Payables (90,694) (28,686) (19,262) (17,169) (2,577) 61,484 (96,904)
Other Current Assets and Liabilities (226) 996 80 (150) 700
Net Working Capital 84,263 68,267 78,317 23,356 1,664 (6,937) 248,930
of which Intercompany (5,193) (968) (468) (151) (157)
Net Financial Debt (198,830) (21,466) (41,262) (4,048) (4,878) 606 (269,878)
of which Intercompany 606
Consolidation F.I.L.A. GroupEuropeNorth
America
Central & South
AmericaAsia
Rest
of the World
December 2017
Euro thousands
Intangible Assets 124,612 16,941 3,746 62,760 108 (76) 208,091
Property, plant & equipment 53,216 2,571 6,338 25,973 257 88,355
Total Intangible and Tangible Assets 177,828 19,512 10,084 88,733 365 (76) 296,446
of which Intercompany (76) 0
Inventories 76,251 48,103 31,761 26,074 3,166 (6,656) 178,699
Trade and Other Receivables 78,285 44,305 55,515 11,595 1,189 (58,121) 132,768
Trade and Other Payables (89,969) (24,226) (21,166) (16,324) (2,858) 58,280 (96,263)
Other Current Assets and Liabilities (277) 1,077 (411) (148) 241
Net Working Capital 64,290 69,259 65,699 21,197 1,497 (6,497) 215,445
of which Intercompany (2,461) (2,720) (631) (449) (234)
Net Financial Debt (181,937) (22,207) (28,537) (2,571) (4,479) 117 (239,614)
of which Intercompany 117
Consolidation F.I.L.A. GroupEuropeNorth
America
Central - South
AmericaAsia
Rest
of the World
Interim Report at
March 31, 2018
20
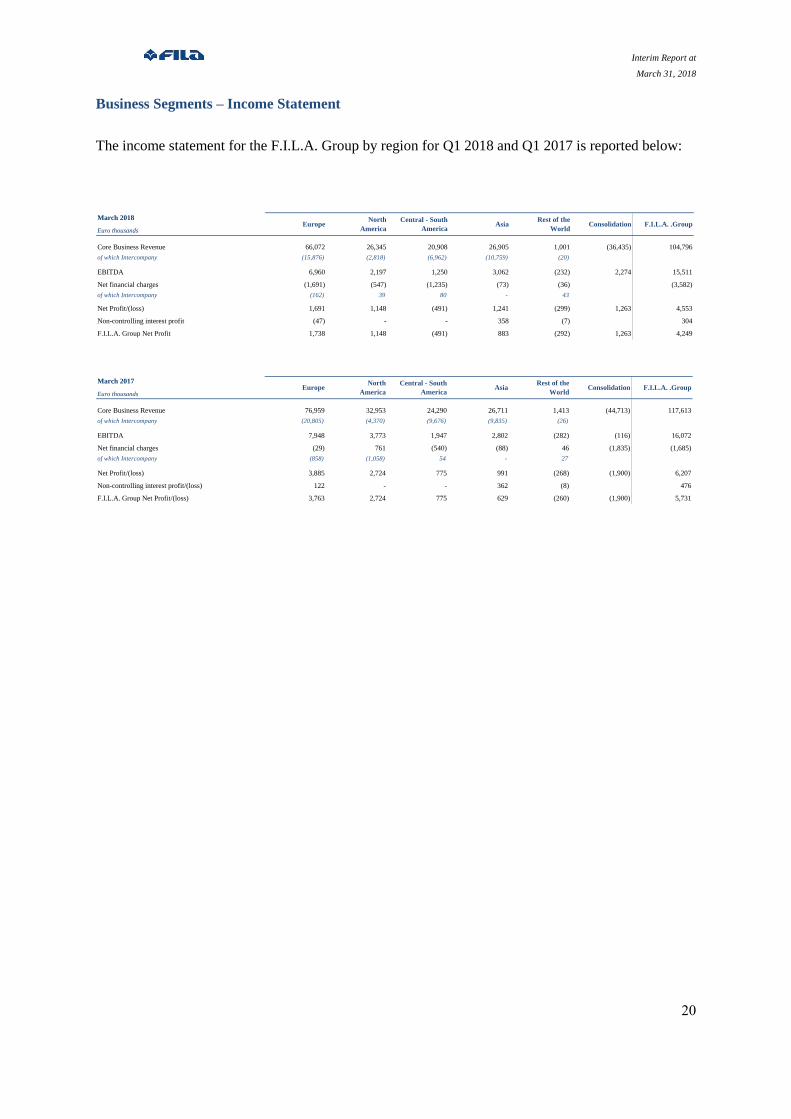
Business Segments – Income Statement
The income statement for the F.I.L.A. Group by region for Q1 2018 and Q1 2017 is reported below:
March 2018
Euro thousands
Core Business Revenue 66,072 26,345 20,908 26,905 1,001 (36,435) 104,796
of which Intercompany (15,876) (2,818) (6,962) (10,759) (20)
EBITDA 6,960 2,197 1,250 3,062 (232) 2,274 15,511
Net financial charges (1,691) (547) (1,235) (73) (36) (3,582)
of which Intercompany (162) 39 80 - 43
Net Profit/(loss) 1,691 1,148 (491) 1,241 (299) 1,263 4,553
Non-controlling interest profit (47) - - 358 (7) 304
F.I.L.A. Group Net Profit 1,738 1,148 (491) 883 (292) 1,263 4,249
F.I.L.A. .Group EuropeNorth
America
Central - South
AmericaAsia
Rest of the
WorldConsolidation
March 2017
Euro thousands
Core Business Revenue 76,959 32,953 24,290 26,711 1,413 (44,713) 117,613
of which Intercompany (20,805) (4,370) (9,676) (9,835) (26)
EBITDA 7,948 3,773 1,947 2,802 (282) (116) 16,072
Net financial charges (29) 761 (540) (88) 46 (1,835) (1,685)
of which Intercompany (858) (1,058) 54 - 27
Net Profit/(loss) 3,885 2,724 775 991 (268) (1,900) 6,207
Non-controlling interest profit/(loss) 122 - - 362 (8) 476
F.I.L.A. Group Net Profit/(loss) 3,763 2,724 775 629 (260) (1,900) 5,731
Consolidation F.I.L.A. .Group EuropeNorth
America
Central - South
AmericaAsia
Rest of the
World
Interim Report at
March 31, 2018
21
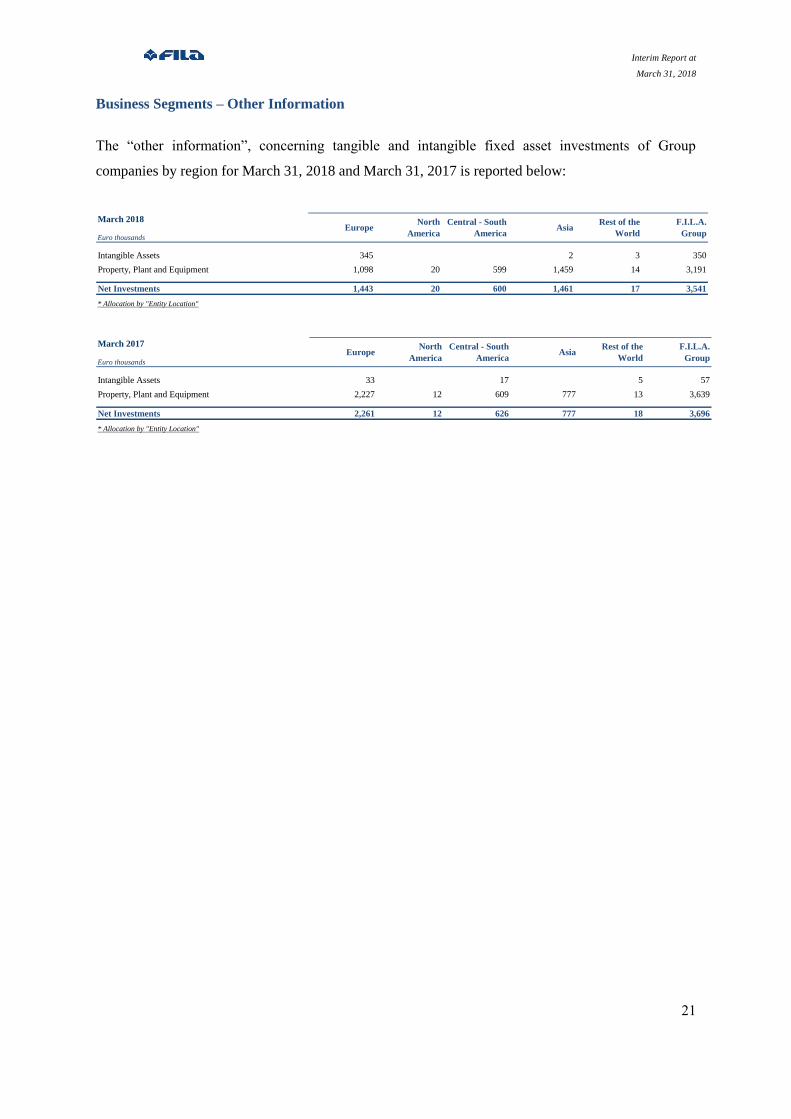
Business Segments – Other Information
The “other information”, concerning tangible and intangible fixed asset investments of Group
companies by region for March 31, 2018 and March 31, 2017 is reported below:
March 2018
Euro thousands
Intangible Assets 345 2 3 350
Property, Plant and Equipment 1,098 20 599 1,459 14 3,191
Net Investments 1,443 20 600 1,461 17 3,541
* Allocation by "Entity Location"
EuropeNorth
America
Central - South
AmericaAsia
Rest of the
World
F.I.L.A.
Group
March 2017
Euro thousands
Intangible Assets 33 17 5 57
Property, Plant and Equipment 2,227 12 609 777 13 3,639
Net Investments 2,261 12 626 777 18 3,696
* Allocation by "Entity Location"
F.I.L.A.
Group Europe
North
America
Central - South
AmericaAsia
Rest of the
World
Interim Report at
March 31, 2018
22
Subsequent events to the first quarter
On May 7, an agreement was signed for the acquisition by the subsidiary Dixon Ticonderoga
Company (U.S.A.) of 100% of Pacon Holding Company (“Pacon”) at an enterprise value of
US$ 325 million, in addition to US$ 15 million of tax benefits and therefore for total cash
consideration of US$ 340 million (subject to the usual adjustments on closing concerning
debt, cash and net working capital). For this purpose, on May 1, 2018 the vehicle company
FILA Acquisition Company was incorporated, with registered office in Delaware (U.S.A.),
held entirely by Dixon Ticonderoga Company (U.S.A.).
The transaction is subject to a number of conditions, including approval by the Antitrust
authority in accordance with the Hart-Scott-Rodino Antitrust Improvements Act in the United
States and other conditions typical of this type of transaction. The Pacon acquisition is
further testament to the Group’s overseas market development commitment and further
expands F.I.L.A on the world’s largest market. With Pacon - in addition - the Group will be
in a position to complete its colour and paper segment offer with a broad and recognised
portfolio of recreational - educational - creative products and tools targeting a highly
diversified audience. Pacon, founded in 1951, is a leading schools and arts & craft operator
on the US market, headquartered in Appleton in the state of Wisconsin. The range of products
includes over 8,500 items produced at 8 facilities located in the United States (3 in Appleton
and 3 in Neenah, in the state of Wisconsin), in Great Britain (1 facility in the West Midlands)
and in Canada (1 facility in Barrie, in the state of Ontario). The transaction is funded through
a medium/long-term bank loan agreed with Mediobanca - Banca di Credito Finanziario S.p.A.
and UniCredit S.p.A. (both as Joint Global Coordinator and Bookrunner) for a total amount of
Euro 520 million, including refinancing of current debt. The Board of Directors, in order to
optimise the capital structure, also submitted for the approval of the Shareholders’ Meeting of
F.I.L.A. a share capital increase for a maximum Euro 100 million (including any share
premium), by way of a rights offering with pre-emption rights and earmarked for the early
repayment of Group debt. The share capital increase shall be subject to completion of the
Pacon acquisition. Mediobanca - Banca di Credito Finanziario S.p.A. and UniCredit
Corporate & Investment Banking will act as Joint Global Coordinator and Joint Bookrunner
for the planned share capital increase and have signed a pre-underwriting agreement by which
they have committed, in accordance with typical market conditions, to underwrite the
subscription of any newly issued shares remaining unopted for a maximum amount equal to
the value of the share capital increase.

Interim Report at
March 31, 2018
23
Treasury shares
The parent F.I.L.A. S.p.A. did not hold treasury shares at March 31, 2018.
Interim Report at
March 31, 2018
24
II - Consolidated Financial Statements of the F.I.L.A. Group at March 31, 2018
Consolidated Financial Statements
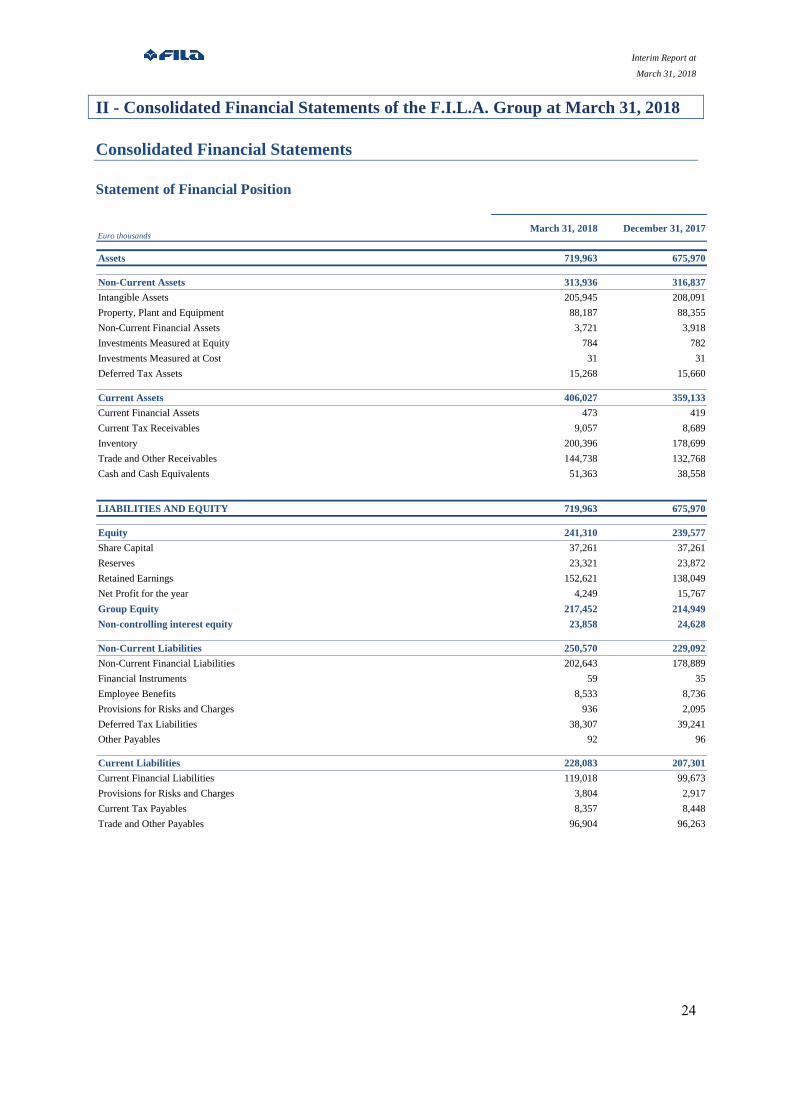
Statement of Financial Position
Euro thousandsMarch 31, 2018 December 31, 2017
Assets 719,963 675,970
Non-Current Assets 313,936 316,837
Intangible Assets 205,945 208,091
Property, Plant and Equipment 88,187 88,355
Non-Current Financial Assets 3,721 3,918
Investments Measured at Equity 784 782
Investments Measured at Cost 31 31
Deferred Tax Assets 15,268 15,660
Current Assets 406,027 359,133
Current Financial Assets 473 419
Current Tax Receivables 9,057 8,689
Inventory 200,396 178,699
Trade and Other Receivables 144,738 132,768
Cash and Cash Equivalents 51,363 38,558
LIABILITIES AND EQUITY 719,963 675,970
Equity 241,310 239,577
Share Capital 37,261 37,261
Reserves 23,321 23,872
Retained Earnings 152,621 138,049
Net Profit for the year 4,249 15,767
Group Equity 217,452 214,949
Non-controlling interest equity 23,858 24,628
Non-Current Liabilities 250,570 229,092
Non-Current Financial Liabilities 202,643 178,889
Financial Instruments 59 35
Employee Benefits 8,533 8,736
Provisions for Risks and Charges 936 2,095
Deferred Tax Liabilities 38,307 39,241
Other Payables 92 96
Current Liabilities 228,083 207,301
Current Financial Liabilities 119,018 99,673
Provisions for Risks and Charges 3,804 2,917
Current Tax Payables 8,357 8,448
Trade and Other Payables 96,904 96,263
Interim Report at
March 31, 2018
25
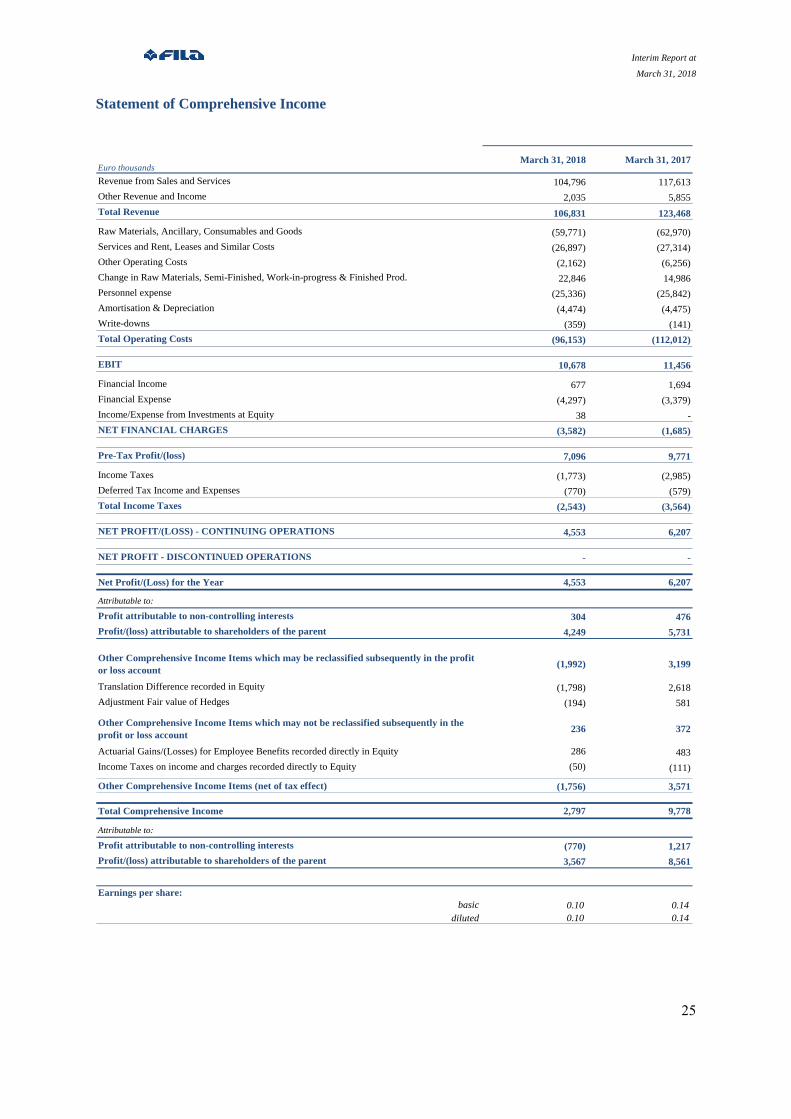
Statement of Comprehensive Income
Euro thousandsMarch 31, 2018 March 31, 2017
Revenue from Sales and Services 104,796 117,613
Other Revenue and Income 2,035 5,855
Total Revenue 106,831 123,468
Raw Materials, Ancillary, Consumables and Goods (59,771) (62,970)
Services and Rent, Leases and Similar Costs (26,897) (27,314)
Other Operating Costs (2,162) (6,256)
Change in Raw Materials, Semi-Finished, Work-in-progress & Finished Prod. 22,846 14,986
Personnel expense (25,336) (25,842)
Amortisation & Depreciation (4,474) (4,475)
Write-downs (359) (141)
Total Operating Costs (96,153) (112,012)
EBIT 10,678 11,456
Financial Income 677 1,694
Financial Expense (4,297) (3,379)
Income/Expense from Investments at Equity 38 -
NET FINANCIAL CHARGES (3,582) (1,685)
Pre-Tax Profit/(loss) 7,096 9,771
Income Taxes (1,773) (2,985)
Deferred Tax Income and Expenses (770) (579)
Total Income Taxes (2,543) (3,564)
NET PROFIT/(LOSS) - CONTINUING OPERATIONS 4,553 6,207
NET PROFIT - DISCONTINUED OPERATIONS - -
Net Profit/(Loss) for the Year 4,553 6,207
Attributable to:
Profit attributable to non-controlling interests 304 476
Profit/(loss) attributable to shareholders of the parent 4,249 5,731
Other Comprehensive Income Items which may be reclassified subsequently in the profit
or loss account(1,992) 3,199
Translation Difference recorded in Equity (1,798) 2,618
Adjustment Fair value of Hedges (194) 581
Other Comprehensive Income Items which may not be reclassified subsequently in the
profit or loss account236 372
Actuarial Gains/(Losses) for Employee Benefits recorded directly in Equity 286 483
Income Taxes on income and charges recorded directly to Equity (50) (111)
Other Comprehensive Income Items (net of tax effect) (1,756) 3,571
Total Comprehensive Income 2,797 9,778
Attributable to:
Profit attributable to non-controlling interests (770) 1,217
Profit/(loss) attributable to shareholders of the parent 3,567 8,561
Earnings per share:
basic 0.10 0.14
diluted 0.10 0.14
Interim Report at
March 31, 2018
26
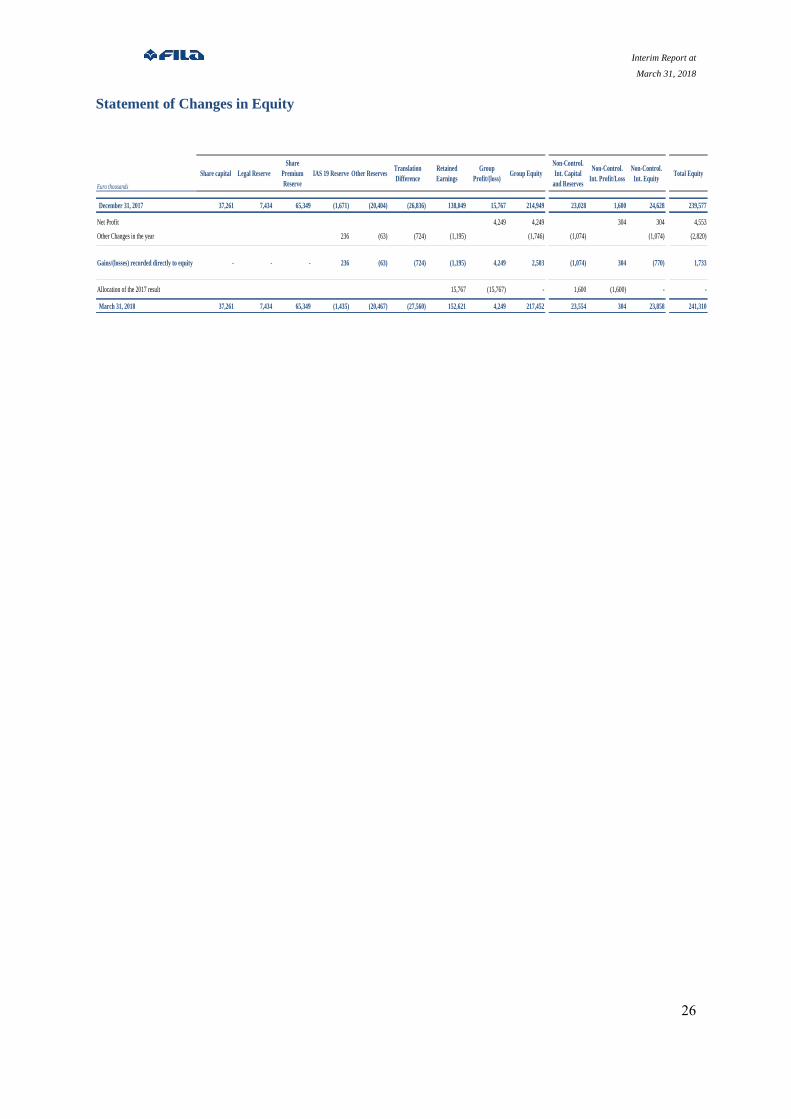
Statement of Changes in Equity
Euro thousands
Share capital Legal Reserve
Share
Premium
Reserve
IAS 19 Reserve Other ReservesTranslation
Difference
Retained
Earnings
Group
Profit/(loss)Group Equity
Non-Control.
Int. Capital
and Reserves
Non-Control.
Int. Profit/Loss
Non-Control.
Int. EquityTotal Equity
December 31, 2017 37,261 7,434 65,349 (1,671) (20,404) (26,836) 138,049 15,767 214,949 23,028 1,600 24,628 239,577
Net Profit 4,249 4,249 304 304 4,553
Other Changes in the year 236 (63) (724) (1,195) (1,746) (1,074) (1,074) (2,820)
Gains/(losses) recorded directly to equity - - - 236 (63) (724) (1,195) 4,249 2,503 (1,074) 304 (770) 1,733
Allocation of the 2017 result 15,767 (15,767) - 1,600 (1,600) - -
March 31, 2018 37,261 7,434 65,349 (1,435) (20,467) (27,560) 152,621 4,249 217,452 23,554 304 23,858 241,310
Interim Report at
March 31, 2018
27
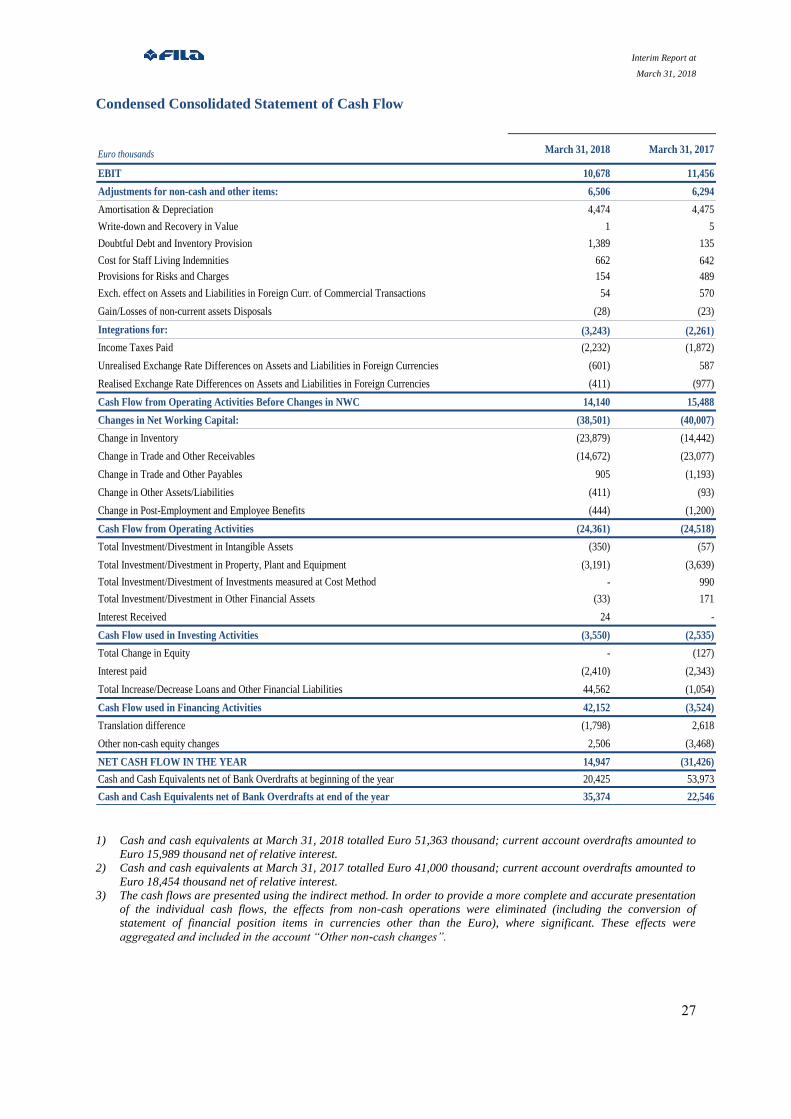
Condensed Consolidated Statement of Cash Flow
Euro thousands March 31, 2018 March 31, 2017
EBIT 10,678 11,456
Adjustments for non-cash and other items: 6,506 6,294
Amortisation & Depreciation 4,474 4,475
Write-down and Recovery in Value 1 5
Doubtful Debt and Inventory Provision 1,389 135
Cost for Staff Living Indemnities 662 642
Provisions for Risks and Charges 154 489
Exch. effect on Assets and Liabilities in Foreign Curr. of Commercial Transactions 54 570
Gain/Losses of non-current assets Disposals (28) (23)
Integrations for: (3,243) (2,261)
Income Taxes Paid (2,232) (1,872)
Unrealised Exchange Rate Differences on Assets and Liabilities in Foreign Currencies (601) 587
Realised Exchange Rate Differences on Assets and Liabilities in Foreign Currencies (411) (977)
Cash Flow from Operating Activities Before Changes in NWC 14,140 15,488
Changes in Net Working Capital: (38,501) (40,007)
Change in Inventory (23,879) (14,442)
Change in Trade and Other Receivables (14,672) (23,077)
Change in Trade and Other Payables 905 (1,193)
Change in Other Assets/Liabilities (411) (93)
Change in Post-Employment and Employee Benefits (444) (1,200)
Cash Flow from Operating Activities (24,361) (24,518)
Total Investment/Divestment in Intangible Assets (350) (57)
Total Investment/Divestment in Property, Plant and Equipment (3,191) (3,639)
Total Investment/Divestment of Investments measured at Cost Method - 990
Total Investment/Divestment in Other Financial Assets (33) 171
Interest Received 24 -
Cash Flow used in Investing Activities (3,550) (2,535)
Total Change in Equity - (127)
Interest paid (2,410) (2,343)
Total Increase/Decrease Loans and Other Financial Liabilities 44,562 (1,054)
Cash Flow used in Financing Activities 42,152 (3,524)
Translation difference (1,798) 2,618
Other non-cash equity changes 2,506 (3,468)
NET CASH FLOW IN THE YEAR 14,947 (31,426)
Cash and Cash Equivalents net of Bank Overdrafts at beginning of the year 20,425 53,973
Cash and Cash Equivalents net of Bank Overdrafts at end of the year 35,374 22,546
1) Cash and cash equivalents at March 31, 2018 totalled Euro 51,363 thousand; current account overdrafts amounted to
Euro 15,989 thousand net of relative interest.
2) Cash and cash equivalents at March 31, 2017 totalled Euro 41,000 thousand; current account overdrafts amounted to
Euro 18,454 thousand net of relative interest.
3) The cash flows are presented using the indirect method. In order to provide a more complete and accurate presentation
of the individual cash flows, the effects from non-cash operations were eliminated (including the conversion of
statement of financial position items in currencies other than the Euro), where significant. These effects were
aggregated and included in the account “Other non-cash changes”.
Interim Report at
March 31, 2018
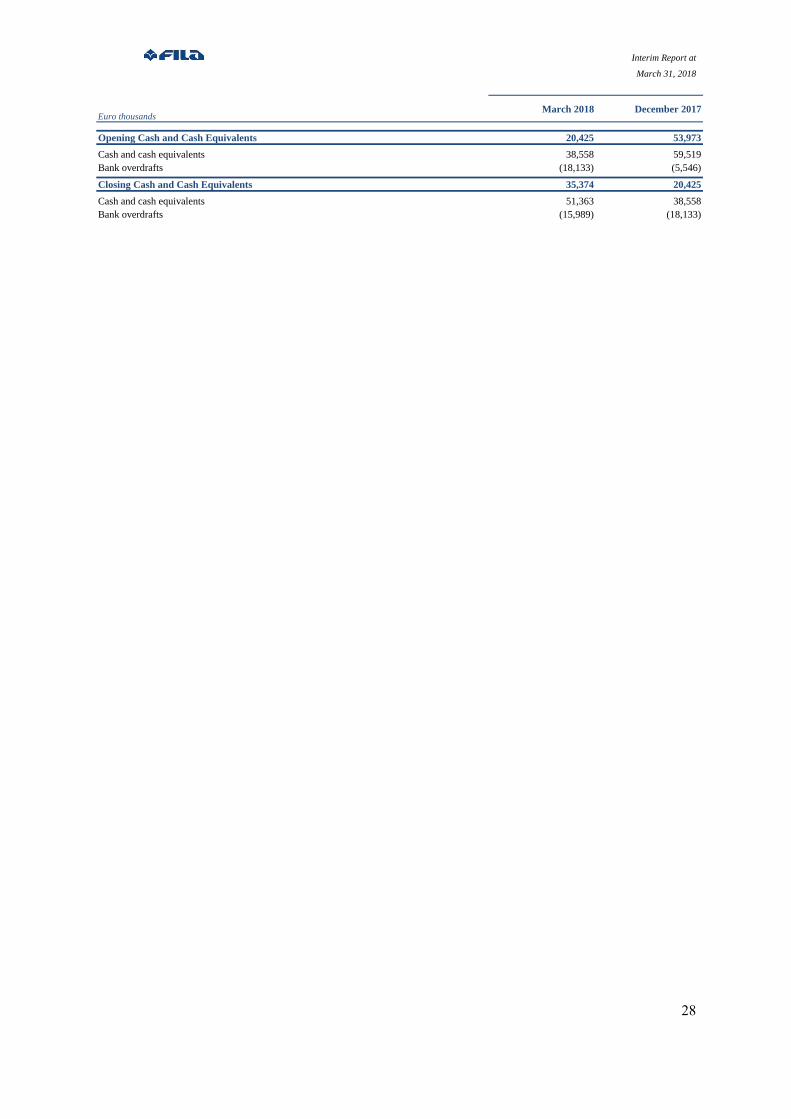
28
Euro thousandsMarch 2018 December 2017
Opening Cash and Cash Equivalents 20,425 53,973
Cash and cash equivalents 38,558 59,519
Bank overdrafts (18,133) (5,546)
Closing Cash and Cash Equivalents 35,374 20,425
Cash and cash equivalents 51,363 38,558
Bank overdrafts (15,989) (18,133)
Interim Report at
March 31, 2018
29
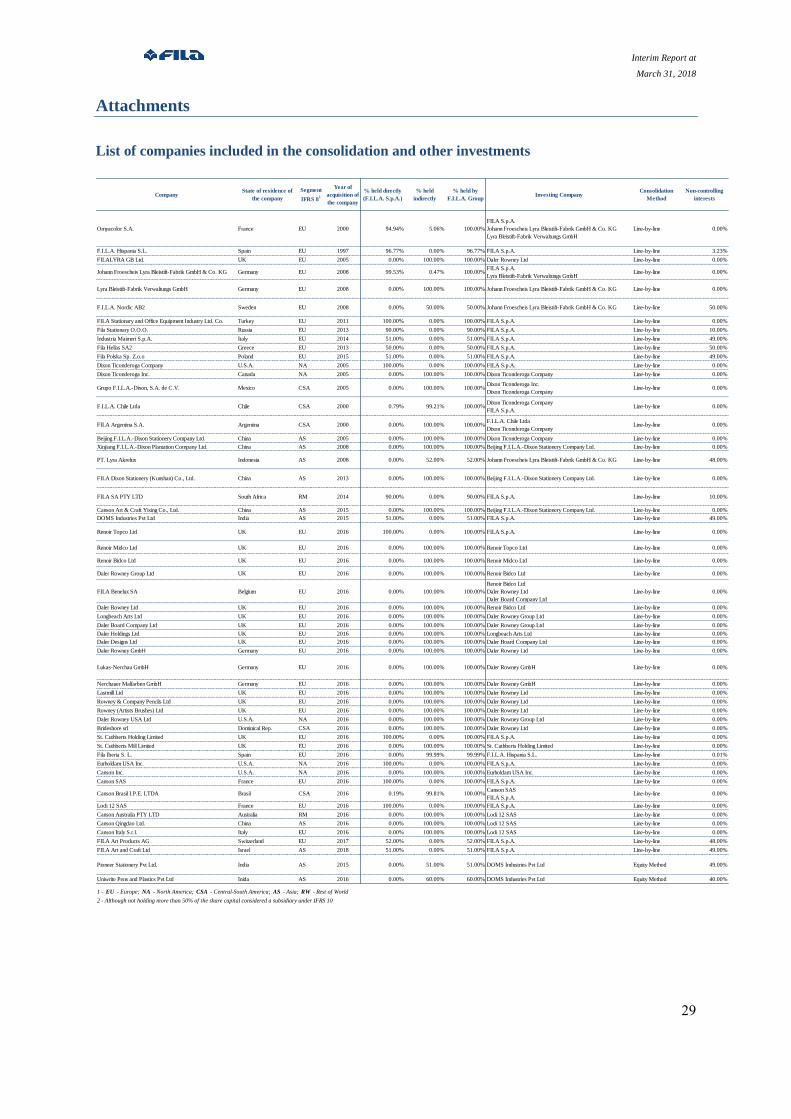
Attachments
List of companies included in the consolidation and other investments
CompanyState of residence of
the company
Segment
IFRS 81
Year of
acquisition of
the company
% held directly
(F.I.L.A. S.p.A.)
% held
indirectly
% held by
F.I.L.A. GroupInvesting Company
Consolidation
Method
Non-controlling
interests
Omyacolor S.A. France EU 2000 94.94% 5.06% 100.00%
FILA S.p.A.
Johann Froescheis Lyra Bleistift-Fabrik GmbH & Co. KG
Lyra Bleistift-Fabrik Verwaltungs GmbH
Line-by-line 0.00%
F.I.L.A. Hispania S.L. Spain EU 1997 96.77% 0.00% 96.77% FILA S.p.A. Line-by-line 3.23%
FILALYRA GB Ltd. UK EU 2005 0.00% 100.00% 100.00% Daler Rowney Ltd Line-by-line 0.00%
Johann Froescheis Lyra Bleistift-Fabrik GmbH & Co. KG Germany EU 2008 99.53% 0.47% 100.00%FILA S.p.A.
Lyra Bleistift-Fabrik Verwaltungs GmbHLine-by-line 0.00%
Lyra Bleistift-Fabrik Verwaltungs GmbH Germany EU 2008 0.00% 100.00% 100.00% Johann Froescheis Lyra Bleistift-Fabrik GmbH & Co. KG Line-by-line 0.00%
F.I.L.A. Nordic AB2 Sweden EU 2008 0.00% 50.00% 50.00% Johann Froescheis Lyra Bleistift-Fabrik GmbH & Co. KG Line-by-line 50.00%
FILA Stationary and Office Equipment Industry Ltd. Co. Turkey EU 2011 100.00% 0.00% 100.00% FILA S.p.A. Line-by-line 0.00%
Fila Stationary O.O.O. Russia EU 2013 90.00% 0.00% 90.00% FILA S.p.A. Line-by-line 10.00%
Industria Maimeri S.p.A. Italy EU 2014 51.00% 0.00% 51.00% FILA S.p.A. Line-by-line 49.00%
Fila Hellas SA2 Greece EU 2013 50.00% 0.00% 50.00% FILA S.p.A. Line-by-line 50.00%
Fila Polska Sp. Z.o.o Poland EU 2015 51.00% 0.00% 51.00% FILA S.p.A. Line-by-line 49.00%
Dixon Ticonderoga Company U.S.A. NA 2005 100.00% 0.00% 100.00% FILA S.p.A. Line-by-line 0.00%
Dixon Ticonderoga Inc. Canada NA 2005 0.00% 100.00% 100.00% Dixon Ticonderoga Company Line-by-line 0.00%
Grupo F.I.L.A.-Dixon, S.A. de C.V. Mexico CSA 2005 0.00% 100.00% 100.00%Dixon Ticonderoga Inc.
Dixon Ticonderoga CompanyLine-by-line 0.00%
F.I.L.A. Chile Ltda Chile CSA 2000 0.79% 99.21% 100.00%Dixon Ticonderoga Company
FILA S.p.A.Line-by-line 0.00%
FILA Argentina S.A. Argentina CSA 2000 0.00% 100.00% 100.00%F.I.L.A. Chile Ltda
Dixon Ticonderoga CompanyLine-by-line 0.00%
Beijing F.I.L.A.-Dixon Stationery Company Ltd. China AS 2005 0.00% 100.00% 100.00% Dixon Ticonderoga Company Line-by-line 0.00%
Xinjiang F.I.L.A.-Dixon Plantation Company Ltd. China AS 2008 0.00% 100.00% 100.00% Beijing F.I.L.A.-Dixon Stationery Company Ltd. Line-by-line 0.00%
PT. Lyra Akrelux Indonesia AS 2008 0.00% 52.00% 52.00% Johann Froescheis Lyra Bleistift-Fabrik GmbH & Co. KG Line-by-line 48.00%
FILA Dixon Stationery (Kunshan) Co., Ltd. China AS 2013 0.00% 100.00% 100.00% Beijing F.I.L.A.-Dixon Stationery Company Ltd. Line-by-line 0.00%
FILA SA PTY LTD South Africa RM 2014 90.00% 0.00% 90.00% FILA S.p.A. Line-by-line 10.00%
Canson Art & Craft Yixing Co., Ltd. China AS 2015 0.00% 100.00% 100.00% Beijing F.I.L.A.-Dixon Stationery Company Ltd. Line-by-line 0.00%
DOMS Industries Pvt Ltd India AS 2015 51.00% 0.00% 51.00% FILA S.p.A. Line-by-line 49.00%
Renoir Topco Ltd UK EU 2016 100.00% 0.00% 100.00% FILA S.p.A. Line-by-line 0.00%
Renoir Midco Ltd UK EU 2016 0.00% 100.00% 100.00% Renoir Topco Ltd Line-by-line 0.00%
Renoir Bidco Ltd UK EU 2016 0.00% 100.00% 100.00% Renoir Midco Ltd Line-by-line 0.00%
Daler Rowney Group Ltd UK EU 2016 0.00% 100.00% 100.00% Renoir Bidco Ltd Line-by-line 0.00%
FILA Benelux SA Belgium EU 2016 0.00% 100.00% 100.00%
Renoir Bidco Ltd
Daler Rowney Ltd
Daler Board Company Ltd
Line-by-line 0.00%
Daler Rowney Ltd UK EU 2016 0.00% 100.00% 100.00% Renoir Bidco Ltd Line-by-line 0.00%
Longbeach Arts Ltd UK EU 2016 0.00% 100.00% 100.00% Daler Rowney Group Ltd Line-by-line 0.00%
Daler Board Company Ltd UK EU 2016 0.00% 100.00% 100.00% Daler Rowney Group Ltd Line-by-line 0.00%
Daler Holdings Ltd UK EU 2016 0.00% 100.00% 100.00% Longbeach Arts Ltd Line-by-line 0.00%
Daler Designs Ltd UK EU 2016 0.00% 100.00% 100.00% Daler Board Company Ltd Line-by-line 0.00%
Daler Rowney GmbH Germany EU 2016 0.00% 100.00% 100.00% Daler Rowney Ltd Line-by-line 0.00%
Lukas-Nerchau GmbH Germany EU 2016 0.00% 100.00% 100.00% Daler Rowney GmbH Line-by-line 0.00%
Nerchauer Malfarben GmbH Germany EU 2016 0.00% 100.00% 100.00% Daler Rowney GmbH Line-by-line 0.00%
Lastmill Ltd UK EU 2016 0.00% 100.00% 100.00% Daler Rowney Ltd Line-by-line 0.00%
Rowney & Company Pencils Ltd UK EU 2016 0.00% 100.00% 100.00% Daler Rowney Ltd Line-by-line 0.00%
Rowney (Artists Brushes) Ltd UK EU 2016 0.00% 100.00% 100.00% Daler Rowney Ltd Line-by-line 0.00%
Daler Rowney USA Ltd U.S.A. NA 2016 0.00% 100.00% 100.00% Daler Rowney Group Ltd Line-by-line 0.00%
Brideshore srl Dominical Rep. CSA 2016 0.00% 100.00% 100.00% Daler Rowney Ltd Line-by-line 0.00%
St. Cuthberts Holding Limited UK EU 2016 100.00% 0.00% 100.00% FILA S.p.A. Line-by-line 0.00%
St. Cuthberts Mill Limited UK EU 2016 0.00% 100.00% 100.00% St. Cuthberts Holding Limited Line-by-line 0.00%
Fila Iberia S. L. Spain EU 2016 0.00% 99.99% 99.99% F.I.L.A. Hispania S.L. Line-by-line 0.01%
Eurholdam USA Inc. U.S.A. NA 2016 100.00% 0.00% 100.00% FILA S.p.A. Line-by-line 0.00%
Canson Inc. U.S.A. NA 2016 0.00% 100.00% 100.00% Eurholdam USA Inc. Line-by-line 0.00%
Canson SAS France EU 2016 100.00% 0.00% 100.00% FILA S.p.A. Line-by-line 0.00%
Canson Brasil I.P.E. LTDA Brasil CSA 2016 0.19% 99.81% 100.00%Canson SAS
FILA S.p.A.Line-by-line 0.00%
Lodi 12 SAS France EU 2016 100.00% 0.00% 100.00% FILA S.p.A. Line-by-line 0.00%
Canson Australia PTY LTD Australia RM 2016 0.00% 100.00% 100.00% Lodi 12 SAS Line-by-line 0.00%
Canson Qingdao Ltd. China AS 2016 0.00% 100.00% 100.00% Lodi 12 SAS Line-by-line 0.00%
Canson Italy S.r.l. Italy EU 2016 0.00% 100.00% 100.00% Lodi 12 SAS Line-by-line 0.00%
FILA Art Products AG Switzerland EU 2017 52.00% 0.00% 52.00% FILA S.p.A. Line-by-line 48.00%
FILA Art and Craft Ltd Israel AS 2018 51.00% 0.00% 51.00% FILA S.p.A. Line-by-line 49.00%
Pioneer Stationery Pvt Ltd. India AS 2015 0.00% 51.00% 51.00% DOMS Industries Pvt Ltd Equity Method 49.00%
Uniwrite Pens and Plastics Pvt Ltd Inida AS 2016 0.00% 60.00% 60.00% DOMS Industries Pvt Ltd Equity Method 40.00%
1 - EU - Europe; NA - North America; CSA - Central-South America; AS - Asia; RW - Rest of World
2 - Although not holding more than 50% of the share capital considered a subsidiary under IFRS 10
Interim Report at
March 31, 2018
30
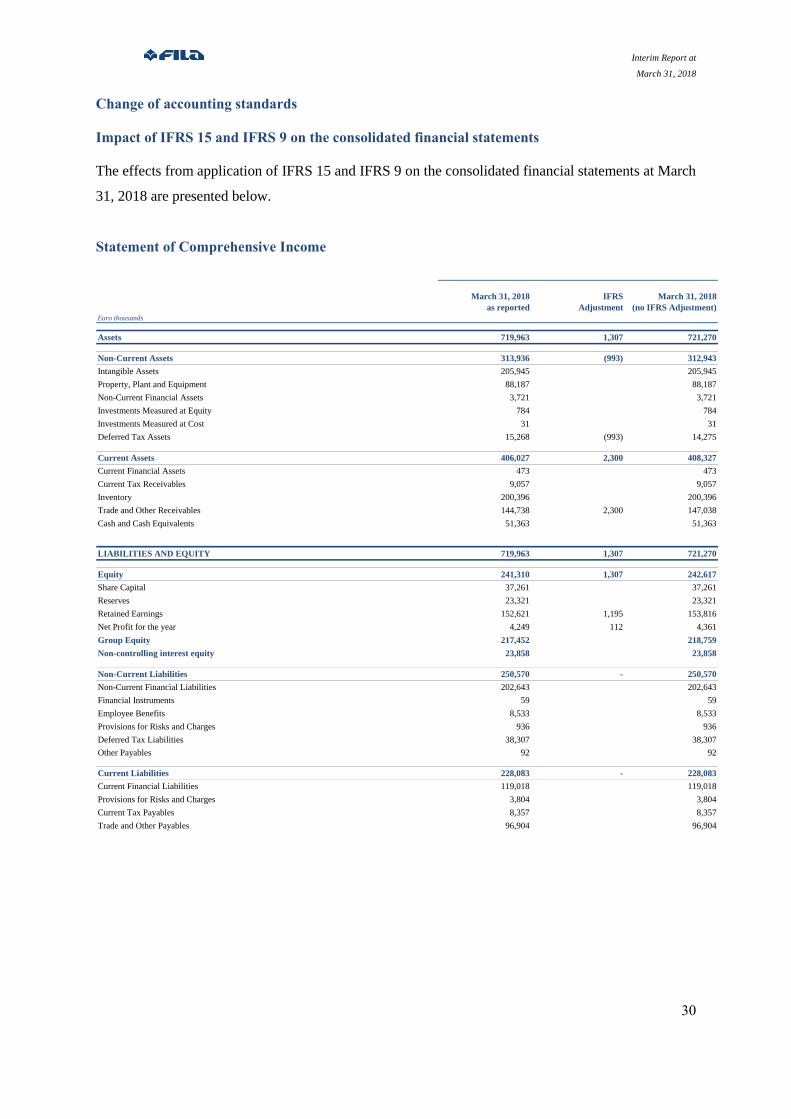
Change of accounting standards
Impact of IFRS 15 and IFRS 9 on the consolidated financial statements
The effects from application of IFRS 15 and IFRS 9 on the consolidated financial statements at March
31, 2018 are presented below.
Statement of Comprehensive Income
Euro thousands
March 31, 2018
as reported
IFRS
Adjustment
March 31, 2018
(no IFRS Adjustment)
Assets 719,963 1,307 721,270
Non-Current Assets 313,936 (993) 312,943
Intangible Assets 205,945 205,945
Property, Plant and Equipment 88,187 88,187
Non-Current Financial Assets 3,721 3,721
Investments Measured at Equity 784 784
Investments Measured at Cost 31 31
Deferred Tax Assets 15,268 (993) 14,275
Current Assets 406,027 2,300 408,327
Current Financial Assets 473 473
Current Tax Receivables 9,057 9,057
Inventory 200,396 200,396
Trade and Other Receivables 144,738 2,300 147,038
Cash and Cash Equivalents 51,363 51,363
LIABILITIES AND EQUITY 719,963 1,307 721,270
Equity 241,310 1,307 242,617
Share Capital 37,261 37,261
Reserves 23,321 23,321
Retained Earnings 152,621 1,195 153,816
Net Profit for the year 4,249 112 4,361
Group Equity 217,452 218,759
Non-controlling interest equity 23,858 23,858
Non-Current Liabilities 250,570 - 250,570
Non-Current Financial Liabilities 202,643 202,643
Financial Instruments 59 59
Employee Benefits 8,533 8,533
Provisions for Risks and Charges 936 936
Deferred Tax Liabilities 38,307 38,307
Other Payables 92 92
Current Liabilities 228,083 - 228,083
Current Financial Liabilities 119,018 119,018
Provisions for Risks and Charges 3,804 3,804
Current Tax Payables 8,357 8,357
Trade and Other Payables 96,904 96,904
Interim Report at
March 31, 2018
31
Statement of Comprehensive Income
Euro thousands
March 31, 2018
as reported
IFRS
Adjustment
March 31, 2018
(no IFRS Adjustment)
Revenue from Sales and Services 104,796 916 105,712
Other Revenue and Income 2,035 - 2,035
Total Revenue 106,831 916 107,747- -
Raw Materials, Ancillary, Consumables and Goods (59,771) - (59,771)
Services and Rent, Leases and Similar Costs (26,897) (782) (27,679)
Other Operating Costs (2,162) - (2,162)
Change in Raw Materials, Semi-Finished, Work-in-progress & Finished Prod. 22,846 - 22,846
Personnel expense (25,336) - (25,336)
Amortisation & Depreciation (4,474) - (4,474)
Write-downs (359) 200 (159)
Total Operating Costs (96,153) (582) (96,735)
EBIT 10,678 334 11,012- -
Financial Income 677 - 677
Financial Expense (4,297) (134) (4,431)
Income/Expense from Investments at Equity 38 - 38
NET FINANCIAL CHARGES (3,582) (134) (3,716)
Pre-Tax Profit/(loss) 7,096 200 7,296- -
Income Taxes (1,773) - (1,773)
Deferred Tax Income and Expenses (770) (88) (858)
Total Income Taxes (2,543) (88) (2,631)
NET PROFIT/(LOSS) - CONTINUING OPERATIONS 4,553 112 4,665
NET PROFIT - DISCONTINUED OPERATIONS - - -
Net Profit/(Loss) for the Year 4,553 112 4,665
Attributable to:
Profit attributable to non-controlling interests 304 304
Profit/(loss) attributable to shareholders of the parent 4,249 4,361
Other Comprehensive Income Items which may be reclassified subsequently in the profit
or loss account(1,992) - (1,992)
Translation Difference recorded in Equity (1,798) - (1,798)
Adjustment Fair value of Hedges (194) - (194)
Other Comprehensive Income Items which may not be reclassified subsequently in the
profit or loss account236 - 236
Actuarial Gains/(Losses) for Employee Benefits recorded directly in Equity 286 - 286
Income Taxes on income and charges recorded directly to Equity (50) - (50)
Other Comprehensive Income Items (net of tax effect) (1,756) - (1,756)
Total Comprehensive Income 2,797 112 2,909
Attributable to:
Profit attributable to non-controlling interests (770) (770)
Profit/(loss) attributable to shareholders of the parent 3,567 3,679
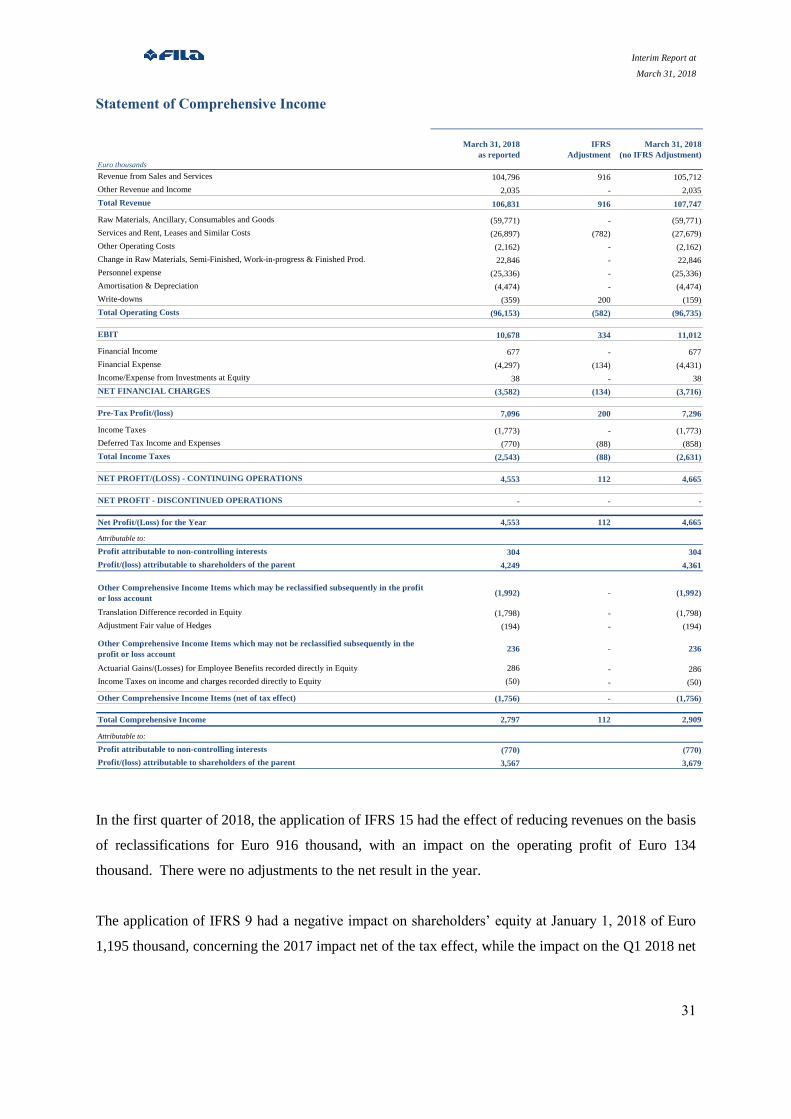
In the first quarter of 2018, the application of IFRS 15 had the effect of reducing revenues on the basis
of reclassifications for Euro 916 thousand, with an impact on the operating profit of Euro 134
thousand. There were no adjustments to the net result in the year.
The application of IFRS 9 had a negative impact on shareholders’ equity at January 1, 2018 of Euro
1,195 thousand, concerning the 2017 impact net of the tax effect, while the impact on the Q1 2018 net
Interim Report at
March 31, 2018
32
profit was Euro 112 thousand. Simultaneously, a reduction in “Trade and Other Receivables” of Euro
2,300 thousand was recorded, with an increase in deferred tax assets of Euro 993 thousand.
Interim Report at
March 31, 2018
33
Transactions relating to Atypical and/or Unusual Operations
In accordance with Consob Communication of July 28, 2006, during 2018, F.I.L.A. S.p.A. did not
undertake any atypical and/or unusual operations as defined by this communication, whereby atypical
and/or unusual operations refers to operations which for size/importance, nature of the counterparties,
nature of the transaction, method in determining the transfer price or time period (close to the year-
end) may give rise to doubts in relation to: the correctness/completeness of the information in the
financial statements, conflicts of interest, the safeguarding of the company’s assets and the protection
of minority shareholders.
The Board of Directors
THE CHAIRMAN
Mr. Gianni Mion
Interim Report at
March 31, 2018
34
Declaration of the Executive Officer for Financial Reporting


![OIL PAINTINGS, WATERCOLOURS, DRAWINGS, PRINTS AND · PDF fileOIL PAINTINGS, WATERCOLOURS, DRAWINGS, PRINTS AND ... together with two other watercolours by the same hand. [3] *£200](https://static.documents.pub/doc/80x56/5abb186f7f8b9a441d8c67c7/oil-paintings-watercolours-drawings-prints-and-paintings-watercolours-drawings.jpg)


