18
File Name: Supplementary Information Description: Supplementary Figures, Supplementary Notes, Supplementary Methods and Supplementary References File Name: Peer Review File Description:

File Name: Supplementary Information Description: Supplementary Figures, Supplementary Notes, Supplementary Methods and Supplementary References File Name: Peer Review File Description:

1
Supplementary Figure 1. Electron Microscopy characterization. High resolution TEM
images of Al and of Al@Cu2O nanoparticles. Each Al nanocrystal is surrounded by a 2-4
nm amorphous, native Al2O3 layer that also separates the Al core from the Cu2O layer in
the Al-Cu2O nanoparticles. The Cu2O shell was grown uniformly around Al core. HRTEM
image of the Cu2O layer shows lattice fringe with d-spacing of about ~0.3 nm
corresponding to Cu2O (110). Scales bars in (a) is 100 nm, in (b) is 5nm, in (c) is 20 nm,
and in (d) is 1 nm.

2
Supplementary Figure 2. Optical characterization of Al, Al@Cu2O and Cu2O.
Experimental (left) and theoretical (right) UV-Vis extinction spectra of Al NCs, Al@Cu2O
and Cu2O in IPA. Pristine Al NCs show a dipolar LSPR around 460 nm that redshifts to
around 550 nm after growth of the Cu2O shell (typical thickness of the is about 15-20 nm)
due to real part of the Cu2O permittivity. Extinction spectra in the wavelength range from
350 nm to 1000 nm of the nanoparticles were recorded by Cary 5000 UV-Vis-NIR
Spectrometer.
3
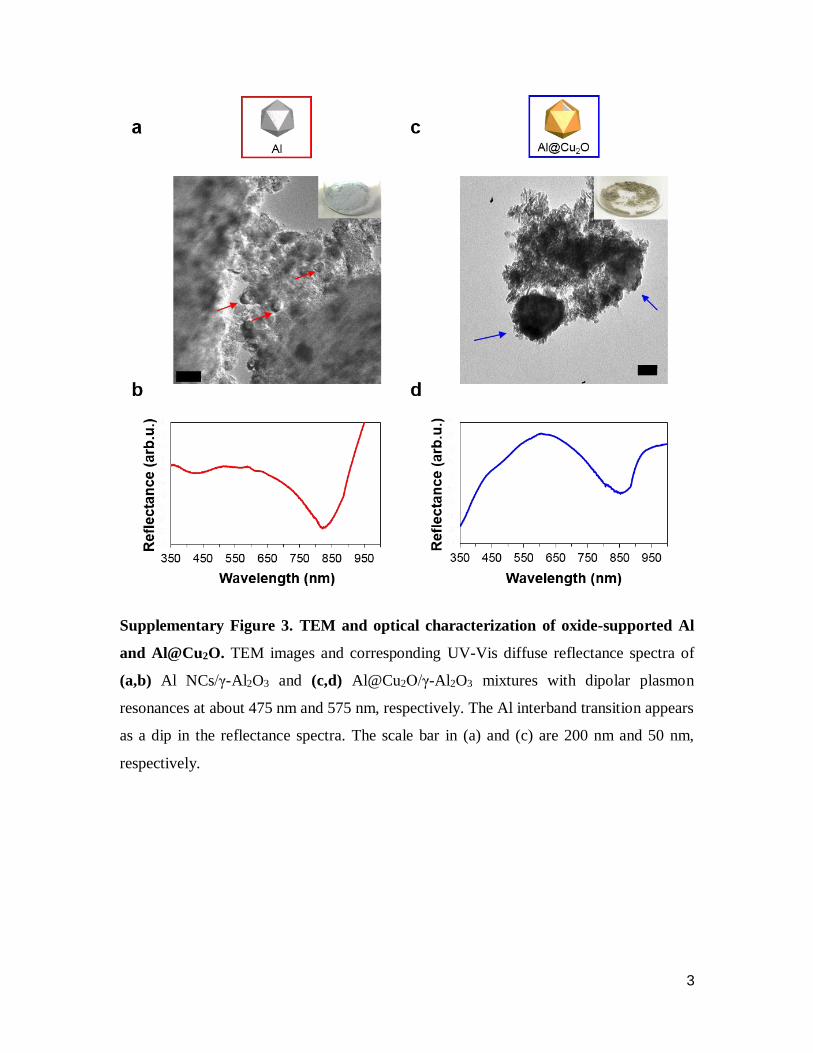
Supplementary Figure 3. TEM and optical characterization of oxide-supported Al
and Al@Cu2O. TEM images and corresponding UV-Vis diffuse reflectance spectra of
(a,b) Al NCs/γ-Al2O3 and (c,d) Al@Cu2O/γ-Al2O3 mixtures with dipolar plasmon
resonances at about 475 nm and 575 nm, respectively. The Al interband transition appears
as a dip in the reflectance spectra. The scale bar in (a) and (c) are 200 nm and 50 nm,
respectively.

4
Supplementary Figure 4. X-ray photoelectron spectroscopy (XPS) characterization
of Al@Cu2O sample before and after illumination under reaction condition.

5
Supplementary Figure 5. Preliminary photocatalytic CO2 hydrogenation and control
experiments. (a) Typical gas chromatogram of the reaction chamber under various
conditions. (b) Spectrum of the light source used for illumination in (a). CO formation was
only detected during irradiation of Al@Cu2O nanoparticle/γ-Al2O3 mixture in CO2 and H2
(1:1, total flow rate of 10 sccm).
6
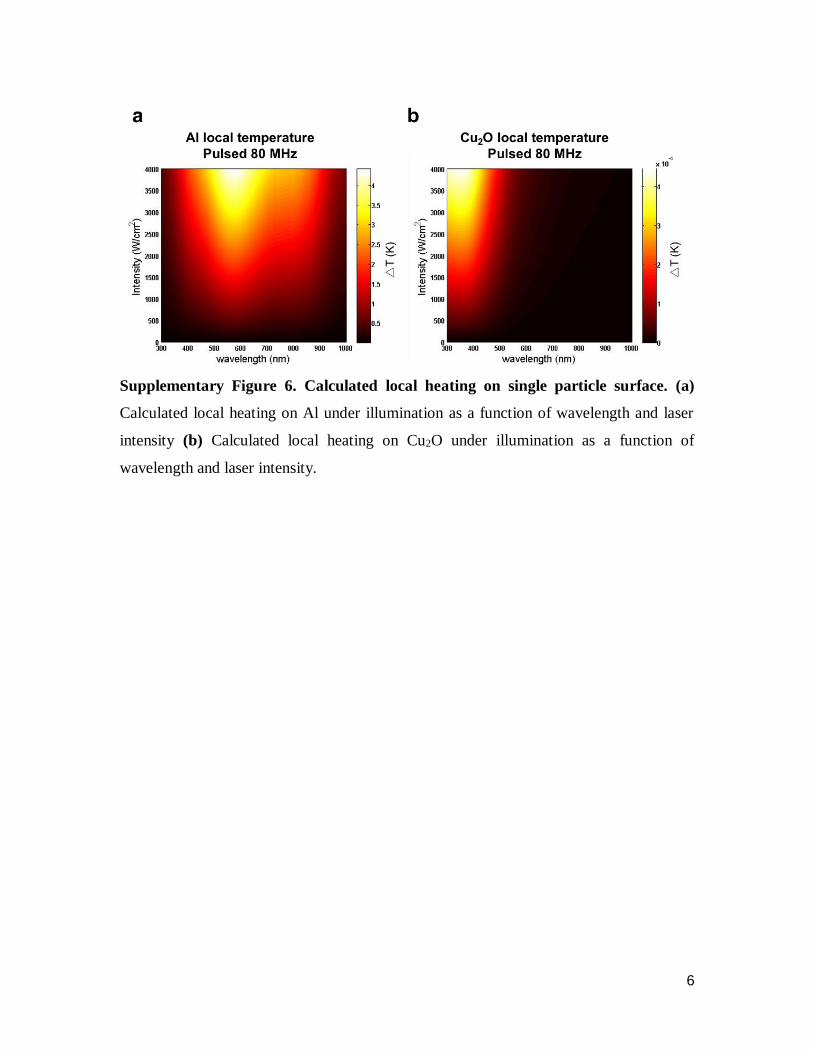
Supplementary Figure 6. Calculated local heating on single particle surface. (a)
Calculated local heating on Al under illumination as a function of wavelength and laser
intensity (b) Calculated local heating on Cu2O under illumination as a function of
wavelength and laser intensity.

7
Supplementary Figure 7. Spatial high resolution photothermal imaging. (a) Before the
illumination, the photocatalyst and stainless steel stage are in thermal equilibrium with
room temperature. (b) Upon illumination with 10 Wcm-2 visible light, the temperature of
pure oxide support reaches up to 55°C, while after loading plasmonic nanoparticles into
the oxide support, the temperature rises up to 180°C under the same light intensity. (c) The
area with high temperature increase in (c) is much large than that initial beam size due to
multiple scattering events in medium by plasmonic particle surface. In (b), however, the
heated area stays very close to the initial beam size in absence of plasmonic particle oxide
support.

8
Supplementary Figure 8. Thermal-driven rWGS: CO/CH4 selectivity as function of
temperature.

9
Supplementary Figure 9. Local field enhancement calculation for Al2O3@Cu2O. (a)
Local field enhancement |E(r)|2 spectrum Integrated over the volume of 15 nm thick Cu2O
shell surrounding 100 nm Al2O3 sphere. As can be seen, unlike to the Al core of the same
size (Fig. 3b), calculated |E(r)|2 in Cu2O shell surrounding Al2O3 core does not reproduce
the features in measured EQE spectrum. (b) |E/E0|2 plot of Al2O3@ Cu2O at 500 nm peak.
10
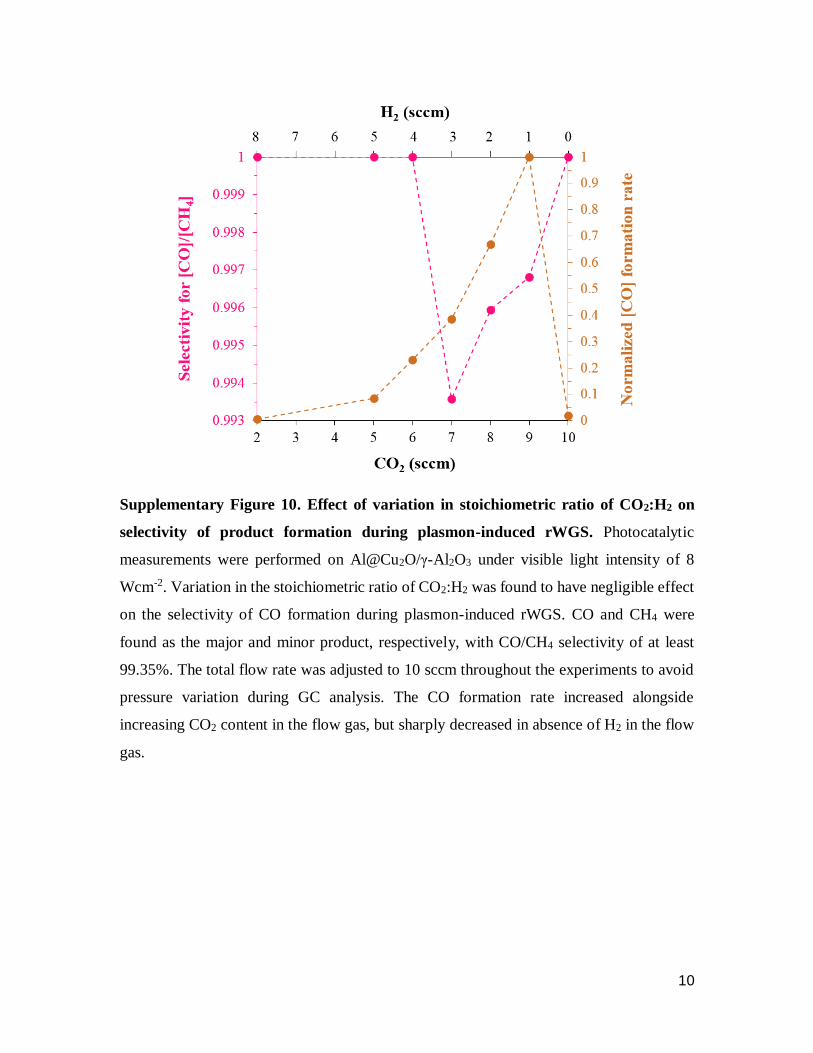
Supplementary Figure 10. Effect of variation in stoichiometric ratio of CO2:H2 on
selectivity of product formation during plasmon-induced rWGS. Photocatalytic
measurements were performed on Al@Cu2O/γ-Al2O3 under visible light intensity of 8
Wcm-2. Variation in the stoichiometric ratio of CO2:H2 was found to have negligible effect
on the selectivity of CO formation during plasmon-induced rWGS. CO and CH4 were
found as the major and minor product, respectively, with CO/CH4 selectivity of at least
99.35%. The total flow rate was adjusted to 10 sccm throughout the experiments to avoid
pressure variation during GC analysis. The CO formation rate increased alongside
increasing CO2 content in the flow gas, but sharply decreased in absence of H2 in the flow
gas.

11
Supplementary Figure 11. Photocatalytic study of rWGS in static mode. Similar to
flow packed-bed reactor conditions in which CO2 and H2 were continuously flowed into
the chamber, CO was found as the product of CO2 transformation in static mode
configuration.
12
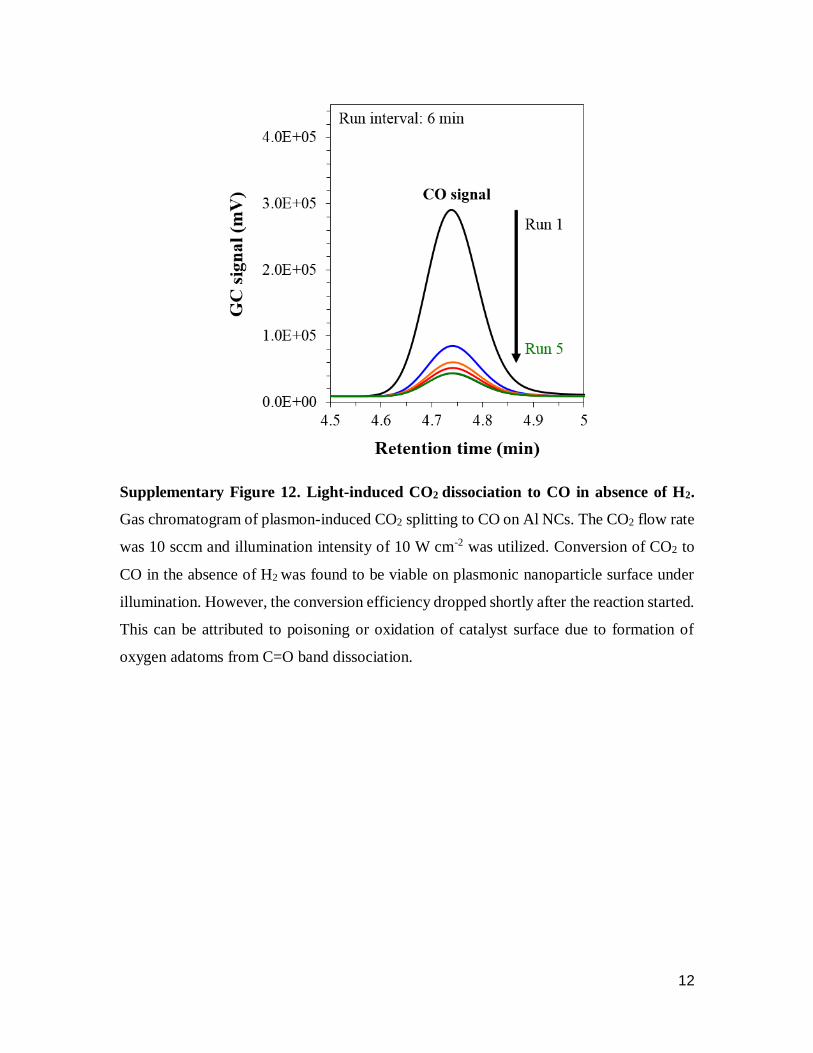
Supplementary Figure 12. Light-induced CO2 dissociation to CO in absence of H2.
Gas chromatogram of plasmon-induced CO2 splitting to CO on Al NCs. The CO2 flow rate
was 10 sccm and illumination intensity of 10 W cm-2 was utilized. Conversion of CO2 to
CO in the absence of H2 was found to be viable on plasmonic nanoparticle surface under
illumination. However, the conversion efficiency dropped shortly after the reaction started.
This can be attributed to poisoning or oxidation of catalyst surface due to formation of
oxygen adatoms from C=O band dissociation.

13
Supplementary Note 1. Calculated local heating on single particle surface.
The maximum temperature increase of the Al@Cu2O nanostructure was calculated for single
particle under pulsed illumination as a function of laser intensity and wavelength (Supplementary
Figure 6). The geometry of the structure is identical to the sample in experiments and in
electromagnetic simulations. Under the assumption that electron-phonon thermalization occurs
much faster than external thermal diffusion (from 100 ps to a few ns) and the time separation
between laser pulses, the maximum temporal temperature increase of the particle was calculated
separately for Al and Cu2O by ∆𝑇𝑚𝑎𝑥 = 𝜎𝑎𝑏𝑠𝐹/(𝑉𝜌𝑐) according to the theory developed in, 1
where 𝜎𝑎𝑏𝑠 is the absorption cross section of Al (or Cu2O) in Al@Cu2O calculated from FDTD
electromagnetic modeling, 𝐹 = ⟨𝐼⟩ 𝑓 ⁄ is the laser fluence, ⟨𝐼⟩ and 𝑓 = 80 MHz are the average
intensity and pulse repetition rate of laser, respectively. 𝑉, 𝜌 and 𝑐 are the volume, mass density
and heat capacity of Al (or Cu2O).
Supplementary Note 2. General information on Monte-Carlo Simulation.
Because thermal properties in the system derive from the absorption of light, which
is not an observable property, calculating light transport properties of the system can give
important information about the thermal response. In systems composed of high density of
randomly dispersed particles, the Monte-Carlo (MC) method is particularly well-suited for
making light transport calculations. Given the nanoparticle density for 5% loading on oxide
support and optical cross sections, light absorption and scattering coefficients were
calculated. These optical coefficients give the probability per unit propagation that a photon
will interact with the collection of nanoparticles, and inverse gives the mean-free path of a
photon in the medium. We incorporate these values into a MC simulation by choosing
random propagation distances according to the cumulative probability distribution,
equation (1):
𝐹(𝑥) = 1 − 𝑒−𝜇𝑒𝑥 (1)
where μe is the extinction coefficient (which is wavelength dependent), and x is the
propagation distance. Then whether a photon is absorbed or scattered is chosen randomly
according to the albedo. If the photon is scattered, the scattering direction is also chosen
randomly. If the photon is absorbed, the position is recorded and the simulation of the next

14
photon begins. Each photon simulated goes through as many iterations as needed until it is
absorbed or leaves the simulation domain. By simulating the fate of many such photons a
statistical solution to the light transport properties of the medium can be calculated for each
wavelength of light. Of particular interest in this work are the absorption efficiency and
absorption density. The latter is directly proportional to the heat-source density, i.e., the
source term in the heat equation. Therefore, the temperature increase of the
nanoparticle/support matrix should be directly proportional to the heat density.
Supplementary Method 1. TEM characterization.
15
High-resolution electron micrographs and energy dispersive X-ray spectroscopy (EDX)
data were acquired on a JEOL 2100 Field Emission Gun electron microscopes at 200kV
(Rice U., U.S.A.). Additional high-contrast (HC) TEM images were collected by a JEOL
HC Field Emission Gun electron microscope at 80kV (Rice U., U.S.A.). EDX data were
processed using the open source multidimensional data analysis toolbox, HyperSpy. 2
Supplementary Method 2. XPS characterization.
We performed high resolution XPS analysis on the Al@Cu2O/γ-Al2O3 mixture before and
after illumination under reaction condition (Supplementary Figure 4). XPS analysis was
performed on a PHI 5500 XPS system equipped with an Al KR monochromator X-ray
source operating at a power of 350 W. The pressure in the test chamber was maintained
below 1×10⁻⁹ Torr during the acquisition process.
The prepared Al@Cu2O/γ-Al2O3 mixture was stored under lab atmosphere before
performing photocatalysis experiment. In the XPS spectrum before illumination, the lack
of satellite peaks at binding energy of 943 eV and 965 eV excludes the existence of Cu
(+2). This means that storing the sample in air does not lead to further oxidation of Cu2O
to CuO as Cu(+1) is more stable oxide form of copper under ambient conditions.
For XPS analysis after the illumination under reaction condition, we sealed and separated
the reactor from the photocatalysis set up and opened it on-site. The photocatalyst powder
was initially loaded on a customized sample holder that allowed convenient and fast
transfer of the sample from reaction chamber to XPS chamber followed by fast evacuation
of the chamber. A quick (<5 sec) transfer of sample from reaction chamber to XPS chamber
minimizes the exposure of the photocatalyst to ambient air atmosphere and thus any
possible change in oxidation state of the copper.
The higher resolution XPS analysis at binding energies of copper shows an identical
spectrum. It is known that the Cu 2p3/2 spin-orbit peak in metallic copper is narrower than
that of Cu(+1). However, we measured similar FWHM of Cu 2p3/2 peak before and after
illumination, meaning that the oxidation state of copper should mainly remain unchanged
during photocatalytic process. The weak Cu auger peak appears at binding energy of the ~
570 eV corresponds to the Cu(+1). 3 In addition, we did not observe any change in physical

16
properties (specifically color) of sample as a result of illumination. Previous studies have
reported that polycrystalline Cu2O (as we observed in our HRTEM images), in particular
with a predominant Cu+1-terminated (111) surface, is resistance to photoreduction, while
single crystalline Cu2O is prone to photoreduction. 4 In our Al@Cu2O nanoparticles,
because epitaxial growth of Cu2O on amorphous aluminum oxide layer surrounding the Al
core was not possible, the Cu2O growth was performed through mild alcoholic reduction
without utilizing any capping agent to avoid organic contamination for photocatalytic
experiments. As a result, we found the Cu2O shell very porous and low degree of
crystallinity. Overall, although we do not exclude the existence of metallic copper (from
reduction of Cu(I) during chemical reaction) in our photocatalysts at percentage below the
detection limit of XPS, our combined experimental and simulation results suggest that
copper should remain in the form of Cu2O throughout the photocatalytic reaction.
Supplementary Method 3. Photocatalytic study of rWGS in static mode.
Static mode rWGS experiments were performed on an Al@Cu2O/γ-Al2O3 mixture in a
closed chamber configuration (without flowing reactant streams) (Supplementary Figure
11). The reaction chamber was purged with He first and then filled with CO2 and H2 at
stoichiometric ratio of 1:1 and total pressure of 1 atm. The inlet/outlet valves were closed
and the photocatalytic reaction was performed under visible light illumination of 9Wcm-2
for 90 min. The valves were then opened and the chamber was purged to toward the gas
chromatography system with He gas flowing at 10 sccm into the chamber.
Supplementary References

17
1. Baffou, G. & Rigneault, H. Femtosecond-pulsed optical heating of gold
nanoparticles. Phys. Rev. B 84, 035415 (2011).
2. De la Peña, F. et al. hyperspy/hyperspy: HyperSpy 1.1.2, (2017).
3. Wilson, S. S. et al. Interface stoichiometry control to improve device voltage and
modify band alignment in ZnO/Cu2O heterojunction solar cells. Energy Environ.
Sci. 7, 3606-3610 (2014).
4. Sowers, K. L. & Fillinger, A. Crystal Face Dependence of p-Cu2O Stability as
Photocathode. J. Electrochem. Soc. 156, F80-F85 (2009).


