40
Chapter Eleven Sampling: Design and Procedures © 2007 Prentice Hall 11-1
| Date post: | 07-Apr-2018 |
| Category: |
Documents |
| Upload: | saeed-ur-rehman |
| View: | 232 times |
| Download: | 3 times |

8/6/2019 Files-2-Presentations Malhotra ORGNL Ppt 11
http://slidepdf.com/reader/full/files-2-presentations-malhotra-orgnl-ppt-11 1/40

8/6/2019 Files-2-Presentations Malhotra ORGNL Ppt 11
http://slidepdf.com/reader/full/files-2-presentations-malhotra-orgnl-ppt-11 2/40
© 2007 Prentice Hall 11-2
Chapter Outline
1) Overview
2) Sample or Census
3) The Sampling Design Process
i. Define the Target Population
ii. Determine the Sampling Frame
iii. Select a Sampling Technique
iv. Determine the Sample Size
v. Execute the Sampling Process
8/6/2019 Files-2-Presentations Malhotra ORGNL Ppt 11
http://slidepdf.com/reader/full/files-2-presentations-malhotra-orgnl-ppt-11 3/40
© 2007 Prentice Hall 11-3
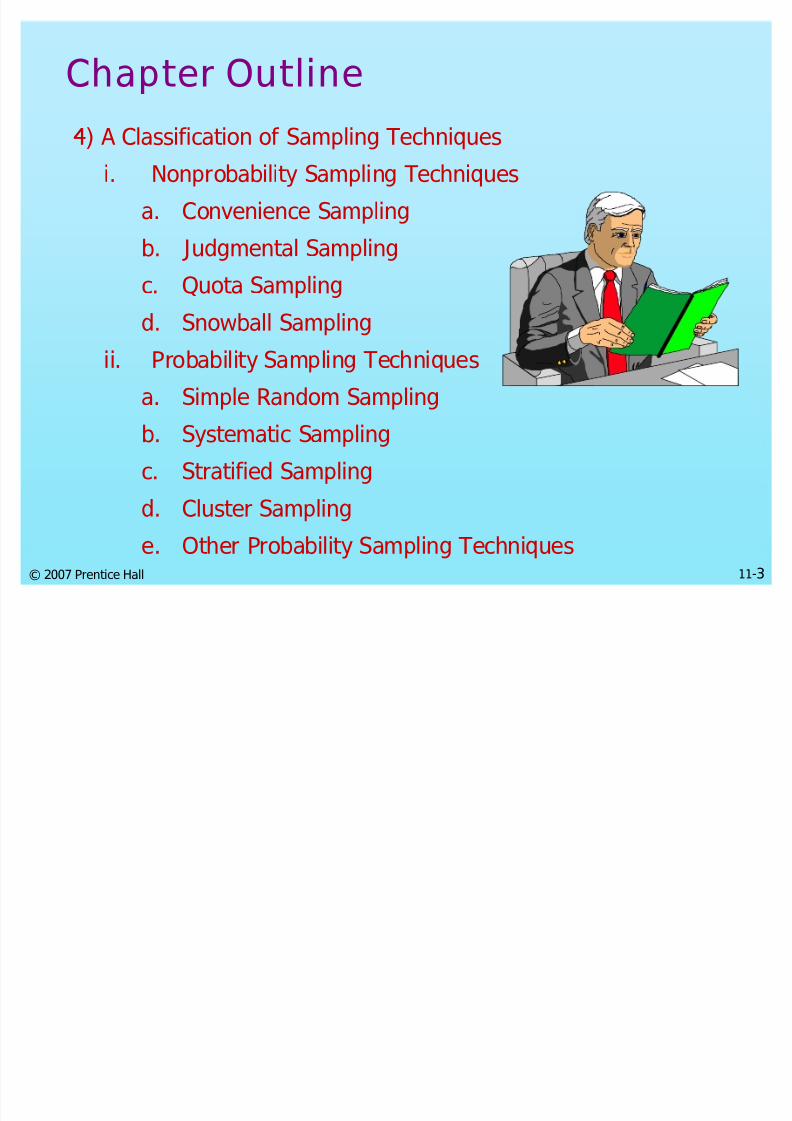
Chapter Outline
4) A Classification of Sampling Techniquesi. Nonprobability Sampling Techniques
a. Convenience Sampling
b. Judgmental Sampling
c. Quota Sampling
d. Snowball Sampling
ii. Probability Sampling Techniques
a. Simple Random Sampling
b. Systematic Sampling
c. Stratified Sampling
d. Cluster Sampling
e. Other Probability Sampling Techniques

8/6/2019 Files-2-Presentations Malhotra ORGNL Ppt 11
http://slidepdf.com/reader/full/files-2-presentations-malhotra-orgnl-ppt-11 4/40
© 2007 Prentice Hall 11-4
Chapter Outline
5. Choosing Nonprobability Versus ProbabilitySampling
6. Uses of Nonprobability Versus ProbabilitySampling
7. Internet Sampling
8. International Marketing Research
9. Ethics in Marketing Research
10. Summary
8/6/2019 Files-2-Presentations Malhotra ORGNL Ppt 11
http://slidepdf.com/reader/full/files-2-presentations-malhotra-orgnl-ppt-11 5/40
© 2007 Prentice Hall 11-5
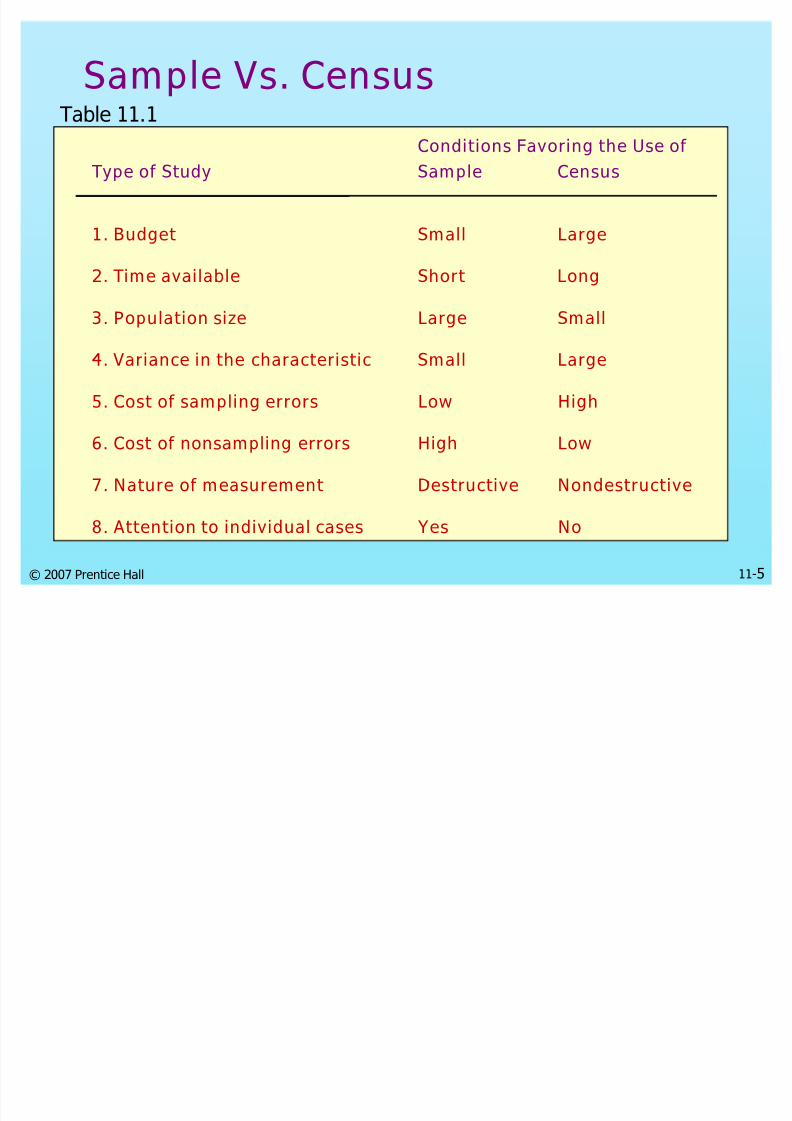
Sample Vs. CensusTable 11.1
Conditions Favoring the Use of
Type of Study Sample Census
1. Budget Small Large
2. Time available Short Long
3. Population size Large Small
4. Variance in the characteristic Small Large
5. Cost of sampling errors Low High
6. Cost of nonsampling errors High Low
7. Nature of measurement Destructive Nondestructive
8. Attention to individual cases Yes No
8/6/2019 Files-2-Presentations Malhotra ORGNL Ppt 11
http://slidepdf.com/reader/full/files-2-presentations-malhotra-orgnl-ppt-11 6/40
© 2007 Prentice Hall 11-6
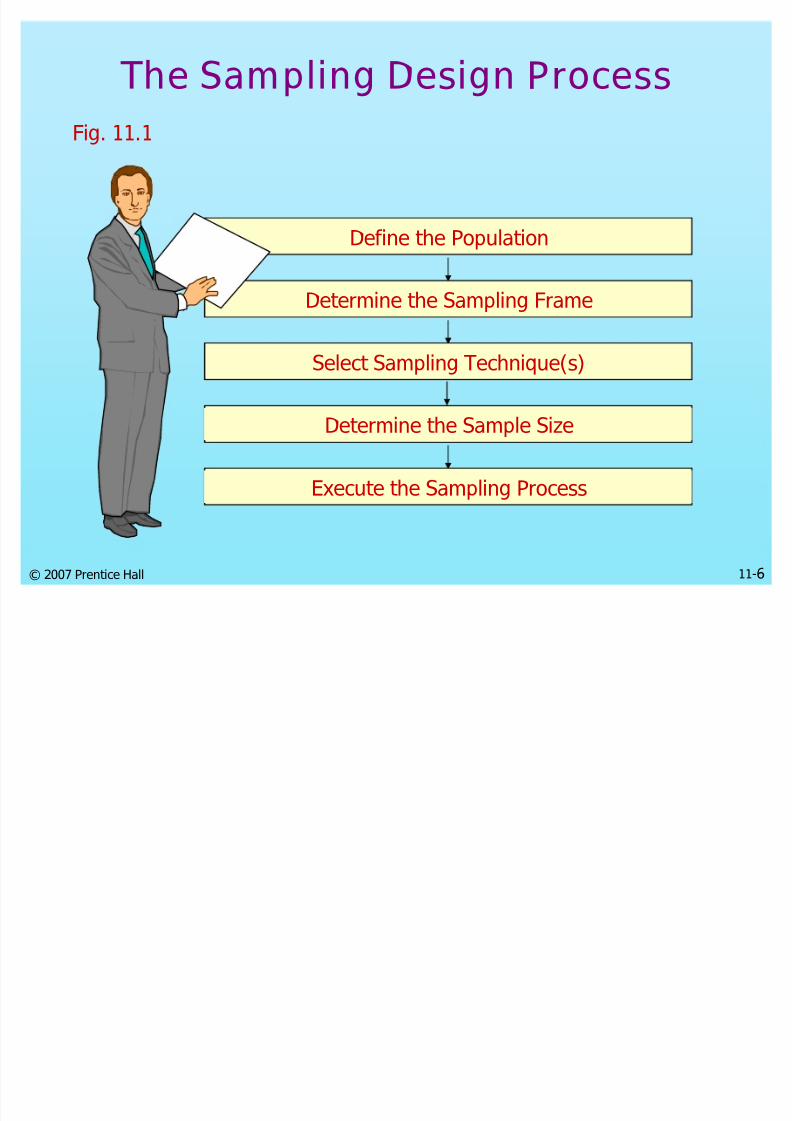
The Sampling Design Process
Fig. 11.1
Define the Population
Determine the Sampling Frame
Select Sampling Technique(s)
Determine the Sample Size
Execute the Sampling Process

8/6/2019 Files-2-Presentations Malhotra ORGNL Ppt 11
http://slidepdf.com/reader/full/files-2-presentations-malhotra-orgnl-ppt-11 7/40
© 2007 Prentice Hall 11-7
Define the Target Population
The target population is the collection of elements orobjects that possess the information sought by theresearcher and about which inferences are to be made.The target population should be defined in terms of elements, sampling units, extent, and time.
An element is the object about which or from whichthe information is desired, e.g., the respondent.
A sampling unit is an element, or a unit containing
the element, that is available for selection at somestage of the sampling process.
Extent refers to the geographical boundaries.
Time is the time period under consideration.

8/6/2019 Files-2-Presentations Malhotra ORGNL Ppt 11
http://slidepdf.com/reader/full/files-2-presentations-malhotra-orgnl-ppt-11 8/40
© 2007 Prentice Hall 11-8
Define the Target Population
Important qualitative factors in determining thesample size are:
the importance of the decision the nature of the research
the number of variables
the nature of the analysis
sample sizes used in similar studies incidence rates
completion rates
resource constraints

8/6/2019 Files-2-Presentations Malhotra ORGNL Ppt 11
http://slidepdf.com/reader/full/files-2-presentations-malhotra-orgnl-ppt-11 9/40

8/6/2019 Files-2-Presentations Malhotra ORGNL Ppt 11
http://slidepdf.com/reader/full/files-2-presentations-malhotra-orgnl-ppt-11 10/40
© 2007 Prentice Hall 11-10
Classification of Sampling Techniques
Sampling Techniques
NonprobabilitySampling Techniques
Probability
Sampling Techniques
ConvenienceSampling
JudgmentalSampling
QuotaSampling
SnowballSampling
SystematicSampling
StratifiedSampling
ClusterSampling
Other SamplingTechniques
Simple RandomSampling
Fig. 11.2
8/6/2019 Files-2-Presentations Malhotra ORGNL Ppt 11
http://slidepdf.com/reader/full/files-2-presentations-malhotra-orgnl-ppt-11 11/40
© 2007 Prentice Hall 11-11
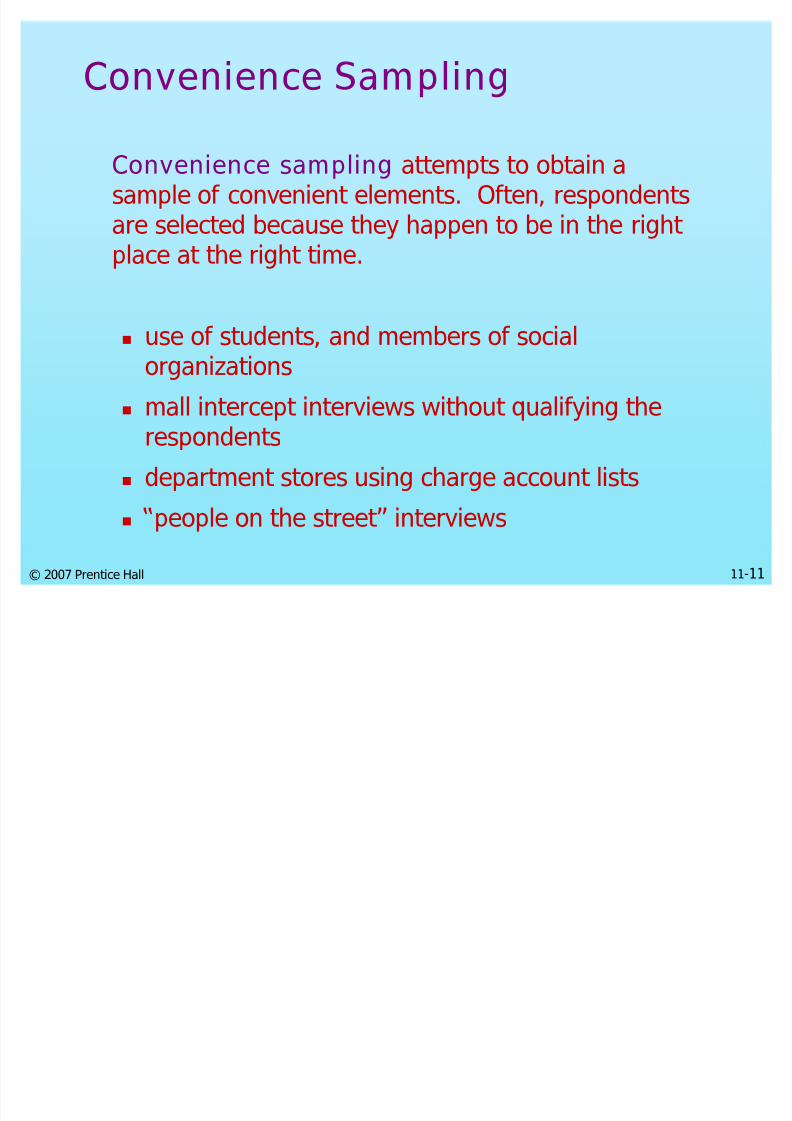
Convenience Sampling
Convenience sampling attempts to obtain asample of convenient elements. Often, respondentsare selected because they happen to be in the right place at the right time.
use of students, and members of socialorganizations
mall intercept interviews without qualifying therespondents
department stores using charge account lists
people on the street interviews

8/6/2019 Files-2-Presentations Malhotra ORGNL Ppt 11
http://slidepdf.com/reader/full/files-2-presentations-malhotra-orgnl-ppt-11 12/40
© 2007 Prentice Hall 11-12
A Graphical Illustration ofConvenience Sampling
Fig. 11.3
A B C D E
1 6 11 16 21
2 7 12 17 22
3 8 13 18 23
4 9 14 19 24
5 10 15 2 25
Group D happens to
assemble at a
convenient time and
place. So all the
elements in this
Group are selected.
The resulting sample
consists of elements
16, 17, 18, 19 and 20.
Note, no elements are
selected from group
A, B, C and E.

8/6/2019 Files-2-Presentations Malhotra ORGNL Ppt 11
http://slidepdf.com/reader/full/files-2-presentations-malhotra-orgnl-ppt-11 13/40
© 2007 Prentice Hall 11-13
Judgmental Sampling
Judgmental sampling is a form of conveniencesampling in which the population elements areselected based on the judgment of the researcher.
test markets
purchase engineers selected in industrialmarketing research
bellwether precincts selected in voting behaviorresearch
expert witnesses used in court

8/6/2019 Files-2-Presentations Malhotra ORGNL Ppt 11
http://slidepdf.com/reader/full/files-2-presentations-malhotra-orgnl-ppt-11 14/40
© 2007 Prentice Hall 11-14
Graphical Illustration of JudgmentalSampling
Fig. 11.3 A B C D E
1 6 11 16 21
2 7 12 17 22
3 8 13 18 23
4 9 14 19 24
5 1 15 20 25
The researcher considers
groups B, C and E to be
typical and convenient.
Within each of these
groups one or two
elements are selected
based on typicality and
convenience. The
resulting sampleconsists of elements 8,
10, 11, 13, and 24. Note,
no elements are selected
from groups A and D.

8/6/2019 Files-2-Presentations Malhotra ORGNL Ppt 11
http://slidepdf.com/reader/full/files-2-presentations-malhotra-orgnl-ppt-11 15/40
© 2007 Prentice Hall 11-15
Quota Sampling
Quota sampling may be viewed as two-stage restricted judgmentalsampling.
The first stage consists of developing control categories, orquotas, of population elements.
In the second stage, sample elements are selected based onconvenience or judgment.
Population Samplecomposition composition
ControlCharacteristic Percentage Percentage NumberSexMale 48 48 480Female 52 52 520
____ ____ ____100 100 1000

8/6/2019 Files-2-Presentations Malhotra ORGNL Ppt 11
http://slidepdf.com/reader/full/files-2-presentations-malhotra-orgnl-ppt-11 16/40
© 2007 Prentice Hall 11-16
A Graphical Illustration ofQuota Sampling
Fig. 11.3 A B C D E
1 6 11 16 21
2 7 12 17 22
38
1318 23
4 9 14 19 24
5 10 15
225
A quota of one
element from each
group, A to E, is
imposed. Within eachgroup, one element is
selected based on
judgment or
convenience. The
resulting sample
consists of elements
3, 6, 13, 20 and 22.
Note, one element is
selected from each
column or group.

8/6/2019 Files-2-Presentations Malhotra ORGNL Ppt 11
http://slidepdf.com/reader/full/files-2-presentations-malhotra-orgnl-ppt-11 17/40
© 2007 Prentice Hall 11-17
Snowball Sampling
In snowball sampling, an initial group of respondents is selected, usually at random.
After being interviewed, these respondents areasked to identify others who belong to the target population of interest.
Subsequent respondents are selected based onthe referrals.

8/6/2019 Files-2-Presentations Malhotra ORGNL Ppt 11
http://slidepdf.com/reader/full/files-2-presentations-malhotra-orgnl-ppt-11 18/40
© 2007 Prentice Hall 11-18
A Graphical Illustration ofSnowball Sampling
A B C D E
1 6 11 16 21
2 7 12 17 22
3 8
13 1823
4 9 14 19 24
5 10 15 20 25
Elements 2 and 9 are
selected randomly
from groups A and B.
Element 2 referselements 12 and 13.
Element 9 refers
element 18. The
resulting sample
consists of elements
2, 9, 12, 13, and 18.
Note, there are no
element from group E.
Random
Selection Referrals
8/6/2019 Files-2-Presentations Malhotra ORGNL Ppt 11
http://slidepdf.com/reader/full/files-2-presentations-malhotra-orgnl-ppt-11 19/40
© 2007 Prentice Hall 11-19
Simple Random Sampling
Each element in the population has a known andequal probability of selection.
Each possible sample of a given size (n) has aknown and equal probability of being the sampleactually selected.
This implies that every element is selectedindependently of every other element.

8/6/2019 Files-2-Presentations Malhotra ORGNL Ppt 11
http://slidepdf.com/reader/full/files-2-presentations-malhotra-orgnl-ppt-11 20/40
© 2007 Prentice Hall 11-20
A Graphical Illustration ofSimple Random Sampling
Fig. 11.4 A B C D E
1 6 11 16 21
2 7 12 17 22
3 8 13 18 23
4 9 14 19 24
5 10 15 20 25
Select five
random numbers
from 1 to 25. Theresulting sample
consists of
population
elements 3, 7, 9,
16, and 24. Note,
there is no
element from
Group C.

8/6/2019 Files-2-Presentations Malhotra ORGNL Ppt 11
http://slidepdf.com/reader/full/files-2-presentations-malhotra-orgnl-ppt-11 21/40
© 2007 Prentice Hall 11-21
Systematic Sampling
The sample is chosen by selecting a random startingpoint and then picking every ith element insuccession from the sampling frame.
The sampling interval, i, is determined by dividing thepopulation size N by the sample size n and roundingto the nearest integer.
When the ordering of the elements is related to thecharacteristic of interest, systematic samplingincreases the representativeness of the sample.

8/6/2019 Files-2-Presentations Malhotra ORGNL Ppt 11
http://slidepdf.com/reader/full/files-2-presentations-malhotra-orgnl-ppt-11 22/40
© 2007 Prentice Hall 11-22
Systematic Sampling
If the ordering of the elements produces a cyclicalpattern, systematic sampling may decrease therepresentativeness of the sample.
For example, there are 100,000 elements in thepopulation and a sample of 1,000 is desired. In thiscase the sampling interval, i, is 100. A randomnumber between 1 and 100 is selected. If, forexample, this number is 23, the sample consists of
elements 23, 123, 223, 323, 423, 523, and so on.

8/6/2019 Files-2-Presentations Malhotra ORGNL Ppt 11
http://slidepdf.com/reader/full/files-2-presentations-malhotra-orgnl-ppt-11 23/40
© 2007 Prentice Hall 11-23
A Graphical Illustration ofSystematic Sampling
Fig. 11.4 A B C D E
1 6 11 16 21
2 7 12 17 22
3 8 13 18 23
4 9 14 19 24
5 10 15 20 25
Select a random
number between 1 to
5, say 2.
The resulting sampleconsists of
population 2,
(2+5=) 7, (2+5x2=) 12,
(2+5x3=)17, and
(2+5x4=) 22. Note, all
the elements are
selected from a
single row.

8/6/2019 Files-2-Presentations Malhotra ORGNL Ppt 11
http://slidepdf.com/reader/full/files-2-presentations-malhotra-orgnl-ppt-11 24/40

8/6/2019 Files-2-Presentations Malhotra ORGNL Ppt 11
http://slidepdf.com/reader/full/files-2-presentations-malhotra-orgnl-ppt-11 25/40
© 2007 Prentice Hall 11-25
Stratified Sampling
The elements within a stratum should be ashomogeneous as possible, but the elements indifferent strata should be as heterogeneous as
possible.
The stratification variables should also be closelyrelated to the characteristic of interest.
Finally, the variables should decrease the cost of the stratification process by being easy to measureand apply.
8/6/2019 Files-2-Presentations Malhotra ORGNL Ppt 11
http://slidepdf.com/reader/full/files-2-presentations-malhotra-orgnl-ppt-11 26/40
© 2007 Prentice Hall 11-26
Stratified Sampling
In proportionate stratified sampling, the size of the sample drawn from each stratum is proportionate
to the relative size of that stratum in the totalpopulation.
In disproportionate stratified sampling, the sizeof the sample from each stratum is proportionate to
the relative size of that stratum and to the standarddeviation of the distribution of the characteristic of interest among all the elements in that stratum.

8/6/2019 Files-2-Presentations Malhotra ORGNL Ppt 11
http://slidepdf.com/reader/full/files-2-presentations-malhotra-orgnl-ppt-11 27/40
© 2007 Prentice Hall 11-27
A Graphical Illustration ofStratified Sampling
Fig. 11.4 A B C D E
1 6 11 16 21
2 7 12 17 22
3 8 13 18 23
4 9 14 19 24
5 10 15 20 25
Randomly select a
number from 1 to 5
for each stratum, A toE. The resulting
sample consists of
population elements
4, 7, 13, 19 and 21.
Note, one elementis selected from each
column.
8/6/2019 Files-2-Presentations Malhotra ORGNL Ppt 11
http://slidepdf.com/reader/full/files-2-presentations-malhotra-orgnl-ppt-11 28/40
© 2007 Prentice Hall 11-28
Cluster Sampling
The target population is first divided into mutuallyexclusive and collectively exhaustive subpopulations,or clusters.
Then a random sample of clusters is selected, basedon a probability sampling technique such as SRS.
For each selected cluster, either all the elements areincluded in the sample (one-stage) or a sample of elements is drawn probabilistically (two-stage).

8/6/2019 Files-2-Presentations Malhotra ORGNL Ppt 11
http://slidepdf.com/reader/full/files-2-presentations-malhotra-orgnl-ppt-11 29/40
© 2007 Prentice Hall 11-29
Cluster Sampling
Elements within a cluster should be asheterogeneous as possible, but clusters themselvesshould be as homogeneous as possible. Ideally,
each cluster should be a small-scale representationof the population.
In probability proportionate to size sampling,the clusters are sampled with probabilityproportional to size. In the second stage, theprobability of selecting a sampling unit in a selectedcluster varies inversely with the size of the cluster.

8/6/2019 Files-2-Presentations Malhotra ORGNL Ppt 11
http://slidepdf.com/reader/full/files-2-presentations-malhotra-orgnl-ppt-11 30/40
© 2007 Prentice Hall 11-30
A Graphical Illustration ofCluster Sampling 2 Stage
Fig. 11.4 A B C D E
1 6 11 16 21
2 7 12 17 22
3 8 13 18 23
4 9 14 19 24
5 10 15
225
Randomly select 3
clusters, B, D and E.
Within each cluster,
randomly select oneor two elements. The
resulting sample
consists of
population elements
7, 18, 20, 21, and 23.
Note, no elements
are selected from
clusters A and C.

8/6/2019 Files-2-Presentations Malhotra ORGNL Ppt 11
http://slidepdf.com/reader/full/files-2-presentations-malhotra-orgnl-ppt-11 31/40
© 2007 Prentice Hall 11-31
Types of Cluster Sampling
Fig 11.5 Cluster Sampling
One-Stage
Sampling
Multistage
Sampling
Two-Stage
Sampling
Simple ClusterSampling
ProbabilityProportionate
to Size Sampling

8/6/2019 Files-2-Presentations Malhotra ORGNL Ppt 11
http://slidepdf.com/reader/full/files-2-presentations-malhotra-orgnl-ppt-11 32/40
© 2007 Prentice Hall 11-32
Technique Strengths Weaknesses
Nonprobability Sampling Convenience sampling
Least expensive, leasttime-consuming, mostconvenient
Selection bias, sample notrepresentative, not recommended for descriptive or causal research
Judgmental sampling Low cost, convenient,not time-consuming
Does not allow generalization,subjective
Quota sampling Sample can be controlled
for certain characteristics
Selection bias, no assurance of
representativenessSnowball sampling Can estimate rare
characteristicsTime-consuming
Probability sampling Simple random sampling(SRS)
Easily understood,results projectable
Difficult to construct samplingframe, expensive, lower precision,no assurance of representativeness.
Systematic sampling Can increaserepresentativeness,easier to implement thanSRS, sampling frame notnecessary
Can decrease representativeness
Stratified sampling Include all importantsubpopulations,
precision
Difficult to select relevantstratification variables, not feasible tostratify on many variables, expensive
Cluster sampling Easy to implement, costeffective
Imprecise, difficult to compute andinterpret results
Table 11.3
Strengths and Weaknesses ofBasic Sampling Techniques

8/6/2019 Files-2-Presentations Malhotra ORGNL Ppt 11
http://slidepdf.com/reader/full/files-2-presentations-malhotra-orgnl-ppt-11 33/40
© 2007 Prentice Hall 11-33
A Classification of Internet Sampling
Fig. 11.6
Internet Sampling
Online Intercept Sampling
Recruited OnlineSampling
Other Techniques
Nonrandom Random Panel Nonpanel
RecruitedPanels
Opt-inPanels
Opt-in List Rentals

8/6/2019 Files-2-Presentations Malhotra ORGNL Ppt 11
http://slidepdf.com/reader/full/files-2-presentations-malhotra-orgnl-ppt-11 34/40
© 2007 Prentice Hall 11-34
Procedures for DrawingProbability Samples
Exhibit 11.1
Simple Random
Sampling
1. Select a suitable sampling frame
2. Each element is assigned a number from 1 to N(pop. size)
3. Generate n (sample size) different random numbersbetween 1 and N
4. The numbers generated denote the elements that should be included in the sample

8/6/2019 Files-2-Presentations Malhotra ORGNL Ppt 11
http://slidepdf.com/reader/full/files-2-presentations-malhotra-orgnl-ppt-11 35/40
© 2007 Prentice Hall 11-35
Procedures for DrawingProbability Samples
Exhibit 11.1, cont.Systematic
Sampling
1. Select a suitable sampling frame
2. Each element is assigned a number from 1 to N (pop. size)
3. Determine the sampling interval i:i=N/n. If i is a fraction,round to the nearest integer
4. Select a random number, r, between 1 and i, as explained in
simple random sampling
5. The elements with the following numbers will comprise thesystematic random sample: r, r+i,r+2i,r+3i,r+4i,...,r+(n-1)i

8/6/2019 Files-2-Presentations Malhotra ORGNL Ppt 11
http://slidepdf.com/reader/full/files-2-presentations-malhotra-orgnl-ppt-11 36/40
© 2007 Prentice Hall 11-36
Procedures for DrawingProbability Samples
1. Select a suitable frame
2. Select the stratification variable(s) and the number of strata, H
3. Divide the entire population into H strata. Based on theclassification variable, each element of the population is assignedto one of the H strata
4. In each stratum, number the elements from 1 to Nh (the pop.size of stratum h)
5. Determine the sample size of each stratum, nh, based onproportionate or disproportionate stratified sampling, where
6. In each stratum, select a simple random sample of size nh
Exhibit 11.1, cont.
nh = nh=1
H
StratifiedSampling

8/6/2019 Files-2-Presentations Malhotra ORGNL Ppt 11
http://slidepdf.com/reader/full/files-2-presentations-malhotra-orgnl-ppt-11 37/40

8/6/2019 Files-2-Presentations Malhotra ORGNL Ppt 11
http://slidepdf.com/reader/full/files-2-presentations-malhotra-orgnl-ppt-11 38/40
© 2007 Prentice Hall 11-38
Procedures for DrawingProbability Samples
Repeat the process until each of the remaining
clusters has a population less than the sampling
interval. If b clusters have been selected withcertainty, select the remaining c-b clusters
according to steps 1 through 7. The fraction of units
to be sampled with certainty is the overall sampling
fraction = n/N. Thus, for clusters selected withcertainty, we would select ns=(n/N)(N1+N2+...+Nb)
units. The units selected from clusters selected
under two-stage sampling will therefore be n*=n- ns.
Cluster Sampling
Exhibit 11.1,cont.

8/6/2019 Files-2-Presentations Malhotra ORGNL Ppt 11
http://slidepdf.com/reader/full/files-2-presentations-malhotra-orgnl-ppt-11 39/40

8/6/2019 Files-2-Presentations Malhotra ORGNL Ppt 11
http://slidepdf.com/reader/full/files-2-presentations-malhotra-orgnl-ppt-11 40/40
© 2007 Prentice Hall 11-40
Tennis' Systematic SamplingReturns a Smash
Tennis magazine conducted a mail survey of its subscribers togain a better understanding of its market. Systematic samplingwas employed to select a sample of 1,472 subscribers from thepublication's domestic circulation list. If we assume that thesubscriber list had 1,472,000 names, the sampling intervalwould be 1,000 (1,472,000/1,472). A number from 1 to 1,000
was drawn at random. Beginning with that number, every1,000th subscriber was selected.
A brand-new dollar bill was included with the questionnaire asan incentive to respondents. An alert postcard was mailed oneweek before the survey. A second, follow-up, questionnaire
was sent to the whole sample ten days after the initialquestionnaire. There were 76 post office returns, so the net effective mailing was 1,396. Six weeks after the first mailing,778 completed questionnaires were returned, yielding aresponse rate of 56%.


