Chapter 2 page Please read the following list of large companies: Boeing American Express China Petroleum & Chemical (Sinopec) Intel Home Depot China Construction Bank Microsoft Petrobras-Petro´leo Brasil AT&T Cre´dit Agricole Mizuho Financial Socie´te´ Ge´ne´rale Group Microsoft Petrobras-Petro´leo Brasil AT&T Cre´dit Agricole Mizuho Financial Socie´te´ Ge´ne´rale Group E.ON ENI AXA Group
Transcript
Chapter 2 page
Please read the following list of large companies:
Boeing
American Express
China Petroleum & Chemical (Sinopec)
Intel
Home Depot
China Construction Bank
Microsoft
Petrobras-Petro´leo Brasil
AT&T
Cre´dit Agricole
Mizuho Financial
Socie´te´ Ge´ne´rale Group
Microsoft
Petrobras-Petro´leo Brasil
AT&T
Cre´dit Agricole
Mizuho Financial
Socie´te´ Ge´ne´rale Group
E.ON
ENI
AXA Group
Verizon Communications
HBOS
IBM
Procter & Gamble
Barclays
Banco Santander
BNP Paribas
Royal Bank of Scotland
Wal-Mart Stores
ExxonMobil
Bank of America
General Electric
Without looking back at the list, please estimate whether there are:
a. more companies on the list that are based in the United States, or
b. more companies on the list that are based outside the United States.
Ifyou guessed that there are more American firms on the list, you are in the majority.
Most people (at least, most Americans polled) estimate that there are more American
companies than foreign companies on the list. Most people also guess that the Ameri-
can firms are larger than the foreign companies listed.
However, this majority response is incorrect. In fact, there are thirteen American
firms on the list and fourteen based outside ofthe United States. What’s more, the non-
U.S. firms were ranked higher than the American firms on Fortune magazine’s 2006 list
ofthe largest global corporations.
Why do most people overestimate the frequency of American firms on the list?
Because the American company names are more familiar, more recognizable, and more
memorable to Americans than the foreign company names.
This problem illustrates the availabilityheuristic, which we introduced in Chapter 1.
For Americans, the names ofAmerican firms are more available in our memories than
the names offoreign firms after reading the list. We err in assuming that the prevalence
ofAmerican firms in our minds mirrors the real world. Awareness ofthe bias resulting
from the availability heuristic should inspire us to question our judgments and adjust
them accordingly.
As we noted in Chapter 1, individuals develop rules ofthumb, or heuristics, to re-
duce the information-processing demands ofmaking decisions. By providing managers
with efficient ways of dealing with complex problems, heuristics produce good deci-
sions a significant proportion of the time. However, heuristics also can lead managers
to make systematically biased judgments. Biases result when an individual inappropri-
ately applies a heuristic when making a decision.
This chapter is comprised ofthree sections that correspond to three ofthe general
heuristics we introduced in Chapter 1: the availability heuristic, the representativeness
heuristic, and the confirmation heuristic. (We will discuss a fourth general heuristic, the
affect heuristic, in Chapter 5.) The three heuristics covered in this chapter encompass
twelve specific biases that we will illustrate using your responses to a series ofproblems.
The goal of the chapter is to help you ‘‘unfreeze’’ your decision-making patterns by
showing you how easily heuristics become biases when improperly applied. Once you
are able to spot these biases, you will be able to improve the quality ofyour decisions.
Before reading further, please take a few minutes to respond to the problems pre-
sented in Table 2.1. page 14
Respond to the following problems before reading the rest of the chapter.
Problem 1. Please rank order the following causes of death in the United States between 1990
and 2000, placing a 1 next to the most common cause, 2 next to the second most common, etc.
___ Tobacco
___ Poor diet and physical inactivity
___ Motor vehicle accidents
___ Firearms (guns)
___ Illicit drug use
Now estimate the number of deaths caused by each of these five causes between 1990 and 2000.
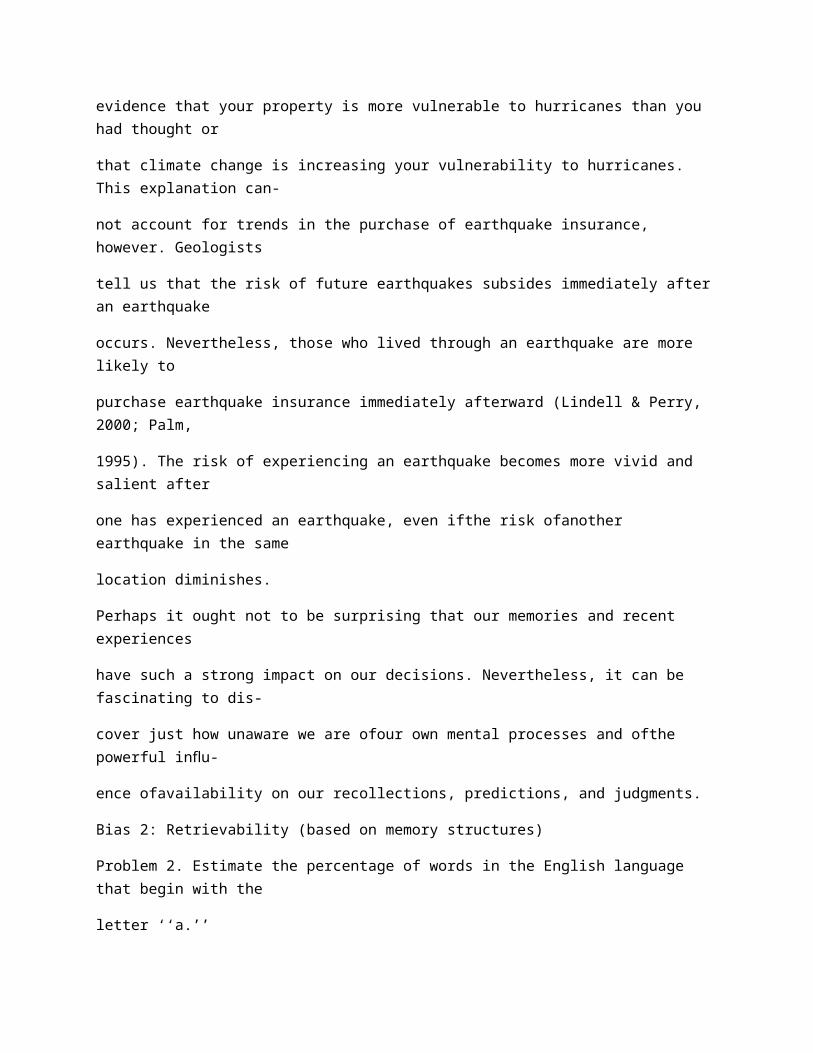
Problem 2. Estimate the percentage of words in the English language that begin with the letter ‘‘a.’’
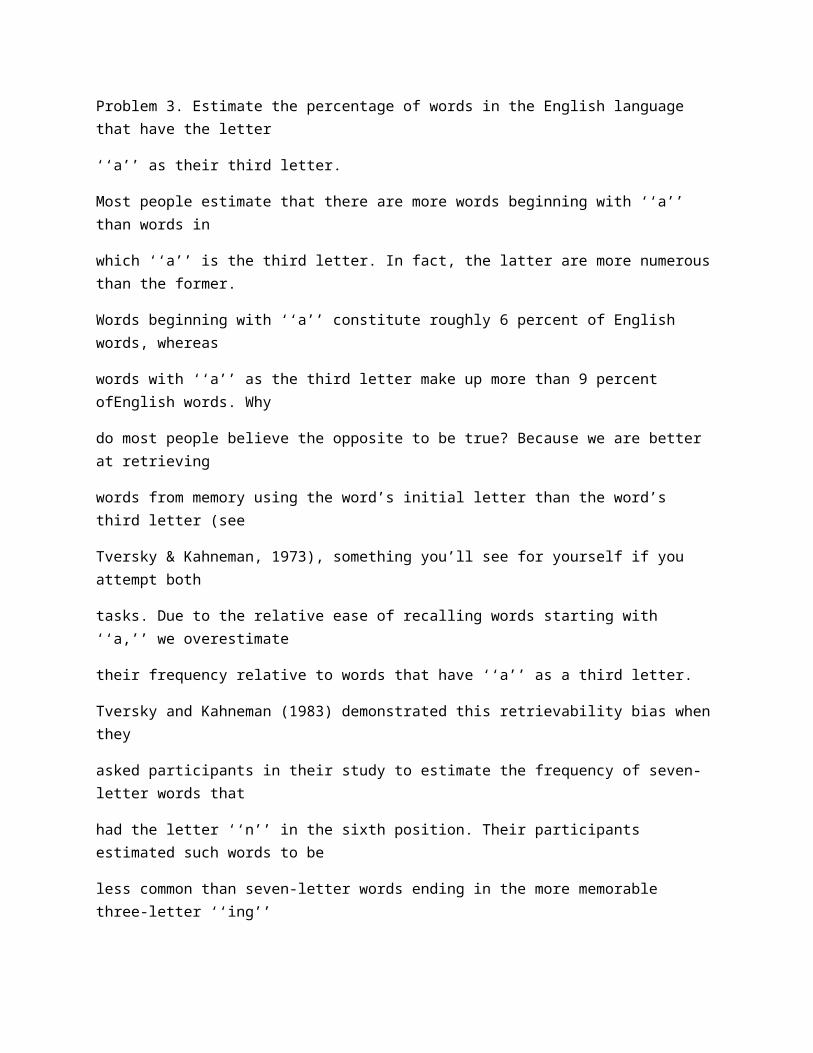
Problem 3. Estimate the percentage of words in the English language that have the letter ‘‘a’’ as
their third letter.
Problem 2. Estimate the percentage of words in the English language that begin with the letter ‘‘a.’’
Problem 3. Estimate the percentage of words in the English language that have the letter ‘‘a’’ as
their third letter.
Problem 4. Lisa is thirty-three and is pregnant for the first time. She is worried about birth
defects such as Down syndrome. Her doctor tells her that she need not worry too much because
there is only a 1 in 1,000 chance that a woman of her age will have a baby with Down syndrome.
Nevertheless, Lisa remains anxious about this possibility and decides to obtain a test, known as
the Triple Screen, that can detect Down syndrome. The test is moderately accurate: When a
baby has Down syndrome, the test delivers a positive result 86 percent of the time. There is,
however, a small ‘‘false positive’’ rate: 5 percent of babies produce a positive result despite not
having Down syndrome. Lisa takes the Triple Screen and obtains a positive result for Down
syndrome. Given this test result, what are the chances that her baby has Down syndrome?
a. 0–20 percent chance
b. 21–40 percent chance
c. 41–60 percent chance
d. 61–80 percent chance
e. 81–100 percent chance
Problem 5. (from Tversky & Kahneman, 1974). A certain town is served by two hospitals. In the
larger hospital, about forty-five babies are born each day. In the smaller hospital, about fifteen
babies are born each day. As you know, about 50 percent of all babies are boys. However, the
exact percentage of boys born varies from day to day. Sometimes it may be higher than 50
percent, sometimes lower.
For a period of one year, each hospital recorded the days on which more than 60 percent of the
babies born were boys. Which hospital do you think recorded more such days?
a. The larger hospital
b. The smaller hospital
c. About the same (that is, within 5 percent of each other)
Problem 6. You and your spouse have had three children together, all of them girls. Now that
you are expecting your fourth child, you wonder whether the odds favor having a boy this time.
What is the best estimate of your probability of having another girl?
a. 6.25 percent (1 in 16), because the odds of getting four girls in a row is 1 out of 16
b. 50 percent (1 in 2), because there is roughly an equal chance of getting each gender
c. A percentage that falls somewhere between these two estimates (6.25–50 percent)
Problem 7. You are the manager of a Major League Baseball team, and the 2005 season has just
ended. One of your most important jobs is to predict players’ future performance. Currently,
your primary interest lies in predicting batting averages for nine particular players. A measure of
a player’s performance, batting averages range from 0 to 1. Larger numbers reflect better batting
performance. You know the nine players’ 2005 batting averages, and must estimate each one’s
2006 batting average. Please fill in your guesses in the right-hand column.
Problem 8. Linda is thirty-one years old, single, outspoken, and very smart. She majored in
philosophy. As a student, she was deeply concerned with issues of discrimination and social
justice, and she participated in antinuclear demonstrations.
Rank the following eight descriptions in order of the probability (likelihood) that they
describe Linda:
___ a. Linda is a teacher in an elementary school.
___ b. Linda works in a bookstore and takes yoga classes.
___ c. Linda is active in the feminist movement.
___ d. Linda is a psychiatric social worker.
___ e. Linda is a member of the League of Women Voters.
___ f. Linda is a bank teller.
___ g. Linda is an insurance salesperson.
___ h. Linda is a bank teller who is active in the feminist movement.
Problem 9. Take the last three digits of your phone number. Add the number one to the front of
the string, so that now you have four digits. Think of that number as a year. Now try to estimate
the year that the Taj Mahal was completed. Was it before or after the date made by your phone
number?
____________ Before ____________ After
On the line below, please make your best estimate of the actual year in which the Taj Mahal was
completed:
____________
Problem 10. Which of the following instances appears most likely? Which appears second most
likely? Player 2005 Estimated 2006 Batting Average
1 .215
2 .242
3 .244
4 .258
5 .261
6 .274
7 .276
8 .283
9 .305
Problem 8. Linda is thirty-one years old, single, outspoken, and very smart. She majored in
philosophy. As a student, she was deeply concerned with issues of discrimination and social
justice, and she participated in antinuclear demonstrations.
Rank the following eight descriptions in order of the probability (likelihood) that they
describe Linda:
___ a. Linda is a teacher in an elementary school.
___ b. Linda works in a bookstore and takes yoga classes.
___ c. Linda is active in the feminist movement.
___ d. Linda is a psychiatric social worker.
___ e. Linda is a member of the League of Women Voters.
___ f. Linda is a bank teller.
___ g. Linda is an insurance salesperson.
___ h. Linda is a bank teller who is active in the feminist movement.
Problem 9. Take the last three digits of your phone number. Add the number one to the front of
the string, so that now you have four digits. Think of that number as a year. Now try to estimate
the year that the Taj Mahal was completed. Was it before or after the date made by your phone
number?
____________ Before ____________ After
On the line below, please make your best estimate of the actual year in which the Taj Mahal was
completed:
____________
Problem 10. Which of the following instances appears most likely? Which appears second most
likely?
a. Drawing a red marble from a bag containing 50 percent red marbles and 50 percent
white marbles.
b. Drawing a red marble seven times in succession, with replacement (i.e., a selected mar-
ble is put back into the bag before the next marble is selected), from a bag containing 90
percent red marbles and 10 percent white marbles.
c. Drawing at least one red marble in seven tries, with replacement, from a bag containing
10 percent red marbles and 90 percent white marbles.
Problem 11. Ten uncertain quantities are listed below. Do not look up any information about
these items. For each, write down your best estimate of the quantity. Next, put a lower and upper
bound around your estimate, so that you are confident that your 98 percent range surrounds the
actual quantity.
Estimate Lower Upper
___ ___ ___ a. Wal-Mart’s 2006 revenue
___ ___ ___ b. Microsoft’s 2006 revenue
___ ___ ___ c. World population as of July 2007
___ ___ ___ d. Market capitalization (price per share times
___ ___ ___ e. Market capitalization of Heinz as of July 6, 2007
___ ___ ___ f. Rank of McDonald’s in the 2006 Fortune 500
___ ___ ___ g. Rank of Nike in the 2006 Fortune 500
___ ___ ___ h. Number of fatalities due to motor vehicle accidents
in the United States in 2005
___ ___ ___ i. The national debt of the U.S. federal government as
of July 2007
___ ___ ___ j. The U.S. federal government budget for the 2008
fiscal year.
Problem 12. If you had to describe the relationship between baseball players’ batting averages
in one season and their batting averages in the subsequent season, which of the following four
descriptions would you pick?
1. Zero correlation: Performance is entirely unpredictable, in the sense that knowing how
well a player hits one year does not help you predict how well he is going to hit the next
year.
2. Weak correlation of about .4: Performance from one season to the next is moderately
predictable, but there are also a lot of random, unpredictable influences on how well a
particular player hits in a particular season.
3. Strong correlation of about .7: Performance is quite predictable from one season to
the next, but there is a small random component in how well a player hits.
4. Perfect correlation of 1.0: Performance is stable from one year to the next. The player
with the highest batting average in one season always has the highest batting average the
next season.
BIASES EMANATING FROM THE AVAILABILITY HEURISTIC
Bias 1: Ease ofRecall (based on vividness and recency)
Problem 1. Please rank order the following causes of death in the United States between
1990 and 2000, placing a 1 next to the most common cause, 2 next to the second most
common, etc.
___ Tobacco
___ Poor diet and physical inactivity
___ Motor vehicle accidents
___ Firearms (guns)
___ Illicit drug use
Now estimate the number of deaths caused by each of these five causes between 1990 and
2000.
It may surprise you to learn that, according to the Journal ofthe American Medical
Association (Mokdad, Marks, Stroup, & Gerberding, 2004, p. 1240), the causes ofdeath
above are listed in the order offrequency, with tobacco consumption causing the most
deaths and illicit drug use causing the fewest. Even if you got the order right or came
close, you probably underestimated the magnitude ofdifference between the first two
causes and the last three causes. The first two causes, tobacco and poor diet/physical
inactivity, resulted in 435,000 and 400,000 annual deaths, respectively, while the latter
three causes resulted in far fewer deaths—43,000, 29,000, and 17,000 deaths, respec-
tively. Vivid deaths caused by cars, guns, and drugs tend to get a lot ofpress coverage.
The availability of vivid stories in the media biases our perception of the frequency of
events toward the last three causes over the first two. As a result, we may underestimate
the likelihood ofdeath due to tobacco and poor diet, while overestimating the hazards
ofcars, guns, and drugs.
Many life decisions are affected by the vividness of information. Although most
people recognize that AIDS is a devastating disease, many individuals ignore clear data
about how to avoid contracting AIDS. In the fall of 1991, however, sexual behavior in
Dallas was dramatically affected by one vivid piece of data that may or may not have
been true. In a chilling interview, a Dallas woman calling herself C.J. claimed she had
AIDS and was trying to spread the disease out of revenge against the man who had
infected her. After this vivid interview made the local news, attendance at Dallas AIDS
seminars increased dramatically, AIDS became the main topic ofDallas talk shows, and
requests for HIV tests surged citywide. Although C.J.’s possible actions were a legiti-
mate cause for concern, it is clear that most ofthe health risks related to AIDS are not
a result of one woman’s actions. There are many more important reasons to be con-
cerned about AIDS. However, C.J.’s vivid report had a more substantial effect on many
people’s behavior than the mountains ofdata available.
The availability heuristic describes the inferences we make about event common-
ness based on the ease with which we can remember instances of that event. Tversky
and Kahneman (1974) cite evidence of this bias in a lab study in which individuals
were read lists of names of well-known personalities of both genders. Different
lists were presented to two groups. One group was read a list in which the women listed
were relatively more famous than the listed men, but the list included more men’s
names overall. The other group was read a list in which the men listed were relatively
more famous than the listed women, but the list included more women’s names overall.
After hearing their group’s list, participants in both groups were asked if the list con-
tained the names of more women or men. In both groups, participants incorrectly
guessed that the gender that included the relatively more famous personalities was the
more numerous. Participants apparently paid more attention to vivid household names
than to less well-known figures, leading to inaccurate judgments.
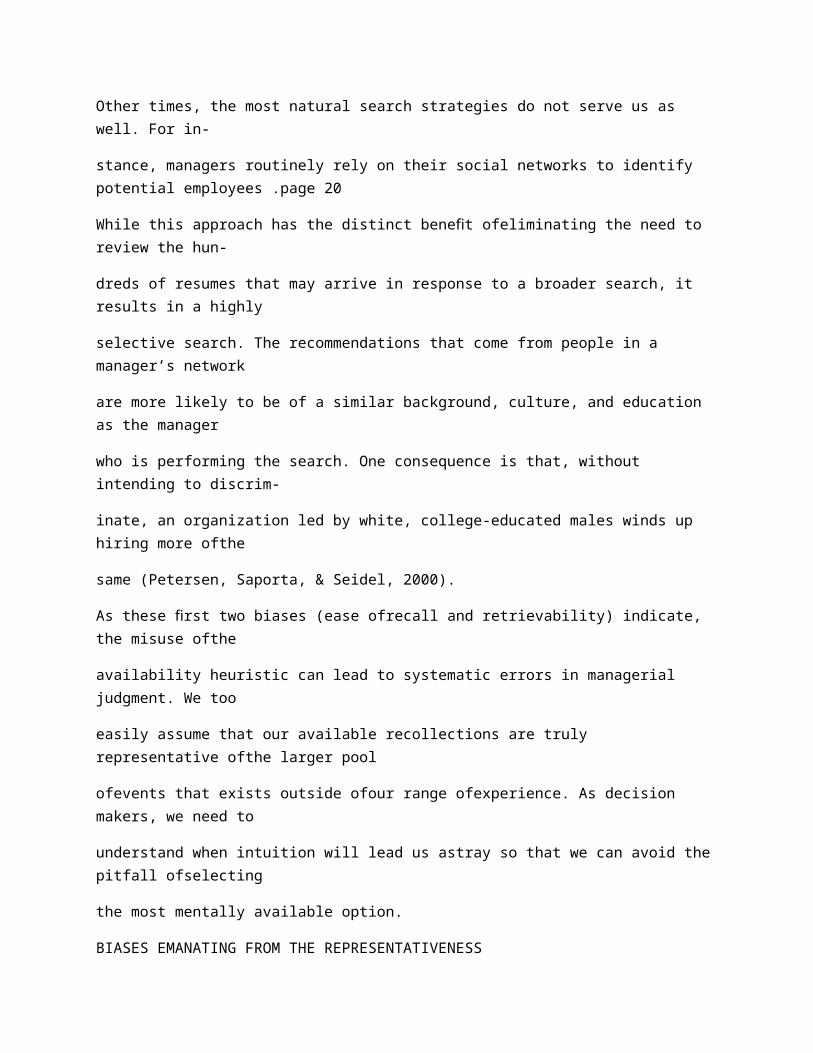
While this example ofvividness may seem fairly benign, it is not difficult to see how
the availability bias could lead managers to make potentially destructive workplace de-
cisions. The following came from the experience of one of our MBA students: As a
purchasing agent, he had to select one ofseveral possible suppliers. He chose the firm
whose name was the most familiar to him. He later found out that the salience of the
name resulted from recent adverse publicity concerning the firm’s extortion of funds
from client companies!
Managers conducting performance appraisals often fall victim to the availability
heuristic. Working from memory, vivid instances of an employee’s behavior (either
positive or negative) will be most easily recalled from memory, will appear more
numerous than commonplace incidents, and will therefore be weighted more heavily
in the performance appraisal. The recency of events is also a factor: Managers give
more weight to performance during the three months prior to the evaluation than to
the previous nine months of the evaluation period because it is more available in
memory. Page 19.
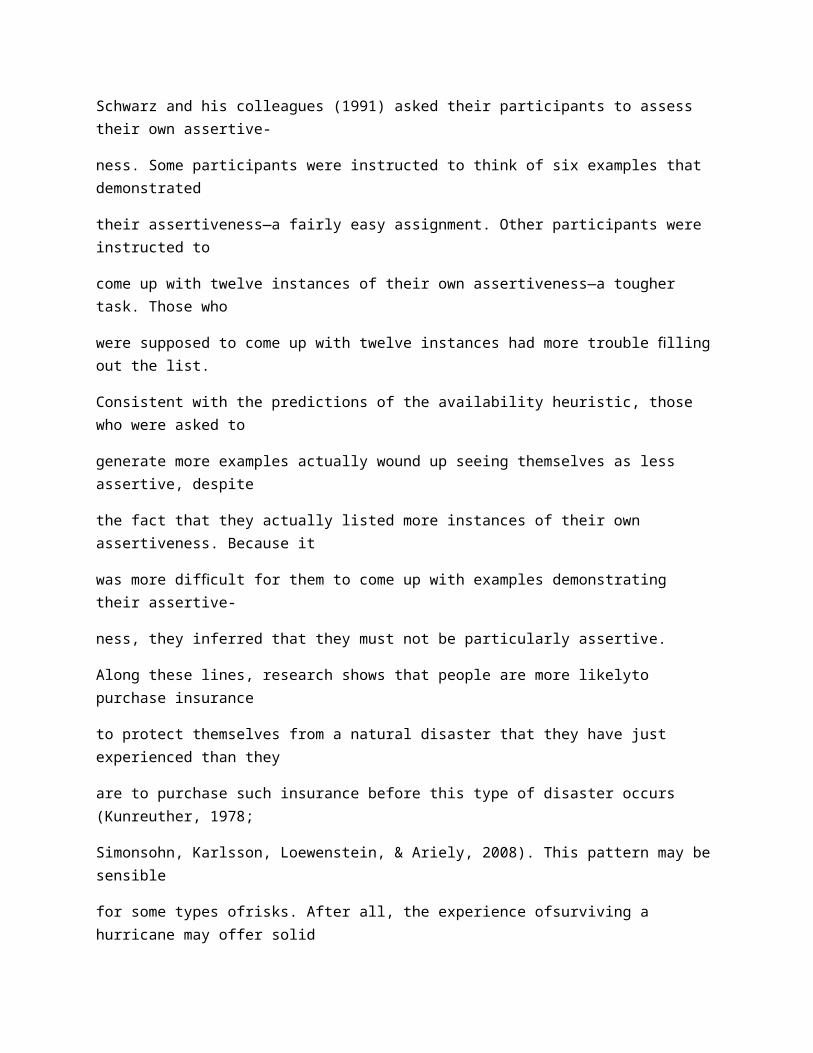
In one clever experiment that illustrates the potential biasing effect ofavailability,
Schwarz and his colleagues (1991) asked their participants to assess their own assertive-
ness. Some participants were instructed to think of six examples that demonstrated
their assertiveness—a fairly easy assignment. Other participants were instructed to
come up with twelve instances of their own assertiveness—a tougher task. Those who
were supposed to come up with twelve instances had more trouble filling out the list.
Consistent with the predictions of the availability heuristic, those who were asked to
generate more examples actually wound up seeing themselves as less assertive, despite
the fact that they actually listed more instances of their own assertiveness. Because it
was more difficult for them to come up with examples demonstrating their assertive-
ness, they inferred that they must not be particularly assertive.
Along these lines, research shows that people are more likelyto purchase insurance
to protect themselves from a natural disaster that they have just experienced than they
are to purchase such insurance before this type of disaster occurs (Kunreuther, 1978;
Simonsohn, Karlsson, Loewenstein, & Ariely, 2008). This pattern may be sensible
for some types ofrisks. After all, the experience ofsurviving a hurricane may offer solid
evidence that your property is more vulnerable to hurricanes than you had thought or
that climate change is increasing your vulnerability to hurricanes. This explanation can-
not account for trends in the purchase of earthquake insurance, however. Geologists
tell us that the risk of future earthquakes subsides immediately after an earthquake
occurs. Nevertheless, those who lived through an earthquake are more likely to
which often occurs when people look back on their own judgments and those of others.
We typically are notvery good at recalling or reconstructing the way an uncertain situation
appeared to us before finding out the results of the decision. What play would you have
called? Did you really know that your spouse should have turned left? Was there truly
evidence that the selected supervisor was a bad choice? Could the senior vice president
actually have predicted your study’s results? While our intuition is occasionally accurate,
we tend to overestimate what we knew beforehand based upon what we later learned.
Fischhoff(1975) examined the differences between hindsight and foresight in the
context of judging the outcome of historical events. In one study, participants were div-
ided into five groups and asked to read a passage about the war between the British and
Gurka forces in 1814. One group was not told the result of the war. The remaining four
groups of participants were told either that: (1) the British won, (2) the Gurkas won, (3)
a military stalemate was reached with no peace settlement, or (4) a military stalemate
was reached with a peace settlement. Obviously, only one group was told the truthful
outcome—in this case, (1)—that the British won. Each participant was then asked what
his or her subjective assessments of the probability of each of the outcomes would have
been without the benefit of knowing the reported outcome. Participants tended to be-
live that even if they had not been told the outcome, they would have judged the out-
come that they were later told had happened as being most likely. Based on this and
other varied examples, it becomes clear that knowledge of an outcome increases an
individual’s belief about the degree to which he or she would have predicted that out-
come without the benefit of that knowledge.
The processes that give rise to anchoring and overconfidence are also at work in
producing the hindsight bias (Fiedler, 2000; Koriat, Fiedler, & Bjork, 2006). According
to this explanation, knowledge of an event’s outcome works as an anchor by which
individuals interpret their prior judgments of the event’s likelihood. Due to the selec-
tive accessibility ofconfirmatory information during information retrieval, adjustments
to anchors are inadequate (Mussweiler & Strack, 1999). Consequently, hindsight
knowledge biases our perceptions of what we remember knowing in foresight. Further-
more, to the extent that various pieces of data about the event vary in support of the
actual outcome, evidence that is consistent with the known outcome may become cog-
nitively more salient and thus more available in memory (Slovic & Fischhoff, 1977).
This tendency will lead an individual to justify a claimed foresight in view of‘ ‘the facts
provided.’’ Finally, the relevance of a particular piece of data may later be judged im-
portant to the extent to which it is representative of the final observed outcome. Page 39
In the short run, the hindsight bias can offer a number of advantages. For instance,
it can be flattering to believe that your judgment is far better than it actually is! In
addition, hindsight allows us to criticize other people’s apparent lack of foresight. How-
ever, the hindsight bias reduces our ability to learn from the past and to evaluate deci-
sions objectively. In general, individuals should be judged by the process and logic of
their decisions, not just on their results. A decision maker who makes a high-quality
decision that does not work out should be rewarded, not punished. Why? Because re-
sults are affected by a variety of factors outside the direct control of the decision maker.
When the hindsight bias leads our knowledge of the result to color our evaluation of the
decision maker’s logic, we will make poorer evaluations than we would otherwise.
Closely related to the hindsight bias is the ‘‘curse ofknowledge,’’ which argues that
when assessing others’ knowledge, people are unable to ignore knowledge that they
have that others do not have (Camerer, Loewenstein, & Weber, 1989). Available
knowledge is hard to forget when you try to imagine how much others know about
something; sophistication stands in the way of a fair assessment. This ‘‘curse’’ explains
the difficulty that teachers often have adjusting their lessons according to students’
level of knowledge and the tendency ofproduct designers to overestimate the average
person’s ability to master high-tech devices. Indeed, evidence suggests that as many as
halfofhigh-tech devices that consumers return as malfunctioning are, in fact, in perfect
working order—the consumer just couldn’t figure out how to use it (den Ouden, 2006).
Hoch (1988) found that marketing experts are generally worse at predicting the beliefs,
values, and tastes ofother consumers than nonexpert consumers are. This results from
the marketing experts acting as if the nonexpert consumer understood as much about
the products as they do.
Have you ever given someone what you believed were very clear directions to your
home, only to find that he got lost? Keysar (1994) argues that when an individual sends
an ambiguous message (which is clear to her) to another individual, based on informa-
tion that the receiver does not possess, she assumes that her intent will be magically
understood by the other party. Keysar (1994) had people read scenarios that provided
them with privileged information about ‘‘David.’’ They read that David had dinner at a
particular restaurant based on a friend’s recommendation. Halfthe participants in the
experiment learned that David had really enjoyed his meal, and the other halflearned
that he had disliked it very much. All the participants read that David wrote his friend
the following note: ‘‘About the restaurant, it was marvelous, just marvelous.’’ The
participants who knew that David had enjoyed the restaurant had a strong tendency to
believe that the friend would take the comment as sincere. In contrast, participants who
knew that David had disliked the restaurant had a strong tendency to believe that the
friend would take the comment as sarcastic. This result occurred despite the fact that
both groups of participants knew that the friend had access to the same note and no
additional information about David’s dining experience.
In organizations, a great deal ofdisappointment results from the failure to commu-
nicate clearly. This disappointment is caused in part by our false belief that people
understand our ambiguous messages. It should come as no surprise that communica-
tion by e-mail, lacking the cues ofintonation and body language, only makes this prob-
lem worse (Kruger, Epley, Parker, & Ng, 2005).
INTEGRATION AND COMMENTARY
Heuristics, or rules of thumb, are the cognitive tools we use to simplify decision mak-
ing. The preceding pages have described twelve ofthe most common biases that result
when we over-rely on these judgmental heuristics. These biases, along with their asso-
ciated heuristics, are summarized in Table 2.2. Remember that more than one heuristic
can operate on your decision-making processes at any given time.
The logic of heuristics is that, on average, any loss in decision quality will be out-
weighed by time saved. And, indeed, such ‘‘shortcuts’’ lead far more often to adequate
decisions than to poor ones. However, as we have demonstrated in this chapter, a blan-
ket acceptance of heuristics is unwise. First, as illustrated by the quiz items, there are
many instances in which the loss in decision quality far outweighs the time saved by
heuristics. Second, the foregoing logic suggests that we voluntarily accept the quality
tradeoffs associated with heuristics. In reality, we do not: Most of us are unaware of
their existence and their pervasive impact upon our decision making. Consequently, we
fail to distinguish between situations in which they are beneficial and situations in
which they are potentially harmful.
Why do we fail to apply heuristics selectively? In good part because our minds are
wired to make reliance on these heuristics natural and comfortable. For instance, the
biases related to the availability heuristic appear to be a natural function of the selec-
tiveness of human memory. Our brains are better at remembering information that is
interesting, emotionally arousing, or recently acquired. The human brain evolved over
millennia using strategies that helped our ancestors survive and reproduce. Humans
seem to be more self-aware than any other animals. Nevertheless, we remain pro-
foundly ignorant of the internal workings of our minds and of the processes, such as
recall from immediate memory and confirmatory hypothesis testing, that can have such
important and negative consequences.
When the stakes are high and decision quality is important, it is worth engaging in
more effortful thought processes that can avoid biases. The key to improved judgment
lies in learning to distinguish between appropriate and inappropriate uses ofheuristics,
when your judgment is likely to rely on heuristics, and how to avoid them. This chapter
gives you the foundation you need to make these distinctions.
TABLE 2-2 Summary ofthe Twelve Biases Presented in Chapter 2
Bias Description
Biases Emanating from the Availability Heuristic
1. Ease of recall Individuals judge events that are more easily recalled from
memory, based on vividness or recency, to be more numerous
than events of equal frequency whose instances are less easily
recalled.
2. Retrievability Individuals are biased in their assessments of the frequency of
events based on how their memory structures affect the search
process.
Biases Emanating from the Representativeness Heuristic
3. Insensitivity to base rates When assessing the likelihood of events, individuals tend to
ignore base rates if any other descriptive information is
provided—even if it is irrelevant.
4. Insensitivity to sample size When assessing the reliability of sample information,
individuals frequently fail to appreciate the role of sample size.
5. Misconceptions of chance Individuals expect that a sequence of data generated by a
random process will look ‘‘random,’’ even when the sequence is too short for those expectations to be statistically valid.
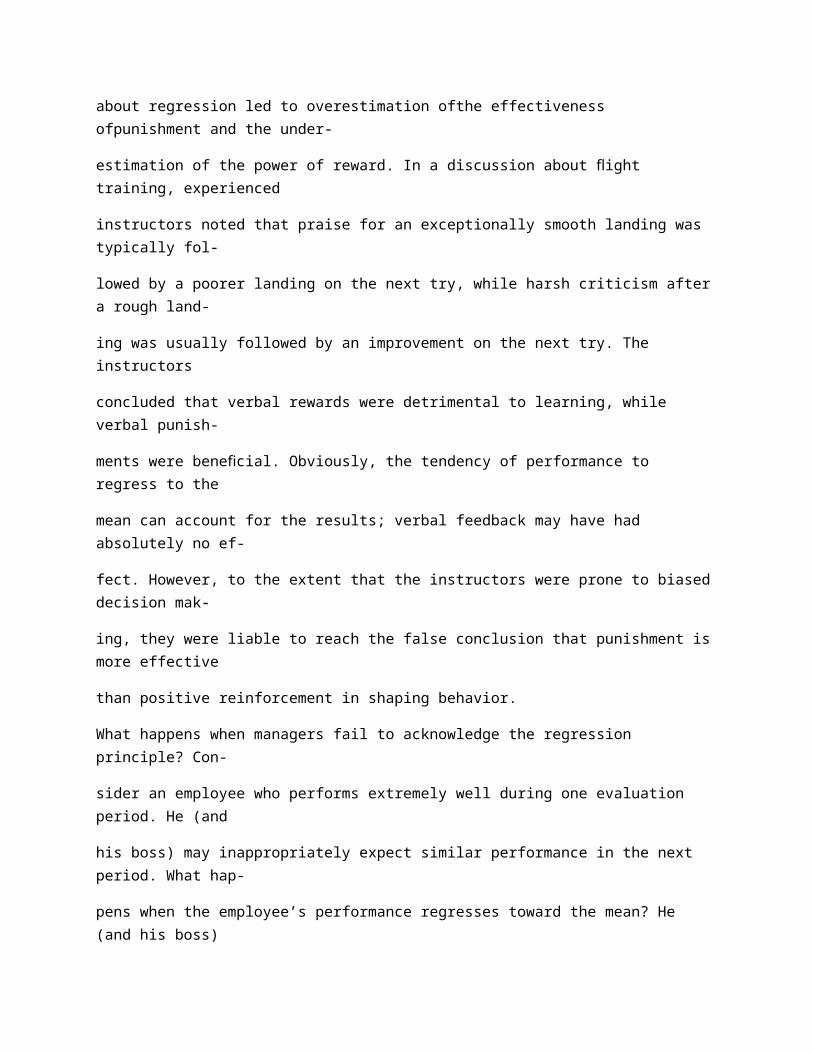
6. Regression to the mean Individuals tend to ignore the fact that extreme events tend to
regress to the mean on subsequent trials.
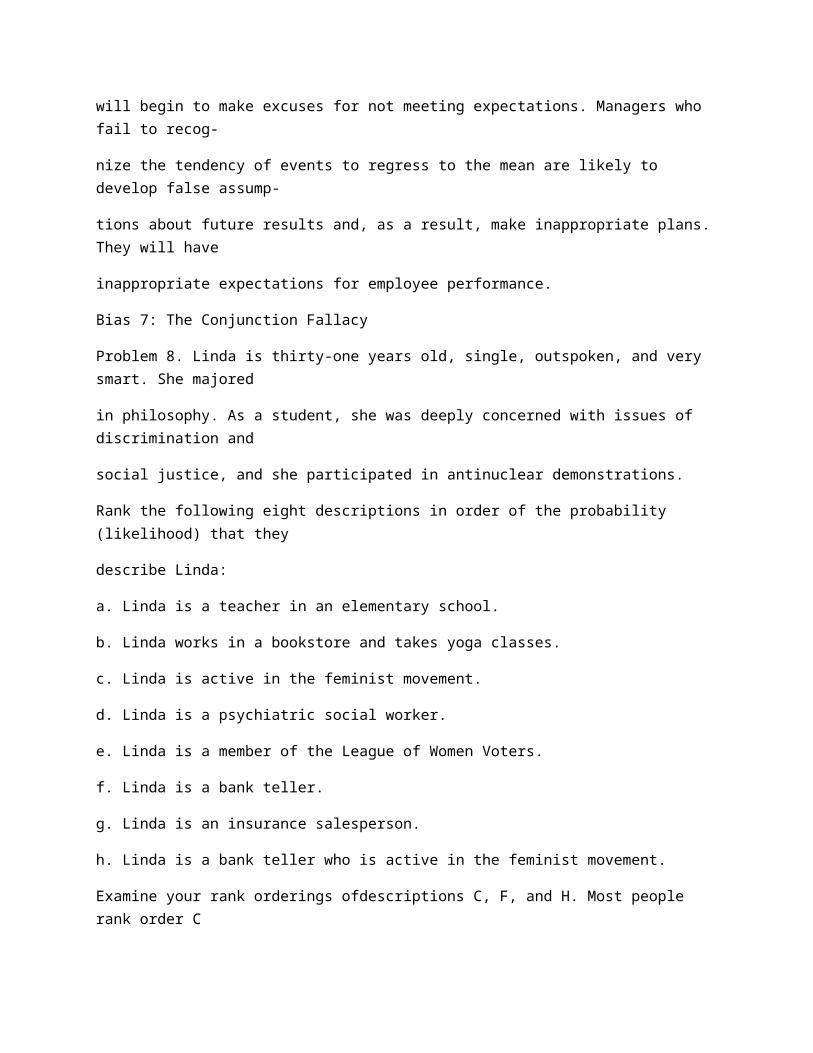
7. The conjunction fallacy Individuals falsely judge that conjunctions (two events co-
occurring) are more probable than a more global set of occurrences of which the conjunction is a subset.
Biases Emanating from the Confirmation Heuristic
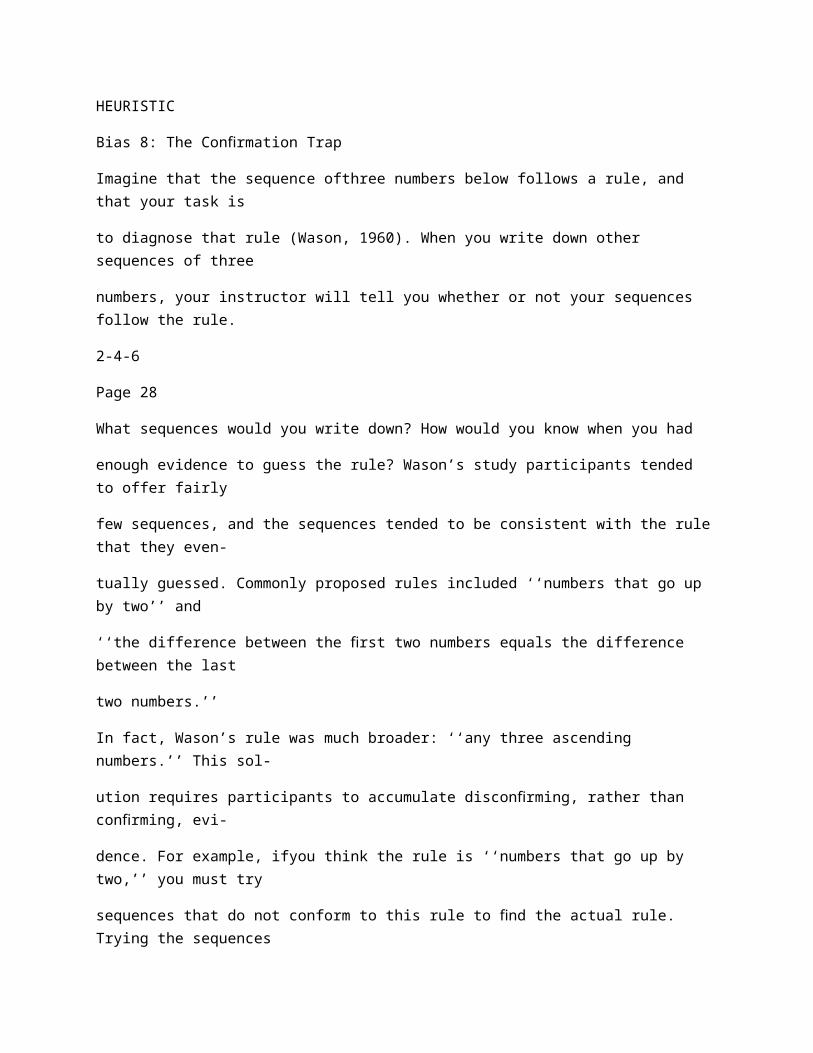
8. The confirmation trap Individuals tend to seek confirmatory information for what they
think is true and fail to search for disconfirmatory evidence.
9. Anchoring Individuals make estimates for values based upon an initial
value (derived from past events, random assignment, or
whatever information is available) and typically make
insufficient adjustments from that anchor when establishing a final value.
10. Conjunctive- and
disjunctive-events bias Individuals exhibit a bias toward overestimating the probability
of conjunctive events and underestimating the probability of disjunctive events.
11. Overconfidence Individuals tend to be overconfident of the infallibility of their
judgments when answering moderately to extremely difficult questions.
12. Hindsight and the curse of knowledge After finding out whether or not an event occurred, individuals
tend to overestimate the degree to which they would have predicted the correct outcome. Furthermore, individuals fail to ignore information they possess that others do not when