Page 1
Financial Analysis 2014
An Annual Report on the Financial Health of PennsylvaniaHospitals
Volume One: General Acute Care Hospitals
Pennsylvania Health Care Cost Containment Council May 2015
Page 2
About PHC4 The Pennsylvania Health Care Cost
Containment Council (PHC4) is an independent
state agency charged with collecting, analyzing, and
reporting information that can be used to improve
the quality and restrain the cost of health care in the
state. It was created in the mid-1980s when
Pennsylvania businesses and labor unions, in
collaboration with other key stakeholders, joined
forces to enact market-oriented health care reforms.
As a result of their efforts, the General Assembly
passed legislation (Act 89 of 1986) creating PHC4.
PHC4’s primary goal is to empower purchasers
of health care benefits, such as businesses and labor
unions, as well as other stakeholders, with
information they can use to improve quality and
restrain costs. More than 840,000 public reports on
patient treatment results are downloaded from the
PHC4 website each year. Additionally, nearly 100
organizations and individuals annually utilize
PHC4’s special requests process to access and use
data. Today, PHC4 is a recognized national leader
in public health care reporting.
PHC4 is governed by a 25-member board of
directors representing business, labor, consumers,
health care providers, insurers, and state
government.
Foreword
A high-quality, cost-effective health care
delivery system requires financially healthy
hospitals and health systems. Since fiscal year
1989, the Pennsylvania Health Care Cost
Containment Council (PHC4) has produced a series
of financial reports measuring the financial
condition and utilization of the Commonwealth’s
hospitals and health systems.
Volume One presents a financial profile of
Pennsylvania’s general acute care (GAC) hospitals.
Volume Two provides financial information about
ambulatory surgery centers, and Volume Three
addresses non-GAC (rehabilitation, long-term acute,
psychiatric and specialty) hospitals.
The GAC hospitals data included in Volume
One is, for most GAC hospitals, on a fiscal year
2014 (FY14) basis. FY14 began on July 1, 2013
and ended on June 30, 2014. A small number of
facilities operate fiscally on a calendar year; their
reporting period is from January 1, 2013 to
December 31, 2013.
Information contained in this report was derived
from annual hospital financial statements,
supplemented with additional data supplied by each
hospital. Every reasonable effort has been made to
ensure the accuracy of the information contained
herein. Each facility had the opportunity to review
its data and to make corrections. The responsibility
for data accuracy lies with each individual facility.
Table of Contents
Hospital Income .......................................... 1
Statewide Utilization ................................... 8
Individual Hospital Data ........................... 11
Explanation of Terms & Measures ........... 26
Non-Compliant Hospitals .......................... 27
Page 3
HOSPITAL INCOME
Financial Analysis 2014 • Volume One
1
Pennsylvania’s GAC Hospitals
The Commonwealth of Pennsylvania licenses
general acute care (GAC) hospitals, including
specialty acute care hospitals, to offer medical and/or
surgical services to the public. A GAC hospital
provides care to patients who require hospitalization
for more than 24 hours, and may offer emergency
care. Many GAC hospitals operate subunits, such as
skilled nursing, psychiatric, rehabilitation, and long-
term acute care, which are included in the
information presented in this report. Ancillary
operations, such as physician practice groups, were
excluded whenever possible.
There were 171 licensed GAC hospitals in
Pennsylvania that operated during at least some por-
tion of fiscal year 2014 (FY14). There were 173
GAC hospitals operating during the prior year. Three
hospitals closed between reporting periods, Saint
Catherine Medical Center Fountain Springs, Marian
Community Hospital, and Montgomery Hospital.
Wills Eye Hospital converted from an ambulatory
surgery center to a hospital between reporting
periods.
This report includes 170 hospitals in the
individual hospital data tables because one hospital
did not submit FY14 data. The statewide and
regional analysis in this report is based on data for all
GAC hospitals.
Hospital Income
Hospitals need positive income levels (total
margin) to operate effectively. Those that have a
negative total margin, or deficit, are not receiving
sufficient revenue to pay all of their expenses.
Hospitals operating at a deficit must find other
sources of revenue, such as debt restructuring,
charitable donations, or endowments, etc., or review
spending patterns to find ways to save on costs.
Hospitals need to earn sufficient income to
improve their facilities and equipment. Such
improvements are necessary to replace worn out or
obsolete buildings and equipment, keep pace with
changes in medical technology, and meet a
community’s changing health care needs.
In addition to using their own funds, hospitals
finance improvements to facilities and equipment by
issuing bonds or entering into other debt financing.
Financial institutions and potential bondholders,
however, must believe that a hospital is capable of
repaying its debt. Hospitals projected to have low or
negative income may encounter difficulty borrowing
money.
It is important to monitor hospital income levels
closely because relatively small changes in revenues
or expenses can make a large difference in the
financial health of a hospital.
The level of income needed to keep a hospital
financially healthy will be different for each
individual hospital or health system. The precise
amount of income a hospital needs depends on
several factors, including, but not limited to: the
condition of its plant and equipment, the amount of
debt, assets available for capital improvements, the
mix of care provided by the hospital, the level of
payment risk, and the current and future needs of the
market a hospital serves.
For example, a hospital that has experienced low
or negative income levels for a number of years may
need to realize an above-average income level if it is
to make overdue capital improvements, reduce
outstanding debt, and replenish capital reserves.
Alternatively, a hospital with a history of continuous
moderate income levels in all likelihood can maintain
operations with a lower income level if it has kept
pace with needed improvements and has not depleted
its capital reserves or acquired debt in order to meet
expenses.
Page 4
HOSPITAL INCOME
Financial Analysis 2014 • Volume One
2
Figure 1 Statewide Operating and Non-Operating Income
($1,000)
($500)
$0
$500
$1,000
$1,500
$2,000
$2,500
FY00 FY01 FY02 FY03 FY04 FY05 FY06 FY07 FY08 FY09 FY10 FY11 FY12 FY13 FY14
Millions
Operating Income Non‐operating Income
Operating Margin & Total Margin
Hospital income is usually expressed as either
operating margin or total margin.
Operating margin reflects the percent of
operating revenue remaining after all operating
expenses are paid (operating income). A hospital’s
operations include patient care and other related
functions, such as medical education, cafeteria
services, community health education and screening
programs, and parking services. A positive operating
margin indicates operating revenues exceed operating
expenses. Alternatively, a negative operating margin
indicates that revenues are not covering costs. To
cover operating expenses, hospitals with a negative
operating margin, for instance, may use funds that
were reserved to replace obsolete or worn out
facilities and equipment.
Total margin reflects the percent of net income,
which is both operating income and income from all
other sources, (non-operating income). Examples of
non-operating income are investment gains, trust
income and contributions. However, some hospitals
may include all or part of investment and trust
income in operating revenue, specifically when the
funds have been designated to support specific
operations of a hospital.
Total margin reveals the composite financial
health of a facility during the year. If total margin is
negative, the hospital is losing money after all
sources of revenue and income have been considered.
Endowments enable some hospitals with negative
operating margins to continue operations to provide
care. For endowed hospitals, a negative operating
margin may not be critical, provided the facility
realizes a healthy positive total margin.
Hospitals without endowments or other non-
operating income sources may have very similar
operating and total margins. In such cases, a low or
negative operating and/or total margin may reveal the
hospital is under financial stress.
Page 5
HOSPITAL INCOME
Financial Analysis 2014 • Volume One
3
Statewide Margins
Statewide operating income decreased from $1.8
billion in FY13 to $1.7 billion in FY14 (Figure 1).
As a result, the statewide average operating margin
decreased from 4.67% in FY13 to 4.30% in FY14
(Figure 2).
Statewide operating income decreased because
the increase in operating expenses outpaced the
increase in operating revenues. GAC hospitals
collectively posted an increase in operating revenue
of 3.1%, or $1.2 billion, while operating expenses
increased 3.5%, or $1.3 billion. Total operating
revenue increased to $40.5 billion, and operating
expenses increased to $38.7 billion in FY14.
The revenue hospitals received for patient care,
net patient revenue, grew 3.2% during FY14.
Statewide net patient revenue was $38.3 billion,
making up 95% of statewide total operating revenue
during FY14.
The overall total margin realized by GAC
hospitals decreased by 0.36 percentage points during
FY14, from 6.06% in FY13 to 5.70% in FY14. The
average total margin increased 0.13 percentage points
the previous year, from 5.93% in FY12 to 6.06% in
FY13.
The decrease in the statewide total margin during
FY14 was the product of the increase in non-
operating income combined with a decrease in
operating income. The $67.7 million decrease in
statewide net income was the result of a $24.9
million increase in non-operating income and $92.6
million decrease in operating income. The net result
is statewide net income decreased from $2.4 billion
in FY13 to $2.3 billion in FY14.
GAC Hospital Margins
Fifty-seven, or 34%, of 170 GAC hospitals
included in this analysis posted a negative operating
margin in FY14. In FY13, 59 hospitals (out of 169),
or 35%, reported a negative operating margin.
For these hospitals with negative operating
margins, revenue from patient care and other
operations was not sufficient to cover operating
expenses.
Among the 57 GAC hospitals with operating
losses in FY14, 46, or 81%, of the hospitals had
annual net patient revenues below $150 million.
The number of hospitals with a negative total
margin decreased in FY14. Forty-seven, or 28%,
GAC hospitals posted a negative total margin in
Figure 2 Statewide Average Operating and Total Margins
0.89%2.00% 2.05% 2.16% 1.99%
3.52%3.99%
4.82%
3.99%
3.53%
4.37%
5.55% 5.73%
4.67%4.30%
3.16% 3.29%
2.19% 2.30%
3.22%
4.59%
5.39%
6.56%
4.70%
2.03%
5.26%
7.04%5.93% 6.06%
5.70%
0%
2%
4%
6%
8%
FY00 FY01 FY02 FY03 FY04 FY05 FY06 FY07 FY08 FY09 FY10 FY11 FY12 FY13 FY14
Operating Margin Total Margin
Page 6
HOSPITAL INCOME
Financial Analysis 2014 • Volume One
4
FY14. In FY13, 49 hospitals, or 29%, reported a
negative total margin.
Since extraordinary or short-term events can have
a significant impact on a hospital’s annual total
margin, a three-year average total margin often
provides a better perspective on a hospital’s medium-
term financial health.
Among the 164 hospitals that operated from
FY12 through FY14, 33, or 20%, realized average
losses over this three-year period (Figure 3). Thirty-
five hospitals realized average losses in the prior
three-year period between FY11 and FY13.
There was a general improvement in the number
of hospitals with a positive three-year average total
margin in FY14. Eighty percent, or 131, hospitals
experienced a positive three-year average total mar-
gin in FY14. During FY13, 126, or 78%, of the 161
hospitals had a positive three-year average total
margin.
The number of hospitals with a three-year
average total margin in the 0% to 2% range increased
from 15 at the end of FY13 to 18 at the end of FY14.
The number of hospitals that posted a three-year
average total margin above 8% rose by one, from 42
at the end of FY13 to 43 at the end of FY14.
Uncompensated Care Levels
The foregone dollar value of uncompensated care
grew by 2.2%, or about $22 million, from $1.043
billion during FY13 to $1.065 billion during FY14
(Figure 4). Uncompensated care as a percent of net
patient revenue remained relatively unchanged at
2.78%.
Forty-nine percent of uncompensated care was
categorized as bad debt during FY14. This indicates
that Pennsylvania GAC hospitals as a group did not
receive payment for a little over half of the care that
was determined to be uncollectible. The remaining
51% of unreimbursed care was provided as charity
care to patients that met the individual hospital’s
charity care guidelines.
Uncompensated Care Calculation
Hospitals report bad debt and charity care at
charges. Using each hospital’s revenue-to-charge
Figure 3 Statewide Distribution of 3-Year Average Total Margin
22%
9%
16%13%
14%
26%
20%
11%
21%
10%12%
26%
0%
5%
10%
15%
20%
25%
30%
Loss 0‐2% 2‐4% 4‐6% 6‐8% >8%
FY11 ‐ FY13 FY12 ‐ FY14
3‐yr Average Total Margin
Number of Hospitals
FY11 ‐ FY13 FY12 ‐ FY14
Loss 35 33
0‐2% 15 18
2‐4% 25 35
4‐6% 21 16
6‐8% 23 19
>8% 42 43
Total 161 164
Percent of hospitals
Page 7
HOSPITAL INCOME
Financial Analysis 2014 • Volume One
5
ratio, bad debt charges and charity care charges were
converted to a dollar value known as foregone
revenue. This uncompensated care foregone revenue
provides an estimate of the amount of revenue from
all payers (commercial health insurers, Medicare,
Medical Assistance, and patients) that hospitals did
not receive due to bad debt and charity care.
All services and materials that are provided to the
general public under an established fee are eligible to
be included in uncompensated care. Consequently,
costs associated with hospital-sponsored community
health programs are not included. Hospitals
frequently report these activities separately.
A few hospitals include the difference between
reimbursements from government-funded programs,
such as Medical Assistance, and their customary fees
or charges as a component of charity care in their
audited financial statements. These differences are
not included in the uncompensated care levels
reported to PHC4. However, if a patient fails to pay
a required co-payment, or receives care beyond the
range of services covered by a third-party payer,
these foregone revenues may be included in charity
care or bad debt.
For-Profit GAC Hospitals
During FY14, all but 35 of the 171 GAC
hospitals operated solely as non-profit organizations
(Table 1). Non-profit hospitals retain all income
from their operations within the organization. Their
income is used primarily to fund capital
improvements, retire outstanding debt, and create a
reserve in the event that revenues do not cover
expenses in the future. For-profit hospitals may
distribute a portion of their income to shareholders as
dividends. In FY14, three publicly traded for-profit
corporations, Tenet Healthcare Corporation,
Community Health Systems Inc., and Health
Management Associates Inc. operated 21 of the 35
for-profit GAC hospitals in Pennsylvania. The
remaining 14 for-profit hospitals were privately held
companies. Twelve of the hospitals operated by the
publicly traded corporations made a profit during
FY14, and nine hospitals operated at a loss.
Unlike non-profit hospitals, the income realized
by for-profit hospitals is subject to income tax.
PHC4 reports income taxes as a non-operating
expense. Consequently, the operating margins
portrayed in this report for both non-profit and for-
profit hospitals are comparable.
Figure 4 Statewide Uncompensated Care
2.46% 2.32%2.17% 2.17% 2.09% 2.17% 2.27%
2.44% 2.48% 2.59% 2.73% 2.72% 2.81% 2.78%
0%
1%
2%
3%
4%
FY01 FY02 FY03 FY04 FY05 FY06 FY07 FY08 FY09 FY10 FY11 FY12 FY13 FY14
* Statewide uncompensated care foregone revenue in millions.
$461* $469* $479* $523* $544* $604* $677* $769* $825* $891* $974* $989* $1,043* $1,065*
Percent of net patient revenue
Page 8
HOSPITAL INCOME
Financial Analysis 2014 • Volume One
6
Table 1 Statewide For-Profit General Acute Care Hospitals
Hospital Corporate Owner Region
Operating Margin
Total Margin
FY14 FY14
Advanced Surgical Advanced Surgical Hospital, LLC 1 14.08% 15.93%
Barix Clinics PA Barix Clinics of Pennsylvania, LLC 8 ‐114.03% ‐191.47%
Berwick Community Health Systems 4 9.78% 5.48%
Brandywine Community Health Systems 8 ‐11.85% ‐6.97%
Carlisle Regional Health Management Associates 5 25.62% 18.14%
Chestnut Hill Community Health Systems 9 ‐6.39% ‐4.66%
Coordinated Health Ortho Coordinated Health Holding Company, LLC 7 11.77% 11.77%
Eastern Regional Eastern Regional Medical Center, Inc 9 0.90% 0.56%
Easton Community Health Systems 7 15.38% 9.00%
Edgewood Surgical Surgery Center at Edgewood Place, LLC 2 8.61% 8.73%
Hahnemann University Tenet Health System 9 ‐11.28% ‐7.26%
Heart of Lancaster Health Management Associates 5 16.92% 16.92%
Jennersville Regional Community Health Systems 8 ‐6.06% ‐4.12%
Lancaster Regional Health Management Associates 5 16.35% 10.06%
Lock Haven Community Health Systems 4 6.01% 6.01%
Lower Bucks Prime Healthcare Services 8 ‐10.56% ‐10.34%
Memorial York Community Health Systems 5 3.77% 2.30%
Mid‐Valley Community Health Systems 6 ‐33.82% ‐19.79%
Moses Taylor Community Health Systems 6 ‐3.34% ‐1.95%
OSS Orthopaedic OSS Orthopaedic Hospital, LLC 5 6.36% 6.90%
Phoenixville Community Health Systems 8 6.95% 4.05%
Physicians Care Physicians Care Surgical Hospital, LP 8 20.61% 20.61%
Pottstown Memorial Community Health Systems 8 20.15% 13.84%
Regional Scranton Community Health Systems 6 ‐9.17% ‐12.97%
Rothman Ortho Specialty Bucks County Specialty Hospital, LLC 8 30.13% 30.13%
Roxborough Memorial Prime Healthcare Services Inc 9 ‐12.28% ‐12.28%
Sharon Regional Sharon Pennsylvania Hospital Company LLC 2 ‐4.17% ‐2.47%
Southwest Regional Essent Healthcare, LLC 1 ‐2.72% ‐0.12%
St Christopher's Children Tenet Health System 9 3.39% 2.00%
Sunbury Community Community Health Systems 4 ‐42.69% ‐24.97%
Surgical Inst Reading Surgical Institute of Reading LP 7 23.04% 23.14%
Surgical Spec Coordinated Coordinated Health Holding Company, LLC 7 16.81% 16.81%
Tyler Memorial Community Health Systems 6 2.45% 1.30%
Wilkes‐Barre General Community Health Systems 6 4.19% 2.45%
Statewide 2.48% 1.70%
Westfield Hospital, a for‐profit hospital, closed.
Page 9
HOSPITAL INCOME
Financial Analysis 2014 • Volume One
7
Since for-profit hospitals typically have little or
no non-operating income, the difference between the
operating and non-operating income of for-profit
hospitals is primarily the effect of federal income
taxes.
Typically, if a for-profit hospital had a positive
operating margin and its parent corporation paid in-
come taxes, the hospital will have an income tax
expense, thereby reducing the hospital’s total margin.
If a for-profit hospital lost money and its parent
corporation posted a tax credit, typically a tax credit
is posted for the facility. The tax credit is an estimate
of how much the hospital’s loss reduced the parent’s
net income, and therefore its tax expense. In these
circumstances, the tax credit will increase the
hospital’s total margin.
Additionally, based on the corporate structure of
the hospital, e.g., a Limited Liability Corporation
(LLC), some for-profit hospitals’ income tax expense
may be passed on to the owners, in which case the
hospitals are not directly subject to income tax.
Of the 34 for-profit hospitals reporting data,
twelve reported federal income tax expenses totaling
$64.6 million in FY14, about 3.0% of their total
operating revenue and 43.3% of their net operating
income. Nine of the 34 hospitals received tax credits
totaling $36.2 million. The remaining thirteen
hospitals were limited partnerships and LLC’s that
passed tax liability on to the owners. The average
operating margin for the statewide for-profit hospitals
in FY14 is 2.48% and the average total margin (after
taxes) is 1.70%.
In January 2014 Community Health Systems,
Inc. acquired Health Management Associates for-
profit hospitals.
Average Days in Patient Accounts Receivable
During the period between a hospital concluding
services to a patient and receiving payment for those
services, the amount the hospital expects to receive is
booked as patient accounts receivable. Accounts
receivable can be affected by a number of factors
including: the efficiency of hospital billing and
claims systems, the time it takes third-party payers
and individuals to pay bills, communications between
hospitals and payers, and the time it takes hospitals to
remove uncollectible accounts from accounts
receivable.
On a statewide basis, the amount of time the
average bill remained in accounts receivable
decreased 1 day to 45 days in FY14 (Figure 5).
Figure 5 Statewide Average Patient Days in Accounts Receivable
66 6458
5449
45 45 44 44 43 41 42 44 46 45
0
10
20
30
40
50
60
70
80
Days
Page 10
STATEWIDE UTILIZATION
Financial Analysis 2014 • Volume One
8
Statewide Utilization
The number of statewide hospital discharges
reported by GAC hospitals declined from 1.65
million in FY13 to 1.60 million in FY14 (Figure 6).
The statewide total number of patient days
declined for the seventh consecutive year at GAC
hospitals, from 8.62 million in FY13 to 8.35 million
in FY14 (Figure 7).
Statewide average length of stay (ALOS) has
remained relatively level after small steady declines
from FY00 through FY06 (Figure 8). During FY09
to FY14, the ALOS remained approximately the
same between 5.18 and 5.23 days.
Of the $38.3 billion in statewide net patient
revenue 54.7%, or $20.9 billion, was derived from
inpatient care. Statewide inpatient revenue increased
1.8% during FY14.
Statewide outpatient revenue increased 4.9%
during FY14, rising to $17.1 billion. Outpatient
revenue made up 44.8% of total net patient revenue
in FY14. Hospitals reported a 3.2% decrease in the
number of outpatient visits in FY14 to 38.0 million
visits.
The remaining 0.5% of statewide net patient
revenue was generated by home health care provided
by hospitals. Forty-two of the GAC hospitals offered
home health services during FY14. Statewide home
health revenue increased 1.6% during FY14 to $215
million. The number of visits to patients’ homes by
hospital home health staff declined 7.5% to 1.3
million visits in FY14.
Figure 6 Statewide Inpatient Discharges
1.75
1.76
1.75
1.781.82
1.83
1.82
1.83
1.83
1.79
1.75
1.721.69
1.65
1.601.55
1.60
1.65
1.70
1.75
1.80
1.85
1.90
Millions
Figure 7 Statewide Inpatient Days
9.75
9.71
9.49
9.59
9.73
9.67
9.62
9.67
9.65
9.399.14
8.978.74
8.62
8.35
7.50
8.00
8.50
9.00
9.50
10.00
Millions
Figure 8 Statewide Average Length of Stay
5.57
5.51
5.41 5.395.35
5.29 5.27 5.28 5.285.23 5.22 5.23
5.185.22 5.23
5.00
5.25
5.50
5.75
Days
Page 11
STATEWIDE UTILIZATION
Financial Analysis 2014 • Volume One
9
Utilization and Revenue by Payer
GAC hospitals received 95% of their net patient
revenue, which encompasses inpatient, outpatient and
home health services, from third-party health care
insurers in FY14 (Figure 9). These health insurers
included the federal Medicare program, the state and
federally-funded Medical Assistance program, and
commercial managed care and indemnity companies.
The remaining 5% came from patients and other
insurers, such as auto insurance and workers’
compensation.
Commercial health insurers provided 48%, or
$18.2 billion, of statewide net patient revenue at
GAC hospitals in FY14. Medicare paid for 34%, or
$13.2 billion, and Medical Assistance program
provided 13% or $4.9 billion of statewide net patient
revenue (Table 2).
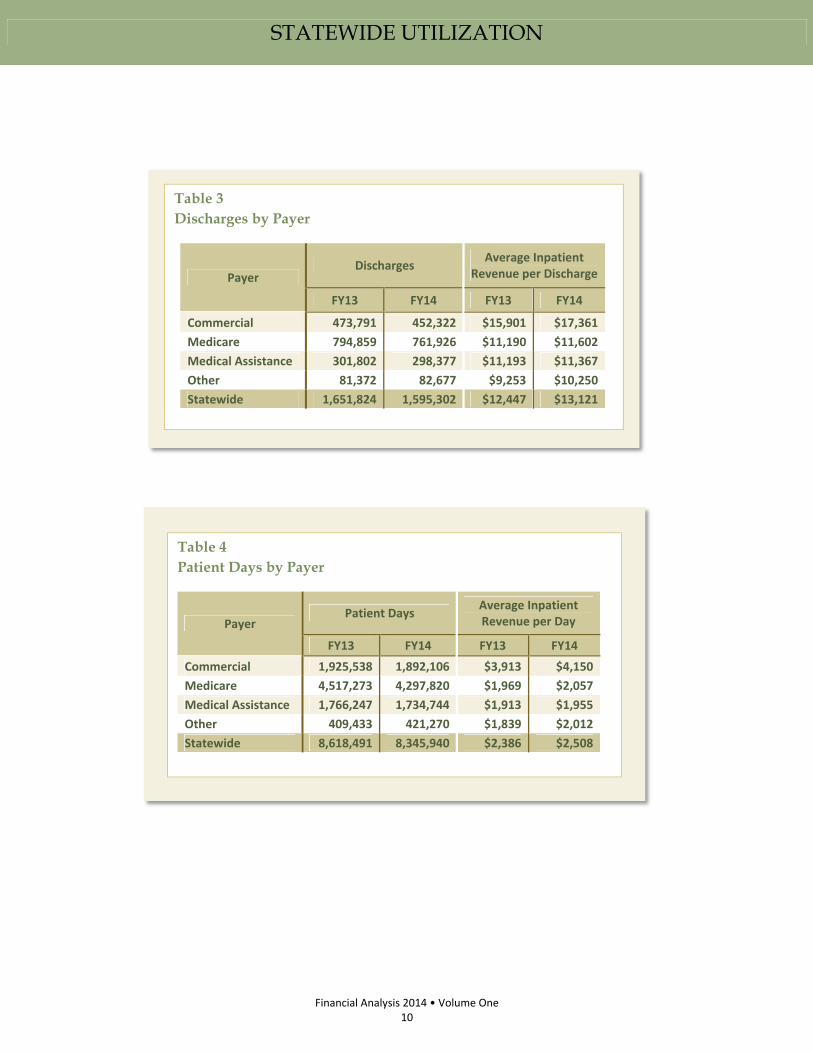
Statewide the number of patient days and patient
discharges decreased in all third-party health care
insurers categories at GAC hospitals during FY14
(Table 3 & Table 4). Statewide GAC hospitals
experienced an increase in the number of patient days
and patient discharges from the ‘other’ payer
category during FY14.
Statewide average inpatient revenue per day and
average revenue per discharge increased for all payer
categories during FY14.
Figure 9 Statewide Net Patient Revenue by Payer, FY14
Indemnity13%
Managed Care35%
Indemnity21%
Managed Care13%
Indemnity3%
Managed Care10%
MedicalAssistance
13%
Commercial48%
Medicare34%
Other5%
Table 2 Net Patient Revenue by Payer (millions)
Payer FY13 FY14
Commercial $ 17,463 $ 18,229
Medicare $ 12,987 $ 13,182
Medical Assistance $ 4,791 $ 4,883
Other $ 1,865 $ 1,988
Statewide $ 37,106 $ 38,282
Page 12
STATEWIDE UTILIZATION
Financial Analysis 2014 • Volume One
10
Table 3 Discharges by Payer
Payer Discharges
Average Inpatient Revenue per Discharge
FY13 FY14 FY13 FY14
Commercial 473,791 452,322 $15,901 $17,361
Medicare 794,859 761,926 $11,190 $11,602
Medical Assistance 301,802 298,377 $11,193 $11,367
Other 81,372 82,677 $9,253 $10,250
Statewide 1,651,824 1,595,302 $12,447 $13,121
Table 4 Patient Days by Payer
Payer Patient Days
Average Inpatient Revenue per Day
FY13 FY14 FY13 FY14
Commercial 1,925,538 1,892,106 $3,913 $4,150
Medicare 4,517,273 4,297,820 $1,969 $2,057
Medical Assistance 1,766,247 1,734,744 $1,913 $1,955
Other 409,433 421,270 $1,839 $2,012
Statewide 8,618,491 8,345,940 $2,386 $2,508
Page 13
INDIVIDUAL HOSPITAL DATA
Financial Analysis 2014 • Volume One
11
Hospital Data
The tables on the following pages provide
hospital-specific financial data for 170 GAC
hospitals that reported data for FY14. The hospitals
are arranged by the PHC4’s nine regions.
Included in these tables are operating and total
margins for each individual hospital. Each hospital’s
corresponding operating income, total income, and
total operating revenue can be obtained on PHC4’s
website, www.phc4.org. (Note: Other operating
revenue must be included with net patient revenue to
calculate the operating income that is used to
calculate operating margin.)
Averages for all of the hospitals in the region are
presented in the first row of each table. The regional
averages that are expressed as a percentage (e.g., “3-
Year Average Change in NPR” and “Operating
Margin”) are calculated as if the entire region was a
single reporting entity. For example, the regional
average operating margins are calculated by adding
operating income and operating revenue for all
hospitals within the region. The regional total
operating income is divided by the regional total
operating revenue to yield a regional average
operating margin.
In calculating the regional averages, estimated
data was used for hospitals that reported less than a
full year of data due to a change in the fiscal year.
No estimated data was used for the individual
hospital data.
Footnotes 1. The end of the fiscal year is not June 30. The data reflects
the fiscal year that ended prior to June 30.
2. FY14 data is less than 12 months; therefore, a three‐year comparison is not appropriate for some of the measures.
3. Prior year(s) reflect less than 12 months of data; therefore, a three‐year comparison is not appropriate for some of the measures.
4. This is the first reporting year for this facility. Expenses are often higher than operating revenue during the start‐up period. Three‐year comparisons are not appropriate for this facility.
5. The hospital has specialty units such as psychiatric, rehabilitation, long‐term care, skilled nursing, etc., which are included in the data presented for the facility.
6. Extraordinary item(s) was included in the calculation of total margin.
7. Balance sheet ratios are for the parent organization.
8. Acquired or merged with another licensed hospital during the FY14 reporting period.
9. Acquired or merged with another licensed hospital during the FY12 or FY13 reporting periods.
10. For‐profit facility; total margin includes pro rata share of the parent corporation’s federal income taxes.
11. Facility is referred to by a different name, or it closed after the FY14 reporting period.
12. Facility failed to satisfy the financial filing requirements.
13. One or more of the required financial submissions was filed late.
14. Facility submitted incomplete or inaccurate data.
NA Not applicable.
NR Information necessary to report or calculate this measure was not reported by the hospital.
Page 14
INDIVIDUAL HOSPITAL DATA
Financial Analysis 2014 • Volume One
12
Hospital
Net Patient Revenue (NPR) (millions)
3‐yr Avg Change in NPR FY11‐14
Total Operating Expenses (TOE) (millions)
3‐yr Avg Change in TOE FY11‐14 FY14 FY13 FY12 FY11 FY14 FY13 FY12 FY11
Region 1 Average $258 $248 $256 $252 0.81% $270 $261 $260 $251 2.48%
ACMH 5 $93 $92 $93 $90 1.29% $94 $92 $90 $88 2.55%
Advanced Surgical 1, 3, 10 $15 $14 $14 $4 NA $13 $13 $12 $6 NA
Allegheny General 1, 2 $308 $593 $602 $616 NA $301 $616 $590 $594 NA
Allegheny Valley 1, 2, 5 $50 $108 $115 $120 NA $54 $117 $114 $117 NA
Butler Memorial 5 $217 $202 $198 $201 2.62% $206 $203 $201 $210 ‐0.69%
Canonsburg 1, 2, 5 $23 $48 $46 $50 NA $24 $55 $52 $53 NA
Children's Hosp Pgh UPMC 5 $481 $445 $431 $414 5.33% $524 $483 $468 $442 6.11%
Excela Hlth Westmoreland 5, 7 $212 $205 $217 $235 ‐3.30% $214 $221 $214 $248 ‐4.67%
Forbes 1, 2, 5 $93 $173 $181 $193 NA $117 $186 $179 $182 NA
Frick 6 $45 $44 $45 $50 ‐3.04% $41 $46 $45 $49 ‐5.32%
Heritage Valley Beaver 5 $214 $209 $206 $219 ‐0.66% $228 $229 $220 $240 ‐1.67%
Heritage Valley Sewickley 5, 7 $118 $115 $121 $121 ‐0.82% $129 $127 $125 $133 ‐0.89%
Highlands 5 $23 $20 $22 $24 ‐0.86% $24 $23 $23 $26 ‐1.76%
Jefferson 1, 2, 5 $107 $215 $210 $209 NA $120 $239 $220 $221 NA
Latrobe Area 5, 7 $117 $115 $119 $124 ‐1.68% $112 $123 $118 $123 ‐2.95%
Magee Womens UPMC 5 $510 $467 $441 $431 6.07% $483 $420 $406 $376 9.54%
Monongahela Valley 5 $125 $125 $123 $110 4.66% $127 $127 $124 $111 4.83%
Ohio Valley General 5 $50 $54 $53 $57 ‐3.86% $59 $58 $58 $63 ‐2.32%
Southwest Regional 5, 10 $29 $33 $40 $41 ‐10.11% $31 $37 $41 $40 ‐7.11%
St Clair Memorial 5, 7 $240 $223 $219 $216 3.66% $232 $223 $217 $214 2.84%
Uniontown 5 $116 $119 $121 $121 ‐1.48% $120 $125 $127 $129 ‐2.51%
UPMC East 5 $112 $82 NA NA NA $114 $97 NA NA NA
UPMC McKeesport 5 $139 $131 $127 $128 3.05% $145 $137 $128 $124 5.79%
UPMC Mercy 5 $340 $354 $363 $347 ‐0.65% $372 $387 $379 $352 1.91%
UPMC Passavant 5 $379 $372 $378 $360 1.74% $373 $356 $349 $321 5.30%
UPMC Presby Shadyside 5 $2,078 $2,024 $2,068 $1,904 3.04% $2,200 $2,200 $2,118 $1,928 4.71%
UPMC St Margaret 5 $226 $222 $237 $240 ‐1.98% $230 $227 $233 $218 1.83%
Washington 5, 7 $223 $216 $215 $229 ‐0.85% $229 $222 $229 $232 ‐0.44%
West Penn 1, 2, 5 $104 $183 $151 $190 NA $149 $214 $192 $198 NA
See footnotes on page 11.
Page 15
INDIVIDUAL HOSPITAL DATA
Financial Analysis 2014 • Volume One
13
Hospital Operating Margin FY14
Total Margin FY14
3‐yr Avg Total Margin
FY12‐FY14
Percent of Uncompensated
Care FY14
Medicare Share of NPR FY14
Medical Assistance
Share of NPR FY14
Region 1 Average 1.64% 3.03% 3.55% 2.26% 38.44% 11.91%
ACMH 5 3.01% 5.30% 5.64% 2.06% 44.03% 10.69%
Advanced Surgical 1, 3, 10 14.08% 15.93% 14.39% 0.35% 36.49% 0.01%
Allegheny General 1, 2 7.87% 8.96% 6.13% 1.70% 43.11% 13.49%
Allegheny Valley 1, 2, 5 ‐0.05% 0.45% 1.66% ‐2.58% 57.01% 7.15%
Butler Memorial 5 9.39% 9.85% 6.42% 1.56% 45.40% 5.79%
Canonsburg 1, 2, 5 3.17% 3.20% ‐5.87% ‐2.97% 50.00% 4.34%
Children's Hosp Pgh UPMC 5 2.81% 2.87% 3.43% 2.57% 2.42% 40.95%
Excela Hlth Westmoreland 5, 7 3.48% 8.66% 4.88% 2.63% 45.75% 8.48%
Forbes 1, 2, 5 ‐23.62% ‐23.62% ‐5.95% 1.93% 52.71% 7.11%
Frick 6 11.79% 10.87% 5.22% 3.68% 49.72% 7.95%
Heritage Valley Beaver 5 ‐0.40% 2.40% 0.58% 2.67% 48.69% 5.90%
Heritage Valley Sewickley 5, 7 ‐1.07% 1.04% 2.13% 2.86% 42.04% 6.82%
Highlands 5 0.05% 4.17% 2.00% 4.72% 43.70% 21.15%
Jefferson 1, 2, 5 ‐6.10% 4.54% 2.88% 2.47% 52.76% 3.63%
Latrobe Area 5, 7 9.56% 15.68% 9.74% 2.68% 42.56% 5.80%
Magee Womens UPMC 5 8.30% 8.57% 11.27% 2.37% 18.55% 14.37%
Monongahela Valley 5 0.84% 2.68% 2.60% 2.70% 50.50% 12.12%
Ohio Valley General 5 ‐7.61% 7.46% 2.07% 2.25% 59.97% 4.75%
Southwest Regional 5, 10 ‐2.72% ‐0.12% 0.87% 4.73% 47.45% 14.92%
St Clair Memorial 5, 7 7.35% 14.01% 11.00% 1.00% 48.99% 4.94%
Uniontown 5 1.70% 2.68% 0.25% 4.50% 52.33% 18.04%
UPMC East 5 1.19% 1.19% NA 2.82% 44.89% 6.21%
UPMC McKeesport 5 0.20% 0.20% 2.17% 5.42% 57.53% 12.10%
UPMC Mercy 5 ‐4.13% ‐4.13% ‐2.66% 4.93% 46.81% 15.80%
UPMC Passavant 5 3.96% 3.96% 7.56% 1.83% 39.60% 2.66%
UPMC Presby Shadyside 5 3.08% 3.16% 3.93% 2.11% 37.52% 10.19%
UPMC St Margaret 5 1.78% 1.78% 3.49% 1.98% 47.41% 5.47%
Washington 5, 7 5.87% 8.99% 6.49% 3.69% 44.29% 12.85%
West Penn 1, 2, 5 ‐36.22% ‐36.15% ‐19.89% 0.94% 34.30% 11.52%
See footnotes on page 11.
Page 16
INDIVIDUAL HOSPITAL DATA
Financial Analysis 2014 • Volume One
14
Hospital
Net Patient Revenue (NPR) (millions)
3‐yr Avg Change in
NPR FY11‐14
Total Operating Expenses (TOE) (millions)
3‐yr Avg Change in
TOE FY11‐14 FY14 FY13 FY12 FY11 FY14 FY13 FY12 FY11
Region 2 Average $89 $86 $87 $85 1.53% $92 $91 $89 $87 1.82%
Bradford Regional 1, 5 $67 $58 $62 $62 2.63% $69 $58 $61 $61 4.26%
Charles Cole Memorial 5 $73 $71 $66 $64 4.50% $77 $75 $70 $67 5.41%
Clarion 5 $47 $47 $50 $48 ‐0.94% $50 $49 $50 $48 1.23%
Corry Memorial $18 $17 $16 $19 ‐2.06% $19 $19 $17 $19 0.96%
Edgewood Surgical 1, 7, 10 $8 $8 $8 $8 1.42% $8 $8 $7 $8 ‐1.68%
Ellwood City 5 $28 $28 $30 $30 ‐2.14% $33 $32 $33 $32 1.26%
Grove City 5 $42 $42 $44 $43 ‐0.66% $44 $43 $44 $44 0.01%
Jameson Memorial 5 $105 $110 $103 $102 0.94% $110 $113 $104 $103 2.31%
Kane Community $19 $20 $19 $15 8.69% $20 $19 $18 $14 13.96%
Meadville 5 $150 $148 $143 $136 3.29% $151 $153 $146 $138 3.29%
Millcreek Community 5 $45 $38 $40 $39 4.43% $46 $42 $40 $40 5.13%
Penn Highlands Brookville 5 $24 $25 $25 $25 ‐0.79% $26 $28 $26 $26 0.18%
Penn Highlands Clearfield 5 $46 $50 $56 $64 ‐9.30% $55 $58 $62 $68 ‐6.51%
Penn Highlands DuBois 5 $225 $211 $203 $198 4.55% $235 $225 $218 $208 4.25%
Penn Highlands Elk 5 $67 $69 $70 $71 ‐2.11% $70 $72 $72 $73 ‐1.42%
Punxsutawney Area 5 $29 $29 $29 $30 ‐0.92% $32 $31 $32 $32 0.04%
Saint Vincent 5, 7 $236 $213 $233 $237 ‐0.20% $235 $242 $245 $255 ‐2.65%
Sharon Regional 2, 5, 10 $35 $149 $156 $155 NA $38 $166 $173 $163 NA
Titusville Area $22 $26 $31 $31 ‐8.88% $29 $30 $30 $31 ‐1.91%
UPMC Hamot $343 $317 $332 $307 3.87% $334 $317 $316 $304 3.27%
UPMC Horizon 5 $147 $141 $135 $119 8.11% $148 $140 $132 $119 8.04%
UPMC Northwest 5 $100 $99 $95 $86 5.34% $98 $90 $89 $85 5.34%
Warren General 5 $66 $64 $66 $68 ‐1.10% $75 $74 $69 $70 2.84%
See footnotes on page 11.
Page 17
INDIVIDUAL HOSPITAL DATA
Financial Analysis 2014 • Volume One
15
Hospital Operating Margin FY14
Total Margin FY14
3‐yr Avg Total Margin
FY12‐FY14
Percent of Uncompensated
Care FY14
Medicare Share of NPR FY14
Medical Assistance
Share of NPR FY14
Region 2 Average 1.08% 3.81% 3.17% 2.98% 45.21% 10.84%
Bradford Regional 1, 5 0.81% 1.07% 3.37% 2.21% 38.40% 15.90%
Charles Cole Memorial 5 2.80% 3.61% 2.94% 3.58% 42.66% 14.70%
Clarion 5 ‐1.93% 0.82% 2.41% 4.09% 50.49% 5.85%
Corry Memorial ‐5.66% ‐4.06% ‐7.92% 4.76% 47.42% 11.31%
Edgewood Surgical 1, 7, 10 8.61% 8.73% 10.44% 0.62% 24.54% 1.65%
Ellwood City 5 ‐9.93% ‐2.74% 1.53% 1.79% 53.31% 4.71%
Grove City 5 ‐3.51% 1.87% 3.44% 2.42% 39.82% 5.43%
Jameson Memorial 5 ‐0.17% 2.77% 3.09% 4.18% 54.32% 9.30%
Kane Community ‐1.37% ‐1.27% 8.80% 2.67% 51.72% 11.59%
Meadville 5 3.44% 5.71% 5.47% 2.10% 41.84% 7.05%
Millcreek Community 5 7.64% 14.71% 10.55% 3.02% 49.34% 20.45%
Penn Highlands Brookville 5 ‐5.97% ‐5.60% ‐2.98% 3.52% 49.47% 9.08%
Penn Highlands Clearfield 5 ‐12.96% ‐6.93% ‐6.10% 4.01% 48.78% 9.55%
Penn Highlands DuBois 5 0.52% 4.04% 1.10% 1.95% 42.39% 11.66%
Penn Highlands Elk 5 ‐1.41% 1.00% 1.86% 3.03% 42.51% 13.13%
Punxsutawney Area 5 ‐3.32% ‐0.42% ‐0.53% 4.26% 50.31% 10.52%
Saint Vincent 5, 7 5.78% 6.83% 1.65% 2.09% 48.31% 11.07%
Sharon Regional 2, 5, 10 ‐4.17% ‐2.47% ‐0.08% 1.04% 55.54% 13.11%
Titusville Area ‐20.30% 11.71% 3.89% 3.50% 54.51% 6.44%
UPMC Hamot 6.62% 9.80% 8.11% 3.93% 45.23% 13.09%
UPMC Horizon 5 1.40% 1.67% 3.74% 3.69% 43.40% 7.84%
UPMC Northwest 5 3.44% 3.44% 8.23% 4.75% 45.73% 8.93%
Warren General 5 ‐10.07% ‐7.70% ‐5.78% 2.01% 34.73% 6.33%
See footnotes on page 11.
Page 18
INDIVIDUAL HOSPITAL DATA
Financial Analysis 2014 • Volume One
16
Hospital
Net Patient Revenue (NPR) (millions)
3‐yr Avg Change in
NPR FY11‐14
Total Operating Expenses (TOE) (millions)
3‐yr Avg Change in
TOE FY11‐14 FY14 FY13 FY12 FY11 FY14 FY13 FY12 FY11
Region 3 Average $107 $103 $101 $100 2.34% $110 $105 $103 $102 2.79%
Conemaugh Valley Memorial 5, 7, 11 $360 $353 $348 $347 1.28% $372 $358 $348 $341 3.02%
Indiana Regional 5 $133 $128 $127 $130 0.67% $137 $131 $128 $135 0.62%
Meyersdale Community 5, 11 $13 $12 $12 $11 4.85% $13 $12 $12 $11 5.64%
Miners 11 $16 $16 $18 $17 ‐3.38% $16 $17 $17 $17 ‐1.67%
Nason $31 $30 $30 $32 ‐0.77% $32 $31 $30 $31 1.17%
Somerset 5 $62 $62 $62 $63 ‐0.68% $64 $62 $64 $63 0.33%
Tyrone $21 $18 $14 $16 10.94% $24 $21 $20 $20 7.14%
UPMC Altoona 5 $343 $328 $316 $297 5.09% $346 $328 $323 $309 4.02%
UPMC Bedford $51 $43 $40 $40 8.74% $51 $43 $38 $38 11.27%
Windber 5 $36 $39 $41 $41 ‐4.07% $45 $47 $48 $50 ‐3.63%
Hospital
Net Patient Revenue (NPR) (millions)
3‐yr Avg Change in
NPR FY11‐14
Total Operating Expenses (TOE) (millions)
3‐yr Avg Change in
TOE FY11‐14 FY14 FY13 FY12 FY11 FY14 FY13 FY12 FY11
Region 4 Average $153 $145 $128 $124 7.97% $152 $144 $127 $120 9.07%
Berwick 1, 5, 10 $61 $66 $68 $64 ‐1.62% $55 $59 $58 $57 ‐0.85%
Bucktail 5 $5 $6 $5 $6 ‐3.98% $7 $7 $6 $6 6.68%
Evangelical Community 5 $152 $132 $123 $122 8.22% $141 $129 $118 $117 6.67%
Geisinger Bloomsburg 5 $29 $30 $33 $40 ‐9.06% $41 $36 $40 $42 ‐0.45%
Geisinger Danville 5, 9 $950 $903 $851 $789 6.77% $934 $872 $831 $753 7.97%
Geisinger Lewistown 5 $87 $90 $88 $93 ‐2.32% $93 $93 $88 $91 0.94%
Jersey Shore $24 $27 $27 $30 ‐6.22% $28 $28 $28 $30 ‐2.93%
Lock Haven 1, 5, 10 $31 $30 $31 $28 2.88% $29 $34 $32 $31 ‐2.17%
Mount Nittany 5 $291 $258 $235 $226 9.47% $269 $254 $225 $207 10.14%
Muncy Valley 5 $45 $41 $40 $40 4.49% $39 $38 $36 $35 4.60%
Soldiers & Sailors 5 $53 $51 $49 $46 4.88% $53 $48 $46 $43 8.37%
Sunbury Community 1, 5, 10 $21 $23 $25 $25 ‐4.82% $31 $32 $34 $34 ‐3.61%
Williamsport Regional 5 $244 $228 $205 $187 10.21% $261 $244 $221 $195 11.24%
See footnotes on page 11.
Page 19
INDIVIDUAL HOSPITAL DATA
Financial Analysis 2014 • Volume One
17
Hospital Operating Margin FY14
Total Margin FY14
3‐yr Avg Total Margin
FY12‐FY14
Percent of Uncompensated
Care FY14
Medicare Share of NPR FY14
Medical Assistance
Share of NPR FY14
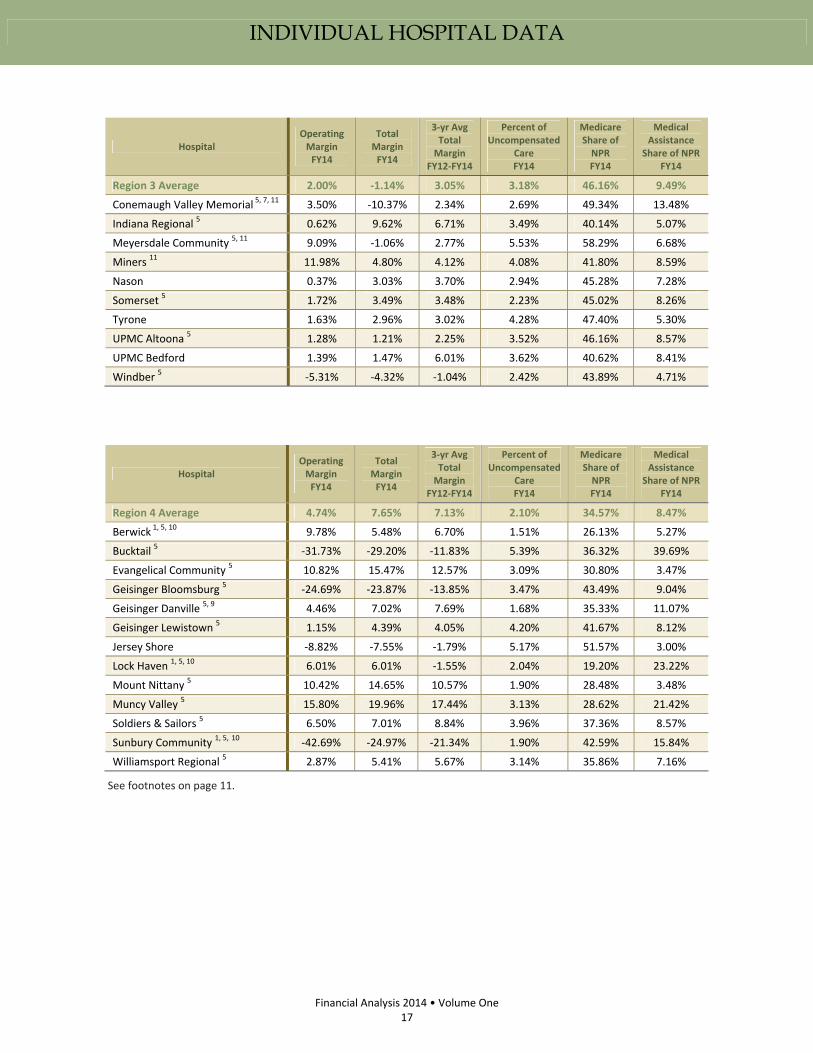
Region 3 Average 2.00% ‐1.14% 3.05% 3.18% 46.16% 9.49%
Conemaugh Valley Memorial 5, 7, 11 3.50% ‐10.37% 2.34% 2.69% 49.34% 13.48%
Indiana Regional 5 0.62% 9.62% 6.71% 3.49% 40.14% 5.07%
Meyersdale Community 5, 11 9.09% ‐1.06% 2.77% 5.53% 58.29% 6.68%
Miners 11 11.98% 4.80% 4.12% 4.08% 41.80% 8.59%
Nason 0.37% 3.03% 3.70% 2.94% 45.28% 7.28%
Somerset 5 1.72% 3.49% 3.48% 2.23% 45.02% 8.26%
Tyrone 1.63% 2.96% 3.02% 4.28% 47.40% 5.30%
UPMC Altoona 5 1.28% 1.21% 2.25% 3.52% 46.16% 8.57%
UPMC Bedford 1.39% 1.47% 6.01% 3.62% 40.62% 8.41%
Windber 5 ‐5.31% ‐4.32% ‐1.04% 2.42% 43.89% 4.71%
Hospital Operating Margin FY14
Total Margin FY14
3‐yr Avg Total Margin
FY12‐FY14
Percent of Uncompensated
Care FY14
Medicare Share of NPR FY14
Medical Assistance
Share of NPR FY14
Region 4 Average 4.74% 7.65% 7.13% 2.10% 34.57% 8.47%
Berwick 1, 5, 10 9.78% 5.48% 6.70% 1.51% 26.13% 5.27%
Bucktail 5 ‐31.73% ‐29.20% ‐11.83% 5.39% 36.32% 39.69%
Evangelical Community 5 10.82% 15.47% 12.57% 3.09% 30.80% 3.47%
Geisinger Bloomsburg 5 ‐24.69% ‐23.87% ‐13.85% 3.47% 43.49% 9.04%
Geisinger Danville 5, 9 4.46% 7.02% 7.69% 1.68% 35.33% 11.07%
Geisinger Lewistown 5 1.15% 4.39% 4.05% 4.20% 41.67% 8.12%
Jersey Shore ‐8.82% ‐7.55% ‐1.79% 5.17% 51.57% 3.00%
Lock Haven 1, 5, 10 6.01% 6.01% ‐1.55% 2.04% 19.20% 23.22%
Mount Nittany 5 10.42% 14.65% 10.57% 1.90% 28.48% 3.48%
Muncy Valley 5 15.80% 19.96% 17.44% 3.13% 28.62% 21.42%
Soldiers & Sailors 5 6.50% 7.01% 8.84% 3.96% 37.36% 8.57%
Sunbury Community 1, 5, 10 ‐42.69% ‐24.97% ‐21.34% 1.90% 42.59% 15.84%
Williamsport Regional 5 2.87% 5.41% 5.67% 3.14% 35.86% 7.16%
See footnotes on page 11.
Page 20
INDIVIDUAL HOSPITAL DATA
Financial Analysis 2014 • Volume One
18
Hospital
Net Patient Revenue (NPR) (millions)
3‐yr Avg Change in
NPR FY11‐14
Total Operating Expenses (TOE) (millions)
3‐yr Avg Change in
TOE FY11‐14 FY14 FY13 FY12 FY11 FY14 FY13 FY12 FY11
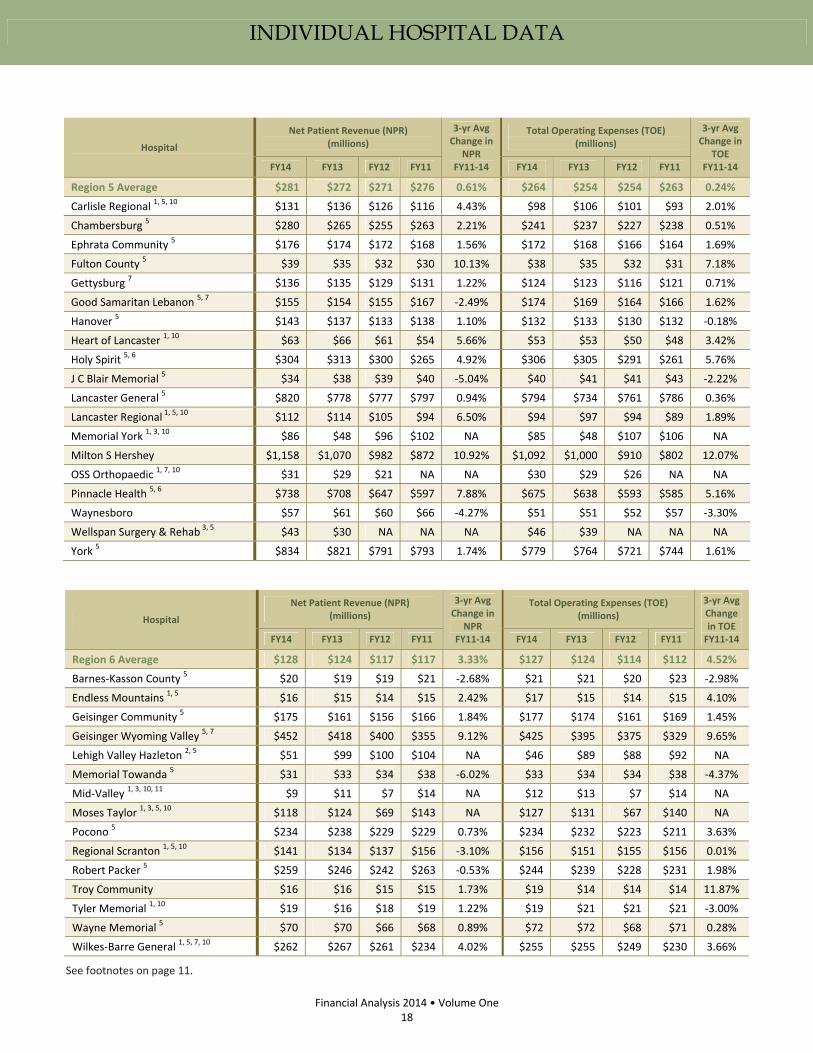
Region 5 Average $281 $272 $271 $276 0.61% $264 $254 $254 $263 0.24%
Carlisle Regional 1, 5, 10 $131 $136 $126 $116 4.43% $98 $106 $101 $93 2.01%
Chambersburg 5 $280 $265 $255 $263 2.21% $241 $237 $227 $238 0.51%
Ephrata Community 5 $176 $174 $172 $168 1.56% $172 $168 $166 $164 1.69%
Fulton County 5 $39 $35 $32 $30 10.13% $38 $35 $32 $31 7.18%
Gettysburg 7 $136 $135 $129 $131 1.22% $124 $123 $116 $121 0.71%
Good Samaritan Lebanon 5, 7 $155 $154 $155 $167 ‐2.49% $174 $169 $164 $166 1.62%
Hanover 5 $143 $137 $133 $138 1.10% $132 $133 $130 $132 ‐0.18%
Heart of Lancaster 1, 10 $63 $66 $61 $54 5.66% $53 $53 $50 $48 3.42%
Holy Spirit 5, 6 $304 $313 $300 $265 4.92% $306 $305 $291 $261 5.76%
J C Blair Memorial 5 $34 $38 $39 $40 ‐5.04% $40 $41 $41 $43 ‐2.22%
Lancaster General 5 $820 $778 $777 $797 0.94% $794 $734 $761 $786 0.36%
Lancaster Regional 1, 5, 10 $112 $114 $105 $94 6.50% $94 $97 $94 $89 1.89%
Memorial York 1, 3, 10 $86 $48 $96 $102 NA $85 $48 $107 $106 NA
Milton S Hershey $1,158 $1,070 $982 $872 10.92% $1,092 $1,000 $910 $802 12.07%
OSS Orthopaedic 1, 7, 10 $31 $29 $21 NA NA $30 $29 $26 NA NA
Pinnacle Health 5, 6 $738 $708 $647 $597 7.88% $675 $638 $593 $585 5.16%
Waynesboro $57 $61 $60 $66 ‐4.27% $51 $51 $52 $57 ‐3.30%
Wellspan Surgery & Rehab 3, 5 $43 $30 NA NA NA $46 $39 NA NA NA
York 5 $834 $821 $791 $793 1.74% $779 $764 $721 $744 1.61%
Hospital
Net Patient Revenue (NPR) (millions)
3‐yr Avg Change in
NPR FY11‐14
Total Operating Expenses (TOE) (millions)
3‐yr Avg Change in TOE FY11‐14 FY14 FY13 FY12 FY11 FY14 FY13 FY12 FY11
Region 6 Average $128 $124 $117 $117 3.33% $127 $124 $114 $112 4.52%
Barnes‐Kasson County 5 $20 $19 $19 $21 ‐2.68% $21 $21 $20 $23 ‐2.98%
Endless Mountains 1, 5 $16 $15 $14 $15 2.42% $17 $15 $14 $15 4.10%
Geisinger Community 5 $175 $161 $156 $166 1.84% $177 $174 $161 $169 1.45%
Geisinger Wyoming Valley 5, 7 $452 $418 $400 $355 9.12% $425 $395 $375 $329 9.65%
Lehigh Valley Hazleton 2, 5 $51 $99 $100 $104 NA $46 $89 $88 $92 NA
Memorial Towanda 5 $31 $33 $34 $38 ‐6.02% $33 $34 $34 $38 ‐4.37%
Mid‐Valley 1, 3, 10, 11 $9 $11 $7 $14 NA $12 $13 $7 $14 NA
Moses Taylor 1, 3, 5, 10 $118 $124 $69 $143 NA $127 $131 $67 $140 NA
Pocono 5 $234 $238 $229 $229 0.73% $234 $232 $223 $211 3.63%
Regional Scranton 1, 5, 10 $141 $134 $137 $156 ‐3.10% $156 $151 $155 $156 0.01%
Robert Packer 5 $259 $246 $242 $263 ‐0.53% $244 $239 $228 $231 1.98%
Troy Community $16 $16 $15 $15 1.73% $19 $14 $14 $14 11.87%
Tyler Memorial 1, 10 $19 $16 $18 $19 1.22% $19 $21 $21 $21 ‐3.00%
Wayne Memorial 5 $70 $70 $66 $68 0.89% $72 $72 $68 $71 0.28%
Wilkes‐Barre General 1, 5, 7, 10 $262 $267 $261 $234 4.02% $255 $255 $249 $230 3.66%
See footnotes on page 11.
Page 21
INDIVIDUAL HOSPITAL DATA
Financial Analysis 2014 • Volume One
19
Hospital Operating Margin FY14
Total Margin FY14
3‐yr Avg Total Margin
FY12‐FY14
Percent of Uncompensated
Care FY14
Medicare Share of NPR FY14
Medical Assistance
Share of NPR FY14
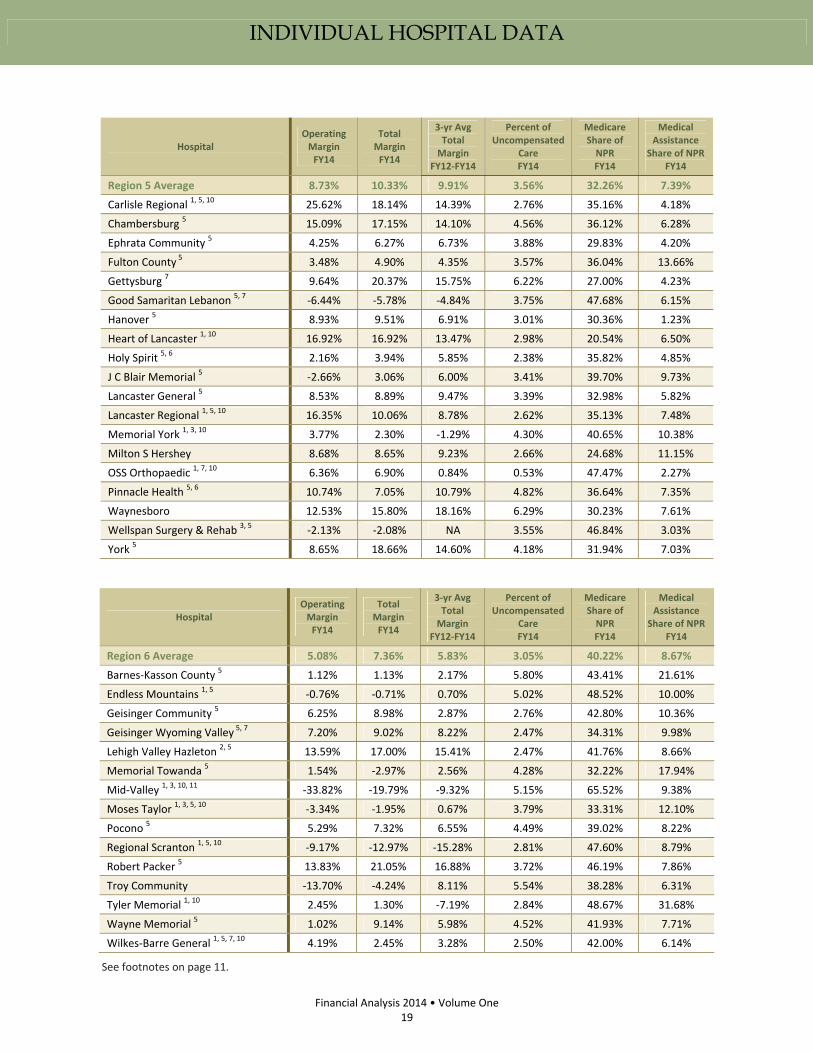
Region 5 Average 8.73% 10.33% 9.91% 3.56% 32.26% 7.39%
Carlisle Regional 1, 5, 10 25.62% 18.14% 14.39% 2.76% 35.16% 4.18%
Chambersburg 5 15.09% 17.15% 14.10% 4.56% 36.12% 6.28%
Ephrata Community 5 4.25% 6.27% 6.73% 3.88% 29.83% 4.20%
Fulton County 5 3.48% 4.90% 4.35% 3.57% 36.04% 13.66%
Gettysburg 7 9.64% 20.37% 15.75% 6.22% 27.00% 4.23%
Good Samaritan Lebanon 5, 7 ‐6.44% ‐5.78% ‐4.84% 3.75% 47.68% 6.15%
Hanover 5 8.93% 9.51% 6.91% 3.01% 30.36% 1.23%
Heart of Lancaster 1, 10 16.92% 16.92% 13.47% 2.98% 20.54% 6.50%
Holy Spirit 5, 6 2.16% 3.94% 5.85% 2.38% 35.82% 4.85%
J C Blair Memorial 5 ‐2.66% 3.06% 6.00% 3.41% 39.70% 9.73%
Lancaster General 5 8.53% 8.89% 9.47% 3.39% 32.98% 5.82%
Lancaster Regional 1, 5, 10 16.35% 10.06% 8.78% 2.62% 35.13% 7.48%
Memorial York 1, 3, 10 3.77% 2.30% ‐1.29% 4.30% 40.65% 10.38%
Milton S Hershey 8.68% 8.65% 9.23% 2.66% 24.68% 11.15%
OSS Orthopaedic 1, 7, 10 6.36% 6.90% 0.84% 0.53% 47.47% 2.27%
Pinnacle Health 5, 6 10.74% 7.05% 10.79% 4.82% 36.64% 7.35%
Waynesboro 12.53% 15.80% 18.16% 6.29% 30.23% 7.61%
Wellspan Surgery & Rehab 3, 5 ‐2.13% ‐2.08% NA 3.55% 46.84% 3.03%
York 5 8.65% 18.66% 14.60% 4.18% 31.94% 7.03%
Hospital Operating Margin FY14
Total Margin FY14
3‐yr Avg Total Margin
FY12‐FY14
Percent of Uncompensated
Care FY14
Medicare Share of NPR FY14
Medical Assistance
Share of NPR FY14
Region 6 Average 5.08% 7.36% 5.83% 3.05% 40.22% 8.67%
Barnes‐Kasson County 5 1.12% 1.13% 2.17% 5.80% 43.41% 21.61%
Endless Mountains 1, 5 ‐0.76% ‐0.71% 0.70% 5.02% 48.52% 10.00%
Geisinger Community 5 6.25% 8.98% 2.87% 2.76% 42.80% 10.36%
Geisinger Wyoming Valley 5, 7 7.20% 9.02% 8.22% 2.47% 34.31% 9.98%
Lehigh Valley Hazleton 2, 5 13.59% 17.00% 15.41% 2.47% 41.76% 8.66%
Memorial Towanda 5 1.54% ‐2.97% 2.56% 4.28% 32.22% 17.94%
Mid‐Valley 1, 3, 10, 11 ‐33.82% ‐19.79% ‐9.32% 5.15% 65.52% 9.38%
Moses Taylor 1, 3, 5, 10 ‐3.34% ‐1.95% 0.67% 3.79% 33.31% 12.10%
Pocono 5 5.29% 7.32% 6.55% 4.49% 39.02% 8.22%
Regional Scranton 1, 5, 10 ‐9.17% ‐12.97% ‐15.28% 2.81% 47.60% 8.79%
Robert Packer 5 13.83% 21.05% 16.88% 3.72% 46.19% 7.86%
Troy Community ‐13.70% ‐4.24% 8.11% 5.54% 38.28% 6.31%
Tyler Memorial 1, 10 2.45% 1.30% ‐7.19% 2.84% 48.67% 31.68%
Wayne Memorial 5 1.02% 9.14% 5.98% 4.52% 41.93% 7.71%
Wilkes‐Barre General 1, 5, 7, 10 4.19% 2.45% 3.28% 2.50% 42.00% 6.14%
See footnotes on page 11.
Page 22
INDIVIDUAL HOSPITAL DATA
Financial Analysis 2014 • Volume One
20
Hospital
Net Patient Revenue (NPR) (millions)
3‐yr Avg Change in
NPR FY11‐14
Total Operating Expenses (TOE) (millions)
3‐yr Avg Change in
TOE FY11‐14 FY14 FY13 FY12 FY11 FY14 FY13 FY12 FY11
Region 7 Average $214 $212 $193 $200 2.28% $210 $203 $182 $190 3.41%
Coordinated Health Ortho 1, 10 $31 $28 $31 $27 4.75% $27 $25 $24 $22 8.71%
Easton 1, 5, 10 $181 $188 $206 $197 ‐2.72% $154 $154 $155 $154 0.02%
Gnaden Huetten Memorial 5 $54 $55 $58 $57 ‐1.55% $55 $57 $56 $55 ‐0.25%
Lehigh Valley Allentown 5, 7 $1,066 $1,017 $987 $975 3.12% $1,114 $1,046 $976 $966 5.13%
Lehigh Valley Muhlenberg $217 $220 $221 $228 ‐1.66% $205 $207 $203 $210 ‐0.67%
Palmerton 5 $28 $28 $29 $25 4.28% $29 $29 $30 $27 3.01%
Reading 5 $751 $778 $738 $747 0.20% $754 $725 $684 $694 2.87%
Sacred Heart Allentown 5 $96 $95 $105 $102 ‐1.82% $92 $93 $102 $98 ‐1.96%
Schuylkill‐East Norwegian 5 $50 $54 $56 $58 ‐4.68% $57 $58 $59 $63 ‐3.46%
Schuylkill‐South Jackson 5 $84 $85 $86 $88 ‐1.54% $88 $86 $86 $93 ‐1.91%
St Joseph Reading $193 $196 $188 $199 ‐0.89% $189 $189 $182 $193 ‐0.70%
St Luke's Anderson 3 $141 $109 $40 NA NA $112 $90 $43 NA NA
St Luke's Bethlehem 5 $563 $575 $589 $588 ‐1.40% $531 $542 $544 $552 ‐1.26%
St Luke's Miners 5, 11 $48 $45 $41 $41 6.17% $43 $41 $38 $39 3.96%
Surgical Inst Reading 1, 10 $22 $20 $22 $20 3.22% $18 $18 $18 $18 0.33%
Surgical Spec Coordinated 1, 7, 10 $98 $93 $41 $20 133.03% $82 $76 $49 $17 123.53%
See footnotes on page 11.
Page 23
INDIVIDUAL HOSPITAL DATA
Financial Analysis 2014 • Volume One
21
Hospital Operating Margin FY14
Total Margin FY14
3‐yr Avg Total Margin
FY12‐FY14
Percent of Uncompensated
Care FY14
Medicare Share of NPR FY14
Medical Assistance
Share of NPR FY14
Region 7 Average 5.64% 5.95% 7.79% 2.72% 35.43% 8.18%
Coordinated Health Ortho 1, 10 11.77% 11.77% 16.06% 0.27% 34.69% 1.98%
Easton 1, 5, 10 15.38% 9.00% 11.65% 1.26% 38.78% 6.60%
Gnaden Huetten Memorial 5 3.26% 3.32% 3.29% 3.29% 48.22% 14.56%
Lehigh Valley Allentown 5, 7 1.27% 3.40% 7.55% 3.01% 33.85% 8.60%
Lehigh Valley Muhlenberg 9.73% 19.75% 16.34% 3.73% 41.03% 4.15%
Palmerton 5 ‐0.94% ‐0.20% ‐0.20% 3.08% 48.58% 4.21%
Reading 5 3.22% 3.20% 7.75% 2.17% 31.53% 7.45%
Sacred Heart Allentown 5 7.79% 7.94% 6.33% 1.62% 44.32% 18.24%
Schuylkill‐East Norwegian 5 ‐7.93% ‐7.99% ‐3.68% 3.17% 56.72% 5.81%
Schuylkill‐South Jackson 5 ‐1.54% ‐1.55% 1.30% 4.18% 37.34% 12.71%
St Joseph Reading 4.50% 5.63% 5.86% 2.57% 34.66% 11.66%
St Luke's Anderson 3 21.95% 15.79% 11.15% 2.59% 36.11% 3.68%
St Luke's Bethlehem 5 8.16% 5.23% 5.62% 3.16% 37.05% 8.71%
St Luke's Miners 5, 11 13.76% 8.86% 8.19% 4.47% 40.24% 11.98%
Surgical Inst Reading 1, 10 23.04% 23.14% 18.68% 0.14% 27.90% 2.44%
Surgical Spec Coordinated 1, 7, 10 16.81% 16.81% 11.29% 0.07% 21.00% 1.81%
See footnotes on page 11.
Page 24
INDIVIDUAL HOSPITAL DATA
Financial Analysis 2014 • Volume One
22
Hospital
Net Patient Revenue (NPR) (millions)
3‐yr Avg Change in
NPR FY11‐14
Total Operating Expenses (TOE) (millions)
3‐yr Avg Change in
TOE FY11‐14 FY14 FY13 FY12 FY11 FY14 FY13 FY12 FY11
Region 8 Average $191 $188 $191 $198 ‐1.17% $192 $188 $186 $194 ‐0.42%
Abington Memorial 5 $591 $600 $600 $626 ‐1.84% $614 $608 $599 $625 ‐0.60%
Barix Clinics PA 1, 10, 12 $5 NR $13 $10 ‐16.01% $11 NR $14 $12 ‐3.21%
Brandywine 1, 5, 10 $122 $120 $116 $104 5.89% $138 $136 $135 $116 6.24%
Chester County $233 $236 $221 $232 0.07% $251 $240 $231 $236 2.15%
Crozer Chester 5, 7 $468 $512 $526 $532 ‐4.02% $516 $528 $541 $542 ‐1.59%
Delaware County Memorial 5, 7 $157 $168 $178 $178 ‐3.93% $170 $178 $187 $184 ‐2.58%
Doylestown $217 $211 $198 $196 3.63% $225 $217 $203 $202 3.94%
Einstein Montgomery 3 $167 $111 NA NA NA $186 $135 NA NA NA
Grand View 5, 7 $169 $165 $165 $166 0.65% $168 $163 $164 $166 0.36%
Holy Redeemer 5 $172 $173 $179 $183 ‐2.13% $177 $180 $184 $185 ‐1.34%
Jennersville Regional 1, 10 $43 $43 $44 $40 2.61% $47 $46 $44 $42 3.63%
Lansdale 5 $78 $76 $75 $81 ‐1.03% $77 $76 $74 $80 ‐0.98%
Lower Bucks 1, 3, 5, 10 $76 $14 NR $94 NA $88 $24 NR $103 NA
Main Line Bryn Mawr 5 $306 $310 $321 $318 ‐1.22% $285 $285 $289 $289 ‐0.45%
Main Line Lankenau 5 $395 $374 $392 $361 3.10% $391 $353 $367 $356 3.26%
Main Line Paoli $284 $276 $282 $256 3.70% $239 $227 $234 $222 2.58%
Mercy Fitzgerald 5 $166 $169 $174 $192 ‐4.49% $174 $180 $177 $208 ‐5.41%
Mercy Suburban 5, 6 $92 $100 $109 $117 ‐7.08% $104 $112 $109 $120 ‐4.43%
Phoenixville 1, 5, 7, 10 $148 $149 $150 $149 ‐0.31% $140 $140 $138 $141 ‐0.33%
Physicians Care 1, 10 $20 $10 $10 NA NA $16 $12 $10 NA NA
Pottstown Memorial 1, 5, 10 $172 $180 $179 $178 ‐1.21% $139 $141 $139 $136 0.76%
Riddle Memorial 5 $161 $156 $165 $165 ‐0.74% $166 $169 $170 $172 ‐1.24%
Rothman Ortho Specialty 1, 10 $42 $37 $29 $17 50.37% $30 $29 $23 $16 31.80%
St Luke's Quakertown 5 $56 $60 $54 $50 4.20% $55 $56 $51 $49 4.26%
St Mary MC 5 $426 $404 $411 $389 3.22% $385 $371 $372 $348 3.46%
See footnotes on page 11.
Page 25
INDIVIDUAL HOSPITAL DATA
Financial Analysis 2014 • Volume One
23
Hospital Operating Margin FY14
Total Margin FY14
3‐yr Avg Total Margin
FY12‐FY14
Percent of Uncompensated
Care FY14
Medicare Share of NPR FY14
Medical Assistance
Share of NPR FY14
Region 8 Average 4.18% 4.83% 5.41% 2.35% 38.22% 8.43%
Abington Memorial 5 0.97% 1.25% 3.28% 1.85% 41.91% 6.16%
Barix Clinics PA 1, 10, 12 ‐114.03% ‐191.47% NR 2.57% 9.36% 0.00%
Brandywine 1, 5, 10 ‐11.85% ‐6.97% ‐7.51% 1.88% 34.39% 8.56%
Chester County ‐2.27% ‐2.25% 0.57% 2.88% 35.56% 6.57%
Crozer Chester 5, 7 ‐1.55% ‐1.55% 0.22% 3.24% 35.80% 22.65%
Delaware County Memorial 5, 7 ‐1.06% ‐1.06% ‐1.76% 3.98% 41.43% 17.57%
Doylestown 2.03% 5.37% 3.54% 0.57% 44.87% 2.60%
Einstein Montgomery 3 ‐8.01% ‐6.90% NA 2.00% 41.42% 10.91%
Grand View 5, 7 3.29% 8.72% 7.02% 2.56% 47.38% 3.15%
Holy Redeemer 5 2.07% 8.76% 4.79% 1.02% 47.11% 8.06%
Jennersville Regional 1, 10 ‐6.06% ‐4.12% ‐1.79% 2.35% 35.73% 9.32%
Lansdale 5 4.57% 4.57% 4.18% 1.58% 50.95% 3.84%
Lower Bucks 1, 3, 5, 10 ‐10.56% ‐10.34% NR 7.41% 31.98% 12.36%
Main Line Bryn Mawr 5 11.20% 13.02% 14.46% 1.48% 37.01% 1.54%
Main Line Lankenau 5 7.90% 10.90% 12.98% 1.21% 38.88% 4.87%
Main Line Paoli 18.24% 19.06% 19.91% 2.54% 31.16% 1.14%
Mercy Fitzgerald 5 2.19% 1.44% 1.36% 3.66% 42.57% 27.07%
Mercy Suburban 5, 6 ‐8.85% ‐42.45% ‐15.41% 3.39% 41.89% 16.79%
Phoenixville 1, 5, 7, 10 6.95% 4.05% 4.54% 1.37% 38.69% 6.46%
Physicians Care 1, 10 20.61% 20.61% 7.12% 0.39% 37.96% 0.14%
Pottstown Memorial 1, 5, 10 20.15% 13.84% 14.05% 1.56% 31.58% 9.37%
Riddle Memorial 5 3.25% 6.00% 3.80% 1.99% 47.13% 0.64%
Rothman Ortho Specialty 1, 10 30.13% 30.13% 25.39% 0.55% 16.98% 0.00%
St Luke's Quakertown 5 7.54% 7.49% 7.23% 3.82% 42.48% 6.40%
St Mary MC 5 12.38% 15.28% 13.05% 2.82% 30.84% 1.82%
See footnotes on page 11.
Page 26
INDIVIDUAL HOSPITAL DATA
Financial Analysis 2014 • Volume One
24
Hospital
Net Patient Revenue (NPR) (millions)
3‐yr Avg Change in
NPR FY11‐14
Total Operating Expenses (TOE) (millions)
3‐yr Avg Change in
TOE FY11‐14 FY14 FY13 FY12 FY11 FY14 FY13 FY12 FY11
Region 9 Average $501 $509 $495 $488 0.94% $521 $526 $510 $504 1.07%
Albert Einstein 5, 7 $538 $559 $554 $574 ‐2.11% $592 $613 $612 $609 ‐0.97%
Aria Health 5 $380 $415 $402 $412 ‐2.63% $429 $408 $389 $393 3.06%
Chestnut Hill 1, 10 $102 $99 $97 $89 4.67% $109 $103 $101 $95 4.78%
Children's Hosp Phila 5, 7 $1,503 $1,395 $1,290 $1,239 7.12% $1,614 $1,546 $1,455 $1,431 4.27%
Eastern Regional 10 $459 $415 $372 $355 9.82% $462 $410 $365 $348 10.90%
Hahnemann University 1, 5, 10 $385 $416 $442 $412 ‐2.22% $483 $474 $470 $467 1.16%
Hospital Fox Chase Cancer $247 $245 $244 NR NR $223 $216 $225 NR NR
Hospital University PA 5 $2,241 $2,109 $2,007 $1,982 4.36% $2,087 $2,025 $1,944 $1,902 3.25%
Jeanes $137 $139 $148 $148 ‐2.29% $154 $159 $164 $166 ‐2.35%
Mercy Philadelphia 5 $128 $134 $137 $158 ‐6.28% $131 $138 $138 $164 ‐6.60%
Nazareth 5 $141 $142 $144 $166 ‐5.05% $145 $148 $145 $166 ‐4.32%
Penn Presbyterian 5 $513 $489 $480 $507 0.42% $534 $530 $521 $539 ‐0.26%
Pennsylvania 5 $478 $439 $453 $471 0.49% $529 $488 $471 $486 2.94%
Roxborough Memorial 1, 3, 5, 10 $59 $45 $61 $62 NA $69 $52 $69 $69 NA
Shriners Children Phila 1 $14 $13 $19 $2 198.73% $50 $48 $46 $41 7.16%
St Christopher's Children 1, 10 $313 $316 $308 $271 5.27% $327 $314 $281 $269 7.12%
St Joseph's Philadelphia 5, 9 $97 $99 $95 $80 7.26% $101 $104 $99 $82 8.00%
Temple University 5 $856 $808 $773 $785 3.02% $837 $813 $786 $787 2.13%
Thomas Jefferson Univ 5 $1,421 $1,390 $1,378 $1,341 1.99% $1,502 $1,414 $1,407 $1,376 3.04%
Wills Eye 4 $15 NA NA NA NA $32 NA NA NA NA
See footnotes on page 11.
Page 27
INDIVIDUAL HOSPITAL DATA
Financial Analysis 2014 • Volume One
25
Hospital Operating Margin FY14
Total Margin FY14
3‐yr Avg Total Margin
FY12‐FY14
Percent of Uncompensated
Care FY14
Medicare Share of NPR FY14
Medical Assistance
Share of NPR FY14
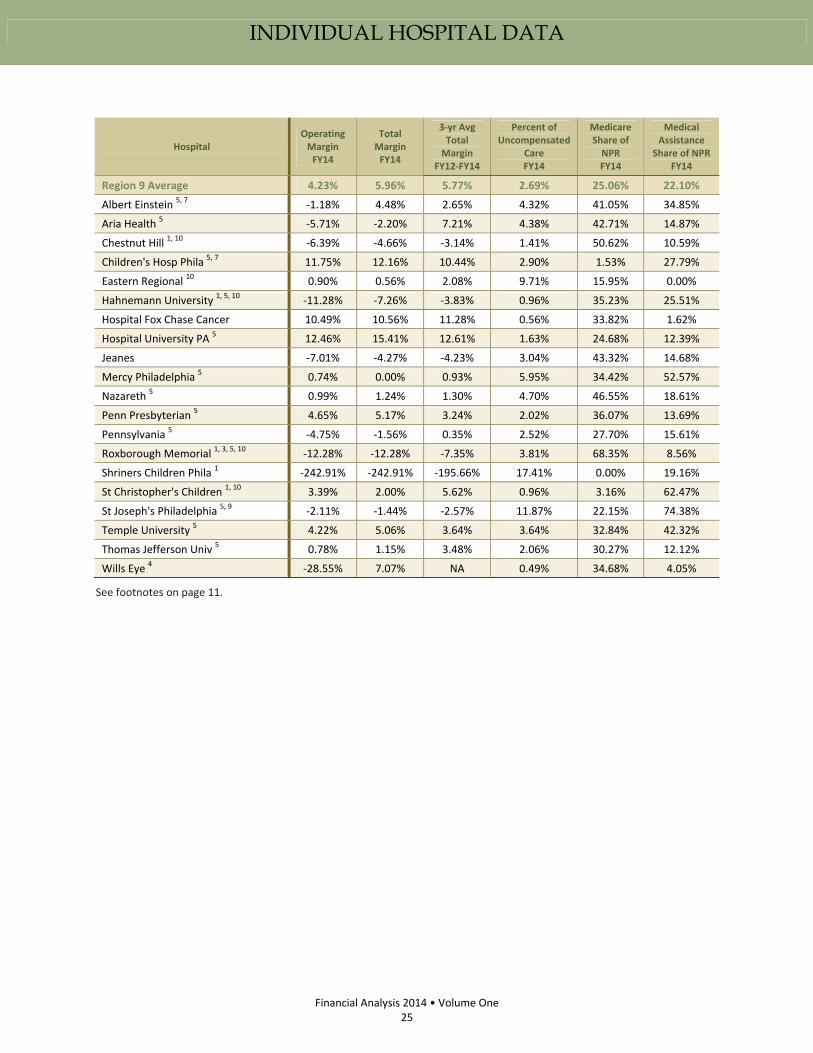
Region 9 Average 4.23% 5.96% 5.77% 2.69% 25.06% 22.10%
Albert Einstein 5, 7 ‐1.18% 4.48% 2.65% 4.32% 41.05% 34.85%
Aria Health 5 ‐5.71% ‐2.20% 7.21% 4.38% 42.71% 14.87%
Chestnut Hill 1, 10 ‐6.39% ‐4.66% ‐3.14% 1.41% 50.62% 10.59%
Children's Hosp Phila 5, 7 11.75% 12.16% 10.44% 2.90% 1.53% 27.79%
Eastern Regional 10 0.90% 0.56% 2.08% 9.71% 15.95% 0.00%
Hahnemann University 1, 5, 10 ‐11.28% ‐7.26% ‐3.83% 0.96% 35.23% 25.51%
Hospital Fox Chase Cancer 10.49% 10.56% 11.28% 0.56% 33.82% 1.62%
Hospital University PA 5 12.46% 15.41% 12.61% 1.63% 24.68% 12.39%
Jeanes ‐7.01% ‐4.27% ‐4.23% 3.04% 43.32% 14.68%
Mercy Philadelphia 5 0.74% 0.00% 0.93% 5.95% 34.42% 52.57%
Nazareth 5 0.99% 1.24% 1.30% 4.70% 46.55% 18.61%
Penn Presbyterian 5 4.65% 5.17% 3.24% 2.02% 36.07% 13.69%
Pennsylvania 5 ‐4.75% ‐1.56% 0.35% 2.52% 27.70% 15.61%
Roxborough Memorial 1, 3, 5, 10 ‐12.28% ‐12.28% ‐7.35% 3.81% 68.35% 8.56%
Shriners Children Phila 1 ‐242.91% ‐242.91% ‐195.66% 17.41% 0.00% 19.16%
St Christopher's Children 1, 10 3.39% 2.00% 5.62% 0.96% 3.16% 62.47%
St Joseph's Philadelphia 5, 9 ‐2.11% ‐1.44% ‐2.57% 11.87% 22.15% 74.38%
Temple University 5 4.22% 5.06% 3.64% 3.64% 32.84% 42.32%
Thomas Jefferson Univ 5 0.78% 1.15% 3.48% 2.06% 30.27% 12.12%
Wills Eye 4 ‐28.55% 7.07% NA 0.49% 34.68% 4.05%
See footnotes on page 11.
Page 28
EXPLANATION OF TERMS & MEASURES
Financial Analysis 2014 • Volume One
26
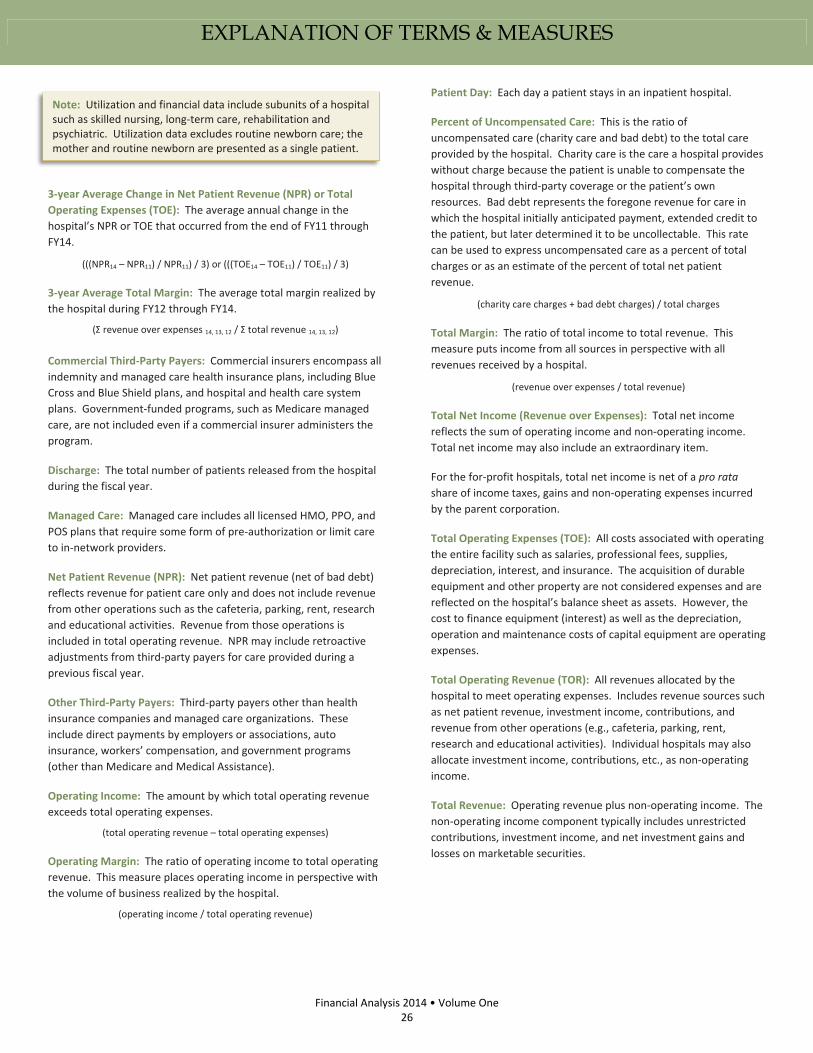
3‐year Average Change in Net Patient Revenue (NPR) or Total
Operating Expenses (TOE): The average annual change in the
hospital’s NPR or TOE that occurred from the end of FY11 through
FY14.
(((NPR14 – NPR11) / NPR11) / 3) or (((TOE14 – TOE11) / TOE11) / 3)
3‐year Average Total Margin: The average total margin realized by
the hospital during FY12 through FY14.
(Σ revenue over expenses 14, 13, 12 / Σ total revenue 14, 13, 12)
Commercial Third‐Party Payers: Commercial insurers encompass all
indemnity and managed care health insurance plans, including Blue
Cross and Blue Shield plans, and hospital and health care system
plans. Government‐funded programs, such as Medicare managed
care, are not included even if a commercial insurer administers the
program.
Discharge: The total number of patients released from the hospital
during the fiscal year.
Managed Care: Managed care includes all licensed HMO, PPO, and
POS plans that require some form of pre‐authorization or limit care
to in‐network providers.
Net Patient Revenue (NPR): Net patient revenue (net of bad debt)
reflects revenue for patient care only and does not include revenue
from other operations such as the cafeteria, parking, rent, research
and educational activities. Revenue from those operations is
included in total operating revenue. NPR may include retroactive
adjustments from third‐party payers for care provided during a
previous fiscal year.
Other Third‐Party Payers: Third‐party payers other than health
insurance companies and managed care organizations. These
include direct payments by employers or associations, auto
insurance, workers’ compensation, and government programs
(other than Medicare and Medical Assistance).
Operating Income: The amount by which total operating revenue
exceeds total operating expenses.
(total operating revenue – total operating expenses)
Operating Margin: The ratio of operating income to total operating
revenue. This measure places operating income in perspective with
the volume of business realized by the hospital.
(operating income / total operating revenue)
Patient Day: Each day a patient stays in an inpatient hospital.
Percent of Uncompensated Care: This is the ratio of
uncompensated care (charity care and bad debt) to the total care
provided by the hospital. Charity care is the care a hospital provides
without charge because the patient is unable to compensate the
hospital through third‐party coverage or the patient’s own
resources. Bad debt represents the foregone revenue for care in
which the hospital initially anticipated payment, extended credit to
the patient, but later determined it to be uncollectable. This rate
can be used to express uncompensated care as a percent of total
charges or as an estimate of the percent of total net patient
revenue.
(charity care charges + bad debt charges) / total charges
Total Margin: The ratio of total income to total revenue. This
measure puts income from all sources in perspective with all
revenues received by a hospital.
(revenue over expenses / total revenue)
Total Net Income (Revenue over Expenses): Total net income
reflects the sum of operating income and non‐operating income.
Total net income may also include an extraordinary item.
For the for‐profit hospitals, total net income is net of a pro rata
share of income taxes, gains and non‐operating expenses incurred
by the parent corporation.
Total Operating Expenses (TOE): All costs associated with operating
the entire facility such as salaries, professional fees, supplies,
depreciation, interest, and insurance. The acquisition of durable
equipment and other property are not considered expenses and are
reflected on the hospital’s balance sheet as assets. However, the
cost to finance equipment (interest) as well as the depreciation,
operation and maintenance costs of capital equipment are operating
expenses.
Total Operating Revenue (TOR): All revenues allocated by the
hospital to meet operating expenses. Includes revenue sources such
as net patient revenue, investment income, contributions, and
revenue from other operations (e.g., cafeteria, parking, rent,
research and educational activities). Individual hospitals may also
allocate investment income, contributions, etc., as non‐operating
income.
Total Revenue: Operating revenue plus non‐operating income. The
non‐operating income component typically includes unrestricted
contributions, investment income, and net investment gains and
losses on marketable securities.
Note: Utilization and financial data include subunits of a hospital such as skilled nursing, long‐term care, rehabilitation and psychiatric. Utilization data excludes routine newborn care; the mother and routine newborn are presented as a single patient.
Page 29
Financial Analysis 2014 • Volume One
27
Hospitals with a December 31st Fiscal Year End Non-Compliant Hospitals
Advanced Surgical Hospital
No Submission
The following hospital was not in compliance with
PHC4’s filing requirements and is not included in this
report.
• Westfield Hospital (closed 12/2013)
Partial Submission
The following hospital was not in compliance with one
or more of PHC4’s filing requirements.
• Barix Clinics of Pennsylvania, LLC
Allegheny General Hospital
Allegheny Valley Hospital
Barix Clinics of Pennsylvania, LLC
Berwick Hospital Center
Bradford Regional Medical Center
Brandywine Hospital
Canonsburg Hospital
Carlisle Regional Medical Center
Chestnut Hill Hospital
Coordinated Health Orthopedic Hospital, LLC
Easton Hospital
Edgewood Surgical Hospital
Endless Mountains Health Systems
Forbes Hospital
Hahnemann University Hospital
Heart of Lancaster Regional Medical Center
Jefferson Hospital
Jennersville Regional Hospital
Lancaster Regional Medical Center
Lock Haven Hospital
Lower Bucks Hospital
Memorial Hospital /York
Mid‐Valley Hospital
Moses Taylor Hospital
OSS Orthopaedic Hospital, LLC
Phoenixville Hospital
Physicians Care Surgical Hospital, LP
Pottstown Memorial Medical Center
Regional Hospital of Scranton
Rothman Orthopaedic Specialty Hospital, LLC
Roxborough Memorial Hospital
Shriners Hospitals for Children/Philadelphia
St. Christopher's Hospital for Children
Sunbury Community Hospital
Surgical Institute of Reading
Surgical Specialty Center at Coordinated Health
Tyler Memorial Hospital
West Penn Hospital
Westfield Hospital
Wilkes‐Barre General Hospital
Page 30
Pennsylvania Health Care Cost Containment Council
Joe Martin, Executive Director
225 Market Street, Suite 400, Harrisburg, PA 17101
Phone: 717‐232‐6787 • Fax: 717‐232‐3821
www.phc4.org
For More Information
The information contained in this report and other PHC4 publications is available
online at www.phc4.org. Additional financial, hospitalization and ambulatory
procedure health care data is available for purchase. For more information,
contact PHC4’s Special Requests at [email protected] or 717‐232‐6787.