120
S tate H ighway S ystem Management P lan FINAL 2017 California Department of Transportation

State Highway System Management Plan
FINAL
2017
California Department of Transportation
June 26, 2017
Prepared byCalifornia Department of Transportationin accordance with Streets and Highways Code 164.6
Table of Contents EXECUTIVE SUMMARY .................................................................................................................... 1
INTRODUCTION .................................................................................................................................. 5
STATE HIGHWAY SYSTEM MANAGEMENT PLAN ORGANIZATION ...................................... 7
CALIFORNIA STATE HIGHWAY SYSTEM...................................................................................... 8
ASSET MANAGEMENT STRUCTURE ............................................................................................ 10
STATE HIGHWAY SYSTEM FUNDING TRENDS ......................................................................... 13
NEEDS ASSESSMENT ....................................................................................................................... 16
Maintenance Needs ....................................................................................................................... 17
State Highway Operation and Protection Program (SHOPP) Needs ............................................ 17
Operational Improvement Needs .................................................................................................. 20
TEN-YEAR INVESTMENT PLAN..................................................................................................... 21
Maintenance Investment Plan ........................................................................................................... 21
SHOPP Investment Plan ................................................................................................................... 23
PERFORMANCE OUTCOMES .......................................................................................................... 25
PROGRAM DEFINITIONS ................................................................................................................. 27
Safety ................................................................................................................................................ 27
Bridge Rail Replacement and Upgrade......................................................................................... 27
Safety Improvements and Collision Severity Reduction .............................................................. 28
Roadside Safety Improvements .................................................................................................... 29
Stewardship ....................................................................................................................................... 30
Bridge Health ................................................................................................................................ 30
Drainage System Restoration ........................................................................................................ 32
Lighting Rehabilitation ................................................................................................................. 35
Major Damage (Emergency Opening) .......................................................................................... 35
Major Damage (Permanent Restoration) ...................................................................................... 36
Overhead Sign Structure Rehabilitation ....................................................................................... 37
Pavement ....................................................................................................................................... 38
Relinquishments ............................................................................................................................ 41
Roadway Protective Betterments .................................................................................................. 42
Safety Roadside Rest Area Rehabilitation .................................................................................... 43
Transportation Related Facilities .................................................................................................. 44
Water and Wastewater Treatment at SRRAs ................................................................................ 45
Sustainability..................................................................................................................................... 46

Americans with Disabilities Act Pedestrian Infrastructure .......................................................... 46
Advance Mitigation ...................................................................................................................... 47
Bridge Scour Mitigation ............................................................................................................... 48
Bridge Seismic Restoration .......................................................................................................... 49
Hazardous Waste Mitigation ........................................................................................................ 50
Roadside Rehabilitation ............................................................................................................... 51
Storm Water Mitigation ............................................................................................................... 52
Zero Emission Vehicle Infrastructure .......................................................................................... 53
Complete Streets and Climate Change ......................................................................................... 54
Commercial Vehicle Enforcement Facilities ............................................................................... 56
Operational Improvements ........................................................................................................... 57
Sign Panel Replacement ............................................................................................................... 57
Transportation Management Systems .......................................................................................... 58
Bridge Goods Movement Upgrades ............................................................................................. 59
Weigh-In-Motion Scales .............................................................................................................. 60
Freight .......................................................................................................................................... 61
Organizational Excellence ............................................................................................................... 63
INTEGRATED ASSET CLASS SUMMARY .................................................................................... 64
COST EFFECTIVENESS STRATEGIES ........................................................................................... 69
Cost Effectiveness ............................................................................................................................ 69
Maintenance Program Budget .......................................................................................................... 71
Highway Maintenance Projects.................................................................................................... 71
Maintenance Program Budget Allocation Tool (State Forces) .................................................... 71
CONCLUSION .................................................................................................................................... 72
APPENDIX A: STATUTORY REQUIREMENTS ............................................................................ 74
APPENDIX B: PERFORMANCE MANAGEMENT SUMMARY SHEETS ................................... 77
APPENDIX C: GLOSSARY ............................................................................................................... 79

2017 State Highway System Management Plan 1
EXECUTIVE SUMMARY The 2017 State Highway System Management Plan (SHSMP) is a new integrated management plan that fulfills the Streets and Highway Code section 164.6 requirements for the State Highway Operation and Protection Program (SHOPP) Ten-Year Plan and the Five-Year Maintenance Plan.
The SHSMP integrates the maintenance, rehabilitation and operation into a single management plan that implements a number of key federal asset management requirements. The SHSMP organizes key activity areas into categories that align with the California Department of Transportation (Caltrans) Strategic Management Plan. The SHSMP introduces new national performance measures for pavement and bridges as required by federal law, presents performance targets approved under provisions of California Senate Bill 486, implements the results of the Automated Pavement Condition Survey (APCS) and pavement management system in a plan that has unprecedented transparency.
The Plan fundamentally changes the way Caltrans manages available funding by focusing on measured condition and performance objectives. The historic asset-based funding approach has been replaced by a performance based approach that provides greater local flexibility to achieve multiple objectives within a single project. The new management methodology allows Caltrans to better integrate multimodal transportation options into traditional rehabilitation work to provide a cost-effective way to expand mode choice and reduce transportation related emissions.
The SHSMP includes a Needs Assessment to achieve the established performance targets and an Investment Plan that will guide the management of the State Highway System (SHS) and related infrastructure.
With the recent passage of Senate Bill 1 (The Road Repair and Accountability Act of 2017), additional funding has been made available for transportation investments across the state, including maintenance and repair of highways, local roads, bridges, and transit systems, and to strategically address the most congested corridors for commuters and freight. These much needed funds will provide over $18 billion in the next decade specifically for the maintenance and repair of the state highway system. SB 1 directs Caltrans to focus new highway repair revenue on four primary highway asset classes; pavement, bridges, culverts and transportation management system projects.
The following table highlights expected accomplishments for the four major asset classes with the addition of SB 1 investments. This table shows the combined performance from the Maintenance and SHOPP programs. Assets in good condition show the quantity of preventive maintenance treatments that can be applied, fair condition assets show a range of corrective maintenance to minor rehabilitation that can be carried out in the Maintenance Program or SHOPP, and the poor asset category reflect rehabilitation or replacement quantities possible with available funding. Quantities have been rounded for presentation.

2017 State Highway System Management Plan 2
Table 1. Estimated Ten-Year Performance Accomplishments
Asset Class Good Condition
(Preventive Maintenance) Fair Condition
(Maintenance and SHOPP) Poor Condition
(Rehab or Replacement) Pavement 17,000 Lane Miles 16,000 Lane Miles 10,500 Lane Miles Bridges 31 million Square Feet 44 million Square Feet 8.5 million Square Feet Culverts N/A 148,000 Linear Feet 1.1 million Linear Feet Transportation Management Systems (TMS)
524,000 Maintenance checks/repairs
N/A 10,900 Replacements 2,000 New Elements
With the augmented funding from Senate Bill 1, the accomplishments possible over the next ten years will achieve the performance targets established by the California Transportation Commission for the four primary asset classes. Other supplementary assets on the SHS will continue to be funded at levels below the identified needs. The following table provides the projected condition for the four asset classes at the end of the Plan period.
Table 2. End of Plan Condition Estimates
Asset Class Projected End of Plan Condition Relative to Current
Pavement The passage of Senate Bill 1 will augment existing funding to provide the resources necessary to achieve the performance goal of 98% of the pavement in good or fair condition by 2027.
Bridges
The passage of Senate Bill 1 will augment existing funding to provide the resources necessary to achieve the performance goal of 98.5% of the bridge deck area in good or fair condition by 2027. This funding will result in 500 bridges being fixed over the next 10 years.
Culverts The passage of Senate Bill 1 will augment existing funding to provide the resources necessary to achieve the performance goal of 90% of culverts in good or fair condition by 2027.
Transportation Management Systems (TMS)
The passage of Senate Bill 1 will augment existing funding to provide the resources necessary to achieve the performance goal of 90% of the TMS elements in good condition by 2027. Funding will provide for an additional 2,000 elements to be added to the system to improve operations over the 10 year period.
The Needs Assessment is a comprehensive aggregation of numerous analyses that fully defines our existing inventory or deficiencies, conditions and performance targets, presents existing pipeline of work, a gap analysis and cost estimate to close the gap. Collectively these steps are referred to as Performance Management and are a requirement of our Transportation Asset Management Plan (TAMP) under federal regulations. The ten-year Needs Assessment identified a total need to maintain the existing system as shown in the following table. Due to SB 1, available funding increases from $30.5 billion to $48.8 billion in this ten-year period.
2017 State Highway System Management Plan 3
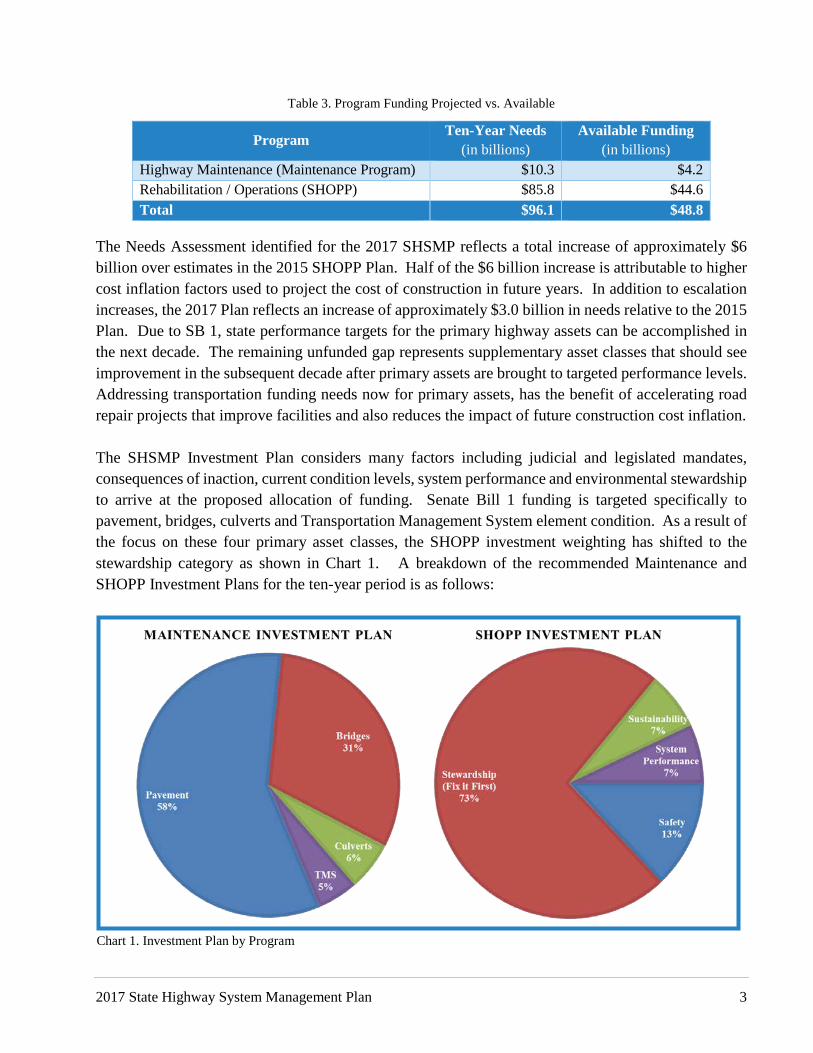
Table 3. Program Funding Projected vs. Available
Program Ten-Year Needs
(in billions) Available Funding
(in billions) Highway Maintenance (Maintenance Program) $10.3 $4.2 Rehabilitation / Operations (SHOPP) $85.8 $44.6 Total $96.1 $48.8
The Needs Assessment identified for the 2017 SHSMP reflects a total increase of approximately $6 billion over estimates in the 2015 SHOPP Plan. Half of the $6 billion increase is attributable to higher cost inflation factors used to project the cost of construction in future years. In addition to escalation increases, the 2017 Plan reflects an increase of approximately $3.0 billion in needs relative to the 2015 Plan. Due to SB 1, state performance targets for the primary highway assets can be accomplished in the next decade. The remaining unfunded gap represents supplementary asset classes that should see improvement in the subsequent decade after primary assets are brought to targeted performance levels. Addressing transportation funding needs now for primary assets, has the benefit of accelerating road repair projects that improve facilities and also reduces the impact of future construction cost inflation. The SHSMP Investment Plan considers many factors including judicial and legislated mandates, consequences of inaction, current condition levels, system performance and environmental stewardship to arrive at the proposed allocation of funding. Senate Bill 1 funding is targeted specifically to pavement, bridges, culverts and Transportation Management System element condition. As a result of the focus on these four primary asset classes, the SHOPP investment weighting has shifted to the stewardship category as shown in Chart 1. A breakdown of the recommended Maintenance and SHOPP Investment Plans for the ten-year period is as follows:
Chart 1. Investment Plan by Program

2017 State Highway System Management Plan 4
With the available funding and anticipated deterioration over the next ten years, Caltrans expects to be able to complete maintenance and rehabilitation work as shown in the Performance Outcomes section of this plan. The SHSMP brings together many changes that collectively are designed to improve the management of the system, squarely focus activities on performance in alignment with our Strategic Management Plan and provide structural changes and transparency that improve asset management of the SHS.

2017 State Highway System Management Plan 5
INTRODUCTION The 2017 State Highway System Management Plan (SHSMP) is a new integrated management plan that encompasses the Streets and Highway Code section 164.6 requirements for the State Highway Operation and Protection Program (SHOPP) Ten-Year Plan and the Five-Year Maintenance Plan. The Streets and Highway Code requires California Department of Transportation (Caltrans) to prepare an update to this Plan every two years. The SHSMP includes both a Needs Assessment and Investment Plan that will guide the management of the State Highway System (SHS) and related infrastructure. The SHSMP includes a number of significant changes that are part of the overall implementation of asset management in California. The SHSMP reorganizes key activity areas into categories that fully align with the Caltrans Strategic Management Plan. The new structure provides greater clarity on the specific strategic goals Caltrans is working to accomplish, along with more transparency of the level of needs and investments in each of the strategic areas. Another major change is the integration of the investments made through the SHOPP and Maintenance Programs for pavements, bridges, culverts and transportation management system (TMS) elements. These four asset classes represent a significant portion of the SHS maintenance and rehabilitation investments in California and were designated as focus areas by the California Transportation Commission (Commission) as part of the ongoing implementation of asset management. The integrated presentation provides a clear understanding of how these funding programs work together to a continuum of management of the assets throughout their life cycle. The SHSMP implements a number of key requirements of the Moving Ahead for Progress in the 21st Century (MAP-21) and Fixing America’s Surface Transportation (FAST) Act for asset management. This Plan implements the federal requirements for performance management required for all states. The principles of performance management are applied at the asset level to develop the total need for the asset subject to defined performance targets. The total needs are reflective of both SHOPP and Maintenance Program contributions to the condition or performance of the assets. Along with the performance management implementation, the SHSMP implements new national performance measures for pavements and bridges. Under requirements of MAP-21, all states are required to adopt national asset management performance measures to establish nationwide consistency for condition reporting of these major highway assets. The new performance measures utilize a good, fair, and poor scale that reports the area of these assets in each category. To comply with new federal requirements, Caltrans is required to assess the condition of the pavements and bridges in a new way. These new condition assessment requirements have been incorporated by utilizing the Automated Pavement Condition Survey (APCS) for pavements and Element Level Inspection data for bridges.

2017 State Highway System Management Plan 6
The SHSMP provides unprecedented transparency in the presentation of the current conditions and performance of the system, project stream, deterioration rates, repair costs, and targets used to develop the Needs Assessment. The Investment Plan clearly presents where available funds are being invested and the expected condition and Performance Outcomes from those investments. The new SHSMP is more than a new title and look. The Plan is implementing fundamental changes in the way Caltrans manages the available funding by placing the focus on measured condition and performance objectives. The historic silo-based funding approach has been replaced by a performance-based approach that provides greater local flexibility to combine multiple objectives together into a single project. Under the provisions of the new Plan, performance and funding targets are being provided to each Caltrans district which is empowered to combine performance accomplishments together in projects that are cost-effective, less disruptive and better aligned with local partners work. The new management methodology allows Caltrans to better integrate multimodal transportation options into traditional rehabilitation work to provide a cost-effective way to expand mode choice and reduce transportation related emissions.

2017 State Highway System Management Plan 7
STATE HIGHWAY SYSTEM MANAGEMENT PLAN ORGANIZATION The State Highway System Management Plan (SHSMP) is organized into five primary sections: System Definition, Asset Management Structure and Funding Trends Needs Assessment Ten-Year Investment Plan Performance Outcomes Appendices
The initial chapters focus on defining the State Highway System (SHS), explaining the asset management structure used to manage the SHS and describing the sources and trends of highway funding in California. All of these items are statewide in nature and are relevant to all funding programs that maintain or rehabilitate the SHS. The Needs Assessment presents the total needs of the existing SHS resulting from a performance management analysis conducted for this Plan. This performance management analysis estimates the costs necessary to close all condition and performance gaps. The Needs Assessment is not constrained by funding currently available for the management of the SHS. The Investment Plan section defines how the available funding is recommended to be allocated. With funding constraints, particularly in the State Highway Operation and Protection Program (SHOPP), tough decisions must be made to prioritize where available resources should be focused to keep highways functioning. Based on the Investment Plan, the Performance Outcomes are presented for each of the funding programs. This section defines what specific performance metrics are estimated to be achieved given the defined investment plan. The SHSMP Appendices include the details of the performance management analysis and a listing of statutory requirements that have influence on the SHSMP.

2017 State Highway System Management Plan 8
CALIFORNIA STATE HIGHWAY SYSTEM The transportation system assets that comprise the SHS include nearly 50,000 lane miles of pavement, 13,160 bridges, 205,000 culverts and drainage facilities, 86 safety roadside rest areas (SRRA), and 30,000 acres of landscaped roadside among others. The vast extent of this transportation system is illustrated in Figure 1. Additional support facilities, such as maintenance stations, equipment shops, and transportation materials laboratories and testing facilities are also included as assets of the SHS. Many of the components of this system were built in 1950s, 1960s, and early 1970s and has reached or is reaching the end of their service lives. Asset deterioration is accelerating at a faster rate than in previous decades due to age and traffic demands, often requiring extensive rehabilitation and even full reconstruction.
Figure 1. California State Highway System

2017 State Highway System Management Plan 9
Under California statutes, Caltrans is the state agency responsible for planning, developing, maintaining and operating the legislatively designated SHS and a variety of supporting infrastructure such as but not limited to highway maintenance stations, SRRAs and drainage facilities. Similarly, various state highway funding and project approval responsibilities are assigned to the California Transportation Commission (Commission). Together, and working in partnership with a wide variety of local, regional and federal transportation and oversight agencies and with the private sector, Caltrans and the Commission are transitioning highway system preservation activities and projects to a robust asset management approach as required by Senate Bill 486 (2015). This approach also directly responds to federal requirements to implement asset management.

2017 State Highway System Management Plan 10
ASSET MANAGEMENT STRUCTURE Caltrans strives to preserve the condition of the SHS in the most economical means possible through carefully planned preservation strategies (preventive maintenance strategies, corrective maintenance strategies, and minor rehabilitation) and rehabilitation or replacement when necessary. Caltrans manages the condition of the SHS by performing the right treatment at the right time through a three-pronged approach: (1) field maintenance, (2) Highway Maintenance (HM) projects and (3) SHOPP projects. Each of the following approaches play key roles in the overall management and preservation of the system:
1. Field maintenance activities are the day-to-day demands that Caltrans maintenance staff must regularly react to. Maintenance strategies are important tools for extending the service life of assets in a cost-effective manner. Preventive maintenance is applied to assets in good condition and some fair condition assets when appropriate, with the goal of maintaining their condition. Local crews address minor maintenance, repairs, and preservation work. This typically includes pothole repair, crack sealing, cleaning of drains, servicing lighting and signs, structural painting, minor facility repairs, irrigation repairs and more. Crews also provide rapid response to repair minor accident damage. These field activities are the first line of defense in Caltrans’ maintenance of the SHS, and are reactionary in nature. Caltrans employs maintenance crews that collectively perform many aspects of ongoing maintenance of the highways and assets within the SHS. For example, as shown in Chart 2, every dollar spent on preventive maintenance delays the need for an equivalent $3 in rehabilitation or $8 in reconstruction or replacement of pavement in the future.
2. HM projects help further prolong the life of existing infrastructure. These projects include preventive and corrective maintenance work that exceeds the scope of what our crews can handle. Corrective maintenance typically applies to assets in fair condition; however, can also be applied to some assets in poor condition in some cases, with the goal of restoration to good condition. Asset deterioration can accelerate the longer the asset is in fair condition. A timely application of corrective maintenance can avoid more costly treatments later. The Maintenance Division utilizes contractors and service providers to execute work designed to extend the life of physical assets and delay rehabilitation or replacement of assets. HM projects are contract work routinely performed on pavements, bridges, culverts, facilities, traffic management systems and more. HM Projects may be preventive or corrective in nature. Examples include thin pavement overlays, bridge joint seals, and culvert repairs. These projects repair, but do not upgrade or replace the facilities. The Major Maintenance Program invests over $330 million annually, through HM projects, to extend the life of physical assets through timely repair and preservation activities.
3. When field maintenance and more extensive HM project activities are no longer cost-effective or viable, asset rehabilitation or replacement is considered. Rehabilitation or replacement typically applies to assets in both fair and poor condition and is typically funded through the

2017 State Highway System Management Plan 11
SHOPP. SHOPP projects are more complex capital construction projects that utilize private construction contractors through a competitive bidding process. These projects are overhauls of infrastructure that is nearing the end of its lifespan, and may involve complex upgrades. These projects may involve extensive planning and design, environmental permitting and even right-of-way acquisition. Rehabilitation and replacement activities are performed on pavements, bridges, culverts, buildings, overhead signs, lights, roadside elements and safety roadside rest areas. In addition to managing the condition of the physical infrastructure, Caltrans invests in safety improvements, operational improvements, environmental mitigation, transportation management systems, freight improvements and system resiliency activities. The SHOPP invests available funds to implement safety improvements, rehabilitate or replace physical assets, improve the operation of the highways, improve the system resiliency and mitigate transportation related environmental impacts. The SHOPP includes 34 specific focus areas that are individually described in the Needs Assessment. The Commission has direct responsibility to adopt the projects that constitute the SHOPP and to approve all scope, schedule and costs changes to the adopted projects. Further, the Commission has responsibility to set asset performance targets that help ensure the investments made through the SHOPP are achieving the desired statewide transportation outcomes.
Utilizing this three-pronged approach to asset preservation, Caltrans crews are able to make timely repairs on minor needs before they grow into major and more expensive problems to fix, contract for highway maintenance activities at the right time to extend the useful life of the assets at the lowest
Chart 2. Graphical Representation of Benefits of Preventive Maintenance

2017 State Highway System Management Plan 12
possible long-term cost and delay future rehabilitation or replacement activities, and to then invest in major asset rehabilitation or replacement projects when the useful life of an asset has been reached. Beyond the asset management objective of taking care of the existing SHS assets, there are additional SHS needs for upgrading and expanding facilities to accommodate increased freight movement, broader economic growth, population increases, new transportation technologies and evolving land use patterns. These needs are beyond the scope of the funding provided through the Maintenance and SHOPP programs and are instead addressed through a variety of other funding programs such as the recently enacted Fixing America’s Surface Transportation (FAST) Act, the State Transportation Improvement Program (STIP), state transportation bond programs, local transportation tax measures and other funding programs. All of these programs invest in the SHS, as well as local roads, and sometimes address SHS preservation needs at the same time. As projects are developed and constructed through these other funding programs, it is essential that the project development process incorporate life cycle and asset management considerations so that when the SHS projects are completed and operational and come under the auspices of the Maintenance and SHOPP programs, the projects are designed to be as efficient and cost-effective as possible to maintain, preserve, and when the time comes, rehabilitate. A number of funding programs are utilized by Caltrans to manage the SHS assets. The largest funding program available is the SHOPP. The SHOPP (including the Road Maintenance and Rehabilitation Funds) invests approximately $4.4 billion annually to implement safety improvements, rehabilitate or replace physical assets, improve the operation of the highways, improve the system resiliency and mitigate transportation related environmental impacts. The SHOPP includes 34 specific focus areas that are individually described in this Plan. The Maintenance Program invests over $330 million annually, through HM projects, to extend the life of physical assets through timely repair and preservation activities. Caltrans employs maintenance crews that collectively perform many aspects of ongoing maintenance of the highways and assets within the SHS. Crew expenditures statewide are over $350 million annually for all activities including maintenance of the four asset classes. Each of the programs mentioned above play key roles and work together in the overall management of the SHS. Utilizing this three-pronged approach to asset preservation, Caltrans is able to make timely repairs at the right time to extend the useful life of the assets at the lowest possible long-term cost and delay future rehabilitation or replacement activities.
2017 State Highway System Management Plan 13
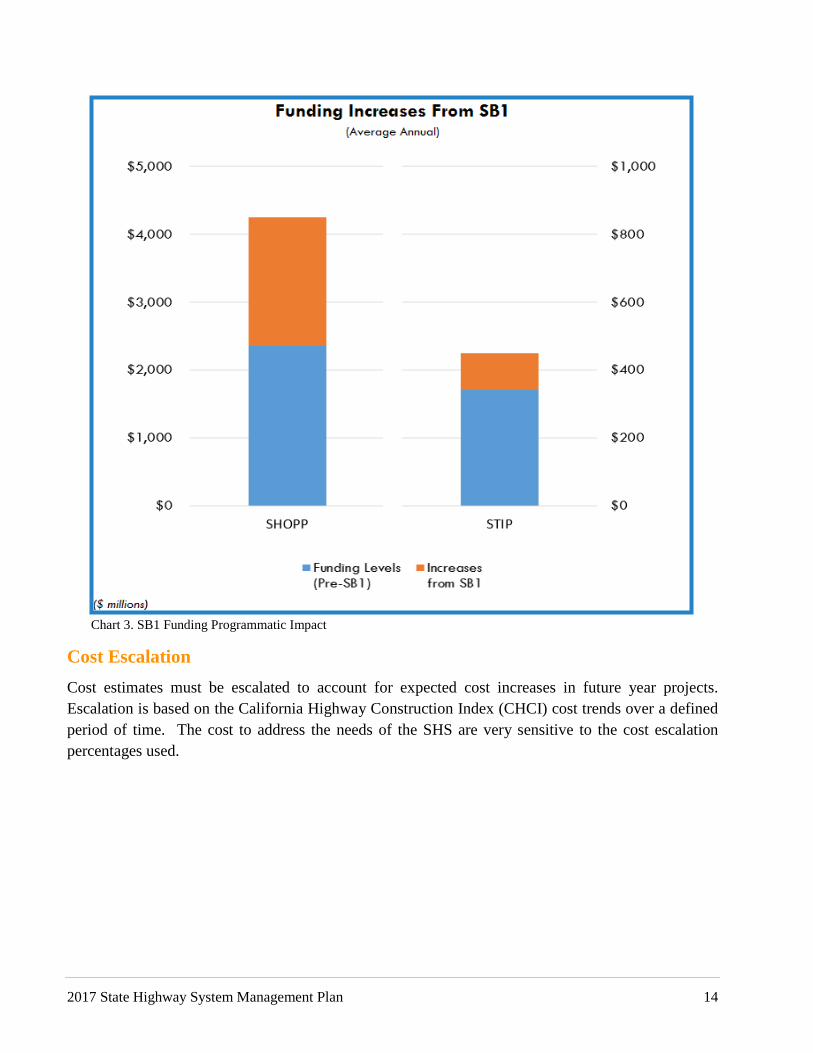
STATE HIGHWAY SYSTEM FUNDING TRENDS The Federal Highway Trust Fund (Trust Fund), the State Highway Account (SHA), and the newly created Road Maintenance and Rehabilitation Account (RMRA) established by SB 1 are the main funding sources for SHOPP. SHOPP federal funding is provided through the Federal Highway Administration from federal fuel taxes. Each state collects a federal excise tax of 18.4 cents per gallon of gasoline, and 24.4 cents per gallon of diesel fuel, and remits that revenue to the federal government for deposit into the Trust Fund. Funding is then provided to states for highway and mass transportation (transit) programs. The uses and distribution of these resources are outlined in federal transportation acts. In recent years, states’ needs for transportation revenue have begun to exceed the amount of money held in the Trust Fund, and as a result, the Trust Fund has had to rely on infusions of federal general fund revenue. Federal fuel taxes no longer provide sufficient revenue to meet federal funding obligations to the states. In addition to federal fuel taxes, both Maintenance and the SHOPP receive a portion of their funding from a state excise tax on gasoline, which is currently 18 cents per gallon. As a result of SB 1, the base excise tax will be increased by 12 cents per gallon beginning November 1, 2017. The resulting revenue increase will be deposited into the RMRA for use in the SHOPP. After allocations to other programs, and a $400 million set aside for bridges and culvert work, 50 percent of the remaining balance in the RMRA will be dedicated to Maintenance and the SHOPP. SB 1 also requires the base excise tax to be indexed to inflation using the California Consumer Price Index (CCPI), annually, beginning in July 2020. Over the next ten years, this change is expected to generate approximately $14 billion for the SHOPP and Maintenance. The SHOPP also receives a small allocation of funding from the price-based excise tax (PBET) on gasoline, which is currently 9.8 cents per gallon. The price-based portion of the excise tax is currently required by statute to be adjusted annually to maintain revenue neutrality with California’s former sales tax on gasoline. SB 1 will change the amount and how adjustments are made to the PBET beginning in fiscal year 2019-20. The PBET will be set at 17.3 cents per gallon effective July 1, 2019. In addition, beginning in 2020-21, the PBET will be indexed to inflation using the CCPI, and will no longer be recalculated by the Board of Equalization. This is expected to generate approximately $300 million for SHOPP over the next ten years. Both SHOPP and Maintenance currently receive a portion of the 16 cents per gallon excise tax on diesel fuel, which is adjusted annually as well. However, SB 1 will increase the diesel tax by 20 cents per gallon. This will translate into additional revenue for Maintenance and the SHOPP. As identified in the 2016 STIP Fund Estimate and funding outside of the fund estimate, projected annual funding for the SHOPP currently averages $2.6 billion per year. With the passage of SB 1, projected annual funding for the SHOPP is expected to be approximately $4.4 billion. Over the next decade, SB 1 is expected to increase revenue for SHOPP and Maintenance by over $18 billion.
2017 State Highway System Management Plan 14
Cost Escalation Cost estimates must be escalated to account for expected cost increases in future year projects. Escalation is based on the California Highway Construction Index (CHCI) cost trends over a defined period of time. The cost to address the needs of the SHS are very sensitive to the cost escalation percentages used.
Chart 3. SB1 Funding Programmatic Impact

2017 State Highway System Management Plan 15
Utilizing the Caltrans Highway Cost Index information shown in the chart below, one can develop the following escalation rates:
Table 4. Alternative Escalation Rates
Analysis Period Analysis Method Escalation Rate Escalated Total Need
(in billions) 10 Years Compounded 1% $76.6 20 Years Best Fit Curve 3% $85.8 20 Years Compounded 4.5% $93.5
The total needs vary by up to $17 billion depending on the escalation rate used for the calculation. The most recent fund estimate used a 4.5 percent escalation rate and the 2015 Ten-Year Plan used a 2 percent rate. Escalation is applied only to the future needs because the costs for programmed projects or projects in a formal planning work plan are already escalated. For the 2017 SHSMP, the escalation rate used is 3 percent. The “best fit curve” escalation calculation was selected as the most appropriate method because it is based on all previous data points over the past 20 years instead of just the first and last data points used for the compounded method. Costs are escalated to the mid-point of the escalated needs; 7.5 years into the ten-year plan period.
Chart 4. California Highway Construction Index Trend

2017 State Highway System Management Plan 16
NEEDS ASSESSMENT The California Streets and Highway Code requires the development of a SHS Needs Assessment that defines the program areas and costs associated with achieving defined condition and performance targets. The Needs Assessment is intended to provide a picture of the total needs of the SHS and is not constrained by currently available funding. The majority of the needs on the SHS are determined through a gap analysis completed as part of the implementation of performance management. The performance management approach captures all of the needs associated with fair and poor condition gaps. Preventive maintenance needs, associated with activities that focus on keeping good condition assets in good condition as long as possible, are added to the performance management gap analysis needs to determine the total need required for the maintenance, rehabilitation and operation of the existing SHS. The performance management based Needs Assessment conducted for the SHSMP is limited to activities that are consistent with state laws that govern the use of Maintenance and SHOPP funds. Generally, these laws require the available funding to be expended on the safety, maintenance, rehabilitation and operation of the existing system. System expansion is not permitted through Maintenance or SHOPP programs.
2017 State Highway System Management Plan 17
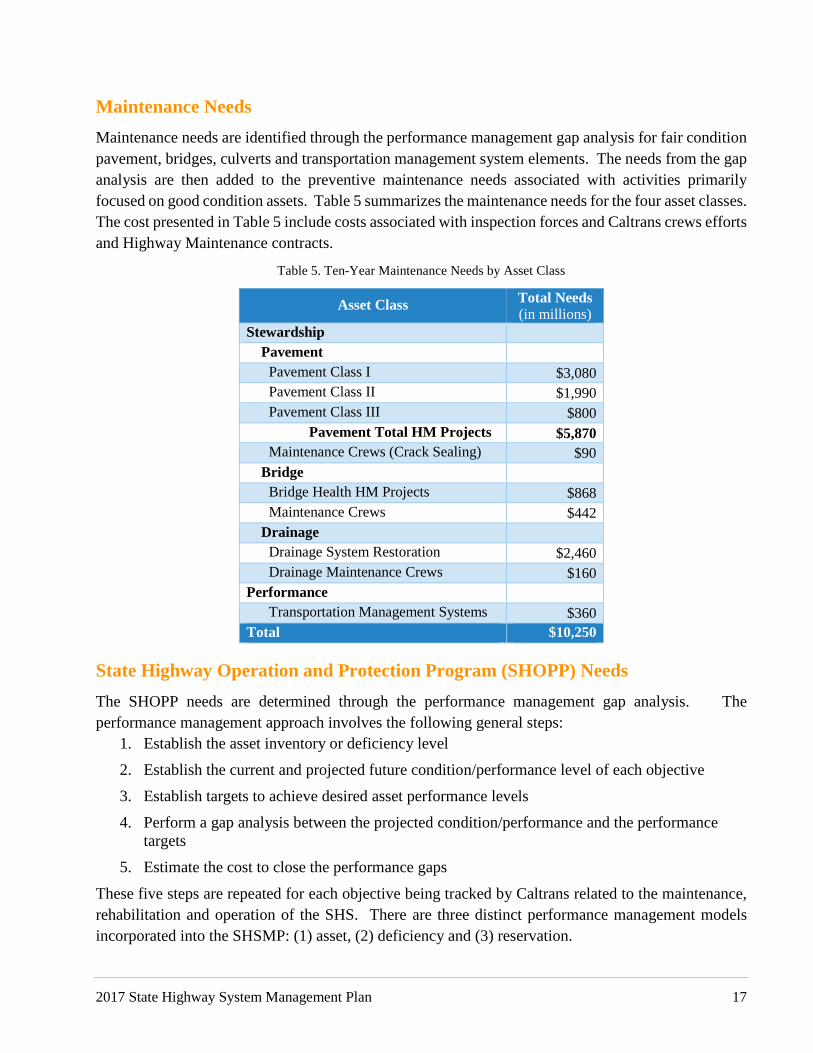
Maintenance Needs Maintenance needs are identified through the performance management gap analysis for fair condition pavement, bridges, culverts and transportation management system elements. The needs from the gap analysis are then added to the preventive maintenance needs associated with activities primarily focused on good condition assets. Table 5 summarizes the maintenance needs for the four asset classes. The cost presented in Table 5 include costs associated with inspection forces and Caltrans crews efforts and Highway Maintenance contracts.
Table 5. Ten-Year Maintenance Needs by Asset Class
Asset Class Total Needs (in millions)
Stewardship Pavement
Pavement Class I $3,080 Pavement Class II $1,990 Pavement Class III $800
Pavement Total HM Projects $5,870 Maintenance Crews (Crack Sealing) $90
Bridge Bridge Health HM Projects $868 Maintenance Crews $442
Drainage Drainage System Restoration $2,460 Drainage Maintenance Crews $160
Performance Transportation Management Systems $360
Total $10,250
State Highway Operation and Protection Program (SHOPP) Needs The SHOPP needs are determined through the performance management gap analysis. The performance management approach involves the following general steps:
1. Establish the asset inventory or deficiency level
2. Establish the current and projected future condition/performance level of each objective
3. Establish targets to achieve desired asset performance levels
4. Perform a gap analysis between the projected condition/performance and the performance targets
5. Estimate the cost to close the performance gaps
These five steps are repeated for each objective being tracked by Caltrans related to the maintenance, rehabilitation and operation of the SHS. There are three distinct performance management models incorporated into the SHSMP: (1) asset, (2) deficiency and (3) reservation.
2017 State Highway System Management Plan 18
1. The asset model is used for physical assets such as pavements, bridges, culverts or any other tangible highway item. The asset model defines an inventory such as the number of lane miles of pavement or the square feet of bridge deck area contained in the SHS. The inventory condition is reported as a percentage of the total in good, fair or poor categories. The performance management approach applies a deterioration rate to each asset to account for expected future conditions. Condition targets for the physical assets are defined with key targets being approved by the Commission. The gap analysis determines the number of lane miles or bridge deck area between projections and the desired performance target. The performance management analysis has both a system preservation and rehabilitation/replacement goal to ensure a balanced management approach. The existing program of work (active projects) is then deducted from these gaps to determine the unaddressed need. The cost to improve the condition to the established targets is then estimated using historical unit costs. These costs, combined with the existing program of work, represents the total need over the ten-year period.
2. The deficiency model is used for objectives like storm water mitigation, safety or Americans with Disabilities Act (ADA) needs. These needs do not have a condition breakdown like the physical assets; they are either deficient or not. A gap analysis between the current deficiency and the target is conducted similar to the asset model. The program of active projects is again deducted from the gap analysis to determine the unaddressed need. Cost estimates to address this need are calculated similar to the asset model.
3. The final Needs Assessment model is for unplanned needs. Emergency response activities and hazardous waste clean-up use this model. Objectives using the reservation model cannot be predicted in terms of the quantity or location of need as location and scope of needs are not known until an event such as a flood or landslide occurs. To effectively manage the SHS, Caltrans holds a financial reservation for when these needs arise. Reservations do not have an identified inventory, condition breakdown or goal. The reservation levels are established based on historical demand in the respective areas.
These various individual models are aggregated up to develop the statewide need figures shown in Table 6. In total, there are 34 different objectives being combined together in the Needs Assessment. Each of these are included in the Appendix of this report providing a fully transparent presentation of the needs calculation. These Needs Assessment models are numerically intensive, relying on narratives provided later in this document to plainly describe what each objective strives to accomplish.

2017 State Highway System Management Plan 19
Table 6. Ten-Year SHOPP Needs
Objectives Capital Outlay (in millions)
Capital Outlay Support
(in millions)
Sum* (in millions)
Safety $9,400 $3,933 $13,333 Bridge Rail Replacement and Upgrade $4,426 $1,771 $6,197 Collision Severity Reduction $895 $430 $1,324 Roadside Safety Improvements $1,072 $530 $1,602 Safety Improvements $3,007 $1,203 $4,210
Stewardship $27,223 $8,305 $35,529 Bridge Health $4,160 $1,325 $5,485 Drainage Pump Plants $110 $55 $165 Drainage System Restoration $1,668 $898 $2,567 Lighting Rehabilitation $401 $201 $602 Major Damage (Emergency Opening) $919 $606 $1,525 Major Damage (Permanent Restoration) $982 $353 $1,335 Office Buildings $491 $0 $491 Overhead Sign Structures Rehabilitation $301 $180 $481 Pavement Class I $10,648 $1,904 $12,552 Pavement Class II $4,171 $800 $4,970 Pavement Class III $989 $197 $1,185 Relinquishments $22 $7 $29 Roadway Protective Betterments $316 $151 $467 Safety Roadside Rest Area (SRRA) Rehabilitation $646 $546 $1,192 Transportation Related Facilities $1,341 $1,046 $2,387 Water and Wastewater Treatment at SRRAs $60 $36 $96
Sustainability $7,167 $3,531 $10,698 ADA Pedestrian Infrastructure $486 $486 $972 Advance Mitigation $231 $69 $300 Bridge Scour Mitigation $580 $267 $847 Bridge Seismic Restoration $2,160 $929 $3,089 Hazardous Waste Mitigation $3 $2 $5 Roadside Rehabilitation $1,368 $657 $2,025 Storm Water Mitigation $2,327 $1,117 $3,444 Zero Emission Vehicle Infrastructure $11 $4 $15
Performance $7,000 $2,859 $9,859 Commercial Vehicle Enforcement Facilities $65 $65 $129 Operational Improvements $666 $267 $933 Sign Panel Replacement $539 $162 $700 Transportation Management Systems $1,321 $489 $1,810 Bridge Goods Movement Upgrades $4,219 $1,688 $5,907 Weigh-In-Motion Scales $189 $189 $379
Subtotal $50,790 $18,628 $69,418 Asset Management Pilot Program - - $82 Minor Program - - $1,500 PID Program Support - - $1,379
Total $72,379 Escalated Total $85,771 *Numbers may not add due to rounding

2017 State Highway System Management Plan 20
Operational Improvement Needs Tables 5 and 6 summarize the total needs associated with achieving the defined condition and performance targets associated with the existing SHS. Improvement needs are also identified through the STIP and California Freight Mobility Plan (CFMP) Programs that are focused on making improvements to or expanding the existing SHS. Improvement needs are identified by Regional Transportation Planning Agencies (RTPA) and Caltrans in regional and interregional improvement plans funded through the STIP and local transportation funding sources. Given the distributed sources of needs identification, placing a specific dollar value on the needs is difficult but it would easily exceed several hundred billion dollars annually. For example, the 2014 CFMP presents a list of 707 freight system improvement projects for all freight modes, with an estimated total cost of approximately $138 billion. The project list uses prioritized corridors, focus areas and overarching strategies and is multi-tiered to address the needs of California’s full, multimodal integrated freight system, as well as to respond to each of the CFMP goals and their corresponding federal freight goals. The project list will be updated as needed to include additional freight projects contained in newly adopted or amended Regional Transportation Plans. The FAST Act provides formula and discretionary funding available to address freight system improvements. California is projected to receive approximately $100 million annually for formula-based state and local freight projects and is eligible to apply for additional discretionary funding. A significant portion of these funds will likely be focused on the SHS. These projects will be approved by the Commission on an annual basis and therefore specific dollar figures for the SHS cannot be determined over the ten-year planning horizon of this Plan.

2017 State Highway System Management Plan 21
TEN-YEAR INVESTMENT PLAN The Needs Assessment identifies the funding necessary to achieve defined condition and performance targets. The identified needs exceed current available funding. Funding for transportation infrastructure comes from a number of sources depending on the asset or deficiency. For example, the condition of the pavement is a function of the activities performed by Caltrans crews, maintenance projects, and rehabilitation or replacement project investments coming from the SHOPP. The Investment Plan defines where the available resources are recommended to be allocated to effectively manage the SHS. Many factors influence the magnitude of investments. In some cases, investment levels are written into law or are terms of court settlements. In other cases, the investments are mandated based on terms of permits or required to be expended on specific activities. The current conditions of highway system assets and consequences of not funding certain objectives must also be taken into consideration. The Investment Plan should also look at longer term life cycle costs and performance that results from various investment scenarios. The Investment Plan should balance highway safety, asset condition, system performance, and sustainability objectives through the allocation of available funding. All of these factors are considered in the development of the recommended Investment Plan. The Investment Plan is a combination of investments from three primary sources: (1) Major Maintenance Program, (2) SHOPP (including the Road Maintenance and Rehabilitation Funds), and (3) Fostering Advancements in Shipping and Transportation for the Long-term Achievement of National Efficiencies (FASTLANE) funds. Each of these investment plans are defined within this section for the assets or objectives that are applicable to the funding source.
Maintenance Investment Plan
Preventive maintenance is the most cost-effective means of protecting the state’s infrastructure investment. Applying the right maintenance treatment at the right time slows deterioration and extends the life of the pavements, bridges, drainage system assets and transportation management system (TMS) assets at the lowest possible long-term cost. The Maintenance Program will utilize new resources from Senate Bill 1 to increase the levels of service in several key areas including pavement, guardrail, striping, bridge, and electrical items (e.g. TMS elements). The benefit of this work will be measured primarily in the annual Level of Service survey. A portion of the ongoing resources will also be utilized for performing additional preventive maintenance on culverts. While the distribution of resources resulting from SB-1 are undergoing final determination, maintenance plans to utilize a combination of Highway Maintenance (HM) and service contracts initially. This will address major maintenance backlog needs initially, but resources will transition to permanent field maintenance staff to maintain these assets in a state of good repair. Table 7 will be updated once the resource allocations from SB1 are finalized and the long term funding picture
2017 State Highway System Management Plan 22
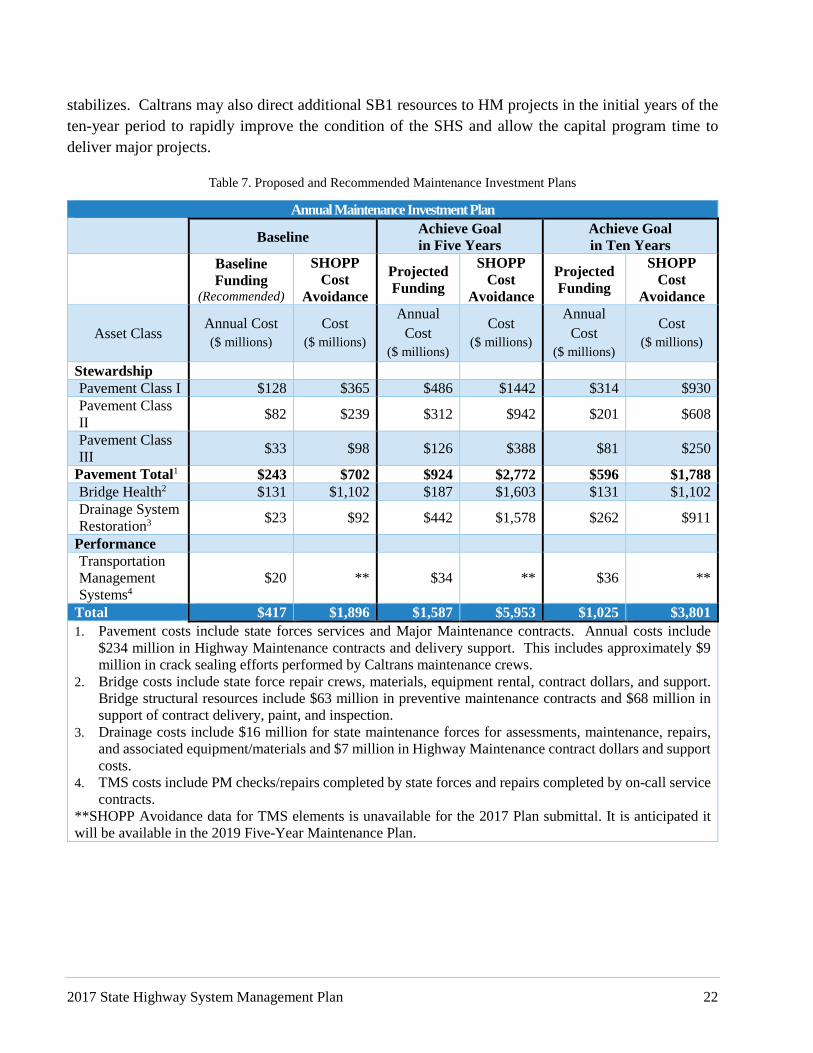
stabilizes. Caltrans may also direct additional SB1 resources to HM projects in the initial years of the ten-year period to rapidly improve the condition of the SHS and allow the capital program time to deliver major projects.
Table 7. Proposed and Recommended Maintenance Investment Plans
Annual Maintenance Investment Plan Baseline Achieve Goal
in Five Years Achieve Goal in Ten Years
Baseline Funding
(Recommended)
SHOPP Cost
Avoidance
Projected Funding
SHOPP Cost
Avoidance
Projected Funding
SHOPP Cost
Avoidance
Asset Class Annual Cost ($ millions)
Cost ($ millions)
Annual Cost
($ millions)
Cost ($ millions)
Annual Cost
($ millions)
Cost ($ millions)
Stewardship Pavement Class I $128 $365 $486 $1442 $314 $930 Pavement Class II $82 $239 $312 $942 $201 $608
Pavement Class III $33 $98 $126 $388 $81 $250
Pavement Total1 $243 $702 $924 $2,772 $596 $1,788 Bridge Health2 $131 $1,102 $187 $1,603 $131 $1,102 Drainage System Restoration3 $23 $92 $442 $1,578 $262 $911
Performance Transportation Management Systems4
$20 ** $34 ** $36 **
Total $417 $1,896 $1,587 $5,953 $1,025 $3,801 1. Pavement costs include state forces services and Major Maintenance contracts. Annual costs include
$234 million in Highway Maintenance contracts and delivery support. This includes approximately $9 million in crack sealing efforts performed by Caltrans maintenance crews.
2. Bridge costs include state force repair crews, materials, equipment rental, contract dollars, and support. Bridge structural resources include $63 million in preventive maintenance contracts and $68 million in support of contract delivery, paint, and inspection.
3. Drainage costs include $16 million for state maintenance forces for assessments, maintenance, repairs, and associated equipment/materials and $7 million in Highway Maintenance contract dollars and support costs.
4. TMS costs include PM checks/repairs completed by state forces and repairs completed by on-call service contracts.
**SHOPP Avoidance data for TMS elements is unavailable for the 2017 Plan submittal. It is anticipated it will be available in the 2019 Five-Year Maintenance Plan.

2017 State Highway System Management Plan 23
SHOPP Investment Plan The SHOPP Investment Plan defines the funding levels for each of the objectives. The investment in Strategic categories strives to be consistent with state law, policy directives and Caltrans Strategic Management Plan objectives. The investments reflect a “fix it first” approach that prioritizes maintenance and rehabilitation of the system along with safety improvements. The magnitude of investment in each of the areas is determined based on many factors. These factors include programmed work, current condition, judicial or legislatively mandated funding levels, consequences of inaction, past investment levels and preservation needs versus rehabilitation consideration. The establishment of investment levels also considers the impact on the system of the investment, the existing pipeline of work, expected deterioration rates, and expected growth in inventory. Investment levels are converted to performance expectations and proportioned out to each of the Caltrans districts based on the unmet need for each objective. Caltrans districts then develop multi-year project portfolios that collectively address the performance expectations. These projects move into formal planning and ultimately vie for programming in the SHOPP. This approach ensures that the project portfolios proposed for future SHOPP’s are consistent with statewide goals and objectives.

2017 State Highway System Management Plan 24
Table 8. SHOPP Ten-Year Investment Plan
Objectives Base Funding SB-1 Funding Sum* (in millions)
Safety $4,572 $903 $5,475 Bridge Rail Replacement and Upgrade $314 $93 $407 Collision Severity Reduction $1,173 $30 $1,203 Roadside Safety Improvements $865 $0 $865 Safety Improvements $2,220 $780 $3,000
Stewardship $15,703 $14,505 $30,208 Bridge Health $2,736 $2,734 $5,470 Drainage Pump Plants $74 $46 $120 Drainage System Restoration $845 $1,473 $2,318 Lighting Rehabilitation $24 $127 $151 Major Damage (Emergency Opening) $1,525 $0 $1,525 Major Damage (Permanent Restoration) $1,181 $0 $1,181 Office Buildings $31 $0 $31 Overhead Sign Structures Rehabilitation $24 $97 $121 Pavement Class I $5,810 $6,706 $12,516 Pavement Class II $2,493 $2,457 $4,950 Pavement Class III $454 $728 $1,181 Relinquishments $29 $0 $29 Roadway Protective Betterments $143 $0 $143 Safety Roadside Rest Area (SRRA) Rehabilitation $93 $48 $141 Transportation Related Facilities $167 $91 $258 Water and Wastewater Treatment at SRRAs $75 $0 $75
Sustainability $2,736 $162 $2,898 ADA Pedestrian Infrastructure $415 $0 $415 Advance Mitigation $40 $120 $160 Bridge Scour Mitigation $266 $0 $266 Bridge Seismic Restoration $780 $0 $780 Hazardous Waste Mitigation $5 $0 $5 Roadside Rehabilitation $121 $42 $162 Storm Water Mitigation $1,094 $0 $1,094 Zero Emission Vehicle Infrastructure $15 $0 $15
Performance $1,588 $1,190 $2,779 Commercial Vehicle Enforcement Facilities $70 $0 $70 Operational Improvements $390 $0 $390 Sign Panel Replacement $76 $102 $178 Transportation Management Systems $864 $881 $1,745 Bridge Goods Movement Upgrades $149 $151 $300 Weigh-In-Motion Scales $39 $57 $95
Subtotal $24,600 $16,760 $41,360 Asset Management Pilot Program $82 $0 $82 Minor Program $1,500 $1,000 $2,500 PID Program Support $395 $309 $704
Total $26,577 $18,069 $44,645 *Numbers may not add due to rounding

2017 State Highway System Management Plan 25
PERFORMANCE OUTCOMES The Investment Plan allocates available funding to specific transportation objectives. These include safety, physical asset condition, system performance, and sustainability goals. Based on the recommended level of investment in each objective area, the corresponding accomplishments that can be expected for the investment are determined. Investments may be defined for good, fair and poor condition assets depending on the objectives of the funding programs. Having specific investments addressing physical assets at all levels helps to minimize long-term cost by avoiding a worst first asset management approach. The following tables detail the specific quantity and units of performance that is expected from each of the funding programs:
Table 9. Proposed Annual Maintenance Accomplishments at Recommended Funding Level
Annual Maintenance Performance Accomplishments
Asset Class Unit Accomplishment Total
Stewardship Good to
Good Fair to Good
Pavement Class I Lane Miles 900 100 1,000 Pavement Class II Lane Miles 576 64 640 Pavement Class III Lane Miles 234 26 260
Pavement Total1 1,710 190 1,900 Bridge Health Square Feet 3,100,000 2,300,000 5,400,000
Drainage System Restoration2 Linear Feet - 14,000 14,000
Assessments 7,800 2,880 12,000
Performance Transportation Management Systems PM Checks/Repairs 52,400 - 52,400
1. The accomplishments listed above do not reflect lane miles that are crack sealed (approximately 3,000) by maintenance forces to maintain fair lane miles as fair, extending the time to when they would become poor.
2. The total 12,000 assessments also include approximately 1,320 assessments of culverts in poor condition.

2017 State Highway System Management Plan 26
Table 10. Ten-Year Performance Accomplishments SHOPP Performance Accomplishments
Objectives Unit Fair Poor New Safety Bridge Rail Replacement and Upgrade Linear Feet 119,968 179,515 - Collision Severity Reduction Injuries - 4,527 - Roadside Safety Improvements Locations - 11,006 - Safety Improvements - - - -
Stewardship Bridge Health SF 21,026,445 8,491,729 - Drainage Pump Plants Locations 2 131 - Drainage System Restoration Linear Feet 7,867 1,132,171 - Lighting Rehabilitation Each 0 11,952 - Major Damage (Emergency Opening) - - - - Major Damage (Permanent Restoration) - - - - Office Buildings SF Various 41,700 - Overhead Sign Structures Rehabilitation Each 0 628 - Pavement Class I Lane Miles 9,861 4,401 - Pavement Class II Lane Miles 4,131 4,057 - Pavement Class III Lane Miles 349 2,039 - Relinquishments - - - - Roadway Protective Betterments Locations - 26 - Safety Roadside Rest Area (SRRA) Rehabilitation
Locations 0 14 0
Transportation Related Facilities SF 0 185,510 97,383 Water and Wastewater Treatment at SRRAs Locations 0 27 -
Sustainability ADA Pedestrian Infrastructure Locations - 15,148 - Advance Mitigation - - - - Bridge Scour Mitigation SF - 1,185,260 - Bridge Seismic Restoration SF - 4,933,322 - Hazardous Waste Mitigation - - - - Roadside Rehabilitation Acre 0 1,215 - Storm Water Mitigation Acre - 4,777 - Zero Emission Vehicle Infrastructure Locations - 30 -
Performance Commercial Vehicle Enforcement Facilities Stations 9 9 -
Operational Improvements Daily Vehicle
Hours of Delay - 24,069 -
Sign Panel Replacement Each 0 22,045 - Transportation Management Systems Each 0 10,906 2,062 Bridge Goods Movement Upgrades SF 571,024 1,312,713 - Weigh-In-Motion Scales Stations 12 34 0

2017 State Highway System Management Plan 27
PROGRAM DEFINITIONS
Safety
Safety activities are carried out to minimize the number of fatalities and injuries and to minimize the number and severity of accidents for all modes of transportation. Engineered safety activities improve the safety of the transportation system for all modes. Examples of activities carried out to improve the safety of the transportation system include: The installation of center dividing rails
Upgrading bridge rails to meet current standards
Installing guardrail
Protection for bicyclists and pedestrians
Installing crosswalks
Worker protection activities
Placement of rumble strips
Installing signals
Geometric changes to the SHS
Construction of bicycle and pedestrian facilities
The ongoing commitment to transportation safety requires continual monitoring of the SHS for changing conditions or use patterns that would necessitate engineered safety solutions. As these situations are identified, improvements are carried out through both Maintenance and SHOPP as appropriate for the specific situation.
Bridge Rail Replacement and Upgrade The Bridge Rail Replacement and Upgrade objective includes improvement or replacement of bridge rails that do not meet federal crash standards for the posted roadway speed or that have deteriorated conditions or damage due to other causes. There are over 13,160 bridges on the SHS containing over 8.2 million linear feet of bridge rail. Approximately 60 percent of the bridge rail is in good condition,
Figure 2. Saratoga Creek Bridge Rail before and after Repair

2017 State Highway System Management Plan 28
33 percent is in fair condition and 7 percent is in poor condition. The goal of the Bridge Rail Replacement and Upgrade objective is to eliminate all non-crashworthy bridge rail on the SHS. The assessment for bridge rail needs on the SHS is approximately $6.2 billion from SHOPP over the next ten years, which includes both needs currently being addressed through the project development process and the existing and projected performance gap. The performance management components which are used to calculate the ten-year need are presented in Appendix B. The basis for these performance management components is stated in the table below.
Table 11. Bridge Rail Replacement and Upgrade Performance Management
Performance Management Components Basis Effective Annual Deterioration Rate N/A (Not a condition-based objective) Average Unit Cost and Support Ratio Historic cost data
Target Condition (in 2027) The target is to have all bridge rails meet current federal crash test standards.
Safety Improvements and Collision Severity Reduction
The Safety Improvements and Collision Severity Reduction objectives include a variety of different safety improvements meant to reduce the severity and number of collisions on the SHS. Statistical analysis is used to identify locations needing safety improvements based on collision data, with a cost-benefit analysis ensuring that projects produce net savings for the public. Other targeted improvements align with the Strategic Highway Safety Plan and focus on an area of improvement, such as pedestrian safety. Other projects repair or replace obsolete or non-functional safety assets such as crash cushions or guard rail. In 2013, there were 1,105 fatal collisions, 51,378 injury collisions, and 98,338 property damage only collisions reported on the SHS. These add up to a total economic impact of almost $22 billion. The goal for the Safety Improvements program is to fund all identified safety improvements which meet the program criteria or cost-benefit analysis. The goal for the Collision Severity Reduction program is to proactively reduce the severity of 10 percent of fatal and injury collisions over ten years. The need for triggered Safety Improvements on the SHS is approximately $4.2 billion from the SHOPP over the next ten years. The basis for this estimated need is stated in the table below.
Table 12. Safety Improvements Performance Management
Performance Management Components Basis Effective Annual Deterioration Rate N/A
Estimated Need The estimated need is based on a multi-year average of recent expenditures.
Target Condition (in 2027) N/A The need for Collision Severity Reduction on the SHS is approximately $1.3 billion from the SHOPP over the next ten years. The performance management components which are used to calculate the ten-year need are presented in Appendix B. The basis for these performance management components is stated in the table below.
2017 State Highway System Management Plan 29
Table 13. Collision Severity Reduction Performance Management
Performance Management Components Basis Effective Annual Deterioration Rate N/A (Not a condition-based objective) Average Unit Cost and Support Ratio Historic cost data
Target Condition (in 2027) The target of 10% reduction in fatal and severe injuries is based on the 2013 statistics.
Roadside Safety Improvements
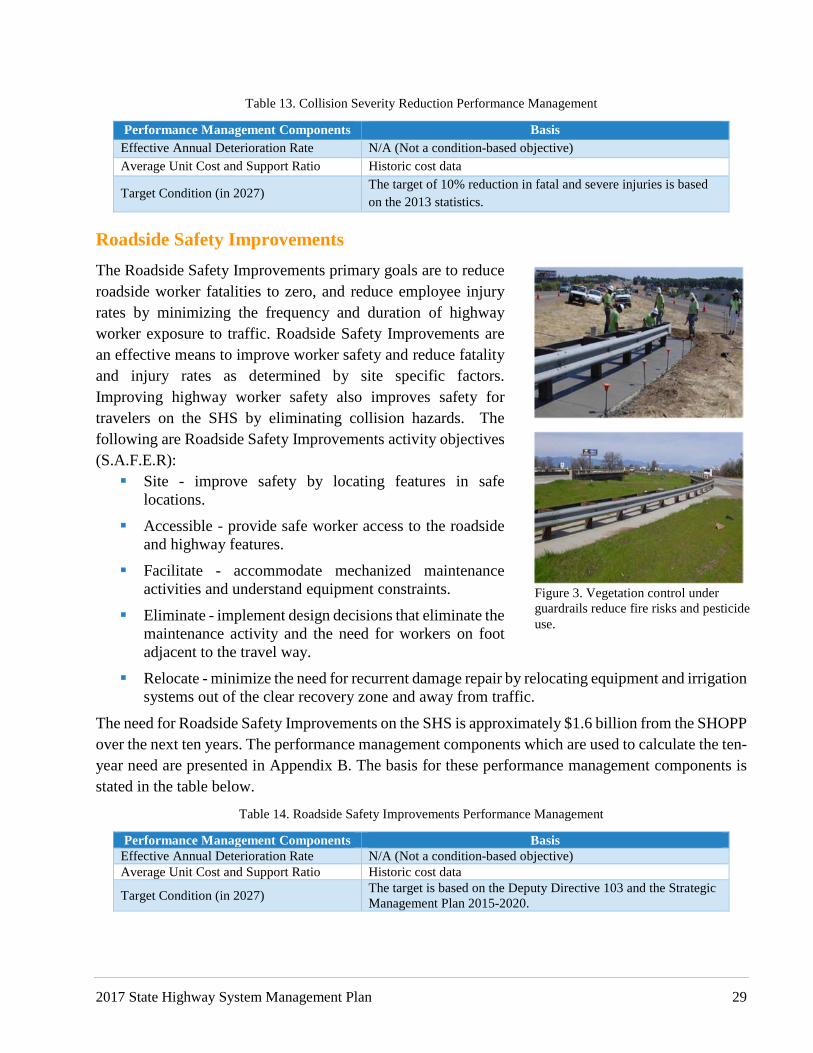
The Roadside Safety Improvements primary goals are to reduce roadside worker fatalities to zero, and reduce employee injury rates by minimizing the frequency and duration of highway worker exposure to traffic. Roadside Safety Improvements are an effective means to improve worker safety and reduce fatality and injury rates as determined by site specific factors. Improving highway worker safety also improves safety for travelers on the SHS by eliminating collision hazards. The following are Roadside Safety Improvements activity objectives (S.A.F.E.R): Site - improve safety by locating features in safe
locations.
Accessible - provide safe worker access to the roadside and highway features.
Facilitate - accommodate mechanized maintenance activities and understand equipment constraints.
Eliminate - implement design decisions that eliminate the maintenance activity and the need for workers on foot adjacent to the travel way.
Relocate - minimize the need for recurrent damage repair by relocating equipment and irrigation systems out of the clear recovery zone and away from traffic.
The need for Roadside Safety Improvements on the SHS is approximately $1.6 billion from the SHOPP over the next ten years. The performance management components which are used to calculate the ten-year need are presented in Appendix B. The basis for these performance management components is stated in the table below.
Table 14. Roadside Safety Improvements Performance Management
Performance Management Components Basis Effective Annual Deterioration Rate N/A (Not a condition-based objective) Average Unit Cost and Support Ratio Historic cost data
Target Condition (in 2027) The target is based on the Deputy Directive 103 and the Strategic Management Plan 2015-2020.
Figure 3. Vegetation control under guardrails reduce fire risks and pesticide use.
2017 State Highway System Management Plan 30
Stewardship
Stewardship activities are carried out primarily to minimize the long-term costs of ownership of physical assets. These activities generally maintain or improve the condition of the asset which can often also improve system reliability and safety at the same time. Stewardship needs continue to increase as the transportation system demand grows and the infrastructure ages. Failure to perform timely stewardship investments in the transportation system increases long-term costs of ownership, reduces the system reliability and safety, and will ultimately take even greater investments to restore the condition in the future. Examples of stewardship activities include: Emergency restoration of damaged infrastructure
Maintaining pavement, bridges, and culverts
Applying protective coatings, protection systems or overlays
Maintenance and rehabilitation of pedestrian and bicycle facilities
Maintenance and rehabilitation of SRRA facilities
Performing maintenance on state-owned maintenance stations, office building, equipment shops, transportation management centers and labs
Maintaining and replacing signs and lighting
Rehabilitation or replacement of pavements, bridges, culverts, buildings, etc.
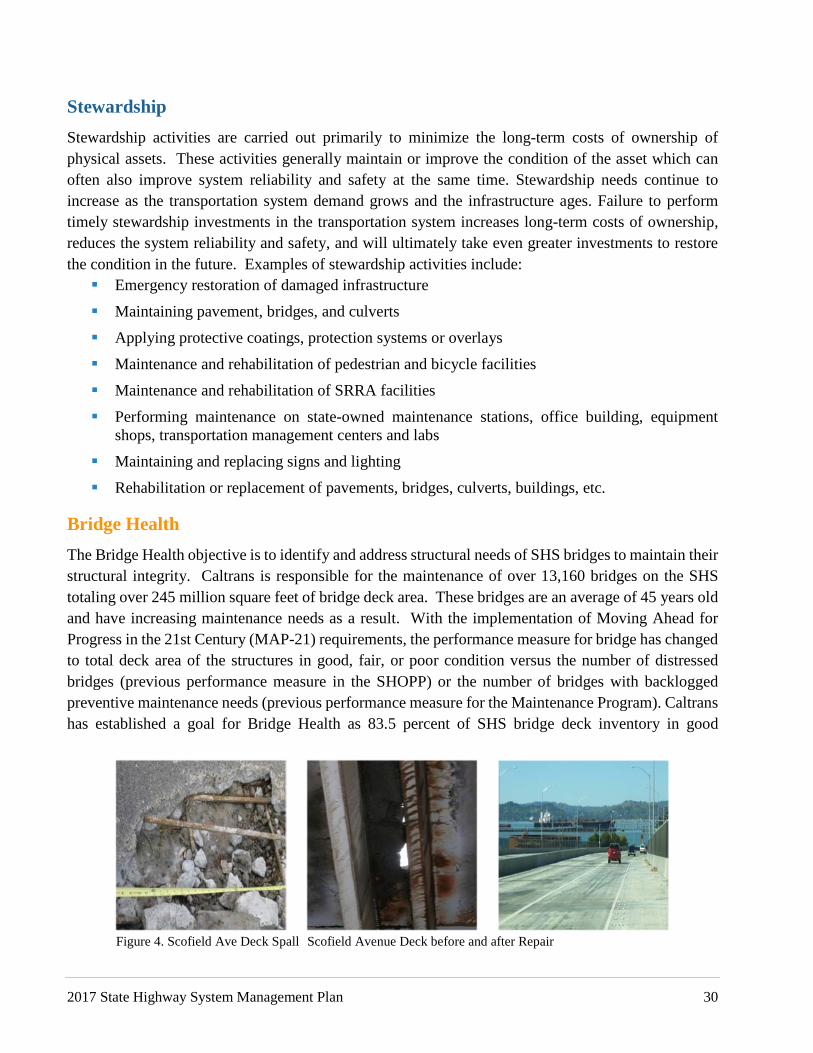
Bridge Health
The Bridge Health objective is to identify and address structural needs of SHS bridges to maintain their structural integrity. Caltrans is responsible for the maintenance of over 13,160 bridges on the SHS totaling over 245 million square feet of bridge deck area. These bridges are an average of 45 years old and have increasing maintenance needs as a result. With the implementation of Moving Ahead for Progress in the 21st Century (MAP-21) requirements, the performance measure for bridge has changed to total deck area of the structures in good, fair, or poor condition versus the number of distressed bridges (previous performance measure in the SHOPP) or the number of bridges with backlogged preventive maintenance needs (previous performance measure for the Maintenance Program). Caltrans has established a goal for Bridge Health as 83.5 percent of SHS bridge deck inventory in good
Figure 4. Scofield Ave Deck Spall Scofield Avenue Deck before and after Repair

2017 State Highway System Management Plan 31
condition, no more than 15 percent in fair condition and no more than 1.5 percent in poor condition. Table 15 identifies the condition target for Bridge Health.
Table 15. Bridge Performance Targets
Bridge Performance Target (Measured by Deck Area Square Feet)
Good Fair Poor 83.5% 15% 1.5%
Bridge maintenance needs are identified and documented during regular, routine bridge inspections and when applicable in specialty investigations which include hydraulics, underwater and fracture critical inspections. When needs are identified, bridge inspectors complete a Bridge Inspection Report documenting the needs and code any changes to the individual structural elements per federal guidelines. The good, fair or poor condition classifications are developed based on these federal coding guidelines. Currently, for Bridge Health, approximately 75 percent of the SHS bridge inventory deck area is in good condition, 22 percent in fair condition, and 3 percent in poor condition. Caltrans works to manage the bridge inventory safely and efficiently to extend the service life of the structures and limit operational restrictions. Preventive maintenance work accomplished through bridge crew repairs or the HM Program provide significant benefit and extend the service life of the structures by addressing minor defects before they progress to more extensive damage. Maintenance bridge work includes repairs that require immediate attention and other minor maintenance work including joint repairs, spalls, paint needs, as well as deck overlays and repairs. When minor defects are not addressed quickly and efficiently, the resulting damage often requires
Chart 5. Displays the deterioration and repair cycle for bridges on the SHS. Currently 75 percent of bridge decks, measured by square feet, are in good condition. Approximately 0.45 percent of bridge decks in good condition deteriorates to fair condition annually. Of the 22 percent of bridge decks in fair condition, approximately 0.75 percent of the bridge deck inventory declines to poor condition annually. SHOPP projects address bridge decks in both fair and poor condition and restore the condition of the asset, while maintenance focuses on maintaining bridge decks in good condition as well addressing some bridge decks in fair condition.

2017 State Highway System Management Plan 32
major structural rehabilitation or replacement which is not only more costly than preventive maintenance, but can cause significant long-term disruptions to the traveling public. The first stage of preventive maintenance is the work performed by bridge maintenance crew forces. These crews address repairs that require immediate attention and other minor maintenance work. Bridge preventive maintenance needs that are beyond the scope of our bridge maintenance crews are combined into maintenance projects completed by contractors. Bridges that have damage or deterioration and can be addressed through preventive maintenance activities, which include bridges in good condition and a portion of the bridges in fair condition, are funded through either the HM Program or the preventive maintenance activities funded through the SHOPP. Bridges that have deteriorated structurally or have damage due to other causes, which include bridges in poor condition and a portion of the bridges in fair condition, are addressed with major rehabilitation or replacement activities funded through the SHOPP. When bridges require major rehabilitation or replacement, it is sometimes appropriate to make additional geometric or structural improvements. Such improvements are permissible, however, the primary purpose for the work shall be to address the condition of the structural elements of the bridge. The need for Bridge Health on the SHS is approximately $6.1 billion from the SHOPP and Maintenance Program over the next ten years. The performance management components which are used to calculate the ten-year need are presented in Appendix B. The basis for these performance management components is stated in the table below.
Table 16. Bridge Health Performance Management
Performance Management Components Basis Effective Annual Deterioration Rate Bridge management system Average Unit Cost and Support Ratio Historic cost data
Target Condition (in 2027) The target is based on a performance-cost analysis which the CTC adopted.
Drainage System Restoration
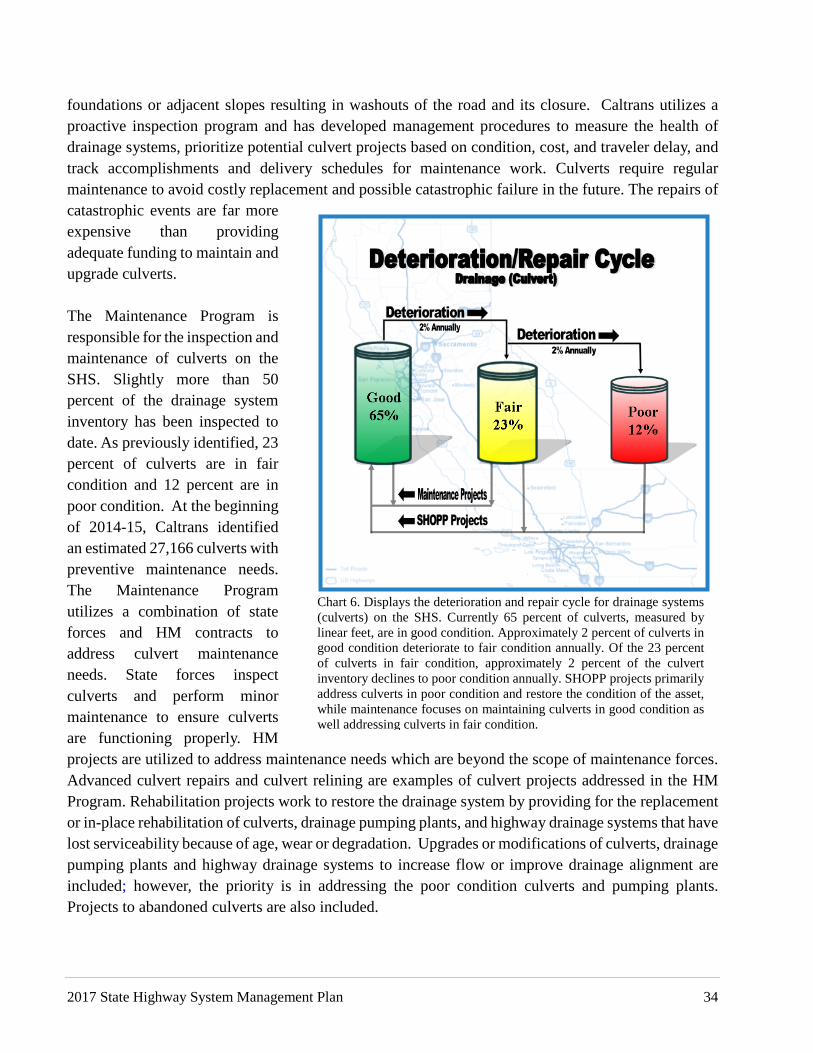
The SHS includes an estimated 205,000 culverts totaling almost 20.3 million linear feet of culverts that drain rainwater, drainage channels, streams, and rivers away from highways via metal or concrete tubes or structures that direct water flow in a controlled manner under the highways. Culvert damage or failure can seriously damage or close roadways, create the need for extensive repairs and threaten the mobility and safety of the traveling public. Of the culverts inventoried to date, approximately 65 percent of the culverts are in good condition, 23 percent in fair condition and 12 percent in poor condition. Figure 5. State Route 39 Culvert before and after Repair

2017 State Highway System Management Plan 33
Caltrans has established a goal to bring 90 percent of culverts to good and fair condition, as well as having no more than ten percent culverts in poor condition. The Drainage System Restoration primary objective is to provide for the replacement or in-place rehabilitation of culverts, drainage pumping plants, and highway drainage systems that have lost serviceability because of age, wear, or degradation. Upgrades or modifications of culverts, drainage pumping plants, and highway drainage systems to increase flow or improve drainage alignment are included, however, the priority is in addressing the poor condition culverts and pumping plants. Projects to abandon culverts are also included. The criteria used to define the Drainage goal was to eliminate all known poor condition culverts from the inventory. The goal was set using Commission and Caltrans program management guidance and engineering judgement taking into account the deterioration rate and the anticipated annual culvert inspection rate. The need for the Drainage System Restoration on the SHS is approximately $5 billion for the culverts and $165 million for the pumping plants from the SHOPP and Maintenance Program over the next ten years. The performance management components which are used to calculate the ten-year need are presented in Appendix B. The basis for these performance management components for the culverts is stated in the table below.
Table 17. Culvert Performance Management
Performance Management Components Basis Effective Annual Deterioration Rate Service life criteria Average Unit Cost and Support Ratio Historic cost data
Target Condition (in 2027) The target is based on a performance-cost analysis which the CTC adopted.
For the pumping plants, the basis for the performance management components is stated in the following table.
Table 18. Pumping Plant Performance Management
Performance Management Components Basis Effective Annual Deterioration Rate Service life criteria Average Unit Cost and Support Ratio Historic cost data Target Condition (in 2027) The target is to avoid roadway flooding because of poor pump plants.
Table 19. Drainage System Performance Target
Drainage System Performance Goal Good Fair Poor 80% 10% 10%
16,219,598 Linear Feet 2,027,451 Linear Feet 2,027,451 Linear Feet
Culverts exemplify the potentially severe consequences of not caring adequately for components of the transportation system that are out-of-sight but are critically important to the safety and reliability of the SHS. If a culvert becomes clogged, decays, or fails due to rust or other factors, and fails to convey water away from the highway as a result, the water may then flood the highway or erode highway
2017 State Highway System Management Plan 34
foundations or adjacent slopes resulting in washouts of the road and its closure. Caltrans utilizes a proactive inspection program and has developed management procedures to measure the health of drainage systems, prioritize potential culvert projects based on condition, cost, and traveler delay, and track accomplishments and delivery schedules for maintenance work. Culverts require regular maintenance to avoid costly replacement and possible catastrophic failure in the future. The repairs of catastrophic events are far more expensive than providing adequate funding to maintain and upgrade culverts. The Maintenance Program is responsible for the inspection and maintenance of culverts on the SHS. Slightly more than 50 percent of the drainage system inventory has been inspected to date. As previously identified, 23 percent of culverts are in fair condition and 12 percent are in poor condition. At the beginning of 2014-15, Caltrans identified an estimated 27,166 culverts with preventive maintenance needs. The Maintenance Program utilizes a combination of state forces and HM contracts to address culvert maintenance needs. State forces inspect culverts and perform minor maintenance to ensure culverts are functioning properly. HM projects are utilized to address maintenance needs which are beyond the scope of maintenance forces. Advanced culvert repairs and culvert relining are examples of culvert projects addressed in the HM Program. Rehabilitation projects work to restore the drainage system by providing for the replacement or in-place rehabilitation of culverts, drainage pumping plants, and highway drainage systems that have lost serviceability because of age, wear or degradation. Upgrades or modifications of culverts, drainage pumping plants and highway drainage systems to increase flow or improve drainage alignment are included; however, the priority is in addressing the poor condition culverts and pumping plants. Projects to abandoned culverts are also included.
Chart 6. Displays the deterioration and repair cycle for drainage systems (culverts) on the SHS. Currently 65 percent of culverts, measured by linear feet, are in good condition. Approximately 2 percent of culverts in good condition deteriorate to fair condition annually. Of the 23 percent of culverts in fair condition, approximately 2 percent of the culvert inventory declines to poor condition annually. SHOPP projects primarily address culverts in poor condition and restore the condition of the asset, while maintenance focuses on maintaining culverts in good condition as well addressing culverts in fair condition.

2017 State Highway System Management Plan 35
Lighting Rehabilitation
The Lighting Rehabilitation objective includes rehabilitation and replacement of roadway lighting systems (poles, foundations, luminaires, etc.) that have damage or deteriorated conditions due to aging, weather or other factors. Lighting systems need to be updated to current technology and/or structural requirements to prevent structural failure, improve operational reliability and reduce the use of electricity. Caltrans has converted significant portions of the SHS to LED lighting already and we continue to look at adaptive lighting solutions to further reduce power demand. The primary factor for this activity is asset age, since many of the points of deterioration are directly associated with age of the system. As lighting systems age, metal fatigue can set in, corrosion weakens the pole or base bolts, and wire can deteriorate to the point of insulation failure which will cause electrical failure. There are approximately 90,000 roadway lights identified. About 46 percent (41,000) are older than 40 years, therefore rated as poor. During this ten-year Plan, an additional 6,600 units will surpass this time threshold and also need rehabilitation. The goal is to have no lighting system in poor condition, convert all lighting to LED technology. The need is $602 million over the ten years from SHOPP. The performance management components which are used to calculate the ten-year need are presented in Appendix B. The basis for these performance management components is stated in the table below. The Maintenance Program does not replace poles and foundations unless damaged by collision.
Table 20. Lighting Rehabilitation Performance Management
Performance Management Components Basis Effective Annual Deterioration Rate Service life criteria Average Unit Cost and Support Ratio Historic cost data
Target Condition (in 2027) The target is to replace roadway lighting poles with the current design based on their age, and to upgrade tunnel lighting to the LED technology.
Major Damage (Emergency Opening) The Emergency Opening objective includes emergency repair of assets damaged or imminently threatened by unforeseen events. Qualifying repairs include those needed to maintain essential traffic. To be considered for the program the work must be tied to an identifiable natural event such as storms, floods, fire, earthquake, tsunami, or volcanic action. Human-caused events such as vehicle collision, explosion, theft, civil unrest and acts of war or terrorism are included. Repair to current design standards is allowed. As expected, the level of repairs needed varies annually depending on the number and severity of damaging events. Funding needs are known in real-time when the event(s) occur based on the damage experienced and cost of repair. The goal is to repair 100 percent of qualifying emergency opening damage within 180 days of event so that we can maintain 100 percent roadway access. The need is approximately $1.5 billion from SHOPP over the next ten years. The basis for this estimated need is stated in the table below.

2017 State Highway System Management Plan 36
Table 21. Major Damage (Emergency Opening) Performance Management
Performance Management Components Basis Effective Annual Deterioration Rate N/A
Estimated Need The estimated need is based on a multi-year average of recent expenditures.
Target Condition (in 2027) N/A
Major Damage (Permanent Restoration)
The Permanent Restoration objective includes full restoration of assets in-kind and follows the emergency opening phase. Qualification for Permanent Restoration is the same as for Emergency Opening. Restoration to current design standards is allowed. Accelerated permanent restoration under Emergency Opening is sometimes allowed if it is more economical to complete the repairs as part of Emergency Opening. It is expected that projects begin construction within three years of the incident date. Funding needs are known in real-time when the event(s) occur based on the damage experienced and cost of repair. The need is approximately $1.3 billion from SHOPP over the next ten years. The basis for this estimated need is stated in the table below. This need does not include funding to respond to a major disaster such as a powerful earthquake in a heavily urbanized area.
Table 22. Major Damage (Permanent Restoration) Performance Management
Performance Management Components Basis Effective Annual Deterioration Rate N/A
Estimated Need The estimated need is based on a multi-year average of recent expenditures.
Target Condition (in 2027) N/A
Figure 6. State Route 3 in Trinity County before emergency opening repair of a major slipout following intense rainfall in March 2016.
Figure 7. Emergency opening included rebuilding the embankment and pavements.

2017 State Highway System Management Plan 37
Office Buildings
The Office Building objective includes major rehabilitation and/or replacement of state office buildings that have deteriorated conditions or critical infrastructure deficiencies, such as fire, life safety, seismic, code, or building deficiencies. Additionally, as office building infrastructure begins to deteriorate or become obsolete, it may require repairs to keep the facility operational so that it achieves its full service lifespan. There are ten state-owned office buildings in Caltrans’ portfolio totaling approximately 2.8 million square feet. Approximately 42 percent of that area is in good condition, 32 percent is in fair condition, and 26 percent is in poor condition. It is our goal to have zero office building assets in poor condition, defined as exceeding the useful lifespan of 50 years for fixed buildings, 20 years for modular buildings, and/or with critical infrastructure deficiencies. The goal is to award construction contracts within three years of damaging event for all known needs. All damage locations are considered poor condition and need restoration. The need for the state’s office building assets are approximately $491 million from the SHOPP over the next ten years. The performance management components which are used to calculate the ten-year need are presented in Appendix B. The basis for these performance management components is stated in the table below.
Table 23. Office Buildings Performance Management
Performance Management Components Basis Effective Annual Deterioration Rate Service life criteria Average Unit Cost and Support Ratio Historic cost data
Target Condition (in 2027) The target is to have no fixed or modular building in a poor condition beyond its service life.
Overhead Sign Structure Rehabilitation
The Overhead Sign Structure Rehabilitation objective includes the replacement and upgrade of overhead sign structures (that support overhead sign panels) that have damage or deteriorated due to
Figure 8. SR 1 in Monterey County before a slipout. Figure 9. Permanent Restoration involved building a new viaduct.
Figure 10. Caltrans Headquarters Built In 1936.
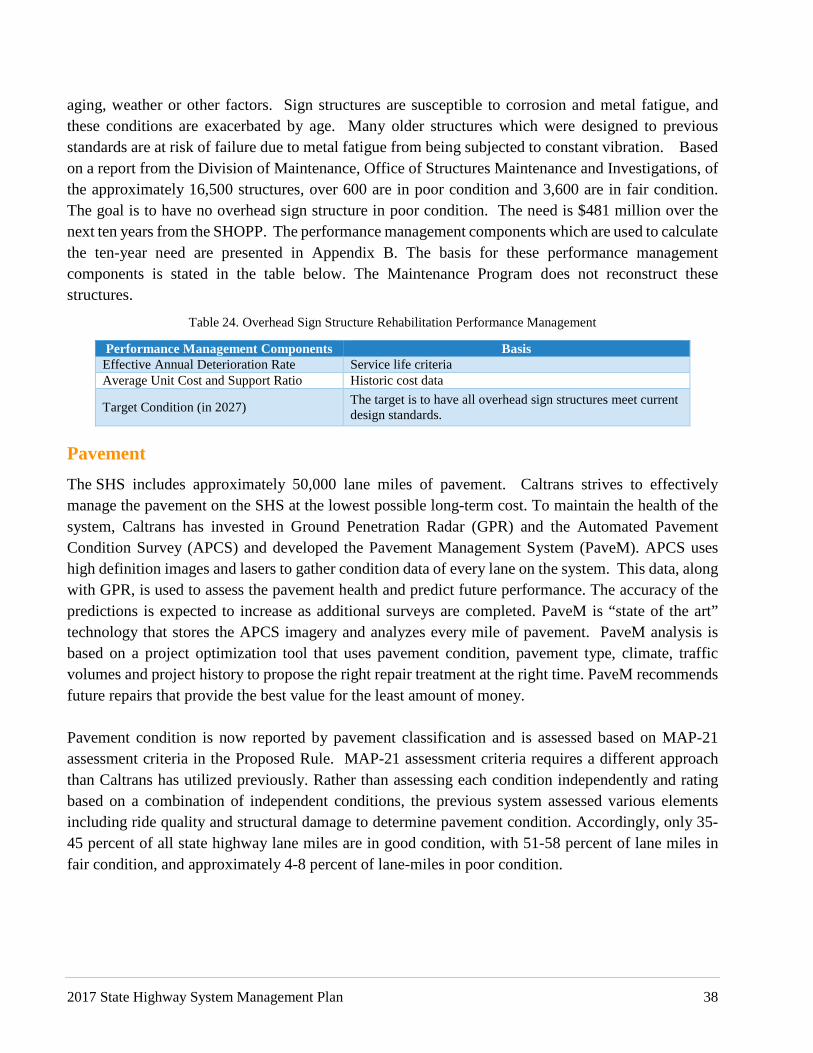
2017 State Highway System Management Plan 38
aging, weather or other factors. Sign structures are susceptible to corrosion and metal fatigue, and these conditions are exacerbated by age. Many older structures which were designed to previous standards are at risk of failure due to metal fatigue from being subjected to constant vibration. Based on a report from the Division of Maintenance, Office of Structures Maintenance and Investigations, of the approximately 16,500 structures, over 600 are in poor condition and 3,600 are in fair condition. The goal is to have no overhead sign structure in poor condition. The need is $481 million over the next ten years from the SHOPP. The performance management components which are used to calculate the ten-year need are presented in Appendix B. The basis for these performance management components is stated in the table below. The Maintenance Program does not reconstruct these structures.
Table 24. Overhead Sign Structure Rehabilitation Performance Management
Performance Management Components Basis Effective Annual Deterioration Rate Service life criteria Average Unit Cost and Support Ratio Historic cost data
Target Condition (in 2027) The target is to have all overhead sign structures meet current design standards.
Pavement
The SHS includes approximately 50,000 lane miles of pavement. Caltrans strives to effectively manage the pavement on the SHS at the lowest possible long-term cost. To maintain the health of the system, Caltrans has invested in Ground Penetration Radar (GPR) and the Automated Pavement Condition Survey (APCS) and developed the Pavement Management System (PaveM). APCS uses high definition images and lasers to gather condition data of every lane on the system. This data, along with GPR, is used to assess the pavement health and predict future performance. The accuracy of the predictions is expected to increase as additional surveys are completed. PaveM is “state of the art” technology that stores the APCS imagery and analyzes every mile of pavement. PaveM analysis is based on a project optimization tool that uses pavement condition, pavement type, climate, traffic volumes and project history to propose the right repair treatment at the right time. PaveM recommends future repairs that provide the best value for the least amount of money. Pavement condition is now reported by pavement classification and is assessed based on MAP-21 assessment criteria in the Proposed Rule. MAP-21 assessment criteria requires a different approach than Caltrans has utilized previously. Rather than assessing each condition independently and rating based on a combination of independent conditions, the previous system assessed various elements including ride quality and structural damage to determine pavement condition. Accordingly, only 35-45 percent of all state highway lane miles are in good condition, with 51-58 percent of lane miles in fair condition, and approximately 4-8 percent of lane-miles in poor condition.
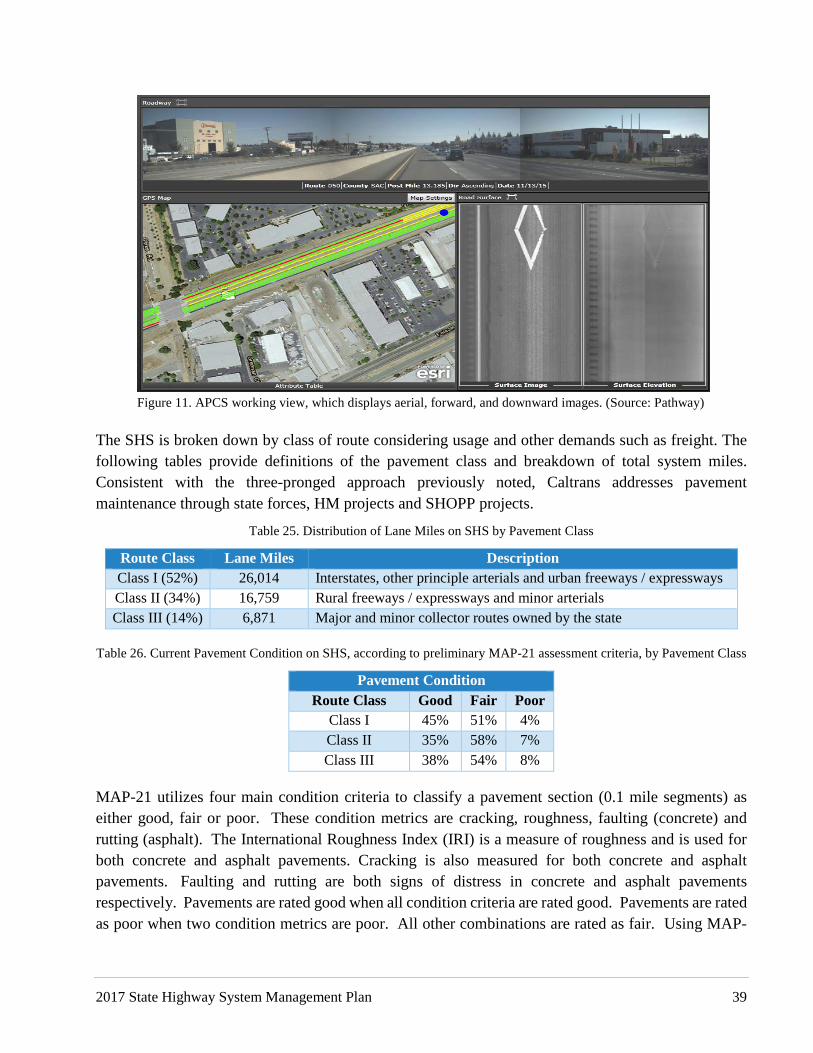
2017 State Highway System Management Plan 39
The SHS is broken down by class of route considering usage and other demands such as freight. The following tables provide definitions of the pavement class and breakdown of total system miles. Consistent with the three-pronged approach previously noted, Caltrans addresses pavement maintenance through state forces, HM projects and SHOPP projects.
Table 25. Distribution of Lane Miles on SHS by Pavement Class
Route Class Lane Miles Description Class I (52%) 26,014 Interstates, other principle arterials and urban freeways / expressways Class II (34%) 16,759 Rural freeways / expressways and minor arterials Class III (14%) 6,871 Major and minor collector routes owned by the state
Table 26. Current Pavement Condition on SHS, according to preliminary MAP-21 assessment criteria, by Pavement Class
Pavement Condition Route Class Good Fair Poor
Class I 45% 51% 4% Class II 35% 58% 7% Class III 38% 54% 8%
MAP-21 utilizes four main condition criteria to classify a pavement section (0.1 mile segments) as either good, fair or poor. These condition metrics are cracking, roughness, faulting (concrete) and rutting (asphalt). The International Roughness Index (IRI) is a measure of roughness and is used for both concrete and asphalt pavements. Cracking is also measured for both concrete and asphalt pavements. Faulting and rutting are both signs of distress in concrete and asphalt pavements respectively. Pavements are rated good when all condition criteria are rated good. Pavements are rated as poor when two condition metrics are poor. All other combinations are rated as fair. Using MAP-
Figure 11. APCS working view, which displays aerial, forward, and downward images. (Source: Pathway)

2017 State Highway System Management Plan 40
21 criteria, as shown in the table above, there is a higher percentage of fair pavements, as compared to good or poor pavements. Performance targets for MAP-21 are tailored by route classification and shown in Table 27.
Table 27. Condition Goals by Pavement Class
Pavement MAP-21 Performance Targets
Route Class Good Fair Poor Class I 60% 39% 1% Class II 55% 43% 2% Class III 45% 53% 2%
The Maintenance Program strives to utilize maintenance resources effectively to slow the deterioration of pavement and maintain the SHS at the lowest possible long-term cost. The SHSMP focuses preservation strategies on pavement conditions which benefit from this philosophy. PaveM is used to identify the best locations and times to perform pavement preservation to minimize future costs in the SHOPP (SHOPP avoidance). Pavements identified in fair condition may be targeted for various preservation, corrective or rehabilitation strategies. The Maintenance Program works to maximize the service life of pavements through both state forces and HM projects. State forces perform maintenance such as crack sealing as well as pot hole and spall repairs. HM projects are utilized to meet longer-term preventive maintenance needs of the SHS. Preventive treatments completed through the HM Program include seal coats, thin asphalt overlays or, for concrete, joint seal installation or replacement. Corrective and preventive maintenance treatments addressed by Maintenance include digouts, cold in-place recycling, grinding, and isolated slab replacements. By efficiently using preventive treatments, Caltrans can avoid more costly repairs in the future. For example, the HM projects awarded in 2013-14 had preventive maintenance costs averaging $123,000 per lane mile. Capital Preventive Maintenance (CAPM) projects involve lower cost minor rehabilitation strategies for pavements that exhibit surface wear due to weather, aging, and traffic and limited or minor structural damage which is more than what can be addressed with HM projects but less than a full pavement rehabilitation. These projects are intended to extend service life for 5-15 years depending on strategy. CAPM strategies typically include pavement grinding to improve smoothness, isolated slab replacements, and thin asphalt overlays. CAPM projects target pavement work only (thus are less expensive than a rehabilitation project that brings a highway up to current standards) but do include low cost safety/maintenance upgrades such as guardrails, worker safety, sign panels, striping, ADA curb ramps, and other items which do not require widening or realigning the roadway. CAPM projects are more costly than an HM project and often require a longer lead-time to prepare the project, due to the inclusion of other work.

2017 State Highway System Management Plan 41
Rehabilitation projects include major rehabilitation and replacement of pavements that have significant structural distress (damage impacting the underlying layers of pavement) due to repeated loading and wear from trucks along with impacts from weather and aging of the pavement. A roadway that is rehabilitated should provide at least 20-40 years of service life with relatively low maintenance expenditures (not requiring an additional SHOPP project during its life cycle). When pavements require major rehabilitation or replacement, it may be appropriate to make operational and performance improvements, such as guardrail modifications, pedestrian and bicycle improvements, storm water or other environmental enhancements, shoulder improvements, and other valued transportation enhancements. These projects may also require expensive environmental and cultural resource mitigation due to impacts. The need for Pavement on the SHS is approximately $18.9 billion from the SHOPP and Maintenance Program over the next ten years. The performance management components which are used to calculate the ten-year need are presented in Appendix B. The basis for these performance management components is stated in the table below.
Table 28. Pavement Performance Management
Performance Management Components Basis Effective Annual Deterioration Rate Pavement management system Average Unit Cost and Support Ratio Historic cost data
Target Condition (in 2027) The target is based on a performance-cost analysis which the CTC adopted.
Relinquishments
The Relinquishment objective provides funding for legislative relinquishments of portions of state highway routes where ownership of the highway segments is transferred to cities and counties when
Chart 7. Displays the deterioration and repair cycle for pavement on the SHS. Currently there is between 35-45 percent of pavement in good condition – which ranges by pavement classification. Approximately 9 percent of pavement in good condition deteriorates to fair condition annually. Of the 51-58 percent of pavement in fair condition, approximately 3-4 percent of the pavement inventory declines to poor condition annually. SHOPP projects address pavement in both fair and poor condition and restore the condition of the asset, while maintenance focuses on maintaining pavement in good condition as well as addressing some pavement in fair condition. It should be noted the deterioration rates are revised based on proposed MAP-21 condition criteria.
2017 State Highway System Management Plan 42
the relinquishments are considered to be “in the best interest of the state”. Benefits to relinquishing facilities that are no longer required to serve regional and statewide needs include: The relinquishment of applicable facilities allow local agencies to be more responsive to
community interests in the administration, planning, construction and operation of that facility. The result is a cost savings to taxpayers by eliminating the need for state encroachment permits.
Reduction of ongoing state maintenance costs.
Reduction in state tort liability.
Decrease in incidence response efforts.
Decreased competition for capital funds for regional and statewide improvements.
When relinquishing a state highway route segment, there may be occasions when it is appropriate for Caltrans to perform work or to provide financial contributions to the recipient agency to ensure that the facility is well-maintained and in operable condition. Additional work or financial contributions may be considered if they are in the best interest of the state. The need for the Relinquishments objective on the SHS is approximately $28.6 million from the SHOPP over the next ten years. The basis for this estimated need is stated in the table below.
Table 29. Relinquishments Performance Management
Performance Management Components Basis Effective Annual Deterioration Rate N/A
Estimated Need The estimated need is based on a multi-year average of recent expenditures.
Target Condition (in 2027) N/A
Roadway Protective Betterments
The Roadway Protective Betterments objective is to protect assets from anticipated future catastrophic damage from natural events such as storms and floods. Example projects include rock slope and rock fall protection, installation of larger diameter culverts, catchment basins and retaining walls. The goal is to address 100 percent of known needs. Unmet needs have high potential for cost increase. The Needs Assessment identified approximately $467 million from the SHOPP over the next ten years. The performance management components which are used to calculate the ten-year need are presented in Appendix B. The basis for these performance management components is stated in the table below.
Table 30. Roadway Protective Betterments Performance Management
Performance Management Components Basis Effective Annual Deterioration Rate N/A (Not a condition-based objective) Average Unit Cost and Support Ratio Historic cost data Target Condition (in 2027) The target is to address all known protective betterment needs.

2017 State Highway System Management Plan 43
Safety Roadside Rest Area Rehabilitation
The Safety Roadside Rest Area (SRRA) Rehabilitation objective is to correct deficiencies, restore existing facilities to a safe condition, and improve capacity and operations at the 86 SRRAs in the SHS. The objective includes addressing the following needs: Compliance with mandates
Operational improvements
On-site capacity expansion (parking and comfort stations)
Existing comfort station or other structural element rehabilitation or replacement
Compliance with ADA and Division of Occupational Safety and Health (Cal/OSHA) regulations
Maintenance facilities, crew rooms, and office space for California Highway Patrol personnel
Utility upgrades (such as photovoltaic energy and water/wastewater)
Ramp upgrades to current design standards
Relocation of existing safety SRRAs
Auxiliary facility construction where expansion and upgrading an existing site is not feasible
Alternative stopping opportunities for freight trucking only
The SRRA objective is to provide new, safe, conveniently spaced stopping opportunities as an integral part of the SHS where the traveler may stop, rest, relax, obtain travel information and return to the highway more alert and driving safely. California law states that SRRA, "should be provided so that,
Figure 13. Buckman Springs Rest Area before and after Construction (San Diego County near Pine Valley)
Figure 12. Catchment Ditch site along Interstate 80 to mitigate future rock slides.
Unstable slopes and narrow shoulders along Route 101 to be cut to mitigate landslide risks.

2017 State Highway System Management Plan 44
in combination with other stopping facilities, there shall be facilities available at intervals of approximately one-half hour's normal driving time." Cal/OSHA standards, California Green Building Standards (CALGreen) Code, Leadership in Energy & Environmental Design (LEED) requirements and other applicable regulatory mandates will be met. A total of nine highway segments have been identified in the 2011 SRRA Master Plan as being in need of new rest area services, with 11 high priority locations identified. Funding for new SRRAs and alternate stopping opportunities has not been available for many years, though there have been some unsuccessful attempts to develop public/private partnerships, including the Federal Highway Administration (FHWA) Interstate Oasis Program and the state Wayside Stop Demonstration Program. The Needs Assessment identified approximately $1.2 billion from the SHOPP over the next ten years.The performance management components which are used to calculate the ten-year need are presented in Appendix B. The basis for these performance management components is stated in the table below.
Table 31. Safety Roadside Rest Area Rehabilitation Performance Management
Performance Management Components Basis Effective Annual Deterioration Rate Service life criteria Average Unit Cost and Support Ratio Historic cost data
Target Condition (in 2027) The target is to correct all deficiencies, restore all facilities to a safe condition, and improve their capacity and operations.
Transportation Related Facilities
The Transportation Related Facility (TRF) objective includes correcting building and site deficiencies associated with worker safety, Cal/OSHA and ADA as well as improve operational efficiency at equipment facilities, maintenance facilities, transportation management centers and transportation material and testing laboratories. Approximately 21 percent of the four million TRF building square footage is in good condition, 15 percent is in fair condition and 64 percent is in poor condition. The goal is to have no TRFs in a poor condition. The need for this objective over the next ten years is approximately $2.4 billion. The performance management components which are used to calculate the ten-year need are presented in Appendix B. The basis for these performance management components is stated in the table below.
Figure 14. El Centro Maintenance Station and Equipment Sub-Shop after Relocation in 2016
El Centro Maintenance Station and Equipment Sub-Shop Constructed In 1935.

2017 State Highway System Management Plan 45
Table 32. Transportation Related Facility Performance Management
Performance Management Components Basis Effective Annual Deterioration Rate Service life criteria Average Unit Cost and Support Ratio Historic cost data
Target Condition (in 2027) The target is to have all workplace locations free of conditional failures, such as fire, life safety, or operational issues.
Water and Wastewater Treatment at SRRAs
The Water/Waste Water Treatment objective is to maintain the traveler safety benefits provided by the SRRA System by preventing closures due to noncompliance with drinking water quality and waste water treatment standards. All ADA and structural deficiencies at SRRAs are identified through the SRRA Rehabilitation element. The identified need is approximately $96 million from the SHOPP over the next ten years. The performance management components which are used to calculate the ten-year need are presented in Appendix B. The basis for these performance management components is stated in the table below.
Table 33. Water/Waste Water Treatment Performance Management
Performance Management Components Basis Effective Annual Deterioration Rate Service life criteria Average Unit Cost and Support Ratio Historic cost data
Target Condition (in 2027) The target is to comply with drinking and waste water quality standards.

2017 State Highway System Management Plan 46
Sustainability
Sustainability activities cover a broad spectrum of work that is intended to minimize transportation system impacts on the environment and communities, improve transportation system resiliency, improve the livability of California residents and improve economic prosperity associated with freight movement. Example sustainability activities include: Make transportation accessible for all Californians
Integration of bicycle, transit and pedestrian mode choices for transportation
Minimize transportation impacts on air quality, water quality and wildlife
Improve the resiliency of the transportation system to extreme events and climate change
Make freight improvements to improve prosperity
Collectively, the sustainability activities strive to improve the quality of life in California by making responsible transportation decisions that will be sustainable for future generations. A number of the activities included within the sustainability area have specific legal or permit requirements that mandate minimum investment levels. Failure to adhere to mandated requirements could have future legal implications and condition and performance ramifications that could negatively impact transportation in California. Failure to reduce transportation related pollution and biological impacts is not sustainable for future generations of Californians.
Americans with Disabilities Act Pedestrian Infrastructure
Pedestrian facilities include such things as sidewalks, pedestrian overcrossings and undercrossings, park and ride lots, SRRAs, and accessible pedestrian signals. Unlike other assets, with regards to ADA compliance, pedestrian facilities are either compliant or noncompliant. There is no intermediate condition. There are currently approximately 208,000 noncompliant elements within our pedestrian facilities statewide. This objective is not only mandated by state and federal law, but Caltrans is also under requirements of
the Californians for Disability Rights, Inc. v. California Department of Transportation (2010), Case No.: C 06 5125. This settlement agreement requires $1.1 billion be spent over a 30-year period beginning in 2010-11 towards the following types of activities: Project development and construction costs (including staffing costs) associated with the
covered program access improvements.
Establish and maintain accessibility grievance procedure, including a system to process other access requests.
Figure 15. ADA-Compliant Sidewalk

2017 State Highway System Management Plan 47
The annual requirement increases incrementally from $25 million for the first five years to $45 million for the last five fiscal years. For each year the required amount is not met, the remained rolls over to the next fiscal year. Funding from the SHOPP for these projects has been increasing. As the amount exceeds the required settlement amount, it is anticipated that Caltrans will catch up and exceed the settlement agreement requirements in 2018-19.The need for ADA Pedestrian Infrastructure on the SHS is approximately $972 million from the SHOPP over the next ten years. The performance management components which are used to calculate the ten-year need are presented in Appendix B. The basis for these performance management components is stated in the table below.
Table 34. ADA Pedestrian Infrastructure Performance Management
Performance Management Components Basis Effective Annual Deterioration Rate N/A (Not a condition-based objective) Average Unit Cost and Support Ratio Historic cost data
Target Condition (in 2027) The target is to comply with the settlement of the ADA class action lawsuit.
Advance Mitigation
The Advance Mitigation objective includes developing stand-alone compensatory mitigation projects that will help ensure that the right type and quantity of environmental mitigation is available for future transportation projects, in advance of funding those transportation projects. Currently, the statutory requirement for compensatory mitigation due to unavoidable impacts to jurisdictional resources can significantly increase the uncertainty related to a project’s scope, schedule and cost. Having available mitigation reserves in place reduces the risk to a transportation project’s cost and schedule associated with securing environmental permits and/or compensatory mitigation. The means to implement advance mitigation include, but are not limited to, conservation banks or mitigation banks (either by creating new banks or through bulk credit purchases from existing banks), in-lieu fee programs, property transfers and permittee responsible mitigation (i.e. mitigation on public or private lands). The goal is based on the acreage of estimated potential compensatory mitigation need for the transportation projects in the SHSMP. The need for Advance
Figure 16. Highway 89 Stewardship Team project is the second in a series of planned mitigation and research efforts. Two concrete box tunnels and 1.3 miles of wildlife fencing guide animals to safely pass under the highway.

2017 State Highway System Management Plan 48
Mitigation is approximately $300 million from the SHOPP over the next ten years. The basis for this estimated need is stated in the table below.
Table 35. Advance Mitigation Performance Management
Performance Management Components Basis Effective Annual Deterioration Rate N/A
Estimated Need The estimated need is informed by long range plans and mitigation needs assessments. The magnitude of the need has been set in budget and legislative language.
Target Condition (in 2027) N/A
Bridge Scour Mitigation
The Bridge Scour Mitigation objective is to prevent catastrophic bridge failures from natural disasters such as floods and storm events. Bridge Scour Mitigation addresses bridges over water whose bridge foundations have been determined to be unstable for potential assessed or calculated scour conditions (scour critical) per federal guidelines. In past SHOPP documents, the performance measure for bridges has been the number of distressed bridges. Similar to MAP-21 Bridge Health requirements, the performance measure for Bridge Scour Mitigation has changed to a deficiency model of total deck area of the structures in poor condition (scour critical). There are over 13,160 bridges on the SHS totaling over 245 million square feet of bridge deck area. There is an existing scour critical deficiency of 1.4 million square feet of bridge deck area. Ideally, the goal of this objective would be to address all identified scour critical (poor) bridges but due to the dynamic nature of identification of scour critical bridges (major flooding or storm events) and the time required for the project delivery process, it is not realistic to assume that at the end of the ten-year cycle all scour critical bridges would be addressed. Therefore, the Bridge Scour Mitigation target is to reduce scour critical bridges to 10 percent of the projected ten-year scour critical need. The need for Bridge Scour Mitigation is approximately $847 million, which includes both
Capell Creek Critical Scour before and after
Interstate 10 Tex Wash Bridge Damage before Replacement
Figure 17. Interstate 10 Tex Wash Bridge after Replacement

2017 State Highway System Management Plan 49
needs currently being addressed through the project development process and the existing and projected performance gap. This increase from previous SHOPP documents reflects updated scour assessments of bridges following the collapse of the Tex Wash Bridge on Interstate 10 in July 2015. The performance management components which are used to calculate the ten-year need are presented in Appendix B. The basis for these performance management components is stated in the table below.
Table 36. Bridge Scour Mitigation Performance Management
Performance Management Components Basis Effective Annual Deterioration Rate N/A (Not a condition-based objective) Average Unit Cost and Support Ratio Historic cost data
Target Condition (in 2027)
The goal is to have no scour critical bridges, but due to additional scour identification after significant storm events and due to the length of the project development process, the target has been set to eliminating 90% of scour critical bridges.
Bridge Seismic Restoration
The Bridge Seismic Restoration objective is to prevent catastrophic bridge failures from seismic events (earthquakes). Bridge Seismic Restoration addresses bridges that have been determined to be vulnerable to potential seismic activity through screening processes implemented by Caltrans’ Office of Earthquake Engineering. A rescreening of potentially seismically vulnerable bridges was completed in 2015 to evaluate these bridges based on updated seismic criteria.
In past SHOPP documents, the performance measure for bridges has been the number of distressed bridges. Similar to MAP-21 Bridge Health requirements, the performance measure for Bridge Seismic Restoration has changed to a deficiency model of total deck area of the structures in poor condition (seismically vulnerable). There is an existing seismic vulnerability of approximately 16 million square feet of bridge deck area. Ideally, the goal of the Bridge Seismic Restoration objective would be to address all seismically vulnerable (poor) bridges identified in the preliminary screening process. The screening process is a preliminary review of bridges that may be seismically vulnerable based on the element configuration of the structure and the surrounding soil prior to detailed seismic analyses being completed. Because bridges identified in the screening process may be found to not require seismic restoration during detailed seismic analysis and due to the length of the time required for the project delivery process, it is not realistic to assume that at the end of the ten-year cycle all currently identified seismically vulnerable bridges would be addressed. Therefore, the Bridge Seismic Restoration target is to reduce seismically vulnerable bridges to 30 percent of the
Figure 18. Trinidad Rd Undercrossing before and after Repair

2017 State Highway System Management Plan 50
projected ten-year seismic need. The need for Bridge Seismic Restoration is over $3 billion which includes both needs currently being addressed through the project development process and the existing and projected performance gap. This increase from previous SHOPP documents reflects the updated seismic rescreening of vulnerable bridges completed in 2015. The performance management components which are used to calculate the ten-year need are presented in Appendix B. The basis for these performance management components is stated in the table below.
Table 37. Bridge Seismic Restoration Performance Management
Performance Management Components Basis Effective Annual Deterioration Rate N/A (Not a condition-based objective) Average Unit Cost and Support Ratio Historic cost data
Target Condition (in 2027)
The goal is to have no seismically vulnerable bridges, but due to the historical trend of bridges found not to be seismically vulnerable under a full seismic analysis and due to the length of the project development process, the target has been set to eliminating 70% of seismically vulnerable bridges.
Hazardous Waste Mitigation
The Hazardous Waste Mitigation objective includes removal of underground storage tanks at maintenance stations and Caltrans owned properties, placement of above ground tanks, removal and disposal of contaminated soil and materials, construction and removal of remediation systems, and cleanup of hazardous waste contamination on Caltrans owned properties and right of way. This is a SHOPP reservation program used to ensure contaminated Caltrans facilities and rights-of-way are mitigated to achieve compliance with federal and state regulatory requirements. Funds are set aside to address hazardous waste mitigation needs as they arise. Funded activities are mandated owner operator responsibilities. Projects include stand-alone construction activities addressing the removal and retrofit of maintenance station underground storage tanks, contaminant removal actions and the construction of mitigation and monitoring systems. The requirements for hazardous waste mitigation fluctuate significantly year to year due to new regulatory mandates and directives and newly identified violations of regulatory requirements. Violation of the federal and state hazardous waste control laws and regulations may result in administrative civil penalties, regulatory orders, federal civil penalties, citizens’ law suits and potential criminal charges. Violations may lead to the loss of credibility with regulatory agencies, causing project delivery delays and increased project costs. The risk level and financial impact is high and may include penalties of up to $25,000 per day per violation. The need for Hazardous Waste Mitigation is approximately $5 million from the SHOPP over the next ten years. The basis for this estimated need is stated in the table below.
Table 38. Hazardous Waste Mitigation Performance Management
Performance Management Components Basis Effective Annual Deterioration Rate N/A
Estimated Need The estimated need includes only the pipelined work. No additional need has been identified.
Target Condition (in 2027) N/A

2017 State Highway System Management Plan 51
Roadside Rehabilitation
The Roadside Rehabilitation objective is to reduce the long-term maintenance costs of highway planting roadside infrastructure, and provide for replacement, restoration, and rehabilitation of almost 30,000 acres of existing highway planting to an economically maintainable state following damage by weather, acts of nature, or deterioration. This element includes improvements for water conservation, worker safety, and aesthetics: Upgrade to more water efficient irrigation systems to achieve a reduction in water consumption.
Improvements for the purpose of water conservation.
Convert systems to meet departmental goal of 100 percent recycled water use by 2036.
Erosion control to comply with Caltrans National Pollution Discharge Elimination System permit requirements.
Implement strategies to improve worker and traveler safety by reducing the frequency and duration of maintenance workers’ exposure to traffic.
Improve roadside appearance and coordination with community character.
It is also the purpose of this objective to perform roadside protection and restoration objective which means to enhance, preserve or restore scenic and native landscape areas within or near roadsides, improve corridor functionality, reduce highway facility life cycle costs and improve worker safety, and comply with the following regulatory agency mandates: Surface Mining and Reclamation Act of 1975 and Storm Water Construction General Permit
regulations
Figure 20. Recycled water project designed to improve water conservation using SMART controllers that enable efficient water usage to maintain roadside landscaping.
Underground Storage Tank Removed During a Remediation Project
Figure 19. Dorris Maintenance Station Soil Vapor Extraction System (State Route 97, Siskiyou County)

2017 State Highway System Management Plan 52
Fish passage remediation when not part of bridge or culvert replacement work
Wildlife preservation and protection
Biological connectivity
Relinquishment of environmental mitigation sites
Restoration of unsuccessful environmental mitigation sites
Securing environmental resources that are in high demand but short supply
Roadside ecological viewing areas
Rehabilitation of vista points
Scenic enhancements
Elimination of qualifying junkyards
Nonconforming outdoor advertising sign removal
The identified need of this objective is approximately $2 billion from the SHOPP over the next ten years. The performance management components which are used to calculate the ten-year need are presented in Appendix B. The basis for these performance management components is stated in the table below.
Table 39. Roadside Rehabilitation Performance Management
Performance Management Components Basis Effective Annual Deterioration Rate Service life criteria Average Unit Cost and Support Ratio Historic cost data
Target Condition (in 2027) The target is to reduce the long-term cost of maintaining roadside planting infrastructure.
Storm Water Mitigation
The goal of this objective is to ensure Caltrans’ storm water discharges to California and federal waters meet applicable water quality standards, through construction of control measures to meet the current National Pollutant Discharge Elimination System (NPDES) permit requirements and other state and federal laws, such as the Porter-Cologne Water Quality Control Act, the Clean Water Act (CWA) and evolving storm water requirements. The NPDES permit mandates Caltrans to achieve a minimum of 33,000 compliance units (CUs) over a 20 year window starting from 2014-15 or 1,650 CUs annually1 within the 84 Total Maximum Daily Loads (TMDLs)2 as well as Areas of Special Biological Significance (ASBS). The Caltrans NPDES Permit also requires retrofits (storm water specific projects) for the location specific requirements and ASBS discharge areas. Failure to achieve annual
1 One CU is equivalent to one acre of Caltrans right of way treated for a given pollutant or pollutants in a TMDL watershed for which Caltrans has been identified as a stakeholder. 2 TMDL is defined as maximum amount of a pollutant that a water body can receive and still meet water quality standards. These are developed by either of the 9 RWQCBs, SWRCB, or United States Environmental Protection Agency (USEPA) pursuant to state and federal requirements to attain the water quality standards for a specific water body.

2017 State Highway System Management Plan 53
CU requirements could result in NPDES permit noncompliance and increased project delivery costs, including penalties3. In addition, CUs will accumulate and be added to the 1,650 CU requirement in the following year resulting in the risk of subsequent enforcement actions. Violation of the CWA and the Porter-Cologne Water Quality Act and their implementing permits and regulations may result in substantial administrative civil liabilities, regulatory enforcement actions, and lawsuits. The requirements of the storm water regulations are dynamic in nature. CUs are expected to increase as new TMDLs are adopted by the State Water Resources Control Board (SWRCB) and incorporated into subsequent Caltrans NPDES Permit cycles (every five years). In consultation with the SWRCB, Caltrans uses the following four methods to achieve CUs:
1. Caltrans SHOPP Storm Water projects (storm water mitigation stand-alone projects).
2. Caltrans SHOPP Storm Water funding contribution only (FCO) projects, in partnership with locals.
3. Other SHOPP projects such as fish passage projects and projects that include post construction storm water best management practices (BMPs).
4. Other Non-SHOPP, Cooperative Implementation Agreements (CIAs) that provide funding for local agency projects.
Caltrans prioritizes its storm water related activities and addresses TMDLs through implementation of source control measures, BMPs and CIAs. Caltrans will utilize asset management principles and multi-objective decision analysis during project planning and programming to optimize the achievement of CUs through the SHOPP program. Caltrans will continue to collaborate with the SWRCB and Regional Water Quality Control Boards (RWQCB) to achieve maximum water quality benefit economically and efficiently through CIAs and SHOPP program. The identified need of this objective is approximately $3.4 billion from the SHOPP, CIAs, and all other sources over the next ten years. The performance management components which are used to calculate the ten-year need are presented in Appendix B. The basis for these performance management components is stated in the table below.
Table 40. Storm Water Mitigation Performance Management
Performance Management Components Basis Effective Annual Deterioration Rate N/A (Not a condition-based objective) Average Unit Cost and Support Ratio Historic cost data Target Condition (in 2027) The target is to comply with the NPDES permit.
Zero Emission Vehicle Infrastructure
In 2012, Governor Brown issued Executive Order B-16-12 directing state government agencies to help accelerate the consumer market for zero-emission vehicles (ZEV) in California. The Executive Order called for 1.5 million ZEVs in California by 2025 and established several milestones on the pathway toward this target. In October 2016, the Governor’s Office released its updated ZEV Action Plan, setting new strategies and targets to help accelerate the adoption of zero-emission technologies in
3 Penalties for violating the CWA may include both fines up to $50,000 a day for each violation and imprisonment.

2017 State Highway System Management Plan 54
California. Chapter 5, Statutes of 2017 (SB1), gives Caltrans explicit authority to apply SHOPP funds toward ZEV infrastructure. Specifically, SB1 Chapter 2, section 2030, subsection (d) states: “To the extent possible and cost effective, and where feasible, the department and cities and counties receiving funds under the program shall use advanced technologies and communications systems in transportation infrastructure that recognize and accommodate advanced automotive technologies that may include, but are not necessarily limited to, charging or fueling opportunities for zero-emission vehicles, and provision of infrastructure-to-vehicle communications for transitional or full autonomous vehicle systems.” Consistent with the actions in the Governors ZEV Action Plan, Caltrans will be installing publically accessible DC fast-charging stations for Electric Vehicles (EV) at a minimum of 30 Caltrans owned locations by December 2018. The need for the ZEV Infrastructure objective is $15 million from the SHOPP over the next ten years. The performance management components which are used to calculate the ten-year need are presented in Appendix B. The basis for these performance management components is stated in the table below.
Table 41. Zero Emission Vehicle Infrastructure Performance Management
Performance Management Components Basis Effective Annual Deterioration Rate N/A (Not a condition-based objective) Average Unit Cost and Support Ratio Historic cost data Target Condition (in 2027) The target is to comply with the Governor’s ZEV Action Plan.
Complete Streets and Climate Change
Executive Order B-30-15 requires all state investments to take greenhouse gas (GHG) reductions and climate change into consideration. In January 2016, Caltrans executive management issued a memo to immediately include project-level performance including complete streets and GHG emissions in the SHOPP. Over the past year, the Caltrans Division of Transportation Planning began quantifying GHG emissions using the Federal Highway Administration Infrastructure Carbon Estimator tool during project initiation document (PID) development. In addition, the Performance Tab of the SHOPP Tool database was modified to enable Caltrans to track the implementation of complete streets and climate change elements, including mitigated and unmitigated GHG emissions. For projects to be programmed in the 2018 and 2020 SHOPP cycles they must now document how complete streets and climate change elements were considered during the development of the Project Initiation Document (PID) with the goal of including complete streets elements in projects where these elements are feasible. For example, we can include complete streets elements on freeway projects that include ramps or projects along sections of freeway where bicyclists are not prohibited. This effort requires additional analysis and extensive collaboration with local and regional agencies to develop projects that consider all modes of travel including bicycles and pedestrians.
Figure 21. Public DC Fast Charging Station at the Del Lago Park and Ride in Escondido, CA

2017 State Highway System Management Plan 55
The majority of improvements for bicycle and pedestrian access on state facilities are incorporated in bridge, mobility, pavement, and safety SHOPP projects. The most common elements are curb ramps, sidewalk improvements, pedestrian signals, and enhanced crosswalk visibility. Complete street elements, such as a sidewalk or a bike lane, require acquisition of right-of-way and environmental considerations, so it is very important that these elements are considered early-on to determine the level of analysis and funding required for the project. Caltrans Strategic Management Plan calls for the percentage of projects with complete streets features to increase by 20 percent from a 2016 baseline. Asset management will result in multi-objective SHOPP projects that consistently include complete streets and climate change elements. By moving towards asset management and breaking down SHOPP program silos, Caltrans will be better aligned to work collaboratively across Caltrans functional units, and work with local and regional partners to serve all users of the transportation system and maximize efficiency in the development of SHOPP projects. Complete streets and climate change project features do not have fiscal performance goals and targets because these project aspects are expected to be incorporated within all projects as applicable.
Figure 22. LA 110 SB Onramp from W. Manchester Avenue
2017 State Highway System Management Plan 56
System Performance and Operation System performance activities focus on increasing mode choice, providing reliable travel times, improving goods movement and minimizing delay associated with congestion. Activities that improve the transportation system performance include: Maintain adequate signage
Improve highway system traffic flow using transportation management systems
Installation of cameras and monitoring system to help minimize non-recurrent delay
Construction of truck climbing lanes, acceleration and deceleration lane and interchange weave lanes
Installation of ramp meters and connected corridors
The noted activities are all designed to maximize the capacity of the existing transportation system footprint because available funding programs for the maintenance, rehabilitation and replacement of transportation assets prohibit the expansion of the highway system lanes and the state’s priorities have shifted away from adding new highway lanes to making the most efficient use of the existing system and diversifying mode choice. Many of the system performance activities also help to improve freight movement that benefits California’s businesses and consumers and provides increased employment opportunities. Failure to adequately invest in system performance activities would result in greater congestion, less reliable travel and a less favorable business climate.
Commercial Vehicle Enforcement Facilities
The Commercial Vehicle Enforcement Facilities (CVEF) objective includes truck weight and inspection stations where the California Highway Patrol monitors and inspects trucks using the SHS to ensure that they are operating safely, licensed properly, and have legal size and weight, which ensures that bridge and pavement assets are not damaged prematurely by overloaded trucks. These facilities are owned by Caltrans and operated by California Highway Patrol personnel. By agreement, both agencies work cooperatively to ensure that the facilities are safe and functional for the staff and public. There are 54 enforcement stations in California, and 85 percent are currently in fair condition, meaning that there are identified needs which must be met to bring the facilities up to good operational condition. The goal for the Commercial Vehicle Enforcement Facility objective is to have no facilities in poor condition. The need for CVEF is $129 million from the SHOPP over the next ten years. The performance management components which are used to calculate the ten-year need are presented in Appendix B. The basis for these performance management components is stated in the table below.
Table 42. Commercial Vehicle Enforcement Facilities Performance Management
Performance Management Components Basis Effective Annual Deterioration Rate Service life criteria Average Unit Cost and Support Ratio Historic cost data
Target Condition (in 2027) The target is to eliminate the potential of unsafe facilities for the Caltrans and CHP staff.
2017 State Highway System Management Plan 57
Operational Improvements
The Operational Improvement objective includes projects which reduce highway user delay by building improvements which alleviate localized congestion on the SHS. Typical improvements include intersection improvements, acceleration or deceleration lanes, shoulder widening, truck climbing lanes and auxiliary lanes which facilitate traffic merging or weaving. All improvements use a cost-benefit analysis to verify that the delay benefits are justified by the project cost. Delay is calculated by adding up the amount of time vehicles spend below 35mph on the SHS, (totaling more than one million hours daily in the fourth quarter of 2015 with an economic impact of almost $17 million per day). The goal for this objective is to mitigate or reduce 10 percent of vehicle delay over ten years. The need for Operational Improvements on the SHS is approximately $933 million from SHOPP over the next ten years. The performance management components which are used to calculate the ten-year need are presented in Appendix B. The basis for these performance management components is stated in the table below.
Table 43. Operational Improvement Performance Management
Performance Management Components Basis Effective Annual Deterioration Rate N/A (Not a condition-based objective) Average Unit Cost and Support Ratio Historic cost data
Target Condition (in 2027) The target is to reach the system performance goals which are stated in the Strategic Management Plan 2015-2020.
Sign Panel Replacement
The Sign Panel Replacement objective is to replace all large overhead and roadside signs to meet federal requirements for retro-reflectivity which reduces the need for overhead sign lighting. Federal requirements for retro-reflectivity are in place to ensure that signs are visible even during night and in inclement weather. The goal is to replace all signs with the current standard for high performance retro-reflective sheeting. The use of this type of sheeting will increase sign service life to between 15-20 years. This will reduce annual replacement needs. Removal of the catwalks should reduce the potential for graffiti and the need for graffiti mitigation. In addition, the elimination of overhead sign lighting will reduce Caltrans’ maintenance and utility costs and contribute to Caltrans’ goal for reduced GHG footprint. There are approximately 87,000 large sign panels on the state’s highways. Current rehabilitation efforts are replacing about 8,000 of those panels. There is a need to replace the other 79,000. The goal is to replace all of these sign panels. The need is $700 million over the ten years from SHOPP. The Maintenance Program replaces signs as they get damaged. The rate of damage is not a significant factor in sign replacement for these larger signs. The performance management components which are used to calculate the ten-year need are presented in Appendix B. The basis for these performance management components is stated in the table below.
Table 44. Sign Panel Replacement Performance Management
Performance Management Components Basis Effective Annual Deterioration Rate Service life criteria Average Unit Cost and Support Ratio Historic cost data Target Condition (in 2027) The target is to replace all sign panels with retroreflective backgrounds.
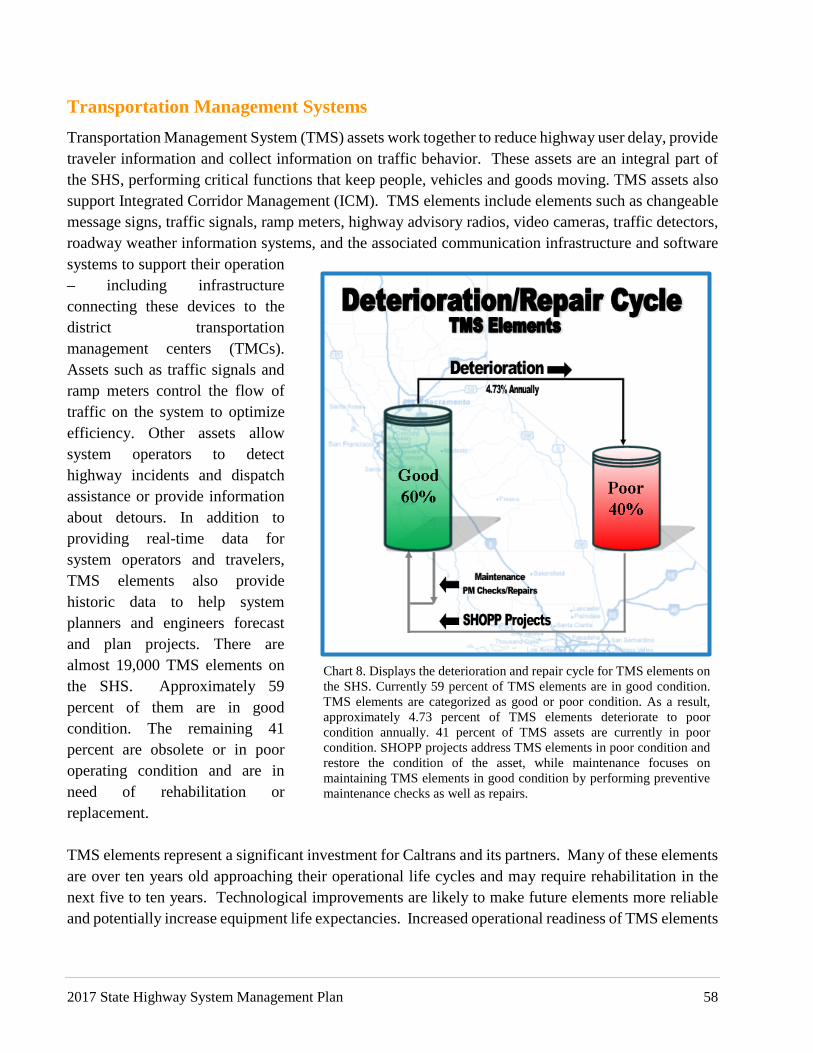
2017 State Highway System Management Plan 58
Transportation Management Systems
Transportation Management System (TMS) assets work together to reduce highway user delay, provide traveler information and collect information on traffic behavior. These assets are an integral part of the SHS, performing critical functions that keep people, vehicles and goods moving. TMS assets also support Integrated Corridor Management (ICM). TMS elements include elements such as changeable message signs, traffic signals, ramp meters, highway advisory radios, video cameras, traffic detectors, roadway weather information systems, and the associated communication infrastructure and software systems to support their operation – including infrastructure connecting these devices to the district transportation management centers (TMCs). Assets such as traffic signals and ramp meters control the flow of traffic on the system to optimize efficiency. Other assets allow system operators to detect highway incidents and dispatch assistance or provide information about detours. In addition to providing real-time data for system operators and travelers, TMS elements also provide historic data to help system planners and engineers forecast and plan projects. There are almost 19,000 TMS elements on the SHS. Approximately 59 percent of them are in good condition. The remaining 41 percent are obsolete or in poor operating condition and are in need of rehabilitation or replacement. TMS elements represent a significant investment for Caltrans and its partners. Many of these elements are over ten years old approaching their operational life cycles and may require rehabilitation in the next five to ten years. Technological improvements are likely to make future elements more reliable and potentially increase equipment life expectancies. Increased operational readiness of TMS elements
Chart 8. Displays the deterioration and repair cycle for TMS elements on the SHS. Currently 59 percent of TMS elements are in good condition. TMS elements are categorized as good or poor condition. As a result, approximately 4.73 percent of TMS elements deteriorate to poor condition annually. 41 percent of TMS assets are currently in poor condition. SHOPP projects address TMS elements in poor condition and restore the condition of the asset, while maintenance focuses on maintaining TMS elements in good condition by performing preventive maintenance checks as well as repairs.

2017 State Highway System Management Plan 59
will increase performance of the SHS and reduce congestion. TMS elements also require continuous maintenance to realize the operational benefits they are designed to achieve. The Maintenance Program is responsible for maintaining these devices and communication links that ensure safety and provide real-time information to improve mobility throughout California. Preventive Maintenance is performed on a regular basis to keep equipment in good working order and reach maximum service life. TMS elements on the SHS require over 80,000 preventive maintenance checks and repairs annually to ensure maximum operability. Maintenance utilizes a combination of state forces and on-call service contracts to maintain TMS elements. State forces address preventive maintenance checks and repairs for the majority of field elements such as traffic signals and ramp meters as well as other TMS elements. On-call service contracts are used for overflow repairs beyond the scope of our maintenance crews and are also used for the field elements associated with the Traffic Operations Systems Network (TOSNET) which include the maintenance of wireless assets, fiber optic cables, copper cable, and communications hubs. Without preventive maintenance, TMS elements may not function properly, and may not provide reliable data to the TMCs or be able to provide accurate and reliable information to the motoring public. TMS projects completed in the SHOPP are larger in scale and typically address assets which are at end of life, obsolete, or otherwise non-functional. These projects could include system failures, systemic repairs, replacements, or upgrades. The goal of this objective is to leave no more than 10% of the TMS elements in a poor or obsolete condition. The identified need is approximately $1.8 billion from the SHOPP over the next ten years. The performance management components which are used to calculate the ten-year need are presented in Appendix B. The basis for these performance management components is stated in the table below.
Table 45. Transportation Management System Performance Management
Performance Management Components Basis Effective Annual Deterioration Rate Service life criteria Average Unit Cost and Support Ratio Historic cost data
Target Condition (in 2027) The target is based on a performance-cost analysis which the CTC adopted.
Bridge Goods Movement Upgrades
The Bridge Goods Movement Upgrades objective is to identify and address geometric restrictions to permit vehicle traffic on the SHS. Bridge Goods Movement Upgrades address restrictions from reduced vertical clearance as established in the Caltrans’ Highway Design Manual and load capacity restrictions as identified in federal guidelines. In past SHOPP documents, the performance measure for bridges has been the number of distressed bridges. Similar to MAP-21 Bridge Health requirements, the performance measure for Bridge Goods Movement Upgrades has changed to total deck area of the structures in good, fair, or poor condition.

2017 State Highway System Management Plan 60
For Bridge Goods Movement Upgrades, approximately 79 percent of the deck area does not require upgrade (good condition), 8 percent in fair condition, and 13 percent in poor condition. The emphasis of this objective is to address poor condition bridges impacting Interstate mainline traffic. As this is the first time restrictions to permit vehicle traffic have been fully identified, the need substantially exceeds what could be realistically funded or delivered for this objective. The established target is to reduce the inventory to 10 percent of bridges in poor condition for goods movement restrictions. The identified need for Bridge Goods Movement Upgrades is approximately $5.9 billion which includes both needs currently being addressed through the project development process and the existing and projected performance gap. This increase from previous SHOPP documents reflects a proactive system wide approach to goods movement restrictions. The performance management components which are used to calculate the ten-year need are presented in Appendix B. The basis for these performance management components is stated in the table below.
Table 46. Bridge Goods Movement Upgrades Performance Management
Performance Management Components Basis Effective Annual Deterioration Rate N/A (Not a condition-based objective) Average Unit Cost and Support Ratio Historic cost data
Target Condition (in 2027) The target is to eliminate restrictions affecting permit vehicle traffic on high truck volume routes of the SHS caused by bridges with insufficient vertical clearance or reduced load capacity.
Weigh-In-Motion Scales
Weigh-In-Motion (WIM) devices are scales in the pavement which weigh vehicles at highway speeds on the mainline highway. These systems are able to calculate the gross vehicle weight of any car or truck, as well as measure the individual axle weights and spacing to determine the vehicle classification. This information is used to fulfil federal mandates, determine enforcement needs, to collect data needed to calculate bridge and pavement needs, and to better perform safety analysis and meet the special needs of trucks. There are 176 WIM stations on the SHS which includes 642 lanes of instrumentation and associated WIM pavement. The goal for the Weigh-In-Motion objective is to have 90 percent of the units in good condition. The identified need for WIM Scales is $379 million from SHOPP over the next ten years. The performance management components which are used to calculate the ten-year need are presented in Appendix B. The basis for these performance management components is stated in the table below.
Figure 23. Walters Road Overcrossing before and after Repair
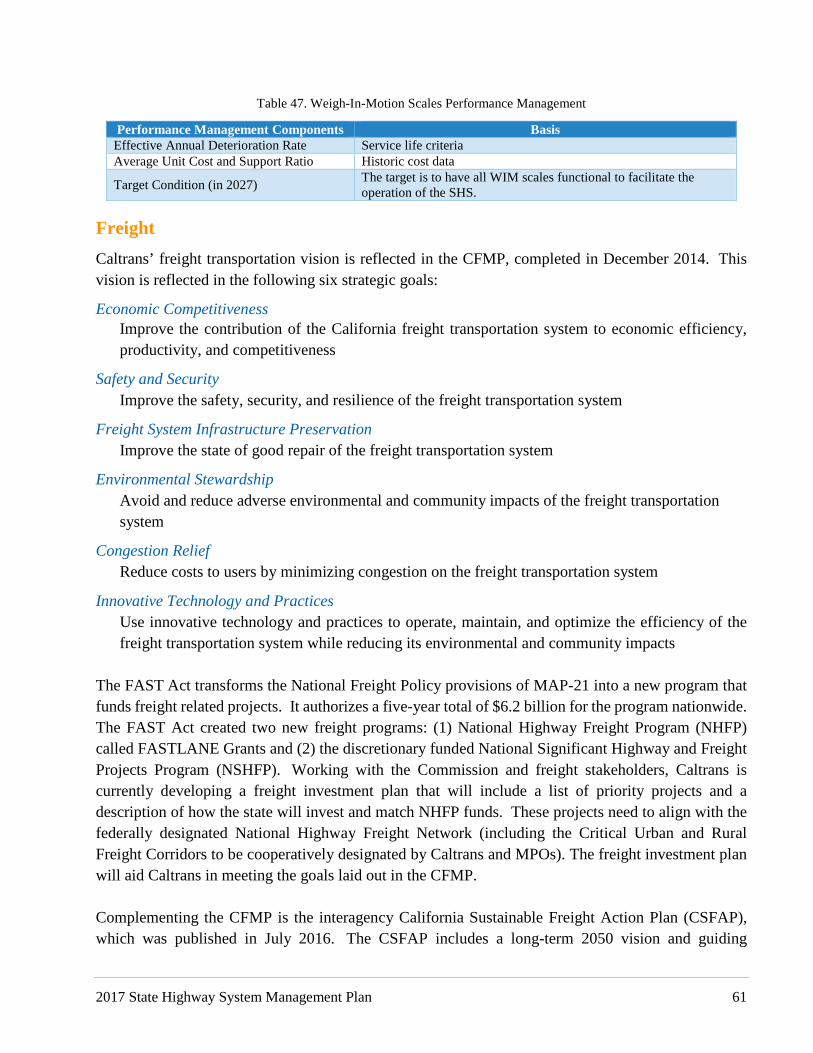
2017 State Highway System Management Plan 61
Table 47. Weigh-In-Motion Scales Performance Management
Performance Management Components Basis Effective Annual Deterioration Rate Service life criteria Average Unit Cost and Support Ratio Historic cost data
Target Condition (in 2027) The target is to have all WIM scales functional to facilitate the operation of the SHS.
Freight
Caltrans’ freight transportation vision is reflected in the CFMP, completed in December 2014. This vision is reflected in the following six strategic goals:
Economic Competitiveness Improve the contribution of the California freight transportation system to economic efficiency, productivity, and competitiveness
Safety and Security Improve the safety, security, and resilience of the freight transportation system
Freight System Infrastructure Preservation Improve the state of good repair of the freight transportation system
Environmental Stewardship Avoid and reduce adverse environmental and community impacts of the freight transportation system
Congestion Relief Reduce costs to users by minimizing congestion on the freight transportation system
Innovative Technology and Practices Use innovative technology and practices to operate, maintain, and optimize the efficiency of the freight transportation system while reducing its environmental and community impacts
The FAST Act transforms the National Freight Policy provisions of MAP-21 into a new program that funds freight related projects. It authorizes a five-year total of $6.2 billion for the program nationwide. The FAST Act created two new freight programs: (1) National Highway Freight Program (NHFP) called FASTLANE Grants and (2) the discretionary funded National Significant Highway and Freight Projects Program (NSHFP). Working with the Commission and freight stakeholders, Caltrans is currently developing a freight investment plan that will include a list of priority projects and a description of how the state will invest and match NHFP funds. These projects need to align with the federally designated National Highway Freight Network (including the Critical Urban and Rural Freight Corridors to be cooperatively designated by Caltrans and MPOs). The freight investment plan will aid Caltrans in meeting the goals laid out in the CFMP. Complementing the CFMP is the interagency California Sustainable Freight Action Plan (CSFAP), which was published in July 2016. The CSFAP includes a long-term 2050 vision and guiding

2017 State Highway System Management Plan 62
principles for California’s future freight transport system along with targets for 2030. The objectives of the plan are laid out in the Governor’s Executive Order B-32-15, which seeks to improve freight efficiency, transition to zero-emission technologies, and increase competitiveness of California’s freight system. This transition of California’s freight transport system is essential to supporting the state’s economic development in coming decades while reducing harmful pollution that affects many California communities.

2017 State Highway System Management Plan 63
Organizational Excellence
The Organizational Excellence goal’s influence on the SHSMP is in how Caltrans carries out its work regardless of the type of work. These overarching principles will result in better project planning and development regardless of the type of work being performed. The following concepts may be applied individually or in combination as applicable to the project:
Communication
Caltrans shall communicate our planned and programmed projects publically. This communication allows interested parties to understand our plans and initiate communication related to specific projects as appropriate. Communication often means listening to input from differing perspectives related to proposed transportation solutions. This communication also provides a means of explaining the various transportation investments being made on behalf of the people of California.
Partnering
The SHS is a portion of a larger network of transportation that must work together to efficiently meet the transportation needs of all Californians. Caltrans shall partner with local transportation providers to maximize the benefit to the system users. This activity focuses on understanding shared objectives and working together to realize the coordinated delivery of transportation services to the public.
Innovation
Caltrans strives to be innovative in our work. Innovation may take the form of new procurement methods, improved safety ideas, incorporation of state of the art practices, use of innovative construction methods or materials, creative design approaches or creative coordination. Regardless of the form, innovation helps to make Caltrans a world leader in transportation and a premier transportation employer.
Risk Management
Transportation projects have many risks that must be appropriately considered during the project development process. Risks take many forms including design and construction risks, environmental permitting risks, schedule risks, cost risks and many more. Caltrans shall consider project risks and mitigate or manage the risk during the planning and development of our projects.
Collectively, the Organizational Excellence objectives help to make Caltrans a better organization for the public and our employees.

2017 State Highway System Management Plan 64
INTEGRATED ASSET CLASS SUMMARY
The California Transportation Commission defined four asset classes as “focus areas” in accordance with California Government Code. The four asset classes: pavement, bridges, culverts and transportation management systems were selected because they represent a significant portion of annual transportation investments in California. Pavements and bridges are also defined under provisions of MAP-21 and FAST Acts. This section consolidates information presented in the Needs Assessment, Investment Plan and Performance Outcomes sections of this Plan and organizes this information by each of the asset classes.
Pavement
Maintaining the condition of the pavement on California’s highways is the single most costly investment made on an annual basis. The large needs are a function of the size of the system, rapid deterioration caused by heavy use and costs associated with fixing the pavement. Pavement assets are divided into three pavement classes that reflect the varying demands of the different classes of roadways that make up the SHS. The condition of the pavement inventory is deteriorating at a rate of 9 percent per year from good to fair and at a rate of between 3-4 percent from fair to poor (as shown in Chart 9). The 2017 SHSMP establishes a goal of treating 1,900 lane miles annually through HM projects, based on existing funding of $234 million for HM projects. Caltrans anticipates using 10 percent of the HM funding to address the fair performance gap and 90 percent of the funding to keep pavement in good condition. Currently, there are maintenance needs on approximately 12,900 lane miles of pavement. The maintenance need is expected to grow to slightly over
Chart 9. Displays the deterioration and repair cycle for pavement on the SHS. Currently there is between 35-45 percent of pavement in good condition – which ranges by pavement classification. Approximately 9 percent of pavement in good condition deteriorates to fair condition annually. Of the 51-58 percent of pavement in fair condition, approximately 3-4 percent of the pavement inventory declines to poor condition annually. With the additional investments provided from SB 1, it is anticipated the SHOPP projects will address pavement in both fair and poor condition and restores the condition of approximately 2,484 lane miles annually, while maintenance focuses on maintaining 1,710 lane miles in good condition as well addressing 190 lane miles of pavement in fair condition. It should be noted the deterioration rates are revised based on proposed MAP-21 condition criteria.

2017 State Highway System Management Plan 65
13,000 lane miles at the end of a ten-year period with current (2016-2017) funding levels. The expected modest increase in maintenance needs over the ten-year period would be offset by increased investment in the SHOPP. If pavement rehabilitation is funded in the SHOPP consistent with the additional investment as stated in this Plan, no additional funding is recommended for the pavement maintenance program, as growth of future maintenance would be reduced.
Bridge
Bridge maintenance needs are identified and documented during bridge inspections and through engineering analysis. Identified preventive maintenance needs that are beyond the capacity of Caltrans bridge crews are developed into projects to be completed under HM contracts. Development and construction of a typical bridge maintenance project takes approximately two to three years. While the current project stream is in development, additional HM needs are continuously being identified by the bridge inspectors. As the bridge inventory ages, the rate of newly identified maintenance needs is growing and is expected to continue that growth in the future. This increase, considering the number of bridges Caltrans is able to address through HM bridge projects and state forces, is tracking with expectations. Through a combination of strategic planning, maintenance field activities, and bridge preservation contracts, Caltrans is working to slow the growth of rehabilitation and replacement needs. The Bridge Health objective in the SHOPP has a projected performance gap of 5.8 million square feet (approximately 310 bridges) of deck area in fair condition. It is anticipated that the Maintenance Program will address 40 percent of that
Chart 10. Displays the deterioration and repair cycle for bridges on the SHS. Currently 75 percent of bridge decks, measured by square feet, are in good condition. Approximately 0.45 percent of bridge decks in good condition deteriorates to fair condition annually. Of the 22 percent of bridge decks in fair condition, approximately 0.75 percent of the bridge deck inventory declines to poor condition annually. With the additional investments provided from SB-1 it is anticipated SHOPP projects will address 3.0 million square feet of bridge decks annually in both fair and poor condition and restores the condition of the asset, while maintenance focuses on maintaining 5.4 million square feet annually of bridge decks in good condition as well addressing some bridge decks in fair condition.

2017 State Highway System Management Plan 66
performance gap (2.3 million square feet or 124 bridges) through HM projects while continuing to provide preventive maintenance measures on good condition bridges to prevent them from deteriorating into fair condition. If bridge rehabilitation is funded consistent with the SHOPP Investment Plan, the condition of bridges on the State Highway System is expected to improve markedly over the ten year plan period.
Drainage (Culvert)
Caltrans continues to build our inventory of culverts running under or draining the SHS. Ongoing culvert inspections are adding between 8-12,000 culverts to the statewide inventory annually. Inspection production rates are dependent on many factors including right-of-way constraints, environmental permits, multiyear mitigation permits, and traffic considerations. Much of the “easier” access locations have been captured leaving locations that are more difficult to access and more time consuming to inspect. Caltrans is actively pursuing various methods to increase the number of inspections performed. Between 2014-15 and 2015-16 an annual average of 8,215 culverts were inspected. The condition of the culvert inventory is deteriorating at a rate of 2 percent per year – both from good to fair and from fair to poor. Historical assessment rates and anticipated rates of deterioration create an annual increase of approximately 270,000 linear feet (2,760 culverts) in the fair category and an annual increase of 141,000 linear feet (1,440 culverts) to the poor category. Between 2014-15 and 2015-16 an annual average of 144 culverts were repaired through HM contracts. There are approximately 392,000 linear feet (4,000 culverts) in need of maintenance on an annual basis. At the current annual maintenance investment of $23 million, the number of culverts in need of maintenance treatment is anticipated to increase to just short
Chart 11. Displays the deterioration and repair cycle for drainage systems (culverts) on the SHS. Currently 65 percent of culverts, measured by linear feet, are in good condition. Approximately 2 percent of culverts in good condition deteriorate to fair condition annually. Of the 23 percent of culverts in fair condition, approximately 2 percent of the culvert inventory declines to poor condition annually. With the additional investments provided from SB-1 it is anticipated the SHOPP projects will address over 114,000 linear feet of culverts annually in both fair and poor condition and restores the condition of the asset, while maintenance focuses on maintaining 14,000 linear feet of culverts annually in good condition as well addressing culverts in fair condition.

2017 State Highway System Management Plan 67
of 6.9 million linear feet (70,000 culverts) in a ten-year period. The culvert maintenance needs have been recognized in various funding proposals; therefore, no additional changes are recommended to the $23 million annual level of investment. The 2017 SHSMP Investment Plan calls for an investment of 2.3 billion for culvert rehabilitation and replacement in the SHOPP.
TMS Elements
Preventive maintenance is performed on a regular basis to keep TMS equipment in good working order and achieve maximum service life. TMS elements on the SHS deteriorate at a rate of almost 5 percent per year and require over 80,000 preventive maintenance checks and repairs annually to existing TMS inventory to maintain operating condition. Maintenance utilizes a combination of state forces and on-call service contracts to maintain TMS elements. TMS field elements are maintained with a goal Level of Service score of 90. State forces address preventive maintenance checks and repairs for the majority of field elements such as traffic signals, ramp meters as well as other TMS elements. On-call service contracts are primarily used for maintaining the communications infrastructure associated with TOSNET which include the maintenance of wireless assets, fiber optic cables, copper cable, and communications hubs. Through a combination of state forces and on-call service contracts, Caltrans is able to address more than 52,000 preventive maintenance checks and repairs annually. Some assets reporting in poor condition may be operational but have exceeded the expected service life and are obsolete. As a result, operational readiness may be higher than good condition shown in Chart 12. The operational readiness of TMS elements, except for traffic
Chart 12. Displays the deterioration and repair cycle for TMS elements on the SHS. Currently 59 percent of TMS elements are in good condition. TMS elements are categorized as good or poor condition. As a result, approximately 4.73 percent of TMS elements deteriorate to poor condition annually. 41 percent of TMS assets are currently in poor condition. In addition to adding 206 new elements, SHOPP projects address 1,090 TMS elements annually in poor condition and restores the condition of the asset, while maintenance focuses on maintaining TMS elements in good condition by performing over 52,000 preventive maintenance checks as well as repairs annually.

2017 State Highway System Management Plan 68
signals, ranges between 65-85 percent good, varying by district. Caltrans is working diligently to increase the operational readiness of TMS assets. Caltrans Maintenance Program expends an average of $20 million and 169 positions on the maintenance of these assets and recommends the existing level of funding to maintain TMS elements remain unchanged. If TMS elements are provided funding consistent with the SHOPP Investment Plan, no additional funding is recommended for the TMS in the Maintenance Program. The SHOPP Investment Plan calls for $1.7 billion investment for TMS elements.

2017 State Highway System Management Plan 69
COST EFFECTIVENESS STRATEGIES
Cost Effectiveness
California Government Code requires Caltrans to identify strategies to control costs associated with the maintenance of the SHS. The following section identifies a number of strategies being used in the SHOPP or the Maintenance Program for each asset class:
Pavement Apply life cycle cost analysis in design. Caltrans has doubled the rehabilitation design life of
pavement from 20-40 years by using more effective pavement design and life cycle cost analysis. This design analysis, applied during the planning and development of pavement capital projects, ensures the most cost-effective project is constructed at the lowest cost. Maintenance treatments (including Highway Maintenance projects and state forces) are still required to reach the designed service life.
Follow an appropriate 3-20 year cycle of preventive maintenance treatments on the SHS.
Using recycled materials in pavement reduces the impact on new materials and the environment while maintaining the same or better pavement performance. Caltrans uses recycled tires in some pavement, reducing the pressure on landfills. According to the “2014 Crumb Rubber Report,” approximately 27 percent of all flexible pavement on the SHS was designed with rubberized asphalt.
Bridges
Caltrans continues to maximize the use of limited maintenance funding and to control bridge maintenance costs by using new materials that last longer and are easier to apply, such as epoxy paint, polyester concrete, corrosion resistant rebar and other design details.
Caltrans is implementing policies to ensure that new projects are built with cost-effective and easily maintained elements. Caltrans is also studying best practices of other state departments of transportation to ensure the best business practices are employed in California.
Caltrans has begun using accelerated bridge construction techniques (ABC) where appropriate to minimize the impact of the construction on the traveling public. These ABC techniques can be more cost effective than conventional construction when properly utilized.
Culverts
Caltrans is using remote controlled cameras to complete culvert inspections which reduces worker exposure and completes difficult culvert inspections more efficiently.
Caltrans is using remote controlled equipment where practical to perform drain cleaning activities more efficiently.
2017 State Highway System Management Plan 70
Caltrans is utilizing trenchless culvert replacement techniques, where appropriate, which minimize disruptions to the ground surface and the infrastructure above it. This practice decreases the need for full replacement/rehabilitation.
Caltrans is utilizing lining replacement techniques which allow the repair of existing culverts without having to remove and replace the existing deteriorated culvert. Some of the technology considered include paved invert, cured-in-place pipe liner, slip lining, and centrifugally cast liner.
Preventive maintenance is performed to the extent practical to provide waterway adequacy, such as ditch cleaning and culvert cleaning on an annual basis at some locations, even more frequently at some locations to prolong the service life of the culverts.
In improving efficiency, Maintenance staff check culverts annually, as well as during and after each major storm and perform preventative maintenance as needed (flushing sediment in the pipe, cleaning the inlets and outlets).
TMS Elements
Caltrans utilizes on-call service contracts to supplement state forces and continues to integrate on-call service contracts to the extent possible. Caltrans has consolidated on-call contracts over multiple Districts (where feasible) to minimize administrative costs.
Over the last two years, Maintenance and Traffic Operations have begun using one Trouble Ticket system to effect TOSNET system repairs. Once a problem is identified and entered into the Ticket system, the ticket is automatically relayed to the appropriate Maintenance staff. Maintenance then has the option of completing the repairs through state forces or by utilizing the on-call service contracts if state forces do not have the manpower or expertise. This method ensures consistent trouble reporting; ensures that problems are reported as expeditiously as possible; minimizes inaccurate trouble reporting, and duplications of effort.

2017 State Highway System Management Plan 71
Maintenance Program Budget
Highway Maintenance Projects
Highway Maintenance projects are selected by evaluating the asset condition at a route-specific level. This approach is needs-based and considers key factors including: asset age, climate and geographic location, Average Daily Traffic, and projected deterioration. HM projects provide the greatest value and extend service life of assets at the lowest possible long-term cost. Highway Maintenance project selection balances the short-term needs of the system, long-term goals and available resources. HM projects extend the service life of assets and are our primary SHOPP cost avoidance mechanism in the Maintenance Program. The needs of the SHS are assessed in a systematic manner (e.g. PaveM) which includes analysis of these highway deficiencies and their potential solutions. Program advisors review proposed projects, and select those which maximize maintenance investments.
Maintenance Program Budget Allocation Tool (State Forces)
The Maintenance Program has examined its practices on how it allocates resources for field maintenance activities. This is especially valuable given the present and expected future funding, which could place considerable constraints on maintaining the system. Development is under way to improve these practices, and will be shaped by considering Level of Service (LOS), condition of assets, and performance while balancing mandated activities and historic demands on maintenance resources (snow, emergency response, maintenance service requests, etc.) with a commitment to system preservation. The Maintenance Program Budget Allocation Tool (BAT) is under development and is expected to enhance budget management capabilities. The BAT uses a combination of climate and geographic location, Average Daily Traffic, LOS performance, and inventory data to project future resource needs with performance-level expectations. This tool will be used to develop 2017-18 allocations for the ten high-priority maintenance activities identified below: Pavement (potholes/cracks/spalls) Bridge field maintenance activities Guardrail Striping Signs Traffic signals Roadway lighting Tree/brush encroachment Litter/debris Graffiti

2017 State Highway System Management Plan 72
CONCLUSION The SHSMP presented a performance management based Needs Assessment that first defined the needs on the assets and subsequently divided the need into available funding sources. This Needs Assessment incorporated new performance measures proposed by federal regulation and goals established by the Commission. The SHOPP ten-year escalated need for the rehabilitation and operation of the SHS for the period from 2017-18 through 2026-27 is $85.8 billion. Major Maintenance Program needs are an additional $10.3 billion over the ten-year period. The SHSMP presents an Investment Plan that defines the distribution of available funding from the SHOPP, Road Maintenance and Rehabilitation Program, Maintenance and the new FASTLANE Freight Program to address the identified needs. The SHOPP is the single largest funding source available to address rehabilitation needs on the SHS. The projected funding available for the SHOPP is approximately $4.4 billion a year over the ten-year Plan period. Comparing the Needs Assessment to the Investment Plan identified annual funding shortfall for the SHS of approximately $4.1 billion across all objectives. As the SHS continues to age, the demands of vehicle and truck traffic are accelerating the deterioration of its assets. Senate Bill 1, through the Road Maintenance and Rehabilitation Program, has augmented available maintenance and rehabilitation funding for the primary asset classes on the SHS to a level that will allow these assets to be repaired to the condition targets established by the California Transportation Commission (CTC). These much needed transportation funds will make a significant difference in the coming years for these core assets. Supplemental needs on the SHS such as signs, lighting, transportation related facilities, office buildings and others remain underfunded and repairs for these assets will be significantly constrained. Major Maintenance Programs are directed primarily at preventive and minor corrective repairs that delay the need for rehabilitation in the SHOPP. Maintenance contract funding is approximately $2.6 billion over the ten-year Plan period. The passage of the FAST Act has provided up to $900 million for freight improvements on the SHS over ten years. Senate Bill 1 created a new freight improvement program and congestion mitigation program that will likely result in additional funding for SHS improvement through these competitive programs. Maintenance and SHOPP funds are committed to treatments and strategies that extend the service life of existing assets and restore previous condition levels. In the 2017 SHSMP approximately 73 percent of available SHOPP funding is focused on fixing the existing transportation system, 13 percent for safety improvement and 7 percent for sustainability initiatives and 7 percent for system performance improvements. The FAST Act freight funds will provide an estimated additional $90 million annually for system performance improvements on the SHS. The 2017 SHSMP fully implemented the performance management requirements of MAP-21/FAST Acts. This strategic way of looking at performance based infrastructure management has resulted in a plan that is consistent in approach across assets and deficiencies in addition to being fully transparent
2017 State Highway System Management Plan 73
in its analysis. Coupled with the implementation of performance management is a fundamental shift in how the SHOPP is being managed. Beginning with the 2017 SHSMP, SHOPP funding targets will be established at the district level instead of by asset in headquarters. The change in the funding allocation structure will provide greater flexibility for the Caltrans districts to better combine various types of work together to make the projects as efficient as possible with a minimum disruption to the traveling public. The performance management approach implemented with this Plan supports the ongoing implementation of Transportation Asset Management in California. Together these pieces along with others are building the structure for sound asset management of the highway system in California.

2017 State Highway System Management Plan 74
APPENDIX A: STATUTORY REQUIREMENTS
Federal Endangered Species Act Governs conservation of threatened and endangered ecosystems that species of fish, wildlife, and plants depend. 16 U.S.C. section 1531 et seq. http://uscode.house.gov/view.xhtml?req=granuleid:USC-prelim-title16-section1531&num=0&edition=prelim
Federal Water Pollution Control Act (Clean Water Act) Governs surface water pollution as enforced by the Environmental Protection Agency (EPA). 33 U.S.C. section 1251 http://uscode.house.gov/view.xhtml?req=granuleid:USC-prelim-title33-section1251&num=0&edition=prelim
National Pollutant Discharge Elimination System (NPDES) Governs construction and maintenance activities that impact storm water quality. 33 U.S.C. section 1342 http://uscode.house.gov/view.xhtml?req=(title:33%20section:1342%20edition:prelim)%20OR%20(granuleid:USC-prelim-title33-section1342)&f=treesort&edition=prelim&num=0&jumpTo=true
Resource Conservation and Recovery Act (RCRA) Governs hazardous and non-hazardous solid waste management. 42 U.S.C. section 6901 et seq. http://uscode.house.gov/view.xhtml?req=granuleid:USC-prelim-title42-section6901&num=0&edition=prelim
Federal Comprehensive Environmental Response Compensation and Liability Act (CERCLA) Governs hazardous waste site cleanup resulting from accidents, spills, and other emergency releases of pollutants and contaminants into the environment. 42 U.S.C. section 9601 et seq. http://uscode.house.gov/view.xhtml?req=granuleid:USC-prelim-title42-section9601&num=0&edition=prelim
Americans with Disabilities Act (ADA) Governs accessibility services and facility requirements for individuals with disabilities. 42 U.S.C. section 12101 et seq. http://uscode.house.gov/view.xhtml?req=granuleid:USC-prelim-title42-section12101&num=0&edition=prelim
Statewide Potable Urban Water Usage Reduction Requires State Water Resources Control Board (SWRCB) to reduce statewide water usage by 25 percent. Executive Order B-29-15
https://www.gov.ca.gov/docs/4.1.15_Executive_Order.pdf
2017 State Highway System Management Plan 75
Senate Bill 857 Requires Caltrans to prepare an annual report to the Legislature regarding department’s progress in locating, assessing, and remediating barriers to fish passage. Chapter 589, Statutes of 2005
http://leginfo.legislature.ca.gov/faces/billNavClient.xhtml?bill_id=200520060SB857
Fish and Wildlife Protection and Conservation Requires written notification when an activity/project may substantially divert or obstruct the natural flow of any river, stream, or lake. Fish and Game Code section 1602 http://leginfo.legislature.ca.gov/faces/codes_displaySection.xhtml?sectionNum=1602.&lawCode=FGC
California Endangered Species Act (CESA) Protects and preserves all native species threatened by extinction or experiencing a significant decline which, if not halted, would lead to a threatened or endangered designation. Fish and Game Code sections 2050-2069
http://www.leginfo.ca.gov/cgi-bin/displaycode?section=fgc&group=02001-03000&file=2050-2069
California Transportation Commission Requires Caltrans to prepare a state highway operation and protection program and submit to the Commission for adoption no later than January 31 of each even-numbered year. Government Code section 14526.5 http://leginfo.legislature.ca.gov/faces/codes_displaySection.xhtml?sectionNum=14526.5.&lawCode=GOV
California Environmental Quality Act (CEQA) Requires state and local agencies to identify the significant environmental impacts associated with their activities and to mitigate those impacts. Public Resources Code sections 21000-21177 http://leginfo.legislature.ca.gov/faces/codes_displayexpandedbranch.xhtml?tocCode=PRC&division=13.&title=&part=&chapter=&article=
Transportation Funding Plan Requires Caltrans to prepare a ten-year state rehabilitation plan and a five-year maintenance plan that addresses rehabilitation and maintenance needs of the state highway system. Streets and Highways Code section 164.6 http://leginfo.legislature.ca.gov/faces/codes_displaySection.xhtml?sectionNum=164.6.&lawCode=SHC

2017 State Highway System Management Plan 76
Safety Roadside Rests Requires CTC and Caltrans to plan, design, and construct safety roadside rests outside the state park system units. In addition, Caltrans must maintain safety roadside rests on the state highway system. Streets and Highways Code section 218 et seq. http://leginfo.legislature.ca.gov/faces/codes_displayText.xhtml?lawCode=SHC&division=1.&title=&part=&chapter=1.&article=7.
Surface Mining and Reclamation Act of 1975 (SMARA) Establishes surface mining and reclamation policy to regulate surface mining operations to minimize adverse environmental impacts and reclaimed mined lands are in a usable condition. Public Resources Code section 2710 et. seq. http://leginfo.legislature.ca.gov/faces/codes_displayText.xhtml?lawCode=PRC&division=2.&title=&part=&chapter=9.&article=1.
Highway Users Tax Account (HUTA) Explains fuel tax revenue uses and establishes county apportionment amounts in accordance with various tax laws. Streets and Highways Code sections 2104-2108 http://leginfo.legislature.ca.gov/faces/codes_displayText.xhtml?lawCode=SHC&division=3.&title=&part=&chapter=3.&article=
Railroad Crossings Outlines construction practices surrounding railroad crossings, including policy development by CTC in consultation with Caltrans. Public Utilities Code sections 1201-1220 http://leginfo.legislature.ca.gov/faces/codes_displayText.xhtml?lawCode=PUC&division=1.&title=&part=1.&chapter=6.&article=
Railway-Highway Crossings Requires states to make safety improvements at public railroad-highway crossings and submit an annual progress report to FHWA. 23 U.S.C. section 130 http://uscode.house.gov/view.xhtml?req=(title:23%20section:130%20edition:prelim)%20OR%20(granuleid:USC-prelim-title23-section130)&f=treesort&edition=prelim&num=0&jumpTo=true
Assembly Bill 2289 Amends Government Code section 14526.5 to include capital improvement projects relative to the operation of state highways and bridges. Chapter 76 , Statutes of 2016
http://leginfo.legislature.ca.gov/faces/billTextClient.xhtml?bill_id=201520160AB2289

2017 State Highway System Management Plan 77
APPENDIX B: PERFORMANCE MANAGEMENT SUMMARY SHEETS
Objectives Page Number Bridge Rail Replacement and Upgrade 1 Collision Severity Reduction 2 Roadside Safety Improvements 3 Safety Improvements 4 Bridge Health 5 Drainage Pump Plants 6 Drainage System Restoration 7 Lighting Rehabilitation 8 Major Damage (Emergency Opening) 9 Major Damage (Permanent Restoration) 10 Office Buildings 11 Overhead Sign Structures Rehabilitation 12 Pavement Class I 13 Pavement Class II 14 Pavement Class III 15 Relinquishments 16 Roadway Protective Betterments 17 Safety Roadside Rest Area (SRRA) Rehabilitation 18 Transportation Related Facilities 19 Water and Wastewater Treatment at SRRAs 20 ADA Pedestrian Infrastructure 21 Advance Mitigation 22 Bridge Scour Mitigation 23 Bridge Seismic Restoration 24 Hazardous Waste Mitigation 25 Roadside Rehabilitation 26 Storm Water Mitigation 27 Zero Emission Vehicle Infrastructure 28 Commercial Vehicle Enforcement Facilities 29 Operational Improvements 30 Sign Panel Replacement 31 Transportation Management Systems 32 Bridge Goods Movement Upgrades 33 Weigh-In-Motion Scales 34

2017 State Highway System Management Plan 78
The Performance Management Summary Sheets are included in the appendix of the State Highway System Management Plan. These sheets summarize the inventory, condition breakdown, deterioration rates, pipelined work, targets, unit cost to address the needs and a statewide and district level cost summary. The summary sheets include sections A - M as shown below. A description of each section is provided for each lettered section below:
A. Current inventory for physical assets or magnitude of deficiency. B. Projected inventory or deficiency at the end of the period. Typically equals current numbers. C. Average annual deterioration rates used in the calculation of the projected condition. In cases
which Asset Management Systems are used to project the condition, these rates are back-calculated from the projected condition.
D. The current breakdown of the condition of physical assets. Deficiencies are typically poor. E. Projected future condition based on a do nothing scenario. Uses projected future inventory. F. Pipeline of quantities from the SHOPP, PID work plan commitments, and other sources. G. Established performance targets. These are not constrained targets. H. The summation of the district level non-negative performance gaps for fair and poor. I. The average unit costs for repair and associated support ratio. J. The dollar value of the Maintenance and SHOPP unfunded future commitments. K. The dollar value necessary to close the performance gap. Split between SHOPP and
Maintenance. L. The total need to achieve the performance target. Includes HM and SHOPP funding. M. District level breakdown of the inventory, gaps and SHOPP and Maintenance needs.
Notes A negative gap means that the projected condition and planned pipeline will result in the district surpassing the statewide performance target in a ten-year period.
A B
C
D E
F G
H I J K L
M

Appendix B - Performance Management Sheets 1 of 34
% per Year% per Year
59.80% 59.80%33.29% 33.29%6.91% 6.91%
1.46% 100.00%1.60% 0.00%0.00% 0.00%
Support Ratio**31.83% 40.00%5.32% 40.00%0.00% 40.00%
D1 290,438 $1,925 $559,093,150 0 $1,925 89,832 $1,925 31,117 $1,925 $232,826,825D2 261,471 $1,925 $503,331,675 0 $1,925 84,499 $1,925 12,212 $1,925 $186,168,675D3 795,380 $1,925 $1,531,106,500 0 $1,925 313,880 $1,925 47,624 $1,925 $695,895,200D4 1,645,604 $1,925 $3,167,787,700 0 $1,925 446,459 $1,925 92,783 $1,925 $1,038,040,850D5 350,405 $1,925 $674,529,625 0 $1,925 110,679 $1,925 42,827 $1,925 $295,499,050D6 408,027 $1,925 $785,451,975 0 $1,925 100,997 $1,925 22,345 $1,925 $237,433,350D7 1,774,798 $1,925 $3,416,486,150 0 $1,925 553,741 $1,925 138,146 $1,925 $1,331,882,475D8 771,528 $1,925 $1,485,191,400 0 $1,925 264,781 $1,925 13,397 $1,925 $535,492,650D9 46,550 $1,925 $89,608,750 0 $1,925 11,685 $1,925 1,871 $1,925 $26,095,300
D10 371,347 $1,925 $714,842,975 0 $1,925 167,809 $1,925 15,980 $1,925 $353,793,825D11 945,635 $1,925 $1,820,347,375 0 $1,925 317,172 $1,925 7,612 $1,925 $625,209,200D12 565,251 $1,925 $1,088,108,175 0 $1,925 157,084 $1,925 11,483 $1,925 $324,491,475HQ N/A N/A N/A N/A N/A N/A N/A N/A N/A N/A
Statewide Totals 8,226,434 N/A $15,835,885,450 0 N/A 2,618,618 N/A 437,397 N/A $5,882,828,875
Projected Condition (in 2027) - Do Nothing ScenarioGood 4,919,050 Good 4,919,050Fair 2,738,586 Fair 2,738,586
Effective Annual Deterioration RateInto Fair 0.00Into Poor 0.00
Current Condition
Bridge Rail Replacement and Upgrade
Current Inventory Projected Inventory (in 2027)8,226,434 Linear Feet 8,226,434 Linear Feet
Add New 0 Poor 0
Performance Gap for the Last 5 Years Average Unit Cost*
Fix Fair to Good 119,968 Good or New 8,226,434Fix Poor to Good 131,401 Fair 0
Poor 568,798 Poor 568,798
Pipelined Projects (in any SHOPP or 2018 PID Workplan) Target Condition (in 2027) - Goal
Add New 0 Add New $1,375
Estimated CostsUnfunded Pipelined Maintenance Work $0 Maintenance Performance Gap $0
Total
Fix Fair to Good 2,618,618 Fix Fair to Good $1,375Fix Poor to Good 437,397 Fix Poor to Good $1,375
Fair Gap "Fix Fair"Total Unit Cost* Poor Gap "Fix Poor"
Total Unit Cost*Goal Constrained
Need
(*) The unit costs represent a multi-year programmatic average of a number of activities included within this objective. These costs should not be used for project level estimates.(**) The support ratios represent a multi-year cost-weighted average of a number of activities included within this objective. These ratios should not be used for project level estimates.
District Projected Quantity ReplacementTotal Unit Cost* Estimated Value New Gap "Add New"
Total Unit Cost*
$6,197,022,875Unfunded Pipelined SHOPP Projects $314,194,000 SHOPP Performance Gap $5,882,828,875
District Breakdown

Appendix B - Performance Management Sheets 2 of 34
% per Year% per Year
N/A N/AN/A N/A
100.00% 100.00%
N/A 10.00%2.69% N/A
N/A 90.00%
Support Ratio**N/A N/A
7.42% 48.00%N/A N/A
D1 793 N/A N/A N/A N/A N/A N/A -11 $155,400 $0D2 718 N/A N/A N/A N/A N/A N/A 30 $155,400 $4,662,000D3 3,286 N/A N/A N/A N/A N/A N/A 204 $155,400 $31,701,600D4 10,080 N/A N/A N/A N/A N/A N/A 876 $155,400 $136,130,400D5 2,241 N/A N/A N/A N/A N/A N/A 114 $155,400 $17,715,600D6 2,866 N/A N/A N/A N/A N/A N/A 274 $155,400 $42,579,600D7 14,645 N/A N/A N/A N/A N/A N/A 1,287 $155,400 $199,999,800D8 6,081 N/A N/A N/A N/A N/A N/A 207 $155,400 $32,167,800D9 130 N/A N/A N/A N/A N/A N/A -46 $155,400 $0
D10 2,330 N/A N/A N/A N/A N/A N/A 144 $155,400 $22,377,600D11 4,827 N/A N/A N/A N/A N/A N/A 436 $155,400 $67,754,400D12 4,486 N/A N/A N/A N/A N/A N/A 324 $155,400 $50,349,600HQ N/A N/A N/A N/A N/A N/A N/A N/A N/A N/A
Statewide Totals 52,483 N/A N/A N/A N/A N/A N/A 3,896 N/A $605,438,400
Projected Need (in 2027) - Do Nothing ScenarioGood N/A Good N/AFair N/A Fair N/A
Effective Annual Deterioration RateInto Fair N/AInto Poor N/A
Current Need
Collision Severity Reduction
Current Need Projected Need (in 2027)52,483 Injuries 52,483 Injuries
Add New N/A Poor 47,234
Performance Gap for the Last 5 Years Average Unit Cost*
Fix Fair to Good N/A Good or New 5,249Fix Poor to Good 1,410 Fair N/A
Poor 52,483 Poor 52,483
Pipelined Projects (in any SHOPP or 2018 PID Workplan) Target Need (in 2027) - Goal
Add New N/A Add New N/A
Estimated CostsUnfunded Pipelined Maintenance Work $0 Maintenance Performance Gap $0
Total
Fix Fair to Good N/A Fix Fair to Good N/AFix Poor to Good 3,896 Fix Poor to Good $105,000
Fair Gap "Fix Fair"Total Unit Cost* Poor Gap "Fix Poor"
Total Unit Cost*Goal Constrained
Need
(*) The unit costs represent a multi-year programmatic average of a number of activities included within this objective. These costs should not be used for project level estimates.(**) The support ratios represent a multi-year cost-weighted average of a number of activities included within this objective. These ratios should not be used for project level estimates.
District Projected Need ReplacementTotal Unit Cost* Estimated Value New Gap "Add New"
Total Unit Cost*
$1,324,406,400Unfunded Pipelined SHOPP Projects $718,968,000 SHOPP Performance Gap $605,438,400
District Breakdown

Appendix B - Performance Management Sheets 3 of 34
% per Year% per Year
N/A N/AN/A N/A
100.00% 100.00%
N/A 100.00%26.10% N/A
N/A 0.00%
Support Ratio**N/A N/A
73.90% 49.43%N/A N/A
D1 214 N/A N/A N/A N/A N/A N/A 191 $68,870 $13,154,170D2 647 N/A N/A N/A N/A N/A N/A 610 $68,870 $42,010,700D3 1,138 N/A N/A N/A N/A N/A N/A 827 $68,870 $56,955,490D4 3,158 N/A N/A N/A N/A N/A N/A 2,571 $68,870 $177,064,770D5 1,010 N/A N/A N/A N/A N/A N/A 758 $68,870 $52,203,460D6 1,568 N/A N/A N/A N/A N/A N/A 1,363 $68,870 $93,869,810D7 6,190 N/A N/A N/A N/A N/A N/A 4,910 $68,870 $338,151,700D8 2,814 N/A N/A N/A N/A N/A N/A 1,000 $68,870 $68,870,000D9 110 N/A N/A N/A N/A N/A N/A 96 $68,870 $6,611,520
D10 664 N/A N/A N/A N/A N/A N/A 281 $68,870 $19,352,470D11 2,263 N/A N/A N/A N/A N/A N/A 1,830 $68,870 $126,032,100D12 1,930 N/A N/A N/A N/A N/A N/A 1,604 $68,870 $110,467,480HQ N/A N/A N/A N/A N/A N/A N/A N/A N/A N/A
Statewide Totals 21,706 N/A N/A N/A N/A N/A N/A 16,041 N/A $1,104,743,670
Projected Need (in 2027) - Do Nothing ScenarioGood N/A Good N/AFair N/A Fair N/A
Effective Annual Deterioration RateInto Fair N/AInto Poor N/A
Current Need
Roadside Safety Improvements
Current Need Projected Need (in 2027)21,706 Locations 21,706 Locations
Add New N/A Poor 0
Performance Gap for the Last 5 Years Average Unit Cost*
Fix Fair to Good N/A Good or New 21,706Fix Poor to Good 5,665 Fair N/A
Poor 21,706 Poor 21,706
Pipelined Projects (in any SHOPP or 2018 PID Workplan) Target Need (in 2027) - Goal
Add New N/A Add New N/A
Estimated CostsUnfunded Pipelined Maintenance Work $0 Maintenance Performance Gap $0
Total
Fix Fair to Good N/A Fix Fair to Good N/AFix Poor to Good 16,041 Fix Poor to Good $46,090
Fair Gap "Fix Fair"Total Unit Cost* Poor Gap "Fix Poor"
Total Unit Cost*Goal Constrained
Need
(*) The unit costs represent a multi-year programmatic average of a number of activities included within this objective. These costs should not be used for project level estimates.(**) The support ratios represent a multi-year cost-weighted average of a number of activities included within this objective. These ratios should not be used for project level estimates.
District Projected Need ReplacementTotal Unit Cost* Estimated Value New Gap "Add New"
Total Unit Cost*
$1,601,629,770Unfunded Pipelined SHOPP Projects $496,886,100 SHOPP Performance Gap $1,104,743,670
District Breakdown

Appendix B - Performance Management Sheets 4 of 34
% per Year% per Year
N/A N/AN/A N/AN/A N/A
N/A N/AN/A N/AN/A N/A
Support Ratio**N/A N/AN/A N/AN/A N/A
D1 N/A N/A N/A N/A N/A N/A N/A N/A N/A N/AD2 N/A N/A N/A N/A N/A N/A N/A N/A N/A N/AD3 N/A N/A N/A N/A N/A N/A N/A N/A N/A N/AD4 N/A N/A N/A N/A N/A N/A N/A N/A N/A N/AD5 N/A N/A N/A N/A N/A N/A N/A N/A N/A N/AD6 N/A N/A N/A N/A N/A N/A N/A N/A N/A N/AD7 N/A N/A N/A N/A N/A N/A N/A N/A N/A N/AD8 N/A N/A N/A N/A N/A N/A N/A N/A N/A N/AD9 N/A N/A N/A N/A N/A N/A N/A N/A N/A N/A
D10 N/A N/A N/A N/A N/A N/A N/A N/A N/A N/AD11 N/A N/A N/A N/A N/A N/A N/A N/A N/A N/AD12 N/A N/A N/A N/A N/A N/A N/A N/A N/A N/AHQ N/A N/A N/A N/A N/A N/A N/A N/A N/A N/A
Statewide Totals N/A N/A N/A N/A N/A N/A N/A N/A N/A N/A
Projected Need (in 2027) - Do Nothing ScenarioGood N/A Good N/AFair N/A Fair N/A
Effective Annual Deterioration RateInto Fair N/AInto Poor N/A
Current Need
Safety Improvements
Current Need Projected Need (in 2027)N/A N/A N/A N/A
Add New N/A Poor N/A
Performance Gap for the Last 5 Years Average Unit Cost*
Fix Fair to Good N/A Good or New N/AFix Poor to Good N/A Fair N/A
Poor N/A Poor N/A
Pipelined Projects (in any SHOPP or 2018 PID Workplan) Target Need (in 2027) - Goal
Add New N/A Add New N/A
Estimated CostsUnfunded Pipelined Maintenance Work $0 Maintenance Performance Gap $0
Total
Fix Fair to Good N/A Fix Fair to Good N/AFix Poor to Good N/A Fix Poor to Good N/A
Fair Gap "Fix Fair"Total Unit Cost* Poor Gap "Fix Poor"
Total Unit Cost*Goal Constrained
Need
(*) The unit costs represent a multi-year programmatic average of a number of activities included within this objective. These costs should not be used for project level estimates.(**) The support ratios represent a multi-year cost-weighted average of a number of activities included within this objective. These ratios should not be used for project level estimates.
District Projected Need ReplacementTotal Unit Cost* Estimated Value New Gap "Add New"
Total Unit Cost*
$4,210,000,000Unfunded Pipelined SHOPP Projects $1,570,089,800 SHOPP Performance Gap $2,639,910,200
District Breakdown
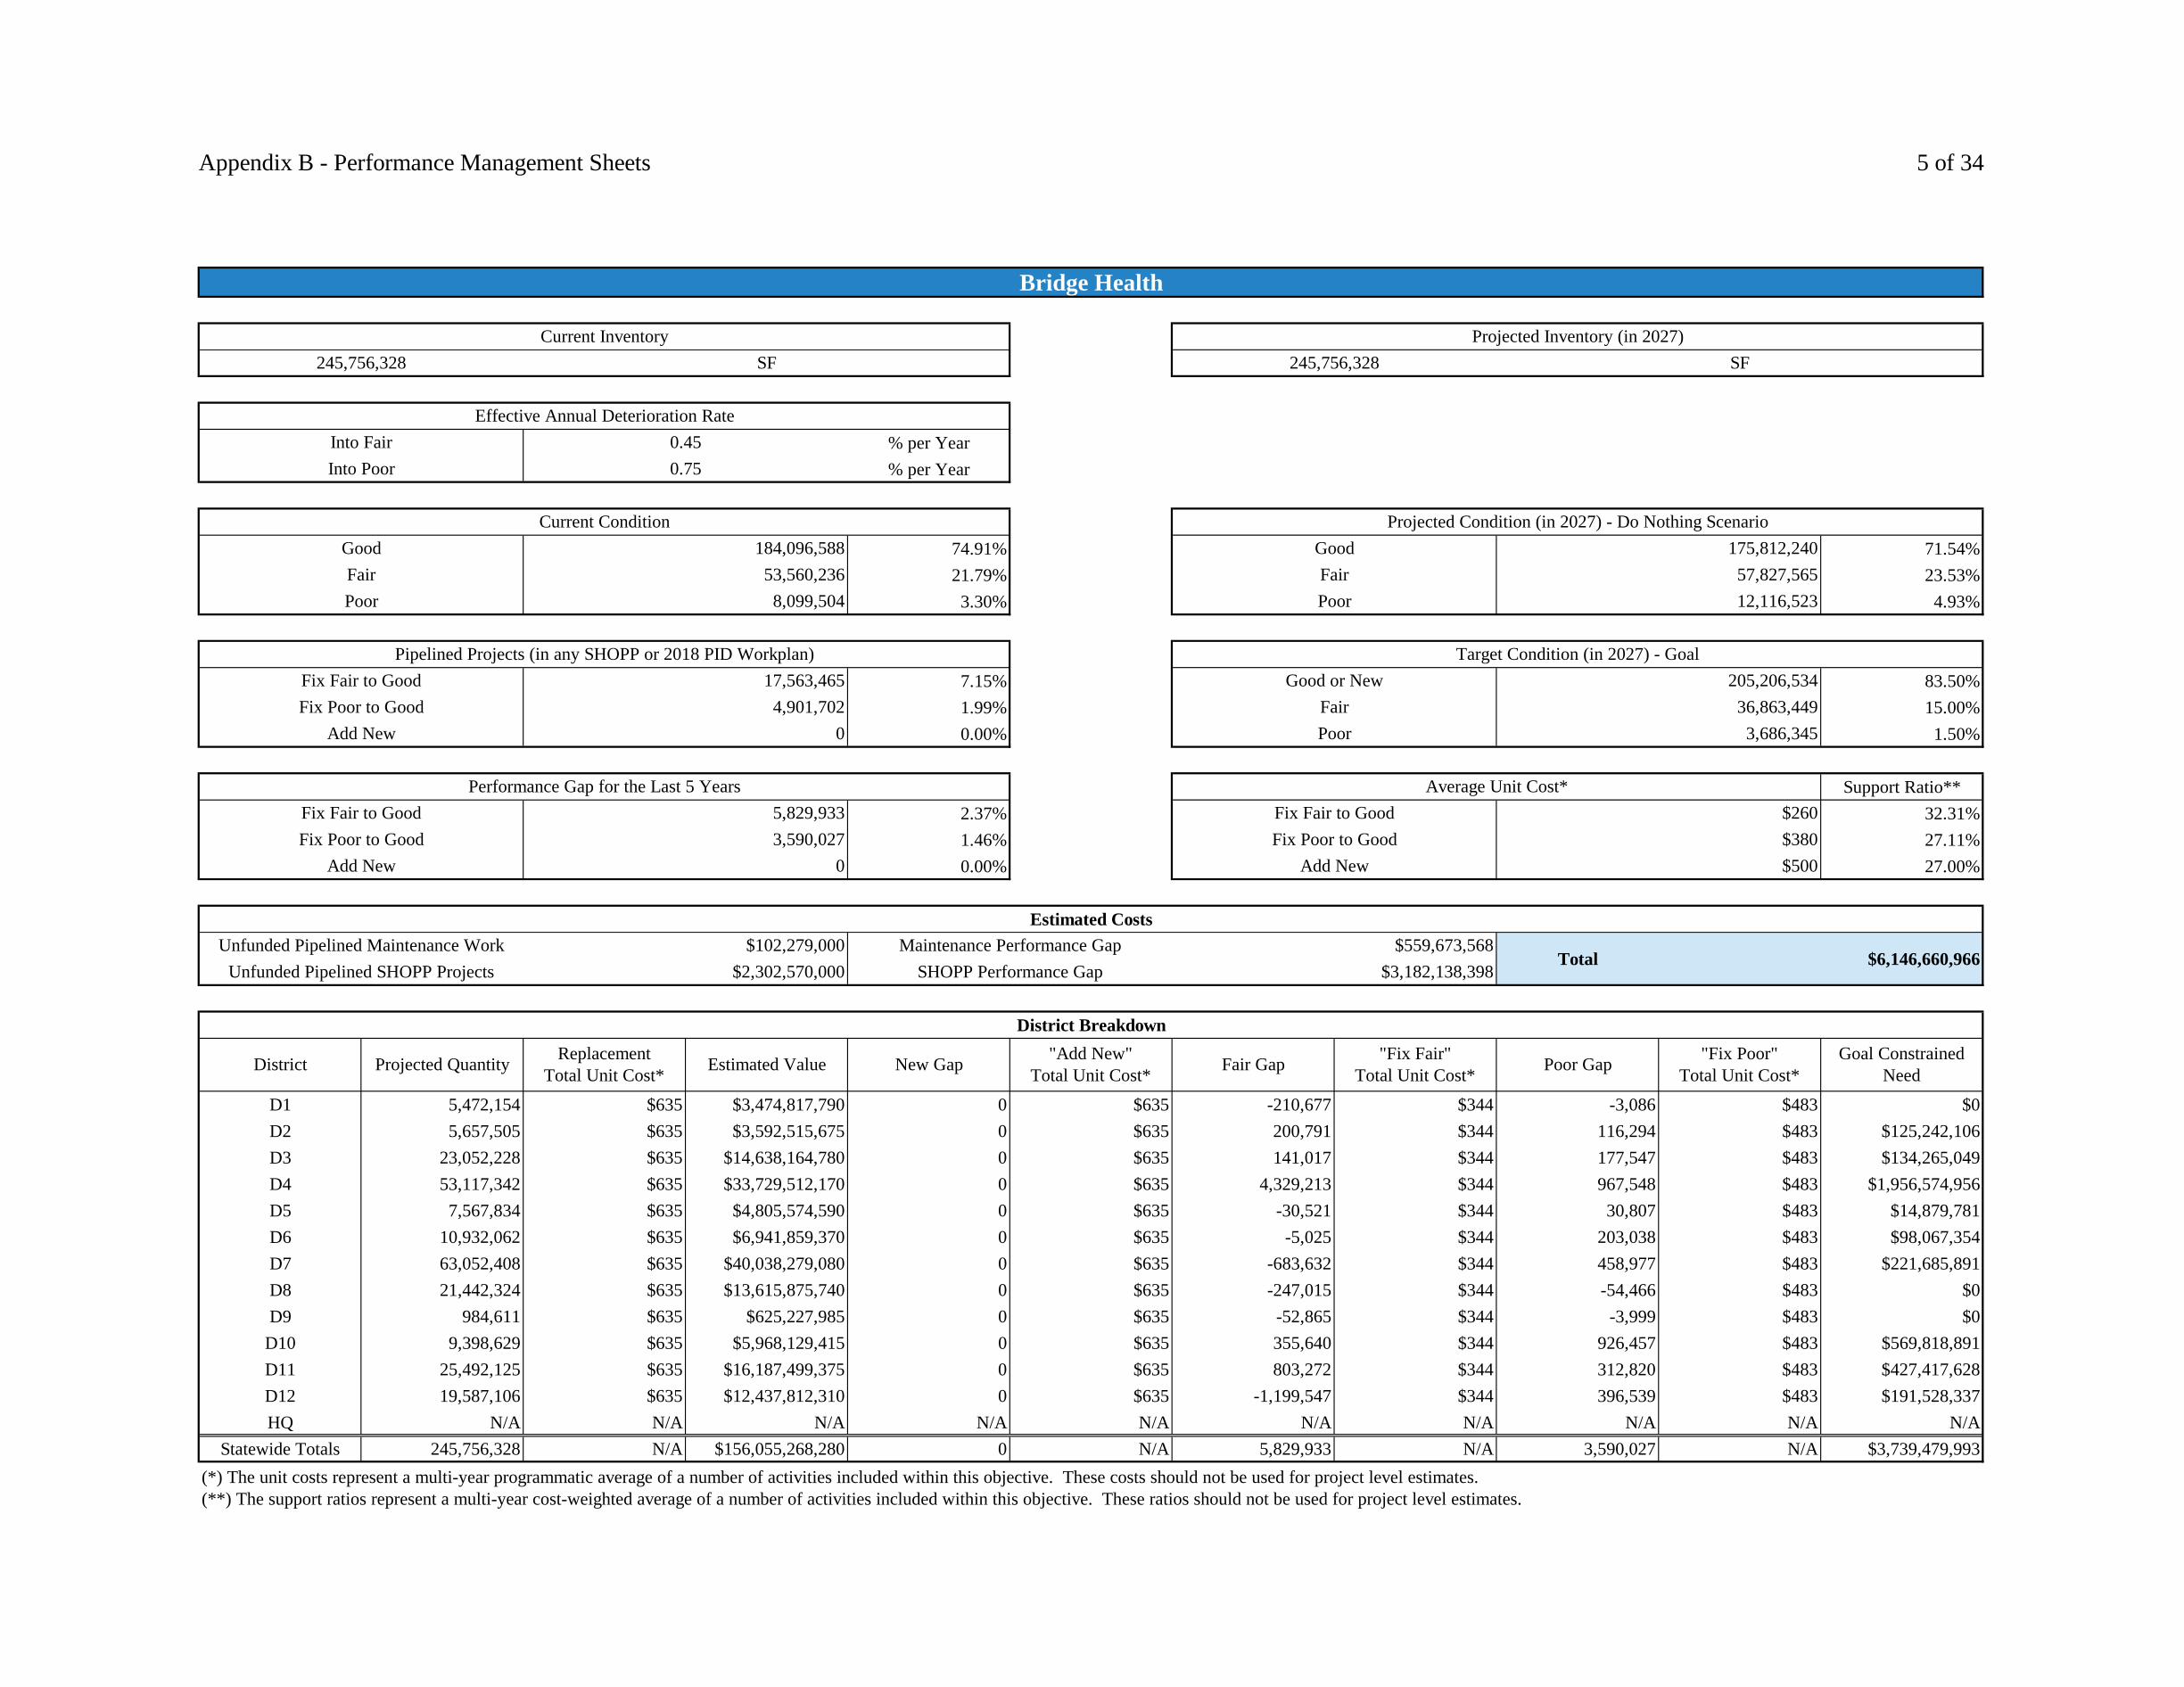
Appendix B - Performance Management Sheets 5 of 34
% per Year% per Year
74.91% 71.54%21.79% 23.53%3.30% 4.93%
7.15% 83.50%1.99% 15.00%0.00% 1.50%
Support Ratio**2.37% 32.31%1.46% 27.11%0.00% 27.00%
D1 5,472,154 $635 $3,474,817,790 0 $635 -210,677 $344 -3,086 $483 $0D2 5,657,505 $635 $3,592,515,675 0 $635 200,791 $344 116,294 $483 $125,242,106D3 23,052,228 $635 $14,638,164,780 0 $635 141,017 $344 177,547 $483 $134,265,049D4 53,117,342 $635 $33,729,512,170 0 $635 4,329,213 $344 967,548 $483 $1,956,574,956D5 7,567,834 $635 $4,805,574,590 0 $635 -30,521 $344 30,807 $483 $14,879,781D6 10,932,062 $635 $6,941,859,370 0 $635 -5,025 $344 203,038 $483 $98,067,354D7 63,052,408 $635 $40,038,279,080 0 $635 -683,632 $344 458,977 $483 $221,685,891D8 21,442,324 $635 $13,615,875,740 0 $635 -247,015 $344 -54,466 $483 $0D9 984,611 $635 $625,227,985 0 $635 -52,865 $344 -3,999 $483 $0
D10 9,398,629 $635 $5,968,129,415 0 $635 355,640 $344 926,457 $483 $569,818,891D11 25,492,125 $635 $16,187,499,375 0 $635 803,272 $344 312,820 $483 $427,417,628D12 19,587,106 $635 $12,437,812,310 0 $635 -1,199,547 $344 396,539 $483 $191,528,337HQ N/A N/A N/A N/A N/A N/A N/A N/A N/A N/A
Statewide Totals 245,756,328 N/A $156,055,268,280 0 N/A 5,829,933 N/A 3,590,027 N/A $3,739,479,993
Projected Condition (in 2027) - Do Nothing ScenarioGood 184,096,588 Good 175,812,240Fair 53,560,236 Fair 57,827,565
Effective Annual Deterioration RateInto Fair 0.45Into Poor 0.75
Current Condition
Bridge Health
Current Inventory Projected Inventory (in 2027)245,756,328 SF 245,756,328 SF
Add New 0 Poor 3,686,345
Performance Gap for the Last 5 Years Average Unit Cost*
Fix Fair to Good 17,563,465 Good or New 205,206,534Fix Poor to Good 4,901,702 Fair 36,863,449
Poor 8,099,504 Poor 12,116,523
Pipelined Projects (in any SHOPP or 2018 PID Workplan) Target Condition (in 2027) - Goal
Add New 0 Add New $500
Estimated CostsUnfunded Pipelined Maintenance Work $102,279,000 Maintenance Performance Gap $559,673,568
Total
Fix Fair to Good 5,829,933 Fix Fair to Good $260Fix Poor to Good 3,590,027 Fix Poor to Good $380
Fair Gap "Fix Fair"Total Unit Cost* Poor Gap "Fix Poor"
Total Unit Cost*Goal Constrained
Need
(*) The unit costs represent a multi-year programmatic average of a number of activities included within this objective. These costs should not be used for project level estimates.(**) The support ratios represent a multi-year cost-weighted average of a number of activities included within this objective. These ratios should not be used for project level estimates.
District Projected Quantity ReplacementTotal Unit Cost* Estimated Value New Gap "Add New"
Total Unit Cost*
$6,146,660,966Unfunded Pipelined SHOPP Projects $2,302,570,000 SHOPP Performance Gap $3,182,138,398
District Breakdown

Appendix B - Performance Management Sheets 6 of 34
% per Year% per Year
24.14% 17.93%29.31% 27.59%46.55% 54.48%
0.69% 80.00%15.17% 20.00%0.00% 0.00%
Support Ratio**8.62% 50.00%
39.31% 50.00%0.00% 50.00%
D1 0 $870,000 $0 0 $870,000 0 $870,000 0 $870,000 $0D2 0 $870,000 $0 0 $870,000 0 $870,000 0 $870,000 $0D3 43 $870,000 $37,410,000 0 $870,000 9 $870,000 20 $870,000 $25,230,000D4 71 $870,000 $61,770,000 0 $870,000 3 $870,000 31 $870,000 $29,580,000D5 10 $870,000 $8,700,000 0 $870,000 1 $870,000 6 $870,000 $6,090,000D6 73 $870,000 $63,510,000 0 $870,000 10 $870,000 13 $870,000 $20,010,000D7 52 $870,000 $45,240,000 0 $870,000 -4 $870,000 34 $870,000 $29,580,000D8 2 $870,000 $1,740,000 0 $870,000 1 $870,000 0 $870,000 $870,000D9 0 $870,000 $0 0 $870,000 0 $870,000 0 $870,000 $0
D10 21 $870,000 $18,270,000 0 $870,000 -1 $870,000 2 $870,000 $1,740,000D11 5 $870,000 $4,350,000 0 $870,000 1 $870,000 0 $870,000 $870,000D12 13 $870,000 $11,310,000 0 $870,000 0 $870,000 8 $870,000 $6,960,000HQ N/A N/A N/A N/A N/A N/A N/A N/A N/A N/A
Statewide Totals 290 N/A $252,300,000 0 N/A 25 N/A 114 N/A $120,930,000
Projected Condition (in 2027) - Do Nothing ScenarioGood 70 Good 52Fair 85 Fair 80
Effective Annual Deterioration RateInto Fair 2.57Into Poor 2.71
Current Condition
Drainage Pump Plants
Current Inventory Projected Inventory (in 2027)290 Locations 290 Locations
Add New 0 Poor 0
Performance Gap for the Last 5 Years Average Unit Cost*
Fix Fair to Good 2 Good or New 232Fix Poor to Good 44 Fair 58
Poor 135 Poor 158
Pipelined Projects (in any SHOPP or 2018 PID Workplan) Target Condition (in 2027) - Goal
Add New 0 Add New $580,000
Estimated CostsUnfunded Pipelined Maintenance Work $0 Maintenance Performance Gap $0
Total
Fix Fair to Good 25 Fix Fair to Good $580,000Fix Poor to Good 114 Fix Poor to Good $580,000
Fair Gap "Fix Fair"Total Unit Cost* Poor Gap "Fix Poor"
Total Unit Cost*Goal Constrained
Need
(*) The unit costs represent a multi-year programmatic average of a number of activities included within this objective. These costs should not be used for project level estimates.(**) The support ratios represent a multi-year cost-weighted average of a number of activities included within this objective. These ratios should not be used for project level estimates.
District Projected Quantity ReplacementTotal Unit Cost* Estimated Value New Gap "Add New"
Total Unit Cost*
$164,925,000Unfunded Pipelined SHOPP Projects $43,995,000 SHOPP Performance Gap $120,930,000
District Breakdown

Appendix B - Performance Management Sheets 7 of 34
% per Year% per Year
65.02% 52.02%23.48% 31.79%11.50% 16.20%
0.07% 80.00%1.16% 10.00%0.00% 10.00%
Support Ratio**41.41% 86.00%10.64% 53.85%0.00% 53.85%
D1 1,180,715 $2,000 $2,361,430,000 0 $2,000 287,641 $558 110,595 $2,000 $381,693,678D2 1,756,533 $2,000 $3,513,066,000 0 $2,000 349,712 $558 24,881 $2,000 $244,901,296D3 1,444,956 $2,000 $2,889,912,000 0 $2,000 362,362 $558 194,162 $2,000 $590,521,996D4 1,784,772 $2,000 $3,569,544,000 0 $2,000 386,437 $558 42,164 $2,000 $299,959,846D5 2,443,680 $2,000 $4,887,360,000 0 $2,000 511,855 $558 157,177 $2,000 $599,969,090D6 2,991,424 $2,000 $5,982,848,000 0 $2,000 774,052 $558 309,490 $2,000 $1,050,901,016D7 920,689 $2,000 $1,841,378,000 0 $2,000 180,257 $558 51,709 $2,000 $204,001,406D8 1,876,811 $2,000 $3,753,622,000 0 $2,000 360,810 $558 57,905 $2,000 $317,141,980D9 969,197 $2,000 $1,938,394,000 0 $2,000 183,318 $558 12,919 $2,000 $128,129,444
D10 1,215,005 $2,000 $2,430,010,000 0 $2,000 271,524 $558 63,712 $2,000 $278,934,392D11 2,935,378 $2,000 $5,870,756,000 0 $2,000 599,546 $558 86,140 $2,000 $506,826,668D12 755,338 $2,000 $1,510,676,000 0 $2,000 141,634 $558 21,884 $2,000 $122,799,772HQ N/A N/A N/A N/A N/A N/A N/A N/A N/A N/A
Statewide Totals 20,274,500 N/A $40,548,996,000 0 N/A 4,409,148 N/A 1,132,738 N/A $4,725,780,584
Projected Condition (in 2027) - Do Nothing ScenarioGood 6,923,197 Good 10,545,812Fair 2,499,915 Fair 6,444,466
Effective Annual Deterioration RateInto Fair 2.00Into Poor 2.00
Current Condition
Drainage System Restoration
Current Inventory Projected Inventory (in 2027)10,647,970 Linear Feet 20,274,500 Linear Feet
Add New 0 Poor 2,027,451
Performance Gap for the Last 5 Years Average Unit Cost*
Fix Fair to Good 7,867 Good or New 16,219,598Fix Poor to Good 124,033 Fair 2,027,451
Poor 1,224,858 Poor 3,284,222
Pipelined Projects (in any SHOPP or 2018 PID Workplan) Target Condition (in 2027) - Goal
Add New 0 Add New $1,300
Estimated CostsUnfunded Pipelined Maintenance Work $0 Maintenance Performance Gap $2,460,304,584
Total
Fix Fair to Good 4,409,148 Fix Fair to Good $300Fix Poor to Good 1,132,738 Fix Poor to Good $1,300
Fair Gap "Fix Fair"Total Unit Cost* Poor Gap "Fix Poor"
Total Unit Cost*Goal Constrained
Need
(*) The unit costs represent a multi-year programmatic average of a number of activities included within this objective. These costs should not be used for project level estimates.(**) The support ratios represent a multi-year cost-weighted average of a number of activities included within this objective. These ratios should not be used for project level estimates.
District Projected Quantity ReplacementTotal Unit Cost* Estimated Value New Gap "Add New"
Total Unit Cost*
$5,027,201,584Unfunded Pipelined SHOPP Projects $301,421,000 SHOPP Performance Gap $2,265,476,000
District Breakdown
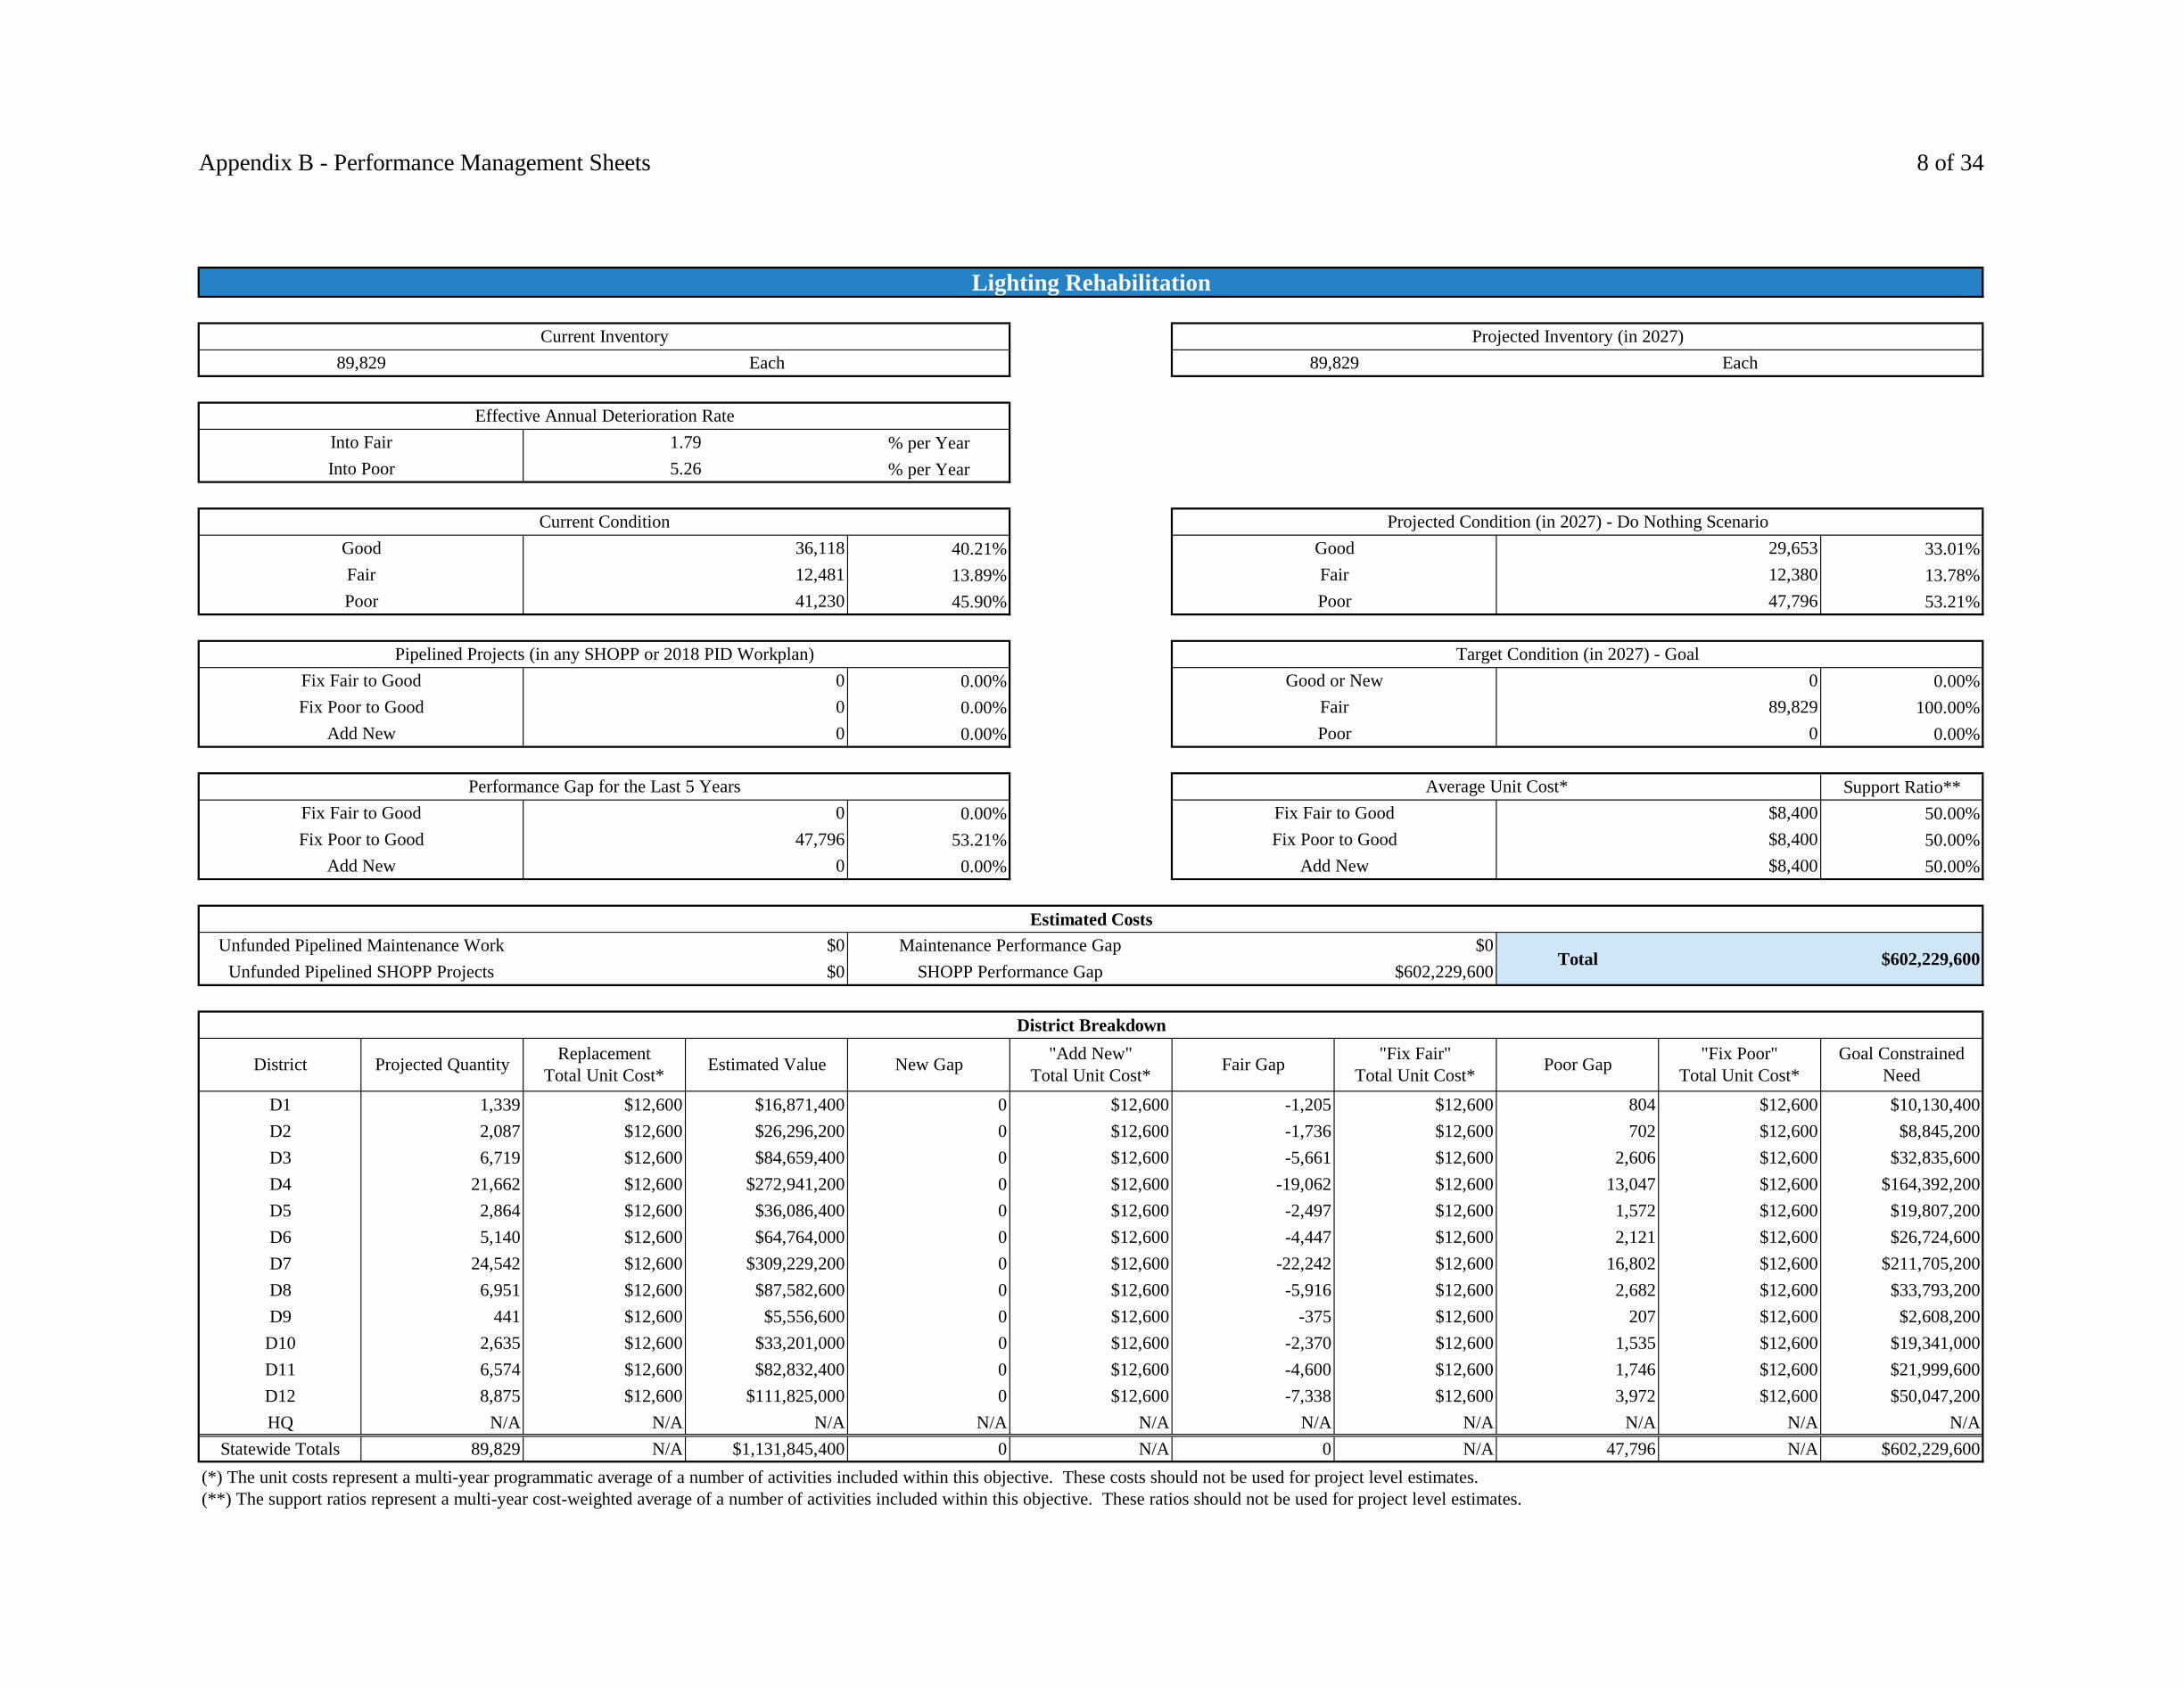
Appendix B - Performance Management Sheets 8 of 34
% per Year% per Year
40.21% 33.01%13.89% 13.78%45.90% 53.21%
0.00% 0.00%0.00% 100.00%0.00% 0.00%
Support Ratio**0.00% 50.00%
53.21% 50.00%0.00% 50.00%
D1 1,339 $12,600 $16,871,400 0 $12,600 -1,205 $12,600 804 $12,600 $10,130,400D2 2,087 $12,600 $26,296,200 0 $12,600 -1,736 $12,600 702 $12,600 $8,845,200D3 6,719 $12,600 $84,659,400 0 $12,600 -5,661 $12,600 2,606 $12,600 $32,835,600D4 21,662 $12,600 $272,941,200 0 $12,600 -19,062 $12,600 13,047 $12,600 $164,392,200D5 2,864 $12,600 $36,086,400 0 $12,600 -2,497 $12,600 1,572 $12,600 $19,807,200D6 5,140 $12,600 $64,764,000 0 $12,600 -4,447 $12,600 2,121 $12,600 $26,724,600D7 24,542 $12,600 $309,229,200 0 $12,600 -22,242 $12,600 16,802 $12,600 $211,705,200D8 6,951 $12,600 $87,582,600 0 $12,600 -5,916 $12,600 2,682 $12,600 $33,793,200D9 441 $12,600 $5,556,600 0 $12,600 -375 $12,600 207 $12,600 $2,608,200
D10 2,635 $12,600 $33,201,000 0 $12,600 -2,370 $12,600 1,535 $12,600 $19,341,000D11 6,574 $12,600 $82,832,400 0 $12,600 -4,600 $12,600 1,746 $12,600 $21,999,600D12 8,875 $12,600 $111,825,000 0 $12,600 -7,338 $12,600 3,972 $12,600 $50,047,200HQ N/A N/A N/A N/A N/A N/A N/A N/A N/A N/A
Statewide Totals 89,829 N/A $1,131,845,400 0 N/A 0 N/A 47,796 N/A $602,229,600
Projected Condition (in 2027) - Do Nothing ScenarioGood 36,118 Good 29,653Fair 12,481 Fair 12,380
Effective Annual Deterioration RateInto Fair 1.79Into Poor 5.26
Current Condition
Lighting Rehabilitation
Current Inventory Projected Inventory (in 2027)89,829 Each 89,829 Each
Add New 0 Poor 0
Performance Gap for the Last 5 Years Average Unit Cost*
Fix Fair to Good 0 Good or New 0Fix Poor to Good 0 Fair 89,829
Poor 41,230 Poor 47,796
Pipelined Projects (in any SHOPP or 2018 PID Workplan) Target Condition (in 2027) - Goal
Add New 0 Add New $8,400
Estimated CostsUnfunded Pipelined Maintenance Work $0 Maintenance Performance Gap $0
Total
Fix Fair to Good 0 Fix Fair to Good $8,400Fix Poor to Good 47,796 Fix Poor to Good $8,400
Fair Gap "Fix Fair"Total Unit Cost* Poor Gap "Fix Poor"
Total Unit Cost*Goal Constrained
Need
(*) The unit costs represent a multi-year programmatic average of a number of activities included within this objective. These costs should not be used for project level estimates.(**) The support ratios represent a multi-year cost-weighted average of a number of activities included within this objective. These ratios should not be used for project level estimates.
District Projected Quantity ReplacementTotal Unit Cost* Estimated Value New Gap "Add New"
Total Unit Cost*
$602,229,600Unfunded Pipelined SHOPP Projects $0 SHOPP Performance Gap $602,229,600
District Breakdown
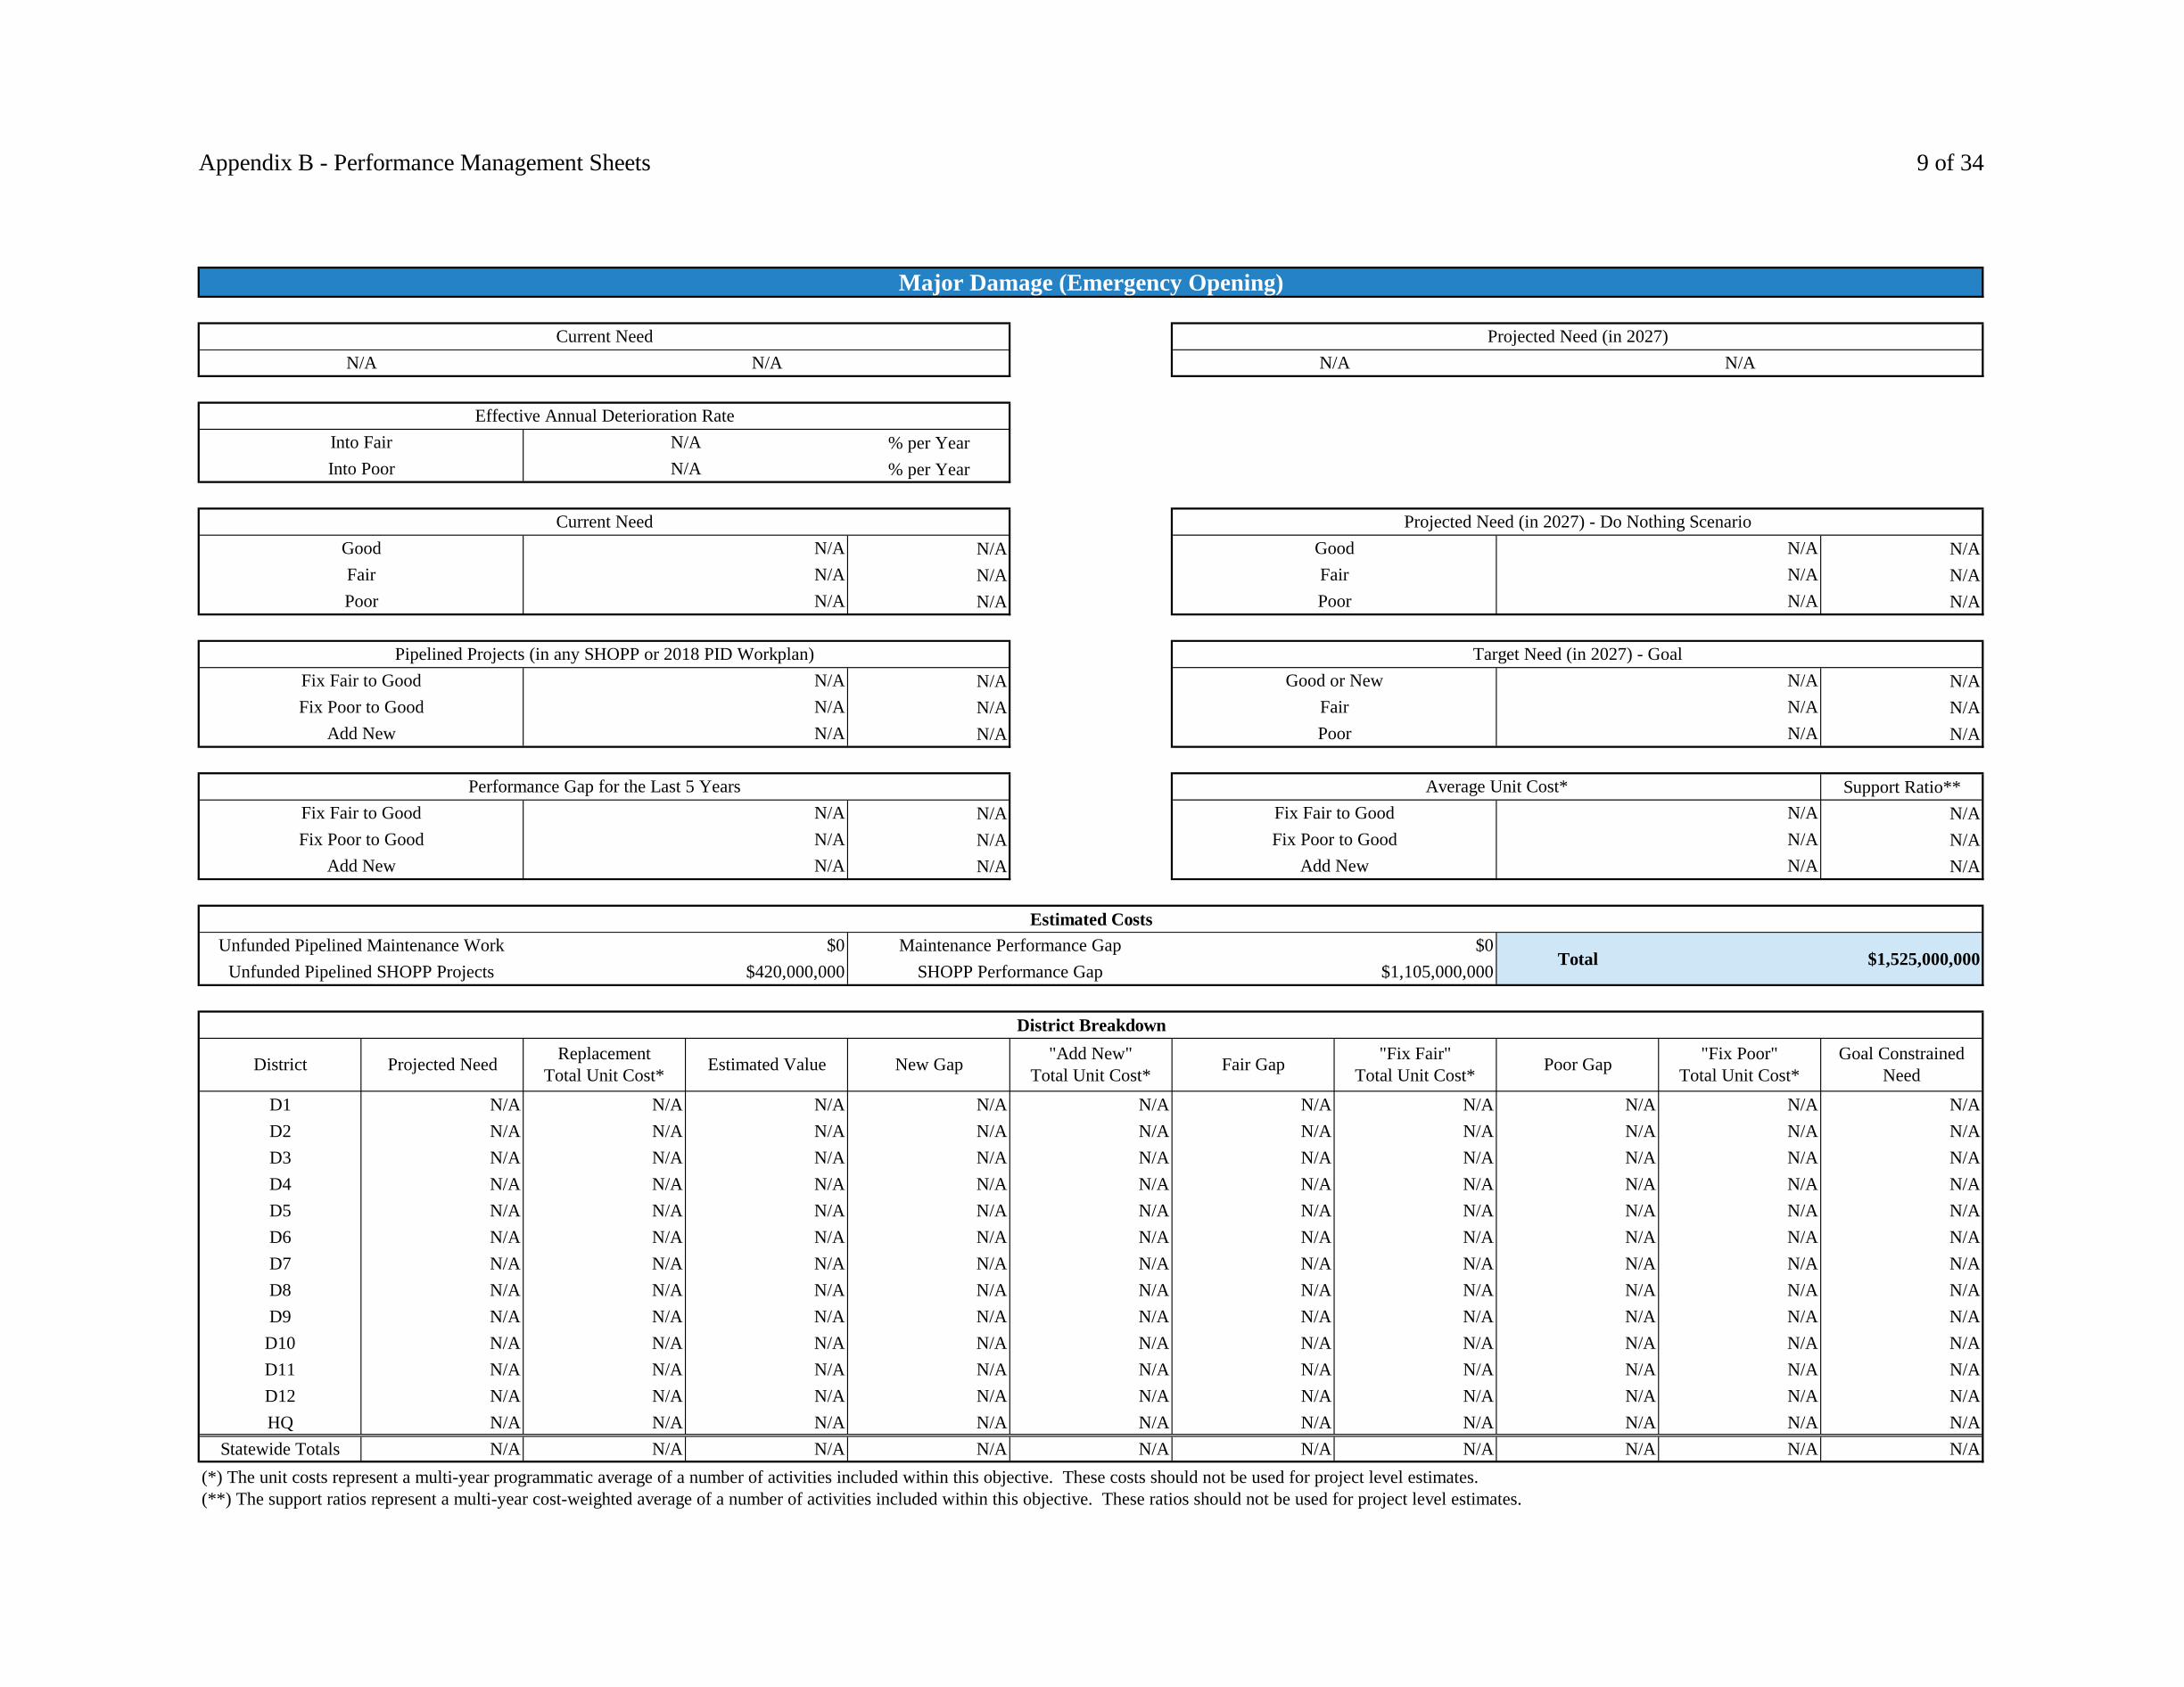
Appendix B - Performance Management Sheets 9 of 34
% per Year% per Year
N/A N/AN/A N/AN/A N/A
N/A N/AN/A N/AN/A N/A
Support Ratio**N/A N/AN/A N/AN/A N/A
D1 N/A N/A N/A N/A N/A N/A N/A N/A N/A N/AD2 N/A N/A N/A N/A N/A N/A N/A N/A N/A N/AD3 N/A N/A N/A N/A N/A N/A N/A N/A N/A N/AD4 N/A N/A N/A N/A N/A N/A N/A N/A N/A N/AD5 N/A N/A N/A N/A N/A N/A N/A N/A N/A N/AD6 N/A N/A N/A N/A N/A N/A N/A N/A N/A N/AD7 N/A N/A N/A N/A N/A N/A N/A N/A N/A N/AD8 N/A N/A N/A N/A N/A N/A N/A N/A N/A N/AD9 N/A N/A N/A N/A N/A N/A N/A N/A N/A N/A
D10 N/A N/A N/A N/A N/A N/A N/A N/A N/A N/AD11 N/A N/A N/A N/A N/A N/A N/A N/A N/A N/AD12 N/A N/A N/A N/A N/A N/A N/A N/A N/A N/AHQ N/A N/A N/A N/A N/A N/A N/A N/A N/A N/A
Statewide Totals N/A N/A N/A N/A N/A N/A N/A N/A N/A N/A
Projected Need (in 2027) - Do Nothing ScenarioGood N/A Good N/AFair N/A Fair N/A
Effective Annual Deterioration RateInto Fair N/AInto Poor N/A
Current Need
Major Damage (Emergency Opening)
Current Need Projected Need (in 2027)N/A N/A N/A N/A
Add New N/A Poor N/A
Performance Gap for the Last 5 Years Average Unit Cost*
Fix Fair to Good N/A Good or New N/AFix Poor to Good N/A Fair N/A
Poor N/A Poor N/A
Pipelined Projects (in any SHOPP or 2018 PID Workplan) Target Need (in 2027) - Goal
Add New N/A Add New N/A
Estimated CostsUnfunded Pipelined Maintenance Work $0 Maintenance Performance Gap $0
Total
Fix Fair to Good N/A Fix Fair to Good N/AFix Poor to Good N/A Fix Poor to Good N/A
Fair Gap "Fix Fair"Total Unit Cost* Poor Gap "Fix Poor"
Total Unit Cost*Goal Constrained
Need
(*) The unit costs represent a multi-year programmatic average of a number of activities included within this objective. These costs should not be used for project level estimates.(**) The support ratios represent a multi-year cost-weighted average of a number of activities included within this objective. These ratios should not be used for project level estimates.
District Projected Need ReplacementTotal Unit Cost* Estimated Value New Gap "Add New"
Total Unit Cost*
$1,525,000,000Unfunded Pipelined SHOPP Projects $420,000,000 SHOPP Performance Gap $1,105,000,000
District Breakdown

Appendix B - Performance Management Sheets 10 of 34
% per Year% per Year
N/A N/AN/A N/AN/A N/A
N/A N/AN/A N/AN/A N/A
Support Ratio**N/A N/AN/A N/AN/A N/A
D1 N/A N/A N/A N/A N/A N/A N/A N/A N/A N/AD2 N/A N/A N/A N/A N/A N/A N/A N/A N/A N/AD3 N/A N/A N/A N/A N/A N/A N/A N/A N/A N/AD4 N/A N/A N/A N/A N/A N/A N/A N/A N/A N/AD5 N/A N/A N/A N/A N/A N/A N/A N/A N/A N/AD6 N/A N/A N/A N/A N/A N/A N/A N/A N/A N/AD7 N/A N/A N/A N/A N/A N/A N/A N/A N/A N/AD8 N/A N/A N/A N/A N/A N/A N/A N/A N/A N/AD9 N/A N/A N/A N/A N/A N/A N/A N/A N/A N/A
D10 N/A N/A N/A N/A N/A N/A N/A N/A N/A N/AD11 N/A N/A N/A N/A N/A N/A N/A N/A N/A N/AD12 N/A N/A N/A N/A N/A N/A N/A N/A N/A N/AHQ N/A N/A N/A N/A N/A N/A N/A N/A N/A N/A
Statewide Totals N/A N/A N/A N/A N/A N/A N/A N/A N/A N/A
Projected Need (in 2027) - Do Nothing ScenarioGood N/A Good N/AFair N/A Fair N/A
Effective Annual Deterioration RateInto Fair N/AInto Poor N/A
Current Need
Major Damage (Permanent Restoration)
Current Need Projected Need (in 2027)N/A N/A N/A N/A
Add New N/A Poor N/A
Performance Gap for the Last 5 Years Average Unit Cost*
Fix Fair to Good N/A Good or New N/AFix Poor to Good N/A Fair N/A
Poor N/A Poor N/A
Pipelined Projects (in any SHOPP or 2018 PID Workplan) Target Need (in 2027) - Goal
Add New N/A Add New N/A
Estimated CostsUnfunded Pipelined Maintenance Work $0 Maintenance Performance Gap $0
Total
Fix Fair to Good N/A Fix Fair to Good N/AFix Poor to Good N/A Fix Poor to Good N/A
Fair Gap "Fix Fair"Total Unit Cost* Poor Gap "Fix Poor"
Total Unit Cost*Goal Constrained
Need
(*) The unit costs represent a multi-year programmatic average of a number of activities included within this objective. These costs should not be used for project level estimates.(**) The support ratios represent a multi-year cost-weighted average of a number of activities included within this objective. These ratios should not be used for project level estimates.
District Projected Need ReplacementTotal Unit Cost* Estimated Value New Gap "Add New"
Total Unit Cost*
$1,334,930,000Unfunded Pipelined SHOPP Projects $530,930,000 SHOPP Performance Gap $804,000,000
District Breakdown

Appendix B - Performance Management Sheets 11 of 34
% per Year% per Year
41.86% 28.92%31.60% 43.63%26.54% 27.45%
0.00% 60.00%0.00% 40.00%0.00% 0.00%
Support Ratio**23.45% 0.00%27.45% 0.00%0.00% 0.00%
D1 91,456 $769 $70,329,664 0 $769 -32,406 $60 0 $769 $0D2 47,851 $769 $36,797,419 0 $769 -19,140 $60 47,851 $769 $36,797,419D3 0 $769 $0 0 $769 0 $60 0 $769 $0D4 750,000 $652 $489,000,000 0 $652 450,000 $13 0 $652 $5,850,000D5 41,700 $918 $38,280,600 0 $918 -16,680 $13 41,700 $918 $38,280,600D6 78,000 $996 $77,688,000 0 $996 -31,200 $13 78,000 $996 $77,688,000D7 716,200 $652 $466,962,400 0 $652 -286,480 $13 0 $652 $0D8 336,000 $652 $219,072,000 0 $652 201,600 $13 0 $652 $2,620,800D9 37,496 $1,736 $65,093,056 0 $1,736 -14,998 $13 37,496 $1,736 $65,093,056
D10 91,174 $716 $65,280,584 0 $716 -36,470 $13 91,174 $716 $65,280,584D11 0 $652 $0 0 $652 0 $13 0 $652 $0D12 0 $652 $0 0 $652 0 $13 0 $652 $0HQ 588,422 $428 $251,844,616 0 $428 -113,371 $9 466,424 $428 $199,629,472
Statewide Totals 2,778,299 N/A $1,780,348,339 0 N/A 651,600 N/A 762,645 N/A $491,239,931
Projected Condition (in 2027) - Do Nothing ScenarioGood 1,163,096 Good 803,480Fair 877,944 Fair 1,212,174
Effective Annual Deterioration RateInto Fair 3.09Into Poor 0.29
Current Condition
Office Buildings
Current Inventory Projected Inventory (in 2027)2,778,299 SF 2,778,299 SF
Add New 0 Poor 0
Performance Gap for the Last 5 Years Average Unit Cost*
Fix Fair to Good 0 Good or New 1,666,980Fix Poor to Good 0 Fair 1,111,319
Poor 737,259 Poor 762,645
Pipelined Projects (in any SHOPP or 2018 PID Workplan) Target Condition (in 2027) - Goal
Add New 0 Add New $633
Estimated CostsUnfunded Pipelined Maintenance Work $0 Maintenance Performance Gap $0
Total
Fix Fair to Good 651,600 Fix Fair to Good $13Fix Poor to Good 762,645 Fix Poor to Good $633
Fair Gap "Fix Fair"Total Unit Cost* Poor Gap "Fix Poor"
Total Unit Cost*Goal Constrained
Need
(*) The unit costs represent a multi-year programmatic average of a number of activities included within this objective. These costs should not be used for project level estimates.(**) The support ratios represent a multi-year cost-weighted average of a number of activities included within this objective. These ratios should not be used for project level estimates.
District Projected Quantity ReplacementTotal Unit Cost* Estimated Value New Gap "Add New"
Total Unit Cost*
$491,225,085Unfunded Pipelined SHOPP Projects $0 SHOPP Performance Gap $491,225,085
District Breakdown

Appendix B - Performance Management Sheets 12 of 34
% per Year% per Year
74.47% 61.14%21.76% 23.66%3.76% 15.21%
0.00% 0.00%0.00% 100.00%0.00% 0.00%
Support Ratio**0.00% 60.00%
15.21% 60.00%0.00% 60.00%
D1 74 $192,000 $14,208,000 0 $192,000 -61 $192,000 0 $192,000 $0D2 117 $192,000 $22,464,000 0 $192,000 -96 $192,000 0 $192,000 $0D3 1,259 $192,000 $241,728,000 0 $192,000 -1,008 $192,000 62 $192,000 $11,904,000D4 3,121 $192,000 $599,232,000 0 $192,000 -2,454 $192,000 231 $192,000 $44,352,000D5 236 $192,000 $45,312,000 0 $192,000 -182 $192,000 24 $192,000 $4,608,000D6 1,095 $192,000 $210,240,000 0 $192,000 -861 $192,000 78 $192,000 $14,976,000D7 4,559 $192,000 $875,328,000 0 $192,000 -3,385 $192,000 1,264 $192,000 $242,688,000D8 1,730 $192,000 $332,160,000 0 $192,000 -1,281 $192,000 308 $192,000 $59,136,000D9 10 $192,000 $1,920,000 0 $192,000 -8 $192,000 0 $192,000 $0
D10 482 $192,000 $92,544,000 0 $192,000 -377 $192,000 44 $192,000 $8,448,000D11 2,228 $192,000 $427,776,000 0 $192,000 -1,691 $192,000 280 $192,000 $53,760,000D12 1,559 $192,000 $299,328,000 0 $192,000 -1,170 $192,000 214 $192,000 $41,088,000HQ N/A N/A N/A N/A N/A N/A N/A N/A N/A N/A
Statewide Totals 16,470 N/A $3,162,240,000 0 N/A 0 N/A 2,505 N/A $480,960,000
Projected Condition (in 2027) - Do Nothing ScenarioGood 12,266 Good 10,069Fair 3,584 Fair 3,896
Effective Annual Deterioration RateInto Fair 1.79Into Poor 5.26
Current Condition
Overhead Sign Structures Rehabilitation
Current Inventory Projected Inventory (in 2027)16,470 Each 16,470 Each
Add New 0 Poor 0
Performance Gap for the Last 5 Years Average Unit Cost*
Fix Fair to Good 0 Good or New 0Fix Poor to Good 0 Fair 16,470
Poor 620 Poor 2,505
Pipelined Projects (in any SHOPP or 2018 PID Workplan) Target Condition (in 2027) - Goal
Add New 0 Add New $120,000
Estimated CostsUnfunded Pipelined Maintenance Work $0 Maintenance Performance Gap $0
Total
Fix Fair to Good 0 Fix Fair to Good $120,000Fix Poor to Good 2,505 Fix Poor to Good $120,000
Fair Gap "Fix Fair"Total Unit Cost* Poor Gap "Fix Poor"
Total Unit Cost*Goal Constrained
Need
(*) The unit costs represent a multi-year programmatic average of a number of activities included within this objective. These costs should not be used for project level estimates.(**) The support ratios represent a multi-year cost-weighted average of a number of activities included within this objective. These ratios should not be used for project level estimates.
District Projected Quantity ReplacementTotal Unit Cost* Estimated Value New Gap "Add New"
Total Unit Cost*
$480,960,000Unfunded Pipelined SHOPP Projects $0 SHOPP Performance Gap $480,960,000
District Breakdown

Appendix B - Performance Management Sheets 13 of 34
% per Year% per Year
45.08% 4.53%50.54% 77.55%4.38% 17.92%
22.51% 60.00%2.57% 39.00%0.00% 1.00%
Support Ratio**17.68% 15.04%14.35% 20.00%0.00% 20.00%
D1 1,063 $1,323,600 $1,406,986,800 0 $1,323,600 415 $891,152 68 $1,155,600 $448,408,880D2 934 $1,323,600 $1,236,242,400 0 $1,323,600 343 $990,328 91 $1,016,400 $432,174,904D3 1,792 $1,323,600 $2,371,891,200 0 $1,323,600 652 $994,376 75 $1,274,400 $743,913,152D4 3,470 $1,323,600 $4,592,892,000 0 $1,323,600 73 $481,292 1,004 $1,363,200 $1,403,787,116D5 1,170 $1,323,600 $1,548,612,000 0 $1,323,600 440 $868,888 43 $1,188,000 $433,394,720D6 2,100 $1,323,600 $2,779,560,000 0 $1,323,600 370 $824,360 327 $1,236,000 $709,185,200D7 4,424 $1,323,600 $5,855,606,400 0 $1,323,600 -423 $412,476 759 $1,662,000 $1,261,458,000D8 4,212 $1,323,600 $5,575,003,200 0 $1,323,600 368 $714,052 747 $1,254,000 $1,199,509,136D9 1,435 $1,323,600 $1,899,366,000 0 $1,323,600 705 $699,884 51 $1,178,400 $553,516,620
D10 1,303 $1,323,600 $1,724,650,800 0 $1,323,600 273 $915,440 110 $1,257,600 $388,251,120D11 2,741 $1,323,600 $3,627,987,600 0 $1,323,600 718 $684,704 171 $1,758,000 $792,235,472D12 1,370 $1,323,600 $1,813,332,000 0 $1,323,600 241 $689,764 286 $1,539,600 $606,558,724HQ N/A N/A N/A N/A N/A N/A N/A N/A N/A N/A
Statewide Totals 26,014 N/A $34,432,130,400 0 N/A 4,598 N/A 3,732 N/A $8,972,393,044
Projected Condition (in 2027) - Do Nothing ScenarioGood 11,726 Good 1,178Fair 13,148 Fair 20,175
Effective Annual Deterioration RateInto Fair 9.00Into Poor 2.68
Current Condition
Pavement Class I
Current Inventory Projected Inventory (in 2027)26,014 Lane Miles 26,014 Lane Miles
Add New 0 Poor 260
Performance Gap for the Last 5 Years Average Unit Cost*
Fix Fair to Good 5,855 Good or New 15,609Fix Poor to Good 669 Fair 10,145
Poor 1,140 Poor 4,661
Pipelined Projects (in any SHOPP or 2018 PID Workplan) Target Condition (in 2027) - Goal
Add New 0 Add New $1,103,000
Estimated CostsUnfunded Pipelined Maintenance Work $0 Maintenance Performance Gap $67,866,480
Total
Fix Fair to Good 4,598 Fix Fair to Good $707,872Fix Poor to Good 3,732 Fix Poor to Good $1,167,412
Fair Gap "Fix Fair"Total Unit Cost* Poor Gap "Fix Poor"
Total Unit Cost*Goal Constrained
Need
(*) The unit costs represent a multi-year programmatic average of a number of activities included within this objective. These costs should not be used for project level estimates.(**) The support ratios represent a multi-year cost-weighted average of a number of activities included within this objective. These ratios should not be used for project level estimates.
District Projected Quantity ReplacementTotal Unit Cost* Estimated Value New Gap "Add New"
Total Unit Cost*
$12,619,824,725Unfunded Pipelined SHOPP Projects $3,647,432,450 SHOPP Performance Gap $8,904,525,795
District Breakdown

Appendix B - Performance Management Sheets 14 of 34
% per Year% per Year
35.60% 4.36%57.62% 69.43%6.77% 26.22%
16.76% 55.00%1.73% 43.00%0.00% 2.00%
Support Ratio**12.64% 15.31%22.48% 20.00%0.00% 20.00%
D1 732 $714,000 $522,648,000 0 $714,000 160 $282,250 129 $600,000 $122,560,000D2 1,886 $714,000 $1,346,604,000 0 $714,000 420 $282,250 243 $600,000 $264,345,000D3 1,848 $714,000 $1,319,472,000 0 $714,000 366 $301,237 299 $904,800 $380,787,942D4 2,078 $714,000 $1,483,692,000 0 $714,000 -179 $291,519 876 $748,800 $655,948,800D5 1,374 $714,000 $981,036,000 0 $714,000 77 $284,642 273 $638,400 $196,200,634D6 1,536 $714,000 $1,096,704,000 0 $714,000 405 $308,712 264 $1,024,800 $395,575,560D7 1,586 $714,000 $1,132,404,000 0 $714,000 -280 $290,398 512 $730,800 $374,169,600D8 1,947 $714,000 $1,390,158,000 0 $714,000 103 $283,446 407 $619,200 $281,209,338D9 627 $714,000 $447,678,000 0 $714,000 252 $282,250 13 $600,000 $78,927,000
D10 1,589 $714,000 $1,134,546,000 0 $714,000 123 $292,939 348 $771,600 $304,548,297D11 1,041 $714,000 $743,274,000 0 $714,000 212 $289,202 247 $711,600 $237,076,024D12 515 $714,000 $367,710,000 0 $714,000 -40 $282,624 156 $606,000 $94,536,000HQ N/A N/A N/A N/A N/A N/A N/A N/A N/A N/A
Statewide Totals 16,759 N/A $11,965,926,000 0 N/A 2,118 N/A 3,767 N/A $3,385,884,195
Projected Condition (in 2027) - Do Nothing ScenarioGood 5,967 Good 730Fair 9,657 Fair 11,635
Effective Annual Deterioration RateInto Fair 8.78Into Poor 3.37
Current Condition
Pavement Class II
Current Inventory Projected Inventory (in 2027)16,759 Lane Miles 16,759 Lane Miles
Add New 0 Poor 337
Performance Gap for the Last 5 Years Average Unit Cost*
Fix Fair to Good 2,809 Good or New 9,215Fix Poor to Good 290 Fair 7,207
Poor 1,135 Poor 4,394
Pipelined Projects (in any SHOPP or 2018 PID Workplan) Target Condition (in 2027) - Goal
Add New 0 Add New $595,000
Estimated CostsUnfunded Pipelined Maintenance Work $0 Maintenance Performance Gap $91,179,900
Total
Fix Fair to Good 2,118 Fix Fair to Good $253,274Fix Poor to Good 3,767 Fix Poor to Good $612,184
Fair Gap "Fix Fair"Total Unit Cost* Poor Gap "Fix Poor"
Total Unit Cost*Goal Constrained
Need
(*) The unit costs represent a multi-year programmatic average of a number of activities included within this objective. These costs should not be used for project level estimates.(**) The support ratios represent a multi-year cost-weighted average of a number of activities included within this objective. These ratios should not be used for project level estimates.
District Projected Quantity ReplacementTotal Unit Cost* Estimated Value New Gap "Add New"
Total Unit Cost*
$5,061,673,301Unfunded Pipelined SHOPP Projects $1,675,788,481 SHOPP Performance Gap $3,294,704,920
District Breakdown
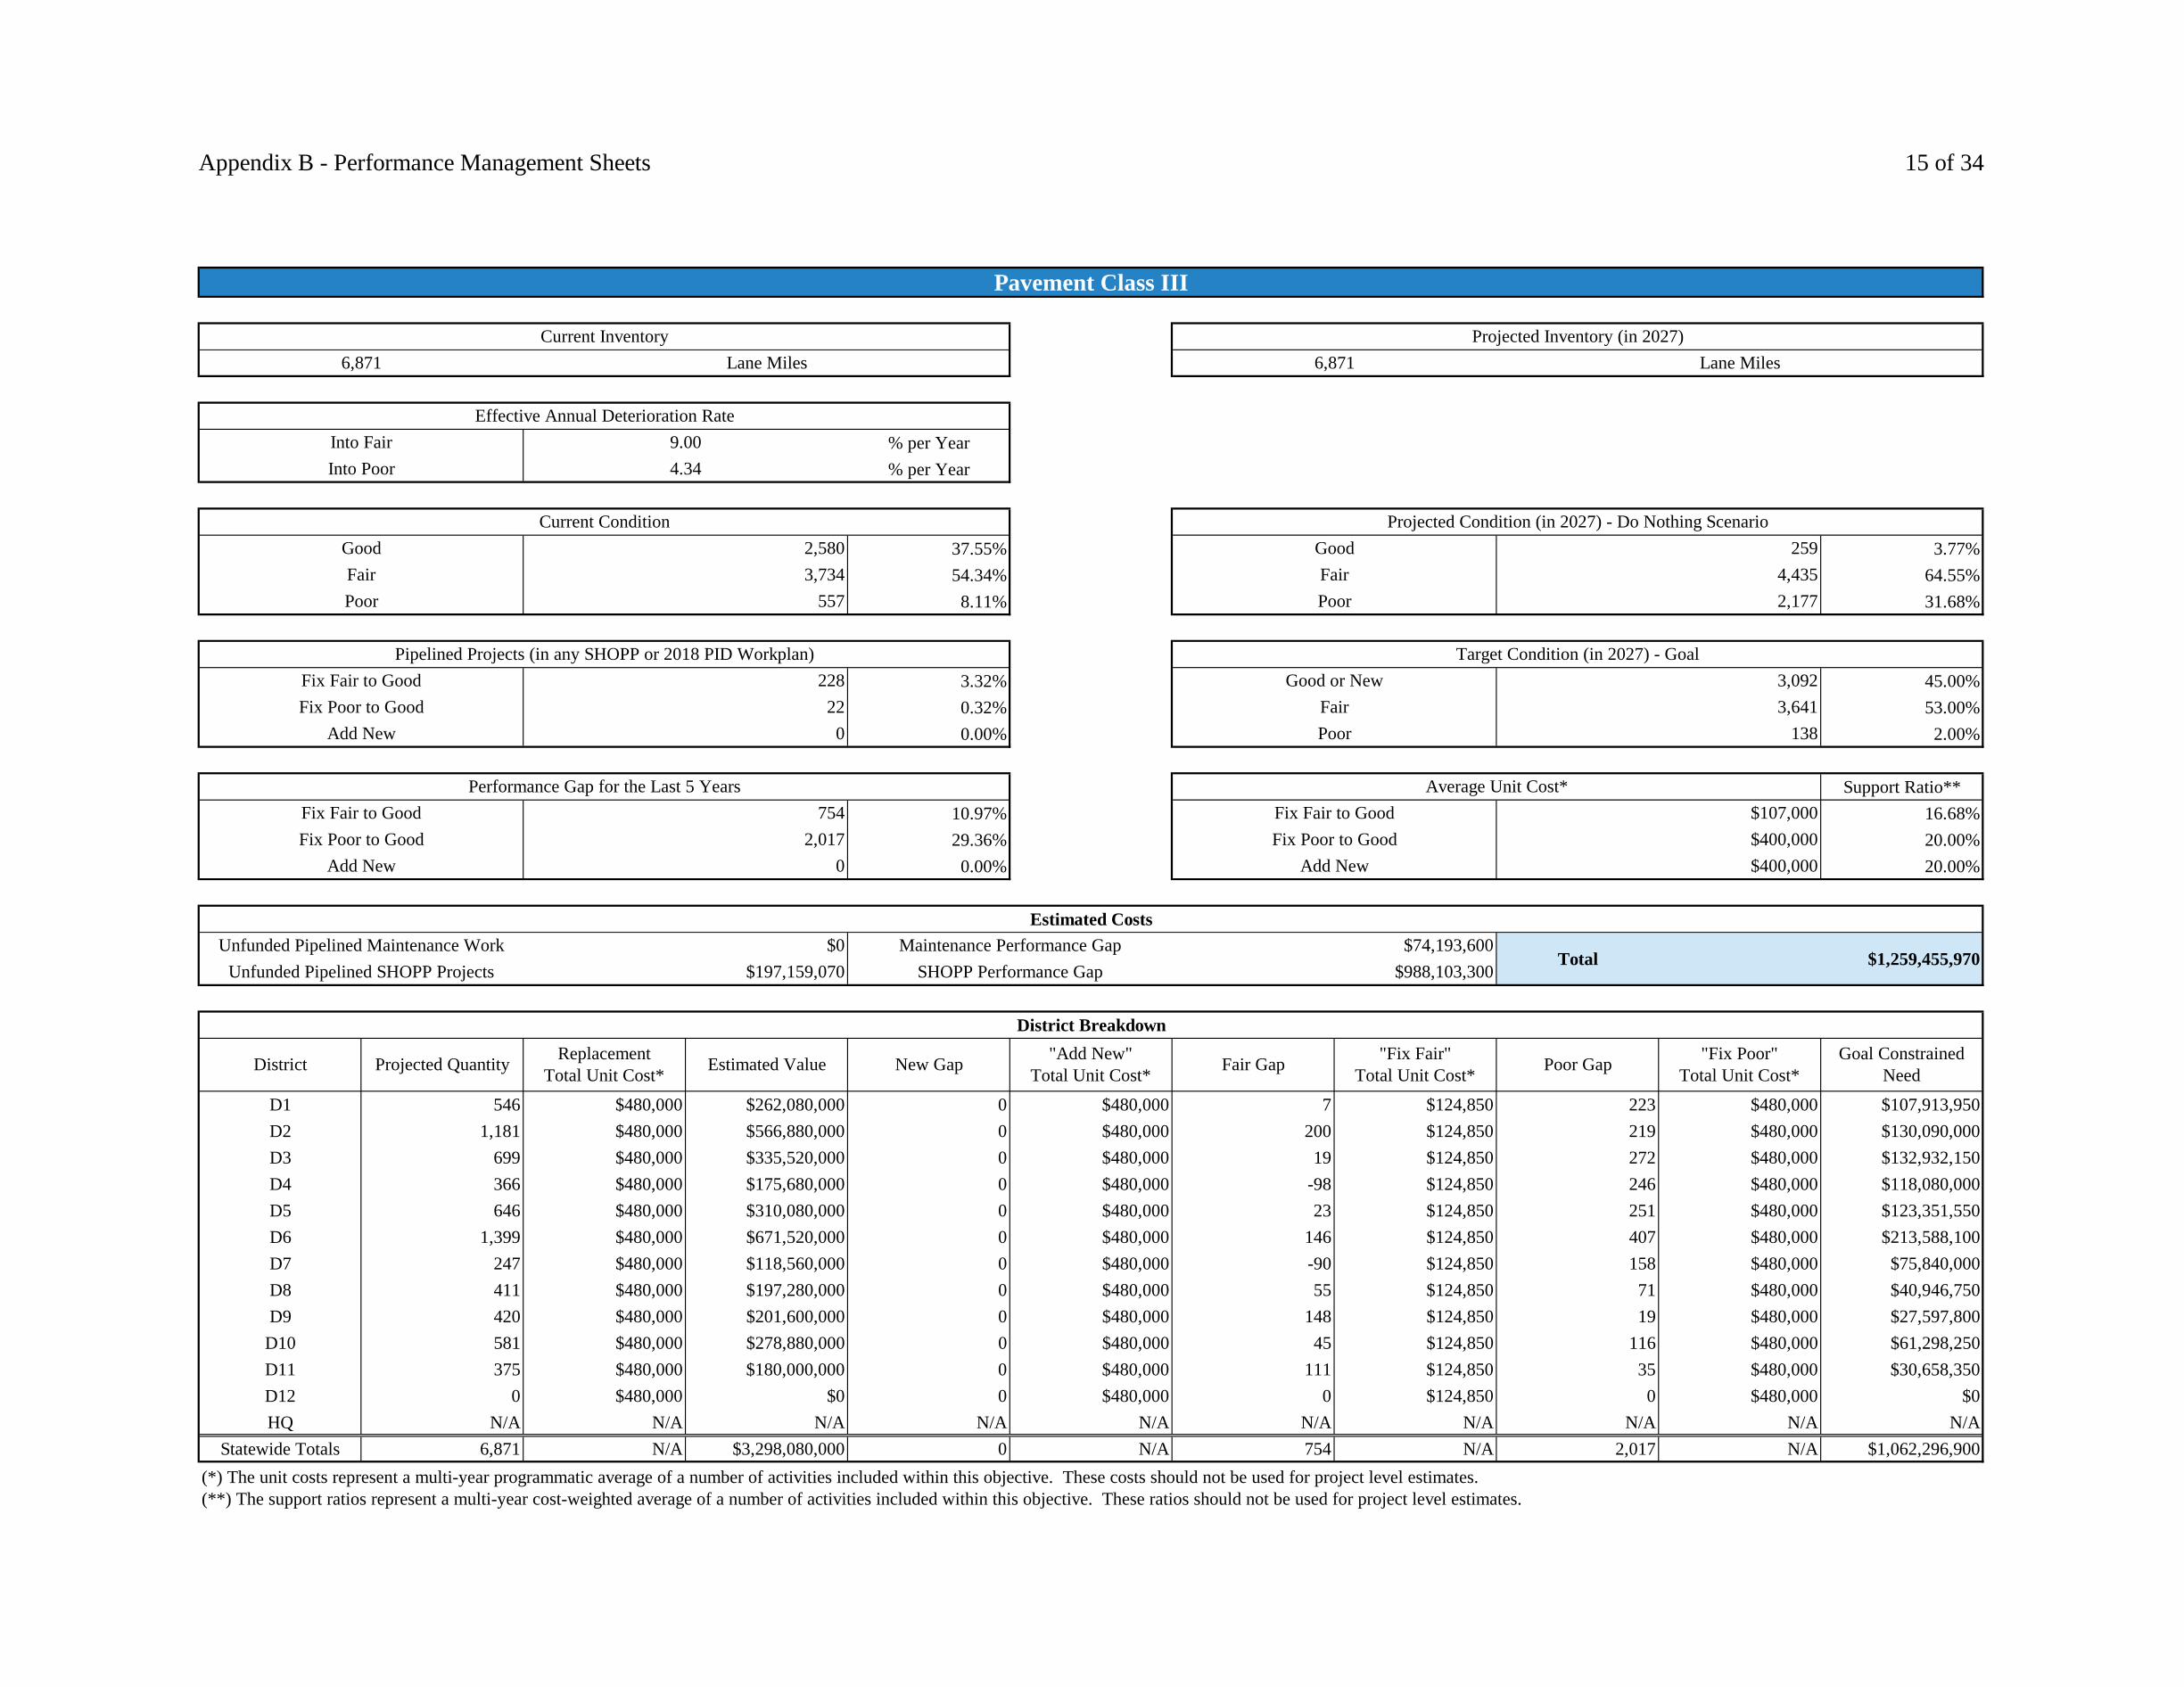
Appendix B - Performance Management Sheets 15 of 34
% per Year% per Year
37.55% 3.77%54.34% 64.55%8.11% 31.68%
3.32% 45.00%0.32% 53.00%0.00% 2.00%
Support Ratio**10.97% 16.68%29.36% 20.00%0.00% 20.00%
D1 546 $480,000 $262,080,000 0 $480,000 7 $124,850 223 $480,000 $107,913,950D2 1,181 $480,000 $566,880,000 0 $480,000 200 $124,850 219 $480,000 $130,090,000D3 699 $480,000 $335,520,000 0 $480,000 19 $124,850 272 $480,000 $132,932,150D4 366 $480,000 $175,680,000 0 $480,000 -98 $124,850 246 $480,000 $118,080,000D5 646 $480,000 $310,080,000 0 $480,000 23 $124,850 251 $480,000 $123,351,550D6 1,399 $480,000 $671,520,000 0 $480,000 146 $124,850 407 $480,000 $213,588,100D7 247 $480,000 $118,560,000 0 $480,000 -90 $124,850 158 $480,000 $75,840,000D8 411 $480,000 $197,280,000 0 $480,000 55 $124,850 71 $480,000 $40,946,750D9 420 $480,000 $201,600,000 0 $480,000 148 $124,850 19 $480,000 $27,597,800
D10 581 $480,000 $278,880,000 0 $480,000 45 $124,850 116 $480,000 $61,298,250D11 375 $480,000 $180,000,000 0 $480,000 111 $124,850 35 $480,000 $30,658,350D12 0 $480,000 $0 0 $480,000 0 $124,850 0 $480,000 $0HQ N/A N/A N/A N/A N/A N/A N/A N/A N/A N/A
Statewide Totals 6,871 N/A $3,298,080,000 0 N/A 754 N/A 2,017 N/A $1,062,296,900
Projected Condition (in 2027) - Do Nothing ScenarioGood 2,580 Good 259Fair 3,734 Fair 4,435
Effective Annual Deterioration RateInto Fair 9.00Into Poor 4.34
Current Condition
Pavement Class III
Current Inventory Projected Inventory (in 2027)6,871 Lane Miles 6,871 Lane Miles
Add New 0 Poor 138
Performance Gap for the Last 5 Years Average Unit Cost*
Fix Fair to Good 228 Good or New 3,092Fix Poor to Good 22 Fair 3,641
Poor 557 Poor 2,177
Pipelined Projects (in any SHOPP or 2018 PID Workplan) Target Condition (in 2027) - Goal
Add New 0 Add New $400,000
Estimated CostsUnfunded Pipelined Maintenance Work $0 Maintenance Performance Gap $74,193,600
Total
Fix Fair to Good 754 Fix Fair to Good $107,000Fix Poor to Good 2,017 Fix Poor to Good $400,000
Fair Gap "Fix Fair"Total Unit Cost* Poor Gap "Fix Poor"
Total Unit Cost*Goal Constrained
Need
(*) The unit costs represent a multi-year programmatic average of a number of activities included within this objective. These costs should not be used for project level estimates.(**) The support ratios represent a multi-year cost-weighted average of a number of activities included within this objective. These ratios should not be used for project level estimates.
District Projected Quantity ReplacementTotal Unit Cost* Estimated Value New Gap "Add New"
Total Unit Cost*
$1,259,455,970Unfunded Pipelined SHOPP Projects $197,159,070 SHOPP Performance Gap $988,103,300
District Breakdown

Appendix B - Performance Management Sheets 16 of 34
% per Year% per Year
N/A N/AN/A N/AN/A N/A
N/A N/AN/A N/AN/A N/A
Support Ratio**N/A N/AN/A N/AN/A N/A
D1 N/A N/A N/A N/A N/A N/A N/A N/A N/A N/AD2 N/A N/A N/A N/A N/A N/A N/A N/A N/A N/AD3 N/A N/A N/A N/A N/A N/A N/A N/A N/A N/AD4 N/A N/A N/A N/A N/A N/A N/A N/A N/A N/AD5 N/A N/A N/A N/A N/A N/A N/A N/A N/A N/AD6 N/A N/A N/A N/A N/A N/A N/A N/A N/A N/AD7 N/A N/A N/A N/A N/A N/A N/A N/A N/A N/AD8 N/A N/A N/A N/A N/A N/A N/A N/A N/A N/AD9 N/A N/A N/A N/A N/A N/A N/A N/A N/A N/A
D10 N/A N/A N/A N/A N/A N/A N/A N/A N/A N/AD11 N/A N/A N/A N/A N/A N/A N/A N/A N/A N/AD12 N/A N/A N/A N/A N/A N/A N/A N/A N/A N/AHQ N/A N/A N/A N/A N/A N/A N/A N/A N/A N/A
Statewide Totals N/A N/A N/A N/A N/A N/A N/A N/A N/A N/A
Projected Need (in 2027) - Do Nothing ScenarioGood N/A Good N/AFair N/A Fair N/A
Effective Annual Deterioration RateInto Fair N/AInto Poor N/A
Current Need
Relinquishments
Current Need Projected Need (in 2027)N/A N/A N/A N/A
Add New N/A Poor N/A
Performance Gap for the Last 5 Years Average Unit Cost*
Fix Fair to Good N/A Good or New N/AFix Poor to Good N/A Fair N/A
Poor N/A Poor N/A
Pipelined Projects (in any SHOPP or 2018 PID Workplan) Target Need (in 2027) - Goal
Add New N/A Add New N/A
Estimated CostsUnfunded Pipelined Maintenance Work $0 Maintenance Performance Gap $0
Total
Fix Fair to Good N/A Fix Fair to Good N/AFix Poor to Good N/A Fix Poor to Good N/A
Fair Gap "Fix Fair"Total Unit Cost* Poor Gap "Fix Poor"
Total Unit Cost*Goal Constrained
Need
(*) The unit costs represent a multi-year programmatic average of a number of activities included within this objective. These costs should not be used for project level estimates.(**) The support ratios represent a multi-year cost-weighted average of a number of activities included within this objective. These ratios should not be used for project level estimates.
District Projected Need ReplacementTotal Unit Cost* Estimated Value New Gap "Add New"
Total Unit Cost*
$28,600,000Unfunded Pipelined SHOPP Projects $15,600,000 SHOPP Performance Gap $13,000,000
District Breakdown
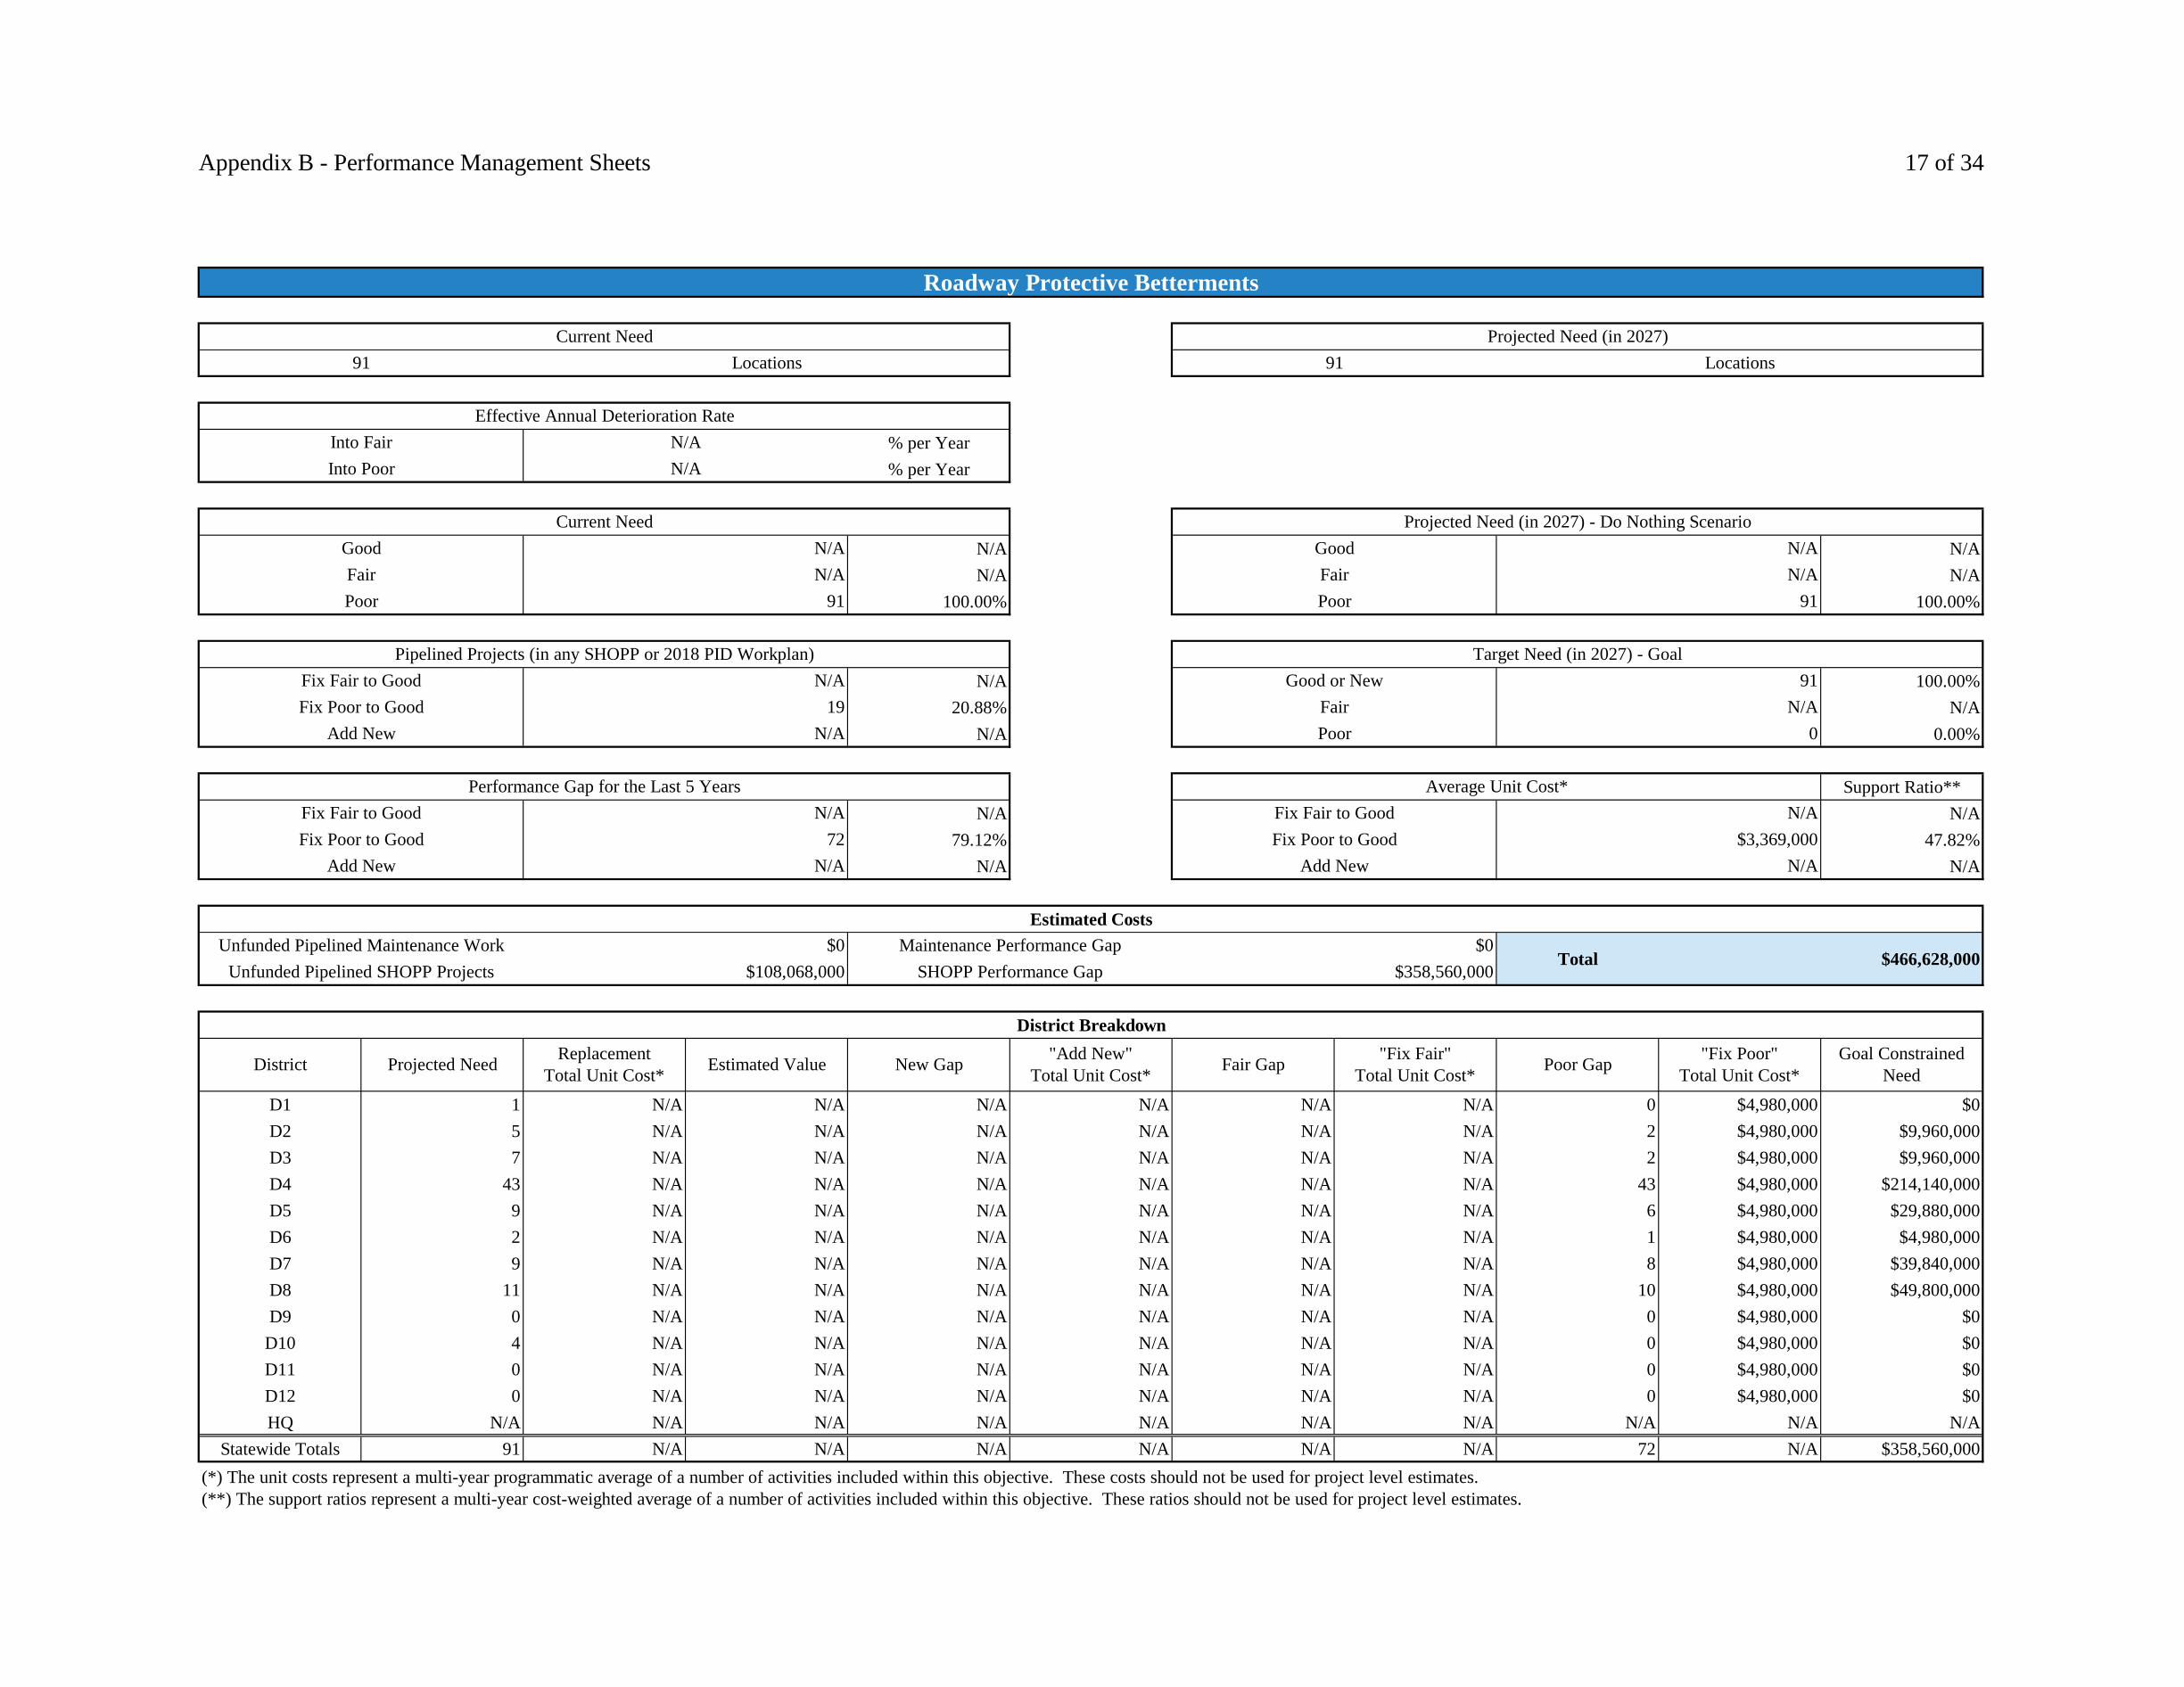
Appendix B - Performance Management Sheets 17 of 34
% per Year% per Year
N/A N/AN/A N/A
100.00% 100.00%
N/A 100.00%20.88% N/A
N/A 0.00%
Support Ratio**N/A N/A
79.12% 47.82%N/A N/A
D1 1 N/A N/A N/A N/A N/A N/A 0 $4,980,000 $0D2 5 N/A N/A N/A N/A N/A N/A 2 $4,980,000 $9,960,000D3 7 N/A N/A N/A N/A N/A N/A 2 $4,980,000 $9,960,000D4 43 N/A N/A N/A N/A N/A N/A 43 $4,980,000 $214,140,000D5 9 N/A N/A N/A N/A N/A N/A 6 $4,980,000 $29,880,000D6 2 N/A N/A N/A N/A N/A N/A 1 $4,980,000 $4,980,000D7 9 N/A N/A N/A N/A N/A N/A 8 $4,980,000 $39,840,000D8 11 N/A N/A N/A N/A N/A N/A 10 $4,980,000 $49,800,000D9 0 N/A N/A N/A N/A N/A N/A 0 $4,980,000 $0
D10 4 N/A N/A N/A N/A N/A N/A 0 $4,980,000 $0D11 0 N/A N/A N/A N/A N/A N/A 0 $4,980,000 $0D12 0 N/A N/A N/A N/A N/A N/A 0 $4,980,000 $0HQ N/A N/A N/A N/A N/A N/A N/A N/A N/A N/A
Statewide Totals 91 N/A N/A N/A N/A N/A N/A 72 N/A $358,560,000
Projected Need (in 2027) - Do Nothing ScenarioGood N/A Good N/AFair N/A Fair N/A
Effective Annual Deterioration RateInto Fair N/AInto Poor N/A
Current Need
Roadway Protective Betterments
Current Need Projected Need (in 2027)91 Locations 91 Locations
Add New N/A Poor 0
Performance Gap for the Last 5 Years Average Unit Cost*
Fix Fair to Good N/A Good or New 91Fix Poor to Good 19 Fair N/A
Poor 91 Poor 91
Pipelined Projects (in any SHOPP or 2018 PID Workplan) Target Need (in 2027) - Goal
Add New N/A Add New N/A
Estimated CostsUnfunded Pipelined Maintenance Work $0 Maintenance Performance Gap $0
Total
Fix Fair to Good N/A Fix Fair to Good N/AFix Poor to Good 72 Fix Poor to Good $3,369,000
Fair Gap "Fix Fair"Total Unit Cost* Poor Gap "Fix Poor"
Total Unit Cost*Goal Constrained
Need
(*) The unit costs represent a multi-year programmatic average of a number of activities included within this objective. These costs should not be used for project level estimates.(**) The support ratios represent a multi-year cost-weighted average of a number of activities included within this objective. These ratios should not be used for project level estimates.
District Projected Need ReplacementTotal Unit Cost* Estimated Value New Gap "Add New"
Total Unit Cost*
$466,628,000Unfunded Pipelined SHOPP Projects $108,068,000 SHOPP Performance Gap $358,560,000
District Breakdown

Appendix B - Performance Management Sheets 18 of 34
% per Year% per Year
32.56% 10.47%38.37% 22.09%29.07% 67.44%
0.00% 80.00%9.30% 20.00%0.00% 0.00%
Support Ratio**4.65% 104.08%
58.14% 104.08%12.79% 43.00%
D1 6 $25,740,000 $154,440,000 0 $25,740,000 -1 $16,000,000 6 $16,000,000 $96,000,000D2 20 $25,740,000 $514,800,000 0 $25,740,000 0 $16,000,000 14 $16,000,000 $224,000,000D3 11 $25,740,000 $283,140,000 0 $25,740,000 1 $16,000,000 7 $16,000,000 $128,000,000D4 3 $25,740,000 $77,220,000 0 $25,740,000 1 $16,000,000 0 $16,000,000 $16,000,000D5 5 $25,740,000 $128,700,000 0 $25,740,000 1 $16,000,000 2 $16,000,000 $48,000,000D6 10 $25,740,000 $257,400,000 4 $25,740,000 0 $16,000,000 5 $16,000,000 $182,960,000D7 0 $25,740,000 $0 0 $25,740,000 0 $16,000,000 0 $16,000,000 $0D8 15 $25,740,000 $386,100,000 4 $25,740,000 -2 $16,000,000 8 $16,000,000 $230,960,000D9 4 $25,740,000 $102,960,000 0 $25,740,000 -1 $16,000,000 4 $16,000,000 $64,000,000
D10 6 $25,740,000 $154,440,000 1 $25,740,000 -1 $16,000,000 2 $16,000,000 $57,740,000D11 6 $25,740,000 $154,440,000 2 $25,740,000 1 $16,000,000 2 $16,000,000 $99,480,000D12 0 $25,740,000 $0 0 $25,740,000 0 $16,000,000 0 $16,000,000 $0HQ N/A N/A N/A N/A N/A N/A N/A N/A N/A N/A
Statewide Totals 86 N/A $2,213,640,000 11 N/A 4 N/A 50 N/A $1,147,140,000
Projected Condition (in 2027) - Do Nothing ScenarioGood 28 Good 9Fair 33 Fair 19
Effective Annual Deterioration RateInto Fair 6.79Into Poor 20.00
Current Condition
Safety Roadside Rest Area (SRRA) Rehabilitation
Current Inventory Projected Inventory (in 2027)86 Locations 86 Locations
Add New 0 Poor 0
Performance Gap for the Last 5 Years Average Unit Cost*
Fix Fair to Good 0 Good or New 77Fix Poor to Good 8 Fair 20
Poor 25 Poor 58
Pipelined Projects (in any SHOPP or 2018 PID Workplan) Target Condition (in 2027) - Goal
Add New 11 Add New $18,000,000
Estimated CostsUnfunded Pipelined Maintenance Work $0 Maintenance Performance Gap $0
Total
Fix Fair to Good 4 Fix Fair to Good $7,840,000Fix Poor to Good 50 Fix Poor to Good $7,840,000
Fair Gap "Fix Fair"Total Unit Cost* Poor Gap "Fix Poor"
Total Unit Cost*Goal Constrained
Need
(*) The unit costs represent a multi-year programmatic average of a number of activities included within this objective. These costs should not be used for project level estimates.(**) The support ratios represent a multi-year cost-weighted average of a number of activities included within this objective. These ratios should not be used for project level estimates.
District Projected Quantity ReplacementTotal Unit Cost* Estimated Value New Gap "Add New"
Total Unit Cost*
$1,192,140,000Unfunded Pipelined SHOPP Projects $45,000,000 SHOPP Performance Gap $1,147,140,000
District Breakdown
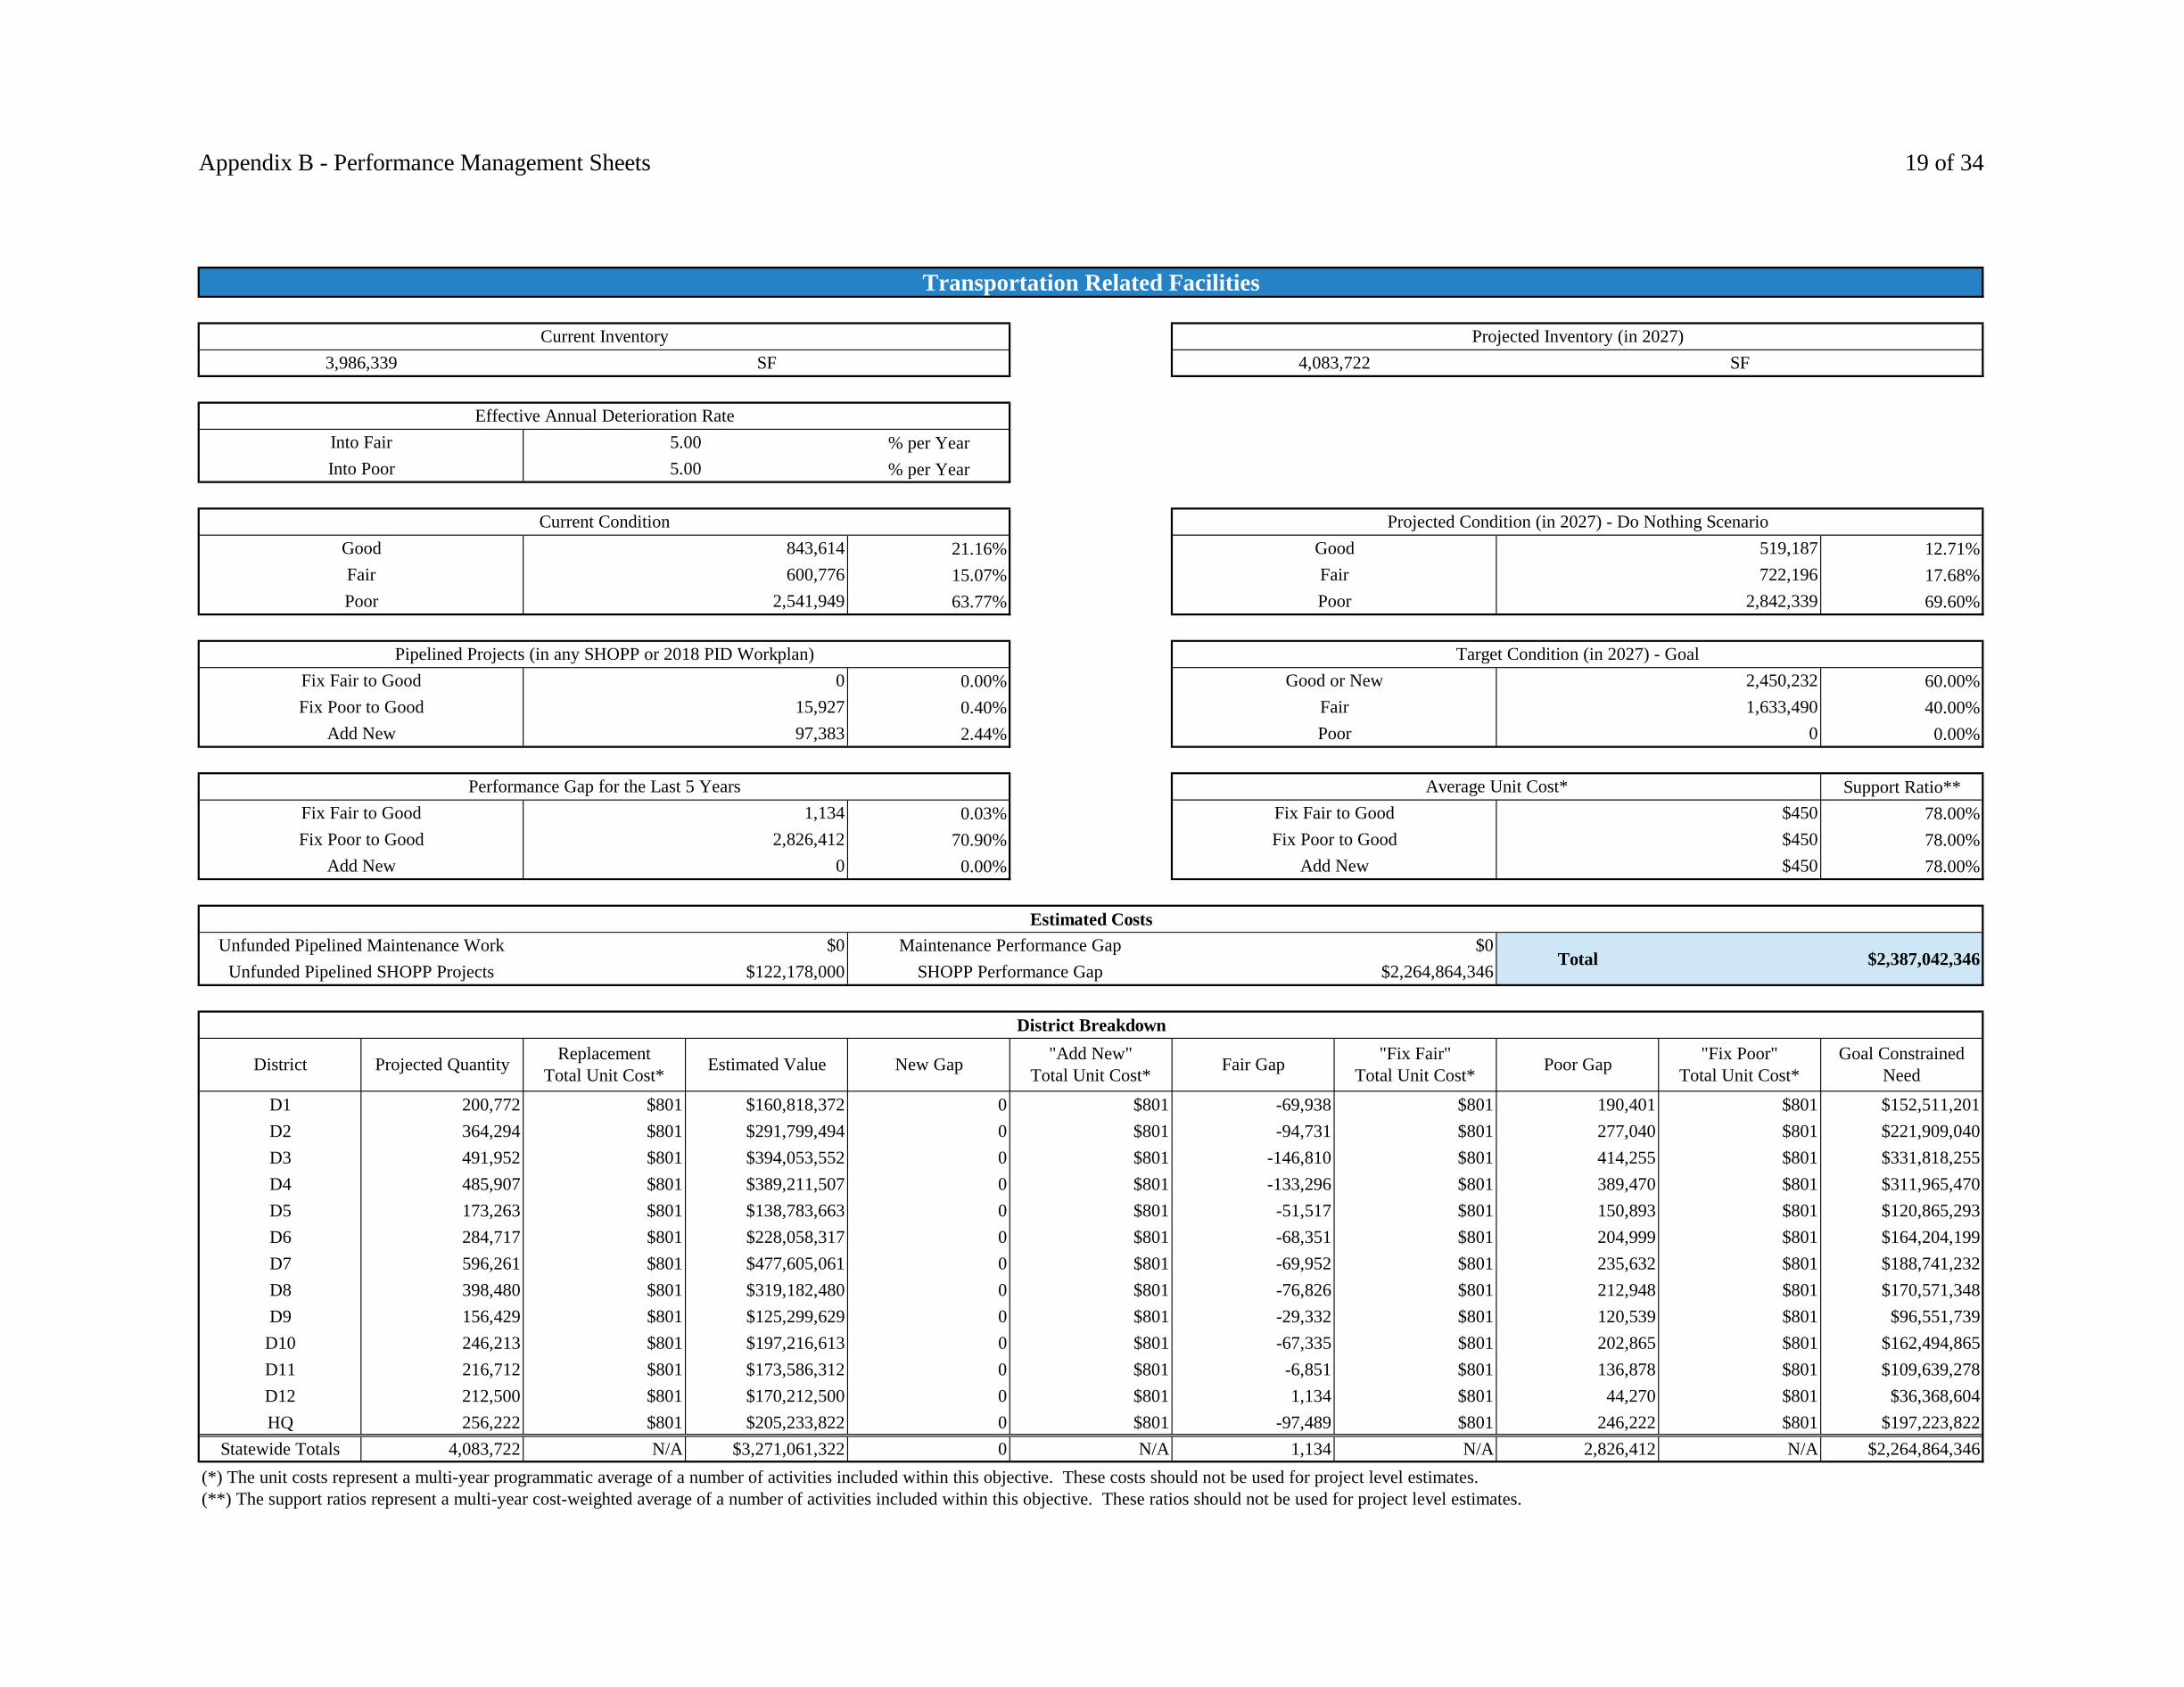
Appendix B - Performance Management Sheets 19 of 34
% per Year% per Year
21.16% 12.71%15.07% 17.68%63.77% 69.60%
0.00% 60.00%0.40% 40.00%2.44% 0.00%
Support Ratio**0.03% 78.00%
70.90% 78.00%0.00% 78.00%
D1 200,772 $801 $160,818,372 0 $801 -69,938 $801 190,401 $801 $152,511,201D2 364,294 $801 $291,799,494 0 $801 -94,731 $801 277,040 $801 $221,909,040D3 491,952 $801 $394,053,552 0 $801 -146,810 $801 414,255 $801 $331,818,255D4 485,907 $801 $389,211,507 0 $801 -133,296 $801 389,470 $801 $311,965,470D5 173,263 $801 $138,783,663 0 $801 -51,517 $801 150,893 $801 $120,865,293D6 284,717 $801 $228,058,317 0 $801 -68,351 $801 204,999 $801 $164,204,199D7 596,261 $801 $477,605,061 0 $801 -69,952 $801 235,632 $801 $188,741,232D8 398,480 $801 $319,182,480 0 $801 -76,826 $801 212,948 $801 $170,571,348D9 156,429 $801 $125,299,629 0 $801 -29,332 $801 120,539 $801 $96,551,739
D10 246,213 $801 $197,216,613 0 $801 -67,335 $801 202,865 $801 $162,494,865D11 216,712 $801 $173,586,312 0 $801 -6,851 $801 136,878 $801 $109,639,278D12 212,500 $801 $170,212,500 0 $801 1,134 $801 44,270 $801 $36,368,604HQ 256,222 $801 $205,233,822 0 $801 -97,489 $801 246,222 $801 $197,223,822
Statewide Totals 4,083,722 N/A $3,271,061,322 0 N/A 1,134 N/A 2,826,412 N/A $2,264,864,346
Projected Condition (in 2027) - Do Nothing ScenarioGood 843,614 Good 519,187Fair 600,776 Fair 722,196
Effective Annual Deterioration RateInto Fair 5.00Into Poor 5.00
Current Condition
Transportation Related Facilities
Current Inventory Projected Inventory (in 2027)3,986,339 SF 4,083,722 SF
Add New 97,383 Poor 0
Performance Gap for the Last 5 Years Average Unit Cost*
Fix Fair to Good 0 Good or New 2,450,232Fix Poor to Good 15,927 Fair 1,633,490
Poor 2,541,949 Poor 2,842,339
Pipelined Projects (in any SHOPP or 2018 PID Workplan) Target Condition (in 2027) - Goal
Add New 0 Add New $450
Estimated CostsUnfunded Pipelined Maintenance Work $0 Maintenance Performance Gap $0
Total
Fix Fair to Good 1,134 Fix Fair to Good $450Fix Poor to Good 2,826,412 Fix Poor to Good $450
Fair Gap "Fix Fair"Total Unit Cost* Poor Gap "Fix Poor"
Total Unit Cost*Goal Constrained
Need
(*) The unit costs represent a multi-year programmatic average of a number of activities included within this objective. These costs should not be used for project level estimates.(**) The support ratios represent a multi-year cost-weighted average of a number of activities included within this objective. These ratios should not be used for project level estimates.
District Projected Quantity ReplacementTotal Unit Cost* Estimated Value New Gap "Add New"
Total Unit Cost*
$2,387,042,346Unfunded Pipelined SHOPP Projects $122,178,000 SHOPP Performance Gap $2,264,864,346
District Breakdown

Appendix B - Performance Management Sheets 20 of 34
% per Year% per Year
28.89% 8.89%13.33% 20.00%57.78% 71.11%
0.00% 80.00%53.33% 20.00%0.00% 0.00%
Support Ratio**4.44% 60.00%
17.78% 60.00%0.00% 60.00%
D1 3 $2,922,416 $8,767,248 0 $2,922,416 -1 $2,922,416 0 $2,922,416 $0D2 15 $2,922,416 $43,836,240 0 $2,922,416 0 $2,922,416 3 $2,922,416 $8,767,248D3 4 $2,922,416 $11,689,664 0 $2,922,416 -1 $2,922,416 0 $2,922,416 $0D4 0 $2,922,416 $0 0 $2,922,416 0 $2,922,416 0 $2,922,416 $0D5 4 $2,922,416 $11,689,664 0 $2,922,416 -1 $2,922,416 0 $2,922,416 $0D6 6 $2,922,416 $17,534,496 0 $2,922,416 0 $2,922,416 0 $2,922,416 $0D7 0 $2,922,416 $0 0 $2,922,416 0 $2,922,416 0 $2,922,416 $0D8 9 $2,922,416 $26,301,744 0 $2,922,416 1 $2,922,416 4 $2,922,416 $14,612,080D9 3 $2,922,416 $8,767,248 0 $2,922,416 0 $2,922,416 1 $2,922,416 $2,922,416
D10 0 $2,922,416 $0 0 $2,922,416 0 $2,922,416 0 $2,922,416 $0D11 1 $2,922,416 $2,922,416 0 $2,922,416 1 $2,922,416 0 $2,922,416 $2,922,416D12 0 $2,922,416 $0 0 $2,922,416 0 $2,922,416 0 $2,922,416 $0HQ N/A N/A N/A N/A N/A N/A N/A N/A N/A N/A
Statewide Totals 45 N/A $131,508,720 0 N/A 2 N/A 8 N/A $29,224,160
Projected Condition (in 2027) - Do Nothing ScenarioGood 13 Good 4Fair 6 Fair 9
Effective Annual Deterioration RateInto Fair 6.92Into Poor 20.00
Current Condition
Water and Wastewater Treatment at SRRAs
Current Inventory Projected Inventory (in 2027)45 Locations 45 Locations
Add New 0 Poor 0
Performance Gap for the Last 5 Years Average Unit Cost*
Fix Fair to Good 0 Good or New 35Fix Poor to Good 24 Fair 10
Poor 26 Poor 32
Pipelined Projects (in any SHOPP or 2018 PID Workplan) Target Condition (in 2027) - Goal
Add New 0 Add New $1,826,510
Estimated CostsUnfunded Pipelined Maintenance Work $0 Maintenance Performance Gap $0
Total
Fix Fair to Good 2 Fix Fair to Good $1,826,510Fix Poor to Good 8 Fix Poor to Good $1,826,510
Fair Gap "Fix Fair"Total Unit Cost* Poor Gap "Fix Poor"
Total Unit Cost*Goal Constrained
Need
(*) The unit costs represent a multi-year programmatic average of a number of activities included within this objective. These costs should not be used for project level estimates.(**) The support ratios represent a multi-year cost-weighted average of a number of activities included within this objective. These ratios should not be used for project level estimates.
District Projected Quantity ReplacementTotal Unit Cost* Estimated Value New Gap "Add New"
Total Unit Cost*
$95,577,160Unfunded Pipelined SHOPP Projects $66,353,000 SHOPP Performance Gap $29,224,160
District Breakdown

Appendix B - Performance Management Sheets 21 of 34
% per Year% per Year
N/A N/AN/A N/A
100.00% 100.00%
N/A 25.00%5.38% N/A
N/A 75.00%
Support Ratio**N/A N/A
19.71% 100.00%N/A N/A
D1 5,460 N/A N/A N/A N/A N/A N/A 1,228 $15,000 $18,420,000D2 8,180 N/A N/A N/A N/A N/A N/A 1,787 $15,000 $26,805,000D3 18,140 N/A N/A N/A N/A N/A N/A -198 $15,000 $0D4 48,720 N/A N/A N/A N/A N/A N/A 11,359 $15,000 $170,385,000D5 12,127 N/A N/A N/A N/A N/A N/A 2,659 $15,000 $39,885,000D6 19,494 N/A N/A N/A N/A N/A N/A 3,427 $15,000 $51,405,000D7 36,900 N/A N/A N/A N/A N/A N/A 8,248 $15,000 $123,720,000D8 21,044 N/A N/A N/A N/A N/A N/A 4,606 $15,000 $69,090,000D9 1,741 N/A N/A N/A N/A N/A N/A 196 $15,000 $2,940,000
D10 10,600 N/A N/A N/A N/A N/A N/A 1,842 $15,000 $27,630,000D11 12,567 N/A N/A N/A N/A N/A N/A 2,679 $15,000 $40,185,000D12 13,243 N/A N/A N/A N/A N/A N/A 3,012 $15,000 $45,180,000HQ N/A N/A N/A N/A N/A N/A N/A N/A N/A N/A
Statewide Totals 208,216 N/A N/A N/A N/A N/A N/A 41,043 N/A $615,645,000
Projected Need (in 2027) - Do Nothing ScenarioGood N/A Good N/AFair N/A Fair N/A
Effective Annual Deterioration RateInto Fair N/AInto Poor N/A
Current Need
ADA Pedestrian Infrastructure
Current Need Projected Need (in 2027)208,216 Locations 208,216 Locations
Add New N/A Poor 156,162
Performance Gap for the Last 5 Years Average Unit Cost*
Fix Fair to Good N/A Good or New 52,054Fix Poor to Good 11,209 Fair N/A
Poor 208,216 Poor 208,216
Pipelined Projects (in any SHOPP or 2018 PID Workplan) Target Need (in 2027) - Goal
Add New N/A Add New N/A
Estimated CostsUnfunded Pipelined Maintenance Work $0 Maintenance Performance Gap $0
Total
Fix Fair to Good N/A Fix Fair to Good N/AFix Poor to Good 41,043 Fix Poor to Good $7,500
Fair Gap "Fix Fair"Total Unit Cost* Poor Gap "Fix Poor"
Total Unit Cost*Goal Constrained
Need
(*) The unit costs represent a multi-year programmatic average of a number of activities included within this objective. These costs should not be used for project level estimates.(**) The support ratios represent a multi-year cost-weighted average of a number of activities included within this objective. These ratios should not be used for project level estimates.
District Projected Need ReplacementTotal Unit Cost* Estimated Value New Gap "Add New"
Total Unit Cost*
$971,944,000Unfunded Pipelined SHOPP Projects $356,299,000 SHOPP Performance Gap $615,645,000
District Breakdown
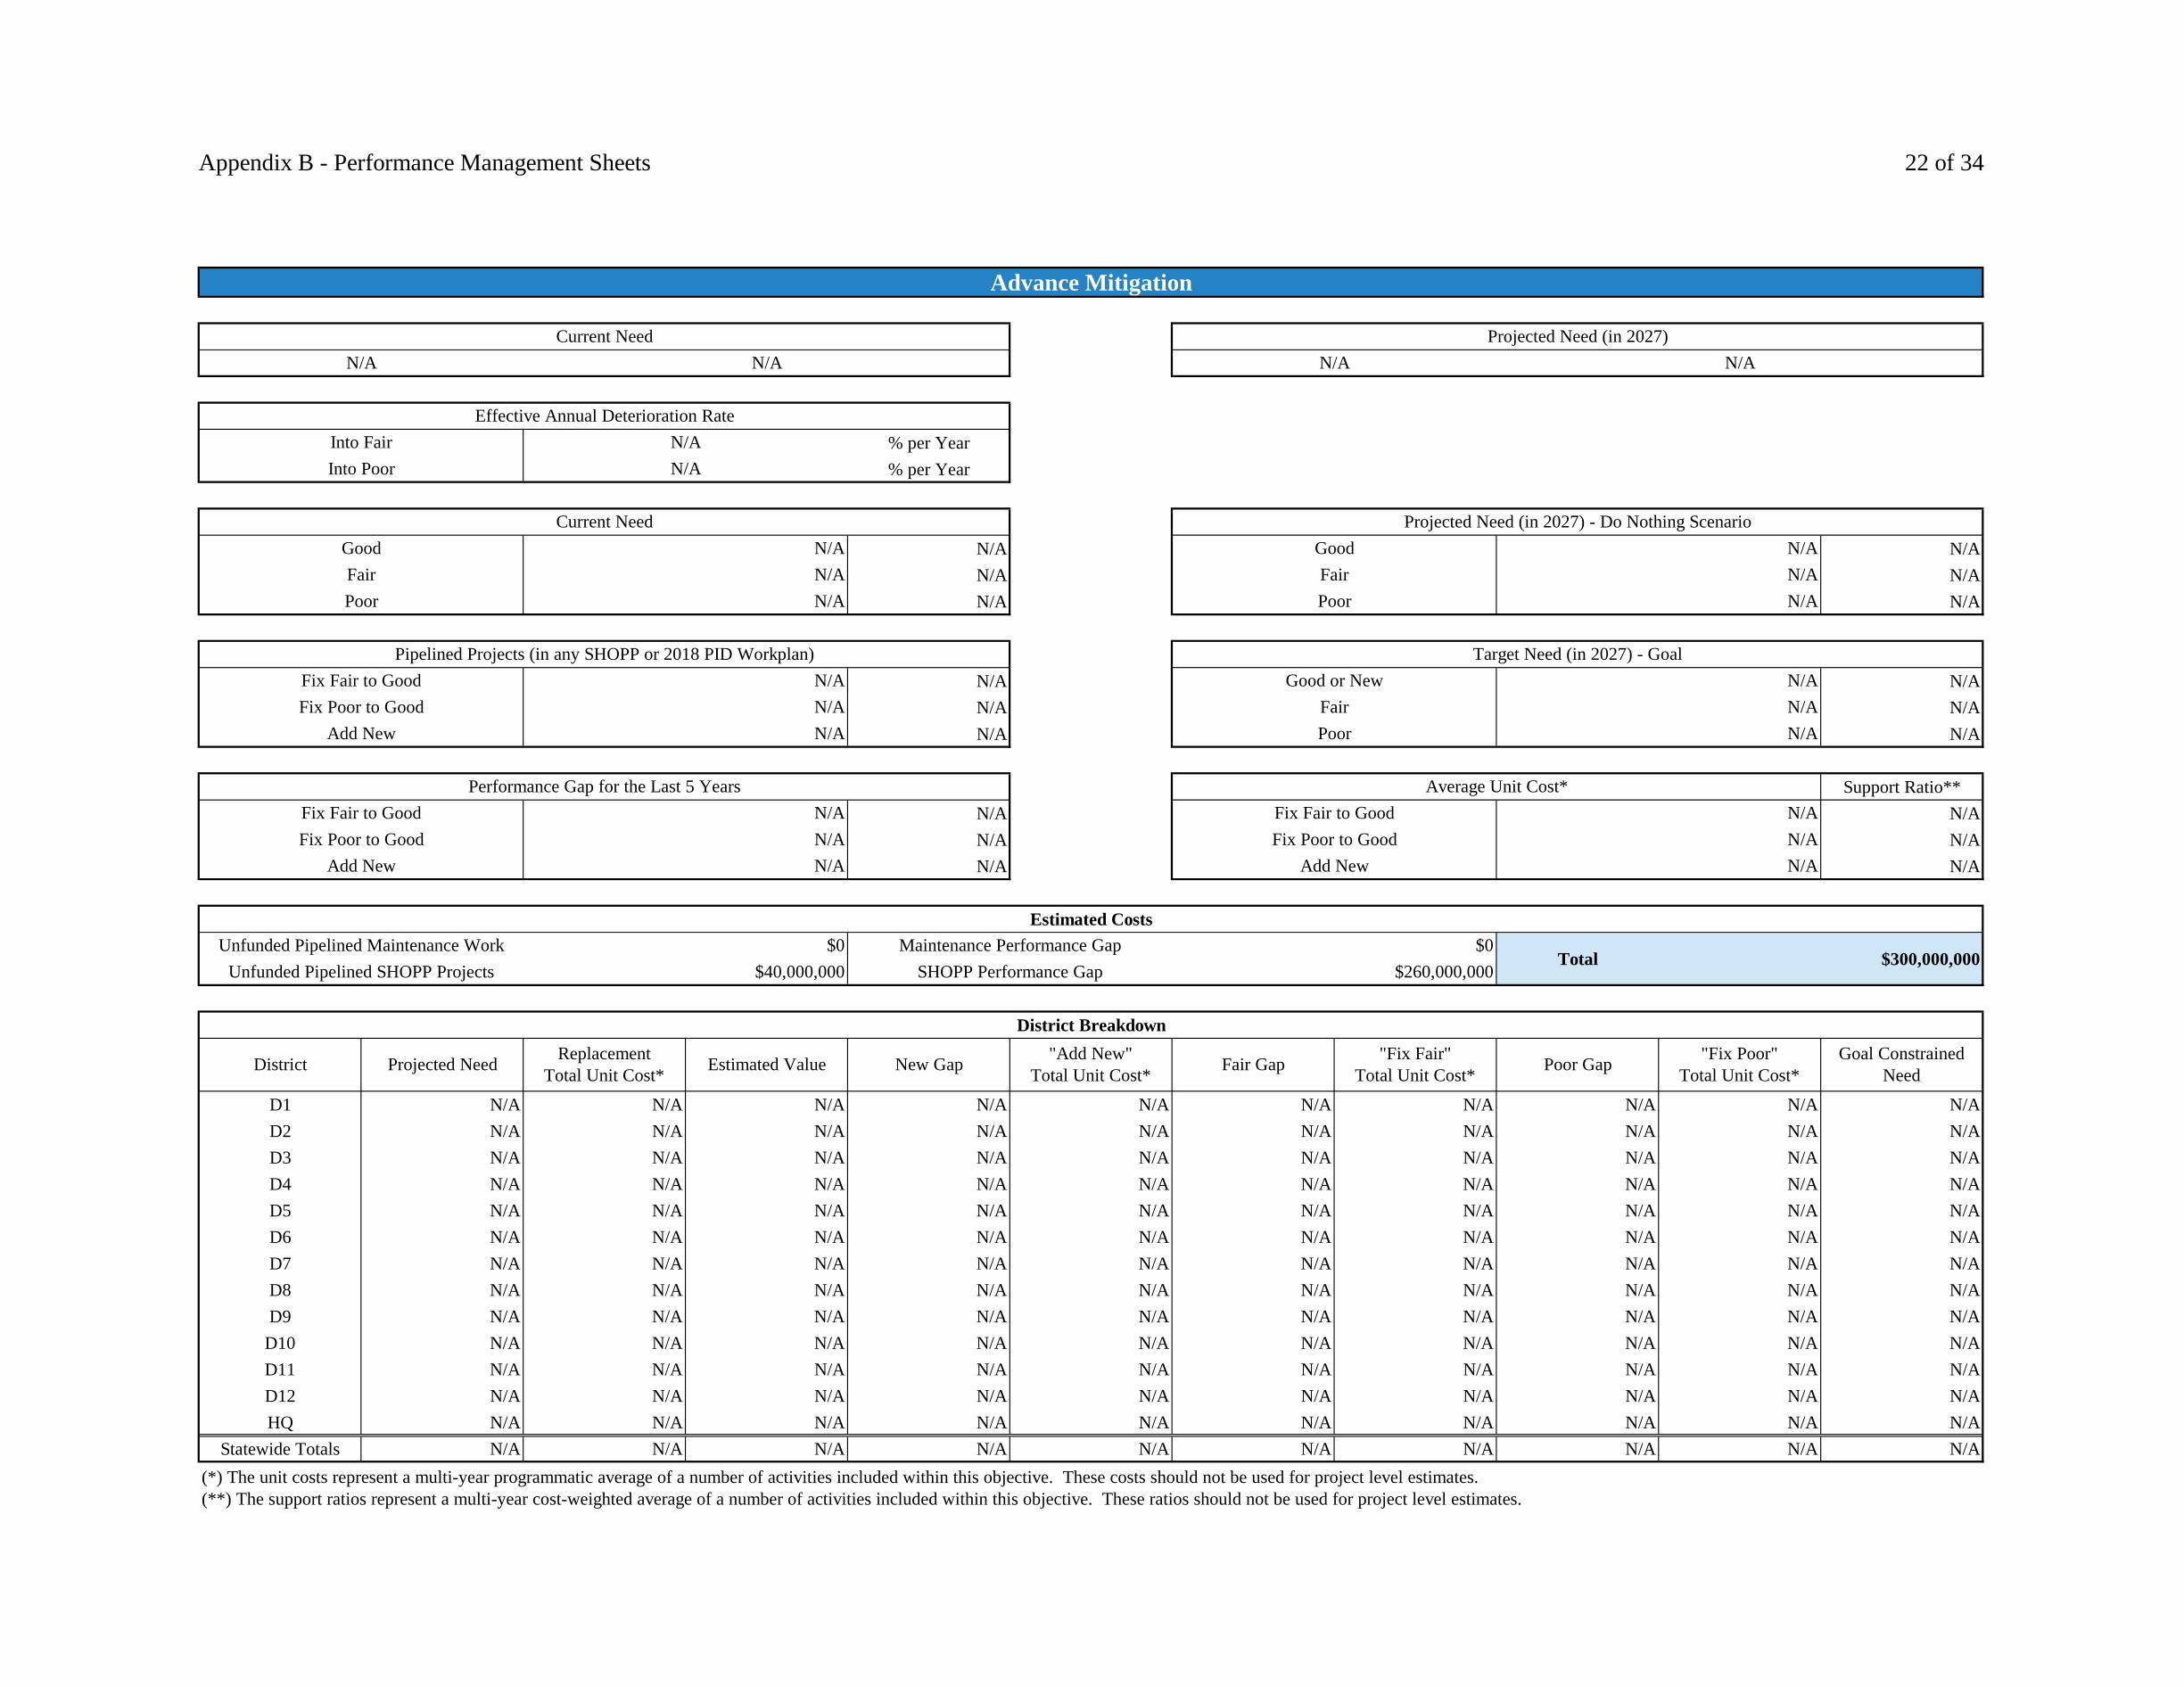
Appendix B - Performance Management Sheets 22 of 34
% per Year% per Year
N/A N/AN/A N/AN/A N/A
N/A N/AN/A N/AN/A N/A
Support Ratio**N/A N/AN/A N/AN/A N/A
D1 N/A N/A N/A N/A N/A N/A N/A N/A N/A N/AD2 N/A N/A N/A N/A N/A N/A N/A N/A N/A N/AD3 N/A N/A N/A N/A N/A N/A N/A N/A N/A N/AD4 N/A N/A N/A N/A N/A N/A N/A N/A N/A N/AD5 N/A N/A N/A N/A N/A N/A N/A N/A N/A N/AD6 N/A N/A N/A N/A N/A N/A N/A N/A N/A N/AD7 N/A N/A N/A N/A N/A N/A N/A N/A N/A N/AD8 N/A N/A N/A N/A N/A N/A N/A N/A N/A N/AD9 N/A N/A N/A N/A N/A N/A N/A N/A N/A N/A
D10 N/A N/A N/A N/A N/A N/A N/A N/A N/A N/AD11 N/A N/A N/A N/A N/A N/A N/A N/A N/A N/AD12 N/A N/A N/A N/A N/A N/A N/A N/A N/A N/AHQ N/A N/A N/A N/A N/A N/A N/A N/A N/A N/A
Statewide Totals N/A N/A N/A N/A N/A N/A N/A N/A N/A N/A
Projected Need (in 2027) - Do Nothing ScenarioGood N/A Good N/AFair N/A Fair N/A
Effective Annual Deterioration RateInto Fair N/AInto Poor N/A
Current Need
Advance Mitigation
Current Need Projected Need (in 2027)N/A N/A N/A N/A
Add New N/A Poor N/A
Performance Gap for the Last 5 Years Average Unit Cost*
Fix Fair to Good N/A Good or New N/AFix Poor to Good N/A Fair N/A
Poor N/A Poor N/A
Pipelined Projects (in any SHOPP or 2018 PID Workplan) Target Need (in 2027) - Goal
Add New N/A Add New N/A
Estimated CostsUnfunded Pipelined Maintenance Work $0 Maintenance Performance Gap $0
Total
Fix Fair to Good N/A Fix Fair to Good N/AFix Poor to Good N/A Fix Poor to Good N/A
Fair Gap "Fix Fair"Total Unit Cost* Poor Gap "Fix Poor"
Total Unit Cost*Goal Constrained
Need
(*) The unit costs represent a multi-year programmatic average of a number of activities included within this objective. These costs should not be used for project level estimates.(**) The support ratios represent a multi-year cost-weighted average of a number of activities included within this objective. These ratios should not be used for project level estimates.
District Projected Need ReplacementTotal Unit Cost* Estimated Value New Gap "Add New"
Total Unit Cost*
$300,000,000Unfunded Pipelined SHOPP Projects $40,000,000 SHOPP Performance Gap $260,000,000
District Breakdown
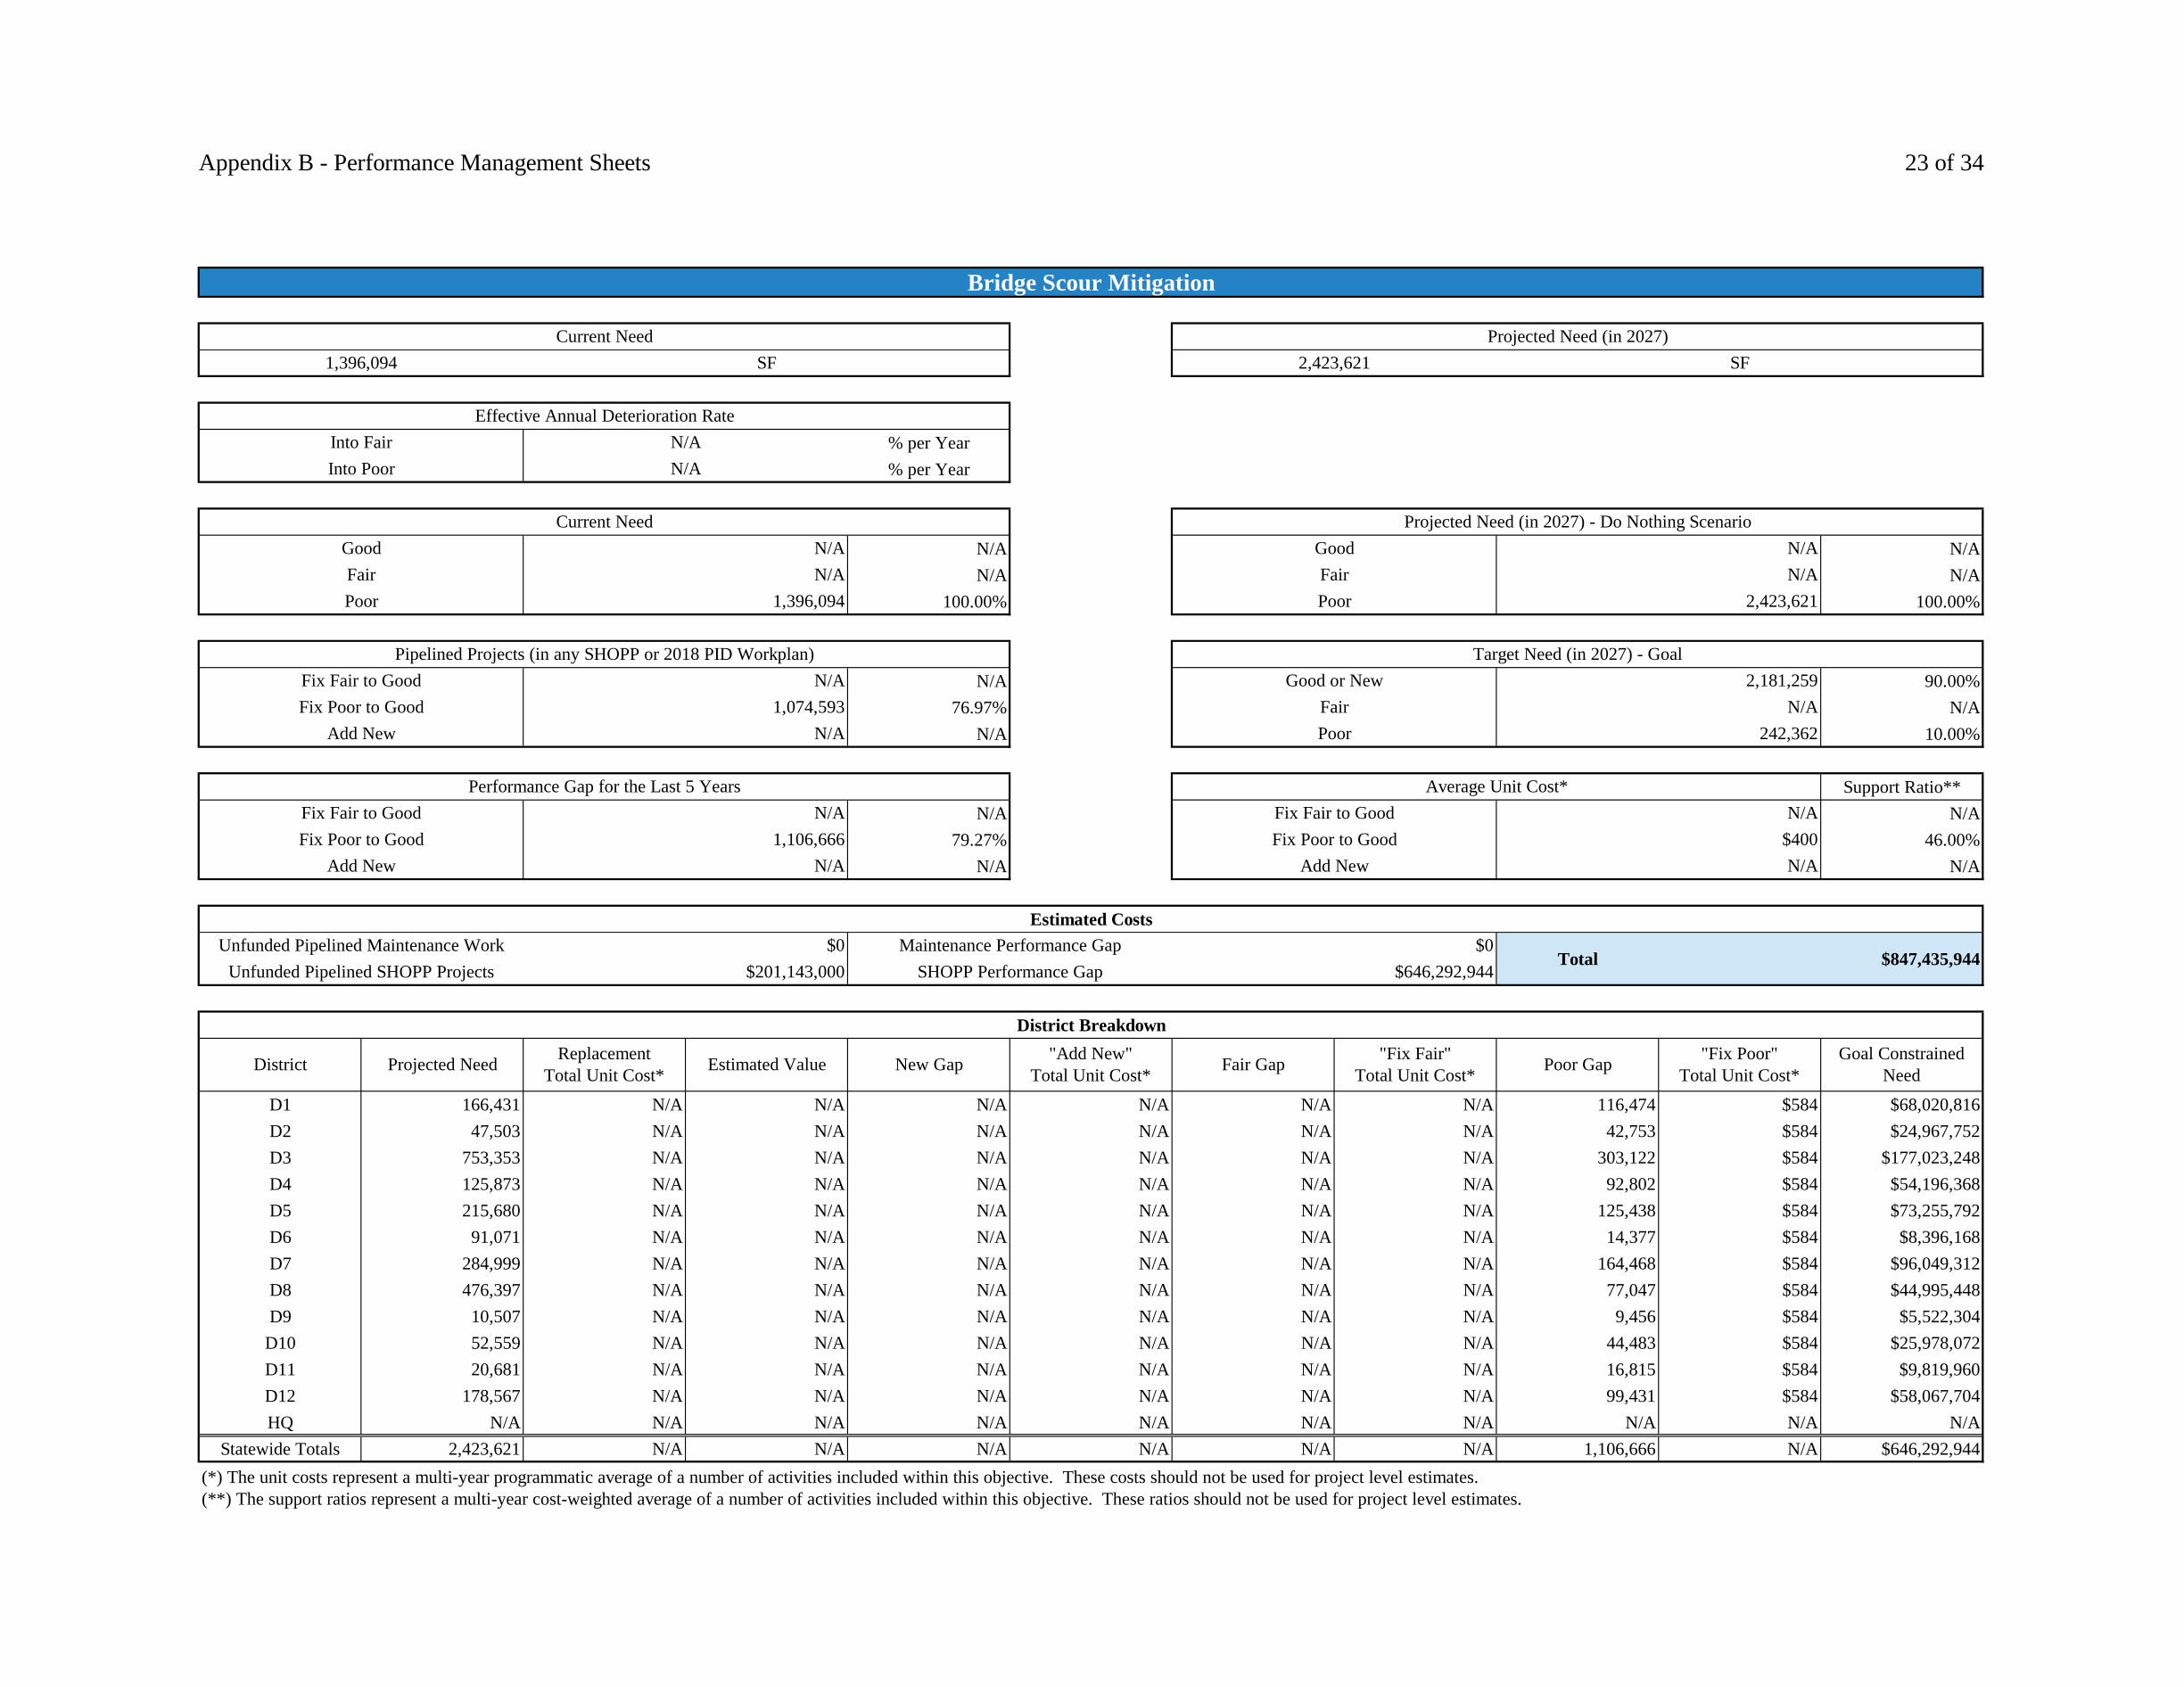
Appendix B - Performance Management Sheets 23 of 34
% per Year% per Year
N/A N/AN/A N/A
100.00% 100.00%
N/A 90.00%76.97% N/A
N/A 10.00%
Support Ratio**N/A N/A
79.27% 46.00%N/A N/A
D1 166,431 N/A N/A N/A N/A N/A N/A 116,474 $584 $68,020,816D2 47,503 N/A N/A N/A N/A N/A N/A 42,753 $584 $24,967,752D3 753,353 N/A N/A N/A N/A N/A N/A 303,122 $584 $177,023,248D4 125,873 N/A N/A N/A N/A N/A N/A 92,802 $584 $54,196,368D5 215,680 N/A N/A N/A N/A N/A N/A 125,438 $584 $73,255,792D6 91,071 N/A N/A N/A N/A N/A N/A 14,377 $584 $8,396,168D7 284,999 N/A N/A N/A N/A N/A N/A 164,468 $584 $96,049,312D8 476,397 N/A N/A N/A N/A N/A N/A 77,047 $584 $44,995,448D9 10,507 N/A N/A N/A N/A N/A N/A 9,456 $584 $5,522,304
D10 52,559 N/A N/A N/A N/A N/A N/A 44,483 $584 $25,978,072D11 20,681 N/A N/A N/A N/A N/A N/A 16,815 $584 $9,819,960D12 178,567 N/A N/A N/A N/A N/A N/A 99,431 $584 $58,067,704HQ N/A N/A N/A N/A N/A N/A N/A N/A N/A N/A
Statewide Totals 2,423,621 N/A N/A N/A N/A N/A N/A 1,106,666 N/A $646,292,944
Projected Need (in 2027) - Do Nothing ScenarioGood N/A Good N/AFair N/A Fair N/A
Effective Annual Deterioration RateInto Fair N/AInto Poor N/A
Current Need
Bridge Scour Mitigation
Current Need Projected Need (in 2027)1,396,094 SF 2,423,621 SF
Add New N/A Poor 242,362
Performance Gap for the Last 5 Years Average Unit Cost*
Fix Fair to Good N/A Good or New 2,181,259Fix Poor to Good 1,074,593 Fair N/A
Poor 1,396,094 Poor 2,423,621
Pipelined Projects (in any SHOPP or 2018 PID Workplan) Target Need (in 2027) - Goal
Add New N/A Add New N/A
Estimated CostsUnfunded Pipelined Maintenance Work $0 Maintenance Performance Gap $0
Total
Fix Fair to Good N/A Fix Fair to Good N/AFix Poor to Good 1,106,666 Fix Poor to Good $400
Fair Gap "Fix Fair"Total Unit Cost* Poor Gap "Fix Poor"
Total Unit Cost*Goal Constrained
Need
(*) The unit costs represent a multi-year programmatic average of a number of activities included within this objective. These costs should not be used for project level estimates.(**) The support ratios represent a multi-year cost-weighted average of a number of activities included within this objective. These ratios should not be used for project level estimates.
District Projected Need ReplacementTotal Unit Cost* Estimated Value New Gap "Add New"
Total Unit Cost*
$847,435,944Unfunded Pipelined SHOPP Projects $201,143,000 SHOPP Performance Gap $646,292,944
District Breakdown

Appendix B - Performance Management Sheets 24 of 34
% per Year% per Year
N/A N/AN/A N/A
100.00% 100.00%
N/A 70.00%24.24% N/A
N/A 30.00%
Support Ratio**N/A N/A
58.02% 43.00%N/A N/A
D1 976,895 N/A N/A N/A N/A N/A N/A 208,783 $286 $59,711,938D2 689,309 N/A N/A N/A N/A N/A N/A 482,516 $286 $137,999,576D3 733,283 N/A N/A N/A N/A N/A N/A 155,915 $286 $44,591,690D4 5,136,395 N/A N/A N/A N/A N/A N/A 3,401,736 $286 $972,896,496D5 441,349 N/A N/A N/A N/A N/A N/A 74,872 $286 $21,413,392D6 217,223 N/A N/A N/A N/A N/A N/A -39,229 $286 $0D7 6,930,259 N/A N/A N/A N/A N/A N/A 4,004,960 $286 $1,145,418,560D8 1,294,146 N/A N/A N/A N/A N/A N/A 605,536 $286 $173,183,296D9 0 N/A N/A N/A N/A N/A N/A 0 $286 $0
D10 1,049,231 N/A N/A N/A N/A N/A N/A -107,275 $286 $0D11 480,911 N/A N/A N/A N/A N/A N/A 240,247 $286 $68,710,642D12 420,005 N/A N/A N/A N/A N/A N/A -2,133 $286 $0HQ N/A N/A N/A N/A N/A N/A N/A N/A N/A N/A
Statewide Totals 18,369,006 N/A N/A N/A N/A N/A N/A 9,174,565 N/A $2,623,925,590
Projected Need (in 2027) - Do Nothing ScenarioGood N/A Good N/AFair N/A Fair N/A
Effective Annual Deterioration RateInto Fair N/AInto Poor N/A
Current Need
Bridge Seismic Restoration
Current Need Projected Need (in 2027)15,813,181 SF 18,369,006 SF
Add New N/A Poor 5,510,704
Performance Gap for the Last 5 Years Average Unit Cost*
Fix Fair to Good N/A Good or New 12,858,302Fix Poor to Good 3,832,374 Fair N/A
Poor 15,813,181 Poor 18,369,006
Pipelined Projects (in any SHOPP or 2018 PID Workplan) Target Need (in 2027) - Goal
Add New N/A Add New N/A
Estimated CostsUnfunded Pipelined Maintenance Work $0 Maintenance Performance Gap $0
Total
Fix Fair to Good N/A Fix Fair to Good N/AFix Poor to Good 9,174,565 Fix Poor to Good $200
Fair Gap "Fix Fair"Total Unit Cost* Poor Gap "Fix Poor"
Total Unit Cost*Goal Constrained
Need
(*) The unit costs represent a multi-year programmatic average of a number of activities included within this objective. These costs should not be used for project level estimates.(**) The support ratios represent a multi-year cost-weighted average of a number of activities included within this objective. These ratios should not be used for project level estimates.
District Projected Need ReplacementTotal Unit Cost* Estimated Value New Gap "Add New"
Total Unit Cost*
$3,089,220,690Unfunded Pipelined SHOPP Projects $465,295,100 SHOPP Performance Gap $2,623,925,590
District Breakdown

Appendix B - Performance Management Sheets 25 of 34
% per Year% per Year
N/A N/AN/A N/AN/A N/A
N/A N/AN/A N/AN/A N/A
Support Ratio**N/A N/AN/A N/AN/A N/A
D1 N/A N/A N/A N/A N/A N/A N/A N/A N/A N/AD2 N/A N/A N/A N/A N/A N/A N/A N/A N/A N/AD3 N/A N/A N/A N/A N/A N/A N/A N/A N/A N/AD4 N/A N/A N/A N/A N/A N/A N/A N/A N/A N/AD5 N/A N/A N/A N/A N/A N/A N/A N/A N/A N/AD6 N/A N/A N/A N/A N/A N/A N/A N/A N/A N/AD7 N/A N/A N/A N/A N/A N/A N/A N/A N/A N/AD8 N/A N/A N/A N/A N/A N/A N/A N/A N/A N/AD9 N/A N/A N/A N/A N/A N/A N/A N/A N/A N/A
D10 N/A N/A N/A N/A N/A N/A N/A N/A N/A N/AD11 N/A N/A N/A N/A N/A N/A N/A N/A N/A N/AD12 N/A N/A N/A N/A N/A N/A N/A N/A N/A N/AHQ N/A N/A N/A N/A N/A N/A N/A N/A N/A N/A
Statewide Totals N/A N/A N/A N/A N/A N/A N/A N/A N/A N/A
Projected Need (in 2027) - Do Nothing ScenarioGood N/A Good N/AFair N/A Fair N/A
Effective Annual Deterioration RateInto Fair N/AInto Poor N/A
Current Need
Hazardous Waste Mitigation
Current Need Projected Need (in 2027)N/A N/A N/A N/A
Add New N/A Poor N/A
Performance Gap for the Last 5 Years Average Unit Cost*
Fix Fair to Good N/A Good or New N/AFix Poor to Good N/A Fair N/A
Poor N/A Poor N/A
Pipelined Projects (in any SHOPP or 2018 PID Workplan) Target Need (in 2027) - Goal
Add New N/A Add New N/A
Estimated CostsUnfunded Pipelined Maintenance Work $0 Maintenance Performance Gap $0
Total
Fix Fair to Good N/A Fix Fair to Good N/AFix Poor to Good N/A Fix Poor to Good N/A
Fair Gap "Fix Fair"Total Unit Cost* Poor Gap "Fix Poor"
Total Unit Cost*Goal Constrained
Need
(*) The unit costs represent a multi-year programmatic average of a number of activities included within this objective. These costs should not be used for project level estimates.(**) The support ratios represent a multi-year cost-weighted average of a number of activities included within this objective. These ratios should not be used for project level estimates.
District Projected Need ReplacementTotal Unit Cost* Estimated Value New Gap "Add New"
Total Unit Cost*
$5,074,000Unfunded Pipelined SHOPP Projects $5,074,000 SHOPP Performance Gap $0
District Breakdown

Appendix B - Performance Management Sheets 26 of 34
% per Year% per Year
20.98% 12.62%34.45% 23.99%44.57% 63.39%
0.00% 60.00%1.98% 30.00%0.00% 10.00%
Support Ratio**1.09% 48.00%
52.49% 48.00%0.00% 48.00%
D1 85 $121,360 $10,315,600 0 $121,360 -26 $121,360 8 $121,360 $970,880D2 371 $121,360 $45,024,560 0 $121,360 -111 $121,360 54 $121,360 $6,553,440D3 1,423 $121,360 $172,695,280 0 $121,360 61 $121,360 672 $121,360 $88,956,880D4 4,446 $121,360 $539,566,560 0 $121,360 189 $121,360 1,757 $121,360 $236,166,560D5 1,020 $121,360 $123,787,200 0 $121,360 -7 $121,360 499 $121,360 $60,558,640D6 2,116 $121,360 $256,797,760 0 $121,360 -14 $121,360 1,056 $121,360 $128,156,160D7 9,669 $121,360 $1,173,429,840 0 $121,360 -1,485 $121,360 6,518 $121,360 $791,024,480D8 3,100 $121,360 $376,216,000 0 $121,360 -21 $121,360 1,041 $121,360 $126,335,760D9 11 $121,360 $1,334,960 0 $121,360 8 $121,360 -1 $121,360 $970,880
D10 726 $121,360 $88,107,360 0 $121,360 66 $121,360 248 $121,360 $38,107,040D11 4,496 $121,360 $545,634,560 0 $121,360 -470 $121,360 2,641 $121,360 $320,511,760D12 2,954 $121,360 $358,497,440 0 $121,360 -19 $121,360 1,157 $121,360 $140,413,520HQ N/A N/A N/A N/A N/A N/A N/A N/A N/A N/A
Statewide Totals 30,417 N/A $3,691,407,120 0 N/A 324 N/A 15,651 N/A $1,938,726,000
Projected Condition (in 2027) - Do Nothing ScenarioGood 6,256 Good 3,838Fair 10,273 Fair 7,297
Effective Annual Deterioration RateInto Fair 3.87Into Poor 5.83
Current Condition
Roadside Rehabilitation
Current Inventory Projected Inventory (in 2027)29,817 Acre 30,417 Acre
Add New 0 Poor 3,043
Performance Gap for the Last 5 Years Average Unit Cost*
Fix Fair to Good 0 Good or New 18,248Fix Poor to Good 589 Fair 9,126
Poor 13,288 Poor 19,282
Pipelined Projects (in any SHOPP or 2018 PID Workplan) Target Condition (in 2027) - Goal
Add New 0 Add New $82,000
Estimated CostsUnfunded Pipelined Maintenance Work $0 Maintenance Performance Gap $0
Total
Fix Fair to Good 324 Fix Fair to Good $82,000Fix Poor to Good 15,651 Fix Poor to Good $82,000
Fair Gap "Fix Fair"Total Unit Cost* Poor Gap "Fix Poor"
Total Unit Cost*Goal Constrained
Need
(*) The unit costs represent a multi-year programmatic average of a number of activities included within this objective. These costs should not be used for project level estimates.(**) The support ratios represent a multi-year cost-weighted average of a number of activities included within this objective. These ratios should not be used for project level estimates.
District Projected Quantity ReplacementTotal Unit Cost* Estimated Value New Gap "Add New"
Total Unit Cost*
$2,025,242,000Unfunded Pipelined SHOPP Projects $86,516,000 SHOPP Performance Gap $1,938,726,000
District Breakdown

Appendix B - Performance Management Sheets 27 of 34
% per Year% per Year
N/A N/AN/A N/A
100.00% 100.00%
N/A 100.00%10.80% N/A
N/A 0.00%
Support Ratio**N/A N/A
89.20% 48.00%N/A N/A
D1 750 N/A N/A N/A N/A N/A N/A 725 $200,450 $145,326,250D2 1,080 N/A N/A N/A N/A N/A N/A 1,049 $200,450 $210,272,050D3 780 N/A N/A N/A N/A N/A N/A 773 $200,450 $154,947,850D4 2,700 N/A N/A N/A N/A N/A N/A 2,663 $200,450 $533,798,350D5 130 N/A N/A N/A N/A N/A N/A 103 $200,450 $20,646,350D6 0 N/A N/A N/A N/A N/A N/A 0 $200,450 $0D7 7,780 N/A N/A N/A N/A N/A N/A 6,356 $200,450 $1,274,060,200D8 630 N/A N/A N/A N/A N/A N/A 526 $200,450 $105,436,700D9 0 N/A N/A N/A N/A N/A N/A 0 $200,450 $0
D10 220 N/A N/A N/A N/A N/A N/A 220 $200,450 $44,099,000D11 1,760 N/A N/A N/A N/A N/A N/A 1,649 $200,450 $330,542,050D12 670 N/A N/A N/A N/A N/A N/A 654 $200,450 $131,094,300HQ N/A N/A N/A N/A N/A N/A N/A N/A N/A N/A
Statewide Totals 16,500 N/A N/A N/A N/A N/A N/A 14,718 N/A $2,950,223,100
Projected Need (in 2027) - Do Nothing ScenarioGood N/A Good N/AFair N/A Fair N/A
Effective Annual Deterioration RateInto Fair N/AInto Poor N/A
Current Need
Storm Water Mitigation
Current Need Projected Need (in 2027)16,500 Acre 16,500 Acre
Add New N/A Poor 0
Performance Gap for the Last 5 Years Average Unit Cost*
Fix Fair to Good N/A Good or New 16,500Fix Poor to Good 1,782 Fair N/A
Poor 16,500 Poor 16,500
Pipelined Projects (in any SHOPP or 2018 PID Workplan) Target Need (in 2027) - Goal
Add New N/A Add New N/A
Estimated CostsUnfunded Pipelined Maintenance Work $0 Maintenance Performance Gap $0
Total
Fix Fair to Good N/A Fix Fair to Good N/AFix Poor to Good 14,718 Fix Poor to Good $135,439
Fair Gap "Fix Fair"Total Unit Cost* Poor Gap "Fix Poor"
Total Unit Cost*Goal Constrained
Need
(*) The unit costs represent a multi-year programmatic average of a number of activities included within this objective. These costs should not be used for project level estimates.(**) The support ratios represent a multi-year cost-weighted average of a number of activities included within this objective. These ratios should not be used for project level estimates.
District Projected Need ReplacementTotal Unit Cost* Estimated Value New Gap "Add New"
Total Unit Cost*
$3,443,689,100Unfunded Pipelined SHOPP Projects $493,466,000 SHOPP Performance Gap $2,950,223,100
District Breakdown

Appendix B - Performance Management Sheets 28 of 34
% per Year% per Year
N/A N/AN/A N/A
100.00% 100.00%
N/A 100.00%0.00% N/A
N/A 0.00%
Support Ratio**N/A N/A
100.00% 40.06%N/A N/A
D1 5 N/A N/A N/A N/A N/A N/A 5 $500,000 $2,500,000D2 5 N/A N/A N/A N/A N/A N/A 5 $500,000 $2,500,000D3 1 N/A N/A N/A N/A N/A N/A 1 $500,000 $500,000D4 3 N/A N/A N/A N/A N/A N/A 3 $500,000 $1,500,000D5 3 N/A N/A N/A N/A N/A N/A 3 $500,000 $1,500,000D6 0 N/A N/A N/A N/A N/A N/A 0 $500,000 $0D7 1 N/A N/A N/A N/A N/A N/A 1 $500,000 $500,000D8 5 N/A N/A N/A N/A N/A N/A 5 $500,000 $2,500,000D9 3 N/A N/A N/A N/A N/A N/A 3 $500,000 $1,500,000
D10 1 N/A N/A N/A N/A N/A N/A 1 $500,000 $500,000D11 2 N/A N/A N/A N/A N/A N/A 2 $500,000 $1,000,000D12 1 N/A N/A N/A N/A N/A N/A 1 $500,000 $500,000HQ N/A N/A N/A N/A N/A N/A N/A N/A N/A N/A
Statewide Totals 30 N/A N/A N/A N/A N/A N/A 30 N/A $15,000,000
Projected Need (in 2027) - Do Nothing ScenarioGood N/A Good N/AFair N/A Fair N/A
Effective Annual Deterioration RateInto Fair N/AInto Poor N/A
Current Need
Zero Emission Vehicle Infrastructure
Current Need Projected Need (in 2027)30 Locations 30 Locations
Add New N/A Poor 0
Performance Gap for the Last 5 Years Average Unit Cost*
Fix Fair to Good N/A Good or New 30Fix Poor to Good 0 Fair N/A
Poor 30 Poor 30
Pipelined Projects (in any SHOPP or 2018 PID Workplan) Target Need (in 2027) - Goal
Add New N/A Add New N/A
Estimated CostsUnfunded Pipelined Maintenance Work $0 Maintenance Performance Gap $0
Total
Fix Fair to Good N/A Fix Fair to Good N/AFix Poor to Good 30 Fix Poor to Good $357,000
Fair Gap "Fix Fair"Total Unit Cost* Poor Gap "Fix Poor"
Total Unit Cost*Goal Constrained
Need
(*) The unit costs represent a multi-year programmatic average of a number of activities included within this objective. These costs should not be used for project level estimates.(**) The support ratios represent a multi-year cost-weighted average of a number of activities included within this objective. These ratios should not be used for project level estimates.
District Projected Need ReplacementTotal Unit Cost* Estimated Value New Gap "Add New"
Total Unit Cost*
$15,000,000Unfunded Pipelined SHOPP Projects $0 SHOPP Performance Gap $15,000,000
District Breakdown

Appendix B - Performance Management Sheets 29 of 34
% per Year% per Year
14.81% 5.56%85.19% 46.30%0.00% 48.15%
16.67% 60.00%0.00% 40.00%0.00% 0.00%
Support Ratio**3.70% 100.00%
48.15% 100.00%0.00% 100.00%
D1 3 $3,125,334 $9,376,002 0 $3,125,334 0 $3,125,334 2 $3,125,334 $6,250,668D2 4 $3,125,334 $12,501,336 0 $3,125,334 0 $3,125,334 2 $3,125,334 $6,250,668D3 5 $3,125,334 $15,626,670 0 $3,125,334 -1 $3,125,334 3 $3,125,334 $9,376,002D4 13 $3,125,334 $40,629,342 0 $3,125,334 2 $3,125,334 4 $3,125,334 $18,752,004D5 0 $3,125,334 $0 0 $3,125,334 0 $3,125,334 0 $3,125,334 $0D6 3 $3,125,334 $9,376,002 0 $3,125,334 -1 $3,125,334 2 $3,125,334 $6,250,668D7 6 $3,125,334 $18,752,004 0 $3,125,334 -3 $3,125,334 3 $3,125,334 $9,376,002D8 6 $3,125,334 $18,752,004 0 $3,125,334 0 $3,125,334 2 $3,125,334 $6,250,668D9 0 $3,125,334 $0 0 $3,125,334 0 $3,125,334 0 $3,125,334 $0
D10 5 $3,125,334 $15,626,670 0 $3,125,334 0 $3,125,334 3 $3,125,334 $9,376,002D11 7 $3,125,334 $21,877,338 0 $3,125,334 0 $3,125,334 4 $3,125,334 $12,501,336D12 2 $3,125,334 $6,250,668 0 $3,125,334 -2 $3,125,334 1 $3,125,334 $3,125,334HQ N/A N/A N/A N/A N/A N/A N/A N/A N/A N/A
Statewide Totals 54 N/A $168,768,036 0 N/A 2 N/A 26 N/A $87,509,352
Projected Condition (in 2027) - Do Nothing ScenarioGood 8 Good 3Fair 46 Fair 25
Effective Annual Deterioration RateInto Fair 6.25Into Poor 5.65
Current Condition
Commercial Vehicle Enforcement Facilities
Current Inventory Projected Inventory (in 2027)54 Stations 54 Stations
Add New 0 Poor 0
Performance Gap for the Last 5 Years Average Unit Cost*
Fix Fair to Good 9 Good or New 33Fix Poor to Good 0 Fair 21
Poor 0 Poor 26
Pipelined Projects (in any SHOPP or 2018 PID Workplan) Target Condition (in 2027) - Goal
Add New 0 Add New $1,562,667
Estimated CostsUnfunded Pipelined Maintenance Work $0 Maintenance Performance Gap $0
Total
Fix Fair to Good 2 Fix Fair to Good $1,562,667Fix Poor to Good 26 Fix Poor to Good $1,562,667
Fair Gap "Fix Fair"Total Unit Cost* Poor Gap "Fix Poor"
Total Unit Cost*Goal Constrained
Need
(*) The unit costs represent a multi-year programmatic average of a number of activities included within this objective. These costs should not be used for project level estimates.(**) The support ratios represent a multi-year cost-weighted average of a number of activities included within this objective. These ratios should not be used for project level estimates.
District Projected Quantity ReplacementTotal Unit Cost* Estimated Value New Gap "Add New"
Total Unit Cost*
$129,281,352Unfunded Pipelined SHOPP Projects $41,772,000 SHOPP Performance Gap $87,509,352
District Breakdown

Appendix B - Performance Management Sheets 30 of 34
% per Year% per Year
N/A N/AN/A N/A
100.00% 100.00%
N/A 10.00%1.02% N/A
N/A 90.00%
Support Ratio**N/A N/A
9.08% 40.00%N/A N/A
D1 0 N/A N/A N/A N/A N/A N/A 0 $6,955 $0D2 0 N/A N/A N/A N/A N/A N/A 0 $6,955 $0D3 40,000 N/A N/A N/A N/A N/A N/A 1,351 $6,955 $9,396,205D4 215,000 N/A N/A N/A N/A N/A N/A 20,432 $6,955 $142,104,560D5 5,564 N/A N/A N/A N/A N/A N/A 209 $6,955 $1,453,595D6 8,136 N/A N/A N/A N/A N/A N/A 814 $6,955 $5,661,370D7 460,000 N/A N/A N/A N/A N/A N/A 44,539 $6,955 $309,768,745D8 77,000 N/A N/A N/A N/A N/A N/A 5,201 $6,955 $36,172,955D9 0 N/A N/A N/A N/A N/A N/A 0 $6,955 $0
D10 5,262 N/A N/A N/A N/A N/A N/A -983 $6,955 $0D11 90,000 N/A N/A N/A N/A N/A N/A 8,388 $6,955 $58,338,540D12 110,000 N/A N/A N/A N/A N/A N/A 10,842 $6,955 $75,406,110HQ N/A N/A N/A N/A N/A N/A N/A N/A N/A N/A
Statewide Totals 1,010,962 N/A N/A N/A N/A N/A N/A 91,776 N/A $638,302,080
Projected Need (in 2027) - Do Nothing ScenarioGood N/A Good N/AFair N/A Fair N/A
Effective Annual Deterioration RateInto Fair N/AInto Poor N/A
Current Need
Operational Improvements
Current Need Projected Need (in 2027)1,010,962 Daily Vehicle Hours of Delay 1,010,962 Daily Vehicle Hours of Delay
Add New N/A Poor 909,866
Performance Gap for the Last 5 Years Average Unit Cost*
Fix Fair to Good N/A Good or New 101,096Fix Poor to Good 10,303 Fair N/A
Poor 1,010,962 Poor 1,010,962
Pipelined Projects (in any SHOPP or 2018 PID Workplan) Target Need (in 2027) - Goal
Add New N/A Add New N/A
Estimated CostsUnfunded Pipelined Maintenance Work $0 Maintenance Performance Gap $0
Total
Fix Fair to Good N/A Fix Fair to Good N/AFix Poor to Good 91,776 Fix Poor to Good $4,968
Fair Gap "Fix Fair"Total Unit Cost* Poor Gap "Fix Poor"
Total Unit Cost*Goal Constrained
Need
(*) The unit costs represent a multi-year programmatic average of a number of activities included within this objective. These costs should not be used for project level estimates.(**) The support ratios represent a multi-year cost-weighted average of a number of activities included within this objective. These ratios should not be used for project level estimates.
District Projected Need ReplacementTotal Unit Cost* Estimated Value New Gap "Add New"
Total Unit Cost*
$933,002,080Unfunded Pipelined SHOPP Projects $294,700,000 SHOPP Performance Gap $638,302,080
District Breakdown

Appendix B - Performance Management Sheets 31 of 34
% per Year% per Year
0.00% 0.00%0.00% 0.00%
100.00% 100.00%
0.00% 0.00%8.99% 100.00%0.00% 0.00%
Support Ratio**0.00% 30.00%
91.01% 30.00%0.00% 30.00%
D1 4,185 $8,060 $33,731,100 0 $8,060 -4,185 $8,060 4,185 $8,060 $33,731,100D2 7,407 $8,060 $59,700,420 0 $8,060 -7,407 $8,060 7,087 $8,060 $57,121,220D3 6,864 $8,060 $55,323,840 0 $8,060 -6,864 $8,060 6,253 $8,060 $50,399,180D4 13,894 $8,060 $111,985,640 0 $8,060 -13,894 $8,060 12,670 $8,060 $102,120,200D5 4,607 $8,060 $37,132,420 0 $8,060 -4,607 $8,060 3,443 $8,060 $27,750,580D6 7,702 $8,060 $62,078,120 0 $8,060 -7,702 $8,060 7,192 $8,060 $57,967,520D7 17,373 $8,060 $140,026,380 0 $8,060 -17,373 $8,060 16,703 $8,060 $134,626,180D8 8,533 $8,060 $68,775,980 0 $8,060 -8,533 $8,060 7,432 $8,060 $59,901,920D9 917 $8,060 $7,391,020 0 $8,060 -917 $8,060 917 $8,060 $7,391,020
D10 4,608 $8,060 $37,140,480 0 $8,060 -4,608 $8,060 4,468 $8,060 $36,012,080D11 6,878 $8,060 $55,436,680 0 $8,060 -6,878 $8,060 4,915 $8,060 $39,614,900D12 3,909 $8,060 $31,506,540 0 $8,060 -3,909 $8,060 3,801 $8,060 $30,636,060HQ N/A N/A N/A N/A N/A N/A N/A N/A N/A N/A
Statewide Totals 86,877 N/A $700,228,620 0 N/A 0 N/A 79,066 N/A $637,271,960
Projected Condition (in 2027) - Do Nothing ScenarioGood 0 Good 0Fair 0 Fair 0
Effective Annual Deterioration RateInto Fair 6.67Into Poor 20.00
Current Condition
Sign Panel Replacement
Current Inventory Projected Inventory (in 2027)86,877 Each 86,877 Each
Add New 0 Poor 0
Performance Gap for the Last 5 Years Average Unit Cost*
Fix Fair to Good 0 Good or New 0Fix Poor to Good 7,811 Fair 86,877
Poor 86,877 Poor 86,877
Pipelined Projects (in any SHOPP or 2018 PID Workplan) Target Condition (in 2027) - Goal
Add New 0 Add New $6,200
Estimated CostsUnfunded Pipelined Maintenance Work $0 Maintenance Performance Gap $0
Total
Fix Fair to Good 0 Fix Fair to Good $6,200Fix Poor to Good 79,066 Fix Poor to Good $6,200
Fair Gap "Fix Fair"Total Unit Cost* Poor Gap "Fix Poor"
Total Unit Cost*Goal Constrained
Need
(*) The unit costs represent a multi-year programmatic average of a number of activities included within this objective. These costs should not be used for project level estimates.(**) The support ratios represent a multi-year cost-weighted average of a number of activities included within this objective. These ratios should not be used for project level estimates.
District Projected Quantity ReplacementTotal Unit Cost* Estimated Value New Gap "Add New"
Total Unit Cost*
$700,472,960Unfunded Pipelined SHOPP Projects $63,201,000 SHOPP Performance Gap $637,271,960
District Breakdown
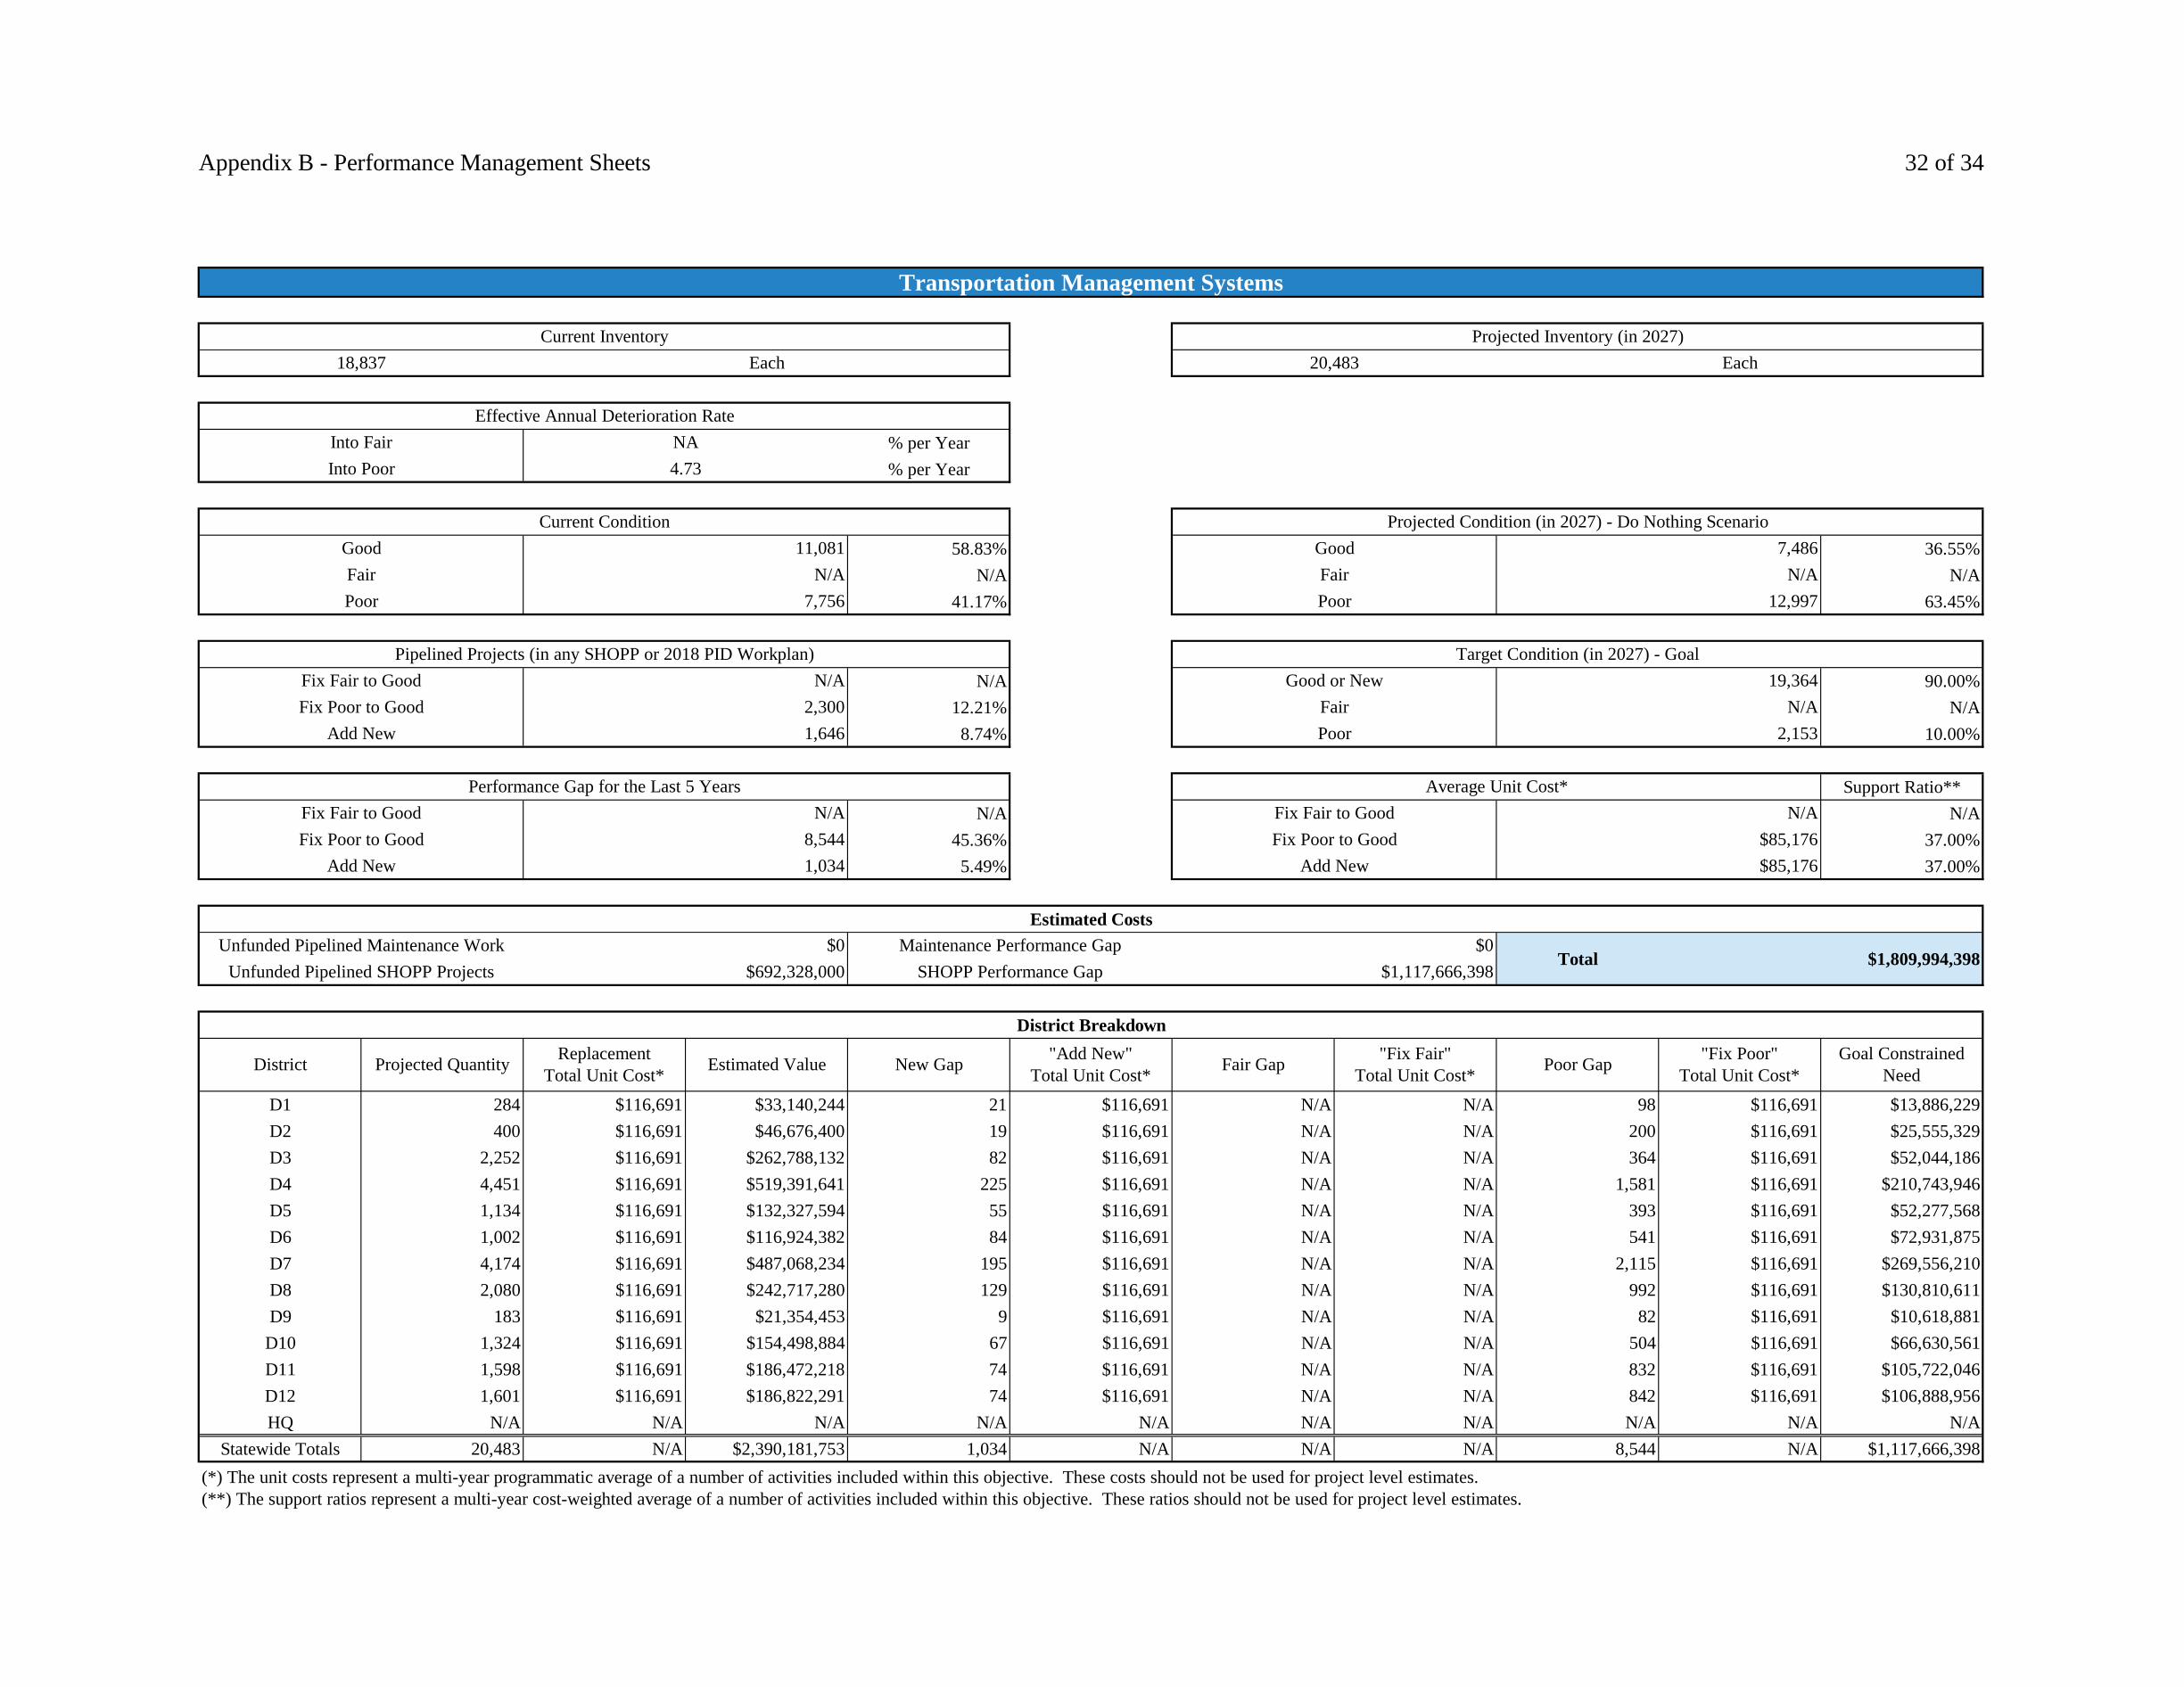
Appendix B - Performance Management Sheets 32 of 34
% per Year% per Year
58.83% 36.55%N/A N/A
41.17% 63.45%
N/A 90.00%12.21% N/A8.74% 10.00%
Support Ratio**N/A N/A
45.36% 37.00%5.49% 37.00%
D1 284 $116,691 $33,140,244 21 $116,691 N/A N/A 98 $116,691 $13,886,229D2 400 $116,691 $46,676,400 19 $116,691 N/A N/A 200 $116,691 $25,555,329D3 2,252 $116,691 $262,788,132 82 $116,691 N/A N/A 364 $116,691 $52,044,186D4 4,451 $116,691 $519,391,641 225 $116,691 N/A N/A 1,581 $116,691 $210,743,946D5 1,134 $116,691 $132,327,594 55 $116,691 N/A N/A 393 $116,691 $52,277,568D6 1,002 $116,691 $116,924,382 84 $116,691 N/A N/A 541 $116,691 $72,931,875D7 4,174 $116,691 $487,068,234 195 $116,691 N/A N/A 2,115 $116,691 $269,556,210D8 2,080 $116,691 $242,717,280 129 $116,691 N/A N/A 992 $116,691 $130,810,611D9 183 $116,691 $21,354,453 9 $116,691 N/A N/A 82 $116,691 $10,618,881
D10 1,324 $116,691 $154,498,884 67 $116,691 N/A N/A 504 $116,691 $66,630,561D11 1,598 $116,691 $186,472,218 74 $116,691 N/A N/A 832 $116,691 $105,722,046D12 1,601 $116,691 $186,822,291 74 $116,691 N/A N/A 842 $116,691 $106,888,956HQ N/A N/A N/A N/A N/A N/A N/A N/A N/A N/A
Statewide Totals 20,483 N/A $2,390,181,753 1,034 N/A N/A N/A 8,544 N/A $1,117,666,398
Projected Condition (in 2027) - Do Nothing ScenarioGood 11,081 Good 7,486Fair N/A Fair N/A
Effective Annual Deterioration RateInto Fair NAInto Poor 4.73
Current Condition
Transportation Management Systems
Current Inventory Projected Inventory (in 2027)18,837 Each 20,483 Each
Add New 1,646 Poor 2,153
Performance Gap for the Last 5 Years Average Unit Cost*
Fix Fair to Good N/A Good or New 19,364Fix Poor to Good 2,300 Fair N/A
Poor 7,756 Poor 12,997
Pipelined Projects (in any SHOPP or 2018 PID Workplan) Target Condition (in 2027) - Goal
Add New 1,034 Add New $85,176
Estimated CostsUnfunded Pipelined Maintenance Work $0 Maintenance Performance Gap $0
Total
Fix Fair to Good N/A Fix Fair to Good N/AFix Poor to Good 8,544 Fix Poor to Good $85,176
Fair Gap "Fix Fair"Total Unit Cost* Poor Gap "Fix Poor"
Total Unit Cost*Goal Constrained
Need
(*) The unit costs represent a multi-year programmatic average of a number of activities included within this objective. These costs should not be used for project level estimates.(**) The support ratios represent a multi-year cost-weighted average of a number of activities included within this objective. These ratios should not be used for project level estimates.
District Projected Quantity ReplacementTotal Unit Cost* Estimated Value New Gap "Add New"
Total Unit Cost*
$1,809,994,398Unfunded Pipelined SHOPP Projects $692,328,000 SHOPP Performance Gap $1,117,666,398
District Breakdown

Appendix B - Performance Management Sheets 33 of 34
% per Year% per Year
78.80% 78.80%8.45% 8.45%
12.75% 12.75%
0.23% 75.00%0.41% 15.00%0.00% 10.00%
Support Ratio**0.09% 40.00%4.13% 40.00%0.00% 40.00%
D1 5,472,154 $560 $3,064,406,240 0 $560 -510,047 $420 35,327 $560 $19,783,120D2 5,657,506 $560 $3,168,203,360 0 $560 -596,320 $420 -211,909 $560 $0D3 23,052,229 $560 $12,909,248,240 0 $560 233,202 $420 586,477 $560 $426,371,960D4 53,117,342 $560 $29,745,711,520 0 $560 -3,765,127 $420 4,337,012 $560 $2,428,726,720D5 7,567,833 $560 $4,237,986,480 0 $560 -605,365 $420 42,813 $560 $23,975,280D6 10,932,061 $560 $6,121,954,160 0 $560 -950,769 $420 489,534 $560 $274,139,040D7 63,052,408 $560 $35,309,348,480 0 $560 -3,279,742 $420 4,651,290 $560 $2,604,722,400D8 21,442,325 $560 $12,007,702,000 0 $560 -2,137,376 $420 -1,657,241 $560 $0D9 984,610 $560 $551,381,600 0 $560 -84,519 $420 -71,810 $560 $0
D10 9,398,628 $560 $5,263,231,680 0 $560 -546,165 $420 -256,980 $560 $0D11 25,492,126 $560 $14,275,590,560 0 $560 -2,457,955 $420 -861,896 $560 $0D12 19,587,106 $560 $10,968,779,360 0 $560 -1,976,925 $420 -1,332,715 $560 $0HQ N/A N/A N/A N/A N/A N/A N/A N/A N/A N/A
Statewide Totals 245,756,328 N/A $137,623,543,680 0 N/A 233,202 N/A 10,142,453 N/A $5,777,718,520
Projected Condition (in 2027) - Do Nothing ScenarioGood 193,664,987 Good 193,664,987Fair 20,757,365 Fair 20,757,365
Effective Annual Deterioration RateInto Fair 0.00Into Poor 0.00
Current Condition
Bridge Goods Movement Upgrades
Current Inventory Projected Inventory (in 2027)245,756,328 SF 245,756,328 SF
Add New 0 Poor 24,575,634
Performance Gap for the Last 5 Years Average Unit Cost*
Fix Fair to Good 571,024 Good or New 184,317,245Fix Poor to Good 1,008,440 Fair 36,863,449
Poor 31,333,976 Poor 31,333,976
Pipelined Projects (in any SHOPP or 2018 PID Workplan) Target Condition (in 2027) - Goal
Add New 0 Add New $400
Estimated CostsUnfunded Pipelined Maintenance Work $0 Maintenance Performance Gap $0
Total
Fix Fair to Good 233,202 Fix Fair to Good $300Fix Poor to Good 10,142,453 Fix Poor to Good $400
Fair Gap "Fix Fair"Total Unit Cost* Poor Gap "Fix Poor"
Total Unit Cost*Goal Constrained
Need
(*) The unit costs represent a multi-year programmatic average of a number of activities included within this objective. These costs should not be used for project level estimates.(**) The support ratios represent a multi-year cost-weighted average of a number of activities included within this objective. These ratios should not be used for project level estimates.
District Projected Quantity ReplacementTotal Unit Cost* Estimated Value New Gap "Add New"
Total Unit Cost*
$5,907,195,320Unfunded Pipelined SHOPP Projects $129,476,800 SHOPP Performance Gap $5,777,718,520
District Breakdown

Appendix B - Performance Management Sheets 34 of 34
% per Year% per Year
2.84% 1.14%97.16% 47.73%0.00% 51.14%
6.82% 90.00%0.00% 10.00%0.00% 0.00%
Support Ratio**31.25% 100.00%51.14% 100.00%2.27% 100.00%
D1 3 $2,465,334 $7,396,002 0 $2,465,334 1 $2,465,334 2 $2,465,334 $7,396,002D2 10 $2,465,334 $24,653,340 0 $2,465,334 2 $2,465,334 5 $2,465,334 $17,257,338D3 15 $2,465,334 $36,980,010 0 $2,465,334 4 $2,465,334 6 $2,465,334 $24,653,340D4 36 $2,465,334 $88,752,024 4 $2,465,334 10 $2,465,334 18 $2,465,334 $78,890,688D5 3 $2,465,334 $7,396,002 0 $2,465,334 1 $2,465,334 2 $2,465,334 $7,396,002D6 11 $2,465,334 $27,118,674 0 $2,465,334 3 $2,465,334 6 $2,465,334 $22,188,006D7 22 $2,465,334 $54,237,348 0 $2,465,334 8 $2,465,334 11 $2,465,334 $46,841,346D8 29 $2,465,334 $71,494,686 0 $2,465,334 9 $2,465,334 15 $2,465,334 $59,168,016D9 1 $2,465,334 $2,465,334 0 $2,465,334 0 $2,465,334 1 $2,465,334 $2,465,334
D10 13 $2,465,334 $32,049,342 0 $2,465,334 5 $2,465,334 7 $2,465,334 $29,584,008D11 21 $2,465,334 $51,772,014 0 $2,465,334 7 $2,465,334 11 $2,465,334 $44,376,012D12 12 $2,465,334 $29,584,008 0 $2,465,334 5 $2,465,334 6 $2,465,334 $27,118,674HQ N/A N/A N/A N/A N/A N/A N/A N/A N/A N/A
Statewide Totals 176 N/A $433,898,784 4 N/A 55 N/A 90 N/A $367,334,766
Projected Condition (in 2027) - Do Nothing ScenarioGood 5 Good 2Fair 171 Fair 84
Effective Annual Deterioration RateInto Fair 6.00Into Poor 5.26
Current Condition
Weigh-In-Motion Scales
Current Inventory Projected Inventory (in 2027)176 Stations 176 Stations
Add New 0 Poor 0
Performance Gap for the Last 5 Years Average Unit Cost*
Fix Fair to Good 12 Good or New 163Fix Poor to Good 0 Fair 17
Poor 0 Poor 90
Pipelined Projects (in any SHOPP or 2018 PID Workplan) Target Condition (in 2027) - Goal
Add New 4 Add New $1,232,667
Estimated CostsUnfunded Pipelined Maintenance Work $0 Maintenance Performance Gap $0
Total
Fix Fair to Good 55 Fix Fair to Good $1,232,667Fix Poor to Good 90 Fix Poor to Good $1,232,667
Fair Gap "Fix Fair"Total Unit Cost* Poor Gap "Fix Poor"
Total Unit Cost*Goal Constrained
Need
(*) The unit costs represent a multi-year programmatic average of a number of activities included within this objective. These costs should not be used for project level estimates.(**) The support ratios represent a multi-year cost-weighted average of a number of activities included within this objective. These ratios should not be used for project level estimates.
District Projected Quantity ReplacementTotal Unit Cost* Estimated Value New Gap "Add New"
Total Unit Cost*
$378,874,766Unfunded Pipelined SHOPP Projects $11,540,000 SHOPP Performance Gap $367,334,766
District Breakdown
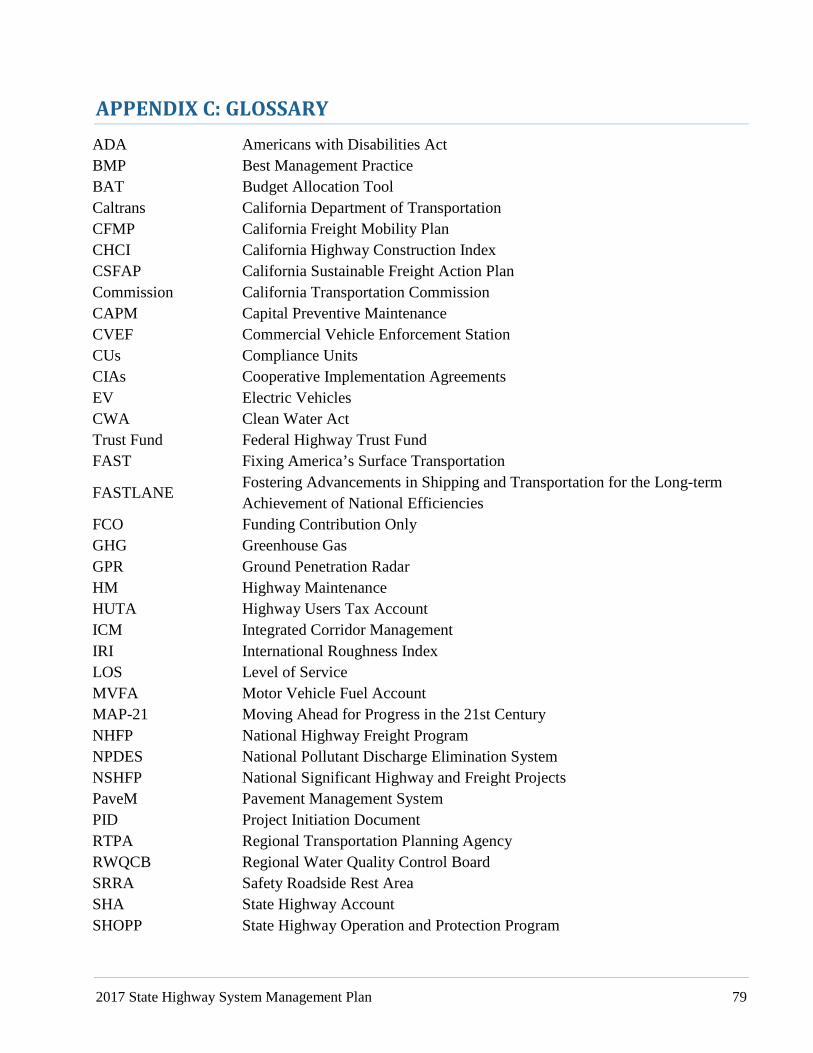
2017 State Highway System Management Plan 79
APPENDIX C: GLOSSARY ADA Americans with Disabilities Act BMP Best Management Practice BAT Budget Allocation Tool Caltrans California Department of Transportation CFMP California Freight Mobility Plan CHCI California Highway Construction Index CSFAP California Sustainable Freight Action Plan Commission California Transportation Commission CAPM Capital Preventive Maintenance CVEF Commercial Vehicle Enforcement Station CUs Compliance Units CIAs Cooperative Implementation Agreements EV Electric Vehicles CWA Clean Water Act Trust Fund Federal Highway Trust Fund FAST Fixing America’s Surface Transportation
FASTLANE Fostering Advancements in Shipping and Transportation for the Long-term Achievement of National Efficiencies
FCO Funding Contribution Only GHG Greenhouse Gas GPR Ground Penetration Radar HM Highway Maintenance HUTA Highway Users Tax Account ICM Integrated Corridor Management IRI International Roughness Index LOS Level of Service MVFA Motor Vehicle Fuel Account MAP-21 Moving Ahead for Progress in the 21st Century NHFP National Highway Freight Program NPDES National Pollutant Discharge Elimination System NSHFP National Significant Highway and Freight Projects PaveM Pavement Management System PID Project Initiation Document RTPA Regional Transportation Planning Agency RWQCB Regional Water Quality Control Board SRRA Safety Roadside Rest Area SHA State Highway Account SHOPP State Highway Operation and Protection Program
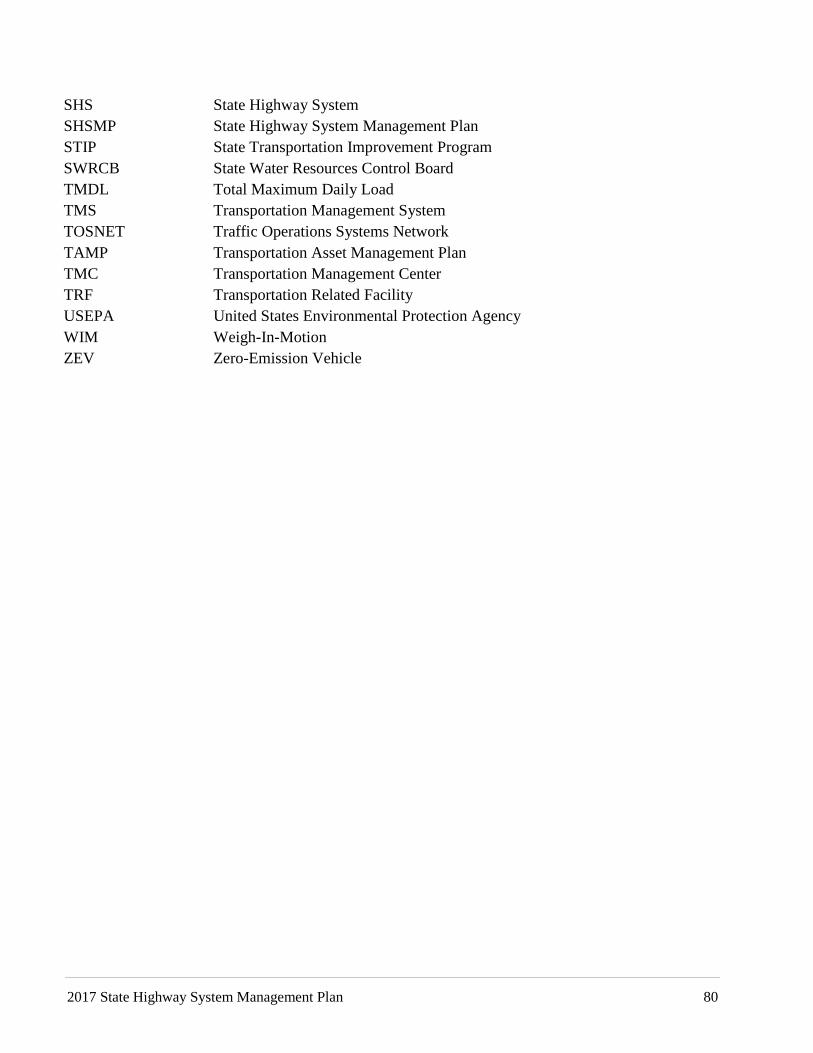
2017 State Highway System Management Plan 80
SHS State Highway System SHSMP State Highway System Management Plan STIP State Transportation Improvement Program SWRCB State Water Resources Control Board TMDL Total Maximum Daily Load TMS Transportation Management System TOSNET Traffic Operations Systems Network TAMP Transportation Asset Management Plan TMC Transportation Management Center TRF Transportation Related Facility USEPA United States Environmental Protection Agency WIM Weigh-In-Motion ZEV Zero-Emission Vehicle

Our MissionProvide a safe, sustainable, integrated and efficient transportation system to
enhance California’s economy and livability.
Our VisionA performance-driven, transparent and accountable organization that values its people, resources and
partners, and meets new challenges through leadership, innovation and teamwork.
Safety and HealthProvide a safe transportation system for workers and users, and promote health through active transportation and reduced pollution in communities.
Sustainability, Livability and EconomyMake long-lasting, smart mobility decisions that improve the environment, support a vibrant economy, and build communities, not sprawl.
System PerformanceUtilize leadership, collaboration and strategic partnerships to develop an integrated transportation system that provides reliable and accessible mobility for travelers.
Stewardship and EfficiencyMoney counts. Responsibly manage California’s transportation-related assets.
Organizational ExcellenceBe a national leader in delivering quality service through excellent employee performance, public communication, and accountability.
Integrity n Commitment n Teamwork n Innovation

California Department of Transportation 1120 N Street, MS 49
Sacramento, CA 95814 www.dot.ca.gov


