98
Madibeng Local Municipality SCHEDULE A FINAL ANNUAL BUDGET AND SUPPORTING DOCUMENTATION OF MADIBENG LOCAL MUNICIPALITY

Madibeng Local Municipality
SCHEDULE A
FINAL ANNUAL BUDGET AND
SUPPORTING DOCUMENTATION
OF MADIBENG LOCAL
MUNICIPALITY

FINAL ANNUAL BUDGET OF
MADIBENG LOCAL
MUNICIPALITY
2020/21 TO 2022/23
FINAL MEDIUM TERM REVENUE AND
EXPENDITURE FORECASTS
Copies of this document can be viewed:
In the foyers of all municipal buildings
All public libraries within the municipality
At www.treasury.gov.za
Madibeng Local Municipality 2020/21 Annual Budget and MTREF
Page | i
Table of Contents
PART 1 – ANNUAL BUDGET ...................................................................................................................... 1
1.1 MAYOR’S REPORT ....................................................................................................................................... 1
1.2 FINAL COUNCIL RESOLUTIONS .................................................................................................................... 6
1.3 EXECUTIVE SUMMARY ................................................................................................................................. 7
1.4 OPERATING REVENUE FRAMEWORK ........................................................................................................... 9
1.5 OPERATING EXPENDITURE FRAMEWORK .................................................................................................. 19
1.6 CAPITAL EXPENDITURE .............................................................................................................................. 23
1.7 ANNUAL BUDGET TABLES - PARENT MUNICIPALITY .................................................................................. 25
2 PART 2 – SUPPORTING DOCUMENTATION ............................................................................. 41
2.1 OVERVIEW OF THE ANNUAL BUDGET PROCESS ......................................................................................... 41
2.2 OVERVIEW OF ALIGNMENT OF ANNUAL BUDGET WITH IDP ....................................................................... 44
2.3 MEASURABLE PERFORMANCE OBJECTIVES AND INDICATORS ................................................................... 47
2.4 OVERVIEW OF BUDGET RELATED-POLICIES ............................................................................................... 54
2.5 OVERVIEW OF BUDGET ASSUMPTIONS ...................................................................................................... 56
2.6 OVERVIEW OF BUDGET FUNDING ............................................................................................................... 57
2.7 EXPENDITURE ON GRANTS AND RECONCILIATIONS OF UNSPENT FUNDS .................................................. 69
2.8 COUNCILLOR AND EMPLOYEE BENEFITS .................................................................................................... 71
2.9 MONTHLY TARGETS FOR REVENUE, EXPENDITURE AND CASH FLOW ........................................................ 72
2.10 ANNUAL BUDGETS AND SDBIPS – INTERNAL DEPARTMENTS ................................................................... 79
2.11 CONTRACTS HAVING FUTURE BUDGETARY IMPLICATIONS ........................................................................ 79
2.12 CAPITAL EXPENDITURE DETAILS ................................................................................................................ 79
2.13 LEGISLATION COMPLIANCE STATUS ........................................................................................................... 84
2.14 OTHER SUPPORTING DOCUMENTS ............................................................................................................. 85
2.15 MUNICIPAL MANAGER’S QUALITY CERTIFICATE ......................................................................................... 92
List of Tables
Table 1 Consolidated Overview of the 2020/21 MTREF ............................................................................... 9
Table 2 Summary of revenue classified by main revenue source .............................................................. 10
Table 3 Percentage growth in revenue by main revenue source .............................................................. 11
Table 4 Operating Transfers and Grant Receipts ....................................................................................... 12
Table 5 Comparison of proposed rates to levy for the 2020/21 financial year ......................................... 13
Table 6 Proposed Water Tariffs ................................................................................................................. 14
Table 7 Comparison between current water charges and increases (Domestic) ...................................... 15
Table 8 Comparison between current electricity charges and increases (Domestic) ................................ 15
Table 9 Comparison between current sanitation charges and increases .................................................. 16
Table 10 Comparison between current sanitation charges and increases, single dwelling- houses ......... 16
Table 11 Comparison between current waste removal fees and increases ............................................... 17
Table 12 MBRR Table SA14 – Household bills............................................................................................. 18
Table 13 Summary of operating expenditure by standard classification item ........................................... 19
Madibeng Local Municipality 2020/21 /Final Annual Budget and MTREF
ii | P a g e
Table 14 Operational repairs and maintenance ......................................................................................... 22
Table 15 Repairs and maintenance per asset class .................................................................................... 22
Table 16 2020/21 Medium-term capital budget per vote .......................................................................... 23
Table 17 MBRR Table A1 - Budget Summary .............................................................................................. 26
Table 18 MBRR Table A2 - Budgeted Financial Performance (revenue and expenditure by standard
classification)............................................................................................................................................... 28
Table 19 MBRR Table A3 - Budgeted Financial Performance (revenue and expenditure by municipal vote)
.................................................................................................................................................................... 29
Table 20Surplus/(Deficit) calculations for the trading services .................................................................. 30
Table 21 MBRR Table A4 - Budgeted Financial Performance (revenue and expenditure) ......................... 31
Table 22 MBRR Table A5 - Budgeted Capital Expenditure by vote, standard classification and funding
source .......................................................................................................................................................... 33
Table 23 MBRR Table A6 - Budgeted Financial Position ............................................................................. 35
Table 24 MBRR Table A7 - Budgeted Cash Flow Statement ....................................................................... 36
Table 25 MBRR Table A8 - Cash Backed Reserves/Accumulated Surplus Reconciliation ........................... 37
Table 26 MBRR Table A9 - Asset Management .......................................................................................... 38
Table 27 MBRR Table A10 - Basic Service Delivery Measurement ............................................................. 40
Table 28 IDP Strategic Objectives ............................................................................................................... 44
Table 29 MBRR Table SA4 - Reconciliation between the IDP strategic objectives and budgeted revenue 46
Table 30 MBRR Table SA5 - Reconciliation between the IDP strategic objectives and budgeted operating
expenditure ................................................................................................................................................. 47
Table 31 MBRR Table SA6 - Reconciliation between the IDP strategic objectives and budgeted capital
expenditure ................................................................................................................................................. 47
Table 32 MBRR Table SA7 - Measurable performance objectives.............................................................. 50
Table 33 MBRR Table SA8 - Performance indicators and benchmarks ...................................................... 51
Table 34 Breakdown of the operating revenue over the medium-term .................................................... 58
Table 35 Proposed tariff increases over the medium-term........................................................................ 59
Table 36 MBRR SA15 – Detail Investment Information .............................................................................. 60
Table 37 MBRR SA16 – Investment particulars by maturity ....................................................................... 60
Table 38 Sources of capital revenue over the MTREF ................................................................................ 60
Table 39 MBRR Table SA 17 - Detail of borrowings .................................................................................... 61
Table 40 MBRR Table SA 18 - Capital transfers and grant receipts ............................................................ 62
Table 41 MBRR Table A7 - Budget cash flow statement ............................................................................. 62
Table 42 MBRR Table A8 - Cash backed reserves/accumulated surplus reconciliation ............................. 64
Table 44 MBRR SA10 – Funding compliance measurement ....................................................................... 66
Table 46 MBRR SA19 - Expenditure on transfers and grant programmes ................................................. 69
Table 47 MBRR SA22 - Summary of councillor and staff benefits .............................................................. 71
Table 48 MBRR SA23 - Salaries, allowances and benefits (political office bearers/councillors/ senior
managers) ................................................................................................................................................... 72
Table 49 MBRR SA24 – Summary of personnel numbers ........................................................................... 72
Table 50 MBRR SA25 - Budgeted monthly revenue and expenditure ........................................................ 73
Table 51 MBRR SA26 - Budgeted monthly revenue and expenditure (municipal vote) ............................. 74

Madibeng Local Municipality 2020/21 /Final Annual Budget and MTREF
iii | P a g e
Table 52 MBRR SA27 - Budgeted monthly revenue and expenditure (standard classification) ................. 75
Table 53 MBRR SA28 - Budgeted monthly capital expenditure (municipal vote) ...................................... 76
Table 54 MBRR SA29 - Budgeted monthly capital expenditure (standard classification) .......................... 77
Table 55 MBRR SA30 - Budgeted monthly cash flow .................................................................................. 78
Table 56 MBRR SA 34a - Capital expenditure on new assets by asset class ............................................... 79
Table 57 MBRR SA34b - Capital expenditure on the renewal of existing assets by asset class.................. 80
Table 58 MBRR SA34c - Repairs and maintenance expenditure by asset class .......................................... 80
Table 59 MBRR SA34d - Depreciation by asset class .................................................................................. 81
Table 60 MBRR SA34e - Capital expenditure on the upgrading of existing assets by asset class .............. 81
Table 61 MBRR SA35 - Future financial implications of the capital budget ............................................... 82
Table 62 MBRR SA36 - Detailed capital budget per municipal vote .......................................................... 83
Table 63 MBRR Table SA1 - Supporting detail to budgeted financial performance (Continued) ............... 86
Table 64 MBRR Table SA2 – Matrix financial performance budget (revenue source/expenditure type and
department) ................................................................................................................................................ 87
Table 65 MBRR Table SA3 – Supporting detail to Statement of Financial Position .................................... 88
Table 66 MBRR Table SA9 – Social, economic and demographic statistics and assumptions .................... 89
Table 67 MBRR Table SA37 Projects delayed from previous financial year/s ............................................ 89
Table 68 MBRR Table SA38 Consolidated detailed operational projects ................................................... 90
List of Figures
Figure 1 Main operational expenditure categories for the 2020/21 financial year .................................. 21
Figure 2 Capital Infrastructure Programme ............................................................................................... 24
Figure 3 Expenditure by major type ........................................................................................................... 32
Figure 4 Depreciation in relation to repairs and maintenance over the MTREF ....................................... 39
Figure 5 Planning, budgeting and reporting cycle ..................................................................................... 48
Figure 6 Definition of performance information concepts ........................................................................ 49
Figure 7 Breakdown of operating revenue over the 2019/20MTREF ........................................................ 58
Figure 8 Sources of capital revenue for the 2020/21 financial year .......................................................... 61
Figure 9 Growth in outstanding borrowing (long-term liabilities) ............................................................. 61
Figure 10 Cash and cash equivalents / Cash backed reserves and accumulated funds ............................. 65

Madibeng Local Municipality 2020/21 /Final Annual Budget and MTREF
iv | P a g e
Abbreviations and Acronyms
AMR Automated Meter Reading ASGISA Accelerated and Shared Growth
Initiative BPC Budget Planning Committee CBD Central Business District CFO Chief Financial Officer CM Municipality Manager CPI Consumer Price Index CRRF Capital Replacement Reserve Fund DBSA Development Bank of South Africa DoRA Division of Revenue Act DWA Department of Water Affairs EE Employment Equity EEDSM Energy Efficiency Demand Side
Management EM Executive Mayor FBS Free basic services GAMAP Generally Accepted Municipal
Accounting Practice GDP Gross domestic product GDS Gauteng Growth and Development
Strategy GFS Government Financial Statistics GRAP General Recognised Accounting
Practice HR Human Resources HSRC Human Science Research Council IDP Integrated Development Strategy IT Information Technology kℓ kilolitre km kilometre KPA Key Performance Area KPI Key Performance Indicator kWh kilowatt
ℓ Litre LED Local Economic Development MEC Member of the Executive Committee MFMA Municipal Financial Management Act
Programme MIG Municipal Infrastructure Grant MMC Member of Mayoral Committee MPRA Municipal Properties Rates Act MSA Municipal Systems Act MTEF Medium-term Expenditure
Framework MTREF Medium-term Revenue and
Expenditure Framework NERSA National Electricity Regulator South
Africa NGO Non-Governmental organisations NKPIs National Key Performance Indicators OHS Occupational Health and Safety OP Operational Plan PBO Public Benefit Organisations PHC Provincial Health Care PMS Performance Management System PPE Property Plant and Equipment PPP Public Private Partnership PTIS Public Transport Infrastructure
System RG Restructuring Grant RSC Regional Services Council SALGA South African Local Government
Association SAPS South African Police Service SDBIP Service Delivery Budget
Implementation Plan SMME Small Micro and Medium Enterprises

Madibeng Local Municipality 2020/21 Final Annual Budget and MTREF
1
Part 1 – Annual Budget
1.1 Mayor’s Report
Honourable Speaker of Council-Clr. Ntshabele, Honourable Single Whip of Council- Clr.
Makgabo, Honourable Chairperson of Municipal Public Accounts-Clr. Diale, Members of the
Mayoral Committee, Councillors; Administrator and your team, The Acting Accounting Officer Mr.
Neo Maape and your team, Entire Officials of the Municipality, All protocol observed
INTRODUCTION
Honourable Speaker, this meeting is taking place at a critical time when the world is responding
to the outbreak of COVID-19.We need to applaud national Government for stringent measures
put in place to control the spread of the virus. The declaration of the state of national disaster
followed by the national lockdown are the two key measures government employed to deal with
the spread. Our Provincial Government has done a splendid work going around the province
ensuring that necessary measures are put in place to reduce the spread and assist in flattening
the curve. We have been doing our part as the Municipality guided by the District Joint Operations
(JOC) Centre and the Bojanala District Command Council
Speaker, we responded to the call by the President that Municipalities should be considerate to
the homeless by establishing shelters for the Homeless and the Municipality through the Office of
the Executive Mayor identified and availed the Primindia Hall for such. The centre started
operating on 15 April and the numbers of homeless people varies daily. We wish to thank all the
donors who supplied and are continuing to supply the centre with all necessities to sustaining it
and to ensure that our vulnerable members of the community are well taken care of and are not
exposed to this invisible enemy that the entire world is fighting against.
Honourable Speaker, Madibeng has seen a rise in numbers of positive COVID-19 cases.
The stats as confirmed on the 29th of June 2020 are at 192 and may we recognise that these
numbers increases on a daily basis. I wish to call upon our people to join hands in the fight to
flatten the curve. Let us all follow the necessary precautions and stay safe. The protocols of
washing our hands regularly, keeping a social distance of at least one and a half meters away
from the next person, wearing our masks all the time when in the public and not travelling for no
apparent reason should be our new normal. Hence our budget this year delayed and it was
publicised on local newspapers, website, social media platforms, municipal satellite office and the
Madibeng FM.
BACKGROUND
Hon Speaker, in accordance with Section 16 of the Municipal Finance Management Act, 56 of
2003, the council must for each financial year approve annual budget for the municipality before
the start of the financial year. As The Executive Mayor of the municipality, it is my legislative
obligation to table the annual budget in a Council Sitting, at least 90 days before the start of the
new budget year. Section 23 further requires that the tabled budget adopted by Council be public
Madibeng Local Municipality 2020/21 /Final Annual Budget and MTREF
2 | P a g e
participated to solicit views of Local Community, National Treasury, Provincial Treasury and any
other organ of state who made submissions to the budget. The MFMA Section 17(1) refers to a
prescribed format according to which the annual budget is required to be prepared. National
Treasury has issued Municipal Budget and Reporting Regulations in terms of Government
Gazette Number 32141 dated 17 April 2009. These regulations set out the manner in which
municipalities are required to present their budget. Furthermore, the compilation of this budget is
based on the municipality’s Integrated Development Plan (IDP) priority weighing and the National
and Provincial government priorities.
BUDGET
The proposed budget of Madibeng Local municipality for the 2020/21 financial year totals R 2.7
billion, comprising of R 2.4 billion Operating Expenditure and R 281.4 million for Capital
expenditure. The total budget remains at R2.7billion when compared with the 2019/20 Original
Budget and has increased by R 41 million or 3% compared with the 2019/20 Adjustment Budget.
Total operating revenue has grown by 7 per cent or R152 million for the 2020/21 financial year
when compared to the 2019/20 Adjustments Budget. For the two outer years, operational
revenue will increase by 6 and 7 per cent respectively, equating to a total revenue growth of R140
and 155 million respectively over the MTREF when compared to the 2019/20 financial year.
Total operating expenditure for the 2020/21 financial year has been appropriated at R2.4 billion
and translates into a budgeted deficit of R404 million. When compared to the 2019/20
Adjustments Budget, operational expenditure has grown by 4 per cent in the 2020/21 budget and
by 4 and 3 per cent for each of the respective outer years of the MTREF. The operating deficit for
the two outer years steadily decreases to R375 million and 309 million.
The capital budget of R281 million for 2020/21 is 5 per cent less when compared to the 2019/20
Adjustment Budget. The conditional grants to municipalities have been reduced and most
conditional grants have been reduced as part of efforts to limit growth in government expenditure
and ensure that public debt is sustainable.
Operating Revenue Framework
For Madibeng Local Municipality to continue improving the quality of services provided to its
communities it needs to generate the required revenue. In these tough economic times, strong
revenue management is fundamental to the financial sustainability of every municipality. The
reality is that we are faced with development backlogs, poverty, and rising number of
unemployment. The expenditure required to address these challenges will inevitably always
exceed available funding; hence difficult choices have to be made in relation to tariff increases
and balancing expenditures against realistically anticipated revenues.
The economic situation of the country has not improved since the previous financial year and now
has worsened by the lockdown. Therefore, we are reminded as it was communicated in MFMA
Madibeng Local Municipality 2020/21 /Final Annual Budget and MTREF
3 | P a g e
Circular No. 89 that weak economic growth has put stress on consumers’ ability to pay for
services, while transfers from national government are growing more slowly than in the past.
National Treasury encourages municipalities to maintain tariff increases at levels that reflect an
appropriate balance between the affordability to poorer households and other customers while
ensuring the financial sustainability of the municipality.
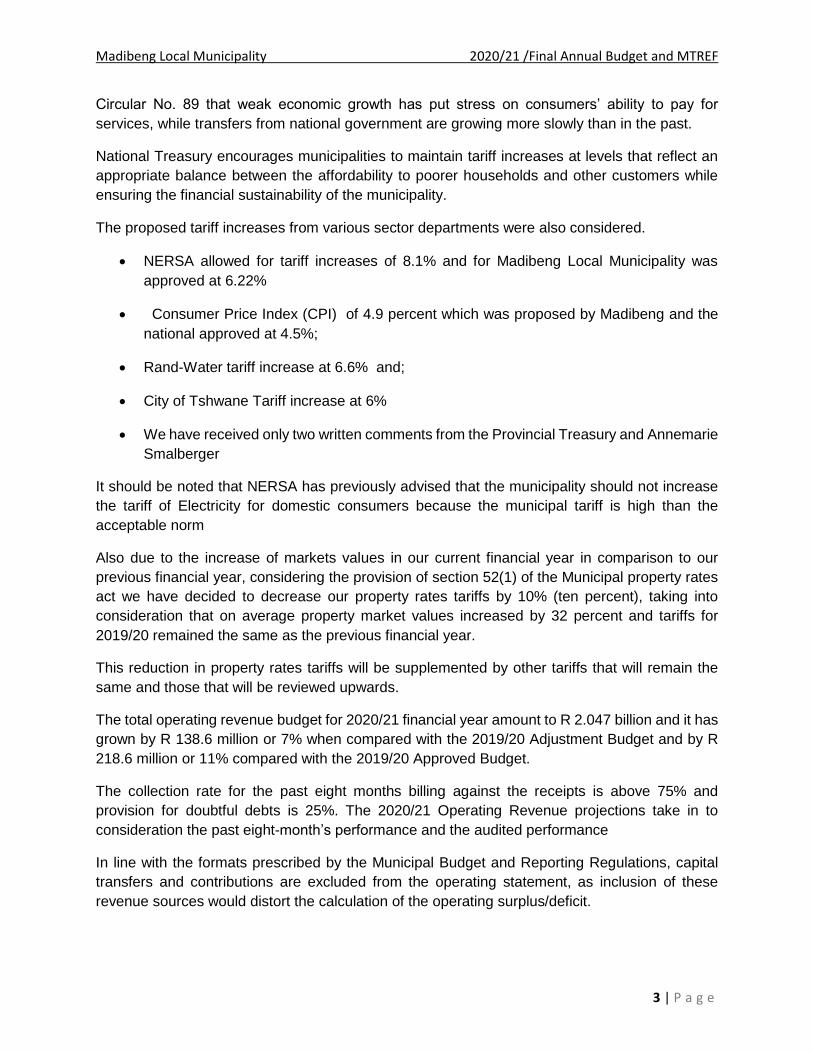
The proposed tariff increases from various sector departments were also considered.
NERSA allowed for tariff increases of 8.1% and for Madibeng Local Municipality was
approved at 6.22%
Consumer Price Index (CPI) of 4.9 percent which was proposed by Madibeng and the
national approved at 4.5%;
Rand-Water tariff increase at 6.6% and;
City of Tshwane Tariff increase at 6%
We have received only two written comments from the Provincial Treasury and Annemarie
Smalberger
It should be noted that NERSA has previously advised that the municipality should not increase
the tariff of Electricity for domestic consumers because the municipal tariff is high than the
acceptable norm
Also due to the increase of markets values in our current financial year in comparison to our
previous financial year, considering the provision of section 52(1) of the Municipal property rates
act we have decided to decrease our property rates tariffs by 10% (ten percent), taking into
consideration that on average property market values increased by 32 percent and tariffs for
2019/20 remained the same as the previous financial year.
This reduction in property rates tariffs will be supplemented by other tariffs that will remain the
same and those that will be reviewed upwards.
The total operating revenue budget for 2020/21 financial year amount to R 2.047 billion and it has
grown by R 138.6 million or 7% when compared with the 2019/20 Adjustment Budget and by R
218.6 million or 11% compared with the 2019/20 Approved Budget.
The collection rate for the past eight months billing against the receipts is above 75% and
provision for doubtful debts is 25%. The 2020/21 Operating Revenue projections take in to
consideration the past eight-month’s performance and the audited performance
In line with the formats prescribed by the Municipal Budget and Reporting Regulations, capital
transfers and contributions are excluded from the operating statement, as inclusion of these
revenue sources would distort the calculation of the operating surplus/deficit.
Madibeng Local Municipality 2020/21 /Final Annual Budget and MTREF
4 | P a g e
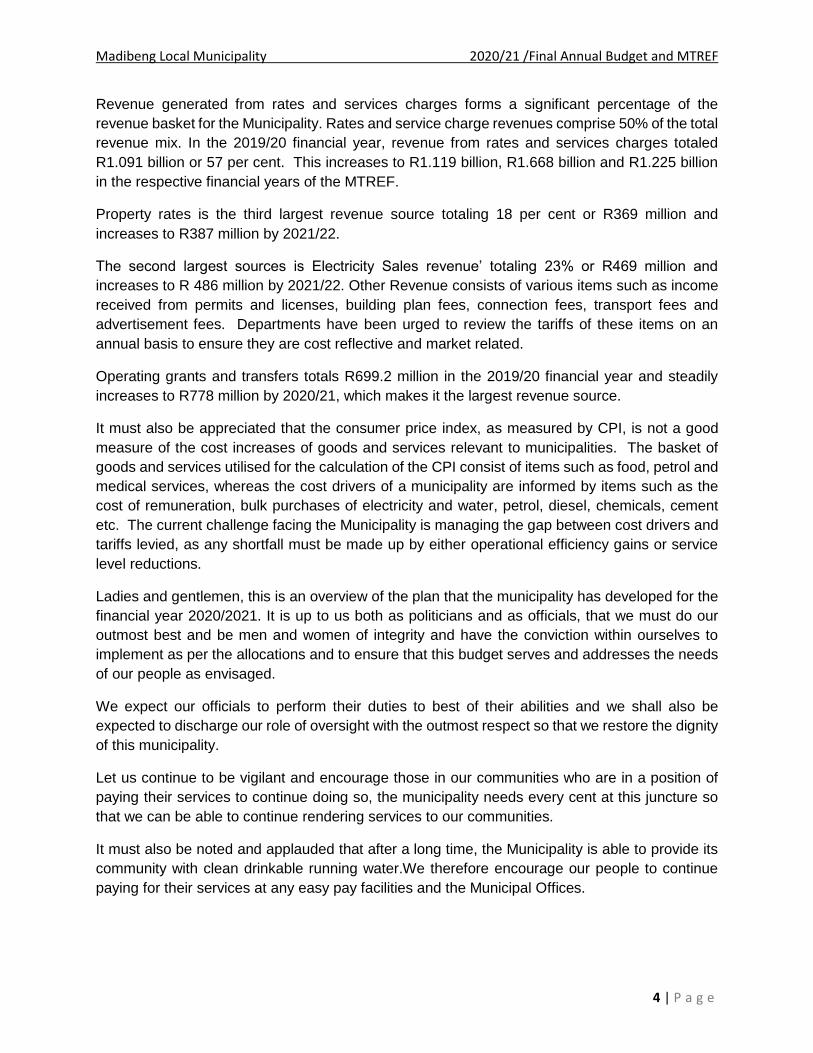
Revenue generated from rates and services charges forms a significant percentage of the
revenue basket for the Municipality. Rates and service charge revenues comprise 50% of the total
revenue mix. In the 2019/20 financial year, revenue from rates and services charges totaled
R1.091 billion or 57 per cent. This increases to R1.119 billion, R1.668 billion and R1.225 billion
in the respective financial years of the MTREF.
Property rates is the third largest revenue source totaling 18 per cent or R369 million and
increases to R387 million by 2021/22.
The second largest sources is Electricity Sales revenue’ totaling 23% or R469 million and
increases to R 486 million by 2021/22. Other Revenue consists of various items such as income
received from permits and licenses, building plan fees, connection fees, transport fees and
advertisement fees. Departments have been urged to review the tariffs of these items on an
annual basis to ensure they are cost reflective and market related.
Operating grants and transfers totals R699.2 million in the 2019/20 financial year and steadily
increases to R778 million by 2020/21, which makes it the largest revenue source.
It must also be appreciated that the consumer price index, as measured by CPI, is not a good
measure of the cost increases of goods and services relevant to municipalities. The basket of
goods and services utilised for the calculation of the CPI consist of items such as food, petrol and
medical services, whereas the cost drivers of a municipality are informed by items such as the
cost of remuneration, bulk purchases of electricity and water, petrol, diesel, chemicals, cement
etc. The current challenge facing the Municipality is managing the gap between cost drivers and
tariffs levied, as any shortfall must be made up by either operational efficiency gains or service
level reductions.
Ladies and gentlemen, this is an overview of the plan that the municipality has developed for the
financial year 2020/2021. It is up to us both as politicians and as officials, that we must do our
outmost best and be men and women of integrity and have the conviction within ourselves to
implement as per the allocations and to ensure that this budget serves and addresses the needs
of our people as envisaged.
We expect our officials to perform their duties to best of their abilities and we shall also be
expected to discharge our role of oversight with the outmost respect so that we restore the dignity
of this municipality.
Let us continue to be vigilant and encourage those in our communities who are in a position of
paying their services to continue doing so, the municipality needs every cent at this juncture so
that we can be able to continue rendering services to our communities.
It must also be noted and applauded that after a long time, the Municipality is able to provide its
community with clean drinkable running water.We therefore encourage our people to continue
paying for their services at any easy pay facilities and the Municipal Offices.

Madibeng Local Municipality 2020/21 /Final Annual Budget and MTREF
5 | P a g e
In Conclusion
An impression has been created that we are corrupt, yet I can stand here that since the
Municipality was put under Administration, there has never been any political interference or
otherwise. The Administrator and his team were allowed their space to operate in what was to be
the best interest of Madibeng and we are yet to receive report with any allegations. For the past
twelve months, no report has been received that I as the Political Head of this institution was
involved in anything illegal.
I previously resisted suggestions by legal experts and local government practitioners to interdict
the Administration and even though not everything went well I still restrained myself for the interest
of the Municipality and the people of Madibeng who are the ultimate owners of Madibeng.
With my background of recruiting government officials, I still refused to question the selection
processes of Administrator and his team. If I was approached to be an administrator or even a
team member of any municipality in South African I would have refused without any due process.
And for the sake of the people who elected this council we restrained ourselves to object to such
a flawed process. We however wish the administration team well in their future endeavours as for
us the councillors we are here elected by due processes of the constitution of the Republic to
serve the community.
Hon. Speaker, I therefore present the budget to the august house.
I THANK YOU!!!
I recommend that the Council approves and adopts the following resolutions:

Madibeng Local Municipality 2020/21 /Final Annual Budget and MTREF
6 | P a g e
1.2 Final Council Resolutions
1. That cognisance be taken:
1.1. of the contents of the report;
1.2. Annexure A, the 2020/2021 Budget book;
1.3. Annexure B, the 2020/2021 tariffs;
1.4. Annexure C, the 2020/2021 Budget related policies;
2. That Council approves the final budget for 2020/21 Medium MTREF as contained ‘’Annexure
A’’
3. That the following budget related policies is approved with the budget:
3.1. Reviewed Budget Policy
3.2. Reviewed Tariff Setting Policy and By- Law
3.3. Reviewed Credit Control and Debt Collection Policy and By-Law.
3.4. Reviewed Indigent Household Subsidy Policy
3.5. Reviewed Bad Debts Write-Off Policy
3.6. Reviewed Property Rates Policy & By-Law
3.7. Reviewed Deposit Policy
3.8. Reviewed Cost Containment Policy
3.9. Reviewed Cash Management and Investment Policy
3.10. Reviewed Cash Management and Investment Policy Supply Chain Policy and new
tender document specimen
4. That the Final Schedule of Proposed Tariffs hereto presented as the supporting document of
budget be approved for implementation on 01 July 2020.
5. That the Medium Term Revenue and Expenditure Framework for the period 2020/21 to 2022/23
be submitted to the National and Provincial Treasuries as required by MFMA.
6. That ward 24 Mashamplane road be allocated a full budget for the road in this current financial
year and ward 3 be allocated 2.5m for storm water.

Madibeng Local Municipality 2020/21 /Final Annual Budget and MTREF
7 | P a g e
1.3 Executive Summary
The start of 2020 began with the news of the coronavirus, or COVID-19, which was declared a
global pandemic by the World Health Organisation (WHO) on 11 March 2020. A pandemic is
commonly defined as the worldwide spread of a new disease. This virus created much panic in
the global economy with fears of a global recession. A recession generally occurs when there are
two successive quarters of a decline in the gross domestic product (GDP) of a country.
The coronavirus is bound to have an impact on Chinese demand for South African commodities
such as iron ore, coal and others. It will also affect other South African exports, such as agricultural
goods to China and other countries. South Africa’s economy needs all the help it can get right
now, and there is almost nothing out there that could possibly give it a boost.
The impact of the ESKOM load shedding is bound to continue with the next 3 – 5 years, mostly
due to critical planned and unplanned maintenance. The objective for the municipality during the
budget planning process was to keep rates and tariffs as low as possible for its residents in this
uncertain economic environment.
The main challenges experienced during the compilation of the 2020/21 MTREF can be
summarised as follows:
• The COVID 19 effect on the economy and municipal budget priorities; • The cost containment strategies; • The unfunded and under- funded mandates; • The Inter-Governmental agreements on Service Delivery provisions; • The on-going difficulties in the national and local economy; • Ever aging water, roads, sewage and electricity infrastructure; • Sustainable refuse disposal; • The need to reprioritise projects and expenditure within the existing resources; • The cost of bulk electricity; • Revenue recovery from cost reflective core municipal services; • Wage increases for municipal staff that have exceeded headline consumer inflation; • Maintaining a positive cash flow; and • Ensuring financial sustainability.
The following budget principles and guidelines directly informed the compilation of the
2020/21 MTREF:
• The 2019/2020 Adjustments Budget priorities and targets, as well as the base line allocations contained in the Budget Circulars informed the upper limits for the new baselines for the 2020/21 Annual Budget;
• Service level standards were used to inform the measurable objectives, targets and any backlog eradication goals;
• Tariffs and property rates increases should aim to be affordable; • Some price increases in the input costs of services are beyond the control of the
municipality, for instance the cost of fuel, chemicals and electricity. In addition, tariffs need

Madibeng Local Municipality 2020/21 /Final Annual Budget and MTREF
8 | P a g e
to remain or move towards being cost reflective, and should take into account the need to address infrastructure maintenance and backlogs;
• There will be no budget allocated to national and provincial funded projects unless the necessary grants to the municipality are reflected in the national and provincial budget, and have been gazetted as required by the annual Division of Revenue Act (DoRA);
• The following cost saving measures were applied:
- The principle of a minimal increase in non-core general expenses unless valid motivations, such as contractual inflation adjustments dictate.
- Municipal Cost Containment Regulations, 2019.
The following macro-economic forecasts were also considered when preparing the 2020/21
MTREF municipal budget.
Macroeconomic performance and projections
Fiscal Year 2019/20 2020/21 2021/22 2022/23
Estimate Forecast
CONSUMER PRICE INFLATION (CPI) 4.1% 4.5% 4.6% 4.6%
Source: 2020 Budget Review. : The fiscal year referred to is the national fiscal year (April to March) which is more closely aligned to the municipal fiscal year (July to June) than the calendar year inflation.
The Salary and Wage Collective Agreement for the period 01 July 2018 to 30 June 2021 is still in
operation, therefore municipalities need to budget for their employee related costs in line with the
multi-year wage agreement, and also ensure that the agreement is correctly implemented and
applied as per clauses of the agreement.
Government Gazette on the Remuneration of Public Office Bearers Act: Determination of Upper
Limits of Salaries, Allowances and Benefits of different members of municipal councils published
annually between December and January by the Department of Cooperative Governance and
Traditional Affairs (CoGTA). Any overpayment to Councillors contrary to the upper limits as
published by the Minister of Cooperative Governance and Traditional Affairs will be irregular
expenditure in terms of section 167 of the MFMA and must be recovered from the Councillor(s)
concerned.
Other matters as outlined in MFMA Circulars No. 28, 42, 51, 54, 55, 58, 59, 66, 67, 70, 71, 72,
74, 75, 78, 79, 85, 86, 89, 91,93, 94, 98,99 and budget related regulation no 32141 of 17 April
2009 and Chapter 4, 7 etc. of the MFMA.
The proposed budget of Madibeng Local municipality for the 2020/21 financial year totals R 2.7 billion, comprising of R 2.4 billion Operating Expenditure and R 281.4 million for Capital expenditure. The total budget remains at 2.7billion when compared with the 2019/20 Original Budget and has increased by R 41 million or 3% compared with the 2019/20 Adjustment Budget.
Madibeng Local Municipality 2020/21 /Final Annual Budget and MTREF
9 | P a g e
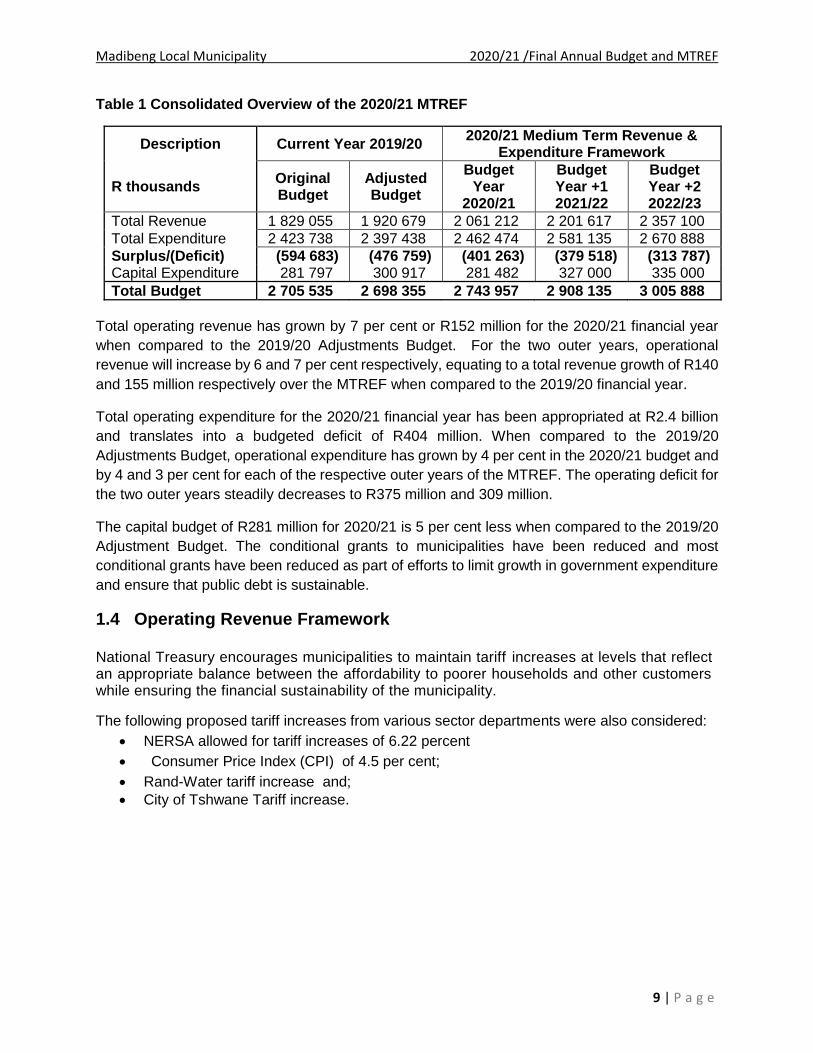
Table 1 Consolidated Overview of the 2020/21 MTREF
Description Current Year 2019/20 2020/21 Medium Term Revenue &
Expenditure Framework
R thousands Original Budget
Adjusted Budget
Budget Year
2020/21
Budget Year +1 2021/22
Budget Year +2 2022/23
Total Revenue 1 829 055 1 920 679 2 061 212 2 201 617 2 357 100
Total Expenditure 2 423 738 2 397 438 2 462 474 2 581 135 2 670 888
Surplus/(Deficit) (594 683) (476 759) (401 263) (379 518) (313 787) Capital Expenditure 281 797 300 917 281 482 327 000 335 000
Total Budget 2 705 535 2 698 355 2 743 957 2 908 135 3 005 888
Total operating revenue has grown by 7 per cent or R152 million for the 2020/21 financial year
when compared to the 2019/20 Adjustments Budget. For the two outer years, operational
revenue will increase by 6 and 7 per cent respectively, equating to a total revenue growth of R140
and 155 million respectively over the MTREF when compared to the 2019/20 financial year.
Total operating expenditure for the 2020/21 financial year has been appropriated at R2.4 billion
and translates into a budgeted deficit of R404 million. When compared to the 2019/20
Adjustments Budget, operational expenditure has grown by 4 per cent in the 2020/21 budget and
by 4 and 3 per cent for each of the respective outer years of the MTREF. The operating deficit for
the two outer years steadily decreases to R375 million and 309 million.
The capital budget of R281 million for 2020/21 is 5 per cent less when compared to the 2019/20
Adjustment Budget. The conditional grants to municipalities have been reduced and most
conditional grants have been reduced as part of efforts to limit growth in government expenditure
and ensure that public debt is sustainable.
1.4 Operating Revenue Framework
National Treasury encourages municipalities to maintain tariff increases at levels that reflect an appropriate balance between the affordability to poorer households and other customers while ensuring the financial sustainability of the municipality.
The following proposed tariff increases from various sector departments were also considered:
NERSA allowed for tariff increases of 6.22 percent
Consumer Price Index (CPI) of 4.5 per cent;
Rand-Water tariff increase and;
City of Tshwane Tariff increase.
Madibeng Local Municipality 2020/21 /Final Annual Budget and MTREF
10 | P a g e
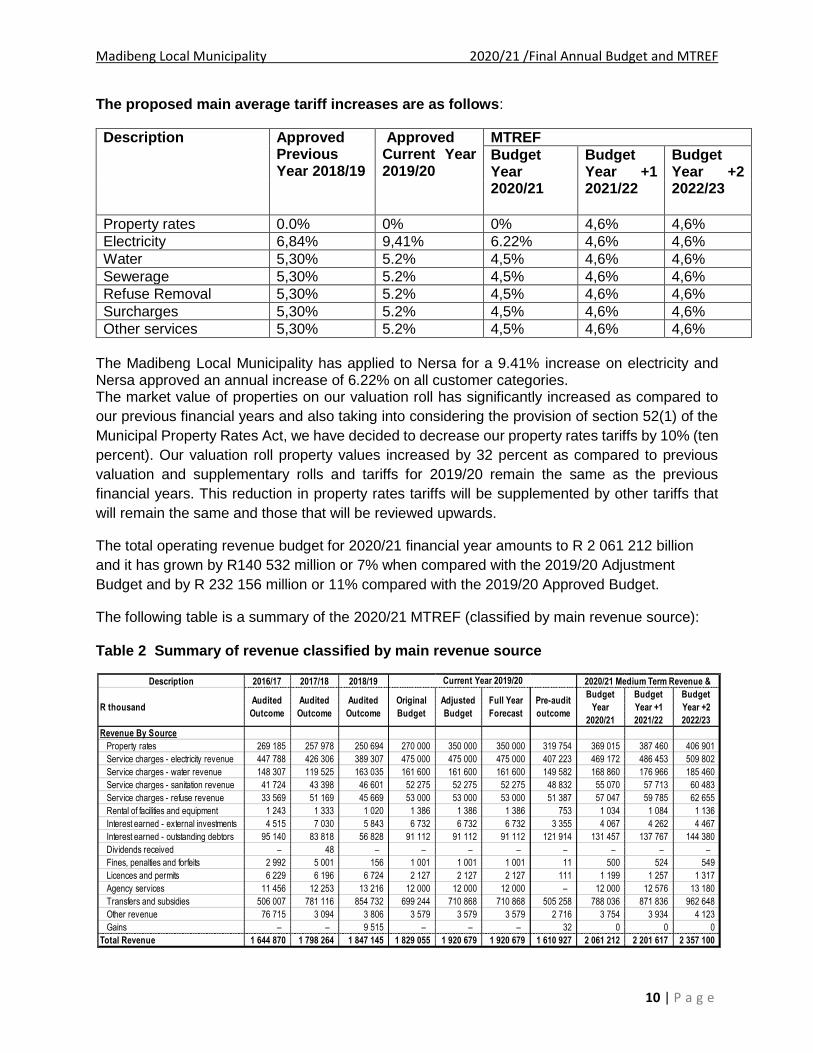
The proposed main average tariff increases are as follows:
Description Approved Previous Year 2018/19
Approved Current Year 2019/20
MTREF
Budget Year 2020/21
Budget Year +1 2021/22
Budget Year +2 2022/23
Property rates 0.0% 0% 0% 4,6% 4,6%
Electricity 6,84% 9,41% 6.22% 4,6% 4,6%
Water 5,30% 5.2% 4,5% 4,6% 4,6%
Sewerage 5,30% 5.2% 4,5% 4,6% 4,6%
Refuse Removal 5,30% 5.2% 4,5% 4,6% 4,6%
Surcharges 5,30% 5.2% 4,5% 4,6% 4,6%
Other services 5,30% 5.2% 4,5% 4,6% 4,6%
The Madibeng Local Municipality has applied to Nersa for a 9.41% increase on electricity and Nersa approved an annual increase of 6.22% on all customer categories. The market value of properties on our valuation roll has significantly increased as compared to
our previous financial years and also taking into considering the provision of section 52(1) of the
Municipal Property Rates Act, we have decided to decrease our property rates tariffs by 10% (ten
percent). Our valuation roll property values increased by 32 percent as compared to previous
valuation and supplementary rolls and tariffs for 2019/20 remain the same as the previous
financial years. This reduction in property rates tariffs will be supplemented by other tariffs that
will remain the same and those that will be reviewed upwards.
The total operating revenue budget for 2020/21 financial year amounts to R 2 061 212 billion
and it has grown by R140 532 million or 7% when compared with the 2019/20 Adjustment
Budget and by R 232 156 million or 11% compared with the 2019/20 Approved Budget.
The following table is a summary of the 2020/21 MTREF (classified by main revenue source): Table 2 Summary of revenue classified by main revenue source
Description 2016/17 2017/18 2018/19
R thousandAudited
Outcome
Audited
Outcome
Audited
Outcome
Original
Budget
Adjusted
Budget
Full Year
Forecast
Pre-audit
outcome
Budget
Year
2020/21
Budget
Year +1
2021/22
Budget
Year +2
2022/23
Revenue By Source
Property rates 269 185 257 978 250 694 270 000 350 000 350 000 319 754 369 015 387 460 406 901
Service charges - electricity revenue 447 788 426 306 389 307 475 000 475 000 475 000 407 223 469 172 486 453 509 802
Service charges - water revenue 148 307 119 525 163 035 161 600 161 600 161 600 149 582 168 860 176 966 185 460
Service charges - sanitation revenue 41 724 43 398 46 601 52 275 52 275 52 275 48 832 55 070 57 713 60 483
Service charges - refuse revenue 33 569 51 169 45 669 53 000 53 000 53 000 51 387 57 047 59 785 62 655
Rental of facilities and equipment 1 243 1 333 1 020 1 386 1 386 1 386 753 1 034 1 084 1 136
Interest earned - external investments 4 515 7 030 5 843 6 732 6 732 6 732 3 355 4 067 4 262 4 467
Interest earned - outstanding debtors 95 140 83 818 56 828 91 112 91 112 91 112 121 914 131 457 137 767 144 380
Dividends received – 48 – – – – – – – –
Fines, penalties and forfeits 2 992 5 001 156 1 001 1 001 1 001 11 500 524 549
Licences and permits 6 229 6 196 6 724 2 127 2 127 2 127 111 1 199 1 257 1 317
Agency services 11 456 12 253 13 216 12 000 12 000 12 000 – 12 000 12 576 13 180
Transfers and subsidies 506 007 781 116 854 732 699 244 710 868 710 868 505 258 788 036 871 836 962 648
Other revenue 76 715 3 094 3 806 3 579 3 579 3 579 2 716 3 754 3 934 4 123
Gains – – 9 515 – – – 32 0 0 0
Total Revenue 1 644 870 1 798 264 1 847 145 1 829 055 1 920 679 1 920 679 1 610 927 2 061 212 2 201 617 2 357 100
Current Year 2019/20 2020/21 Medium Term Revenue &

Madibeng Local Municipality 2020/21 /Final Annual Budget and MTREF
11 | P a g e
Table 3 Percentage growth in revenue by main revenue source
The collection rate for the past eleven months billing against the receipts is averaged at 70% and
provision for doubtful debts is 30%. The 2020/21 Operating Revenue projections take in to
consideration the past 11 month’s performance and the audited performance.
In line with the formats prescribed by the Municipal Budget and Reporting Regulations, capital
transfers and contributions are excluded from the operating statement, as inclusion of these
revenue sources would distort the calculation of the operating surplus/deficit.
Revenue generated from rates and services charges forms a significant percentage of the revenue basket for the Municipality. Rates and service charge revenues comprise more than 50% of the total revenue mix. In the 2019/20 financial year, revenue from rates and services charges totaled R1.091 billion or 57 per cent. This increases to R1.119 billion, R1.668 billion and R1.225 billion in the respective financial years of the MTREF. The above table excludes revenue foregone arising from discounts and rebates associated with the tariff policies of the Municipality. Details in this regard are contained in Table 64 MBRR SA1. Property rates is the third largest revenue source totaling 18 per cent or R369 million and increases to R387 million by 2021/22. The second largest sources is Electricity Sales revenue’ totaling 23% or R469 million and increases to R 486 million by 2021/22. Other Revenue consists of various items such as income received from permits and licenses, building plan fees, connection fees, transport fees and advertisement fees. Departments have been urged to review the tariffs of these items on an annual basis to ensure they are cost reflective and market related. Operating grants and transfers totals R699.2 million in the 2019/20 financial year and steadily increases to R778 million by 2020/21, which makes it the largest revenue source. The following table gives a breakdown of the various operating grants and subsidies allocated to the municipality over the medium term:
Description
R thousandAdjusted
Budget%
Budget Year
2020/21%
Budget Year
+1 2021/22%
Budget Year
+2 2022/23 %
Revenue By Source
Property rates 350 000 18% 369 015 18% 387 460 18% 406 901 17%
Serv ice charges - electricity rev enue 475 000 25% 469 172 23% 486 453 22% 509 802 22%
Serv ice charges - w ater rev enue 161 600 8% 168 860 8% 176 966 8% 185 460 8%
Serv ice charges - sanitation rev enue 52 275 3% 55 070 3% 57 713 3% 60 483 3%
Serv ice charges - refuse rev enue 53 000 3% 57 047 3% 59 785 3% 62 655 3%
Rental of facilities and equipment 1 386 0% 1 034 0% 1 084 0% 1 136 0%
Interest earned - ex ternal inv estments 6 732 0% 4 067 0% 4 262 0% 4 467 0%
Interest earned - outstanding debtors 91 112 5% 131 457 6% 137 767 6% 144 380 6%
Fines, penalties and forfeits 1 001 0% 500 0% 524 0% 549 0%
Licences and permits 2 127 0% 1 199 0% 1 257 0% 1 317 0%
Agency serv ices 12 000 1% 12 000 1% 12 576 1% 13 180 1%
Transfers and subsidies 710 868 37% 788 036 38% 871 836 40% 962 648 41%
Other rev enue 3 579 0% 3 754 0% 3 934 0% 4 123 0%
Total Revenue 1 920 679 100% 2 061 212 100% 2 201 617 100% 2 357 100 100%
Service Charges and Rates 1 091 875 57% 1 119 165 54% 1 168 377 53% 1 225 301 52%
2020/21 Medium Term Revenue & Expenditure
Madibeng Local Municipality 2020/21 /Final Annual Budget and MTREF
12 | P a g e
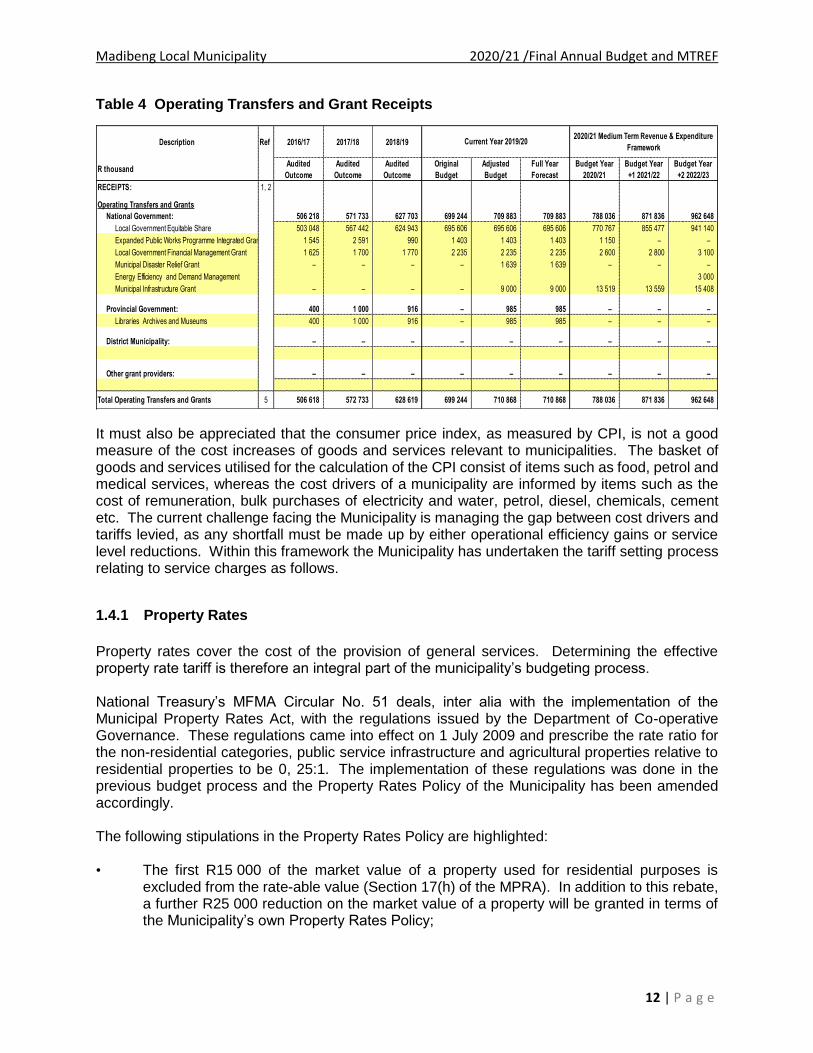
Table 4 Operating Transfers and Grant Receipts
It must also be appreciated that the consumer price index, as measured by CPI, is not a good measure of the cost increases of goods and services relevant to municipalities. The basket of goods and services utilised for the calculation of the CPI consist of items such as food, petrol and medical services, whereas the cost drivers of a municipality are informed by items such as the cost of remuneration, bulk purchases of electricity and water, petrol, diesel, chemicals, cement etc. The current challenge facing the Municipality is managing the gap between cost drivers and tariffs levied, as any shortfall must be made up by either operational efficiency gains or service level reductions. Within this framework the Municipality has undertaken the tariff setting process relating to service charges as follows.
1.4.1 Property Rates
Property rates cover the cost of the provision of general services. Determining the effective property rate tariff is therefore an integral part of the municipality’s budgeting process. National Treasury’s MFMA Circular No. 51 deals, inter alia with the implementation of the Municipal Property Rates Act, with the regulations issued by the Department of Co-operative Governance. These regulations came into effect on 1 July 2009 and prescribe the rate ratio for the non-residential categories, public service infrastructure and agricultural properties relative to residential properties to be 0, 25:1. The implementation of these regulations was done in the previous budget process and the Property Rates Policy of the Municipality has been amended accordingly. The following stipulations in the Property Rates Policy are highlighted: • The first R15 000 of the market value of a property used for residential purposes is
excluded from the rate-able value (Section 17(h) of the MPRA). In addition to this rebate, a further R25 000 reduction on the market value of a property will be granted in terms of the Municipality’s own Property Rates Policy;
Description Ref 2016/17 2017/18 2018/19
R thousandAudited
Outcome
Audited
Outcome
Audited
Outcome
Original
Budget
Adjusted
Budget
Full Year
Forecast
Budget Year
2020/21
Budget Year
+1 2021/22
Budget Year
+2 2022/23
RECEIPTS: 1, 2
Operating Transfers and Grants
National Government: 506 218 571 733 627 703 699 244 709 883 709 883 788 036 871 836 962 648
Local Government Equitable Share 503 048 567 442 624 943 695 606 695 606 695 606 770 767 855 477 941 140
Expanded Public Works Programme Integrated Grant 1 545 2 591 990 1 403 1 403 1 403 1 150 – –
Local Government Financial Management Grant 1 625 1 700 1 770 2 235 2 235 2 235 2 600 2 800 3 100
Municipal Disaster Relief Grant – – – – 1 639 1 639 – – –
Energy Efficiency and Demand Management 3 000
Municipal Infrastructure Grant – – – – 9 000 9 000 13 519 13 559 15 408
Provincial Government: 400 1 000 916 – 985 985 – – –
Libraries Archives and Museums 400 1 000 916 – 985 985 – – –
District Municipality: – – – – – – – – –
Other grant providers: – – – – – – – – –
Total Operating Transfers and Grants 5 506 618 572 733 628 619 699 244 710 868 710 868 788 036 871 836 962 648
Current Year 2019/202020/21 Medium Term Revenue & Expenditure
Framework
Madibeng Local Municipality 2020/21 /Final Annual Budget and MTREF
13 | P a g e
• 35 per cent rebate will be granted on all residential properties (including state owned residential properties);
• 100 per cent rebate will be granted to registered indigents in terms of the Indigent Policy; • For pensioners, physically and mentally disabled persons, a maximum/total rebate of 50
per cent (calculated on a sliding scale) will be granted to owners of rate-able property if the total gross income of the applicant and/or his/her spouse, if any, does not to exceed the amount equal to twice the annual state pension as approved by the National Government for a financial year. In this regard the following stipulations are relevant:
- The rate-able property concerned must be occupied only by the applicant and his/her spouse, if any, and by dependents without income;
- The applicant must submit proof of his/her age and identity and, in the case of a physically or mentally handicapped person, proof of certification by a Medical Officer of Health, also proof of the annual income from a social pension;
- The applicant’s account must be paid in full, or if not, an arrangement to pay the debt should be in place; and
- The property must be categorized as residential. • The Municipality may award a 100 per cent grant-in-aid on the assessment rates of rate-
able properties of certain classes such as registered welfare organizations, institutions or organizations performing charitable work, sports grounds used for purposes of amateur sport. The owner of such a property must apply to the Chief Financial Officer in the prescribed format for such a grant.
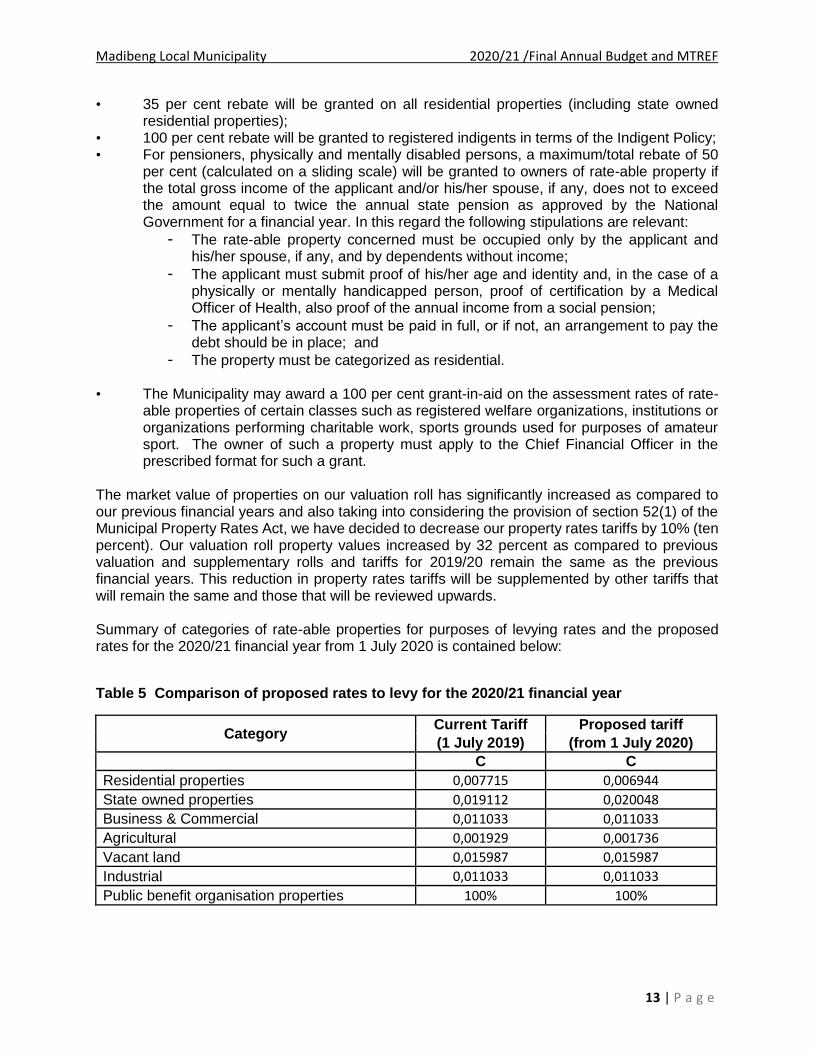
The market value of properties on our valuation roll has significantly increased as compared to our previous financial years and also taking into considering the provision of section 52(1) of the Municipal Property Rates Act, we have decided to decrease our property rates tariffs by 10% (ten percent). Our valuation roll property values increased by 32 percent as compared to previous valuation and supplementary rolls and tariffs for 2019/20 remain the same as the previous financial years. This reduction in property rates tariffs will be supplemented by other tariffs that will remain the same and those that will be reviewed upwards. Summary of categories of rate-able properties for purposes of levying rates and the proposed rates for the 2020/21 financial year from 1 July 2020 is contained below:
Table 5 Comparison of proposed rates to levy for the 2020/21 financial year
Category Current Tariff Proposed tariff
(1 July 2019) (from 1 July 2020)
C C
Residential properties 0,007715 0,006944
State owned properties 0,019112 0,020048
Business & Commercial 0,011033 0,011033
Agricultural 0,001929 0,001736
Vacant land 0,015987 0,015987
Industrial 0,011033 0,011033
Public benefit organisation properties 100% 100%

Madibeng Local Municipality 2020/21 /Final Annual Budget and MTREF
14 | P a g e
1.4.2 Sale of Water and Impact of Tariff Increases
South Africa faces similar challenges with regard to water supply as it did with electricity, since demand growth outstrips supply. Consequently, National Treasury is encouraging all municipalities to carefully review the level and structure of their water tariffs to ensure: • Water tariffs are fully cost-reflective – including the cost of maintenance and renewal of
purification plants, water networks and the cost associated with reticulation expansion; • Water tariffs are structured to protect basic levels of service and ensure the provision of
free water to the poorest of the poor (indigent); and • Water tariffs are designed to encourage efficient and sustainable consumption. Better maintenance of infrastructure and cost-reflective tariffs will ensure that the supply challenges are managed in future to ensure sustainability. A tariff increase of 4.5 per cent from 1 July 2020 for water is proposed and 6 kℓ water per 30-day period will be granted free of charge to all registered indigents residents. A summary of the proposed tariffs for households (residential) and non-residential are as follows: Table 6 Proposed Water Tariffs
CATEGORY CURRENT TARIFFS PROPOSED TARIFFS
01-Jul-19 01-Jul-20
Rand per kℓ Rand per kℓ
RESIDENTIAL
0 – 6 kl per month 10,91
11,40
Above 6 – 10 kl per month 13,84
14,46
Above 10 – 15 kl per month 19,37
20,25
Above 15 – 20 kl per month 20,56
21,48
Above 20 – 30 kl per month 22,93
23,96
Above 30 – 40 kl per month 24,12
25,20
The following table shows the impact of the proposed increases in water tariffs on the water charges for a single dwelling house:

Madibeng Local Municipality 2020/21 /Final Annual Budget and MTREF
15 | P a g e
Table 7 Comparison between current water charges and increases (Domestic)
Monthly Current amount
Proposed amount Difference (Increase)
Percentage change
consumption payable payable kℓ R R R
20 411 430 19 4.5% 30 688 719 31 4.5% 40 965 1008 43 4.5%
1.4.3 Sale of Electricity and Impact of Tariff Increases
Final electricity bulk price increases for 2020/21 are uncertain at this stage. Although the National Energy Regulator of South Africa (NERSA) has approved a Multi-Year Price Determination (MYPD) for the period from 1 April 2019 to 31 March 2022, Eskom has submitted an urgent application to the courts to revise the bulk tariffs allowed under the MYPD. In their most recent MYPD decision, NERSA allowed for tariff increases of 9.41 per cent in 2019/20, 8.1 per cent in 2020/21 and 5.22 per cent in 2021/22 (for national financial years). The Madibeng Local Municipality has applied to Nersa for a 9.41% increase on electricity and Nersa approved an annual increase of 6.22% on all customer categories. Registered indigents will again be granted 50 kWh per 30-day period free of charge. The following table shows the impact of the proposed increases in electricity tariffs charges for domestic customers:
Table 8 Comparison between current electricity charges and increases (Domestic)
Description Monthly Current amount
Proposed amount
Difference Percentage
change
consumption payable payable (Increase) kWh R R R
Service Charge 127,88 135,84 7,96 6.22%
Single phase
1 x 10 A 100 180,1 191,30 11,20 6.22%
1 x 15 A 100 270,15 286.95 16,86 6.22%
THREE PHASE
3 x 20 A 100 1 080,60 1 147.81 67,21 6.22%
3 x 30 A 100 1 620,90 1 721.72 100.82 6.22%
It should further be noted that NERSA has advised that a stepped tariff structure needs to be implemented. The effect thereof will be that the higher the consumption, the higher the cost per kWh. The aim is to subsidise the lower consumption users (mostly the poor). The municipality is currently undergoing electricity cost of supply study, which is anticipated to be complete by end of December 2020. This study when completed the municipality will have cost reflective tariffs and also it will help with the tariff dispute with some of the industrialist. The implementation of stepped tariff will be proposed through this study.

Madibeng Local Municipality 2020/21 /Final Annual Budget and MTREF
16 | P a g e
The inadequate electricity bulk capital Municipality and the impact on service delivery and development remains a challenge for the Municipality The approved budget for the Electricity Division can only be utilised for certain committed upgrade projects and to strengthen critical infrastructure (e.g. substations without back-up supply). Owing to the high increases in Eskom’s bulk tariffs, it is clearly not possible to fund these necessary upgrades through increases in the municipal electricity tariff – as the resultant tariff increases would be unaffordable for the consumers
1.4.4 Sanitation and Impact of Tariff Increases
A tariff increase of 4.5 per cent for sanitation from 1 July 2020 is proposed. This is based on the input cost assumptions related to water. The following factors also contribute to the proposed tariff increase: • Sanitation charges are calculated according to the percentage water discharged as
indicated in the table below; • Free sanitation (100 per cent of 6 kℓ water) will be applicable to registered indigents; and • The total revenue expected to be generated from rendering this service amounts to R57.0
million for the 20120/21 financial year.
The following table compares the current and proposed tariffs: Table 9 Comparison between current sanitation charges and increases
CATEGORY CURRENT TARIFFS
PROPOSED TARIFFS
01-Jul-19 01-Jul-20
Rand per kℓ Rand per kℓ
RESIDENTIAL
0 – 6 kl per month 4,07 4,25
Above 6 – 10 kl per month 4,80 5,02
Above 10 – 15 kl per month 5,67 5,92
Above 15 – 20 kl per month 6,69 6.99
Above 20 – 30 kl per month 7,89 8,25
Above 30 – 40 kl per month 9,31 9,73
The following table shows the impact of the proposed increases in sanitation tariffs on the sanitation charges for a single dwelling-house: Table 10 Comparison between current sanitation charges and increases, single dwelling- houses
Monthly sanitation Current amount Proposed amount Difference
consumption payable payable (4.5% increase)
kℓ R R R
5 20,3 21,25 .95
10 48,0 50,02 2,2
20 133,8 139.8 6.0

Madibeng Local Municipality 2020/21 /Final Annual Budget and MTREF
17 | P a g e
1.4.5 Waste Removal and Impact of Tariff Increases
Currently solid waste removal is operating at a deficit. It is widely accepted that the rendering of this service should at least break even, which is currently not the case. The Municipality will have to implement a solid waste strategy to ensure that this service can be rendered in a sustainable manner over the medium to long-term. The main contributor to this deficit is contracted services and the cost of remuneration. Considering the deficit, it is recommended that the service to be insourced and the plan is that when contracts of waste removal contractors end, we do not renew but deploy our own staff. A 4.5 per cent increase in the waste removal tariff is proposed from 1 July 2020. Higher increases will not be viable in 2020/21. Any increase higher than 4.9 per cent would be counter-productive and will result in affordability challenges for individual rates payers raising the risk associated with bad debt. The following table compares current and proposed amounts payable from 1 July 2020:
Table 11 Comparison between current waste removal fees and increases
Description Monthly Current amount
Proposed amount
Difference Percentage
change consumption payable payable (Increase) kWh R R R
RESIDENTIAL PROPERTIES
Refuse service charge (240 L bin) 115,52 120.72 5.2 4.5%
PRIVATE DEVELOPED RESIDENTIAL
Refuse service charge per number of dwellings/flats 94,20 98,43 4,23 4.5%
PENSIONERS Refuse service charge (240 L bin) 57,75 60,36 2,61 4.5%
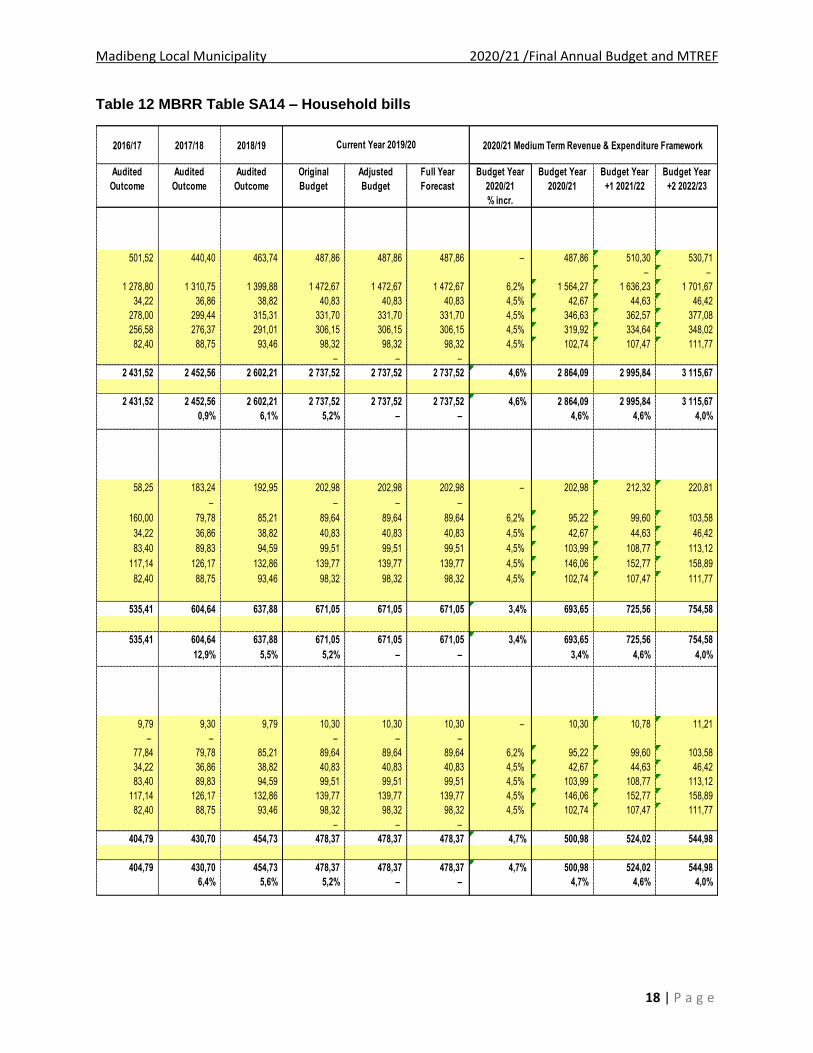
1.4.6 Overall impact of tariff increases on households
The following table shows the overall expected impact of the tariff increases on a large and small household, as well as an indigent household receiving free basic services.
Madibeng Local Municipality 2020/21 /Final Annual Budget and MTREF
18 | P a g e
Table 12 MBRR Table SA14 – Household bills
2016/17 2017/18 2018/19 2020/21 Medium Term Revenue & Expenditure Framework
Audited
Outcome
Audited
Outcome
Audited
Outcome
Original
Budget
Adjusted
Budget
Full Year
Forecast
Budget Year
2020/21
Budget Year
2020/21
Budget Year
+1 2021/22
Budget Year
+2 2022/23
% incr.
501,52 440,40 463,74 487,86 487,86 487,86 – 487,86 510,30 530,71
– –
1 278,80 1 310,75 1 399,88 1 472,67 1 472,67 1 472,67 6,2% 1 564,27 1 636,23 1 701,67
34,22 36,86 38,82 40,83 40,83 40,83 4,5% 42,67 44,63 46,42
278,00 299,44 315,31 331,70 331,70 331,70 4,5% 346,63 362,57 377,08
256,58 276,37 291,01 306,15 306,15 306,15 4,5% 319,92 334,64 348,02
82,40 88,75 93,46 98,32 98,32 98,32 4,5% 102,74 107,47 111,77
– – –
2 431,52 2 452,56 2 602,21 2 737,52 2 737,52 2 737,52 4,6% 2 864,09 2 995,84 3 115,67
2 431,52 2 452,56 2 602,21 2 737,52 2 737,52 2 737,52 4,6% 2 864,09 2 995,84 3 115,67
0,9% 6,1% 5,2% – – 4,6% 4,6% 4,0%
58,25 183,24 192,95 202,98 202,98 202,98 – 202,98 212,32 220,81
– – – –
160,00 79,78 85,21 89,64 89,64 89,64 6,2% 95,22 99,60 103,58
34,22 36,86 38,82 40,83 40,83 40,83 4,5% 42,67 44,63 46,42
83,40 89,83 94,59 99,51 99,51 99,51 4,5% 103,99 108,77 113,12
117,14 126,17 132,86 139,77 139,77 139,77 4,5% 146,06 152,77 158,89
82,40 88,75 93,46 98,32 98,32 98,32 4,5% 102,74 107,47 111,77
535,41 604,64 637,88 671,05 671,05 671,05 3,4% 693,65 725,56 754,58
535,41 604,64 637,88 671,05 671,05 671,05 3,4% 693,65 725,56 754,58
12,9% 5,5% 5,2% – – 3,4% 4,6% 4,0%
-0,57 -0,05 -1,00 -
9,79 9,30 9,79 10,30 10,30 10,30 – 10,30 10,78 11,21
– – – – –
77,84 79,78 85,21 89,64 89,64 89,64 6,2% 95,22 99,60 103,58
34,22 36,86 38,82 40,83 40,83 40,83 4,5% 42,67 44,63 46,42
83,40 89,83 94,59 99,51 99,51 99,51 4,5% 103,99 108,77 113,12
117,14 126,17 132,86 139,77 139,77 139,77 4,5% 146,06 152,77 158,89
82,40 88,75 93,46 98,32 98,32 98,32 4,5% 102,74 107,47 111,77
– – –
404,79 430,70 454,73 478,37 478,37 478,37 4,7% 500,98 524,02 544,98
404,79 430,70 454,73 478,37 478,37 478,37 4,7% 500,98 524,02 544,98
6,4% 5,6% 5,2% – – 4,7% 4,6% 4,0%
Current Year 2019/20

Madibeng Local Municipality 2020/21 /Final Annual Budget and MTREF
19 | P a g e
1.5 Operating Expenditure Framework
. Our municipality continues to face institutional challenges that result in bad debt accumulation, limited cash flows and consequent non-payment of creditors. Eskom and Water Boards are owed the greater percentage of the total municipal creditors; and protracted non-payment undermines the financial sustainability of these state-owned entities. The non-payment of creditors is a symptom of underlying problems which includes, among others, weaknesses in revenue collection due to unfavourable economic climate and underinvestment in asset maintenance and renewal, which compromises the reliability of delivering basic services. The total operating expenditure budget for 2020/21 financial year amounts to R 2 462 474 million and has grown by R 65 036 million or 3% when compared with the 2019/20 Adjustment Budget and by R 38 736 million or 2% compared with the 2019/20 Approved Budget. The following table is a high-level summary of the 2020/21 budget and MTREF (classified per main type of operating expenditure):
Table 13 Summary of operating expenditure by standard classification item
Description 2016/17 2017/18 2018/19
R thousandAudited
Outcome
Audited
Outcome
Audited
Outcome
Original
Budget
Adjusted
Budget
Full Year
Forecast
Pre-audit
outcome
Budget
Year
2020/21
Budget
Year +1
2021/22
Budget
Year +2
2022/23
Expenditure By Type
Employee related costs 392 302 414 356 516 496 470 000 470 020 470 020 507 160 558 803 585 624 613 734
Remuneration of councillors 25 456 30 531 31 050 33 242 33 242 33 242 28 184 31 633 34 200 35 841
Debt impairment 157 979 (128 998) 936 713 275 000 275 000 275 000 25 200 000 209 600 219 661
Depreciation & asset impairment 458 952 474 336 474 165 490 000 490 000 490 000 – 485 000 491 790 498 796
Finance charges 131 937 129 675 4 123 140 501 140 501 140 501 115 135 500 141 244 142 312
Bulk purchases 452 876 499 692 814 198 560 000 533 250 533 250 354 501 600 000 625 760 641 982
Other materials 104 859 23 119 31 246 26 320 27 622 27 622 16 069 23 596 23 877 25 114
Contracted services 259 308 290 283 251 361 235 075 246 863 246 863 162 291 227 834 250 453 264 913
Transfers and subsidies 20 819 4 009 4 051 4 500 4 090 4 090 4 087 4 700 4 900 5 000
Other expenditure 135 372 195 241 97 353 189 101 176 850 176 850 132 201 195 409 213 688 223 534
Losses 129 135 182 526 10 456 – – – 690 0 0 0
Total Expenditure 2 268 996 2 114 770 3 171 212 2 423 738 2 397 438 2 397 438 1 205 322 2 462 474 2 581 135 2 670 888
Surplus/(Deficit) (624 126) (316 507) (1 324 068) (594 683) (476 759) (476 759) 405 605 (401 263) (379 518) (313 787)
Current Year 2019/20 2020/21 Medium Term Revenue &

Madibeng Local Municipality 2020/21 /Final Annual Budget and MTREF
20 | P a g e
Employee related cost increased by R 88.7m (16%) from the adjusted budget and it contribute
23% of the total expenditure budget.
The Salary and Wage Collective Agreement for the period 01 July 2018 to 30 June 2021 is still in
operation, therefore we budgeted for their employee related costs in line with the multi-year wage
agreement, and also ensure the agreement is correctly implemented and applied as per clauses
of the agreement.
Remuneration of councilors decreased by -5% from the adjusted budget and it contribute 1%
of the total expenditure budget.
Municipalities are advised to budget for the actual costs approved in accordance with the
Government Gazette on the Remuneration of Public Office Bearers Act: Determination of Upper
Limits of Salaries, Allowances and Benefits of different members of municipal councils published
annually between December and January by the Department of Cooperative Governance. Any
overpayment to councillors contrary to the upper limits as published by the Minister of Cooperative
Governance and Traditional Affairs will be irregular expenditure in terms of section 167 of the
MFMA and must be recovered from the councillor(s) concerned.
Bulk Purchases increased by R 66.7m (11%) from the adjusted budget and it contribute 22% of
the total expenditure budget. This expenditure includes amongst others:
Contracted Services decreased by R 19m (-8%) from the adjusted budget and it contribute 10%
of the total expenditure budget. This expenditure includes amongst others:
Description
R thousandAdjusted
Budget%
Budget Year
2020/21%
Budget Year
+1 2021/22%
Budget Year
+2 2022/23 %
Expenditure By Type
Employ ee related costs 470 020 20% 558 803 23% 585 624 23% 613 734 23%
Remuneration of councillors 33 242 1% 31 633 1% 34 200 1% 35 841 1%
Debt impairment 275 000 11% 200 000 8% 209 600 8% 219 661 8%
Depreciation & asset impairment 490 000 20% 485 000 20% 491 790 19% 498 796 19%
Finance charges 140 501 6% 135 500 6% 141 244 5% 142 312 5%
Bulk purchases 533 250 22% 600 000 24% 625 760 24% 641 982 24%
Other materials 27 622 1% 23 596 1% 23 877 1% 25 114 1%
Contracted serv ices 246 863 10% 227 834 9% 250 453 10% 264 913 10%
Transfers and subsidies 4 090 0% 4 700 0% 4 900 0% 5 000 0%
Other ex penditure 176 850 7% 195 409 8% 213 688 8% 223 534 8%
Losses – 0% 0 0% 0 0% 0 0%
Total Expenditure 2 397 438 100% 2 462 474 100% 2 581 135 100% 2 670 888 100%
2020/21 Medium Term Revenue & Expenditure

Madibeng Local Municipality 2020/21 /Final Annual Budget and MTREF
21 | P a g e
Other Expenditure increased by R 18.5m (9%) from the adjusted budget and it contribute 7% of
the total expenditure budget.
Other expenditure comprises of various line items relating to the daily operations of the
municipality. This group of expenditure has also been identified as an area in which cost savings
and efficiencies can be achieved. The decrease indicate that significant cost savings have been
already realised.
The following table gives a breakdown of the main expenditure categories for the 2020/21
financial year
Figure 1 Main operational expenditure categories for the 2020/21 financial year
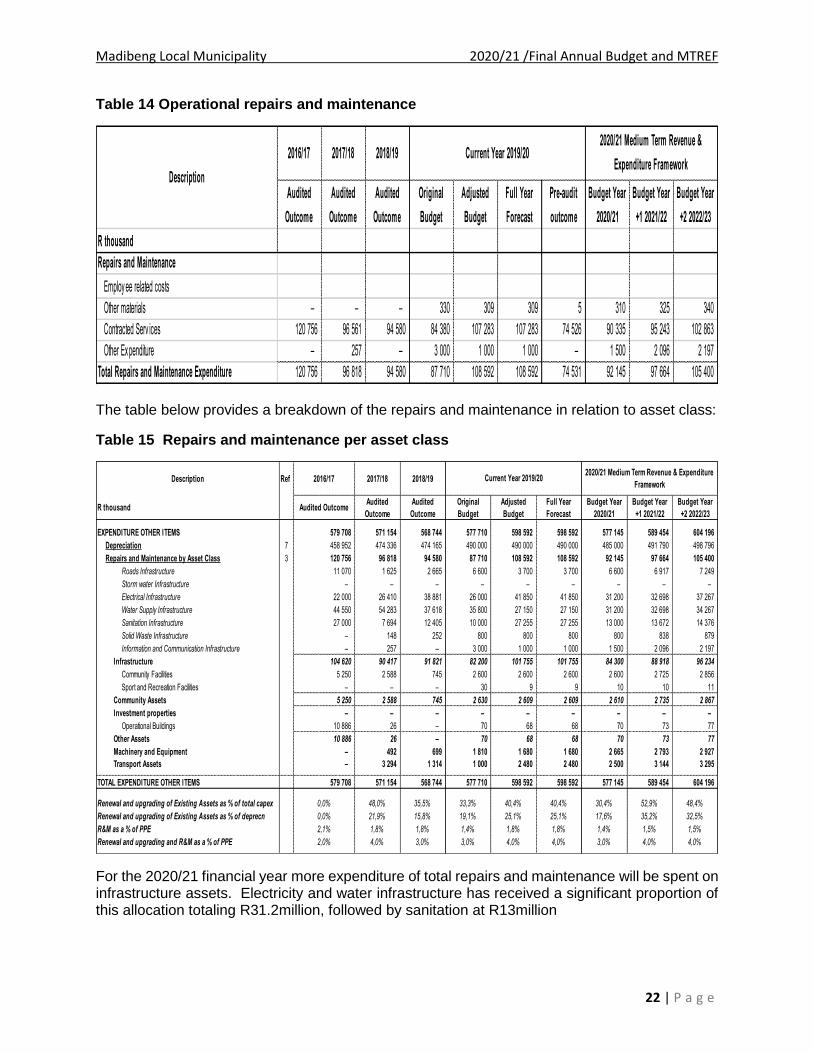
1.5.1 Priority given to repairs and maintenance
In terms of the Municipal Budget and Reporting Regulations, operational repairs and maintenance is not considered a direct expenditure driver but an outcome of certain other expenditures, such as remuneration, purchases of materials and contracted services. Considering these cost drivers, the following table is a consolidation of all the expenditures associated with repairs and maintenance:
Employee related costs &
Remuneration of councillors
24%
Debt impairment8%
Depreciation & asset impairment
20%
Finance charges6%
Bulk purchases & Other materials
25%
Contracted services9%
Other expenditure8%
Madibeng Local Municipality 2020/21 /Final Annual Budget and MTREF
22 | P a g e
Table 14 Operational repairs and maintenance
The table below provides a breakdown of the repairs and maintenance in relation to asset class:
Table 15 Repairs and maintenance per asset class
For the 2020/21 financial year more expenditure of total repairs and maintenance will be spent on infrastructure assets. Electricity and water infrastructure has received a significant proportion of this allocation totaling R31.2million, followed by sanitation at R13million
2016/17 2017/18 2018/19
Audited
Outcome
Audited
Outcome
Audited
Outcome
Original
Budget
Adjusted
Budget
Full Year
Forecast
Pre-audit
outcome
Budget Year
2020/21
Budget Year
+1 2021/22
Budget Year
+2 2022/23
R thousand
Repairs and Maintenance
Employ ee related costs
Other materials – – – 330 309 309 5 310 325 340
Contracted Serv ices 120 756 96 561 94 580 84 380 107 283 107 283 74 526 90 335 95 243 102 863
Other Ex penditure – 257 – 3 000 1 000 1 000 – 1 500 2 096 2 197
Total Repairs and Maintenance Expenditure 120 756 96 818 94 580 87 710 108 592 108 592 74 531 92 145 97 664 105 400
Description
Current Year 2019/202020/21 Medium Term Revenue &
Expenditure Framework
Description Ref 2016/17 2017/18 2018/19
R thousand Audited OutcomeAudited
Outcome
Audited
Outcome
Original
Budget
Adjusted
Budget
Full Year
Forecast
Budget Year
2020/21
Budget Year
+1 2021/22
Budget Year
+2 2022/23
EXPENDITURE OTHER ITEMS 579 708 571 154 568 744 577 710 598 592 598 592 577 145 589 454 604 196
Depreciation 7 458 952 474 336 474 165 490 000 490 000 490 000 485 000 491 790 498 796
Repairs and Maintenance by Asset Class 3 120 756 96 818 94 580 87 710 108 592 108 592 92 145 97 664 105 400
Roads Infrastructure 11 070 1 625 2 665 6 600 3 700 3 700 6 600 6 917 7 249
Storm water Infrastructure – – – – – – – – –
Electrical Infrastructure 22 000 26 410 38 881 26 000 41 850 41 850 31 200 32 698 37 267
Water Supply Infrastructure 44 550 54 283 37 618 35 800 27 150 27 150 31 200 32 698 34 267
Sanitation Infrastructure 27 000 7 694 12 405 10 000 27 255 27 255 13 000 13 672 14 376
Solid Waste Infrastructure – 148 252 800 800 800 800 838 879
Information and Communication Infrastructure – 257 – 3 000 1 000 1 000 1 500 2 096 2 197
Infrastructure 104 620 90 417 91 821 82 200 101 755 101 755 84 300 88 918 96 234
Community Facilities 5 250 2 588 745 2 600 2 600 2 600 2 600 2 725 2 856
Sport and Recreation Facilities – – – 30 9 9 10 10 11
Community Assets 5 250 2 588 745 2 630 2 609 2 609 2 610 2 735 2 867
Investment properties – – – – – – – – –
Operational Buildings 10 886 26 – 70 68 68 70 73 77
Other Assets 10 886 26 – 70 68 68 70 73 77
Machinery and Equipment – 492 699 1 810 1 680 1 680 2 665 2 793 2 927
Transport Assets – 3 294 1 314 1 000 2 480 2 480 2 500 3 144 3 295
TOTAL EXPENDITURE OTHER ITEMS 579 708 571 154 568 744 577 710 598 592 598 592 577 145 589 454 604 196
Renewal and upgrading of Existing Assets as % of total capex 0,0% 48,0% 35,5% 33,3% 40,4% 40,4% 30,4% 52,9% 48,4%
Renewal and upgrading of Existing Assets as % of deprecn 0,0% 21,9% 15,8% 19,1% 25,1% 25,1% 17,6% 35,2% 32,5%
R&M as a % of PPE 2,1% 1,8% 1,8% 1,4% 1,8% 1,8% 1,4% 1,5% 1,5%
Renewal and upgrading and R&M as a % of PPE 2,0% 4,0% 3,0% 3,0% 4,0% 4,0% 3,0% 4,0% 4,0%
Current Year 2019/202020/21 Medium Term Revenue & Expenditure
Framework

Madibeng Local Municipality 2020/21 /Final Annual Budget and MTREF
23 | P a g e
1.5.2 Free Basic Services: Basic Social Services Package
The social package assists households that are poor or face other circumstances that limit their ability to pay for services. To receive these free services the households are required to register in terms of the Municipality’s Indigent Policy. The target is to register 5 000 or more indigent households during the 2020/21 financial year, a process reviewed annually. Detail relating to free services, cost of free basis services, revenue lost owing to free basic services as well as basic service delivery measurement is contained in Table 27 MBRR A10 (Basic Service Delivery Measurement). The cost of the social package of the registered indigent households is largely financed by national government through the local government equitable share received in terms of the annual Division of Revenue Act.
1.6 Capital expenditure
The following table provides a breakdown of budgeted capital expenditure by vote: Table 16 2020/21 Medium-term capital budget per vote
For 2020/21 an amount of R 281.4 million has been appropriated for the development of infrastructure. In the outer years this amount totals R 327 million, and R 335 million, respectively for each of the financial years.
Vote Description 2016/17 2017/18 2018/19
R thousandAudited
Outcome
Audited
Outcome
Audited
Outcome
Original
Budget
Adjusted
Budget
Full Year
Forecast
Pre-audit
outcome
Budget Year
2020/21
Budget Year
+1 2021/22
Budget Year
+2 2022/23
Capital expenditure - Vote
Multi-year expenditure to be appropriated
Vote 06 - Infrastructure And Technical Serv ices – – – – 19 120 19 120 17 288 – – –
Capital multi-year expenditure sub-total – – – – 19 120 19 120 17 288 – – –
Single-year expenditure to be appropriated
Vote 01 - Ex ecutiv e Council – 86 363 – 14 14 6 – – –
Vote 02 - Municipal Manager – – 194 – 48 48 48 – – –
Vote 03 - Chief Operating Officer – – 40 – 115 115 85 – – –
Vote 04 - Corporate Support Serv ices – 3 652 17 432 – 74 74 18 – – –
Vote 05 - Budget And Treasury Office 1 065 228 242 – 282 282 198 – – –
Vote 06 - Infrastructure And Technical Serv ices 216 850 192 380 187 421 281 797 273 513 273 513 102 780 256 149 311 000 335 000
Vote 07 - Community Serv ices 15 251 2 447 1 185 – 11 200 11 200 802 11 708 – –
Vote 08 - Human Settlement – 1 486 – – 3 3 2 – – –
Vote 09 - Economic Dev ,Tourism & Agriculture – – – – – – – 13 626 16 000 –
Vote 10 - Public Safety , Fleet And Facilities Management19 449 16 437 3 467 – 63 63 20 – – –
Vote 11 - Internal Audit – 10 66 – – – – – – –
Capital single-year expenditure sub-total 252 614 216 725 210 410 281 797 285 311 285 311 103 959 281 482 327 000 335 000
Total Capital Expenditure - Vote 252 614 216 725 210 410 281 797 304 431 304 431 121 247 281 482 327 000 335 000
Current Year 2019/202020/21 Medium Term Revenue &
Expenditure Framework
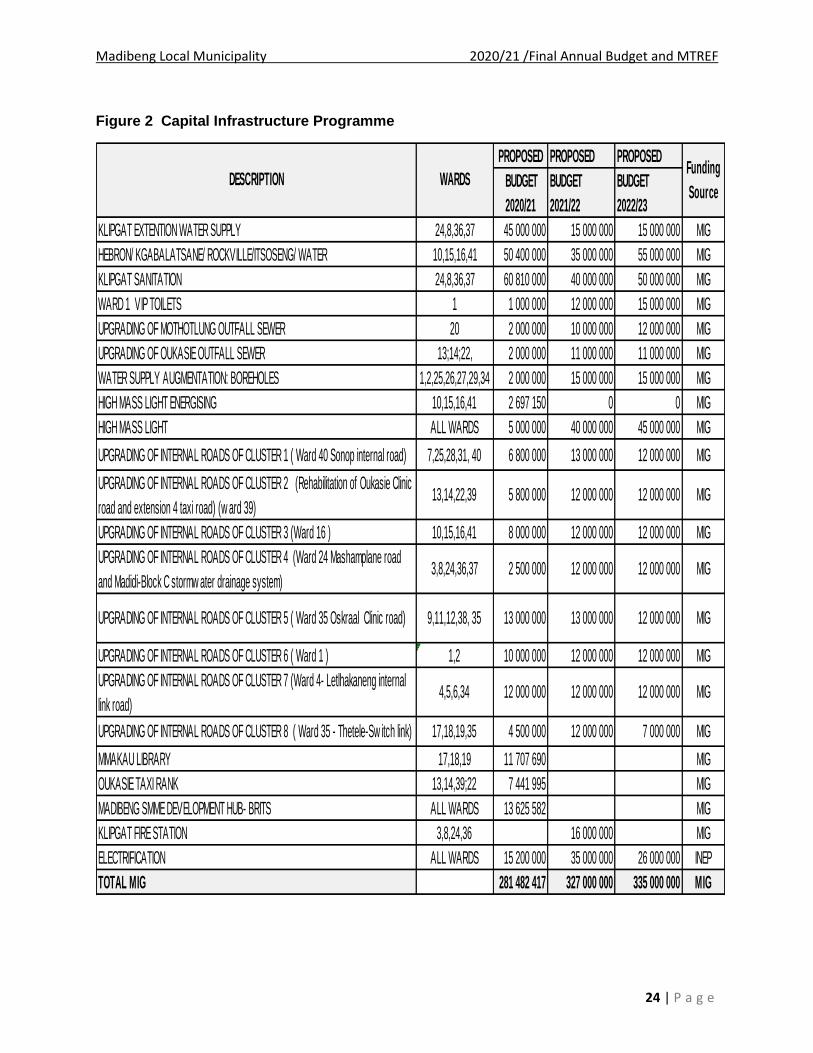
Madibeng Local Municipality 2020/21 /Final Annual Budget and MTREF
24 | P a g e
Figure 2 Capital Infrastructure Programme
PROPOSED PROPOSED PROPOSED
BUDGET
2020/21
BUDGET
2021/22
BUDGET
2022/23
KLIPGAT EXTENTION WATER SUPPLY 24,8,36,37 45 000 000 15 000 000 15 000 000 MIG
HEBRON/ KGABALATSANE/ ROCKVILLE/ITSOSENG/ WATER 10,15,16,41 50 400 000 35 000 000 55 000 000 MIG
KLIPGAT SANITATION 24,8,36,37 60 810 000 40 000 000 50 000 000 MIG
WARD 1 VIP TOILETS 1 1 000 000 12 000 000 15 000 000 MIG
UPGRADING OF MOTHOTLUNG OUTFALL SEWER 20 2 000 000 10 000 000 12 000 000 MIG
UPGRADING OF OUKASIE OUTFALL SEWER 13;14;22, 2 000 000 11 000 000 11 000 000 MIG
WATER SUPPLY AUGMENTATION: BOREHOLES 1,2,25,26,27,29,34 2 000 000 15 000 000 15 000 000 MIG
HIGH MASS LIGHT ENERGISING 10,15,16,41 2 697 150 0 0 MIG
HIGH MASS LIGHT ALL WARDS 5 000 000 40 000 000 45 000 000 MIG
UPGRADING OF INTERNAL ROADS OF CLUSTER 1 ( Ward 40 Sonop internal road) 7,25,28,31, 40 6 800 000 13 000 000 12 000 000 MIG
UPGRADING OF INTERNAL ROADS OF CLUSTER 2 (Rehabilitation of Oukasie Clinic
road and extension 4 taxi road) (w ard 39)13,14,22,39 5 800 000 12 000 000 12 000 000 MIG
UPGRADING OF INTERNAL ROADS OF CLUSTER 3 (Ward 16 ) 10,15,16,41 8 000 000 12 000 000 12 000 000 MIG
UPGRADING OF INTERNAL ROADS OF CLUSTER 4 (Ward 24 Mashamplane road
and Madidi-Block C stormw ater drainage system)3,8,24,36,37 2 500 000 12 000 000 12 000 000 MIG
UPGRADING OF INTERNAL ROADS OF CLUSTER 5 ( Ward 35 Oskraal Clinic road) 9,11,12,38, 35 13 000 000 13 000 000 12 000 000 MIG
UPGRADING OF INTERNAL ROADS OF CLUSTER 6 ( Ward 1 ) 1,2 10 000 000 12 000 000 12 000 000 MIG
UPGRADING OF INTERNAL ROADS OF CLUSTER 7 (Ward 4- Letlhakaneng internal
link road)4,5,6,34 12 000 000 12 000 000 12 000 000 MIG
UPGRADING OF INTERNAL ROADS OF CLUSTER 8 ( Ward 35 - Thetele-Sw itch link) 17,18,19,35 4 500 000 12 000 000 7 000 000 MIG
MMAKAU LIBRARY 17,18,19 11 707 690 MIG
OUKASIE TAXI RANK 13,14,39;22 7 441 995 MIG
MADIBENG SMME DEVELOPMENT HUB- BRITS ALL WARDS 13 625 582 MIG
KLIPGAT FIRE STATION 3,8,24,36 16 000 000 MIG
ELECTRIFICATION ALL WARDS 15 200 000 35 000 000 26 000 000 INEP
TOTAL MIG 281 482 417 327 000 000 335 000 000 MIG
DESCRIPTION WARDSFunding
Source
Madibeng Local Municipality 2020/21 /Final Annual Budget and MTREF
25 | P a g e
1.7 Annual Budget Tables - Parent Municipality
The following eighteen pages present the ten main budget tables as required in terms of section 8 of the Municipal Budget and Reporting Regulations. These tables set out the municipality’s 2020/21 budget and MTREF as approved by the Council. Each table is accompanied by explanatory notes on the facing page.

Madibeng Local Municipality 2020/21 /Final Annual Budget and MTREF
26 | P a g e
Table 17 MBRR Table A1 - Budget Summary
Description 2016/17 2017/18 2018/19
R thousandsAudited
Outcome
Audited
Outcome
Audited
Outcome
Original
Budget
Adjusted
Budget
Full Year
Forecast
Pre-audit
outcome
Budget Year
2020/21
Budget Year
+1 2021/22
Budget Year
+2 2022/23
Financial Performance
Property rates 269 185 257 978 250 694 270 000 349 946 349 946 319 754 369 015 387 460 406 901
Service charges 671 388 640 397 644 611 741 875 741 875 741 875 663 433 750 150 780 917 818 401
Investment revenue 4 515 7 030 5 843 6 732 6 732 6 732 3 355 4 067 4 262 4 467
Transfers recognised - operational 506 007 781 116 854 732 699 244 710 868 710 868 505 258 788 036 871 836 962 648
Other own revenue 193 775 111 743 91 264 111 204 111 204 111 204 126 267 149 944 157 142 164 685
Total Revenue (excluding capital transfers and
contributions)
1 644 870 1 798 264 1 847 145 1 829 055 1 920 625 1 920 625 1 618 067 2 061 212 2 201 617 2 357 100
Employee costs 392 302 414 356 516 496 470 000 470 020 470 020 554 654 558 803 585 624 613 734
Remuneration of councillors 25 456 30 531 31 050 33 242 33 242 33 242 31 836 31 633 34 200 35 841
Depreciation & asset impairment 458 952 474 336 474 165 490 000 490 000 490 000 – 485 000 491 790 498 796
Finance charges 131 937 129 675 4 123 140 501 140 501 140 501 115 135 500 141 244 142 312
Materials and bulk purchases 557 735 522 810 845 443 586 320 560 772 560 772 377 084 623 596 649 637 667 096
Transfers and grants 20 819 4 009 4 051 4 500 4 090 4 090 4 087 4 700 4 900 5 000
Other expenditure 681 794 539 052 1 295 884 699 176 698 815 698 815 307 522 623 243 673 741 708 109
Total Expenditure 2 268 996 2 114 770 3 171 212 2 423 738 2 397 440 2 397 440 1 275 298 2 462 474 2 581 135 2 670 888
Surplus/(Deficit) (624 126) (316 507) (1 324 068) (594 683) (476 814) (476 814) 342 769 (401 263) (379 518) (313 787)
Transfers and subsidies - capital (monetary allocations)
(National / Provincial and District) 261 756 – 5 537 281 797 300 917 300 917 – 281 482 327 000 335 000
Transfers and subsidies - capital (monetary allocations)
(National / Provincial Departmental Agencies, Households,
Non-profit Institutions, Private Enterprises, Public
Corporatons, Higher Educational Institutions) & Transfers
and subsidies - capital (in-kind - all) – – – – – – – – – –
Surplus/(Deficit) after capital transfers & contributions
(362 370) (316 507) (1 318 530) (312 886) (175 897) (175 897) 342 769 (119 780) (52 518) 21 213
Share of surplus/ (deficit) of associate – – – – – – – – – –
Surplus/(Deficit) for the year (362 370) (316 507) (1 318 530) (312 886) (175 897) (175 897) 342 769 (119 780) (52 518) 21 213
Capital expenditure & funds sources
Capital expenditure 252 614 216 725 210 410 281 797 304 516 304 516 130 177 281 482 327 000 335 000
Transfers recognised - capital 232 101 186 967 186 761 281 797 291 917 291 917 124 553 281 482 327 000 335 000
Borrowing – – – – – – – – – –
Internally generated funds 20 513 29 758 23 648 – 12 599 12 599 5 624 – – –
Total sources of capital funds 252 614 216 725 210 410 281 797 304 516 304 516 130 177 281 482 327 000 335 000
Financial position
Total current assets 562 855 1 597 926 1 496 651 849 629 859 714 899 714 1 655 480 913 926 864 580 869 857
Total non current assets 6 108 221 5 700 102 5 443 112 6 512 760 6 491 309 6 491 309 5 567 574 6 665 519 6 763 560 6 973 000
Total current liabilities 705 284 1 667 591 2 476 378 726 655 656 655 656 655 2 434 701 456 255 473 642 483 913
Total non current liabilities 1 192 091 1 163 834 40 787 1 379 342 1 379 342 1 379 342 40 787 1 435 724 1 500 044 1 630 170
Community wealth/Equity 4 773 701 4 466 603 4 422 597 5 256 392 5 315 026 5 355 026 4 747 566 5 687 465 5 654 454 5 728 773
Cash flows
Net cash from (used) operating 106 908 92 635 240 877 350 358 341 206 381 206 113 521 243 513 351 655 383 276
Net cash from (used) investing (252 563) (215 083) (210 237) (301 005) (311 487) (311 487) (83 914) (281 482) (327 000) (335 000)
Net cash from (used) financing 109 856 122 774 – – – – – – – –
Cash/cash equivalents at the year end 33 357 33 692 89 171 20 118 30 203 70 203 30 091 5 926 30 580 78 857
Cash backing/surplus reconciliation
Cash and investments available 46 151 13 560 73 956 32 918 43 003 83 003 (355 149) 18 726 43 480 91 857
Application of cash and investments 556 754 (915 794) 193 050 27 198 41 834 14 586 147 172 17 393 40 876 76 419
Balance - surplus (shortfall) (510 603) 929 354 (119 093) 5 720 1 169 68 417 (502 321) 1 333 2 604 15 438
Asset management
Asset register summary (WDV) 5 687 345 5 431 568 6 499 960 6 478 509 6 478 509 5 561 745 5 561 745 6 652 719 6 750 660 6 960 000
Depreciation 458 952 474 336 474 165 490 000 490 000 490 000 490 000 475 000 491 790 498 796
Renewal and Upgrading of Existing Assets – 104 089 74 702 93 787 105 703 105 703 105 703 – – –
Repairs and Maintenance 120 756 96 818 94 580 87 710 108 566 108 566 108 566 92 145 97 664 105 400
Free services
Cost of Free Basic Services provided 10 778 10 436 22 785 5 101 5 101 5 101 4 016 4 016 4 209 4 411
Revenue cost of free services provided – 51 248 89 145 113 438 25 901 25 901 27 918 27 918 29 258 30 662
Households below minimum service level
Water: 81 103 106 112 112 112 118 118 124 130
Sanitation/sewerage: 62 81 82 86 86 86 91 91 95 100
Energy: 170 176 186 195 195 195 206 206 217 228
Refuse: 399 420 453 476 476 476 502 502 529 556
2020/21 Medium Term Revenue & Expenditure
FrameworkCurrent Year 2019/20

Madibeng Local Municipality 2020/21 /Final Annual Budget and MTREF
27 | P a g e
Explanatory notes to MBRR Table A1 - Budget Summary 1. Table A1 is a budget summary and provides a concise overview of the Municipality’s budget
from all of the major financial perspectives (operating, capital expenditure, financial position, cash flow, and MFMA funding compliance).
2. The table provides an overview of the amounts approved by Council for operating performance, resources deployed to capital expenditure, financial position, cash and funding compliance, as well as the municipality’s commitment to eliminating basic service delivery backlogs.
3. Financial management reforms emphasises the importance of the municipal budget being funded. This requires the simultaneous assessment of the Financial Performance, Financial Position and Cash Flow Budgets, along with the Capital Budget. The Budget Summary provides the key information in this regard:
a. The operating surplus/deficit (after Total Expenditure) is positive over the MTREF b. Capital expenditure is balanced by capital funding sources, of which
i. Transfers recognised is reflected on the Financial Performance Budget; ii. Borrowing is incorporated in the net cash from financing on the Cash Flow
Budget iii. Internally generated funds is financed from a combination of the current
operating surplus and accumulated cash-backed surpluses from previous years. The amount is incorporated in the Net cash from investing on the Cash Flow Budget. The fact that the municipality’s cash flow remains positive, and is improving indicates that the necessary cash resources are available to fund the Capital Budget.
4. The Cash backing/surplus reconciliation shows that in previous financial years the municipality was not paying much attention to managing this aspect of its finances, and consequently many of its obligations are not cash-backed. This places the municipality in a very vulnerable financial position, as the recent slow-down in revenue collections highlighted. Consequently Council has taken a deliberate decision to ensure adequate cash-backing for all material obligations in accordance with the recently adopted Funding and Reserves Policy. This cannot be achieved in one financial year. But over the MTREF there is progressive improvement in the level of cash-backing of obligations.
5. Even though the Council is placing great emphasis on securing the financial sustainability of the municipality, this is not being done at the expense of services to the poor. The section of Free Services shows that the amount spent on Free Basic Services and the revenue cost of free services provided by the municipality continues to increase. In addition, the municipality continues to make progress in addressing service delivery backlogs.
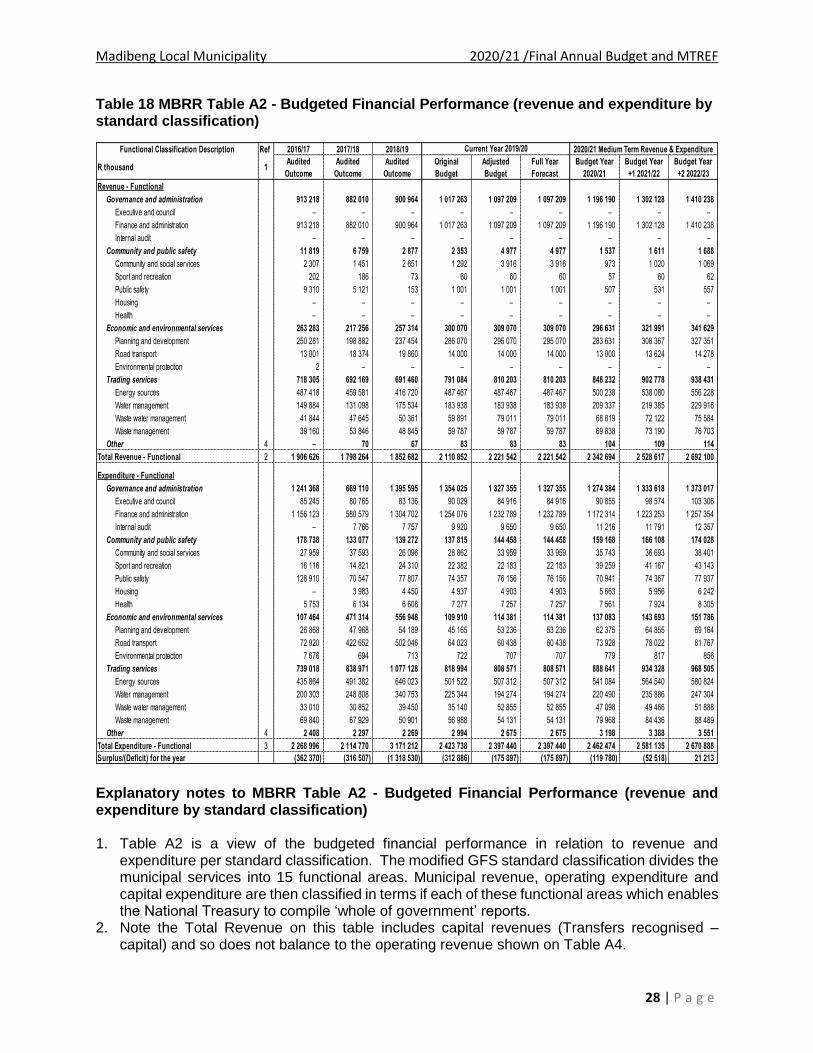
Madibeng Local Municipality 2020/21 /Final Annual Budget and MTREF
28 | P a g e
Table 18 MBRR Table A2 - Budgeted Financial Performance (revenue and expenditure by standard classification)
Explanatory notes to MBRR Table A2 - Budgeted Financial Performance (revenue and expenditure by standard classification) 1. Table A2 is a view of the budgeted financial performance in relation to revenue and
expenditure per standard classification. The modified GFS standard classification divides the municipal services into 15 functional areas. Municipal revenue, operating expenditure and capital expenditure are then classified in terms if each of these functional areas which enables the National Treasury to compile ‘whole of government’ reports.
2. Note the Total Revenue on this table includes capital revenues (Transfers recognised – capital) and so does not balance to the operating revenue shown on Table A4.
Functional Classification Description Ref 2016/17 2017/18 2018/19
R thousand 1Audited
Outcome
Audited
Outcome
Audited
Outcome
Original
Budget
Adjusted
Budget
Full Year
Forecast
Budget Year
2020/21
Budget Year
+1 2021/22
Budget Year
+2 2022/23
Revenue - Functional
Governance and administration 913 218 882 010 900 964 1 017 263 1 097 209 1 097 209 1 196 190 1 302 128 1 410 238
Executive and council – – – – – – – – –
Finance and administration 913 218 882 010 900 964 1 017 263 1 097 209 1 097 209 1 196 190 1 302 128 1 410 238
Internal audit – – – – – – – – –
Community and public safety 11 819 6 759 2 877 2 353 4 977 4 977 1 537 1 611 1 688
Community and social services 2 307 1 451 2 651 1 292 3 916 3 916 973 1 020 1 069
Sport and recreation 202 186 73 60 60 60 57 60 62
Public safety 9 310 5 121 153 1 001 1 001 1 001 507 531 557
Housing – – – – – – – – –
Health – – – – – – – – –
Economic and environmental services 263 283 217 256 257 314 300 070 309 070 309 070 296 631 321 991 341 629
Planning and development 250 281 198 882 237 454 286 070 295 070 295 070 283 631 308 367 327 351
Road transport 13 001 18 374 19 860 14 000 14 000 14 000 13 000 13 624 14 278
Environmental protection 2 – – – – – – – –
Trading services 718 305 692 169 691 460 791 084 810 203 810 203 848 232 902 778 938 431
Energy sources 487 418 459 581 416 720 487 467 487 467 487 467 500 238 538 080 556 228
Water management 149 884 131 098 175 534 183 938 183 938 183 938 209 337 219 385 229 916
Waste water management 41 844 47 645 50 361 59 891 79 011 79 011 68 819 72 122 75 584
Waste management 39 160 53 846 48 845 59 787 59 787 59 787 69 838 73 190 76 703
Other 4 – 70 67 83 83 83 104 109 114
Total Revenue - Functional 2 1 906 626 1 798 264 1 852 682 2 110 852 2 221 542 2 221 542 2 342 694 2 528 617 2 692 100
Expenditure - Functional
Governance and administration 1 241 368 669 110 1 395 595 1 354 025 1 327 355 1 327 355 1 274 384 1 333 618 1 373 017
Executive and council 85 245 80 765 83 136 90 029 84 916 84 916 90 855 98 574 103 306
Finance and administration 1 156 123 580 579 1 304 702 1 254 076 1 232 789 1 232 789 1 172 314 1 223 253 1 257 354
Internal audit – 7 766 7 757 9 920 9 650 9 650 11 216 11 791 12 357
Community and public safety 178 738 133 077 139 272 137 815 144 458 144 458 159 168 166 108 174 028
Community and social services 27 959 37 593 26 096 28 862 33 959 33 959 35 743 36 693 38 401
Sport and recreation 16 116 14 821 24 310 22 382 22 183 22 183 39 259 41 167 43 143
Public safety 128 910 70 547 77 807 74 357 76 156 76 156 70 941 74 367 77 937
Housing – 3 983 4 450 4 937 4 903 4 903 5 663 5 956 6 242
Health 5 753 6 134 6 608 7 277 7 257 7 257 7 561 7 924 8 305
Economic and environmental services 107 464 471 314 556 948 109 910 114 381 114 381 137 083 143 693 151 786
Planning and development 26 868 47 968 54 189 45 165 53 236 53 236 62 375 64 855 69 164
Road transport 72 920 422 652 502 046 64 023 60 438 60 438 73 928 78 022 81 767
Environmental protection 7 676 694 713 722 707 707 779 817 856
Trading services 739 018 838 971 1 077 128 818 994 808 571 808 571 888 641 934 328 968 505
Energy sources 435 864 491 382 646 023 501 522 507 312 507 312 541 084 564 540 580 824
Water management 200 303 248 808 340 753 225 344 194 274 194 274 220 490 235 886 247 304
Waste water management 33 010 30 852 39 450 35 140 52 855 52 855 47 098 49 466 51 888
Waste management 69 840 67 929 50 901 56 988 54 131 54 131 79 968 84 436 88 489
Other 4 2 408 2 297 2 269 2 994 2 675 2 675 3 198 3 388 3 551
Total Expenditure - Functional 3 2 268 996 2 114 770 3 171 212 2 423 738 2 397 440 2 397 440 2 462 474 2 581 135 2 670 888
Surplus/(Deficit) for the year (362 370) (316 507) (1 318 530) (312 886) (175 897) (175 897) (119 780) (52 518) 21 213
Current Year 2019/20 2020/21 Medium Term Revenue & Expenditure

Madibeng Local Municipality 2020/21 /Final Annual Budget and MTREF
29 | P a g e
3. Note that as a general principle the revenues for the Trading Services should exceed their expenditures. The table highlights that this is the case for Electricity, Water and Waste water functions, but not the Waste management function. As already noted above, the municipality will be undertaking a detailed study of this function to explore ways of improving efficiencies and provide a basis for re-evaluating the function’s tariff structure.
4. Other functions that show a deficit between revenue and expenditure are being financed from rates revenues and other revenue sources reflected under the Corporate Services.
Table 19 MBRR Table A3 - Budgeted Financial Performance (revenue and expenditure by municipal vote)
Explanatory notes to MBRR Table A3 - Budgeted Financial Performance (revenue and expenditure by municipal vote) 1. Table A3 is a view of the budgeted financial performance in relation to the revenue and
expenditure per municipal vote. This table facilitates the view of the budgeted operating performance in relation to the organisational structure of the Municipality. This means it is possible to present the operating surplus or deficit of a vote. The following table is an analysis of the surplus or deficit for the electricity and water trading services.
Vote Description Ref 2016/17 2017/18 2018/19
R thousandAudited
Outcome
Audited
Outcome
Audited
Outcome
Original
Budget
Adjusted
Budget
Full Year
Forecast
Budget Year
2020/21
Budget Year
+1 2021/22
Budget Year
+2 2022/23
Revenue by Vote 1
Vote 01 - Executive Council – – – – – – – – –
Vote 02 - Municipal Manager – – – – – – – – –
Vote 03 - Chief Operating Officer – – – – – – – – –
Vote 04 - Corporate Support Services 24 – – – – – – – –
Vote 05 - Budget And Treasury Office 911 649 882 010 900 964 1 017 263 1 097 209 1 097 209 1 196 190 1 302 128 1 410 238
Vote 06 - Infrastructure And Technical Services 692 146 833 078 876 673 1 013 094 1 041 214 1 041 214 1 058 195 1 135 146 1 186 136
Vote 07 - Community Services 41 670 55 483 51 569 61 139 62 124 62 124 70 868 74 270 77 835
Vote 08 - Human Settlement – 1 461 2 326 2 743 2 743 2 743 2 481 2 600 2 725
Vote 09 - Economic Dev,Tourism & Agriculture 251 826 2 666 1 070 1 530 1 530 1 530 1 348 208 218
Vote 10 - Public Safety, Fleet And Facilities Management 9 310 23 565 20 080 15 084 16 723 16 723 13 611 14 264 14 949
Vote 11 - Internal Audit – – – – – – – – –
Vote 12 - Risk Management – – – – – – – – –
Total Revenue by Vote 2 1 906 626 1 798 264 1 852 682 2 110 852 2 221 542 2 221 542 2 342 694 2 528 617 2 692 100
Expenditure by Vote to be appropriated 1
Vote 01 - Executive Council 85 245 59 301 62 732 68 700 64 014 64 014 67 382 73 881 77 428
Vote 02 - Municipal Manager – 6 028 4 295 4 173 4 078 4 078 4 720 4 999 5 239
Vote 03 - Chief Operating Officer – 17 923 19 842 23 505 22 284 22 284 27 406 29 224 30 627
Vote 04 - Corporate Support Services 123 928 57 693 58 178 80 326 72 644 72 644 79 832 85 338 89 137
Vote 05 - Budget And Treasury Office 1 032 195 341 861 1 132 004 1 018 405 1 010 793 1 010 793 914 410 951 214 973 410
Vote 06 - Infrastructure And Technical Services 742 098 1 182 722 1 514 945 807 244 805 148 805 148 874 516 918 832 953 464
Vote 07 - Community Services 127 344 140 301 119 642 129 487 127 712 127 712 175 644 184 931 193 759
Vote 08 - Human Settlement – 25 691 23 746 28 217 27 592 27 592 30 811 32 346 33 899
Vote 09 - Economic Dev,Tourism & Agriculture 29 276 13 248 24 166 14 373 13 840 13 840 15 492 16 311 17 092
Vote 10 - Public Safety, Fleet And Facilities Management 128 910 262 238 203 841 239 262 239 593 239 593 251 910 262 695 274 444
Vote 11 - Internal Audit – 7 766 7 757 9 920 9 650 9 650 11 216 11 791 12 357
Vote 12 - Risk Management – – 65 126 91 91 9 134 9 573 10 032
Total Expenditure by Vote 2 2 268 996 2 114 770 3 171 212 2 423 738 2 397 440 2 397 440 2 462 474 2 581 135 2 670 888
Surplus/(Deficit) for the year 2 (362 370) (316 507) (1 318 530) (312 886) (175 897) (175 897) (119 780) (52 518) 21 213
Current Year 2019/202020/21 Medium Term Revenue & Expenditure
Framework
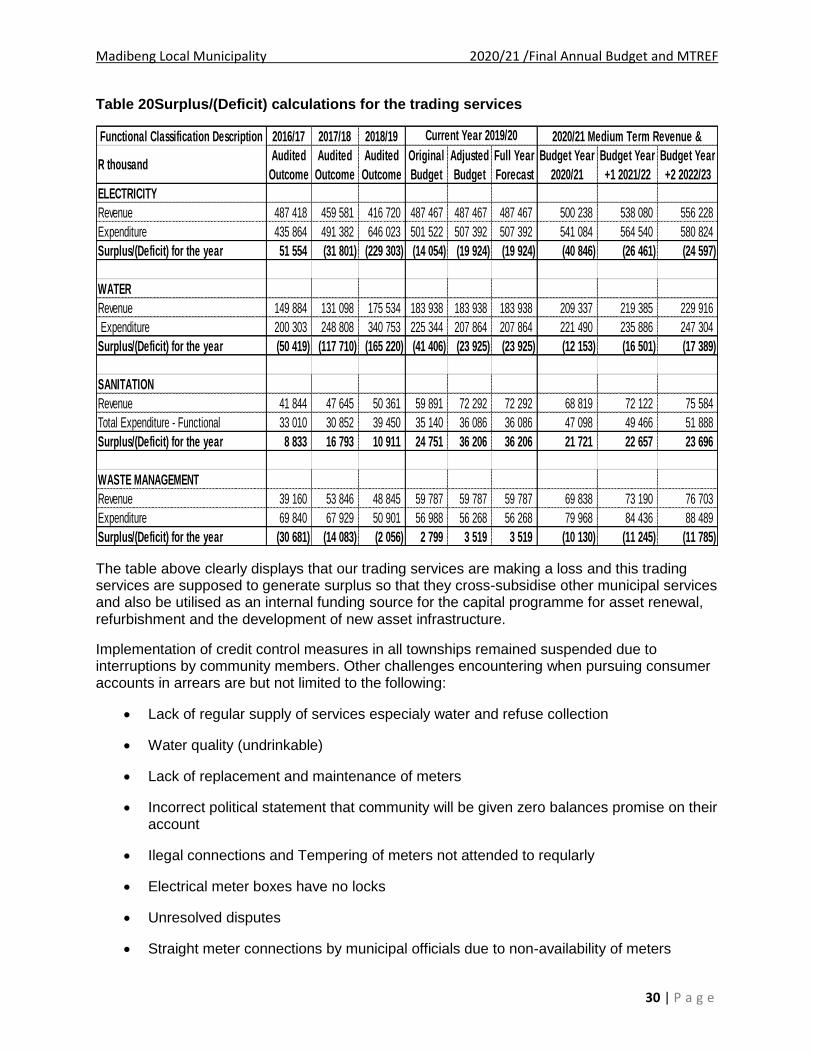
Madibeng Local Municipality 2020/21 /Final Annual Budget and MTREF
30 | P a g e
Table 20Surplus/(Deficit) calculations for the trading services
The table above clearly displays that our trading services are making a loss and this trading services are supposed to generate surplus so that they cross-subsidise other municipal services and also be utilised as an internal funding source for the capital programme for asset renewal, refurbishment and the development of new asset infrastructure.
Implementation of credit control measures in all townships remained suspended due to interruptions by community members. Other challenges encountering when pursuing consumer accounts in arrears are but not limited to the following:
Lack of regular supply of services especialy water and refuse collection
Water quality (undrinkable)
Lack of replacement and maintenance of meters
Incorrect political statement that community will be given zero balances promise on their account
Ilegal connections and Tempering of meters not attended to reqularly
Electrical meter boxes have no locks
Unresolved disputes
Straight meter connections by municipal officials due to non-availability of meters
Functional Classification Description 2016/17 2017/18 2018/19
R thousandAudited
Outcome
Audited
Outcome
Audited
Outcome
Original
Budget
Adjusted
Budget
Full Year
Forecast
Budget Year
2020/21
Budget Year
+1 2021/22
Budget Year
+2 2022/23
ELECTRICITY
Revenue 487 418 459 581 416 720 487 467 487 467 487 467 500 238 538 080 556 228
Expenditure 435 864 491 382 646 023 501 522 507 392 507 392 541 084 564 540 580 824
Surplus/(Deficit) for the year 51 554 (31 801) (229 303) (14 054) (19 924) (19 924) (40 846) (26 461) (24 597)
WATER
Revenue 149 884 131 098 175 534 183 938 183 938 183 938 209 337 219 385 229 916
Expenditure 200 303 248 808 340 753 225 344 207 864 207 864 221 490 235 886 247 304
Surplus/(Deficit) for the year (50 419) (117 710) (165 220) (41 406) (23 925) (23 925) (12 153) (16 501) (17 389)
SANITATION
Revenue 41 844 47 645 50 361 59 891 72 292 72 292 68 819 72 122 75 584
Total Expenditure - Functional 33 010 30 852 39 450 35 140 36 086 36 086 47 098 49 466 51 888
Surplus/(Deficit) for the year 8 833 16 793 10 911 24 751 36 206 36 206 21 721 22 657 23 696
WASTE MANAGEMENT
Revenue 39 160 53 846 48 845 59 787 59 787 59 787 69 838 73 190 76 703
Expenditure 69 840 67 929 50 901 56 988 56 268 56 268 79 968 84 436 88 489
Surplus/(Deficit) for the year (30 681) (14 083) (2 056) 2 799 3 519 3 519 (10 130) (11 245) (11 785)
Current Year 2019/20 2020/21 Medium Term Revenue &

Madibeng Local Municipality 2020/21 /Final Annual Budget and MTREF
31 | P a g e
Table 21 MBRR Table A4 - Budgeted Financial Performance (revenue and expenditure)
Description Ref 2016/17 2017/18 2018/19
R thousand 1Audited
Outcome
Audited
Outcome
Audited
Outcome
Original
Budget
Adjusted
Budget
Full Year
Forecast
Pre-audit
outcome
Budget Year
2020/21
Budget Year
+1 2021/22
Budget Year
+2 2022/23
Revenue By Source
Property rates 2 269 185 257 978 250 694 270 000 349 946 349 946 319 754 369 015 387 460 406 901
Service charges - electricity revenue 2 447 788 426 306 389 307 475 000 475 000 475 000 413 501 469 172 486 453 509 802
Service charges - water revenue 2 148 307 119 525 163 035 161 600 161 600 161 600 149 593 168 860 176 966 185 460
Service charges - sanitation revenue 2 41 724 43 398 46 601 52 275 52 275 52 275 48 832 55 070 57 713 60 483
Service charges - refuse revenue 2 33 569 51 169 45 669 53 000 53 000 53 000 51 507 57 047 59 785 62 655
Rental of facilities and equipment 1 243 1 333 1 020 1 386 1 386 1 386 753 1 034 1 084 1 136
Interest earned - external investments 4 515 7 030 5 843 6 732 6 732 6 732 3 355 4 067 4 262 4 467
Interest earned - outstanding debtors 95 140 83 818 56 828 91 112 91 112 91 112 121 914 131 457 137 767 144 380
Dividends received – 48 – – – – – – – –
Fines, penalties and forfeits 2 992 5 001 156 1 001 1 001 1 001 11 500 524 549
Licences and permits 6 229 6 196 6 724 2 127 2 127 2 127 111 1 199 1 257 1 317
Agency services 11 456 12 253 13 216 12 000 12 000 12 000 – 12 000 12 576 13 180
Transfers and subsidies 506 007 781 116 854 732 699 244 710 868 710 868 505 258 788 036 871 836 962 648
Other revenue 2 76 715 3 094 3 806 3 579 3 579 3 579 2 753 3 754 3 934 4 123
Gains – – 9 515 – – – 725 0 0 0
Total Revenue (excluding capital transfers and
contributions)
1 644 870 1 798 264 1 847 145 1 829 055 1 920 625 1 920 625 1 618 067 2 061 212 2 201 617 2 357 100
Expenditure By Type
Employee related costs 2 392 302 414 356 516 496 470 000 470 020 470 020 554 654 558 803 585 624 613 734
Remuneration of councillors 25 456 30 531 31 050 33 242 33 242 33 242 31 836 31 633 34 200 35 841
Debt impairment 3 157 979 (128 998) 936 713 275 000 275 000 275 000 25 200 000 209 600 219 661
Depreciation & asset impairment 2 458 952 474 336 474 165 490 000 490 000 490 000 – 485 000 491 790 498 796
Finance charges 131 937 129 675 4 123 140 501 140 501 140 501 115 135 500 141 244 142 312
Bulk purchases 2 452 876 499 692 814 198 560 000 533 150 533 150 359 284 600 000 625 760 641 982
Other materials 8 104 859 23 119 31 246 26 320 27 622 27 622 17 800 23 596 23 877 25 114
Contracted services 259 308 290 283 251 361 235 075 246 837 246 837 171 812 227 834 250 453 264 913
Transfers and subsidies 20 819 4 009 4 051 4 500 4 090 4 090 4 087 4 700 4 900 5 000
Other expenditure 4, 5 135 372 195 241 97 353 189 101 176 978 176 978 134 396 195 409 213 688 223 534
Losses 129 135 182 526 10 456 – – – 1 289 0 0 0
Total Expenditure 2 268 996 2 114 770 3 171 212 2 423 738 2 397 440 2 397 440 1 275 298 2 462 474 2 581 135 2 670 888
Surplus/(Deficit) (624 126) (316 507) (1 324 068) (594 683) (476 814) (476 814) 342 769 (401 263) (379 518) (313 787)
Transfers and subsidies - capital (monetary
allocations) (National / Provincial and District) 261 756 – 5 537 281 797 300 917 300 917 – 281 482 327 000 335 000
Transfers and subsidies - capital (monetary
allocations) (National / Provincial Departmental
Agencies, Households, Non-profit Institutions, Private
Enterprises, Public Corporatons, Higher Educational
Institutions) 6 –
Transfers and subsidies - capital (in-kind - all)
Surplus/(Deficit) after capital transfers &
contributions
(362 370) (316 507) (1 318 530) (312 886) (175 897) (175 897) 342 769 (119 780) (52 518) 21 213
Taxation
Surplus/(Deficit) after taxation (362 370) (316 507) (1 318 530) (312 886) (175 897) (175 897) 342 769 (119 780) (52 518) 21 213
Attributable to minorities
Surplus/(Deficit) attributable to municipality (362 370) (316 507) (1 318 530) (312 886) (175 897) (175 897) 342 769 (119 780) (52 518) 21 213
Share of surplus/ (deficit) of associate 7
Surplus/(Deficit) for the year (362 370) (316 507) (1 318 530) (312 886) (175 897) (175 897) 342 769 (119 780) (52 518) 21 213
2020/21 Medium Term Revenue & Expenditure
FrameworkCurrent Year 2019/20

Madibeng Local Municipality 2020/21 /Final Annual Budget and MTREF
32 | P a g e
Explanatory notes to Table A4 - Budgeted Financial Performance (revenue and expenditure) Total operating expenditure for the 2020/21 financial year has been appropriated at R2.4 billion
and translates into a budgeted deficit of R401.2m (excluding capital grants) and a deficit of
R119.7m (including capital grants). When compared to the 2019/2020 Adjustments Budget,
operating expenditure has increased by 3% in the 2020/21 budget and increases by 5% and 3%
for each of the respective outer years of the MTREF.
It should be noted that, although the 2020/2021 operational budget and indicative years indicate
budgeted deficits (Table 1), this does not reflect the actual cash position and also that the deficit
is gradually decreasing over MTREF. This phenomenon will continue for the foreseeable future.
These circumstances arose as the result of the implementation of GRAP, with special reference
to GRAP 17 (Property, Plant and Equipment-PPE). The asset value before depreciation is in
excess of R6 billion, which relates to substantially high depreciation charges. The replacement
thereof can thus not be recouped via current tariffs, no reserves may be established for these
purposes. The principle of recovering actual cash costs during each financial year period is
adhered to.
The following graph illustrates the major expenditure items per type.
Figure 3 Expenditure by major type
1. Bulk purchases have significantly increased over the 2020/21 to 2022/23 period escalating from R600 million to R641.9 million. These increases can be attributed to the substantial increase in the cost of bulk electricity from Eskom and Bulk water from Rand Water.
2. Employee related costs and bulk purchases are the main cost drivers within the municipality and alternative operational gains and efficiencies will have to be identified to lessen the impact of wage and bulk tariff increases in future years.
–
200000 000
400000 000
600000 000
800000 000
1000000 000
1200000 000
Employeerelated costs
Depreciation& asset
impairment
Bulkpurchases
Contractedservices
Otherexpenditure
AUD17 AUD18 AUD19 BUD ADJ20 YEAR 2021 YEAR 2122 YEAR 2223

Madibeng Local Municipality 2020/21 /Final Annual Budget and MTREF
33 | P a g e
Table 22 MBRR Table A5 - Budgeted Capital Expenditure by vote, standard classification and funding source
Vote Description Ref 2016/17 2017/18 2018/19
R thousand 1Audited
Outcome
Audited
Outcome
Audited
Outcome
Original
Budget
Adjusted
Budget
Full Year
Forecast
Pre-audit
outcome
Budget Year
2020/21
Budget Year
+1 2021/22
Budget Year
+2 2022/23
Capital expenditure - Vote
Multi-year expenditure to be appropriated 2
Vote 01 - Executive Council – – – – – – – – – –
Vote 02 - Municipal Manager – – – – – – – – – –
Vote 03 - Chief Operating Officer – – – – – – – – – –
Vote 04 - Corporate Support Services – – – – – – – – – –
Vote 05 - Budget And Treasury Office – – – – – – – – – –
Vote 06 - Infrastructure And Technical Services – – – – 19 120 19 120 17 288 – – –
Vote 07 - Community Services – – – – – – – – – –
Vote 08 - Human Settlement – – – – – – – – – –
Vote 09 - Economic Dev,Tourism & Agriculture – – – – – – – – – –
Vote 10 - Public Safety, Fleet And Facilities Management – – – – – – – – – –
Vote 11 - Internal Audit – – – – – – – – – –
Vote 12 - Risk Management – – – – – – – – – –
Vote 13 - [Name Of Vote 13] – – – – – – – – – –
Vote 14 - [Name Of Vote 14] – – – – – – – – – –
Vote 15 - Other – – – – – – – – – –
Capital multi-year expenditure sub-total 7 – – – – 19 120 19 120 17 288 – – –
Single-year expenditure to be appropriated 2
Vote 01 - Executive Council – 86 363 – 14 14 6 – – –
Vote 02 - Municipal Manager – – 194 – 79 79 48 – – –
Vote 03 - Chief Operating Officer – – 40 – 115 115 85 – – –
Vote 04 - Corporate Support Services – 3 652 17 432 – 74 74 18 – – –
Vote 05 - Budget And Treasury Office 1 065 228 242 – 336 336 198 – – –
Vote 06 - Infrastructure And Technical Services 216 850 192 380 187 421 281 797 273 513 273 513 111 303 256 149 311 000 335 000
Vote 07 - Community Services 15 251 2 447 1 185 – 11 200 11 200 1 209 11 708 – –
Vote 08 - Human Settlement – 1 486 – – 3 3 2 – – –
Vote 09 - Economic Dev,Tourism & Agriculture – – – – – – – 13 626 16 000 –
Vote 10 - Public Safety, Fleet And Facilities Management 19 449 16 437 3 467 – 63 63 20 – – –
Vote 11 - Internal Audit – 10 66 – – – – – – –
Vote 12 - Risk Management – – – – – – – – – –
Vote 13 - [Name Of Vote 13] – – – – – – – – – –
Vote 14 - [Name Of Vote 14] – – – – – – – – – –
Vote 15 - Other – – – – – – – – – –
Capital single-year expenditure sub-total 252 614 216 725 210 410 281 797 285 396 285 396 112 889 281 482 327 000 335 000
Total Capital Expenditure - Vote 252 614 216 725 210 410 281 797 304 516 304 516 130 177 281 482 327 000 335 000
Capital Expenditure - Functional
Governance and administration 1 065 20 413 18 336 – 647 647 354 – – –
Executive and council – 86 612 – 152 152 113 – – –
Finance and administration 1 065 20 317 17 659 – 495 495 241 – – –
Internal audit – 10 66 – – – – – – –
Community and public safety 15 580 1 505 4 039 – 11 237 11 237 1 232 11 708 – –
Community and social services 12 817 488 516 – – – – 11 708 – –
Sport and recreation 2 010 924 582 – 11 200 11 200 1 209 – – –
Public safety 753 – 2 941 – 34 34 20 – – –
Housing – 93 – – 3 3 2 – – –
Health – – – – – – – – – –
Economic and environmental services 100 168 89 208 75 296 77 000 99 200 99 200 32 319 83 668 114 000 91 000
Planning and development – 1 393 30 – – – – 13 626 16 000 –
Road transport 100 168 87 815 75 266 77 000 99 200 99 200 32 319 70 042 98 000 91 000
Environmental protection – – – – – – – – – –
Trading services 116 354 105 600 112 739 204 797 193 433 193 433 96 272 186 107 213 000 244 000
Energy sources 10 766 14 352 975 16 787 14 616 14 616 5 248 22 897 75 000 71 000
Water management 75 640 77 158 87 617 135 000 96 743 96 743 41 596 97 400 65 000 85 000
Waste water management 29 947 13 055 24 127 53 010 82 074 82 074 49 429 65 810 73 000 88 000
Waste management – 1 035 20 – – – – – – –
Other 19 449 – – – – – – – – –
Total Capital Expenditure - Functional 3 252 614 216 725 210 410 281 797 304 516 304 516 130 177 281 482 327 000 335 000
Funded by:
National Government 232 101 186 967 186 761 281 797 291 917 291 917 124 553 281 482 327 000 335 000
Provincial Government
District Municipality
Transfers and subsidies - capital (monetary
allocations) (National / Provincial Departmental
Agencies, Households, Non-profit Institutions,
Private Enterprises, Public Corporatons, Higher
Educational Institutions)
Transfers recognised - capital 4 232 101 186 967 186 761 281 797 291 917 291 917 124 553 281 482 327 000 335 000
Borrowing 6
Internally generated funds 20 513 29 758 23 648 – 12 599 12 599 5 624 – – –
Total Capital Funding 7 252 614 216 725 210 410 281 797 304 516 304 516 130 177 281 482 327 000 335 000
2020/21 Medium Term Revenue & Expenditure
FrameworkCurrent Year 2019/20

Madibeng Local Municipality 2020/21 /Final Annual Budget and MTREF
34 | P a g e
Explanatory notes to Table A5 - Budgeted Capital Expenditure by vote, standard classification and funding source 1. Table A5 is a breakdown of the capital programme in relation to capital expenditure by
municipal vote (multi-year and single-year appropriations); capital expenditure by standard classification; and the funding sources necessary to fund the capital budget, including information on capital transfers from national and provincial departments.
2. The MFMA provides that a municipality may approve multi-year or single-year capital budget appropriations
3. For 2020/21 an amount of R 281.4 million has been appropriated for the development of infrastructure. In the outer years this amount totals R 327 million, and R 335 million, respectively for each of the financial years.
4. Unlike multi-year capital appropriations, single-year appropriations relate to expenditure that will be incurred in the specific budget year such as the procurement of vehicles and specialized tools and equipment. The budget appropriations for the two outer years are indicative allocations based on the departmental business plans as informed by the IDP and will be reviewed on an annual basis to assess the relevance of the expenditure in relation to the strategic objectives and service delivery imperatives of the Municipality. For the purpose of funding assessment of the MTREF, these appropriations have been included but no commitments will be incurred against single-year appropriations for the two outer-years.
5. The capital programme is funded from capital grants and transfers.

Madibeng Local Municipality 2020/21 /Final Annual Budget and MTREF
35 | P a g e
Table 23 MBRR Table A6 - Budgeted Financial Position
Explanatory notes to Table A6 - Budgeted Financial Position 1. Table A6 is consistent with international standards of good financial management practice,
and improves understandability for councilors and management of the impact of the budget on the statement of financial position (balance sheet).
2. This format of presenting the statement of financial position is aligned to GRAP1, which is generally aligned to the international version which presents Assets less Liabilities as “accounting” Community Wealth. The order of items within each group illustrates items in order of liquidity; i.e. assets readily converted to cash, or liabilities immediately required to be met from cash, appear first.
3. Table 23 is supported by an extensive table of notes (SA3) providing a detailed analysis of the major components of a number of items, including: • Call investments deposits; • Consumer debtors; • Property, plant and equipment; • Trade and other payables;
Description Ref 2016/17 2017/18 2018/19
R thousandAudited
Outcome
Audited
Outcome
Audited
Outcome
Original
Budget
Adjusted
Budget
Full Year
Forecast
Pre-audit
outcome
Budget Year
2020/21
Budget Year
+1 2021/22
Budget Year
+2 2022/23
ASSETS
Current assets
Cash 32 334 (7 956) 21 454 10 118 10 203 10 203 (388 531) 5 926 9 580 10 857
Call investment deposits 1 1 031 8 760 40 958 10 000 20 000 60 000 27 553 21 000 68 000
Consumer debtors 1 337 257 636 418 291 675 819 511 819 511 819 511 753 028 896 000 821 000 776 000
Other debtors 179 363 946 809 1 126 130 – – – 1 241 281 – – –
Current portion of long-term receivables
Inventory 2 12 869 13 896 16 433 10 000 10 000 10 000 22 148 12 000 13 000 15 000
Total current assets 562 855 1 597 926 1 496 651 849 629 859 714 899 714 1 655 480 913 926 864 580 869 857
Non current assets
Long-term receivables
Investments 12 785 12 757 11 543 12 800 12 800 12 800 5 829 12 800 12 900 13 000
Investment property 317 245 168 005 100 370 275 000 275 000 275 000 100 370 110 370 120 000 125 000
Investment in Associate
Property, plant and equipment 3 5 778 180 5 519 330 5 327 224 6 224 950 6 203 499 6 203 499 5 457 401 6 542 339 6 630 650 6 835 000
Biological
Intangible – – 3 964 – – – 3 964 – – –
Other non-current assets 10 10 10 10 10 10 10 10 10 –
Total non current assets 6 108 221 5 700 102 5 443 112 6 512 760 6 491 309 6 491 309 5 567 574 6 665 519 6 763 560 6 973 000
TOTAL ASSETS 6 671 076 7 298 028 6 939 763 7 362 389 7 351 023 7 391 023 7 223 054 7 579 444 7 628 140 7 842 857
LIABILITIES
Current liabilities
Bank overdraft 1
Borrowing 4 4 470 2 013 2 013 – – – 2 013 2 013 2 013 2 013
Consumer deposits 13 945 15 948 40 809 16 000 16 000 16 000 43 066 16 500 16 800 16 900
Trade and other payables 4 631 760 1 409 216 2 167 482 470 655 400 655 400 655 2 123 548 382 742 394 829 400 000
Provisions 55 108 240 414 266 074 240 000 240 000 240 000 266 074 55 000 60 000 65 000
Total current liabilities 705 284 1 667 591 2 476 378 726 655 656 655 656 655 2 434 701 456 255 473 642 483 913
Non current liabilities
Borrowing 986 965 1 113 443 (2 013) 1 171 342 1 171 342 1 171 342 (2 013) 1 234 924 1 299 244 1 429 370
Provisions 205 126 50 391 42 800 208 000 208 000 208 000 42 800 200 800 200 800 200 800
Total non current liabilities 1 192 091 1 163 834 40 787 1 379 342 1 379 342 1 379 342 40 787 1 435 724 1 500 044 1 630 170
TOTAL LIABILITIES 1 897 375 2 831 425 2 517 165 2 105 997 2 035 997 2 035 997 2 475 488 1 891 979 1 973 687 2 114 083
NET ASSETS 5 4 773 701 4 466 603 4 422 597 5 256 392 5 315 026 5 355 026 4 747 566 5 687 465 5 654 454 5 728 773
COMMUNITY WEALTH/EQUITY
Accumulated Surplus/(Deficit) 4 773 701 4 466 603 4 422 597 5 256 392 5 315 026 5 355 026 4 747 566 5 687 465 5 654 454 5 728 773
Reserves 4 – – – – – – – – – –
TOTAL COMMUNITY WEALTH/EQUITY 5 4 773 701 4 466 603 4 422 597 5 256 392 5 315 026 5 355 026 4 747 566 5 687 465 5 654 454 5 728 773
2020/21 Medium Term Revenue & Expenditure
FrameworkCurrent Year 2019/20

Madibeng Local Municipality 2020/21 /Final Annual Budget and MTREF
36 | P a g e
• Provisions non-current; • Changes in net assets; and • Reserves
4. The municipal equivalent of equity is Community Wealth/Equity. The justification is that ownership and the net assets of the municipality belong to the community.
5. Any movement on the Budgeted Financial Performance or the Capital Budget will inevitably impact on the Budgeted Financial Position. As an example, the collection rate assumption will impact on the cash position of the municipality and subsequently inform the level of cash and cash equivalents at year end. Similarly, the collection rate assumption should inform the budget appropriation for debt impairment which in turn would impact on the provision for bad debt. These budget and planning assumptions form a critical link in determining the applicability and relevance of the budget as well as the determination of ratios and financial indicators. In addition the funding compliance assessment is informed directly by forecasting the statement of financial position.
Table 24 MBRR Table A7 - Budgeted Cash Flow Statement
Explanatory notes to Table A7 - Budgeted Cash Flow Statement 1. The budgeted cash flow statement is the first measurement in determining if the budget is
funded. 2. It shows the expected level of cash in-flow versus cash out-flow that is likely to result from the
implementation of the budget.
Description Ref 2016/17 2017/18 2018/19
R thousandAudited
Outcome
Audited
Outcome
Audited
Outcome
Original
Budget
Adjusted
Budget
Full Year
Forecast
Pre-audit
outcome
Budget Year
2020/21
Budget Year
+1 2021/22
Budget Year
+2 2022/23
CASH FLOW FROM OPERATING ACTIVITIES
Receipts
Property rates 296 046 258 006 175 499 230 000 230 000 200 000 156 937 258 311 290 595 305 175
Service charges 227 842 646 403 421 053 526 000 526 000 596 000 397 294 525 105 585 688 613 801
Other revenue 32 132 36 225 31 995 29 512 65 512 65 512 9 592 18 487 19 375 20 305
Transfers and Subsidies - Operational 1 504 673 569 142 626 943 571 733 572 804 572 804 428 806 788 036 871 836 962 648
Transfers and Subsidies - Capital 1 263 056 212 007 248 918 301 005 301 005 301 005 106 603 281 482 327 000 335 000
Interest 99 646 90 896 56 620 10 500 20 000 20 000 57 537 29 367 30 762 31 467
Dividends – – – – – – – – –
Payments
Suppliers and employees (1 200 077) (1 592 069) (1 315 453) (1 308 392) (1 369 115) (1 369 115) (1 041 600) (1 657 274) (1 773 601) (1 885 119)
Finance charges (116 410) (127 974) (4 699) – – – – – –
Transfers and Grants 1 (10 000) (5 000) (5 000) (1 649) – – –
NET CASH FROM/(USED) OPERATING ACTIVITIES 106 908 92 635 240 877 350 358 341 206 381 206 113 521 243 513 351 655 383 276
CASH FLOWS FROM INVESTING ACTIVITIES
Receipts
Proceeds on disposal of PPE 6 108 – – –
Decrease (increase) in non-current receivables (16 378) – – – – – – – – –
Decrease (increase) in non-current investments (132) (253) – – – – – – – –
Payments
Capital assets (242 160) (214 830) (210 237) (301 005) (311 487) (311 487) (83 914) (281 482) (327 000) (335 000)
NET CASH FROM/(USED) INVESTING ACTIVITIES (252 563) (215 083) (210 237) (301 005) (311 487) (311 487) (83 914) (281 482) (327 000) (335 000)
CASH FLOWS FROM FINANCING ACTIVITIES
Receipts
Short term loans – – – – – – – – – –
Borrowing long term/refinancing 113 682 128 491 – – – – – – – –
Increase (decrease) in consumer deposits – – – – – – – – – –
Payments
Repayment of borrowing (3 826) (5 717) – – –
NET CASH FROM/(USED) FINANCING ACTIVITIES 109 856 122 774 – – – – – – – –
NET INCREASE/ (DECREASE) IN CASH HELD (35 799) 326 30 641 49 353 29 719 69 719 29 607 (37 969) 24 655 48 276
Cash/cash equivalents at the year begin: 2 69 155 33 366 58 530 (29 235) 484 484 484 43 895 5 926 30 580
Cash/cash equivalents at the year end: 2 33 357 33 692 89 171 20 118 30 203 70 203 30 091 5 926 30 580 78 857
2020/21 Medium Term Revenue & Expenditure
FrameworkCurrent Year 2019/20

Madibeng Local Municipality 2020/21 /Final Annual Budget and MTREF
37 | P a g e
3. The municipality is technically bankrupt, it can be seen that the cash levels fell significantly over the 2016/17 to 2018/19 period owing directly to a net decrease in cash for the 2016/17 financial year of R35.7 million.
4. The approved 2018/19 MTREF provide for a further net decrease in cash of R208.8 million for the 2018/19 financial year resulting in an overall projected negative cash position of R175 million at year end.
5. As part of the 2019/20 mid-year review and Adjustments Budget this unsustainable cash position had to be addressed as a matter of urgency and various interventions were implemented such as the reduction of expenditure allocations and rationalization of spending priorities.
6. In addition the municipality undertook an extensive debt collection drive resulting in cash receipts on arrear debtors of R 2 billion. These interventions translated into a net cash position of 39.6 million for the 2019/20 financial year and cash and cash equivalents totaled R82 million at year end.
7. The 2020/21 MTREF has been informed by the planning principle of ensuring adequate cash reserves over the medium-term.
8. Cash and cash equivalents totals R5.9 million as at the end of the 2020/21 financial year and escalates to R78.8 million by 2022/23.
Table 25 MBRR Table A8 - Cash Backed Reserves/Accumulated Surplus Reconciliation
Explanatory notes to Table A8 - Cash Backed Reserves/Accumulated Surplus Reconciliation 1. The cash backed reserves/accumulated surplus reconciliation is aligned to the requirements
of MFMA Circular 42 – Funding a Municipal Budget. 2. In essence the table evaluates the funding levels of the budget by firstly forecasting the cash
and investments at year end and secondly reconciling the available funding to the liabilities/commitments that exist.
3. The outcome of this exercise would either be a surplus or deficit. A deficit would indicate that the applications exceed the cash and investments available and would be indicative of non-compliance with the MFMA requirements that the municipality’s budget must be “funded”.
4. Non-compliance with section 18 of the MFMA is assumed because a shortfall would indirectly indicate that the annual budget is not appropriately funded.
5. From the table it can be seen that for the period 2016/17 to 2019/20 the deficit moved from R332.3 million to R290.4 million.
Description Ref 2016/17 2017/18 2018/19
R thousandAudited
Outcome
Audited
Outcome
Audited
Outcome
Original
Budget
Adjusted
Budget
Full Year
Forecast
Pre-audit
outcome
Budget Year
2020/21
Budget Year
+1 2021/22
Budget Year
+2 2022/23
Cash and investments available
Cash/cash equivalents at the year end 1 33 357 33 692 89 171 20 118 30 203 70 203 30 091 5 926 30 580 78 857
Other current investments > 90 days 9 (32 888) (26 758) – – – (391 069) – – –
Non current assets - Investments 1 12 785 12 757 11 543 12 800 12 800 12 800 5 829 12 800 12 900 13 000
Cash and investments available: 46 151 13 560 73 956 32 918 43 003 83 003 (355 149) 18 726 43 480 91 857
Application of cash and investments
Unspent conditional transfers 327 987 16 903 – – – 57 014 – – –
Unspent borrowing – – – – – – – – –
Statutory requirements 2
Other working capital requirements 3 378 204 (916 781) 176 147 (102 533) (158 966) (186 214) (110 641) (183 407) (159 924) (124 381)
Other provisions 178 224 129 731 200 800 200 800 200 800 200 800 200 800 200 800
Long term investments committed 4 – – – – – – – – – –
Reserves to be backed by cash/investments 5 – – – – – – – – – –
Total Application of cash and investments: 556 754 (915 794) 193 050 27 198 41 834 14 586 147 172 17 393 40 876 76 419
Surplus(shortfall) (510 603) 929 354 (119 093) 5 720 1 169 68 417 (502 321) 1 333 2 604 15 438
2020/21 Medium Term Revenue & Expenditure
FrameworkCurrent Year 2019/20

Madibeng Local Municipality 2020/21 /Final Annual Budget and MTREF
38 | P a g e
6. Considering the requirements of section 18 of the MFMA, it can be concluded that the adopted 2019/20 MTREF was not funded owing to the significant deficit.
7. As part of the budgeting and planning guidelines that informed the compilation of the 2020/21 MTREF the end objective of the medium-term framework was to ensure the budget is funded aligned to section 18 of the MFMA.
8. As can be seen the budget has been modelled to progressively move from a deficit of R1.1 million in 2019/20 to a surplus of R15.4 million by 2022/23.
Table 26 MBRR Table A9 - Asset Management
Description Ref 2016/17 2017/18 2018/19
R thousandAudited
Outcome
Audited
Outcome
Audited
Outcome
Original
Budget
Adjusted
Budget
Full Year
Forecast
Budget Year
2020/21
Budget Year
+1 2021/22
Budget Year
+2 2022/23
CAPITAL EXPENDITURE
Total New Assets 1 252 614 112 636 135 708 188 010 207 639 207 639 279 801 305 559 324 408
Roads Infrastructure 95 245 – – – – – 62 600 98 000 91 000
Electrical Infrastructure 22 000 – – – – – 7 697 40 000 45 000
Water Supply Infrastructure 86 271 77 158 87 610 135 000 135 000 135 000 97 400 65 000 85 000
Sanitation Infrastructure 20 509 13 055 24 040 53 010 53 010 53 010 65 810 73 000 88 000
Infrastructure 224 024 90 213 111 650 188 010 188 010 188 010 233 507 276 000 309 000
Community Facilities 11 098 – – – – – 46 294 29 559 15 408
Sport and Recreation Facilities 14 091 – 409 – 9 200 9 200 – – –
Community Assets 25 189 – 409 – 9 200 9 200 46 294 29 559 15 408
Operational Buildings 1 816 – – – – – – – –
Other Assets 1 816 – – – – – – – –
Furniture and Office Equipment 1 585 4 593 19 869 – 10 429 10 429 – – –
Machinery and Equipment – – 856 – – – – – –
Transport Assets – 16 437 2 923 – – – – – –
Land – 1 393 – – – – – – –
Total Renewal of Existing Assets 2 – 20 673 795 16 787 18 703 18 703 – – –
Electrical Infrastructure – 14 352 795 16 787 18 703 18 703 – – –
Solid Waste Infrastructure – 1 029 – – – – – – –
Infrastructure – 15 381 795 16 787 18 703 18 703 – – –
Community Facilities – 5 292 – – – – – – –
Community Assets – 5 292 – – – – – – –
Total Upgrading of Existing Assets 6 – 83 416 73 907 77 000 87 000 87 000 – – –
Roads Infrastructure – 82 518 73 907 77 000 87 000 87 000 – – –
Infrastructure – 82 518 73 907 77 000 87 000 87 000 – – –
Sport and Recreation Facilities – 898 – – – – – – –
Community Assets – 898 – – – – – – –
Total Capital Expenditure 4 252 614 216 725 210 410 281 797 313 341 313 341 279 801 305 559 324 408
Roads Infrastructure 95 245 82 518 73 907 77 000 87 000 87 000 62 600 98 000 91 000
Storm water Infrastructure – – – – – – – – –
Electrical Infrastructure 22 000 14 352 795 16 787 18 703 18 703 7 697 40 000 45 000
Water Supply Infrastructure 86 271 77 158 87 610 135 000 135 000 135 000 97 400 65 000 85 000
Sanitation Infrastructure 20 509 13 055 24 040 53 010 53 010 53 010 65 810 73 000 88 000
Solid Waste Infrastructure – 1 029 – – – – – – –
Infrastructure 224 024 188 113 186 352 281 797 293 713 293 713 233 507 276 000 309 000
Community Facilities 11 098 5 292 – – – – 46 294 29 559 15 408
Sport and Recreation Facilities 14 091 898 409 – 9 200 9 200 – – –
Community Assets 25 189 6 190 409 – 9 200 9 200 46 294 29 559 15 408
Operational Buildings 1 816 – – – – – – – –
Other Assets 1 816 – – – – – – – –
Furniture and Office Equipment 1 585 4 593 19 869 – 10 429 10 429 – – –
Machinery and Equipment – – 856 – – – – – –
Transport Assets – 16 437 2 923 – – – – – –
Land – 1 393 – – – – – – –
Zoo's, Marine and Non-biological Animals – – – – – – – – –
TOTAL CAPITAL EXPENDITURE - Asset class 252 614 216 725 210 410 281 797 313 341 313 341 279 801 305 559 324 408
Current Year 2019/202020/21 Medium Term Revenue & Expenditure
Framework

Madibeng Local Municipality 2020/21 /Final Annual Budget and MTREF
39 | P a g e
Explanatory notes to Table A9 - Asset Management
1. Table A9 provides an overview of municipal capital allocations to building new assets and the renewal of existing assets, as well as spending on repairs and maintenance by asset class.
2. National Treasury has recommended that municipalities should allocate at least 40 per cent of their capital budget to the renewal of existing assets, and allocations to repairs and maintenance should be 8 per cent of PPE.
3. The following graph provides an analysis between depreciation and operational repairs and maintenance over the MTREF. It highlights the municipality’s strategy to address the maintenance backlog
Figure 4 Depreciation in relation to repairs and maintenance over the MTREF
Description Ref 2016/17 2017/18 2018/19
R thousandAudited
Outcome
Audited
Outcome
Audited
Outcome
Original
Budget
Adjusted
Budget
Full Year
Forecast
Budget Year
2020/21
Budget Year
+1 2021/22
Budget Year
+2 2022/23
ASSET REGISTER SUMMARY - PPE (WDV) 5 5 687 345 5 431 568 6 499 960 6 478 509 6 478 509 5 561 745 6 652 719 6 750 660 6 960 000
Roads Infrastructure 701 892 1 577 565 1 283 101 77 000 99 200 99 200 62 600 98 000 91 000
Storm water Infrastructure – 18 848 35 023 – – – – – –
Electrical Infrastructure 869 219 1 712 003 2 999 467 5 938 489 5 903 598 4 986 835 6 119 123 6 378 650 6 571 000
Water Supply Infrastructure 555 587 649 788 705 038 135 000 96 743 96 743 97 400 65 000 85 000
Sanitation Infrastructure 238 225 75 873 86 858 53 010 82 074 82 074 65 810 73 000 88 000
Solid Waste Infrastructure 18 021 1 320 290 – – – – – –
Rail Infrastructure – 2 575 2 575 – – – – – –
Coastal Infrastructure 2 795 386
Information and Communication Infrastructure –
Infrastructure 5 178 329 4 037 972 5 112 352 6 203 499 6 181 615 5 264 852 6 344 933 6 614 650 6 835 000
Community Assets 88 117 291 548 275 320 – 11 200 11 200 32 775 16 000 –
Heritage Assets 10 10 10 10 10 10 10 10 –
Investment properties 300 653 168 005 100 370 275 000 275 000 275 000 275 000 120 000 125 000
Other Assets 99 723 10 372 11 790 – – – – – –
Biological or Cultivated Assets
Intangible Assets – – 3 964 – – – – – –
Computer Equipment 1 065 12 861 (8 109) – – – – – –
Furniture and Office Equipment – 15 911 30 553 – 10 683 10 683 – – –
Machinery and Equipment – 6 608 7 464 – – – – – –
Transport Assets 19 448 16 437 19 360 – – – – – –
Land – 871 844 946 886 – – – – – –
Zoo's, Marine and Non-biological Animals –
TOTAL ASSET REGISTER SUMMARY - PPE (WDV) 5 5 687 345 5 431 568 6 499 960 6 478 509 6 478 509 5 561 745 6 652 719 6 750 660 6 960 000
EXPENDITURE OTHER ITEMS 579 708 571 154 568 744 577 710 598 566 598 566 567 145 589 454 604 196
Depreciation 7 458 952 474 336 474 165 490 000 490 000 490 000 475 000 491 790 498 796
Repairs and Maintenance by Asset Class 3 120 756 96 818 94 580 87 710 108 566 108 566 92 145 97 664 105 400
Roads Infrastructure 11 070 1 625 2 665 6 600 4 600 4 600 6 600 6 917 7 249
Electrical Infrastructure 22 000 26 410 38 881 26 000 33 950 33 950 31 200 32 698 34 267
Water Supply Infrastructure 44 550 54 283 37 618 35 800 51 174 51 174 31 200 32 698 37 267
Sanitation Infrastructure 27 000 7 694 12 405 10 000 10 055 10 055 13 000 13 672 14 376
Solid Waste Infrastructure – 148 252 800 800 800 800 838 879
Information and Communication Infrastructure – 257 – 3 000 1 000 1 000 1 500 2 096 2 197
Infrastructure 104 620 90 417 91 821 82 200 101 579 101 579 84 300 88 918 96 234
Community Facilities 5 250 2 588 745 2 600 2 600 2 600 2 100 2 725 2 856
Sport and Recreation Facilities – – – 30 29 29 10 10 11
Community Assets 5 250 2 588 745 2 630 2 629 2 629 2 110 2 735 2 867
Operational Buildings 10 886 26 – 70 68 68 70 73 77
Housing – – – – – – – – –
Other Assets 10 886 26 – 70 68 68 70 73 77
Machinery and Equipment – 492 699 1 810 1 810 1 810 2 665 2 793 2 927
Transport Assets – 3 294 1 314 1 000 2 480 2 480 3 000 3 144 3 295
TOTAL EXPENDITURE OTHER ITEMS 579 708 571 154 568 744 577 710 598 566 598 566 567 145 589 454 604 196
Renewal and upgrading of Existing Assets as % of total capex 0,0% 48,0% 35,5% 33,3% 33,7% 33,7% 0,0% 0,0% 0,0%
Renewal and upgrading of Existing Assets as % of deprecn 0,0% 21,9% 15,8% 19,1% 21,6% 21,6% 0,0% 0,0% 0,0%
R&M as a % of PPE 2,1% 1,8% 1,8% 1,4% 1,8% 1,8% 1,4% 1,5% 1,5%
Renewal and upgrading and R&M as a % of PPE 2,0% 4,0% 3,0% 3,0% 3,0% 4,0% 1,0% 1,0% 2,0%
Current Year 2019/202020/21 Medium Term Revenue & Expenditure
Framework
2016/17 2017/18 2018/19 2019/20 2020/21 2021/22 2022/23
Repairs & Maintenance 122068 563 96817 959 94579 548 90042 436 92145 000 97663 960 105399 827
Depreciation 458952 088 474335 992 474164 689 490000 000 485000 000 491790 048498795 969
–
200000 000
400000 000
600000 000
800000 000
Rm
Depreciation Repairs & Maintenance
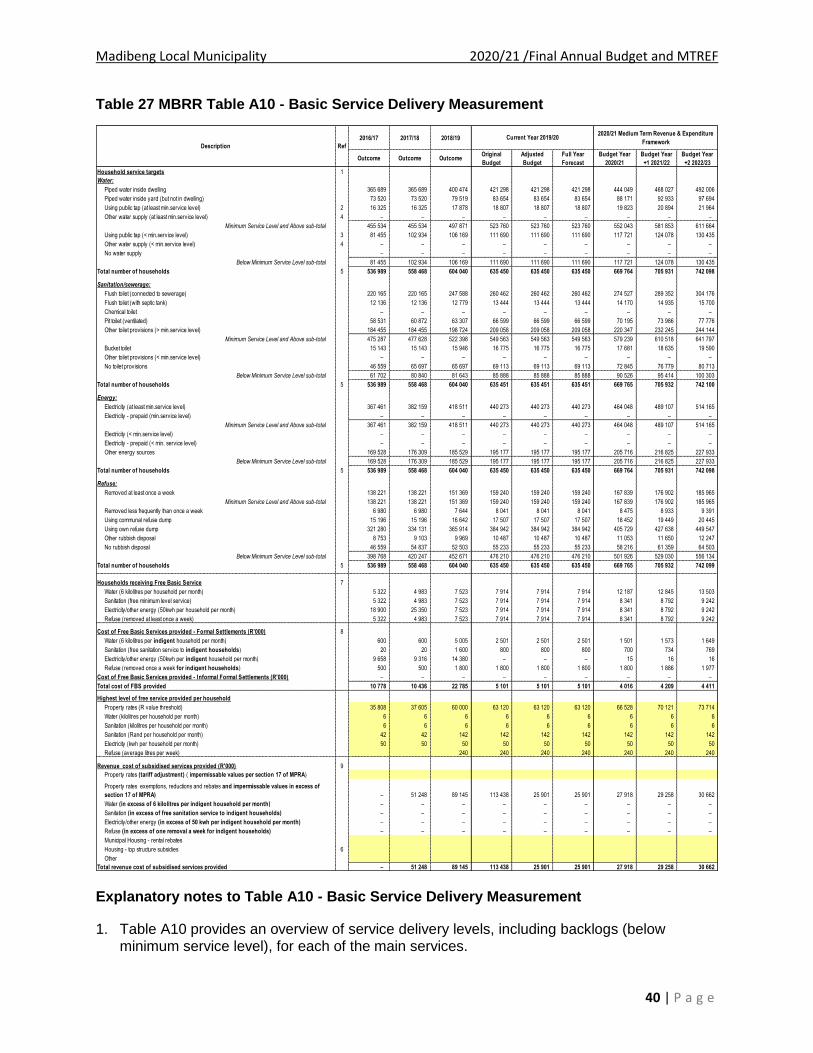
Madibeng Local Municipality 2020/21 /Final Annual Budget and MTREF
40 | P a g e
Table 27 MBRR Table A10 - Basic Service Delivery Measurement
Explanatory notes to Table A10 - Basic Service Delivery Measurement
1. Table A10 provides an overview of service delivery levels, including backlogs (below minimum service level), for each of the main services.
2016/17 2017/18 2018/19
Outcome Outcome OutcomeOriginal
Budget
Adjusted
Budget
Full Year
Forecast
Budget Year
2020/21
Budget Year
+1 2021/22
Budget Year
+2 2022/23
Household service targets 1
Water:
Piped water inside dwelling 365 689 365 689 400 474 421 298 421 298 421 298 444 049 468 027 492 006
Piped water inside yard (but not in dwelling) 73 520 73 520 79 519 83 654 83 654 83 654 88 171 92 933 97 694
Using public tap (at least min.service level) 2 16 325 16 325 17 878 18 807 18 807 18 807 19 823 20 894 21 964
Other water supply (at least min.service level) 4 – – – – – – – – –
Minimum Service Level and Above sub-total 455 534 455 534 497 871 523 760 523 760 523 760 552 043 581 853 611 664
Using public tap (< min.service level) 3 81 455 102 934 106 169 111 690 111 690 111 690 117 721 124 078 130 435
Other water supply (< min.service level) 4 – – – – – – – – –
No water supply – – – – – – – – –
Below Minimum Service Level sub-total 81 455 102 934 106 169 111 690 111 690 111 690 117 721 124 078 130 435
Total number of households 5 536 989 558 468 604 040 635 450 635 450 635 450 669 764 705 931 742 098
Sanitation/sewerage:
Flush toilet (connected to sewerage) 220 165 220 165 247 588 260 462 260 462 260 462 274 527 289 352 304 176
Flush toilet (with septic tank) 12 136 12 136 12 779 13 444 13 444 13 444 14 170 14 935 15 700
Chemical toilet – – – – – – – – –
Pit toilet (ventilated) 58 531 60 872 63 307 66 599 66 599 66 599 70 195 73 986 77 776
Other toilet provisions (> min.service level) 184 455 184 455 198 724 209 058 209 058 209 058 220 347 232 245 244 144
Minimum Service Level and Above sub-total 475 287 477 628 522 398 549 563 549 563 549 563 579 239 610 518 641 797
Bucket toilet 15 143 15 143 15 946 16 775 16 775 16 775 17 681 18 635 19 590
Other toilet provisions (< min.service level) – – – – – – – – –
No toilet provisions 46 559 65 697 65 697 69 113 69 113 69 113 72 845 76 779 80 713
Below Minimum Service Level sub-total 61 702 80 840 81 643 85 888 85 888 85 888 90 526 95 414 100 303
Total number of households 5 536 989 558 468 604 040 635 451 635 451 635 451 669 765 705 932 742 100
Energy:
Electricity (at least min.service level) 367 461 382 159 418 511 440 273 440 273 440 273 464 048 489 107 514 165
Electricity - prepaid (min.service level) – – – – – – – – –
Minimum Service Level and Above sub-total 367 461 382 159 418 511 440 273 440 273 440 273 464 048 489 107 514 165
Electricity (< min.service level) – – – – – – – – –
Electricity - prepaid (< min. service level) – – – – – – – – –
Other energy sources 169 528 176 309 185 529 195 177 195 177 195 177 205 716 216 825 227 933
Below Minimum Service Level sub-total 169 528 176 309 185 529 195 177 195 177 195 177 205 716 216 825 227 933
Total number of households 5 536 989 558 468 604 040 635 450 635 450 635 450 669 764 705 931 742 098
Refuse:
Removed at least once a week 138 221 138 221 151 369 159 240 159 240 159 240 167 839 176 902 185 965
Minimum Service Level and Above sub-total 138 221 138 221 151 369 159 240 159 240 159 240 167 839 176 902 185 965
Removed less frequently than once a week 6 980 6 980 7 644 8 041 8 041 8 041 8 475 8 933 9 391
Using communal refuse dump 15 196 15 196 16 642 17 507 17 507 17 507 18 452 19 449 20 445
Using own refuse dump 321 280 334 131 365 914 384 942 384 942 384 942 405 729 427 638 449 547
Other rubbish disposal 8 753 9 103 9 969 10 487 10 487 10 487 11 053 11 650 12 247
No rubbish disposal 46 559 54 837 52 503 55 233 55 233 55 233 58 216 61 359 64 503
Below Minimum Service Level sub-total 398 768 420 247 452 671 476 210 476 210 476 210 501 926 529 030 556 134
Total number of households 5 536 989 558 468 604 040 635 450 635 450 635 450 669 765 705 932 742 099
Households receiving Free Basic Service 7
Water (6 kilolitres per household per month) 5 322 4 983 7 523 7 914 7 914 7 914 12 187 12 845 13 503
Sanitation (free minimum level service) 5 322 4 983 7 523 7 914 7 914 7 914 8 341 8 792 9 242
Electricity/other energy (50kwh per household per month) 18 900 25 350 7 523 7 914 7 914 7 914 8 341 8 792 9 242
Refuse (removed at least once a week) 5 322 4 983 7 523 7 914 7 914 7 914 8 341 8 792 9 242
Cost of Free Basic Services provided - Formal Settlements (R'000) 8
Water (6 kilolitres per indigent household per month) 600 600 5 005 2 501 2 501 2 501 1 501 1 573 1 649
Sanitation (free sanitation service to indigent households) 20 20 1 600 800 800 800 700 734 769
Electricity/other energy (50kwh per indigent household per month) 9 658 9 316 14 380 – – – 15 16 16
Refuse (removed once a week for indigent households) 500 500 1 800 1 800 1 800 1 800 1 800 1 886 1 977
Cost of Free Basic Services provided - Informal Formal Settlements (R'000) – – – – – – – – –
Total cost of FBS provided 10 778 10 436 22 785 5 101 5 101 5 101 4 016 4 209 4 411
Highest level of free service provided per household
Property rates (R value threshold) 35 808 37 605 60 000 63 120 63 120 63 120 66 528 70 121 73 714
Water (kilolitres per household per month) 6 6 6 6 6 6 6 6 6
Sanitation (kilolitres per household per month) 6 6 6 6 6 6 6 6 6
Sanitation (Rand per household per month) 42 42 142 142 142 142 142 142 142
Electricity (kwh per household per month) 50 50 50 50 50 50 50 50 50
Refuse (average litres per week) 240 240 240 240 240 240 240
Revenue cost of subsidised services provided (R'000) 9
Property rates (tariff adjustment) ( impermissable values per section 17 of MPRA)
Property rates exemptions, reductions and rebates and impermissable values in excess of
section 17 of MPRA) – 51 248 89 145 113 438 25 901 25 901 27 918 29 258 30 662
Water (in excess of 6 kilolitres per indigent household per month) – – – – – – – – –
Sanitation (in excess of free sanitation service to indigent households) – – – – – – – – –
Electricity/other energy (in excess of 50 kwh per indigent household per month) – – – – – – – – –
Refuse (in excess of one removal a week for indigent households) – – – – – – – – –
Municipal Housing - rental rebates
Housing - top structure subsidies 6
Other
Total revenue cost of subsidised services provided – 51 248 89 145 113 438 25 901 25 901 27 918 29 258 30 662
Current Year 2019/202020/21 Medium Term Revenue & Expenditure
FrameworkDescription Ref

Madibeng Local Municipality 2020/21 /Final Annual Budget and MTREF
41 | P a g e
2 Part 2 – Supporting Documentation
2.1 Overview of the annual budget process Section 53 of the MFMA requires the Mayor of the municipality to provide general political guidance in the budget process and the setting of priorities that must guide the preparation of the budget. In addition Chapter 2 of the Municipal Budget and Reporting Regulations states that the Mayor of the municipality must establish a Budget Steering Committee to provide technical assistance to the Mayor in discharging the responsibilities set out in section 53 of the Act. The Budget Steering Committee consists of the Municipal Manager and senior officials of the municipality meeting under the chairpersonship of the MMC for Finance. The primary aims of the Budget Steering Committee is to ensure:
that the process followed to compile the budget complies with legislation and good budget practices;
that there is proper alignment between the policy and service delivery priorities set out in the Municipality’s IDP and the budget, taking into account the need to protect the financial sustainability of municipality;
that the municipality’s revenue and tariff setting strategies ensure that the cash resources needed to deliver services are available; and
that the various spending priorities of the different municipal departments are properly evaluated and prioritised in the allocation of resources.
2.1.1 Budget Process Overview
In terms of section 21 of the MFMA the Mayor is required to table in Council ten months before the start of the new financial year (i.e. in August 2019) a time schedule that sets out the process to revise the IDP and prepare the budget. The Mayor tabled in Council the required the IDP and budget time schedule on 28 August 2019. Key dates applicable to the process were:
• August 2019 – Joint strategic planning session of the Mayoral Committee and Executive Management. Aim: to review past performance trends of the capital and operating budgets, the economic realities and to set the prioritisation criteria for the compilation of the 2020/21MTREF;
• November 2019 – Detail departmental budget proposals (capital and operating) submitted to the Budget and Treasury Office for consolidation and assessment against the financial planning guidelines;
• January 2020 - Review of the financial strategy and key economic and financial planning assumptions by the Budget Steering Committee. This included financial forecasting and scenario considerations;
• January 2020 – Multi-year budget proposals are submitted to the Mayoral Committee for endorsement;
Madibeng Local Municipality 2020/21 /Final Annual Budget and MTREF
42 | P a g e
• January 2020 - Council considers the 2019/20 Mid-year Review and Adjustments Budget;
• February 2020 - Recommendations of the Mayoral Committee are communicated to the Budget Steering Committee, and on to the respective departments. The Final 2020/21 MTREF is revised accordingly;
• March 2020 - Tabling in Council of the Draft 2020/21 IDP and 2020/21 MTREF for public
consultation;
• April 2020 – Public and National and Provincial Treasury Consultation ;
• May 2020 - Closing date for written comments;
• May 2020 – finalisation of the 2020/21 IDP and 2020/21MTREF, taking into consideration comments received from the public, comments from National Treasury, and updated information from the most recent Division of Revenue Bill and financial framework; and
• May 2020 - Tabling of the 2020/21 MTREF before Council for consideration and approval.
There has been deviations from the key dates set out in the Budget Time Schedule tabled in Council:
1. The municipality had to pass a special adjustment budget in November 2019 due the budget not been funded and also a financial plan was developed because the budget could be funded. The purpose of the financial plan was to assist municipality to achieve a funded budget.
2. Due to the special adjustment in November 2019 the municipality could not revise again the budget in February 2020.
3. A second special Adjustment was done in the month of June 2020 due to expenditure in relation to covid-19
4. During March 2020 the country went on lockdown due to corona virus pandemic, hence the mayor could not table the draft budget. The Draft budget was tabled in the beginning of June 2020 after lockdown regulation where eased.
5. Ward per ward community consultation could not be done due to lockdown regulations but what the municipality did was to advertise the Draft budget on local newspapers and all social media platforms that the municipality has access to. Written comments were received from the community. Provincial and national treasury consultation was also done.
6. The Final budget was also approved in the month of June 2020
2.1.2 IDP and Service Delivery and Budget Implementation Plan
This is the last review of the IDP as adopted by Council in May 2015. It started in September 2019 after the tabling of the IDP Process Plan and the Budget Time Schedule for the 2020/21 MTREF in August. The Municipality’s IDP is its principal strategic planning instrument, which directly guides and informs its planning, budget, management and development actions. This framework is rolled out into objectives, key performance indicators and targets for implementation which directly inform the Service Delivery and Budget Implementation Plan. The Process Plan applicable to the fourth revision cycle included the following key IDP processes and deliverables:
Madibeng Local Municipality 2020/21 /Final Annual Budget and MTREF
43 | P a g e
• Registration of community needs; • Compilation of departmental business plans including key performance indicators and
targets; • Financial planning and budgeting process; • Public participation process; • Compilation of the SDBIP, and • The review of the performance management and monitoring processes. The IDP has been taken into a business and financial planning process leading up to the 2020/21 MTREF, based on the approved 2019/20 MTREF, Mid-year Review and adjustments budget. The business planning process has subsequently been refined in the light of current economic circumstances and the resulting revenue projections. With the compilation of the 2020/21MTREF, each department/function had to review the business planning process, including the setting of priorities and targets after reviewing the mid-year and third quarter performance against the 2019/20 Departmental Service Delivery and Budget Implementation Plan. Business planning links back to priority needs and master planning, and essentially informed the detail operating budget appropriations and three-year capital programme.
2.1.3 Financial Modelling and Key Planning Drivers
As part of the compilation of the 2020/21 MTREF, extensive financial modelling was undertaken to ensure affordability and long-term financial sustainability. The following key factors and planning strategies have informed the compilation of the 2020/21 MTREF: • Municipality growth • Policy priorities and strategic objectives • Asset maintenance • Economic climate and trends (i.e. inflation, Eskom increases, household debt, migration
patterns) • Performance trends • The approved 2019/20 adjustments budget and performance against the SDBIP • Cash Flow Management Strategy • Debtor payment levels • Investment possibilities • The need for tariff increases versus the ability of the community to pay for services; • Improved and sustainable service delivery In addition to the above, the strategic guidance given in National Treasury’s MFMA Circulars 93, 94, 98 and 99 has been taken into consideration in the planning and prioritisation process.
2.1.4 Community Consultation
The Draft 2021/21 MTREF as tabled before Council on June 2020 for community consultation and ward based community consultation was not done but the budget was published on the municipality’s website, local newspapers, social media, radio and hard copies were made available at customer care offices, municipal notice boards and various libraries. Wards community consultation was not held due to lockdown regulation. Nevertheless we received community inputs through emails and radio interview. Submissions received during the community consultation process and additional information regarding revenue

Madibeng Local Municipality 2020/21 /Final Annual Budget and MTREF
44 | P a g e
and expenditure and individual capital projects were addressed, and where relevant considered as part of the finalisation of the 2020/21 MTREF. All documents in the appropriate format (electronic and printed) will provided to National Treasury, and other national and provincial departments in accordance with section 23 of the MFMA, to provide an opportunity for them to make inputs.
2.2 Overview of alignment of annual budget with IDP The Constitution mandates local government with the responsibility to exercise local developmental and cooperative governance. The eradication of imbalances in South African society can only be realized through a credible integrated developmental planning process. Municipalities in South Africa need to utilise integrated development planning as a method to plan future development in their areas and so find the best solutions to achieve sound long-term development goals. A municipal IDP provides a five year strategic programme of action aimed at setting short, medium and long term strategic and budget priorities to create a development platform, which correlates with the term of office of the political incumbents. The plan aligns the resources and the capacity of a municipality to its overall development aims and guides the municipal budget. An IDP is therefore a key instrument which municipalities use to provide vision, leadership and direction to all those that have a role to play in the development of a municipal area. The IDP enables municipalities to make the best use of scarce resources and speed up service delivery.
The Constitution requires local government to relate its management, budgeting and planning functions to its objectives. This gives a clear indication of the intended purposes of municipal integrated development planning. Legislation stipulates clearly that a municipality must not only give effect to its IDP, but must also conduct its affairs in a manner which is consistent with its IDP. The following table highlights the IDP’s six strategic objectives or key performance areas for the 2020/21 MTREF and further planning refinements that have directly informed the compilation of the budget: Table 28 IDP Strategic Objectives
In order to ensure integrated and focused service delivery between all spheres of government it was important for the Municipality to align its budget priorities with that of national and provincial government. All spheres of government place a high priority on infrastructure development, economic development and job creation, efficient service delivery, poverty alleviation and building sound institutional arrangements.
KPA KPA Description
KPA 1 TRANSFORMATION AND ORGANISATIONAL DEVELOPMENT
KPA 2 GOOD GOVERNANCE
KPA 3 LOCAL ECONOMIC DEVELOPMENT
KPA 4 FINANCIAL VIABILITY
KPA 5 BASIC SERVICE DELIVERY AND INFRASTRUCTURE
KPA 6 MUNICIPAL TRANSFORMATION & INSTITUTIONAL DEVELOPMENT

Madibeng Local Municipality 2020/21 /Final Annual Budget and MTREF
45 | P a g e
Local priorities were identified as part of the IDP review process which is directly aligned to that of the national and provincial priorities. The key performance areas can be summarised as follows against the five strategic objectives:
1. Provision of quality basic services and infrastructure which includes, amongst others: o Provide electricity; o Provide water; o Provide sanitation; o Provide waste removal; o Provide housing; o Provide roads and storm water; o Provide public transport; o Provide city planning services; and o Maintaining the infrastructure of the municipality.
2. Economic growth and development that leads to sustainable job creation by:
o Ensuring the is a clear structural plan for the municipality; o Ensuring planning processes function in accordance with set timeframes; o Facilitating the use of labour intensive approaches in the delivery of services and
the building of infrastructure.
3.1 Fight poverty and build clean, healthy, safe and sustainable communities: o Effective implementation of the Indigent Policy; o Working with the provincial department of health to provide primary health care
services; o Extending waste removal services and ensuring effective city cleansing; o Ensuring all waste water treatment works are operating optimally; o Working with strategic partners such as SAPS to address crime; o Ensuring save working environments by effective enforcement of building and
health regulations; o Promote viable, sustainable communities through proper zoning; and o Promote environmental sustainability by protecting wetlands and key open spaces.
3.2 Integrated Social Services for empowered and sustainable communities o Work with provincial departments to ensure the development of community
infrastructure such as schools and clinics is properly coordinated with the informal settlements upgrade programme
4. Foster participatory democracy and Batho Pele principles through a caring, accessible and accountable service by: o Optimising effective community participation in the ward committee system; and o Implementing Batho Pele in the revenue management strategy.
5.1 Promote sound governance through:
o Publishing the outcomes of all tender processes on the municipal website
5.2 Ensure financial sustainability through: o Reviewing the use of contracted services o Continuing to implement the infrastructure renewal strategy and the repairs and
maintenance plan

Madibeng Local Municipality 2020/21 /Final Annual Budget and MTREF
46 | P a g e
5.3 Optimal institutional transformation to ensure capacity to achieve set objectives o Review of the organizational structure to optimize the use of personnel;
In line with the MSA, the IDP constitutes a single, inclusive strategic plan for the Municipality. The five-year programme responds to the development challenges and opportunities faced by the Madibeng Local Municipality by identifying the key performance areas to achieve the five the strategic objectives mentioned above. In addition to the five-year IDP, the Municipality undertakes an extensive planning and developmental strategy which primarily focuses on a longer-term horizon; 15 to 20 years. This process is aimed at influencing the development path by proposing a substantial programme of public-led investment to restructure current patterns of settlement, activity and access to resources in the Municipality so as to promote greater equity and enhanced opportunity. The strategy specifically targets future developmental opportunities in traditional dormitory settlements. It provides direction to the Municipality’s IDP, associated sectoral plans and strategies, and the allocation of resources of the Municipality and other service delivery partners. The 2020/21 MTREF has therefore been directly informed by the IDP revision process and the SA 4, 5 and 6 tables below provide a reconciliation between the IDP strategic objectives and operating revenue, operating expenditure and capital expenditure. Table 29 MBRR Table SA4 - Reconciliation between the IDP strategic objectives and budgeted revenue
Strategic Objective GoalGoal
Code2016/17 2017/18 2018/19
R thousand
Audited
Outcome
Audited
Outcome
Audited
Outcome
Original
Budget
Adjusted
Budget
Full Year
Forecast
Budget Year
2020/21
Budget Year
+1 2021/22
Budget Year
+2 2022/23
Sustainable Service - Electricity Electricity A 487 418 459 581 487 317 487 467 513 791 541 477 513 791 541 477 569 164
Sustainable Service - Water Water A 149 884 163 445 172 811 183 938 193 799 204 227 193 799 204 227 214 655
Sustainable Service - Sanitation Sanitation A 41 844 49 382 57 140 59 891 63 124 66 533 63 124 66 533 69 941
Sustainable Service - Waste Management Waste Management A 39 160 69 650 59 500 59 787 63 015 66 417 63 015 66 417 69 820
Infrastructure - Cemeteries And Parks Cemeteries And Parks A 2 307 5 068 1 333 1 292 1 362 1 436 1 362 1 436 1 509
Good Governance - Financial Management Financial Management B 911 673 883 629 982 404 1 017 263 1 110 064 1 213 142 1 110 064 1 213 142 1 316 220
Good Governance - Human Resources Human Resources B 9 310 123 1 010 1 001 1 055 1 112 1 055 1 112 1 169
Social Development Arts, Culture, Sports And Recreation B 202 186 71 60 63 66 63 66 70
Road Safety, Fire And Disaster, Security Road Safety, Fire And Disaster, Security B 13 001 23 372 11 000 14 000 14 756 15 222 14 756 15 222 15 688
Sustainable Service - Community And Others Community And Others A – – 60 83 87 92 87 92 97
Infrastructure - Roads And Stormwater Roads And Stormwater A 251 826 143 828 80 036 286 070 260 426 111 818 381 577 418 892 433 768
Environmental Management - Pollution Pollution A 2 – – – – – – – –
Total Revenue (excluding capital transfers and contributions) 1 1 906 626 1 798 264 1 852 682 2 110 852 2 221 542 2 221 542 2 342 694 2 528 617 2 692 100
Current Year 2019/202020/21 Medium Term Revenue & Expenditure
FrameworkRef

Madibeng Local Municipality 2020/21 /Final Annual Budget and MTREF
47 | P a g e
Table 30 MBRR Table SA5 - Reconciliation between the IDP strategic objectives and budgeted operating expenditure
Table 31 MBRR Table SA6 - Reconciliation between the IDP strategic objectives and budgeted capital expenditure
2.3 Measurable performance objectives and indicators Performance Management is a system intended to manage and monitor service delivery progress against the identified strategic objectives and priorities. In accordance with legislative requirements and good business practices as informed by the National Framework for Managing Programme Performance Information, the Municipality has developed and implemented a performance management system of which system is constantly refined as the integrated
Strategic Objective GoalGoal
Code2016/17 2017/18 2018/19
R thousand
Audited
Outcome
Audited
Outcome
Audited
Outcome
Original
Budget
Adjusted
Budget
Full Year
Forecast
Budget Year
2020/21
Budget Year
+1 2021/22
Budget Year
+2 2022/23
Sustainable Service - Electricity Electricity A 435 864 491 382 512 340 501 522 501 522 501 522 528 256 556 701 585 146
Sustainable Service - Water Water A 200 303 248 808 198 199 225 344 225 344 225 344 236 691 248 570 260 449
Sustainable Service - Sanitation Sanitation A 33 010 30 852 35 243 35 140 35 140 35 140 36 685 38 585 40 485
Sustainable Service - Waste Management Waste Management A 69 840 67 929 70 336 56 988 56 988 56 988 56 701 56 915 57 130
Infrastructure - Cemeteries And Parks Cemeteries And Parks A 27 959 37 593 28 103 28 862 28 862 28 862 30 671 32 327 33 983
Infrastructure - Land And Housing Land And Housing A – 3 983 2 498 4 937 4 937 4 937 5 260 5 544 5 828
Good Governance - Financial Management Financial Management B 1 156 123 630 708 2 046 851 1 254 076 1 155 456 1 155 456 1 220 695 1 270 038 1 292 074
Good Governance - Human Resources Audit B – 7 766 10 407 9 920 9 920 9 920 10 561 11 132 11 702
Planning And Development Planning And Development B 26 868 47 968 40 327 45 165 45 165 45 165 48 096 50 693 53 291
Social Development Arts, Culture, Sports And Recreation B 16 116 14 821 15 881 22 382 22 382 22 382 23 823 25 110 26 396
Safety And Security Road Safety, Fire And Disaster, Security B 128 910 70 547 58 220 74 357 74 357 74 357 79 274 83 555 87 836
Sustainable Service - Health Health A 5 753 6 134 1 054 7 277 7 277 7 277 7 759 8 178 8 597
Sustainable Service - Community And Others Community And Others A 2 408 2 297 2 913 2 994 2 994 2 994 3 183 3 355 3 527
Infrastructure - Roads And Stormwater Roads And Stormwater A 72 920 372 524 62 438 64 023 136 344 136 344 78 661 89 081 97 900
Environmental Management - Pollution Pollution A 7 676 694 866 722 722 722 770 812 853
Council And Public Participation Good Governance A 85 245 80 765 85 536 90 029 90 029 90 029 95 388 100 539 105 690
Allocations to other priorities
Total Expenditure 1 2 268 996 2 114 770 3 171 212 2 423 738 2 397 440 2 397 440 2 462 474 2 581 135 2 670 888
Current Year 2019/202020/21 Medium Term Revenue & Expenditure
FrameworkRef
Strategic Objective GoalGoal
Code2016/17 2017/18 2018/19
R thousand
Audited
Outcome
Audited
Outcome
Audited
Outcome
Original
Budget
Adjusted
Budget
Full Year
Forecast
Budget Year
2020/21
Budget Year
+1 2021/22
Budget Year
+2 2022/23
Sustainable Service - Electricity Electricity A 11 519 14 352 14 725 16 787 16 787 16 787 7 697 40 000 45 000
Sustainable Service - Water Water A 75 640 77 158 120 000 135 000 135 000 135 000 97 400 65 000 85 000
Sustainable Service - Sanitation Sanitation A 29 522 13 055 35 245 53 010 53 010 53 010 65 810 73 000 88 000
Sustainable Service - Waste Management Waste Management A – 1 035 – – – – – – –
Infrastructure - Cemeteries And Parks Cemeteries And Parks A 720 488 – – – – – – –
Infrastructure - Land And Housing Land And Housing A – 93 – – – – – – –
Good Governance - Support Service Support Service B – – – – – – – – –
Good Governance - Financial Management Financial Management B 20 513 20 317 – – – – – – –
Good Governance - Human Resources Human Resources B – – – – – – – – –
Planning And Development Planning And Development B – 1 393 – – – – – – –
Social Development - Arts, Culture, Sports And Recreation Arts, Culture, Sports And
Recreation
B 2 010 924 9 500 – – – 13 626 – –
Safety And Security - Road Safety, Fire And Disaster, Security Road Safety, Fire And Disaster,
Security
B – – – – – – – 16 000 –
Good Governance - Support Service Audit A – 10 – – – – – – –
Sustainable Service - Community And Others Community And Others A 12 522 – – – – – 32 668 13 559 15 408
Infrastructure - Roads And Stormwater Roads And Stormwater A 100 168 87 815 30 939 77 000 99 719 99 719 64 281 119 441 101 592
Environmental Management - Pollution Pollution A – – – – – – – – –
Good Governance - Council And Public Participation Good Governance A – 86 – – – – – – –
Allocations to other priorities 3
Total Capital Expenditure 1 252 614 216 725 210 410 281 797 304 516 304 516 281 482 327 000 335 000
Current Year 2019/202020/21 Medium Term Revenue & Expenditure
FrameworkRef

Madibeng Local Municipality 2020/21 /Final Annual Budget and MTREF
48 | P a g e
planning process unfolds. The Municipality targets, monitors, assesses and reviews organisational performance which in turn is directly linked to individual employee’s performance. At any given time within government, information from multiple years is being considered; plans and budgets for next year; implementation for the current year; and reporting on last year's performance. Although performance information is reported publicly during the last stage, the performance information process begins when policies are being developed, and continues through each of the planning, budgeting, implementation and reporting stages. The planning, budgeting and reporting cycle can be graphically illustrated as follows:
Figure 5 Planning, budgeting and reporting cycle
The performance of the Municipality relates directly to the extent to which it has achieved success in realising its goals and objectives, complied with legislative requirements and meeting stakeholder expectations. The Municipality therefore has adopted one integrated performance management system which encompasses: • Planning (setting goals, objectives, targets and benchmarks); • Monitoring (regular monitoring and checking on the progress against plan); • Measurement (indicators of success); • Review (identifying areas requiring change and improvement);

Madibeng Local Municipality 2020/21 /Final Annual Budget and MTREF
49 | P a g e
• Reporting (what information, to whom, from whom, how often and for what purpose); and • Improvement (making changes where necessary).
The performance information concepts used by the Municipality in its integrated performance management system are aligned to the Framework of Managing Programme Performance Information issued by the National Treasury:
Figure 6 Definition of performance information concepts
SA7 table below illustrates Madibeng Local Municipality’s measurable performance objectives and indicators.
IMPAC
TS
OUTCO
MES
OUTPUTS
INPUTS
ACTIVITIES
The developmental results of achieving specific outcomes
The medium-term results for specific beneficiaries that are
the consequence of achieving specific outputs
The final products, or goods and services produced for
delivery
The processes or actions that use a range of inputs to
produce the desired outputs and ultimately outcomes
The resources that contribute to the
production and delivery of outputs
What we use to do the
work?
What we do?
What we produce or
deliver?
What we wish to
achieve?
What we aim to
change?
Plan, budget,
implement and
monitor
Manage towards
achieving these
results

Madibeng Local Municipality 2020/21 /Final Annual Budget and MTREF
50 | P a g e
Table 32 MBRR Table SA7 - Measurable performance objectives
2016/17 2017/18 2018/19
Audited
Outcome
Audited
Outcome
Audited
Outcome
Original
Budget
Adjusted
Budget
Full Year
Forecast
Budget Year
2020/21
Budget Year
+1 2021/22
Budget Year
+2 2022/23
06 - Infrastructure And Technical Services
Electricity
Electricity Distribution
Electricity (At Least Min.Service Level) Households 65 130 137 144 144 144 152 160 168
Electricity - Prepaid (Min.Service Level) Households (39) 65 69 72 72 72 76 80 84
Electricity/Other Energy Rand Value 18 831 472 396 497 433 523 300 523 300 523 300 551 558 581 342 611 126
Electricity/Other Energy (50kwh Per Household Per
Month)
Households (9) 32 33 35 35 35 37 39 41
Electricity/Other Energy (50kwh Per Household Per
Month)
Rand Value 18 831 11 874 12 503 13 153 13 153 13 153 13 864 14 612 15 361
Other Energy Sources Households – – – – – – – – –
Electricity distribution losses Percentage – 0 0 0 0 0 0 0 0
High mast lights energized Number – 0 0 0 0 0 0 0 0
Waste Water Management
Sewerage
Bucket Toilet Households (41) 6 6 6 6 6 7 7 7
Flush Toilet (Connected To Sewerage) Households 44 44 46 48 48 48 51 54 57
Flush Toilet (With Septic Tank) Households 2 80 84 89 89 89 93 98 103
No Toilet Provisions Households 19 31 33 35 35 35 37 38 40
Sanitation Rand Value (1 195) 37 583 39 575 41 633 41 633 41 633 43 881 46 250 48 620
Sanitation (Free Minimum Level Service) Households 7 7 7 8 8 8 8 9 9
Sanitation (Free Sanitation Service) Rand Value 285 227 239 251 251 251 265 279 294
Number of new households connected to
water borne sanitation
Number 4 4 5 5 5 5 5 5
Water
Water Distribution
Households with access to basic level of
water
Number
Piped Water Inside Dwelling Households 10 36 38 40 40 40 42 44 46
Piped Water Inside Yard (But Not In Dwelling) Households 101 98 103 109 109 109 115 121 127
Using Public Tap (< Min.Service Level) Households 31 27 28 30 30 30 31 33 35
Using Public Tap (At Least Min.Service
Level)
Households (15) – – – – – – – –
Water Rand Value 4 681 150 378 158 348 166 582 166 582 166 582 175 577 185 058 194 540
Water (6 Kilolitres Per Household Per Month) Households 17 7 8 8 8 8 8 9 9
Water (6 Kilolitres Per Household Per Month) Rand Value 449 422 445 468 468 468 493 520 546
07 - Community Services
Waste Management
Solid Waste
No Rubbish Disposal Households 30 113 118 125 125 125 131 138 146
Other Rubbish Disposal Households 3 – – – – – – – –
Refuse Rand Value 4 385 32 553 34 278 36 061 36 061 36 061 38 008 40 060 42 113
Refuse (Removed At Least Once A Week) Households 7 3 612 3 803 4 001 4 001 4 001 4 217 4 445 4 673
Refuse (Removed Once A Week) Rand Value 4 385 41 44 46 46 46 48 51 54
Removed At Least Once A Week Households 35 2 2 2 2 2 2 3 3
Removed Less Frequently Than Once A
Week
Households 25 5 5 5 5 5 5 6 6
Using Communal Refuse Dump Households 9 96 101 107 107 107 112 118 124
Using Own Refuse Dump Households 192 – – – – – – –
08 - Human Settlement
Housing
Housing
Property Rates (Other Exemptions
Reductions And Rebates)
Rand Value 60 600 – – – – – – – –
Property Rates (R15 000 Threshold Rebate) Rand Value 717 717 717 754 754 754 795 838 881
Unit of measurementDescription
Current Year 2019/202020/21 Medium Term Revenue & Expenditure
Framework

Madibeng Local Municipality 2020/21 /Final Annual Budget and MTREF
51 | P a g e
The following table sets out the municipalities main performance objectives and benchmarks for the 2020/21 MTREF. Table 33 MBRR Table SA8 - Performance indicators and benchmarks
2016/17 2017/18 2018/19
Audited
Outcome
Audited
Outcome
Audited
Outcome
Original
Budget
Adjusted
Budget
Full Year
Forecast
Pre-audit
outcome
Budget Year
2020/21
Budget Year
+1 2021/22
Budget Year
+2 2022/23
Borrowing Management
Credit Rating
Capital Charges to Operating Expenditure Interest & Principal Paid /Operating
Expenditure
6,0% 6,4% 0,1% 5,8% 5,9% 5,9% 0,0% 5,5% 5,5% 5,3%
Capital Charges to Own Revenue Finance charges & Repayment of borrowing
/Own Revenue
11,9% 13,3% 0,4% 12,4% 11,6% 11,6% 0,0% 10,6% 10,6% 10,2%
Borrowed funding of 'own' capital expenditure Borrowing/Capital expenditure excl. transfers
and grants and contributions
554,2% 431,8% 0,0% 0,0% 0,0% 0,0% 0,0% 0,0% 0,0% 0,0%
Safety of Capital
Gearing Long Term Borrowing/ Funds & Reserves 0,0% 0,0% 0,0% 0,0% 0,0% 0,0% 0,0% 0,0% 0,0% 0,0%
Liquidity
Current Ratio Current assets/current liabilities 0,8 1,0 0,6 1,2 1,3 1,4 0,7 2,0 1,8 1,8
Current Ratio adjusted for aged debtors Current assets less debtors > 90 days/current
liabilities
0,8 1,0 0,6 1,2 1,3 1,4 0,7 2,0 1,8 1,8
Liquidity Ratio Monetary Assets/Current Liabilities 0,0 0,0 0,0 0,0 0,0 0,1 (0,1) 0,0 0,1 0,2
Revenue Management
Annual Debtors Collection Rate (Payment Level % ) Last 12 Mths Receipts/Last 12 Mths Billing 54,0% 100,7% 66,6% 74,7% 69,2% 72,9% 56,4% 70,0% 75,0%
Current Debtors Collection Rate (Cash receipts %
of Ratepayer & Other revenue)
55,7% 100,7% 66,6% 74,7% 69,2% 72,9% 56,4% 70,0% 75,0% 75,0%
Outstanding Debtors to Revenue Total Outstanding Debtors to Annual Revenue 31,4% 88,0% 76,8% 44,8% 42,7% 42,7% 123,3% 43,5% 37,3% 32,9%
Longstanding Debtors Recovered Debtors > 12 Mths Recovered/Total Debtors >
12 Months Old
Creditors Management
Creditors System Efficiency % of Creditors Paid Within Terms
(within`MFMA' s 65(e))
Creditors to Cash and Investments 1893,0% 1655,0% 1220,4% 2339,5% 1326,5% 570,7% 3002,7% 6459,1% 1291,1% 507,2%
Other Indicators
Total Volume Losses (kW)
Total Cost of Losses (Rand '000)
% Volume (units purchased and generated
less units sold)/units purchased and generated
Total Volume Losses (kℓ)
Total Cost of Losses (Rand '000)
% Volume (units purchased and generated
less units sold)/units purchased and generated
Employee costs Employee costs/(Total Revenue - capital
revenue)
23,9% 23,0% 28,0% 25,7% 24,5% 24,5% 34,3% 27,1% 26,6% 26,0%
Remuneration Total remuneration/(Total Revenue - capital
revenue)
25,4% 24,7% 29,6% 27,5% 26,2% 26,2% 28,6% 28,2% 27,6%
Repairs & Maintenance R&M/(Total Revenue excluding capital
revenue)
7,3% 5,4% 5,1% 4,8% 5,7% 5,7% 4,5% 4,4% 4,5%
Finance charges & Depreciation FC&D/(Total Revenue - capital revenue) 35,9% 33,6% 25,9% 34,5% 32,8% 32,8% 0,0% 30,1% 28,8% 27,2%
IDP regulation financial viability indicators
i. Debt coverage (Total Operating Revenue - Operating
Grants)/Debt service payments due within
financial year)
11,8 18,0 94,5 56,5 56,5 56,5 37,9 41,4 42,3 44,3
ii.O/S Service Debtors to Revenue Total outstanding service debtors/annual
revenue received for services
54,9% 176,0% 158,2% 80,9% 75,0% 75,0% 202,7% 80,0% 70,2% 63,3%
iii. Cost coverage (Available cash + Investments)/monthly fixed
operational expenditure
0,3 0,3 0,4 0,1 0,2 0,5 0,3 0,0 0,2 0,5
Water Distribution Losses (2)
Description of financial indicator
2020/21 Medium Term Revenue &
Expenditure FrameworkBasis of calculation
Current Year 2019/20
Electricity Distribution Losses (2)
Madibeng Local Municipality 2020/21 /Final Annual Budget and MTREF
52 | P a g e
2.3.1 Performance indicators and benchmarks
2.3.1.1 Borrowing Management
Capital expenditure in local government can be funded by capital grants, own-source revenue and long term borrowing. The ability of a municipality to raise long term borrowing is largely dependent on its creditworthiness and financial position. As with all other municipalities, Madibeng Local Municipality’s borrowing strategy is primarily informed by the affordability of debt repayments. Madibeng Local Municipality’s creditworthiness does not allow it to borrow funds to fund capital expenditure. The following financial performance indicators have formed part of the compilation of the 2020/21 MTREF: • Borrowing to asset ratio is a measure of the long-term borrowing as a percentage of the
total asset base of the municipality. • Capital charges to operating expenditure is a measure of the cost of borrowing in relation
to the operating expenditure. • Borrowing funding of own capital expenditure measures the degree to which own capital
expenditure (excluding grants and contributions) has been funded by way of borrowing.
2.3.1.2 Safety of Capital
• The debt-to-equity ratio is a financial ratio indicating the relative proportion of equity and debt used in financing the municipality’s assets. The indicator is based on the total of loans, creditors, and overdraft and tax provisions as a percentage of funds and reserves.
• The gearing ratio is a measure of the total long term borrowings over funds and reserves.
2.3.1.3 Liquidity
• Current ratio is a measure of the current assets divided by the current liabilities and as a benchmark the Municipality has set a limit of 1, hence at no point in time should this ratio be less than 1. For the 2020/21 MTREF the current ratio is 1.2 in the 2020/21 financial year and 1.6 and 2.1 for the two outer years of the MTREF. Going forward it will be necessary to maintain these levels.
• The liquidity ratio is a measure of the ability of the municipality to utilize cash and cash equivalents to extinguish or retire its current liabilities immediately. Ideally the municipality should have the equivalent cash and cash equivalents on hand to meet at least the current liabilities, which should translate into a liquidity ratio of 1. Anything below 1 indicates a shortage in cash to meet creditor obligations. For the 2019/20 financial year the ratio was 0.2 and as part of the financial planning strategy it has been decreased to 0.1 in the 2020/21 financial year. This needs to be considered a pertinent risk for the municipality as any under collection of revenue will translate into serious financial challenges for the Municipality. As part of the longer term financial planning objectives this ratio will have to be set at a minimum of 1.
2.3.1.4 Revenue Management
• As part of the financial sustainability strategy, an aggressive revenue management framework has been implemented to increase cash inflow, not only from current billings but also from debtors that are in arrears in excess of 90 days. The intention of the strategy is to streamline the revenue value chain by ensuring accurate billing, customer service, and credit control and debt collection.

Madibeng Local Municipality 2020/21 /Final Annual Budget and MTREF
53 | P a g e
2.3.1.5 Creditors Management
• The Municipality has managed to ensure that creditors are settled within the legislated 30 days of invoice. While the liquidity ratio is of concern, by applying daily cash flow management the municipality has managed to ensure a 100 per cent compliance rate to this legislative obligation. This has had a favorable impact on suppliers’ perceptions of risk of doing business with the Municipality, which is expected to benefit the Municipality in the form of more competitive pricing of tenders, as suppliers compete for the Municipality’s business.
2.3.1.6 Other Indicators
• Employee costs as a percentage of operating revenue continues to increase over the MTREF.
• Similar to that of employee costs, repairs and maintenance as percentage of operating
revenue is also decreasing owing directly to cost drivers such as bulk purchases increasing far above inflation. In real terms, repairs and maintenance has increased as part of the Municipality’s strategy to ensure the management of its asset base.
2.3.2 Free Basic Services: basic social services package for indigent households
The social package assists residents that have difficulty paying for services and are registered as indigent households in terms of the Indigent Policy of the Municipality. With the exception of water, only registered indigents qualify for the free basic services. For the 2020/21 financial year 2 484 registered indigents have been provided for in the budget with this figured increasing to 5 0000 by 2021/22. This is due to the proper capturing of indigents on the municipality’s indigent database. In terms of the Municipality’s indigent policy registered households are entitled to 6kℓ fee water, 50 kwh of electricity, 6 kℓ sanitation and free waste removal equivalent to 85ℓ once a week, as well as a discount on their property rates.
Further detail relating to the number of households receiving free basic services, the cost of free basic services, highest level of free basic services as well as the revenue cost associated with the free basic services is contained in Table 27 MBRR A10 (Basic Service Delivery Measurement). Note that the number of households in informal areas that receive free services and the cost of these services (e.g. the provision of water through stand pipes, water tankers, etc) are not taken into account in the table noted above.
2.3.3 Providing clean water and managing waste water
The Municipality is the Water Services Authority for the entire municipality in terms of the Water Services Act, 1997 and acts as water services provider. Approximately 70 per cent of the Municipality’s bulk water needs are generated from the Municipality’s own purification plant, boreholes and small dams. The remaining 30 per cent is supplied by Rand Water in the form of purified water.

Madibeng Local Municipality 2020/21 /Final Annual Budget and MTREF
54 | P a g e
The Department of Water Affairs conducts an annual performance rating of water treatment works, presenting a Blue Drop or Green Drop award respectively to potable water treatment works and waste water treatment works that meet certain criteria of excellence.
2.4 Overview of budget related-policies The proposed amendments to the budget related policies are attached as Annexure
2.4.1 Review of credit control and debt collection procedures/policies
The Collection Policy as approved by Council in May 2019 has been reviewed. While the adopted policy is credible, sustainable, manageable and informed by affordability and value for money there has been a need to review certain components to achieve a higher collection rate. Some of the possible revisions will include the lowering of the credit periods for the down payment of debt. In addition emphasis will be placed on speeding up the indigent registration process to ensure that credit control and debt collection efforts are not fruitlessly wasted on these debtors. As most of the indigents within the municipal area are unable to pay for municipal services because they are unemployed, the Integrated Indigent Exit Programme aims to link the registered indigent households to development, skills and job opportunities. The programme also seeks to ensure that all departments as well as external role players are actively involved in the reduction of the number of registered indigent households. The 2020/21 MTREF has been prepared on the basis of achieving an average debtors’ collection rate of 70 per cent on current billings. In addition the collection of debt in excess of 90 days has been prioritised as a pertinent strategy in increasing the Municipality’s cash levels. In addition, the potential of a payment incentive scheme is being investigated and if found to be viable will be incorporated into the policy.
2.4.2 Asset Management, Infrastructure Investment and Funding Policy
A proxy for asset consumption can be considered the level of depreciation each asset incurs on an annual basis. Preserving the investment in existing infrastructure needs to be considered a significant strategy in ensuring the future sustainability of infrastructure and the Municipality’s revenue base. Within the framework, the need for asset renewal was considered a priority and hence the capital programme was determined based on renewal of current assets versus new asset construction. Further, continued improvements in technology generally allows many assets to be renewed at a lesser ‘real’ cost than the original construction cost. Therefore, it is considered prudent to allow for a slightly lesser continual level of annual renewal than the average annual depreciation. The Asset Management, Infrastructure and Funding Policy is therefore considered a strategic guide in ensuring a sustainable approach to asset renewal, repairs and maintenance and is utilised as a guide to the selection and prioritisation of individual capital projects. In addition the policy prescribes the accounting and administrative policies and procedures relating to property, plant and equipment (fixed assets).

Madibeng Local Municipality 2020/21 /Final Annual Budget and MTREF
55 | P a g e
2.4.3 Budget Adjustment Policy
The adjustment budget process is governed by various provisions in the MFMA and is aimed at instilling and establishing an increased level of discipline, responsibility and accountability in the financial management practices of municipalities. To ensure that the Municipality continues to deliver on its core mandate and achieves its developmental goals, the mid-year review and adjustment budget process will be utilised to ensure that underperforming functions are identified and funds redirected to performing functions.
2.4.4 Supply Chain Management Policy
The Supply Chain Management Policy has been reviewed and a new tender document has been developed. An amended policy has be considered by Council on 30 June 2020.
2.4.5 Budget and Virement Policy
The Budget and Virement Policy aims to empower senior managers with an efficient financial and budgetary amendment and control system to ensure optimum service delivery within the legislative framework of the MFMA and the Municipality’s system of delegations.
2.4.6 Cash Management and Investment Policy
The aim of the policy is to ensure that the Municipality’s surplus cash and investments are adequately managed, especially the funds set aside for the cash backing of certain reserves. The policy details the minimum cash and cash equivalents required at any point in time and introduces time frames to achieve certain benchmarks.
2.4.7 Tariff Policies
The Municipality’s tariff policies provide a broad framework within which the Council can determine fair, transparent and affordable charges that also promote sustainable service delivery.
2.4.8 Financial Modelling and Scenario Planning Policy
The Financial Modelling and Scenario Planning Policy has directly informed the compilation of the 2020/21 MTREF with the emphasis on affordability and long-term sustainability. The policy dictates the approach to longer term financial modelling. The outcomes are then filtered into the budget process. The model and scenario planning outcomes are taken to Council every November and then translate into recommendations for the budget guidelines that inform the compilation of the next MTREF. One of the salient features of the policy is the emphasis on financial sustainability. Amongst others, the following has been modelled as part of the financial modelling and scenario planning process:
• Approved 2019/20 Adjustments Budget; • Cash Flow Management Interventions, Initiatives and Strategies (including the
cash backing of reserves);
Madibeng Local Municipality 2020/21 /Final Annual Budget and MTREF
56 | P a g e
• Economic climate and trends (i.e Inflation, household debt levels, indigent factors, growth, recessionary implications);
• Loan and investment possibilities; • Performance trends; • Tariff Increases; • The ability of the community to pay for services (affordability); • Policy priorities; • Improved and sustainable service delivery; and • Debtor payment levels.
All the above policies are available on the Municipality’s website, as well as the following budget related policies:
o Property Rates Policy; o Funding and Reserves Policy; o Borrowing Policy; o Budget Policy; and o Basic Social Services Package (Indigent Policy).
2.5 Overview of budget assumptions
2.5.1 External factors
Owing to the economic slowdown, financial resources are limited due to reduced payment levels by consumers and the impact of covid-19 pandemic which forced the country to lockdown for more than 90 days. This has resulted in declining cash inflows, which has necessitated restrained expenditure to ensure that cash outflows remain within the affordability parameters of the Municipality’s finances.
2.5.2 Collection rate for revenue services
The base assumption is that tariff and rating increases will increase at a rate slightly higher that CPI over the long term. It is also assumed that current economic conditions, and relatively controlled inflationary conditions, will continue for the forecasted term. The rate of revenue collection is currently expressed as a percentage (70 per cent) of annual billings. Cash flow is assumed to be 70 per cent of billings, plus an increased collection of arrear debt from the revised collection and credit control policy. The performance of arrear collections will however only be considered a source of additional cash in-flow once the performance has been carefully monitored.
2.5.3 Growth or decline in tax base of the municipality
Debtors’ revenue is assumed to increase at a rate that is influenced by the consumer debtors’ collection rate, tariff/rate pricing, real growth rate of the Municipality, household formation growth rate and the poor household change rate.
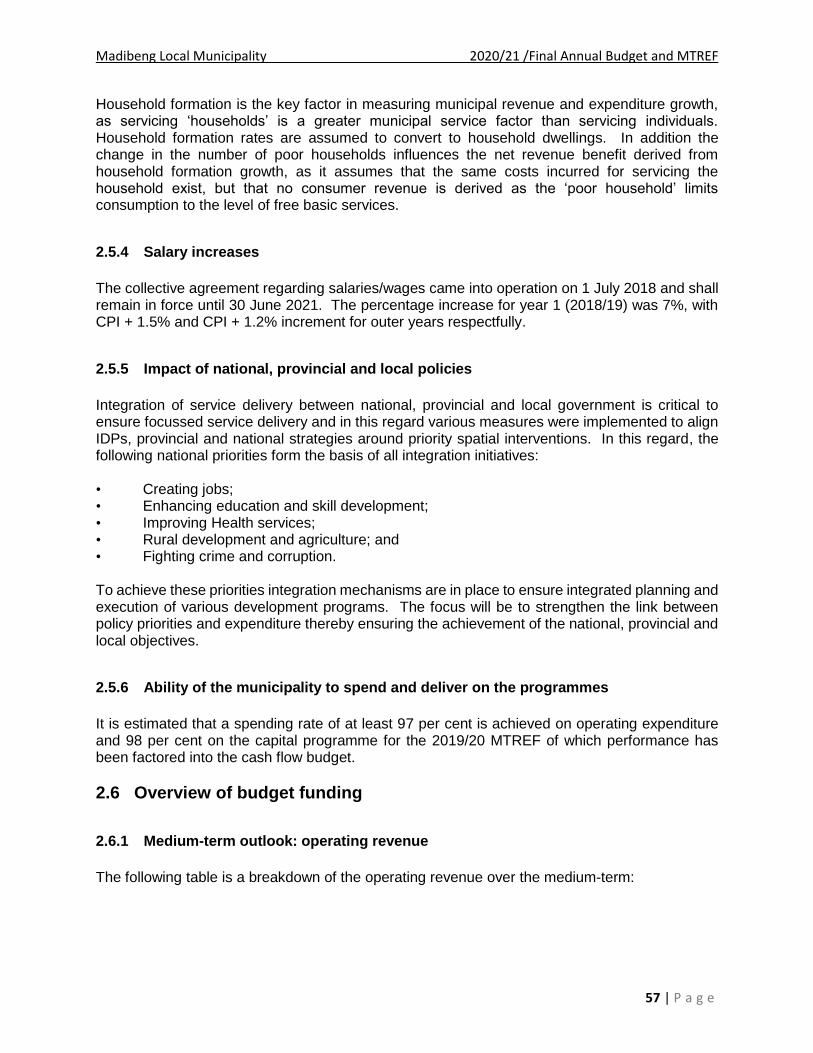
Madibeng Local Municipality 2020/21 /Final Annual Budget and MTREF
57 | P a g e
Household formation is the key factor in measuring municipal revenue and expenditure growth, as servicing ‘households’ is a greater municipal service factor than servicing individuals. Household formation rates are assumed to convert to household dwellings. In addition the change in the number of poor households influences the net revenue benefit derived from household formation growth, as it assumes that the same costs incurred for servicing the household exist, but that no consumer revenue is derived as the ‘poor household’ limits consumption to the level of free basic services.
2.5.4 Salary increases
The collective agreement regarding salaries/wages came into operation on 1 July 2018 and shall remain in force until 30 June 2021. The percentage increase for year 1 (2018/19) was 7%, with CPI + 1.5% and CPI + 1.2% increment for outer years respectfully.
2.5.5 Impact of national, provincial and local policies
Integration of service delivery between national, provincial and local government is critical to ensure focussed service delivery and in this regard various measures were implemented to align IDPs, provincial and national strategies around priority spatial interventions. In this regard, the following national priorities form the basis of all integration initiatives: • Creating jobs; • Enhancing education and skill development; • Improving Health services; • Rural development and agriculture; and • Fighting crime and corruption. To achieve these priorities integration mechanisms are in place to ensure integrated planning and execution of various development programs. The focus will be to strengthen the link between policy priorities and expenditure thereby ensuring the achievement of the national, provincial and local objectives.
2.5.6 Ability of the municipality to spend and deliver on the programmes
It is estimated that a spending rate of at least 97 per cent is achieved on operating expenditure and 98 per cent on the capital programme for the 2019/20 MTREF of which performance has been factored into the cash flow budget.
2.6 Overview of budget funding
2.6.1 Medium-term outlook: operating revenue
The following table is a breakdown of the operating revenue over the medium-term:
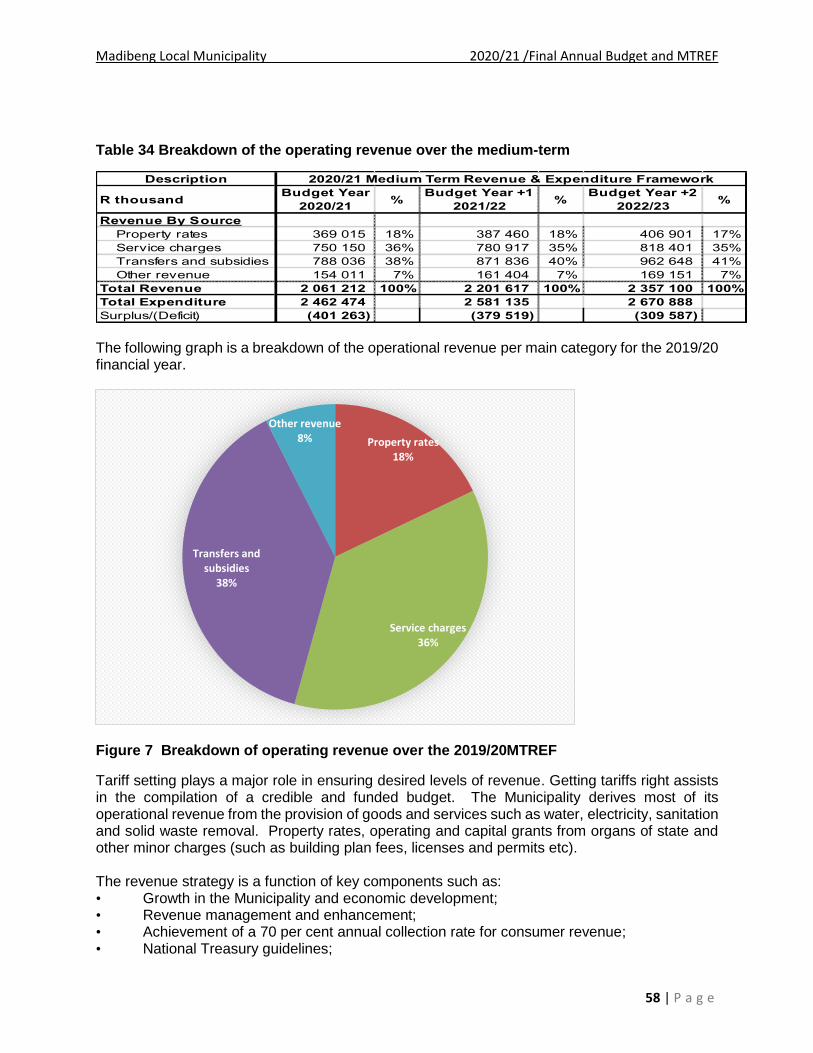
Madibeng Local Municipality 2020/21 /Final Annual Budget and MTREF
58 | P a g e
Table 34 Breakdown of the operating revenue over the medium-term
The following graph is a breakdown of the operational revenue per main category for the 2019/20 financial year.
Figure 7 Breakdown of operating revenue over the 2019/20MTREF
Tariff setting plays a major role in ensuring desired levels of revenue. Getting tariffs right assists in the compilation of a credible and funded budget. The Municipality derives most of its operational revenue from the provision of goods and services such as water, electricity, sanitation and solid waste removal. Property rates, operating and capital grants from organs of state and other minor charges (such as building plan fees, licenses and permits etc). The revenue strategy is a function of key components such as: • Growth in the Municipality and economic development; • Revenue management and enhancement; • Achievement of a 70 per cent annual collection rate for consumer revenue; • National Treasury guidelines;
Description
R thousandBudget Year
2020/21%
Budget Year +1
2021/22%
Budget Year +2
2022/23%
Revenue By Source
Property rates 369 015 18% 387 460 18% 406 901 17%
Service charges 750 150 36% 780 917 35% 818 401 35%
Transfers and subsidies 788 036 38% 871 836 40% 962 648 41%
Other revenue 154 011 7% 161 404 7% 169 151 7%
Total Revenue 2 061 212 100% 2 201 617 100% 2 357 100 100%
Total Expenditure 2 462 474 2 581 135 2 670 888
Surplus/(Deficit) (401 263) (379 519) (309 587)
2020/21 Medium Term Revenue & Expenditure Framework
Property rates18%
Service charges 36%
Transfers and subsidies
38%
Other revenue8%
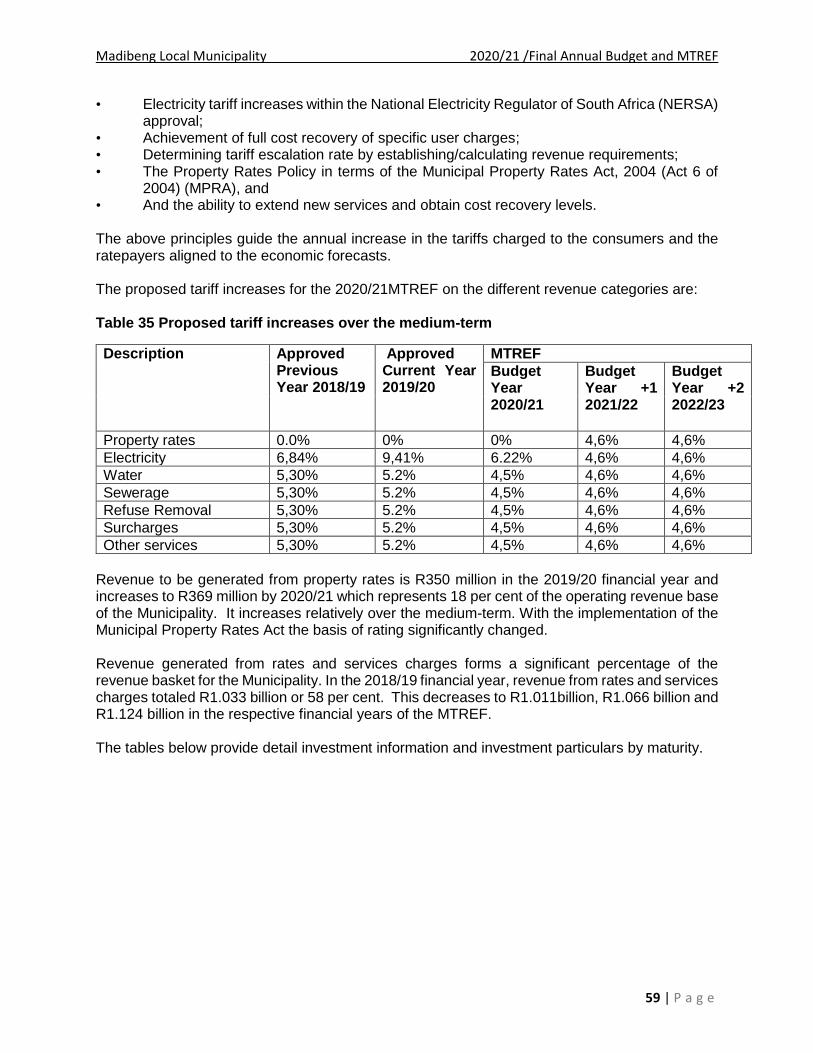
Madibeng Local Municipality 2020/21 /Final Annual Budget and MTREF
59 | P a g e
• Electricity tariff increases within the National Electricity Regulator of South Africa (NERSA) approval;
• Achievement of full cost recovery of specific user charges; • Determining tariff escalation rate by establishing/calculating revenue requirements; • The Property Rates Policy in terms of the Municipal Property Rates Act, 2004 (Act 6 of
2004) (MPRA), and • And the ability to extend new services and obtain cost recovery levels. The above principles guide the annual increase in the tariffs charged to the consumers and the ratepayers aligned to the economic forecasts. The proposed tariff increases for the 2020/21MTREF on the different revenue categories are: Table 35 Proposed tariff increases over the medium-term
Description Approved Previous Year 2018/19
Approved Current Year 2019/20
MTREF
Budget Year 2020/21
Budget Year +1 2021/22
Budget Year +2 2022/23
Property rates 0.0% 0% 0% 4,6% 4,6%
Electricity 6,84% 9,41% 6.22% 4,6% 4,6%
Water 5,30% 5.2% 4,5% 4,6% 4,6%
Sewerage 5,30% 5.2% 4,5% 4,6% 4,6%
Refuse Removal 5,30% 5.2% 4,5% 4,6% 4,6%
Surcharges 5,30% 5.2% 4,5% 4,6% 4,6%
Other services 5,30% 5.2% 4,5% 4,6% 4,6%
Revenue to be generated from property rates is R350 million in the 2019/20 financial year and increases to R369 million by 2020/21 which represents 18 per cent of the operating revenue base of the Municipality. It increases relatively over the medium-term. With the implementation of the Municipal Property Rates Act the basis of rating significantly changed. Revenue generated from rates and services charges forms a significant percentage of the revenue basket for the Municipality. In the 2018/19 financial year, revenue from rates and services charges totaled R1.033 billion or 58 per cent. This decreases to R1.011billion, R1.066 billion and R1.124 billion in the respective financial years of the MTREF. The tables below provide detail investment information and investment particulars by maturity.

Madibeng Local Municipality 2020/21 /Final Annual Budget and MTREF
60 | P a g e
Table 36 MBRR SA15 – Detail Investment Information
Table 37 MBRR SA16 – Investment particulars by maturity
2.6.2 Medium-term outlook: capital revenue
The following table is a breakdown of the funding composition of the 2020/210 medium-term capital programme:
Table 38 Sources of capital revenue over the MTREF
2016/17 2017/18 2018/19
Audited
Outcome
Audited
Outcome
Audited
Outcome
Original
Budget
Adjusted
Budget
Full Year
Forecast
Budget Year
2020/21
Budget Year
+1 2021/22
Budget Year
+2 2022/23
R thousand
Parent municipality
Securities - National Government
Listed Corporate Bonds – – – – – – – – –
Deposits - Bank
Deposits - Public Investment Commissioners
Deposits - Corporation for Public Deposits 13 817 21 516 52 502 22 800 32 800 72 800 12 800 33 900 81 000
Bankers Acceptance Certificates
Negotiable Certificates of Deposit - Banks
Guaranteed Endowment Policies (sinking) – – – – – – – – –
Repurchase Agreements - Banks
Municipal Bonds
Municipality sub-total 1 13 817 21 516 52 502 22 800 32 800 72 800 12 800 33 900 81 000
Entities
Securities - National Government
Listed Corporate Bonds
Deposits - Bank
Deposits - Public Investment Commissioners
Deposits - Corporation for Public Deposits
Bankers Acceptance Certificates
Negotiable Certificates of Deposit - Banks
Guaranteed Endowment Policies (sinking)
Repurchase Agreements - Banks
Entities sub-total – – – – – – – – –
Consolidated total: 13 817 21 516 52 502 22 800 32 800 72 800 12 800 33 900 81 000
Current Year 2019/202020/21 Medium Term Revenue & Expenditure
Framework
RefInvestment type
Investments by Maturity Period of InvestmentCapital Guarantee
(Yes/ No)
Variable or Fixed
interest rateInterest Rate ᶟ Opening balance Interest to be realised
Partial / Premature
Withdrawal (4)Investment Top Up Closing Balance
Name of institution & investment ID Yrs/Months
Parent municipality
FNB 12 Months Call Deposits Yes Fixed 5,5 N/A 56 632 16 168 (279 801) 279 801 72 800
Municipality sub-total 56 632 (279 801) 279 801 72 800
TOTAL INVESTMENTS AND INTEREST 56 632 (279 801) 279 801 72 800
Type of InvestmentExpiry date of
investment
Vote Description 2016/17 2017/18 2018/19 2019/20
R thousandAudited
Outcome
Audited
Outcome
Audited
Outcome
Adjusted
Budget
Budget Year
2020/21
Budget Year
+1 2021/22
Budget Year
+2 2022/23
Funded by:
National Government 232 101 186 967 186 736 313 398 281 482 327 000 335 000
Transfers recognised - capital 232 101 186 967 186 736 313 398 281 482 327 000 335 000
Internally generated funds 20 513 29 758 23 674 12 455 – – –
Total Capital Funding 252 614 216 725 210 410 325 853 281 482 327 000 335 000
2020/21 Medium Term Revenue &

Madibeng Local Municipality 2020/21 /Final Annual Budget and MTREF
61 | P a g e
Figure 8 Sources of capital revenue for the 2020/21 financial year
The total funding source which represents R281 million for the 2020/21 financial year and steadily increase to R327 million in 2021/22. As explained earlier, the borrowing capacity of the Municipality has essentially reached its limits. The following table is a detailed analysis of the Municipality’s borrowing liability. Table 39 MBRR Table SA 17 - Detail of borrowings
The following graph illustrates the growth in outstanding borrowing for the 2016/17 to 2022/23 period.
Figure 9 Growth in outstanding borrowing (long-term liabilities)
–
100000 000
200000 000
300000 000
400000 000
AuditedOutcome
AuditedOutcome
AuditedOutcome
AdjustedBudget
Budget Year Budget Year Budget Year
2016/17 2017/18 2018/19 2019/20 2020/21 2021/22 2022/23
National Government Internally generated funds
Borrowing - Categorised by type Ref 2016/17 2017/18 2018/19
R thousandAudited
Outcome
Audited
Outcome
Audited
Outcome
Original
Budget
Adjusted
Budget
Full Year
Forecast
Budget Year
2020/21
Budget Year
+1 2021/22
Budget Year
+2 2022/23
Parent municipality
Annuity and Bullet Loans
Long-Term Loans (non-annuity) 986 965 1 115 456 (2 013) 1 171 342 1 171 342 1 171 342 1 236 937 1 301 258 1 365 578
Total Borrowing 1 986 965 1 115 456 (2 013) 1 171 342 1 171 342 1 171 342 1 236 937 1 301 258 1 365 578
Current Year 2019/202020/21 Medium Term Revenue & Expenditure
Framework
(500000 000 )
–
500000 000
1000000 000
1500000 000
2000000 000
Long-Term Loans
2016/17 2017/18 2018/19 2019/20 2020/21 2021/22 2022/23

Madibeng Local Municipality 2020/21 /Final Annual Budget and MTREF
62 | P a g e
Table 40 MBRR Table SA 18 - Capital transfers and grant receipts
2.6.3 Cash Flow Management
Cash flow management and forecasting is a critical step in determining if the budget is funded over the medium-term. The table below is consistent with international standards of good financial management practice and also improves understandability for councillors and management. Some specific features include: • Clear separation of receipts and payments within each cash flow category; • Clear separation of capital and operating receipts from government, which also enables
cash from ‘Ratepayers and other’ to be provide for as cash inflow based on actual performance. In other words the actual collection rate of billed revenue., and
• Separation of borrowing and loan repayments (no set-off), to assist with MFMA compliance assessment regarding the use of long term borrowing (debt).
Table 41 MBRR Table A7 - Budget cash flow statement
Description Ref 2016/17 2017/18 2018/19
R thousandAudited
Outcome
Audited
Outcome
Audited
Outcome
Original
Budget
Adjusted
Budget
Full Year
Forecast
Budget Year
2020/21
Budget Year
+1 2021/22
Budget Year
+2 2022/23
Capital Transfers and Grants
National Government: 260 211 301 005 192 298 281 797 300 917 300 917 281 482 327 000 335 000
Integrated National Electrification Programme Grant 11 304 14 000 – – – – 15 200 35 000 26 000
Municipal Infrastructure Grant 248 907 287 005 186 761 281 797 281 797 281 797 266 282 292 000 309 000
Water Services Infrastructure Grant – – 5 537 – 19 120 19 120 – – –
Total Capital Transfers and Grants 5 260 211 301 005 192 298 281 797 300 917 300 917 281 482 327 000 335 000
Current Year 2019/202020/21 Medium Term Revenue & Expenditure
Framework

Madibeng Local Municipality 2020/21 /Final Annual Budget and MTREF
63 | P a g e
The above table shows that cash and cash equivalents of the municipality was largely depleted the 2018/19 financial year moving from a positive cash balance of R93.8 million to a deficit of R-175 million with the approved 2018/19 MTREF. With the 2019/20 adjustments budget various cost efficiencies and savings had to be realised to ensure the municipality could meet its operational expenditure commitments. In addition the Municipality undertook an extensive debt collection process to boost cash levels. These initiatives and interventions have translated into a positive cash position for the municipality and it is projected that cash and cash equivalents on hand will increase to R165.1 million by the financial year end. For the 2020/21 MTREF the budget has been prepared to ensure high levels of cash and cash equivalents over the medium-term with cash levels anticipated to be R23.9 million by 2020/21 and steadily increasing to R117.9 million by 2022/23.
Description Ref 2016/17 2017/18 2018/19
R thousandAudited
Outcome
Audited
Outcome
Audited
Outcome
Original
Budget
Adjusted
Budget
Full Year
Forecast
Pre-audit
outcome
Budget Year
2020/21
Budget Year
+1 2021/22
Budget Year
+2 2022/23
CASH FLOW FROM OPERATING ACTIVITIES
Receipts
Property rates 296 046 258 006 175 499 230 000 230 000 200 000 156 937 258 311 290 595 305 175
Service charges 227 842 646 403 421 053 526 000 526 000 596 000 397 294 525 105 585 688 613 801
Other revenue 32 132 36 225 31 995 29 512 65 512 65 512 9 592 18 487 19 375 20 305
Transfers and Subsidies - Operational 1 504 673 569 142 626 943 571 733 572 804 572 804 428 806 788 036 871 836 962 648
Transfers and Subsidies - Capital 1 263 056 212 007 248 918 301 005 301 005 301 005 106 603 281 482 327 000 335 000
Interest 99 646 90 896 56 620 10 500 20 000 20 000 57 537 29 367 30 762 31 467
Dividends – – – – – – – – –
Payments
Suppliers and employees (1 200 077) (1 592 069) (1 315 453) (1 308 392) (1 369 115) (1 369 115) (1 041 600) (1 657 274) (1 773 601) (1 885 119)
Finance charges (116 410) (127 974) (4 699) – – – – – –
Transfers and Grants 1 (10 000) (5 000) (5 000) (1 649) – – –
NET CASH FROM/(USED) OPERATING ACTIVITIES 106 908 92 635 240 877 350 358 341 206 381 206 113 521 243 513 351 655 383 276
CASH FLOWS FROM INVESTING ACTIVITIES
Receipts
Proceeds on disposal of PPE 6 108 – – –
Decrease (increase) in non-current receivables (16 378) – – – – – – – – –
Decrease (increase) in non-current investments (132) (253) – – – – – – – –
Payments
Capital assets (242 160) (214 830) (210 237) (301 005) (311 487) (311 487) (83 914) (281 482) (327 000) (335 000)
NET CASH FROM/(USED) INVESTING ACTIVITIES (252 563) (215 083) (210 237) (301 005) (311 487) (311 487) (83 914) (281 482) (327 000) (335 000)
CASH FLOWS FROM FINANCING ACTIVITIES
Receipts
Short term loans – – – – – – – – – –
Borrowing long term/refinancing 113 682 128 491 – – – – – – – –
Increase (decrease) in consumer deposits – – – – – – – – – –
Payments
Repayment of borrowing (3 826) (5 717) – – –
NET CASH FROM/(USED) FINANCING ACTIVITIES 109 856 122 774 – – – – – – – –
NET INCREASE/ (DECREASE) IN CASH HELD (35 799) 326 30 641 49 353 29 719 69 719 29 607 (37 969) 24 655 48 276
Cash/cash equivalents at the year begin: 2 69 155 33 366 58 530 (29 235) 484 484 484 43 895 5 926 30 580
Cash/cash equivalents at the year end: 2 33 357 33 692 89 171 20 118 30 203 70 203 30 091 5 926 30 580 78 857
2020/21 Medium Term Revenue & Expenditure
FrameworkCurrent Year 2019/20

Madibeng Local Municipality 2020/21 /Final Annual Budget and MTREF
64 | P a g e
2.6.4 Cash Backed Reserves/Accumulated Surplus Reconciliation
This following table meets the requirements of MFMA Circular 42 which deals with the funding of a municipal budget in accordance with sections 18 and 19 of the MFMA. The table seeks to answer three key questions regarding the use and availability of cash:
• What are the predicted cash and investments that are available at the end of the budget
year? • How are those funds used? • What is the net funds available or funding shortfall? A surplus would indicate the cash-backed accumulated surplus that was/is available. A shortfall (applications > cash and investments) is indicative of non-compliance with section 18 of the MFMA requirement that the municipality’s budget must be ‘funded’. Non-compliance with section 18 is assumed because a shortfall would indirectly indicate that the annual budget is not appropriately funded (budgeted spending is greater than funds available or to be collected). It is also important to analyse trends to understand the consequences, e.g. the budget year might indicate a small surplus situation, which in itself is an appropriate outcome, but if in prior years there were much larger surpluses then this negative trend may be a concern that requires closer examination. Table 42 MBRR Table A8 - Cash backed reserves/accumulated surplus reconciliation
From the above table it can be seen that the cash and investments available total R1.3 million in the 2020/21 financial year and progressively increase to R15.4 million by 2022/23, including the projected cash and cash equivalents as determined in the cash flow forecast. It can be concluded that the Madibeng Municipality has a surplus against the cash backed and accumulated surpluses reconciliation. The level of non-cash-backing progressively deteriorated over the period 2016/17 to 2019/20 escalating from R-332.3 million to R290.4 million in 2019/20. The municipality has essentially depleted all cash reserves which is a serious concern and should be considered a strategic risk to the financial stability of the municipality. As part of the planning strategy, this deficit needs to be aggressively managed downwards and as part of the medium
Description Ref 2016/17 2017/18 2018/19
R thousandAudited
Outcome
Audited
Outcome
Audited
Outcome
Original
Budget
Adjusted
Budget
Full Year
Forecast
Pre-audit
outcome
Budget Year
2020/21
Budget Year
+1 2021/22
Budget Year
+2 2022/23
Cash and investments available
Cash/cash equivalents at the year end 1 33 357 33 692 89 171 20 118 30 203 70 203 30 091 5 926 30 580 78 857
Other current investments > 90 days 9 (32 888) (26 758) – – – (391 069) – – –
Non current assets - Investments 1 12 785 12 757 11 543 12 800 12 800 12 800 5 829 12 800 12 900 13 000
Cash and investments available: 46 151 13 560 73 956 32 918 43 003 83 003 (355 149) 18 726 43 480 91 857
Application of cash and investments
Unspent conditional transfers 327 987 16 903 – – – 57 014 – – –
Unspent borrowing – – – – – – – – –
Statutory requirements 2
Other working capital requirements 3 378 204 (916 781) 176 147 (102 533) (158 966) (186 214) (110 641) (183 407) (159 924) (124 381)
Other provisions 178 224 129 731 200 800 200 800 200 800 200 800 200 800 200 800
Long term investments committed 4 – – – – – – – – – –
Reserves to be backed by cash/investments 5 – – – – – – – – – –
Total Application of cash and investments: 556 754 (915 794) 193 050 27 198 41 834 14 586 147 172 17 393 40 876 76 419
Surplus(shortfall) (510 603) 929 354 (119 093) 5 720 1 169 68 417 (502 321) 1 333 2 604 15 438
2020/21 Medium Term Revenue & Expenditure
FrameworkCurrent Year 2019/20
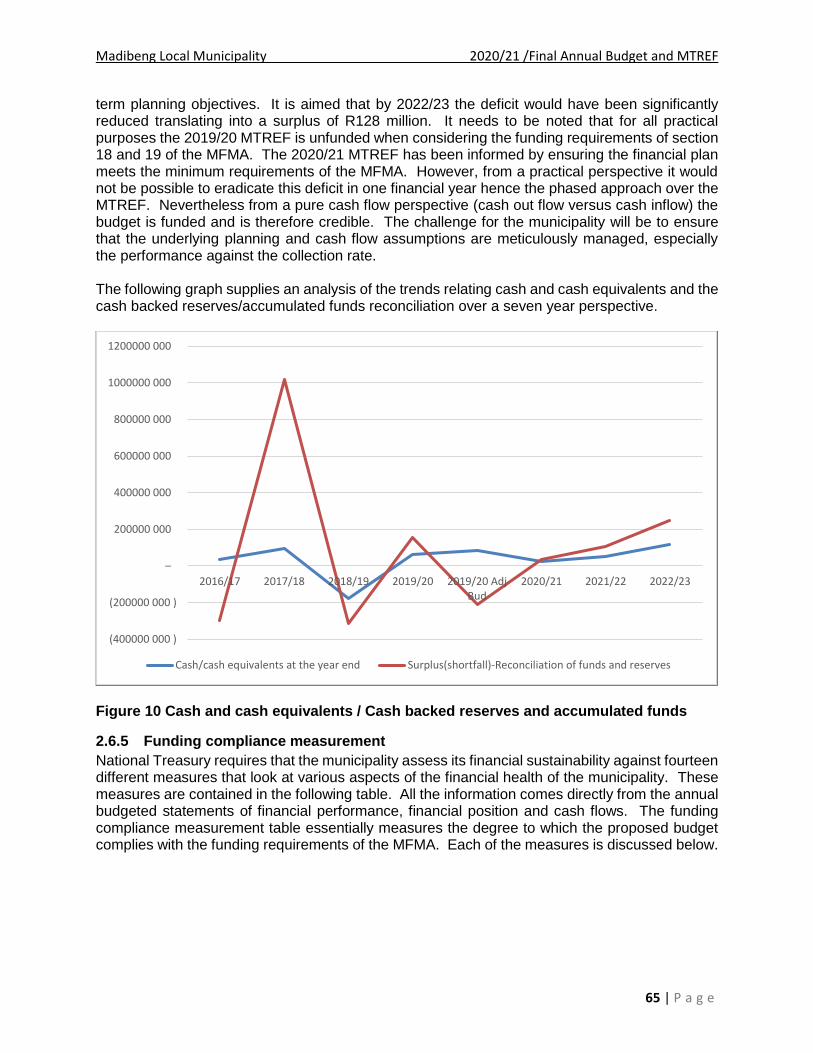
Madibeng Local Municipality 2020/21 /Final Annual Budget and MTREF
65 | P a g e
term planning objectives. It is aimed that by 2022/23 the deficit would have been significantly reduced translating into a surplus of R128 million. It needs to be noted that for all practical purposes the 2019/20 MTREF is unfunded when considering the funding requirements of section 18 and 19 of the MFMA. The 2020/21 MTREF has been informed by ensuring the financial plan meets the minimum requirements of the MFMA. However, from a practical perspective it would not be possible to eradicate this deficit in one financial year hence the phased approach over the MTREF. Nevertheless from a pure cash flow perspective (cash out flow versus cash inflow) the budget is funded and is therefore credible. The challenge for the municipality will be to ensure that the underlying planning and cash flow assumptions are meticulously managed, especially the performance against the collection rate. The following graph supplies an analysis of the trends relating cash and cash equivalents and the cash backed reserves/accumulated funds reconciliation over a seven year perspective.
Figure 10 Cash and cash equivalents / Cash backed reserves and accumulated funds
2.6.5 Funding compliance measurement
National Treasury requires that the municipality assess its financial sustainability against fourteen different measures that look at various aspects of the financial health of the municipality. These measures are contained in the following table. All the information comes directly from the annual budgeted statements of financial performance, financial position and cash flows. The funding compliance measurement table essentially measures the degree to which the proposed budget complies with the funding requirements of the MFMA. Each of the measures is discussed below.
(400000 000 )
(200000 000 )
–
200000 000
400000 000
600000 000
800000 000
1000000 000
1200000 000
2016/17 2017/18 2018/19 2019/20 2019/20 AdjBud
2020/21 2021/22 2022/23
Cash/cash equivalents at the year end Surplus(shortfall)-Reconciliation of funds and reserves
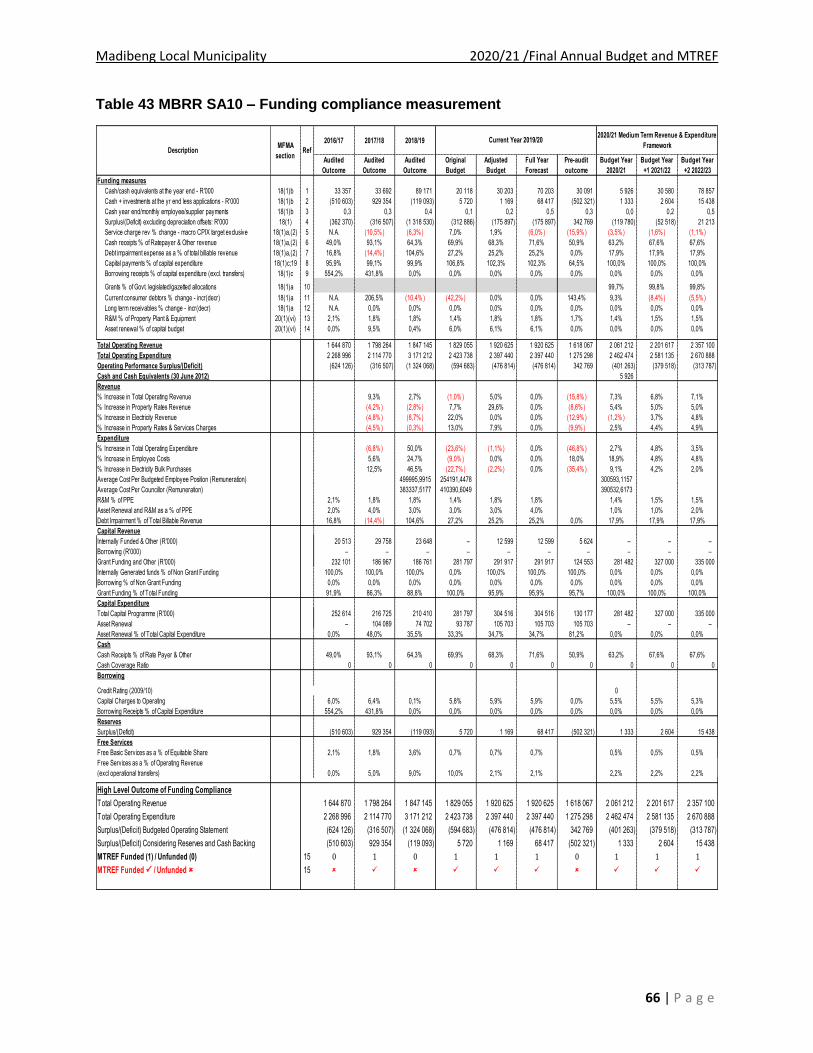
Madibeng Local Municipality 2020/21 /Final Annual Budget and MTREF
66 | P a g e
Table 43 MBRR SA10 – Funding compliance measurement
2016/17 2017/18 2018/19
Audited
Outcome
Audited
Outcome
Audited
Outcome
Original
Budget
Adjusted
Budget
Full Year
Forecast
Pre-audit
outcome
Budget Year
2020/21
Budget Year
+1 2021/22
Budget Year
+2 2022/23
Funding measures
Cash/cash equivalents at the year end - R'000 18(1)b 1 33 357 33 692 89 171 20 118 30 203 70 203 30 091 5 926 30 580 78 857
Cash + investments at the yr end less applications - R'000 18(1)b 2 (510 603) 929 354 (119 093) 5 720 1 169 68 417 (502 321) 1 333 2 604 15 438
Cash year end/monthly employee/supplier payments 18(1)b 3 0,3 0,3 0,4 0,1 0,2 0,5 0,3 0,0 0,2 0,5
Surplus/(Deficit) excluding depreciation offsets: R'000 18(1) 4 (362 370) (316 507) (1 318 530) (312 886) (175 897) (175 897) 342 769 (119 780) (52 518) 21 213
Service charge rev % change - macro CPIX target exclusive 18(1)a,(2) 5 N.A. (10,5% ) (6,3% ) 7,0% 1,9% (6,0% ) (15,9% ) (3,5% ) (1,6% ) (1,1% )
Cash receipts % of Ratepayer & Other revenue 18(1)a,(2) 6 49,0% 93,1% 64,3% 69,9% 68,3% 71,6% 50,9% 63,2% 67,6% 67,6%
Debt impairment expense as a % of total billable revenue 18(1)a,(2) 7 16,8% (14,4% ) 104,6% 27,2% 25,2% 25,2% 0,0% 17,9% 17,9% 17,9%
Capital payments % of capital expenditure 18(1)c;19 8 95,9% 99,1% 99,9% 106,8% 102,3% 102,3% 64,5% 100,0% 100,0% 100,0%
Borrowing receipts % of capital expenditure (excl. transfers) 18(1)c 9 554,2% 431,8% 0,0% 0,0% 0,0% 0,0% 0,0% 0,0% 0,0% 0,0%
Grants % of Govt. legislated/gazetted allocations 18(1)a 10 99,7% 99,8% 99,8%
Current consumer debtors % change - incr(decr) 18(1)a 11 N.A. 206,5% (10,4% ) (42,2% ) 0,0% 0,0% 143,4% 9,3% (8,4% ) (5,5% )
Long term receivables % change - incr(decr) 18(1)a 12 N.A. 0,0% 0,0% 0,0% 0,0% 0,0% 0,0% 0,0% 0,0% 0,0%
R&M % of Property Plant & Equipment 20(1)(vi) 13 2,1% 1,8% 1,8% 1,4% 1,8% 1,8% 1,7% 1,4% 1,5% 1,5%
Asset renewal % of capital budget 20(1)(vi) 14 0,0% 9,5% 0,4% 6,0% 6,1% 6,1% 0,0% 0,0% 0,0% 0,0%
Total Operating Revenue 1 644 870 1 798 264 1 847 145 1 829 055 1 920 625 1 920 625 1 618 067 2 061 212 2 201 617 2 357 100
Total Operating Expenditure 2 268 996 2 114 770 3 171 212 2 423 738 2 397 440 2 397 440 1 275 298 2 462 474 2 581 135 2 670 888
Operating Performance Surplus/(Deficit) (624 126) (316 507) (1 324 068) (594 683) (476 814) (476 814) 342 769 (401 263) (379 518) (313 787)
Cash and Cash Equivalents (30 June 2012) 5 926
Revenue
% Increase in Total Operating Revenue 9,3% 2,7% (1,0% ) 5,0% 0,0% (15,8% ) 7,3% 6,8% 7,1%
% Increase in Property Rates Revenue (4,2% ) (2,8% ) 7,7% 29,6% 0,0% (8,6% ) 5,4% 5,0% 5,0%
% Increase in Electricity Revenue (4,8% ) (8,7% ) 22,0% 0,0% 0,0% (12,9% ) (1,2% ) 3,7% 4,8%
% Increase in Property Rates & Services Charges (4,5% ) (0,3% ) 13,0% 7,9% 0,0% (9,9% ) 2,5% 4,4% 4,9%
Expenditure
% Increase in Total Operating Expenditure (6,8% ) 50,0% (23,6% ) (1,1% ) 0,0% (46,8% ) 2,7% 4,8% 3,5%
% Increase in Employee Costs 5,6% 24,7% (9,0% ) 0,0% 0,0% 18,0% 18,9% 4,8% 4,8%
% Increase in Electricity Bulk Purchases 12,5% 46,5% (22,7% ) (2,2% ) 0,0% (35,4% ) 9,1% 4,2% 2,0%
Average Cost Per Budgeted Employee Position (Remuneration) 499995,9915 254191,4478 300593,1157
Average Cost Per Councillor (Remuneration) 383337,5177 410390,6049 390532,6173
R&M % of PPE 2,1% 1,8% 1,8% 1,4% 1,8% 1,8% 1,4% 1,5% 1,5%
Asset Renewal and R&M as a % of PPE 2,0% 4,0% 3,0% 3,0% 3,0% 4,0% 1,0% 1,0% 2,0%
Debt Impairment % of Total Billable Revenue 16,8% (14,4% ) 104,6% 27,2% 25,2% 25,2% 0,0% 17,9% 17,9% 17,9%
Capital Revenue
Internally Funded & Other (R'000) 20 513 29 758 23 648 – 12 599 12 599 5 624 – – –
Borrowing (R'000) – – – – – – – – – –
Grant Funding and Other (R'000) 232 101 186 967 186 761 281 797 291 917 291 917 124 553 281 482 327 000 335 000
Internally Generated funds % of Non Grant Funding 100,0% 100,0% 100,0% 0,0% 100,0% 100,0% 100,0% 0,0% 0,0% 0,0%
Borrowing % of Non Grant Funding 0,0% 0,0% 0,0% 0,0% 0,0% 0,0% 0,0% 0,0% 0,0% 0,0%
Grant Funding % of Total Funding 91,9% 86,3% 88,8% 100,0% 95,9% 95,9% 95,7% 100,0% 100,0% 100,0%
Capital Expenditure
Total Capital Programme (R'000) 252 614 216 725 210 410 281 797 304 516 304 516 130 177 281 482 327 000 335 000
Asset Renewal – 104 089 74 702 93 787 105 703 105 703 105 703 – – –
Asset Renewal % of Total Capital Expenditure 0,0% 48,0% 35,5% 33,3% 34,7% 34,7% 81,2% 0,0% 0,0% 0,0%
Cash
Cash Receipts % of Rate Payer & Other 49,0% 93,1% 64,3% 69,9% 68,3% 71,6% 50,9% 63,2% 67,6% 67,6%
Cash Coverage Ratio 0 0 0 0 0 0 0 0 0 0
Borrowing
Credit Rating (2009/10) 0
Capital Charges to Operating 6,0% 6,4% 0,1% 5,8% 5,9% 5,9% 0,0% 5,5% 5,5% 5,3%
Borrowing Receipts % of Capital Expenditure 554,2% 431,8% 0,0% 0,0% 0,0% 0,0% 0,0% 0,0% 0,0% 0,0%
Reserves
Surplus/(Deficit) (510 603) 929 354 (119 093) 5 720 1 169 68 417 (502 321) 1 333 2 604 15 438
Free Services
Free Basic Services as a % of Equitable Share 2,1% 1,8% 3,6% 0,7% 0,7% 0,7% 0,5% 0,5% 0,5%
Free Services as a % of Operating Revenue
(excl operational transfers) 0,0% 5,0% 9,0% 10,0% 2,1% 2,1% 2,2% 2,2% 2,2%
High Level Outcome of Funding Compliance
Total Operating Revenue 1 644 870 1 798 264 1 847 145 1 829 055 1 920 625 1 920 625 1 618 067 2 061 212 2 201 617 2 357 100
Total Operating Expenditure 2 268 996 2 114 770 3 171 212 2 423 738 2 397 440 2 397 440 1 275 298 2 462 474 2 581 135 2 670 888
Surplus/(Deficit) Budgeted Operating Statement (624 126) (316 507) (1 324 068) (594 683) (476 814) (476 814) 342 769 (401 263) (379 518) (313 787)
Surplus/(Deficit) Considering Reserves and Cash Backing (510 603) 929 354 (119 093) 5 720 1 169 68 417 (502 321) 1 333 2 604 15 438
MTREF Funded (1) / Unfunded (0) 15 0 1 0 1 1 1 0 1 1 1
MTREF Funded / Unfunded 15
Description
2020/21 Medium Term Revenue & Expenditure
FrameworkMFMA
sectionRef
Current Year 2019/20
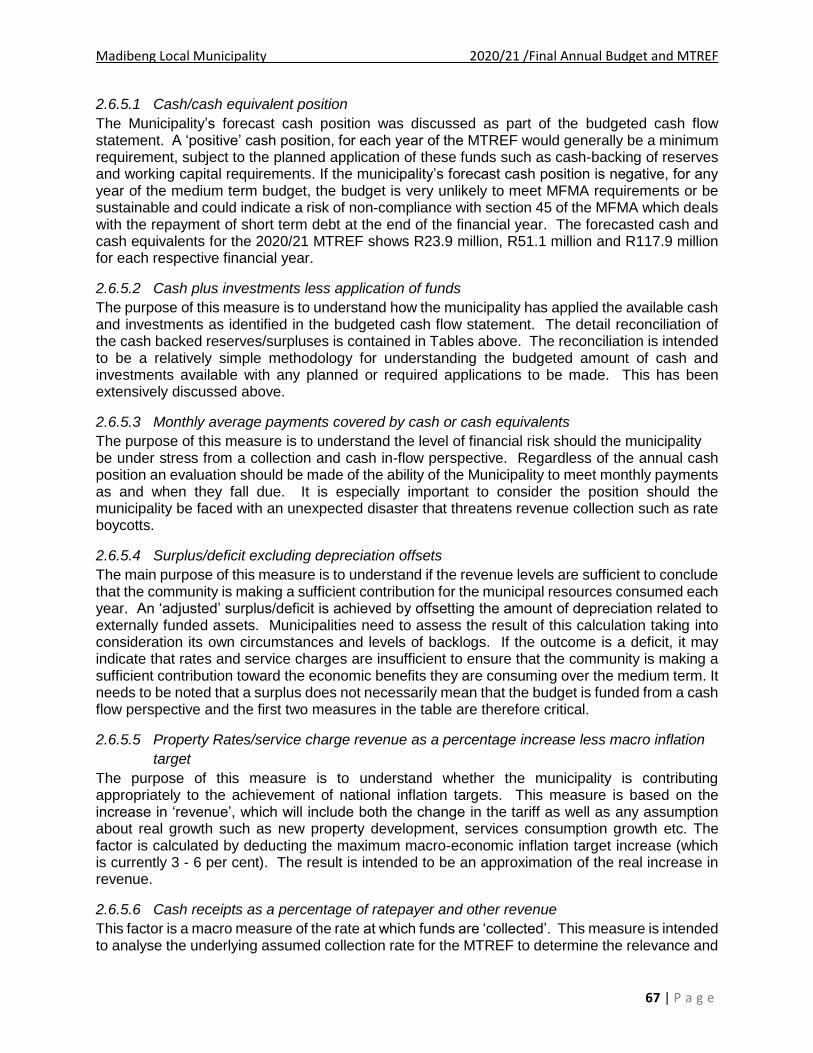
Madibeng Local Municipality 2020/21 /Final Annual Budget and MTREF
67 | P a g e
2.6.5.1 Cash/cash equivalent position
The Municipality’s forecast cash position was discussed as part of the budgeted cash flow statement. A ‘positive’ cash position, for each year of the MTREF would generally be a minimum requirement, subject to the planned application of these funds such as cash-backing of reserves and working capital requirements. If the municipality’s forecast cash position is negative, for any year of the medium term budget, the budget is very unlikely to meet MFMA requirements or be sustainable and could indicate a risk of non-compliance with section 45 of the MFMA which deals with the repayment of short term debt at the end of the financial year. The forecasted cash and cash equivalents for the 2020/21 MTREF shows R23.9 million, R51.1 million and R117.9 million for each respective financial year.
2.6.5.2 Cash plus investments less application of funds
The purpose of this measure is to understand how the municipality has applied the available cash and investments as identified in the budgeted cash flow statement. The detail reconciliation of the cash backed reserves/surpluses is contained in Tables above. The reconciliation is intended to be a relatively simple methodology for understanding the budgeted amount of cash and investments available with any planned or required applications to be made. This has been extensively discussed above.
2.6.5.3 Monthly average payments covered by cash or cash equivalents
The purpose of this measure is to understand the level of financial risk should the municipality be under stress from a collection and cash in-flow perspective. Regardless of the annual cash position an evaluation should be made of the ability of the Municipality to meet monthly payments as and when they fall due. It is especially important to consider the position should the municipality be faced with an unexpected disaster that threatens revenue collection such as rate boycotts.
2.6.5.4 Surplus/deficit excluding depreciation offsets
The main purpose of this measure is to understand if the revenue levels are sufficient to conclude that the community is making a sufficient contribution for the municipal resources consumed each year. An ‘adjusted’ surplus/deficit is achieved by offsetting the amount of depreciation related to externally funded assets. Municipalities need to assess the result of this calculation taking into consideration its own circumstances and levels of backlogs. If the outcome is a deficit, it may indicate that rates and service charges are insufficient to ensure that the community is making a sufficient contribution toward the economic benefits they are consuming over the medium term. It needs to be noted that a surplus does not necessarily mean that the budget is funded from a cash flow perspective and the first two measures in the table are therefore critical.
2.6.5.5 Property Rates/service charge revenue as a percentage increase less macro inflation
target
The purpose of this measure is to understand whether the municipality is contributing appropriately to the achievement of national inflation targets. This measure is based on the increase in ‘revenue’, which will include both the change in the tariff as well as any assumption about real growth such as new property development, services consumption growth etc. The factor is calculated by deducting the maximum macro-economic inflation target increase (which is currently 3 - 6 per cent). The result is intended to be an approximation of the real increase in revenue.
2.6.5.6 Cash receipts as a percentage of ratepayer and other revenue
This factor is a macro measure of the rate at which funds are ‘collected’. This measure is intended to analyse the underlying assumed collection rate for the MTREF to determine the relevance and

Madibeng Local Municipality 2020/21 /Final Annual Budget and MTREF
68 | P a g e
credibility of the budget assumptions contained in the budget. It can be seen that the outcome is at 74.7, 76.0 and 75.5 per cent for each of the respective financial years. Given that the assumed collection rate was based on a 75 per cent performance target, the cash flow statement has been conservatively determined. In addition the risks associated with objections to the valuation roll need to be clarified and hence the conservative approach, also taking into consideration the cash flow challenges experienced in the current financial year. This measure and performance objective will have to be meticulously managed. Should performance with the mid-year review and adjustments be positive in relation to actual collections of billed revenue, the adjustments budget will be amended accordingly.
2.6.5.7 Debt impairment expense as a percentage of billable revenue
This factor measures whether the provision for debt impairment is being adequately funded and is based on the underlying assumption that the provision for debt impairment (doubtful and bad debts) has to be increased to offset under-collection of billed revenues. The provision has been appropriated at 27.2, 22.0 and 16.9 per cent over the MTREF. Considering the debt incentive scheme and the municipality’s revenue management strategy’s objective to collect outstanding debtors of 90 days, the provision is well within the accepted leading practice.
2.6.5.8 Capital payments percentage of capital expenditure
The purpose of this measure is to determine whether the timing of payments has been taken into consideration when forecasting the cash position
2.6.5.9 Borrowing as a percentage of capital expenditure (excluding transfers, grants and
contributions)
The purpose of this measurement is to determine the proportion of a municipality’s ‘own-funded’ capital expenditure budget that is being funded from borrowed funds to confirm MFMA compliance. Externally funded expenditure (by transfers/grants and contributions) has been be excluded
2.6.5.10 Transfers/grants revenue as a percentage of Government transfers/grants available
The purpose of this measurement is mainly to ensure that all available transfers from national and provincial government have been budgeted for. A percentage less than 100 per cent could indicate that not all grants as contained in the Division of Revenue Act (DoRA) have been budgeted for. The Municipality has budgeted for all transfers.
2.6.5.11 Consumer debtors change (Current and Non-current)
The purpose of these measures are to ascertain whether budgeted reductions in outstanding debtors are realistic. There are 2 measures shown for this factor; the change in current debtors and the change in long term receivables, both from the Budgeted Financial Position. Both measures show a relatively stable trend in line with the Municipality’s policy of settling debtors accounts within 30 days.
2.6.5.12 Repairs and maintenance expenditure level
This measure must be considered important within the context of the funding measures criteria because a trend that indicates insufficient funds are being committed to asset repair could also indicate that the overall budget is not credible and/or sustainable in the medium to long term because the revenue budget is not being protected. Details of the Municipality’s strategy pertaining to asset management and repairs and maintenance is contained in Table 60 MBRR SA34C.

Madibeng Local Municipality 2020/21 /Final Annual Budget and MTREF
69 | P a g e
2.6.5.13 Asset renewal/rehabilitation expenditure level
This measure has a similar objective to aforementioned objective relating to repairs and maintenance. A requirement of the detailed capital budget (since MFMA Circular 28 which was issued in December 2005) is to categorise each capital project as a new asset or a renewal/rehabilitation project. The objective is to summarise and understand the proportion of budgets being provided for new assets and also asset sustainability. A declining or low level of renewal funding may indicate that a budget is not credible and/or sustainable and future revenue is not being protected, similar to the justification for ‘repairs and maintenance’ budgets. Further details in this regard are contained in Table 59 MBRR SA34b.
2.7 Expenditure on grants and reconciliations of unspent funds
Table 44 MBRR SA19 - Expenditure on transfers and grant programmes
Description Ref 2016/17 2017/18 2018/19
R thousandAudited
Outcome
Audited
Outcome
Audited
Outcome
Original
Budget
Adjusted
Budget
Full Year
Forecast
Budget Year
2020/21
Budget Year
+1 2021/22
Budget Year
+2 2022/23
EXPENDITURE: 1
Operating expenditure of Transfers and Grants
National Government: 506 218 575 742 632 256 699 244 709 883 709 883 788 036 871 836 962 648
Equitable Share 503 048 567 442 624 943 695 606 695 606 695 606 770 767 855 477 941 140
Expanded Public Works Programme Integrated Grant 1 545 2 591 1 174 1 403 1 403 1 403 1 150 – –
Local Government Financial Management Grant 1 625 1 700 1 770 2 235 2 235 2 235 2 600 2 800 3 100
Municipal Infrastructure Grant – 4 009 4 369 – 9 000 9 000 13 519 13 559 15 408
Municipal Disaster Relief Grant 1 639 1 639
Energy Efficiency and Demand Side Management Grant 3 000
Provincial Government: 1 000 1 000 916 – 985 985 – – –
Library Grant 1 000 1 000 916 – 985 985 – – –
District Municipality: – – – – – – – – –
Other grant providers: – – – – – – – – –
Total operating expenditure of Transfers and Grants: 507 218 576 742 633 172 699 244 710 868 710 868 788 036 871 836 962 648
Capital expenditure of Transfers and Grants
National Government: 260 211 301 005 192 298 281 797 300 917 300 917 281 482 327 000 335 000
Municipal Infrastructure Grant 248 907 287 005 186 761 281 797 281 797 281 797 266 282 292 000 309 000
Integrated National Electrification Programme 11 304 14 000 – – – – 15 200 35 000 26 000
Water Services Infrastructure Grant – – 5 537 – 19 120 19 120 – – –
Provincial Government: – – – – – – – – –
District Municipality: – – – – – – – – –
Other grant providers: – – – – – – – – –
Total capital expenditure of Transfers and Grants 260 211 301 005 192 298 281 797 300 917 300 917 281 482 327 000 335 000
TOTAL EXPENDITURE OF TRANSFERS AND GRANTS 767 429 877 747 825 470 981 041 1 011 785 1 011 785 1 069 518 1 198 836 1 297 648
Current Year 2019/202020/21 Medium Term Revenue & Expenditure
Framework
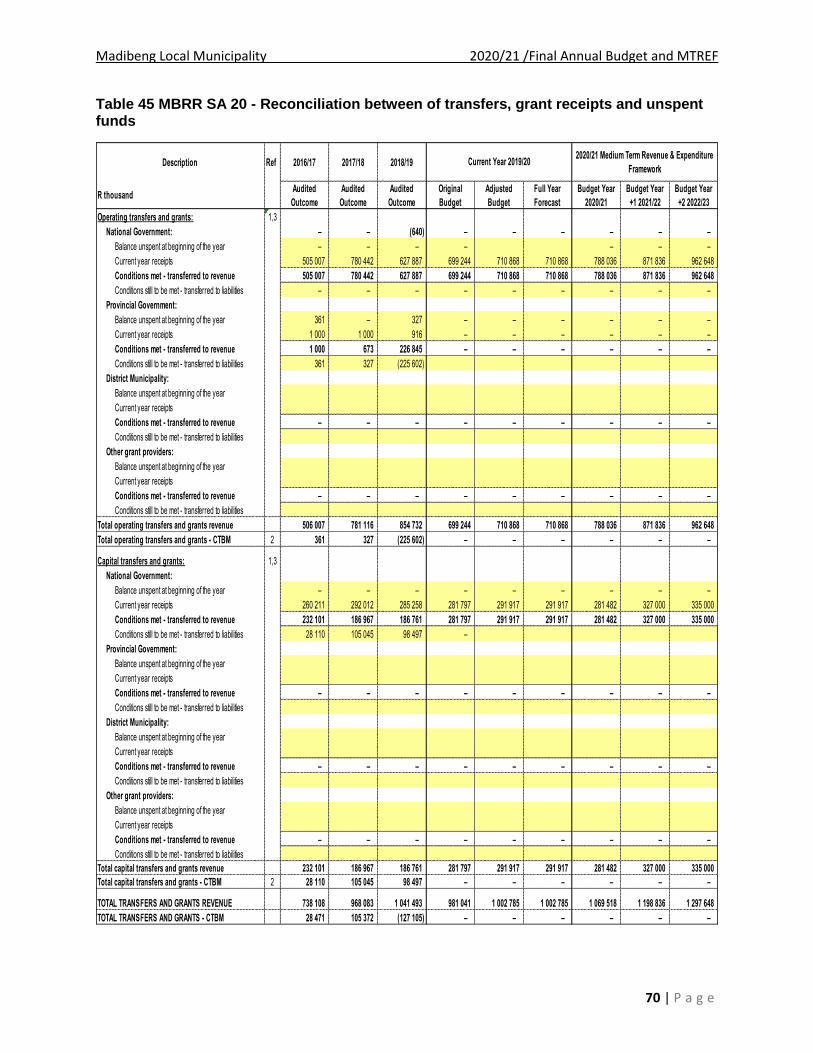
Madibeng Local Municipality 2020/21 /Final Annual Budget and MTREF
70 | P a g e
Table 45 MBRR SA 20 - Reconciliation between of transfers, grant receipts and unspent funds
Description Ref 2016/17 2017/18 2018/19
R thousandAudited
Outcome
Audited
Outcome
Audited
Outcome
Original
Budget
Adjusted
Budget
Full Year
Forecast
Budget Year
2020/21
Budget Year
+1 2021/22
Budget Year
+2 2022/23
Operating transfers and grants: 1,3
National Government: – – (640) – – – – – –
Balance unspent at beginning of the year – – – – – – –
Current year receipts 505 007 780 442 627 887 699 244 710 868 710 868 788 036 871 836 962 648
Conditions met - transferred to revenue 505 007 780 442 627 887 699 244 710 868 710 868 788 036 871 836 962 648
Conditions still to be met - transferred to liabilities – – – – – – – – –
Provincial Government:
Balance unspent at beginning of the year 361 – 327 – – – – – –
Current year receipts 1 000 1 000 916 – – – – – –
Conditions met - transferred to revenue 1 000 673 226 845 – – – – – –
Conditions still to be met - transferred to liabilities 361 327 (225 602)
District Municipality:
Balance unspent at beginning of the year
Current year receipts
Conditions met - transferred to revenue – – – – – – – – –
Conditions still to be met - transferred to liabilities
Other grant providers:
Balance unspent at beginning of the year
Current year receipts
Conditions met - transferred to revenue – – – – – – – – –
Conditions still to be met - transferred to liabilities
Total operating transfers and grants revenue 506 007 781 116 854 732 699 244 710 868 710 868 788 036 871 836 962 648
Total operating transfers and grants - CTBM 2 361 327 (225 602) – – – – – –
Capital transfers and grants: 1,3
National Government:
Balance unspent at beginning of the year – – – – – – – – –
Current year receipts 260 211 292 012 285 258 281 797 291 917 291 917 281 482 327 000 335 000
Conditions met - transferred to revenue 232 101 186 967 186 761 281 797 291 917 291 917 281 482 327 000 335 000
Conditions still to be met - transferred to liabilities 28 110 105 045 98 497 –
Provincial Government:
Balance unspent at beginning of the year
Current year receipts
Conditions met - transferred to revenue – – – – – – – – –
Conditions still to be met - transferred to liabilities
District Municipality:
Balance unspent at beginning of the year
Current year receipts
Conditions met - transferred to revenue – – – – – – – – –
Conditions still to be met - transferred to liabilities
Other grant providers:
Balance unspent at beginning of the year
Current year receipts
Conditions met - transferred to revenue – – – – – – – – –
Conditions still to be met - transferred to liabilities
Total capital transfers and grants revenue 232 101 186 967 186 761 281 797 291 917 291 917 281 482 327 000 335 000
Total capital transfers and grants - CTBM 2 28 110 105 045 98 497 – – – – – –
TOTAL TRANSFERS AND GRANTS REVENUE 738 108 968 083 1 041 493 981 041 1 002 785 1 002 785 1 069 518 1 198 836 1 297 648
TOTAL TRANSFERS AND GRANTS - CTBM 28 471 105 372 (127 105) – – – – – –
Current Year 2019/202020/21 Medium Term Revenue & Expenditure
Framework
Madibeng Local Municipality 2020/21 /Final Annual Budget and MTREF
71 | P a g e
2.8 Councillor and employee benefits
Table 45 MBRR SA22 - Summary of councillor and staff benefits
Summary of Employee and Councillor remuneration Ref 2016/17 2017/18 2018/19
R thousandAudited
Outcome
Audited
Outcome
Audited
Outcome
Original
Budget
Adjusted
Budget
Full Year
Forecast
Budget Year
2020/21
Budget Year
+1 2021/22
Budget Year
+2 2022/23
1 A B C D E F G H I
Councillors (Political Office Bearers plus Other)
Basic Salaries and Wages 14 672 – – – – – – – –
Pension and UIF Contributions 2 215 1 541 1 704 1 762 1 762 1 762 1 900 1 991 2 087
Medical Aid Contributions 871 1 351 1 472 1 539 1 539 1 539 1 563 1 638 1 717
Motor Vehicle Allowance 6 047 – – – – – – – –
Cellphone Allowance 1 651 3 471 3 593 3 471 3 471 3 471 3 597 3 770 3 951
Housing Allowances – – – – – – – –
Other benefits and allowances – 24 168 24 281 26 469 26 469 26 469 24 573 26 800 28 087
Sub Total - Councillors 25 456 30 531 31 050 33 242 33 242 33 242 31 633 34 200 35 841
% increase 4 19,9% 1,7% 7,1% – – (4,8%) 8,1% 4,8%
Senior Managers of the Municipality 2
Basic Salaries and Wages 7 241 4 001 4 241 5 706 5 706 5 706 5 892 6 175 6 472
Pension and UIF Contributions 447 533 555 776 776 776 776 813 852
Medical Aid Contributions 401 154 145 191 191 191 200 210 220
Overtime – – – – – – – – –
Performance Bonus – 68 71 – – – – – –
Motor Vehicle Allowance 3 63 684 763 1 031 1 031 1 031 1 066 1 117 1 171
Cellphone Allowance 3 76 55 58 79 79 79 110 115 121
Housing Allowances 3 3 423 8 7 5 5 5 5 5 5
Other benefits and allowances 3 – 429 1 606 645 645 645 591 620 649
Payments in lieu of leave – 10 193 354 354 354 354 371 389
Long service awards 758 5 105 – – – – – –
Post-retirement benefit obligations 6 – (4 672) 25 584 – – – – – –
Sub Total - Senior Managers of Municipality 11 651 2 028 38 330 8 786 8 786 8 786 8 994 9 426 9 878
% increase 4 (82,6%) 1 790,1% (77,1%) – – 2,4% 4,8% 4,8%
Other Municipal Staff
Basic Salaries and Wages 189 301 235 977 272 397 284 277 284 277 284 277 322 576 338 058 354 285
Pension and UIF Contributions 63 724 49 018 59 214 59 375 59 375 59 375 72 937 76 437 80 106
Medical Aid Contributions 29 545 26 634 30 765 29 651 29 651 29 651 40 259 42 191 44 216
Overtime 40 252 38 829 38 594 17 793 17 793 17 793 20 837 21 837 22 885
Performance Bonus – 17 518 22 523 24 081 24 081 24 081 30 742 32 218 33 765
Motor Vehicle Allowance 3 19 554 24 327 25 169 26 107 26 107 26 107 30 264 31 716 33 239
Cellphone Allowance 3 2 970 220 285 310 310 310 300 314 329
Housing Allowances 3 1 427 2 083 2 319 2 407 2 407 2 407 2 844 2 980 3 123
Other benefits and allowances 3 32 661 7 201 6 270 4 370 4 470 4 470 10 605 11 114 11 647
Payments in lieu of leave 1 216 10 521 20 632 12 843 12 763 12 763 18 446 19 332 20 260
Long service awards –
Post-retirement benefit obligations 6 –
Sub Total - Other Municipal Staff 380 650 412 328 478 166 461 214 461 234 461 234 549 808 576 198 603 856
% increase 4 8,3% 16,0% (3,5%) 0,0% – 19,2% 4,8% 4,8%
Total Parent Municipality 417 757 444 888 547 546 503 242 503 262 503 262 590 436 619 823 649 575
6,5% 23,1% (8,1%) 0,0% – 17,3% 5,0% 4,8%
TOTAL SALARY, ALLOWANCES & BENEFITS 417 757 444 888 547 546 503 242 503 262 503 262 590 436 619 823 649 575
% increase 4 6,5% 23,1% (8,1%) 0,0% – 17,3% 5,0% 4,8%
TOTAL MANAGERS AND STAFF 5,7 392 302 414 356 516 496 470 000 470 020 470 020 558 803 585 624 613 734
Current Year 2019/202020/21 Medium Term Revenue & Expenditure
Framework

Madibeng Local Municipality 2020/21 /Final Annual Budget and MTREF
72 | P a g e
Table 46 MBRR SA23 - Salaries, allowances and benefits (political office bearers/councillors/ senior managers)
Table 47 MBRR SA24 – Summary of personnel numbers
2.9 Monthly targets for revenue, expenditure and cash flow
Disclosure of Salaries, Allowances & Benefits 1. Ref ContributionsIn-kind
benefits
Total Package
Rand per annum 1. 2.
Councillors 3
Speaker 4 329 793 113 949 329 793 773 535
Chief Whip 310 609 106 682 310 609 727 899
Executive Mayor 459 613 164 924 459 613 1 084 150
Deputy Executive Mayor – – – –
Executive Committee 3 455 152 1 076 493 3 455 152 7 986 797
Total for all other councillors 9 529 889 2 000 983 9 529 889 21 060 761
Total Councillors 8 – 14 085 056 3 463 031 14 085 056 31 633 142
Senior Managers of the Municipality 5
Municipal Manager (MM) 1 304 908 251 750 416 814 – 1 973 472
Chief Finance Officer 573 427 90 502 213 660 – 877 590
Director Infrastructure Technical Services 573 427 90 502 213 660 – 877 590
Director Corporate Support Services 573 427 90 502 213 660 – 877 590
Director Human Settlement Planning 573 427 90 502 213 660 – 877 590
Director Community Services 573 427 90 502 213 660 – 877 590
Director Public Safety & Social Services 573 427 90 502 213 660 – 877 590
Director Economic Development Tourism & Agriculture 573 427 90 502 213 660 – 877 590
Chief Audit Executive 573 427 90 502 213 660 – 877 590
List of each offical with packages >= senior manager
–
Total Senior Managers of the Municipality 8,10 – 5 892 327 975 767 2 126 094 – 8 994 188
A Heading for Each Entity 6,7
List each member of board by designation
–
Total for municipal entities 8,10 – – – – – –
TOTAL COST OF COUNCILLOR, DIRECTOR and EXECUTIVE
REMUNERATION10 – 19 977 383 4 438 798 16 211 150 – 40 627 330
No.
AllowancesSalary Performance
Bonuses
Summary of Personnel Numbers Ref
Number 1,2 PositionsPermanent
employees
Contract
employeesPositions
Permanent
employees
Contract
employeesPositions
Permanent
employees
Contract
employees
Municipal Council and Boards of Municipal Entities
Councillors (Political Office Bearers plus Other Councillors) 81 81 – 81 81 – 81 81 –
Board Members of municipal entities 4
Municipal employees 5
Municipal Manager and Senior Managers 3 10 10 – 10 10 – 10 10 –
Other Managers 7
Professionals 40 40 10 50 40 13 60 55 25
Finance 40 40 10 50 40 13 60 55 25
Technicians 1 350 651 – 1 458 651 – 1 458 651 –
Finance 50 50 – 58 50 – 58 50 –
Other 1 300 601 – 1 400 601 – 1 400 601 –
Clerks (Clerical and administrative) 301 301 – 301 301 – 301 301 –
Plant and Machine Operators 30 21 – 30 21 – 30 21 –
TOTAL PERSONNEL NUMBERS 9 1 812 1 104 10 1 930 1 104 13 1 940 1 119 25
% increase 6,5% – 30,0% 0,5% 1,4% 92,3%
Total municipal employees headcount 6, 10 1 731 1 023 10 1 930 1 104 13 1 970 1 230 25
Finance personnel headcount 8, 10
Human Resources personnel headcount 8, 10
Current Year 2019/20 Budget Year 2020/212018/19
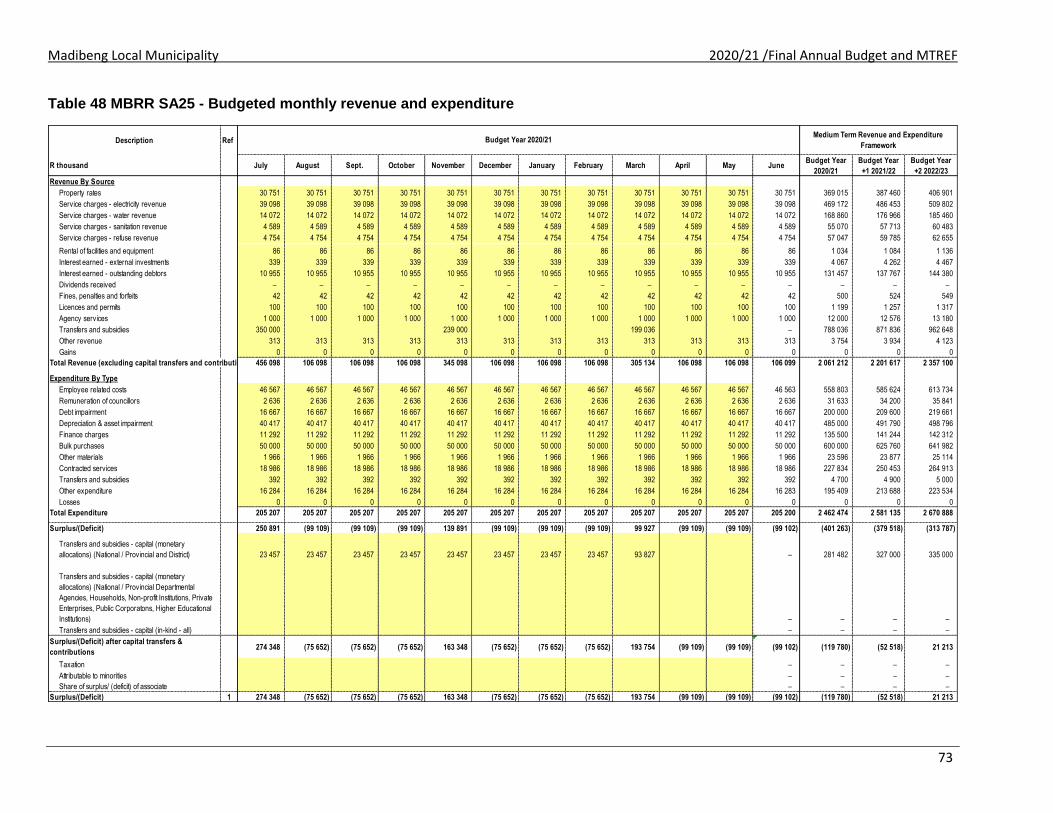
Madibeng Local Municipality 2020/21 /Final Annual Budget and MTREF
73
Table 48 MBRR SA25 - Budgeted monthly revenue and expenditure
Description Ref
R thousand July August Sept. October November December January February March April May JuneBudget Year
2020/21
Budget Year
+1 2021/22
Budget Year
+2 2022/23
Revenue By Source
Property rates 30 751 30 751 30 751 30 751 30 751 30 751 30 751 30 751 30 751 30 751 30 751 30 751 369 015 387 460 406 901
Service charges - electricity revenue 39 098 39 098 39 098 39 098 39 098 39 098 39 098 39 098 39 098 39 098 39 098 39 098 469 172 486 453 509 802
Service charges - water revenue 14 072 14 072 14 072 14 072 14 072 14 072 14 072 14 072 14 072 14 072 14 072 14 072 168 860 176 966 185 460
Service charges - sanitation revenue 4 589 4 589 4 589 4 589 4 589 4 589 4 589 4 589 4 589 4 589 4 589 4 589 55 070 57 713 60 483
Service charges - refuse revenue 4 754 4 754 4 754 4 754 4 754 4 754 4 754 4 754 4 754 4 754 4 754 4 754 57 047 59 785 62 655
Rental of facilities and equipment 86 86 86 86 86 86 86 86 86 86 86 86 1 034 1 084 1 136
Interest earned - external investments 339 339 339 339 339 339 339 339 339 339 339 339 4 067 4 262 4 467
Interest earned - outstanding debtors 10 955 10 955 10 955 10 955 10 955 10 955 10 955 10 955 10 955 10 955 10 955 10 955 131 457 137 767 144 380
Dividends received – – – – – – – – – – – – – – –
Fines, penalties and forfeits 42 42 42 42 42 42 42 42 42 42 42 42 500 524 549
Licences and permits 100 100 100 100 100 100 100 100 100 100 100 100 1 199 1 257 1 317
Agency services 1 000 1 000 1 000 1 000 1 000 1 000 1 000 1 000 1 000 1 000 1 000 1 000 12 000 12 576 13 180
Transfers and subsidies 350 000 239 000 199 036 – 788 036 871 836 962 648
Other revenue 313 313 313 313 313 313 313 313 313 313 313 313 3 754 3 934 4 123
Gains 0 0 0 0 0 0 0 0 0 0 0 0 0 0 0
Total Revenue (excluding capital transfers and contributions) 456 098 106 098 106 098 106 098 345 098 106 098 106 098 106 098 305 134 106 098 106 098 106 099 2 061 212 2 201 617 2 357 100
Expenditure By Type
Employee related costs 46 567 46 567 46 567 46 567 46 567 46 567 46 567 46 567 46 567 46 567 46 567 46 563 558 803 585 624 613 734
Remuneration of councillors 2 636 2 636 2 636 2 636 2 636 2 636 2 636 2 636 2 636 2 636 2 636 2 636 31 633 34 200 35 841
Debt impairment 16 667 16 667 16 667 16 667 16 667 16 667 16 667 16 667 16 667 16 667 16 667 16 667 200 000 209 600 219 661
Depreciation & asset impairment 40 417 40 417 40 417 40 417 40 417 40 417 40 417 40 417 40 417 40 417 40 417 40 417 485 000 491 790 498 796
Finance charges 11 292 11 292 11 292 11 292 11 292 11 292 11 292 11 292 11 292 11 292 11 292 11 292 135 500 141 244 142 312
Bulk purchases 50 000 50 000 50 000 50 000 50 000 50 000 50 000 50 000 50 000 50 000 50 000 50 000 600 000 625 760 641 982
Other materials 1 966 1 966 1 966 1 966 1 966 1 966 1 966 1 966 1 966 1 966 1 966 1 966 23 596 23 877 25 114
Contracted services 18 986 18 986 18 986 18 986 18 986 18 986 18 986 18 986 18 986 18 986 18 986 18 986 227 834 250 453 264 913
Transfers and subsidies 392 392 392 392 392 392 392 392 392 392 392 392 4 700 4 900 5 000
Other expenditure 16 284 16 284 16 284 16 284 16 284 16 284 16 284 16 284 16 284 16 284 16 284 16 283 195 409 213 688 223 534
Losses 0 0 0 0 0 0 0 0 0 0 0 0 0 0 0
Total Expenditure 205 207 205 207 205 207 205 207 205 207 205 207 205 207 205 207 205 207 205 207 205 207 205 200 2 462 474 2 581 135 2 670 888
Surplus/(Deficit) 250 891 (99 109) (99 109) (99 109) 139 891 (99 109) (99 109) (99 109) 99 927 (99 109) (99 109) (99 102) (401 263) (379 518) (313 787)
Transfers and subsidies - capital (monetary
allocations) (National / Provincial and District) 23 457 23 457 23 457 23 457 23 457 23 457 23 457 23 457 93 827 – 281 482 327 000 335 000
Transfers and subsidies - capital (monetary
allocations) (National / Provincial Departmental
Agencies, Households, Non-profit Institutions, Private
Enterprises, Public Corporatons, Higher Educational
Institutions) – – – –
Transfers and subsidies - capital (in-kind - all) – – – –
Surplus/(Deficit) after capital transfers &
contributions274 348 (75 652) (75 652) (75 652) 163 348 (75 652) (75 652) (75 652) 193 754 (99 109) (99 109) (99 102) (119 780) (52 518) 21 213
Taxation – – – –
Attributable to minorities – – – –
Share of surplus/ (deficit) of associate – – – –
Surplus/(Deficit) 1 274 348 (75 652) (75 652) (75 652) 163 348 (75 652) (75 652) (75 652) 193 754 (99 109) (99 109) (99 102) (119 780) (52 518) 21 213
Budget Year 2020/21Medium Term Revenue and Expenditure
Framework

Madibeng Local Municipality 2020/21 /Final Annual Budget and MTREF
74
Table 49 MBRR SA26 - Budgeted monthly revenue and expenditure (municipal vote)
Description Ref
R thousand July August Sept. October November December January February March April May JuneBudget Year
2020/21
Budget Year
+1 2021/22
Budget Year
+2 2022/23
Revenue by Vote
Vote 01 - Executive Council – – – – – – – – – – – – – – –
Vote 02 - Municipal Manager – – – – – – – – – – – – – – –
Vote 03 - Chief Operating Officer – – – – – – – – – – – – – – –
Vote 04 - Corporate Support Services – – – – – – – – – – – – – – –
Vote 05 - Budget And Treasury Office 99 682 99 682 99 682 99 682 99 682 99 682 99 682 99 682 99 682 99 682 99 682 99 683 1 196 190 1 302 128 1 410 238
Vote 06 - Infrastructure And Technical Services 88 183 88 183 88 183 88 183 88 183 88 183 88 183 88 183 88 183 88 183 88 183 88 183 1 058 195 1 135 146 1 186 136
Vote 07 - Community Services 5 906 5 906 5 906 5 906 5 906 5 906 5 906 5 906 5 906 5 906 5 906 5 906 70 868 74 270 77 835
Vote 08 - Human Settlement 207 207 207 207 207 207 207 207 207 207 207 207 2 481 2 600 2 725
Vote 09 - Economic Dev,Tourism & Agriculture 112 112 112 112 112 112 112 112 112 112 112 112 1 348 208 218
Vote 10 - Public Safety, Fleet And Facilities Management 1 134 1 134 1 134 1 134 1 134 1 134 1 134 1 134 1 134 1 134 1 134 1 134 13 611 14 264 14 949
Vote 11 - Internal Audit – – – – – – – – – – – – – – –
Vote 12 - Risk Management – – – – – – – – – – – – – – –
Vote 13 - [Name Of Vote 13] – – – – – – – – – – – – – – –
Vote 14 - [Name Of Vote 14] – – – – – – – – – – – – – – –
Vote 15 - Other – – – – – – – – – – – – – – –
Total Revenue by Vote 195 224 195 224 195 224 195 224 195 224 195 224 195 224 195 224 195 224 195 224 195 224 195 225 2 342 694 2 528 617 2 692 100
Expenditure by Vote to be appropriated
Vote 01 - Executive Council 5 615 5 615 5 615 5 615 5 615 5 615 5 615 5 615 5 615 5 615 5 615 5 615 67 382 73 881 77 428
Vote 02 - Municipal Manager 393 393 393 393 393 393 393 393 393 393 393 393 4 720 4 999 5 239
Vote 03 - Chief Operating Officer 2 284 2 284 2 284 2 284 2 284 2 284 2 284 2 284 2 284 2 284 2 284 2 283 27 406 29 224 30 627
Vote 04 - Corporate Support Services 6 653 6 653 6 653 6 653 6 653 6 653 6 653 6 653 6 653 6 653 6 653 6 652 79 832 85 338 89 137
Vote 05 - Budget And Treasury Office 76 201 76 201 76 201 76 201 76 201 76 201 76 201 76 201 76 201 76 201 76 201 76 200 914 410 951 214 973 410
Vote 06 - Infrastructure And Technical Services 72 876 72 876 72 876 72 876 72 876 72 876 72 876 72 876 72 876 72 876 72 876 72 875 874 516 918 832 953 464
Vote 07 - Community Services 14 637 14 637 14 637 14 637 14 637 14 637 14 637 14 637 14 637 14 637 14 637 14 636 175 644 184 931 193 759
Vote 08 - Human Settlement 2 568 2 568 2 568 2 568 2 568 2 568 2 568 2 568 2 568 2 568 2 568 2 567 30 811 32 346 33 899
Vote 09 - Economic Dev,Tourism & Agriculture 1 291 1 291 1 291 1 291 1 291 1 291 1 291 1 291 1 291 1 291 1 291 1 291 15 492 16 311 17 092
Vote 10 - Public Safety, Fleet And Facilities Management 20 993 20 993 20 993 20 993 20 993 20 993 20 993 20 993 20 993 20 993 20 993 20 992 251 910 262 695 274 444
Vote 11 - Internal Audit 935 935 935 935 935 935 935 935 935 935 935 935 11 216 11 791 12 357
Vote 12 - Risk Management 761 761 761 761 761 761 761 761 761 761 761 761 9 134 9 573 10 032
Vote 13 - [Name Of Vote 13] – – – – – – – – – – – – – – –
Vote 14 - [Name Of Vote 14] – – – – – – – – – – – – – – –
Vote 15 - Other – – – – – – – – – – – – – – –
Total Expenditure by Vote 205 207 205 207 205 207 205 207 205 207 205 207 205 207 205 207 205 207 205 207 205 207 205 200 2 462 474 2 581 135 2 670 888
Surplus/(Deficit) before assoc. (9 982) (9 982) (9 982) (9 982) (9 982) (9 982) (9 982) (9 982) (9 982) (9 982) (9 982) (9 975) (119 780) (52 518) 21 213
Taxation – – – –
Attributable to minorities – – – –
Share of surplus/ (deficit) of associate – – – –
Surplus/(Deficit) 1 (9 982) (9 982) (9 982) (9 982) (9 982) (9 982) (9 982) (9 982) (9 982) (9 982) (9 982) (9 975) (119 780) (52 518) 21 213
Budget Year 2020/21Medium Term Revenue and Expenditure
Framework
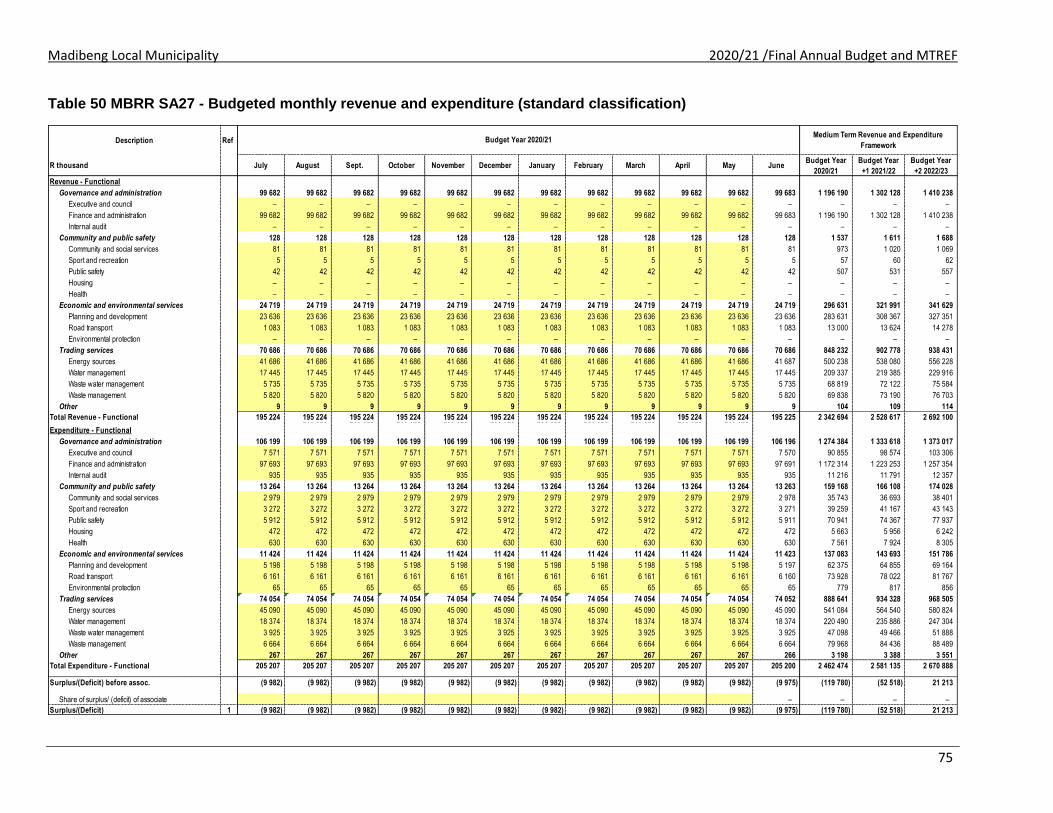
Madibeng Local Municipality 2020/21 /Final Annual Budget and MTREF
75
Table 50 MBRR SA27 - Budgeted monthly revenue and expenditure (standard classification)
Description Ref
R thousand July August Sept. October November December January February March April May JuneBudget Year
2020/21
Budget Year
+1 2021/22
Budget Year
+2 2022/23
Revenue - Functional
Governance and administration 99 682 99 682 99 682 99 682 99 682 99 682 99 682 99 682 99 682 99 682 99 682 99 683 1 196 190 1 302 128 1 410 238
Executive and council – – – – – – – – – – – – – – –
Finance and administration 99 682 99 682 99 682 99 682 99 682 99 682 99 682 99 682 99 682 99 682 99 682 99 683 1 196 190 1 302 128 1 410 238
Internal audit – – – – – – – – – – – – – – –
Community and public safety 128 128 128 128 128 128 128 128 128 128 128 128 1 537 1 611 1 688
Community and social services 81 81 81 81 81 81 81 81 81 81 81 81 973 1 020 1 069
Sport and recreation 5 5 5 5 5 5 5 5 5 5 5 5 57 60 62
Public safety 42 42 42 42 42 42 42 42 42 42 42 42 507 531 557
Housing – – – – – – – – – – – – – – –
Health – – – – – – – – – – – – – – –
Economic and environmental services 24 719 24 719 24 719 24 719 24 719 24 719 24 719 24 719 24 719 24 719 24 719 24 719 296 631 321 991 341 629
Planning and development 23 636 23 636 23 636 23 636 23 636 23 636 23 636 23 636 23 636 23 636 23 636 23 636 283 631 308 367 327 351
Road transport 1 083 1 083 1 083 1 083 1 083 1 083 1 083 1 083 1 083 1 083 1 083 1 083 13 000 13 624 14 278
Environmental protection – – – – – – – – – – – – – – –
Trading services 70 686 70 686 70 686 70 686 70 686 70 686 70 686 70 686 70 686 70 686 70 686 70 686 848 232 902 778 938 431
Energy sources 41 686 41 686 41 686 41 686 41 686 41 686 41 686 41 686 41 686 41 686 41 686 41 687 500 238 538 080 556 228
Water management 17 445 17 445 17 445 17 445 17 445 17 445 17 445 17 445 17 445 17 445 17 445 17 445 209 337 219 385 229 916
Waste water management 5 735 5 735 5 735 5 735 5 735 5 735 5 735 5 735 5 735 5 735 5 735 5 735 68 819 72 122 75 584
Waste management 5 820 5 820 5 820 5 820 5 820 5 820 5 820 5 820 5 820 5 820 5 820 5 820 69 838 73 190 76 703
Other 9 9 9 9 9 9 9 9 9 9 9 9 104 109 114
Total Revenue - Functional 195 224 195 224 195 224 195 224 195 224 195 224 195 224 195 224 195 224 195 224 195 224 195 225 2 342 694 2 528 617 2 692 100 260 628 260 628 260 628 260 628 260 628 260 628 260 628 260 628 260 628 260 628
Expenditure - Functional
Governance and administration 106 199 106 199 106 199 106 199 106 199 106 199 106 199 106 199 106 199 106 199 106 199 106 196 1 274 384 1 333 618 1 373 017
Executive and council 7 571 7 571 7 571 7 571 7 571 7 571 7 571 7 571 7 571 7 571 7 571 7 570 90 855 98 574 103 306
Finance and administration 97 693 97 693 97 693 97 693 97 693 97 693 97 693 97 693 97 693 97 693 97 693 97 691 1 172 314 1 223 253 1 257 354
Internal audit 935 935 935 935 935 935 935 935 935 935 935 935 11 216 11 791 12 357
Community and public safety 13 264 13 264 13 264 13 264 13 264 13 264 13 264 13 264 13 264 13 264 13 264 13 263 159 168 166 108 174 028
Community and social services 2 979 2 979 2 979 2 979 2 979 2 979 2 979 2 979 2 979 2 979 2 979 2 978 35 743 36 693 38 401
Sport and recreation 3 272 3 272 3 272 3 272 3 272 3 272 3 272 3 272 3 272 3 272 3 272 3 271 39 259 41 167 43 143
Public safety 5 912 5 912 5 912 5 912 5 912 5 912 5 912 5 912 5 912 5 912 5 912 5 911 70 941 74 367 77 937
Housing 472 472 472 472 472 472 472 472 472 472 472 472 5 663 5 956 6 242
Health 630 630 630 630 630 630 630 630 630 630 630 630 7 561 7 924 8 305
Economic and environmental services 11 424 11 424 11 424 11 424 11 424 11 424 11 424 11 424 11 424 11 424 11 424 11 423 137 083 143 693 151 786
Planning and development 5 198 5 198 5 198 5 198 5 198 5 198 5 198 5 198 5 198 5 198 5 198 5 197 62 375 64 855 69 164
Road transport 6 161 6 161 6 161 6 161 6 161 6 161 6 161 6 161 6 161 6 161 6 161 6 160 73 928 78 022 81 767
Environmental protection 65 65 65 65 65 65 65 65 65 65 65 65 779 817 856
Trading services 74 054 74 054 74 054 74 054 74 054 74 054 74 054 74 054 74 054 74 054 74 054 74 052 888 641 934 328 968 505
Energy sources 45 090 45 090 45 090 45 090 45 090 45 090 45 090 45 090 45 090 45 090 45 090 45 090 541 084 564 540 580 824
Water management 18 374 18 374 18 374 18 374 18 374 18 374 18 374 18 374 18 374 18 374 18 374 18 374 220 490 235 886 247 304
Waste water management 3 925 3 925 3 925 3 925 3 925 3 925 3 925 3 925 3 925 3 925 3 925 3 925 47 098 49 466 51 888
Waste management 6 664 6 664 6 664 6 664 6 664 6 664 6 664 6 664 6 664 6 664 6 664 6 664 79 968 84 436 88 489
Other 267 267 267 267 267 267 267 267 267 267 267 266 3 198 3 388 3 551
Total Expenditure - Functional 205 207 205 207 205 207 205 207 205 207 205 207 205 207 205 207 205 207 205 207 205 207 205 200 2 462 474 2 581 135 2 670 888
Surplus/(Deficit) before assoc. (9 982) (9 982) (9 982) (9 982) (9 982) (9 982) (9 982) (9 982) (9 982) (9 982) (9 982) (9 975) (119 780) (52 518) 21 213
Share of surplus/ (deficit) of associate – – – –
Surplus/(Deficit) 1 (9 982) (9 982) (9 982) (9 982) (9 982) (9 982) (9 982) (9 982) (9 982) (9 982) (9 982) (9 975) (119 780) (52 518) 21 213
Budget Year 2020/21Medium Term Revenue and Expenditure
Framework
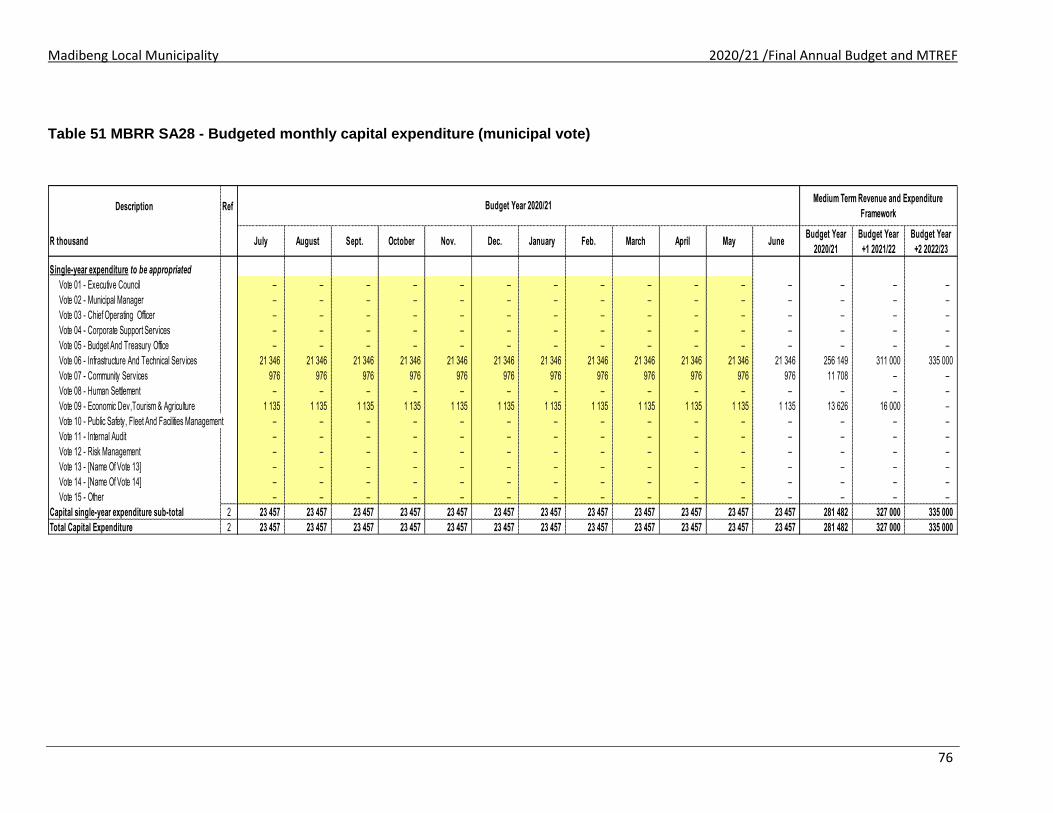
Madibeng Local Municipality 2020/21 /Final Annual Budget and MTREF
76
Table 51 MBRR SA28 - Budgeted monthly capital expenditure (municipal vote)
Description Ref
R thousand July August Sept. October Nov. Dec. January Feb. March April May JuneBudget Year
2020/21
Budget Year
+1 2021/22
Budget Year
+2 2022/23
Single-year expenditure to be appropriated
Vote 01 - Executive Council – – – – – – – – – – – – – – –
Vote 02 - Municipal Manager – – – – – – – – – – – – – – –
Vote 03 - Chief Operating Officer – – – – – – – – – – – – – – –
Vote 04 - Corporate Support Services – – – – – – – – – – – – – – –
Vote 05 - Budget And Treasury Office – – – – – – – – – – – – – – –
Vote 06 - Infrastructure And Technical Services 21 346 21 346 21 346 21 346 21 346 21 346 21 346 21 346 21 346 21 346 21 346 21 346 256 149 311 000 335 000
Vote 07 - Community Services 976 976 976 976 976 976 976 976 976 976 976 976 11 708 – –
Vote 08 - Human Settlement – – – – – – – – – – – – – – –
Vote 09 - Economic Dev,Tourism & Agriculture 1 135 1 135 1 135 1 135 1 135 1 135 1 135 1 135 1 135 1 135 1 135 1 135 13 626 16 000 –
Vote 10 - Public Safety, Fleet And Facilities Management – – – – – – – – – – – – – – –
Vote 11 - Internal Audit – – – – – – – – – – – – – – –
Vote 12 - Risk Management – – – – – – – – – – – – – – –
Vote 13 - [Name Of Vote 13] – – – – – – – – – – – – – – –
Vote 14 - [Name Of Vote 14] – – – – – – – – – – – – – – –
Vote 15 - Other – – – – – – – – – – – – – – –
Capital single-year expenditure sub-total 2 23 457 23 457 23 457 23 457 23 457 23 457 23 457 23 457 23 457 23 457 23 457 23 457 281 482 327 000 335 000
Total Capital Expenditure 2 23 457 23 457 23 457 23 457 23 457 23 457 23 457 23 457 23 457 23 457 23 457 23 457 281 482 327 000 335 000
Budget Year 2020/21Medium Term Revenue and Expenditure
Framework
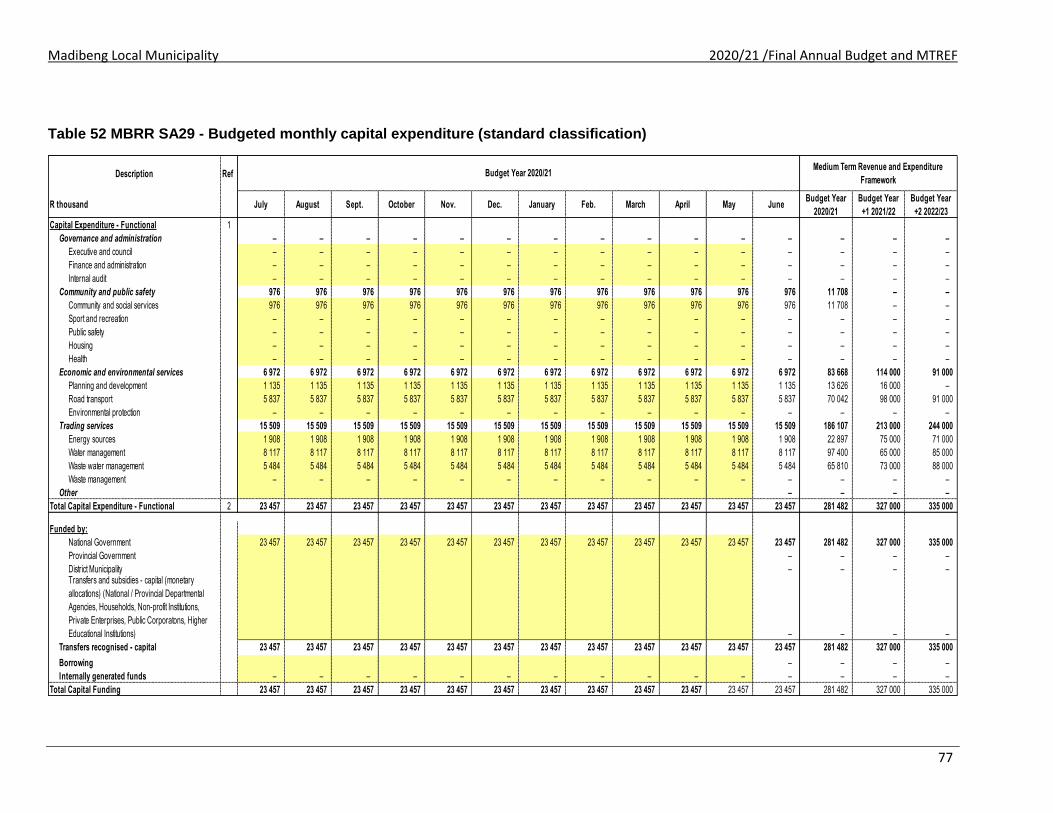
Madibeng Local Municipality 2020/21 /Final Annual Budget and MTREF
77
Table 52 MBRR SA29 - Budgeted monthly capital expenditure (standard classification)
Description Ref
R thousand July August Sept. October Nov. Dec. January Feb. March April May JuneBudget Year
2020/21
Budget Year
+1 2021/22
Budget Year
+2 2022/23
Capital Expenditure - Functional 1
Governance and administration – – – – – – – – – – – – – – –
Executive and council – – – – – – – – – – – – – – –
Finance and administration – – – – – – – – – – – – – – –
Internal audit – – – – – – – – – – – – – – –
Community and public safety 976 976 976 976 976 976 976 976 976 976 976 976 11 708 – –
Community and social services 976 976 976 976 976 976 976 976 976 976 976 976 11 708 – –
Sport and recreation – – – – – – – – – – – – – – –
Public safety – – – – – – – – – – – – – – –
Housing – – – – – – – – – – – – – – –
Health – – – – – – – – – – – – – – –
Economic and environmental services 6 972 6 972 6 972 6 972 6 972 6 972 6 972 6 972 6 972 6 972 6 972 6 972 83 668 114 000 91 000
Planning and development 1 135 1 135 1 135 1 135 1 135 1 135 1 135 1 135 1 135 1 135 1 135 1 135 13 626 16 000 –
Road transport 5 837 5 837 5 837 5 837 5 837 5 837 5 837 5 837 5 837 5 837 5 837 5 837 70 042 98 000 91 000
Environmental protection – – – – – – – – – – – – – – –
Trading services 15 509 15 509 15 509 15 509 15 509 15 509 15 509 15 509 15 509 15 509 15 509 15 509 186 107 213 000 244 000
Energy sources 1 908 1 908 1 908 1 908 1 908 1 908 1 908 1 908 1 908 1 908 1 908 1 908 22 897 75 000 71 000
Water management 8 117 8 117 8 117 8 117 8 117 8 117 8 117 8 117 8 117 8 117 8 117 8 117 97 400 65 000 85 000
Waste water management 5 484 5 484 5 484 5 484 5 484 5 484 5 484 5 484 5 484 5 484 5 484 5 484 65 810 73 000 88 000
Waste management – – – – – – – – – – – – – – –
Other – – – –
Total Capital Expenditure - Functional 2 23 457 23 457 23 457 23 457 23 457 23 457 23 457 23 457 23 457 23 457 23 457 23 457 281 482 327 000 335 000
Funded by:
National Government 23 457 23 457 23 457 23 457 23 457 23 457 23 457 23 457 23 457 23 457 23 457 23 457 281 482 327 000 335 000
Provincial Government – – – –
District Municipality – – – – Transfers and subsidies - capital (monetary
allocations) (National / Provincial Departmental
Agencies, Households, Non-profit Institutions,
Private Enterprises, Public Corporatons, Higher
Educational Institutions) – – – –
Transfers recognised - capital 23 457 23 457 23 457 23 457 23 457 23 457 23 457 23 457 23 457 23 457 23 457 23 457 281 482 327 000 335 000
Borrowing – – – –
Internally generated funds – – – – – – – – – – – – – – –
Total Capital Funding 23 457 23 457 23 457 23 457 23 457 23 457 23 457 23 457 23 457 23 457 23 457 23 457 281 482 327 000 335 000
Budget Year 2020/21Medium Term Revenue and Expenditure
Framework

Madibeng Local Municipality 2020/21 /Final Annual Budget and MTREF
78
Table 53 MBRR SA30 - Budgeted monthly cash flow
MONTHLY CASH FLOWS
R thousand July August Sept. October November December January February March April May JuneBudget Year
2020/21
Budget Year
+1 2021/22
Budget Year
+2 2022/23
Cash Receipts By Source 1
Property rates 21 526 21 526 21 526 21 526 21 526 21 526 21 526 21 526 21 526 21 526 21 526 21 526 258 311 290 595 305 175
Service charges - electricity revenue 27 368 27 368 27 368 27 368 27 368 27 368 27 368 27 368 27 368 27 368 27 368 27 368 328 421 364 840 382 352
Service charges - water revenue 9 850 9 850 9 850 9 850 9 850 9 850 9 850 9 850 9 850 9 850 9 850 9 850 118 202 132 724 139 095
Service charges - sanitation revenue 3 212 3 212 3 212 3 212 3 212 3 212 3 212 3 212 3 212 3 212 3 212 3 212 38 549 43 285 45 362
Service charges - refuse revenue 3 328 3 328 3 328 3 328 3 328 3 328 3 328 3 328 3 328 3 328 3 328 3 328 39 933 44 839 46 991 – – – – – – – – – – –
Rental of facilities and equipment 86 86 86 86 86 86 86 86 86 86 86 86 1 034 1 084 1 136
Interest earned - external investments 339 339 339 339 339 339 339 339 339 339 339 339 4 067 4 262 4 467
Interest earned - outstanding debtors 2 108 2 108 2 108 2 108 2 108 2 108 2 108 2 108 2 108 2 108 2 108 2 108 25 300 26 500 27 000
Fines, penalties and forfeits 42 42 42 42 42 42 42 42 42 42 42 42 500 524 549
Licences and permits 100 100 100 100 100 100 100 100 100 100 100 100 1 199 1 257 1 317
Agency services 1 000 1 000 1 000 1 000 1 000 1 000 1 000 1 000 1 000 1 000 1 000 1 000 12 000 12 576 13 180
Transfers and Subsidies - Operational 350 000 239 000 199 036 – 788 036 871 836 962 648
Other revenue 313 313 313 313 313 313 313 313 313 313 313 313 3 754 3 934 4 123
Cash Receipts by Source 419 272 69 272 69 272 69 272 308 272 69 272 69 272 69 272 268 308 69 272 69 272 69 272 1 619 305 1 798 256 1 933 395
Other Cash Flows by Source
Transfers and subsidies - capital (monetary allocations) (National /
Provincial and District) 23 457 23 457 23 457 23 457 23 457 23 457 23 457 23 457 93 827 – 281 482 327 000 335 000
Transfers and subsidies - capital (monetary allocations) (National /
Provincial Departmental Agencies, Households, Non-profit Institutions,
Private Enterprises, Public Corporatons, Higher Educational Institutions) –
Proceeds on Disposal of Fixed and Intangible Assets –
Short term loans –
Borrowing long term/refinancing –
Increase (decrease) in consumer deposits –
Decrease (increase) in non-current receivables –
Decrease (increase) in non-current investments – –
Total Cash Receipts by Source 442 729 92 729 92 729 92 729 331 729 92 729 92 729 92 729 362 136 69 272 69 272 69 272 1 900 788 2 125 256 2 268 395
Cash Payments by Type
Employee related costs 46 567 46 567 46 567 46 567 46 567 46 567 46 567 46 567 46 567 46 567 46 567 46 563 558 803 585 624 613 734
Remuneration of councillors 2 636 2 636 2 636 2 636 2 636 2 636 2 636 2 636 2 636 2 636 2 636 2 636 31 633 34 200 35 841
Finance charges – – – –
Bulk purchases - Electricity 40 000 40 000 40 000 40 000 40 000 40 000 40 000 40 000 40 000 40 000 40 000 40 000 480 000 500 000 510 186
Bulk purchases - Water & Sewer 10 000 10 000 10 000 10 000 10 000 10 000 10 000 10 000 10 000 10 000 10 000 10 000 120 000 125 760 131 796
Other materials 1 966 1 966 1 966 1 966 1 966 1 966 1 966 1 966 1 966 1 966 1 966 1 966 23 596 23 877 25 114
Contracted services 18 986 18 986 18 986 18 986 18 986 18 986 18 986 18 986 18 986 18 986 18 986 18 986 227 834 250 453 264 913
Other expenditure 16 284 16 284 16 284 16 284 16 284 16 284 16 284 16 284 16 284 16 284 16 284 16 283 195 409 213 688 223 534
Cash Payments by Type 136 440 136 440 136 440 136 440 136 440 136 440 136 440 136 440 136 440 136 440 136 440 136 434 1 637 274 1 733 601 1 805 119
Other Cash Flows/Payments by Type
Capital assets 23 457 23 457 23 457 23 457 23 457 23 457 23 457 23 457 23 457 23 457 23 457 23 457 281 482 327 000 335 000
Repayment of borrowing –
Other Cash Flows/Payments 5 000 3 000 2 000 2 000 2 000 2 000 2 000 2 000 – 20 000 40 000 80 000
Total Cash Payments by Type 164 897 162 897 161 897 161 897 161 897 161 897 161 897 161 897 159 897 159 897 159 897 159 891 1 938 757 2 100 601 2 220 119
NET INCREASE/(DECREASE) IN CASH HELD 277 832 (70 168) (69 168) (69 168) 169 832 (69 168) (69 168) (69 168) 202 239 (90 624) (90 624) (90 618) (37 969) 24 655 48 276
Cash/cash equivalents at the month/year begin: 43 895 321 727 251 559 182 392 113 224 283 057 213 889 144 722 75 554 277 793 187 168 96 544 43 895 5 926 30 580
Cash/cash equivalents at the month/year end: 321 727 251 559 182 392 113 224 283 057 213 889 144 722 75 554 277 793 187 168 96 544 5 926 5 926 30 580 78 857
Medium Term Revenue and Expenditure
FrameworkBudget Year 2020/21

Madibeng Local Municipality 2020/21 /Final Annual Budget and MTREF
79
2.10 Annual budgets and SDBIPs – internal departments
The SDBIP’s for the different departments will in terms of section 53(1)(c)(ii) of the MFMA be
tabled and approved by the mayor within 28 days after the approval of the annual budget
2.11 Contracts having future budgetary implications
In terms of the Municipality’s Supply Chain Management Policy, no contracts are awarded beyond the medium-term revenue and expenditure framework (three years). In ensuring adherence to this contractual time frame limitation, all reports submitted to either the Bid Evaluation and Adjudication Committees must obtain formal financial comments from the Financial Management Division of the Treasury Department.
2.12 Capital expenditure details
The following three tables present details of the Municipality’s capital expenditure programme, firstly on new assets, then the renewal of assets and finally on the repair and maintenance of assets.
Table 54 MBRR SA 34a - Capital expenditure on new assets by asset class
Description Ref 2016/17 2017/18 2018/19
R thousand 1Audited
Outcome
Audited
Outcome
Audited
Outcome
Original
Budget
Adjusted
Budget
Full Year
Forecast
Budget Year
2020/21
Budget Year
+1 2021/22
Budget Year
+2 2022/23
Capital expenditure on new assets by Asset Class/Sub-class
Infrastructure 224 024 90 213 111 650 188 010 188 010 188 010 233 507 276 000 309 000
Roads Infrastructure 95 245 – – – – – 62 600 98 000 91 000
Roads 95 245 62 600 98 000 91 000
Electrical Infrastructure 22 000 – – – – – 7 697 40 000 45 000
MV Networks 22 000 7 697 40 000 45 000
Water Supply Infrastructure 86 271 77 158 87 610 135 000 135 000 135 000 97 400 65 000 85 000
Distribution 86 271 77 158 82 073 135 000 135 000 135 000 97 400 65 000 85 000
Sanitation Infrastructure 20 509 13 055 24 040 53 010 53 010 53 010 65 810 73 000 88 000
Waste Water Treatment Works 20 509 13 055 24 040 45 500 45 500 45 500 65 810 73 000 88 000
Outfall Sewers – – – 1 200 1 200 1 200 – – –
Toilet Facilities – – – 6 310 6 310 6 310 – – –
Solid Waste Infrastructure – – – – – – – – –
Community Assets 25 189 – 409 – 9 200 9 200 46 294 29 559 15 408
Community Facilities 11 098 – – – – – 46 294 29 559 15 408
Testing Stations – 16 000 –
Libraries 1 990 11 708 – –
Markets 13 519 13 559 15 408
Stalls – – – – – – 13 626 – –
Taxi Ranks/Bus Terminals 7 442 – –
Sport and Recreation Facilities 14 091 – 409 – 9 200 9 200 – – –
Outdoor Facilities 14 091 – 409 – 9 200 9 200 – – –
Furniture and Office Equipment 1 585 4 593 19 869 – 10 429 10 429 – – –
Furniture and Office Equipment 1 585 4 593 19 869 – 10 429 10 429 – – –
Total Capital Expenditure on new assets 1 252 614 112 636 135 708 188 010 207 639 207 639 279 801 305 559 324 408
Current Year 2019/202020/21 Medium Term Revenue & Expenditure
Framework

Madibeng Local Municipality 2020/21 /Final Annual Budget and MTREF
80
Table 55 MBRR SA34b - Capital expenditure on the renewal of existing assets by asset class
Table 56 MBRR SA34c - Repairs and maintenance expenditure by asset class
Description Ref 2016/17 2017/18 2018/19
R thousand 1Audited
Outcome
Audited
Outcome
Audited
Outcome
Original
Budget
Adjusted
Budget
Full Year
Forecast
Budget Year
2020/21
Budget Year
+1 2021/22
Budget Year
+2 2022/23
Capital expenditure on renewal of existing assets by Asset Class/Sub-class
Infrastructure – 15 381 795 16 787 18 703 18 703 – – –
Electrical Infrastructure – 14 352 795 16 787 18 703 18 703 – – –
LV Networks – 14 352 795 16 787 18 703 18 703 – – –
Solid Waste Infrastructure – 1 029 – – – – – – –
Landfill Sites – 1 029 – – – – – – –
Community Assets – 5 292 – – – – – – –
Community Facilities – 5 292 – – – – – – –
Taxi Ranks/Bus Terminals – 5 292 – – – – – – –
Total Capital Expenditure on renewal of existing assets 1 – 20 673 795 16 787 18 703 18 703 – – –
Renewal of Existing Assets as % of total capex 0,0% 9,5% 0,4% 6,0% 6,0% 6,0% 0,0% 0,0% 0,0%
Renewal of Existing Assets as % of deprecn" 0,0% 4,4% 0,2% 3,4% 3,8% 3,8% 0,0% 0,0% 0,0%
Current Year 2019/202020/21 Medium Term Revenue & Expenditure
Framework
Description Ref 2016/17 2017/18 2018/19
R thousand 1Audited
Outcome
Audited
Outcome
Audited
Outcome
Original
Budget
Adjusted
Budget
Full Year
Forecast
Budget Year
2020/21
Budget Year
+1 2021/22
Budget Year
+2 2022/23
Repairs and maintenance expenditure by Asset Class/Sub-class
Infrastructure 104 620 90 417 91 821 82 200 101 579 101 579 84 300 88 918 96 234
Roads Infrastructure 11 070 1 625 2 665 6 600 4 600 4 600 6 600 6 917 7 249
Roads
Road Structures 11 070 1 168 1 996 5 000 3 000 3 000 5 000 5 240 5 492
Road Furniture – 457 669 1 600 1 600 1 600 1 600 1 677 1 757
Electrical Infrastructure 22 000 26 410 38 881 26 000 33 950 33 950 31 200 32 698 34 267
Power Plants 22 000 25 914 38 881 26 000 32 950 32 950 30 000 31 440 32 949
LV Networks – 496 – – 1 000 1 000 1 200 1 258 1 318
Water Supply Infrastructure 44 550 54 283 37 618 35 800 51 174 51 174 31 200 32 698 37 267
Reservoirs – 691 601 1 000 1 000 1 000 1 000 1 048 1 098
Water Treatment Works 44 550 35 656 25 171 21 800 40 424 40 424 23 600 24 733 25 920
Distribution – 6 451 200 5 000 5 000 5 000 600 629 659
Distribution Points – 11 485 11 646 8 000 4 750 4 750 6 000 6 288 9 590
Sanitation Infrastructure 27 000 7 694 12 405 10 000 10 055 10 055 13 000 13 672 14 376
Pump Station 27 000 7 694 12 405 10 000 10 055 10 055 13 000 13 672 14 376
Solid Waste Infrastructure – 148 252 800 800 800 800 838 879
Landfill Sites – 148 252 800 800 800 800 838 879
Information and Communication Infrastructure – 257 – 3 000 1 000 1 000 1 500 2 096 2 197
Data Centres – 257 – 3 000 1 000 1 000 1 500 2 096 2 197
Community Assets 5 250 2 588 745 2 630 2 629 2 629 2 110 2 735 2 867
Community Facilities 5 250 2 588 745 2 600 2 600 2 600 2 100 2 725 2 856
Cemeteries/Crematoria 5 250 1 252 451 800 800 800 800 838 879
Parks – 689 137 1 000 1 000 1 000 1 000 1 048 1 098
Public Open Space – 647 157 800 800 800 300 838 879
Sport and Recreation Facilities – – – 30 29 29 10 10 11
Outdoor Facilities – – – 30 29 29 10 10 11 1 1 1 1 1 1 1 1 1
Other assets 10 886 26 – 70 68 68 70 73 77
Operational Buildings 10 886 26 – 70 68 68 70 73 77
Municipal Offices 10 886 26 – 70 68 68 70 73 77
Machinery and Equipment – 492 699 1 810 1 810 1 810 2 665 2 793 2 927
Machinery and Equipment – 492 699 1 810 1 810 1 810 2 665 2 793 2 927
Transport Assets – 3 294 1 314 1 000 2 480 2 480 3 000 3 144 3 295
Transport Assets – 3 294 1 314 1 000 2 480 2 480 3 000 3 144 3 295
Total Repairs and Maintenance Expenditure 1 120 756 96 818 94 580 87 710 108 566 108 566 92 145 97 664 105 400
R&M as a % of PPE 2,1% 1,8% 1,8% 1,4% 1,7% 1,7% 1,7% 1,5% 1,5%
R&M as % Operating Expenditure 5,3% 4,5% 3,0% 3,6% 4,7% 4,7% 10,7% 4,0% 4,1%
Current Year 2019/202020/21 Medium Term Revenue & Expenditure
Framework

Madibeng Local Municipality 2020/21 /Final Annual Budget and MTREF
81
Table 57 MBRR SA34d - Depreciation by asset class
Table 58 MBRR SA34e - Capital expenditure on the upgrading of existing assets by asset class
Description Ref 2016/17 2017/18 2018/19
R thousand 1Audited
Outcome
Audited
Outcome
Audited
Outcome
Original
Budget
Adjusted
Budget
Full Year
Forecast
Budget Year
2020/21
Budget Year
+1 2021/22
Budget Year
+2 2022/23
Capital expenditure on upgrading of existing assets by Asset Class/Sub-class
Infrastructure – 82 518 73 907 77 000 87 000 87 000 – – –
Roads Infrastructure – 82 518 73 907 77 000 87 000 87 000 – – –
Roads – 82 518 73 907 77 000 87 000 87 000 – – –
Community Assets – 898 – – – – – – –
Community Facilities – – – – – – – – –
Sport and Recreation Facilities – 898 – – – – – – –
Indoor Facilities – 898 – – – – – – –
Total Capital Expenditure on upgrading of existing assets 1 – 83 416 73 907 77 000 87 000 87 000 – – –
Upgrading of Existing Assets as % of total capex 0,0% 38,5% 35,1% 27,3% 27,8% 27,8% 0,0% 0,0% 0,0%
Upgrading of Existing Assets as % of deprecn" 0,0% 17,6% 15,6% 15,7% 17,8% 17,8% 0,0% 0,0% 0,0%
Current Year 2019/202020/21 Medium Term Revenue & Expenditure
Framework
Description Ref 2016/17 2017/18 2018/19
R thousand 1Audited
Outcome
Audited
Outcome
Audited
Outcome
Original
Budget
Adjusted
Budget
Full Year
Forecast
Budget Year
2020/21
Budget Year
+1 2021/22
Budget Year
+2 2022/23
Depreciation by Asset Class/Sub-class
Infrastructure 318 578 445 537 452 360 449 015 449 015 449 015 444 015 450 805 457 811
Roads Infrastructure 110 454 381 954 452 360 368 917 368 917 368 917 368 917 368 917 368 917
Roads 110 454 381 954 452 360 368 917 368 917 368 917 368 917 368 917 368 917
Storm water Infrastructure – 906 – 953 953 953 953 953 953
Drainage Collection – 906 – – – – – – –
Storm water Conveyance 953 953 953 953 953 953
Electrical Infrastructure 51 090 48 110 – 50 612 50 612 50 612 50 612 50 612 50 612
Power Plants – 48 110 – – – – – – –
MV Networks 51 090 – – 50 612 50 612 50 612 50 612 50 612 50 612
Water Supply Infrastructure 138 110 12 116 – 12 746 12 746 12 746 7 746 14 536 21 541
Dams and Weirs – 12 116 – – – – – – –
Distribution 138 110 – – 12 746 12 746 12 746 7 746 14 536 21 541
Sanitation Infrastructure 12 924 – – 13 596 13 596 13 596 13 596 13 596 13 596
Waste Water Treatment Works 12 924 – – 13 596 13 596 13 596 13 596 13 596 13 596
Solid Waste Infrastructure 6 000 2 083 – 2 192 2 192 2 192 2 192 2 192 2 192
Landfill Sites 6 000 2 083 – 2 192 2 192 2 192 2 192 2 192 2 192
Rail Infrastructure – 368 – – – – – – –
Rail Lines – 368 – – – – – – –
Community Assets 52 788 11 405 11 446 32 221 32 221 32 221 32 221 32 221 32 221
Community Facilities 13 223 11 405 11 446 25 909 25 909 25 909 25 909 25 909 25 909
Halls – 11 405 – 11 998 11 998 11 998 11 998 11 998 11 998
Centres – – 11 446 – – – – – –
Libraries 13 223 – – 13 911 13 911 13 911 13 911 13 911 13 911
Sport and Recreation Facilities 39 565 – – 6 312 6 312 6 312 6 312 6 312 6 312
Outdoor Facilities 39 565 6 312 6 312 6 312 6 312 6 312 6 312
Other assets 87 202 3 373 – 3 549 3 549 3 549 3 549 3 549 3 549
Operational Buildings 87 202 3 373 – 3 549 3 549 3 549 3 549 3 549 3 549
Municipal Offices – 3 373 – 3 549 3 549 3 549 3 549 3 549 3 549
Capital Spares 87 202
Intangible Assets – 3 393 2 592 – – – – – –
Servitudes – 3 393 2 592
Computer Equipment – 3 813 – – – – – – –
Computer Equipment – 3 813 – – – – – – –
Furniture and Office Equipment 384 4 958 3 680 5 215 5 215 5 215 5 215 5 215 5 215
Furniture and Office Equipment 384 4 958 3 680 5 215 5 215 5 215 5 215 5 215 5 215
Machinery and Equipment – 1 857 – – – – – – –
Machinery and Equipment – 1 857 – – – – – – –
Transport Assets – – 4 086 – – – – – –
Transport Assets – – 4 086 – – – – – –
Total Depreciation 1 458 952 474 336 474 165 490 000 490 000 490 000 485 000 491 790 498 796
Current Year 2019/202020/21 Medium Term Revenue & Expenditure
Framework
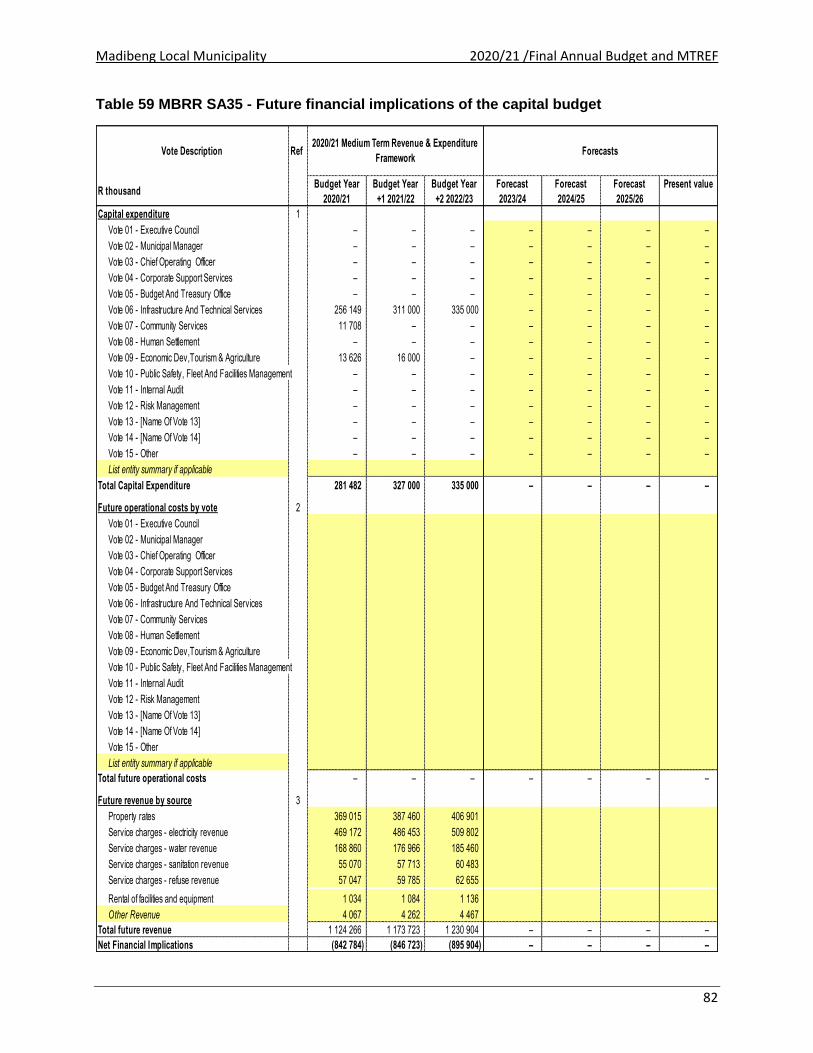
Madibeng Local Municipality 2020/21 /Final Annual Budget and MTREF
82
Table 59 MBRR SA35 - Future financial implications of the capital budget
Vote Description Ref
R thousandBudget Year
2020/21
Budget Year
+1 2021/22
Budget Year
+2 2022/23
Forecast
2023/24
Forecast
2024/25
Forecast
2025/26
Present value
Capital expenditure 1
Vote 01 - Executive Council – – – – – – –
Vote 02 - Municipal Manager – – – – – – –
Vote 03 - Chief Operating Officer – – – – – – –
Vote 04 - Corporate Support Services – – – – – – –
Vote 05 - Budget And Treasury Office – – – – – – –
Vote 06 - Infrastructure And Technical Services 256 149 311 000 335 000 – – – –
Vote 07 - Community Services 11 708 – – – – – –
Vote 08 - Human Settlement – – – – – – –
Vote 09 - Economic Dev,Tourism & Agriculture 13 626 16 000 – – – – –
Vote 10 - Public Safety, Fleet And Facilities Management – – – – – – –
Vote 11 - Internal Audit – – – – – – –
Vote 12 - Risk Management – – – – – – –
Vote 13 - [Name Of Vote 13] – – – – – – –
Vote 14 - [Name Of Vote 14] – – – – – – –
Vote 15 - Other – – – – – – –
List entity summary if applicable
Total Capital Expenditure 281 482 327 000 335 000 – – – –
Future operational costs by vote 2
Vote 01 - Executive Council
Vote 02 - Municipal Manager
Vote 03 - Chief Operating Officer
Vote 04 - Corporate Support Services
Vote 05 - Budget And Treasury Office
Vote 06 - Infrastructure And Technical Services
Vote 07 - Community Services
Vote 08 - Human Settlement
Vote 09 - Economic Dev,Tourism & Agriculture
Vote 10 - Public Safety, Fleet And Facilities Management
Vote 11 - Internal Audit
Vote 12 - Risk Management
Vote 13 - [Name Of Vote 13]
Vote 14 - [Name Of Vote 14]
Vote 15 - Other
List entity summary if applicable
Total future operational costs – – – – – – –
Future revenue by source 3
Property rates 369 015 387 460 406 901
Service charges - electricity revenue 469 172 486 453 509 802
Service charges - water revenue 168 860 176 966 185 460
Service charges - sanitation revenue 55 070 57 713 60 483
Service charges - refuse revenue 57 047 59 785 62 655
Rental of facilities and equipment 1 034 1 084 1 136
Other Revenue 4 067 4 262 4 467
Total future revenue 1 124 266 1 173 723 1 230 904 – – – –
Net Financial Implications (842 784) (846 723) (895 904) – – – –
Forecasts2020/21 Medium Term Revenue & Expenditure
Framework

Madibeng Local Municipality 2020/21 /Final Annual Budget and MTREF
83
Table 60 MBRR SA36 - Detailed capital budget per municipal vote
R thousand
Function Project Description Type Asset Sub-Class Ward Location
Audited
Outcome
2018/19
Current Year
2019/20
Full Year
Forecast
Budget Year
2020/21
Budget Year
+1 2021/22
Budget Year
+2 2022/23
Parent municipality:
List all capital projects grouped by Function
Executive And Council Capital:Non-Infrastructure:New:Furniture And Office Equipment NEW Furniture And Office Equipment R-WHOLE OF MUNICIPALITY 612 120 – – –
Finance And Administration Capital:Non-Infrastructure:New:Furniture And Office Equipment NEW Furniture And Office Equipment R-WHOLE OF MUNICIPALITY 17 659 271 – – –
Internal Audit Capital:Non-Infrastructure:New:Furniture And Office Equipment NEW Furniture And Office Equipment R-WHOLE OF MUNICIPALITY 66 – – – –
Community And Social Services Capital:Non-Infrastructure:Existing:Renewal:Community Assets:Community Facilities:Libraries RENEWAL Libraries R-WARD 17 – – 11 708 – –
Community And Social Services Capital:Non-Infrastructure:New:Furniture And Office Equipment NEW Furniture And Office Equipment R-WHOLE OF MUNICIPALITY 516 – – – –
Sport And Recreation Capital:Non-Infrastructure:New:Machinery And Equipment NEW Machinery And Equipment R-WHOLE OF MUNICIPALITY 172 – – – –
Sport And Recreation Capital:Non-Infrastructure:New:Community Assets:Sport And Recreation Facilities:Outdoor Facilities NEW Outdoor Facilities R-WARD 06 409 9 200 – – –
Public Safety Capital:Non-Infrastructure:New:Furniture And Office Equipment NEW Furniture And Office Equipment R-WHOLE OF MUNICIPALITY 18 34 – – –
Public Safety Capital:Non-Infrastructure:New:Transport Assets NEW Transport Assets R-WHOLE OF MUNICIPALITY 2 923 – – 16 000 –
Housing Capital:Non-Infrastructure:New:Furniture And Office Equipment NEW Furniture And Office Equipment R-WHOLE OF MUNICIPALITY – 3 – – –
Planning And Development Capital:Non-Infrastructure:New:Furniture And Office Equipment NEW Furniture And Office Equipment R-WHOLE OF MUNICIPALITY 30 – – – –
Road Transport Capital:Infrastructure:Existing:Upgrading:Roads Infrastructure:Roads UPGRADING Roads R-WARD 01 – – 10 000 12 000 12 000
Road Transport Capital:Infrastructure:Existing:Upgrading:Roads Infrastructure:Roads UPGRADING Roads R-WARD 02 10 538 11 000 – – –
Road Transport Capital:Infrastructure:Existing:Upgrading:Roads Infrastructure:Roads UPGRADING Roads R-WARD 03 9 206 11 000 2 500 12 000 12 000
Road Transport Capital:Infrastructure:Existing:Upgrading:Roads Infrastructure:Roads UPGRADING Roads R-WARD 04 8 124 11 000 – – –
Road Transport Capital:Infrastructure:Existing:Upgrading:Roads Infrastructure:Roads UPGRADING Roads R-WARD 07 7 217 11 000 6 800 13 000 12 000
Road Transport Capital:Infrastructure:Existing:Upgrading:Roads Infrastructure:Roads UPGRADING Roads R-WARD 09 21 520 11 000 – – –
Road Transport Capital:Infrastructure:Existing:Upgrading:Roads Infrastructure:Roads UPGRADING Roads R-WARD 15 6 816 11 000 8 000 12 000 12 000
Road Transport Capital:Infrastructure:Existing:Upgrading:Roads Infrastructure:Roads UPGRADING Roads R-WARD 16 – – – – –
Road Transport Capital:Infrastructure:Existing:Upgrading:Roads Infrastructure:Roads UPGRADING Roads R-WARD 17 8 617 10 000 – – –
Road Transport Capital:Infrastructure:Existing:Upgrading:Roads Infrastructure:Roads UPGRADING Roads R-WARD 18 – – 4 500 12 000 7 000
Road Transport Capital:Infrastructure:Existing:Upgrading:Roads Infrastructure:Roads UPGRADING Roads R-WARD 21 1 869 11 000 5 800 12 000 12 000
Road Transport Capital:Infrastructure:Existing:Upgrading:Roads Infrastructure:Roads UPGRADING Roads R-WARD 34 – – 12 000 12 000 12 000
Road Transport Capital:Infrastructure:Existing:Upgrading:Roads Infrastructure:Roads UPGRADING Roads R-WARD 35 – – 13 000 13 000 12 000
Road Transport L:Non-Infrastructure:Existing:Renewal:Community Assets:Community Facilities:Taxi Ranks/Bus Terminals RENEWAL Taxi Ranks/Bus Terminals R-WARD 16 – – 7 442 – –
Road Transport Capital:Non-Infrastructure:New:Furniture And Office Equipment NEW Furniture And Office Equipment R-WHOLE OF MUNICIPALITY 675 – – – –
Road Transport Capital:Non-Infrastructure:New:Machinery And Equipment NEW Machinery And Equipment R-WHOLE OF MUNICIPALITY 684 – – – –
Energy Sources Capital:Non-Infrastructure:New:Furniture And Office Equipment NEW Furniture And Office Equipment R-WHOLE OF MUNICIPALITY 180 10 000 – – –
Energy Sources Capital:Infrastructure:Existing:Renewal:Electrical Infrastructure:Lv Networks RENEWAL Lv Networks R-WARD 14 – 16 006 7 697 40 000 45 000
Energy Sources Capital:Infrastructure:Existing:Renewal:Electrical Infrastructure:Lv Networks RENEWAL Lv Networks R-WARD 15 795 2 697 – – –
Water Management Capital:Infrastructure:New:Water Supply Infrastructure:Boreholes NEW Boreholes R-WHOLE OF MUNICIPALITY 5 537 – 2 000 15 000 15 000
Water Management Capital:Infrastructure:New:Water Supply Infrastructure:Distribution NEW Distribution R-WARD 01 – 15 000 – – –
Water Management Capital:Infrastructure:New:Water Supply Infrastructure:Distribution NEW Distribution R-WARD 03 16 830 40 000 – – –
Water Management Capital:Infrastructure:New:Water Supply Infrastructure:Distribution NEW Distribution R-WARD 08 25 282 35 000 – – –
Water Management Capital:Infrastructure:New:Water Supply Infrastructure:Distribution NEW Distribution R-WARD 10 39 961 45 000 50 400 35 000 55 000
Water Management Capital:Infrastructure:New:Water Supply Infrastructure:Distribution NEW Distribution R-WARD 34 – – 45 000 15 000 15 000
Waste Water Management Capital:Infrastructure:Existing:Upgrading:Sanitation Infrastructure:Outfall Sewers UPGRADING Outfall Sewers R-WARD 24 – – 60 810 40 000 50 000
Waste Water Management Capital:Infrastructure:New:Sanitation Infrastructure:Waste Water Treatment Works NEW Waste Water Treatment Works R-WARD 08 24 040 45 500 – – –
Waste Water Management Capital:Infrastructure:New:Sanitation Infrastructure:Outfall Sewers NEW Outfall Sewers R-WARD 14 – – 2 000 11 000 11 000
Waste Water Management Capital:Infrastructure:New:Sanitation Infrastructure:Outfall Sewers NEW Outfall Sewers R-WARD 19 – 1 200 – – –
Waste Water Management Capital:Infrastructure:New:Sanitation Infrastructure:Outfall Sewers NEW Outfall Sewers R-WARD 20 – – 2 000 10 000 12 000
Waste Water Management Capital:Infrastructure:New:Sanitation Infrastructure:Toilet Facilities NEW Toilet Facilities R-WARD 01 – 6 310 1 000 12 000 15 000
Waste Water Management Capital:Non-Infrastructure:New:Furniture And Office Equipment NEW Furniture And Office Equipment R-WHOLE OF MUNICIPALITY 87 – – – –
Waste Management Capital:Non-Infrastructure:New:Furniture And Office Equipment NEW Furniture And Office Equipment R-WHOLE OF MUNICIPALITY 20 – – – –
Other Capital:Non-Infrastructure:New:Furniture And Office Equipment NEW Markets R-WHOLE OF MUNICIPALITY – – 27 144 13 559 15 408
Parent Capital expenditure 210 410 313 341 279 801 305 559 324 408
2020/21 Medium Term Revenue & Expenditure
Framework

Madibeng Local Municipality 2020/21 /Final Annual Budget and MTREF
84
2.13 Legislation compliance status
Compliance with the MFMA implementation requirements have been substantially adhered to through the following activities: 1. In year reporting
Reporting to National Treasury in electronic format was fully complied with on a monthly basis. Section 71 reporting to the Executive Mayor (within 10 working days) has progressively improved and includes monthly published financial performance on the Municipality’s website.
2. Internship programme
The Municipality is participating in the Municipal Financial Management Internship programme and has employed five interns undergoing training in various divisions of the Financial Services Department.
3. Budget and Treasury Office
The Budget and Treasury Office has been established in accordance with the MFMA. 4. Audit Committee
An Audit Committee has been established and is fully functional. 5. Service Delivery and Implementation Plan
The detail SDBIP document is at a Final stage and will be finalised after approval of the 2020/21 MTREF in May 2020 directly aligned and informed by the 2020/21MTREF.
6. Annual Report
Annual report is compiled in terms of the MFMA and National Treasury requirements. 7. MFMA Training
The MFMA training module in electronic format is presented at the Municipality’s internal Centre and training is ongoing.
8. Policies
All financial related policies are reviewed on an annual bases or whenever the need arises and submitted with the budget for adoption by council.
9. Risk Management
A Risk Committee has been established and is functional

Madibeng Local Municipality 2020/21 /Final Annual Budget and MTREF
85
2.14 Other supporting documents
Table 62 MBRR Table SA1 - Supporting detail to budgeted financial performance
2016/17 2017/18 2018/19
Audited
Outcome
Audited
Outcome
Audited
Outcome
Original
Budget
Adjusted
Budget
Full Year
Forecast
Pre-audit
outcome
Budget Year
2020/21
Budget Year
+1 2021/22
Budget Year
+2 2022/23
R thousand
REVENUE ITEMS:
Property rates 6
Total Property Rates 269 185 309 226 339 839 383 438 375 847 375 847 345 728 396 933 416 718 437 562
less Revenue Foregone (exemptions, reductions and
rebates and impermissable values in excess of section 17
of MPRA) – 51 248 89 145 113 438 25 901 25 901 25 974 27 918 29 258 30 662
Net Property Rates 269 185 257 978 250 694 270 000 349 946 349 946 319 754 369 015 387 460 406 901
Service charges - electricity revenue 6
Total Service charges - electricity revenue 457 447 435 622 403 687 475 000 475 000 475 000 413 501 469 187 486 468 509 819
less Revenue Foregone (in excess of 50 kwh per indigent
household per month)
less Cost of Free Basis Services (50 kwh per indigent
household per month) 9 658 9 316 14 380 – – – 15 16 16
Net Service charges - electricity revenue 447 788 426 306 389 307 475 000 475 000 475 000 413 501 469 172 486 453 509 802
Service charges - water revenue 6
Total Service charges - water revenue 148 907 120 125 168 040 164 101 164 101 164 101 149 593 170 361 178 539 187 108
less Revenue Foregone (in excess of 6 kilolitres per
indigent household per month)
less Cost of Free Basis Services (6 kilolitres per indigent
household per month) 600 600 5 005 2 501 2 501 2 501 1 501 1 573 1 649
Net Service charges - water revenue 148 307 119 525 163 035 161 600 161 600 161 600 149 593 168 860 176 966 185 460
Service charges - sanitation revenue
Total Service charges - sanitation revenue 41 744 43 418 48 201 53 075 53 075 53 075 48 832 55 770 58 447 61 252
less Revenue Foregone (in excess of free sanitation service
to indigent households)
less Cost of Free Basis Services (free sanitation service to
indigent households) 20 20 1 600 800 800 800 700 734 769
Net Service charges - sanitation revenue 41 724 43 398 46 601 52 275 52 275 52 275 48 832 55 070 57 713 60 483
Service charges - refuse revenue 6
Total refuse removal revenue 34 069 51 669 47 469 54 800 54 800 54 800 51 507 58 847 61 672 64 632
Total landfill revenue
less Revenue Foregone (in excess of one removal a week to
indigent households)
less Cost of Free Basis Services (removed once a week to
indigent households) 500 500 1 800 1 800 1 800 1 800 1 800 1 886 1 977
Net Service charges - refuse revenue 33 569 51 169 45 669 53 000 53 000 53 000 51 507 57 047 59 785 62 655
Other Revenue by source
Fuel Levy
Other Revenue 76 715 3 094 3 806 3 579 3 579 3 579 2 753 3 754 3 934 4 123
Total 'Other' Revenue 1 76 715 3 094 3 806 3 579 3 579 3 579 2 753 3 754 3 934 4 123
2020/21 Medium Term Revenue & Expenditure
FrameworkCurrent Year 2019/20
Description Ref
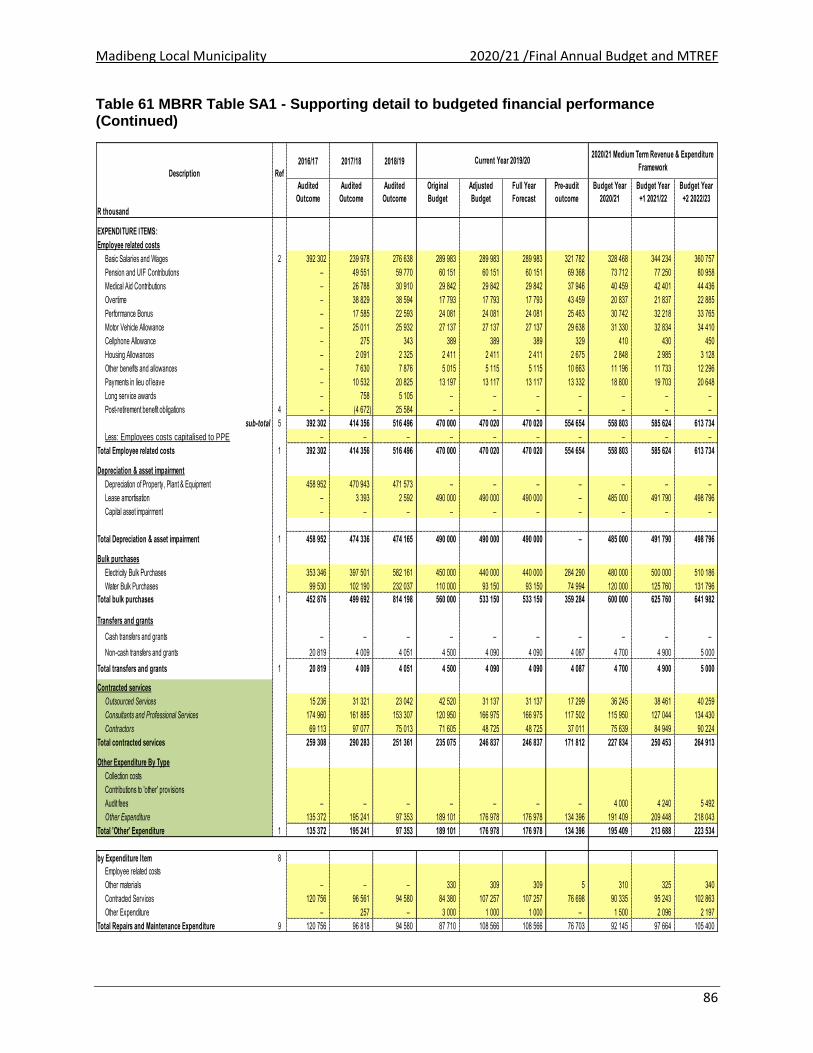
Madibeng Local Municipality 2020/21 /Final Annual Budget and MTREF
86
Table 61 MBRR Table SA1 - Supporting detail to budgeted financial performance (Continued)
2016/17 2017/18 2018/19
Audited
Outcome
Audited
Outcome
Audited
Outcome
Original
Budget
Adjusted
Budget
Full Year
Forecast
Pre-audit
outcome
Budget Year
2020/21
Budget Year
+1 2021/22
Budget Year
+2 2022/23
R thousand
EXPENDITURE ITEMS:
Employee related costs
Basic Salaries and Wages 2 392 302 239 978 276 638 289 983 289 983 289 983 321 782 328 468 344 234 360 757
Pension and UIF Contributions – 49 551 59 770 60 151 60 151 60 151 69 368 73 712 77 250 80 958
Medical Aid Contributions – 26 788 30 910 29 842 29 842 29 842 37 946 40 459 42 401 44 436
Overtime – 38 829 38 594 17 793 17 793 17 793 43 459 20 837 21 837 22 885
Performance Bonus – 17 585 22 593 24 081 24 081 24 081 25 463 30 742 32 218 33 765
Motor Vehicle Allowance – 25 011 25 932 27 137 27 137 27 137 29 638 31 330 32 834 34 410
Cellphone Allowance – 275 343 389 389 389 329 410 430 450
Housing Allowances – 2 091 2 325 2 411 2 411 2 411 2 675 2 848 2 985 3 128
Other benefits and allowances – 7 630 7 876 5 015 5 115 5 115 10 663 11 196 11 733 12 296
Payments in lieu of leave – 10 532 20 825 13 197 13 117 13 117 13 332 18 800 19 703 20 648
Long service awards – 758 5 105 – – – – – – –
Post-retirement benefit obligations 4 – (4 672) 25 584 – – – – – – –
sub-total 5 392 302 414 356 516 496 470 000 470 020 470 020 554 654 558 803 585 624 613 734
Less: Employees costs capitalised to PPE – – – – – – – – – –
Total Employee related costs 1 392 302 414 356 516 496 470 000 470 020 470 020 554 654 558 803 585 624 613 734
Depreciation & asset impairment
Depreciation of Property, Plant & Equipment 458 952 470 943 471 573 – – – – – – –
Lease amortisation – 3 393 2 592 490 000 490 000 490 000 – 485 000 491 790 498 796
Capital asset impairment – – – – – – – – – –
Total Depreciation & asset impairment 1 458 952 474 336 474 165 490 000 490 000 490 000 – 485 000 491 790 498 796
Bulk purchases
Electricity Bulk Purchases 353 346 397 501 582 161 450 000 440 000 440 000 284 290 480 000 500 000 510 186
Water Bulk Purchases 99 530 102 190 232 037 110 000 93 150 93 150 74 994 120 000 125 760 131 796
Total bulk purchases 1 452 876 499 692 814 198 560 000 533 150 533 150 359 284 600 000 625 760 641 982
Transfers and grants
Cash transfers and grants – – – – – – – – – –
Non-cash transfers and grants 20 819 4 009 4 051 4 500 4 090 4 090 4 087 4 700 4 900 5 000
Total transfers and grants 1 20 819 4 009 4 051 4 500 4 090 4 090 4 087 4 700 4 900 5 000
Contracted services
Outsourced Services 15 236 31 321 23 042 42 520 31 137 31 137 17 299 36 245 38 461 40 259
Consultants and Professional Services 174 960 161 885 153 307 120 950 166 975 166 975 117 502 115 950 127 044 134 430
Contractors 69 113 97 077 75 013 71 605 48 725 48 725 37 011 75 639 84 949 90 224
Total contracted services 259 308 290 283 251 361 235 075 246 837 246 837 171 812 227 834 250 453 264 913
Other Expenditure By Type
Collection costs
Contributions to 'other' provisions
Audit fees – – – – – – – 4 000 4 240 5 492
Other Expenditure 135 372 195 241 97 353 189 101 176 978 176 978 134 396 191 409 209 448 218 043
Total 'Other' Expenditure 1 135 372 195 241 97 353 189 101 176 978 176 978 134 396 195 409 213 688 223 534
Repairs and Maintenance
by Expenditure Item 8
Employee related costs
Other materials – – – 330 309 309 5 310 325 340
Contracted Services 120 756 96 561 94 580 84 380 107 257 107 257 76 698 90 335 95 243 102 863
Other Expenditure – 257 – 3 000 1 000 1 000 – 1 500 2 096 2 197
Total Repairs and Maintenance Expenditure 9 120 756 96 818 94 580 87 710 108 566 108 566 76 703 92 145 97 664 105 400
2020/21 Medium Term Revenue & Expenditure
FrameworkCurrent Year 2019/20
Description Ref

Madibeng Local Municipality 2020/21 /Final Annual Budget and MTREF
87
Table 62 MBRR Table SA2 – Matrix financial performance budget (revenue source/expenditure type and department)
Description Ref
R thousand 1
Revenue By Source
Property rates – – – – 369 015 – – – – – – – – – – 369 015
Service charges - electricity revenue – – – – 1 689 467 484 – – – – – – – – – 469 172
Service charges - water revenue – – – – – 168 860 – – – – – – – – – 168 860
Service charges - sanitation revenue – – – – – 55 070 – – – – – – – – – 55 070
Service charges - refuse revenue – – – – – – 57 047 – – – – – – – – 57 047 – – – – – – – – – – – – – – –
Rental of facilities and equipment – – – – – – 34 1 000 – – – – – – – 1 034
Interest earned - external investments – – – – 4 067 – – – – – – – – – – 4 067
Interest earned - outstanding debtors – – – – 46 886 71 780 12 791 – – – – – – – – 131 457
Dividends received – – – – – – – – – – – – – – – –
Fines, penalties and forfeits – – – – – – 0 – – 500 – – – – – 500
Licences and permits – – – – – – – – 198 1 001 – – – – – 1 199
Agency services – – – – – – – – – 12 000 – – – – – 12 000
Other revenue – – – – 1 167 – 996 1 481 – 110 – – – – – 3 754
Transfers and subsidies – – – – 773 367 13 519 – – 1 150 – – – – – – 788 036
Gains – – – – 0 – – – – – – – – – – 0
Total Revenue (excluding capital transfers and contributions) – – – – 1 196 190 776 713 70 868 2 481 1 348 13 611 – – – – – 2 061 212
Expenditure By Type
Employee related costs 24 469 3 010 24 671 23 621 60 596 130 006 132 915 27 776 13 742 99 410 9 571 9 014 558 803
Remuneration of councillors 31 633 – – – – – – – – – – – – – – 31 633
Debt impairment – – – – 200 000 – – – – – – – – – – 200 000
Depreciation & asset impairment 90 – 40 460 451 198 26 451 3 331 – 515 2 915 – – – – – 485 000
Finance charges – – – – 135 500 – – – – – – – – – – 135 500
Bulk purchases – – – – – 600 000 – – – – – – – – – 600 000
Other materials 665 60 70 435 580 8 525 1 490 66 100 11 575 20 10 – – – 23 596
Contracted services 1 360 1 500 600 14 960 34 475 105 919 33 440 2 800 70 31 210 1 500 – – – – 227 834
Transfers and subsidies – – – 4 700 – – – – – – – – – – – 4 700
Other expenditure 9 165 150 2 025 35 655 32 061 3 616 4 468 169 1 065 106 800 125 110 – – – 195 409
Losses – – – – 0 – – – – – – – – – – 0
Total Expenditure 67 382 4 720 27 406 79 832 914 410 874 516 175 644 30 811 15 492 251 910 11 216 9 134 – – – 2 462 474
Surplus/(Deficit) (67 382) (4 720) (27 406) (79 832) 281 780 (97 803) (104 775) (28 330) (14 144) (238 299) (11 216) (9 134) – – – (401 263)
Transfers and subsidies - capital (monetary allocations)
(National / Provincial and District) 281 482 281 482
Transfers and subsidies - capital (monetary allocations)
(National / Provincial Departmental Agencies,
Households, Non-profit Institutions, Private Enterprises,
Public Corporatons, Higher Educational Institutions) –
Transfers and subsidies - capital (in-kind - all) –
Surplus/(Deficit) after capital transfers &
contributions
(67 382) (4 720) (27 406) (79 832) 281 780 183 679 (104 775) (28 330) (14 144) (238 299) (11 216) (9 134) – – – (119 780)
Vote 15 - Other TotalVote 07 -
Community
Services
Vote 08 -
Human
Settlement
Vote 09 -
Economic
Dev,Tourism &
Agriculture
Vote 10 -
Public Safety,
Fleet And
Facilities
Management
Vote 11 -
Internal Audit
Vote 12 - Risk
Management
Vote 13 -
[Name Of Vote
13]
Vote 14 -
[Name Of Vote
14]
Vote 05 -
Budget And
Treasury Office
Vote 06 -
Infrastructure
And Technical
Services
Vote 01 -
Executive
Council
Vote 02 -
Municipal
Manager
Vote 03 - Chief
Operating
Officer
Vote 04 -
Corporate
Support
Services

Madibeng Local Municipality 2020/21 /Final Annual Budget and MTREF
88
Table 63 MBRR Table SA3 – Supporting detail to Statement of Financial Position
2016/17 2017/18 2018/19
Audited
Outcome
Audited
Outcome
Audited
Outcome
Original
Budget
Adjusted
Budget
Full Year
Forecast
Pre-audit
outcome
Budget Year
2020/21
Budget Year
+1 2021/22
Budget Year
+2 2022/23
R thousand
ASSETS
Consumer debtors
Consumer debtors 337 257 1 679 410 2 134 999 819 511 819 511 819 511 2 426 226 2 436 000 2 670 600 2 915 261
Less: Provision for debt impairment – (1 042 992) (1 843 324) – – – (1 673 198) (1 540 000) (1 849 600) (2 139 261)
Total Consumer debtors 2 337 257 636 418 291 675 819 511 819 511 819 511 753 028 896 000 821 000 776 000
Debt impairment provision
Balance at the beginning of the year – (1 224 432) (907 711) – – – (1 673 173) – – –
Contributions to the provision – 316 721 (765 462) – – – 15 – – –
Bad debts written off – (135 281) (170 151) – – – (40) – – –
Balance at end of year – (1 042 992) (1 843 324) – – – (1 673 198) – – –
Property, plant and equipment (PPE)
PPE at cost/valuation (excl. finance leases) 5 778 180 9 407 481 9 686 095 6 224 950 6 203 499 6 203 499 9 816 272 6 542 339 6 630 650 6 835 000
Leases recognised as PPE 3
Less: Accumulated depreciation – 3 888 151 4 358 871 – – – 4 358 871 – – –
Total Property, plant and equipment (PPE) 2 5 778 180 5 519 330 5 327 224 6 224 950 6 203 499 6 203 499 5 457 401 6 542 339 6 630 650 6 835 000
LIABILITIES
Current liabilities - Borrowing
Short term loans (other than bank overdraft)
Current portion of long-term liabilities 4 470 2 013 2 013 – – – 2 013 2 013 2 013 2 013
Total Current liabilities - Borrowing 4 470 2 013 2 013 – – – 2 013 2 013 2 013 2 013
Trade and other payables
Trade Payables 5 631 434 557 608 1 088 234 470 655 400 655 400 655 903 528 382 742 394 829 400 000
Other creditors
Unspent conditional transfers 327 987 16 903 – 57 014 – –
VAT – 850 621 1 062 346 – – – 1 163 007 – – –
Total Trade and other payables 2 631 760 1 409 216 2 167 482 470 655 400 655 400 655 2 123 548 382 742 394 829 400 000
Non current liabilities - Borrowing
Borrowing 4 986 965 1 115 456 – 1 171 342 1 171 342 1 171 342 – 1 234 924 1 299 244 1 429 370
Finance leases (including PPP asset element) – (2 013) (2 013) – – – (2 013) – – –
Total Non current liabilities - Borrowing 986 965 1 113 443 (2 013) 1 171 342 1 171 342 1 171 342 (2 013) 1 234 924 1 299 244 1 429 370
Provisions - non-current
Retirement benefits – – – – – – – – – –
Refuse landfill site rehabilitation – 29 486 16 790 208 000 208 000 208 000 16 790 200 800 200 800 200 800
Other 205 126 20 905 26 010 – – – 26 010 – – –
Total Provisions - non-current 205 126 50 391 42 800 208 000 208 000 208 000 42 800 200 800 200 800 200 800
CHANGES IN NET ASSETS
Accumulated Surplus/(Deficit)
Accumulated Surplus/(Deficit) - opening balance 5 136 071 4 935 052 4 583 924 5 569 278 5 490 924 5 530 924 4 404 796 5 807 246 5 706 972 5 707 561
GRAP adjustments – – – – – – – – – –
Restated balance 5 136 071 4 935 052 4 583 924 5 569 278 5 490 924 5 530 924 4 404 796 5 807 246 5 706 972 5 707 561
Surplus/(Deficit) (362 370) (316 507) (1 318 530) (312 886) (175 897) (175 897) 342 769 (119 780) (52 518) 21 213
Transfers to/from Reserves – – – – – – – – – –
Depreciation offsets – – – – – – – – – –
Other adjustments – (151 943) 1 157 204 – – – – – – –
Accumulated Surplus/(Deficit) 1 4 773 701 4 466 603 4 422 597 5 256 392 5 315 026 5 355 026 4 747 566 5 687 465 5 654 454 5 728 773
Reserves
Housing Development Fund
Capital replacement – – – – – – – – – –
Self-insurance
Other reserves – – – – – – – – – –
Revaluation
Total Reserves 2 – – – – – – – – – –
TOTAL COMMUNITY WEALTH/EQUITY 2 4 773 701 4 466 603 4 422 597 5 256 392 5 315 026 5 355 026 4 747 566 5 687 465 5 654 454 5 728 773
Description Ref
2020/21 Medium Term Revenue & Expenditure
FrameworkCurrent Year 2019/20

Madibeng Local Municipality 2020/21 /Final Annual Budget and MTREF
89
Table 64 MBRR Table SA9 – Social, economic and demographic statistics and assumptions
Table 65 MBRR Table SA37 Projects delayed from previous financial year/s
2016/17 2017/18 2018/19 Current Year
2019/20
Outcome Outcome Outcome Original
Budget
Outcome Outcome Outcome
Demographics
Population STATSSA 348 359 477 493 493 508 524 527 529 532
Females aged 5 - 14 STATSSA 15 15 20 21 21 21 22 22 22 23
Males aged 5 - 14 STATSSA 15 16 21 21 21 22 23 23 23 23
Females aged 15 - 34 STATSSA 15 16 21 22 22 22 23 23 23 23
Males aged 15 - 34 STATSSA 19 19 26 27 27 28 28 29 29 29
Unemployment STATSSA 146 150 145 150 150 154 159 160 161 162
Monthly household income (no. of households) 1, 12
No income STATSSA 56 308 58 093 77 336 82 317 84 926 86 624 88 184 88 625 89 068 89 513
R1 - R1 600 STATSSA 11 818 12 192 16 231 17 276 17 824 18 180 18 508 18 600 18 693 18 787
R1 601 - R3 200 STATSSA 19 117 19 723 26 256 27 947 28 833 29 410 29 939 30 089 30 239 30 390
R3 201 - R6 400 STATSSA 60 479 62 396 83 064 88 414 91 217 93 041 94 716 95 189 95 665 96 144
R6 401 - R12 800 STATSSA 69 516 71 719 95 476 101 625 104 847 106 944 108 869 109 413 109 960 110 510
R12 801 - R25 600 STATSSA 67 083 69 209 92 135 98 068 101 177 103 201 105 058 105 584 106 112 106 642
R25 601 - R51 200 STATSSA 32 672 33 708 44 874 47 764 49 278 50 264 51 168 51 424 51 681 51 940
R52 201 - R102 400 STATSSA 16 684 17 213 22 914 24 390 25 163 25 667 26 129 26 259 26 390 26 522
R102 401 - R204 800 STATSSA 9 037 9 324 12 412 13 211 13 630 13 903 14 153 14 224 14 295 14 366
R204 801 - R409 600 STATSSA 3 128 3 227 4 296 4 573 4 718 4 812 4 899 4 924 4 948 4 973
R409 601 - R819 200 STATSSA 1 043 1 076 1 432 1 524 1 573 1 604 1 633 1 641 1 649 1 658
> R819 200 STATSSA 695 717 955 1 016 1 048 1 069 1 089 1 094 1 100 1 105
Poverty profiles (no. of households)
< R2 060 per household per month 13
Insert description 2
Household/demographics (000)
Number of people in municipal area STATSSA 347 578 358 596 477 381 493 493 493 508 524 527 529
Number of poor people in municipal area
Number of households in municipal area STATSSA 95 524 100 300 160 724 166 166 166 171 176 177 178
Number of poor households in municipal area
Definition of poor household (R per month)
Housing statistics 3
Formal
Informal
Total number of households - - - - - - - - - -
Dwellings provided by municipality 4
Dwellings provided by province/s
Dwellings provided by private sector 5
Total new housing dwellings - - - - - - - - - -
Economic 6
Inflation/inflation outlook (CPIX) 5,4% 6,4% 5,3% 4,9% 4,5% 4,6% 4,6%
Interest rate - borrowing N/A N/A N/A N/A N/A N/A N/A
Interest rate - investment
Remuneration increases 7,0% 6,4% 6,2% 7,0% 6,0% 6,7% 7,1%
Consumption growth (electricity)
Consumption growth (water)
Collection rates 7
Property tax/service charges 70,0% 75,0% 85,0%
Rental of facilities & equipment 100,0% 100,0% 100,0%
Interest - external investments 100,0% 100,0% 100,0%
Interest - debtors 100,0% 100,0% 100,0%
Revenue from agency services 100,0% 100,0% 100,0%
2011 CensusDescription of economic indicator 2001 Census 2007 Survey
2020/21 Medium Term Revenue & Expenditure
Framework
Ref.
Basis of calculation
R thousand
Function Project name Asset Class Ward Location GPS LongitudeOriginal
Budget
Full Year
Forecast
Budget Year
2020/21
Budget Year
+1 2021/22
Budget Year
+2 2022/23
Parent municipality:
List all capital projects grouped by Function
List all capital projects grouped by Entity
Entity Name
Project name
Previous
target year to
complete
Current Year 2019/202020/21 Medium Term Revenue & Expenditure
Framework

Madibeng Local Municipality 2020/21 /Final Annual Budget and MTREF
90
Table 66 MBRR Table SA38 Consolidated detailed operational projects
R thousand
Function Project Description Asset Sub-Class
Audited
Outcome
2018/19
Current Year
2019/20
Full Year
Forecast
Budget Year
2020/21
Budget Year +1
2021/22
Budget Year +2
2022/23
Parent municipality:
List all operational projects grouped by Function
Executive And Council O_Municipal Running Cost 73 156 78 171 82 085 87 602 91 807
Executive And Council O_Tws_A/Ht&C_Support And Distribution Programmes_Aids/Hiv 85 100 100 105 110
Executive And Council O_Tws_Cd_Gender Development 466 350 500 524 549
Executive And Council O_Tws_Cd_Youth Projects_Youth Development 171 400 600 629 659
Executive And Council Operational:Typical Work Streams:Capacity Building Training And Development:Capacity Building Counci 134 95 300 629 659
Executive And Council Operational:Typical Work Streams:Communication And Public Participation:Awareness Campaign 20 50 50 52 55
Executive And Council Operational:Typical Work Streams:Communication And Public Participation:Mayoral/Executive Mayor Camp 835 800 750 1 205 1 263
Executive And Council Operational:Typical Work Streams:Communication And Public Participation:Public Participation Meeting 1 358 1 300 1 400 2 201 2 306
Executive And Council Operational:Typical Work Streams:Community Development:Disability 211 300 300 314 329
Executive And Council Operational:Typical Work Streams:Indigent And Cultural Management And Services – 50 50 52 55
Executive And Council Operational:Typical Work Streams:Ward Committees:Meetings 6 667 3 300 4 700 5 240 5 492
Executive And Council Operational:Maintenance:Non-Infrastructure:Preventative Maintenance:Condition Based:Machinery And Equipment Machinery And Equipment 32 – 20 21 22
Finance And Administration O_Municipal Running Cost 1 241 949 1 179 812 1 128 306 1 177 084 1 209 515
Finance And Administration O_Municipal Running Cost 59 002 48 486 33 963 34 689 35 498
Finance And Administration O_Tws_Capacity Build Train & Dev_Workshops; Seminars & Subject Matter Train 1 871 800 700 943 988
Finance And Administration Operational:Typical Work Streams:Capacity Building Training And Development:Capacity Building Unempl – – 2 600 2 800 3 100
Finance And Administration Operational:Typical Work Streams:Human Resources:Employee Assistance Programme 132 200 200 210 220
Finance And Administration Operational:Typical Work Streams:Indigent And Cultural Management And Services 374 – 2 500 2 240 2 492
Finance And Administration Operational:Maintenance:Infrastructure:Preventative Maintenance:Interval Based:Information And Commu Data Centres – 1 000 1 500 2 096 2 197
Finance And Administration Operational:Maintenance:Non-Infrastructure:Preventative Maintenance:Condition Based:Machinery And Equipment Machinery And Equipment 59 10 35 37 38
Finance And Administration Operational:Maintenance:Non-Infrastructure:Preventative Maintenance:Condition Based:Machinery And Equipment Machinery And Equipment – – 10 10 11
Finance And Administration O_Mai_Ninf_Pm_Cb_Transport Assets Transport Assets 1 314 2 480 2 500 3 144 3 295
Internal Audit O_Municipal Running Cost 7 757 9 650 11 216 11 791 12 357
Community And Social Services O_Municipal Running Cost 6 114 4 738 9 664 10 128 10 614
Community And Social Services O_Municipal Running Cost 16 783 24 511 20 638 20 864 21 812
Community And Social Services Operational:Typical Work Streams:Music; Arts And Culture:Productions And Shows 96 100 100 105 110
Community And Social Services Operational:Maintenance:Non-Infrastructure:Preventative Maintenance:Condition Based:Community Assets:Community Facilities:Cemeteries/Crematoria:LandCemeteries/Crematoria 451 850 800 838 879
Community And Social Services Operational:Maintenance:Non-Infrastructure:Preventative Maintenance:Condition Based:Machinery And Equipment Machinery And Equipment – – 30 31 33
Community And Social Services Operational:Maintenance:Non-Infrastructure:Preventative Maintenance:Condition Based:Machinery And Equipment Machinery And Equipment 121 460 510 534 560
Community And Social Services Operational:Non-Infrastructure:Existing:Upgrading:Other Assets:Operational Buildings:Municipal Offices Municipal Offices 2 530 3 300 4 000 4 192 4 393
Sport And Recreation O_Municipal Running Cost 24 026 20 674 37 619 39 425 41 317
Sport And Recreation O_Tws_Sport Development_Marathons; Sport And Recreation 14 – 30 55 58
Sport And Recreation Operational:Typical Work Streams:Environmental:Nursery 54 600 600 629 659
Sport And Recreation Operational:Typical Work Streams:Sport Development:Sport Development And Sponsorships (Internal) 59 100 200 210 220
Sport And Recreation
Operational:Maintenance:Non-Infrastructure:Preventative Maintenance:Condition Based:Community
Assets:Community Facilities:Public Open Space:Land Public Open Space 157 800 800 838 879
Sport And Recreation
Operational:Maintenance:Non-Infrastructure:Preventative Maintenance:Condition Based:Community Assets:Sport
And Recreation Facilities:Outdoor Facilities:External Facilities Outdoor Facilities – 9 10 10 11
Public Safety O_Municipal Running Cost 31 305 31 064 32 681 34 271 35 916
Public Safety O_Municipal Running Cost 46 347 44 882 38 070 39 897 41 812
Public Safety O_Tws_Occupational Health And Safety 114 160 110 115 121
Public Safety Operational:Maintenance:Non-Infrastructure:Preventative Maintenance:Condition Based:Machinery And Equipment Machinery And Equipment 4 – 30 31 33
Public Safety Operational:Maintenance:Non-Infrastructure:Preventative Maintenance:Condition Based:Machinery And Equipment Machinery And Equipment 38 50 50 52 55
Housing O_Municipal Running Cost 4 156 4 623 5 363 5 641 5 912
Housing Operational:Non-Infrastructure:Existing:Upgrading:Other Assets:Operational Buildings:Municipal Offices Municipal Offices 294 280 300 314 329
Health O_Municipal Running Cost 407 393 425 445 467
Health O_Municipal Running Cost 6 202 6 865 7 136 7 479 7 838
Planning And Development O_Municipal Running Cost 38 870 48 747 56 970 59 171 63 206
Planning And Development O_Municipal Running Cost 15 100 4 027 4 135 4 353 4 562
Planning And Development Operational:Typical Work Streams:Community Development:Social Development Programme (Welfare) – 120 300 314 329
Planning And Development Operational:Typical Work Streams:Emergency And Disaster Management:Disaster Relief – 50 50 52 55
Planning And Development Operational:Typical Work Streams:Local Economic Development:Project Implementation 231 50 400 419 439
Planning And Development Operational:Typical Work Streams:Local Economic Development:Public Participation (7) – 250 262 275
Planning And Development Operational:Typical Work Streams:Strategic Management And Governance:Idp Planning And Revision (4) 200 200 210 220
Planning And Development Operational:Maintenance:Non-Infrastructure:Preventative Maintenance:Interval Based:Other Assets:Oper Municipal Offices – 42 70 73 77
Road Transport O_Municipal Running Cost – 53 53 55 58
Road Transport O_Municipal Running Cost 493 502 49 205 57 546 60 853 63 774
Road Transport Operational:Maintenance:Non-Infrastructure:Preventative Maintenance:Interval Based:Community Assets:Community Facilities:Parks:LandParks 137 1 000 1 000 1 048 1 098
Road Transport Operational:Maintenance:Non-Infrastructure:Preventative Maintenance:Condition Based:Machinery And Equipment Machinery And Equipment 379 250 1 100 1 153 1 208
Road Transport Operational:Maintenance:Infrastructure:Corrective Maintenance:Emergency:Roads Infrastructure:Road Fu Road Furniture 421 1 100 1 100 1 153 1 208
Road Transport Operational:Maintenance:Infrastructure:Preventative Maintenance:Condition Based:Roads Infrastructure Road Furniture 248 500 500 524 549
Road Transport Operational:Maintenance:Infrastructure:Preventative Maintenance:Condition Based:Roads Infrastructure Road Structures 1 996 2 100 5 000 5 240 5 492
Road Transport Operational:Infrastructure Projects:Existing:Renewal:Roads Infrastructure:Roads Roads 4 424 3 930 5 030 5 271 5 524
Road Transport Operational:Maintenance:Infrastructure:Preventative Maintenance:Condition Based:Sanitation Infrastru Pump Station 654 1 500 2 000 2 096 2 197
Road Transport Operational:Maintenance:Infrastructure:Preventative Maintenance:Condition Based:Water Supply Infrast Water Treatment Works 286 800 600 629 659
Environmental Protection O_Municipal Running Cost 713 707 779 817 856
Energy Sources O_Municipal Running Cost 3 252 3 908 5 356 5 613 5 883
Energy Sources O_Municipal Running Cost 603 891 461 554 504 528 526 230 537 675
Energy Sources Operational:Maintenance:Infrastructure:Corrective Maintenance:Emergency:Electrical Infrastructure:Lv Lv Networks – 1 000 1 200 1 258 1 318
Energy Sources Operational:Maintenance:Infrastructure:Preventative Maintenance:Condition Based:Electrical Infrastru Power Plants 38 881 40 850 30 000 31 440 32 949
Energy Sources
Operational:Maintenance:Infrastructure:Preventative Maintenance:Interval Based:Electrical Infrastructure:Power
Plants:Electrical Equipment Power Plants – – – – 3 000
Water Management O_Municipal Running Cost 303 382 167 464 189 470 203 377 213 235
Water Management Operational:Maintenance:Non-Infrastructure:Preventative Maintenance:Condition Based:Machinery And Equipment Machinery And Equipment 39 360 370 388 406
Water Management Operational:Non-Infrastructure:Existing:Upgrading:Machinery And Equipment Machinery And Equipment – 100 50 52 55
Water Management Operational:Maintenance:Infrastructure:Preventative Maintenance:Condition Based:Water Supply Infrast Distribution 200 4 800 600 629 659
Water Management Operational:Maintenance:Infrastructure:Corrective Maintenance:Emergency:Water Supply Infrastructure: Distribution Points 11 646 4 750 6 000 6 288 6 590
Water Management Operational:Maintenance:Infrastructure:Corrective Maintenance:Emergency:Water Supply Infrastructure: Reservoirs 601 1 000 1 000 1 048 1 098
Water Management Operational:Maintenance:Infrastructure:Preventative Maintenance:Condition Based:Water Supply Infrast Water Treatment Works 24 885 15 800 23 000 24 104 25 261
Waste Water Management O_Municipal Running Cost 27 448 26 299 35 288 37 041 38 819
Waste Water Management Operational:Maintenance:Non-Infrastructure:Preventative Maintenance:Condition Based:Machinery And Equipment Machinery And Equipment – – 10 10 11
Waste Water Management Operational:Maintenance:Infrastructure:Corrective Maintenance:Emergency:Sanitation Infrastructure:Pu Pump Station 11 751 25 755 11 000 11 576 12 180
Waste Water Management Operational:Maintenance:Infrastructure:Preventative Maintenance:Condition Based:Solid Waste Disposal Landfill Sites 252 800 800 838 879
Waste Management O_Municipal Running Cost 1 961 2 307 2 107 2 208 2 314
Waste Management O_Municipal Running Cost 48 913 51 324 77 361 81 703 85 625
Waste Management Operational:Maintenance:Non-Infrastructure:Preventative Maintenance:Condition Based:Machinery And Equipment Machinery And Equipment 28 500 500 524 549
Other O_Municipal Running Cost 2 269 2 675 3 198 3 388 3 551
Parent Operational expenditure 3 171 212 2 397 440 2 462 474 2 581 135 2 670 888
Prior year outcomes2020/21 Medium Term Revenue & Expenditure
Framework

Madibeng Local Municipality 2020/21 /Final Annual Budget and MTREF
91
Table 69 MBRR Table SA33 Contracts having future budgetary implications
Table 70 MBRR Table SA32 List of external mechanisms
Description RefPreceding
Years
Current Year
2019/20
Forecast
2023/24
Forecast
2024/25
Forecast
2025/26
Forecast
2026/27
Forecast
2027/28
Forecast
2028/29
Forecast
2029/30
Total
Contract
Value
R thousand 1,3 TotalOriginal
Budget
Budget Year
2020/21
Budget Year
+1 2021/22
Budget Year
+2 2022/23Estimate Estimate Estimate Estimate Estimate Estimate Estimate Estimate
Parent Municipality:
Revenue Obligation By Contract 2
–
–
–
Total Operating Revenue Implication – – – – – – – – – – – – –
Expenditure Obligation By Contract 2
–
–
–
Total Operating Expenditure Implication – – – – – – – – – – – – –
Capital Expenditure Obligation By Contract 2
–
–
–
Total Capital Expenditure Implication – – – – – – – – – – – – –
Total Parent Expenditure Implication – – – – – – – – – – – – –
Entities:
Revenue Obligation By Contract 2
–
–
–
Total Operating Revenue Implication – – – – – – – – – – – – –
Expenditure Obligation By Contract 2
–
–
–
Total Operating Expenditure Implication – – – – – – – – – – – – –
Capital Expenditure Obligation By Contract 2
–
–
–
Total Capital Expenditure Implication – – – – – – – – – – – – –
Total Entity Expenditure Implication – – – – – – – – – – – – –
2020/21 Medium Term Revenue & Expenditure
Framework
External mechanismPeriod of
agreement 1.
Monetary
value of
agreement 2.
Name of organisation Number R thousand
Service provided
Expiry date of
service delivery
agreement or
contract
Yrs/
Mths

Madibeng Local Municipality 2020/21 /Final Annual Budget and MTREF
92
2.15 Municipal manager’s quality certificate
I …………………………………, municipal manager of Madibeng Local Municipality, hereby certify
that the annual budget and supporting documentation have been prepared in accordance with
the Municipal Finance Management Act and the regulations made under the Act, and that the
annual budget and supporting documents are consistent with the Integrated Development Plan
of the municipality.
Print Name _____________________________________________
Municipal manager of Madibeng Local Municipality
Signature ______________________________________________
Date _____________________________


