65
1 | Page FINAL BUDGET AND MTREF 2013/2016 PREPARED BY: BUDGET AND TREASURY OFFICE
1 | P a g e
FINAL BUDGET AND MTREF
2013/2016
PREPARED BY: BUDGET AND TREASURY OFFICE
2 | P a g e
Table of Contents PART 1 – DRAFT ANNUAL BUDGET
1. Mayor‟s Budget Speech 2. Resolutions(Not available at the time of publishing this document) 3. Executive Summary 4. Consolidated Overview 5. Operating Revenue Framework 6. Operating Expenditure Framework 7. Capital Expenditure PART 2 – SUPPORTING DOCUMENTATION 8. Annual Budget Tables 9. Overview of the annual budget process
10. Overview of alignment of budget to IDP 11. Overview of budget related policies 12. Overview of budget assumptions 13 .Overview of budget funding 14 .Legislation compliance status 15. Municipal Managers Quality certificate

3 | P a g e
1. Mayor’s Speech Tuesday, 28 May 2013
Mr Speaker
Amakhosi
Honourable councillors
Municipal Manager and Heads of Departments
Distinguished guests
Members of the press
Ladies and gentlemen
Good morning; Sanibonani; Goeie more!
It is a pleasure to stand before this house to table the final proposed budget for 2013/14. This
day represents the last leg of a journey which has spanned several weeks, from the time since
we tabled the very first draft budget in this House on the 26th March of this year.
On that day we tabled a budget with a total value of value of R731 237 571; comprising of
capital projects totalling R138 571 229 and an operating budget of R592 756 342.
At the same time Mr Speaker and honourable councillors, we highlighted certain considerations
which had, by and large shaped the content of the draft budget. Amongst these were:
A consideration of the prevailing economic circumstances
Alignment of policy with budget expenditure
Limitation on non- priority spending
A focus on the mandate of local government; as well as
The collective bargaining agreement which governs the remuneration of municipal
employees
As we concluded proceedings on that day, we invited all affected stakeholders to make
submissions on the proposed budget document in order to further engage on the process as
envisaged in various legislative prescripts governing local government.

4 | P a g e
The process of the izimbizo consultative sessions took place in the month of April in all of our
seven municipal clusters. By and large the issues raised at these meetings were concerned with
the capital budget, which is being tabled this morning with these considerations in mind.
Concurrent to this process, the municipality continued to receive written and verbal submissions
on behalf of various ratepayers and associations representing organised business.
It is my pleasure to report to this house Mr Speaker that after the chronology of events which I
have briefly outlined, the following proposals are made in respect of the final budget:
Indigent Support
In light of interactions with various organs of government, the Indigent Burial programme will be
discontinued. We are aware that it is a sensitive issue in certain communities, but we are
obliged to observe protocols of government as determined from time to time.
In terms of the housing rebate for indigent households, I am happy to report that we propose to
increase the threshold of the value of the property from R290 000 to R320 000.
As far as disaster relief is concerned, we propose that the budget allocation is increased from
R160 000 to R365 000.
Tariffs
The draft budget which we tabled had made provision for an increase of 8% in electricity tariffs
whilst awaiting determination by NERSA. The determination of 7% as announced has required
that our budget projections be adjusted from R93 621 000 to R 93 383 000 accordingly.
We are also currently engaged in discussions with the Master Builders Association, a major
stakeholder in the construction industry. We have, as an interim measure, agreed that planning
tariffs will not increase until our discussions are concluded. In addition, we have agreed on
innovative means to manage the current tariff structure. We have agreed that 50% of the tariff
will be payable on submission of plans, whilst the balance shall be paid in full before a certificate
of completion is issued.
We have also engaged with the Bed and Breakfast network and South Coast Tourism, and have
agreed on a rating system which is acceptable to all parties.

5 | P a g e
Roads
In line with our service delivery mandate, coupled with the unsatisfactory state of our road
network, the budget has been increased:-
From R8,5 million to R11,7 million on Capital budget for resurfacing and gravel
From 9,4 million to R10 million on maintenance of pot holes on Operating budget
From R1,5 million to R1, 9 million for Storm Water
Youth Empowerment Programmes
Several representations were received from various stakeholders to re-consider the proposed
allocation for youth programmes.
We also fully appreciate that women, rural communities and youth continue to be the most
vulnerable groups affected by the challenge of poverty, unemployment and inequality.
It is against this background that it is proposed that the budget for Youth Empowerment
programmes be increased to R1 million. This is of course in addition to the Internship
programme and the Back to School campaign.
Municipal Bylaws
The area of bylaw enforcement has been identified as a weakness by some members of the
public. On closer inspection though, it is apparent that our bylaws are not synergised properly,
and some are clearly outdated. We propose that we set aside an allocation of R300 000 to kick-
start the process of consolidating all bylaws into an efficient system of municipal law. We
anticipate this to become a medium to long-term project which will spill over the next financial
year and beyond.
Cluster budget
In terms of our cluster projects, the budget in cluster 2 and cluster 3 has been revised to R28
110 000 and R22 729 000 respectively.
Last but certainly not least Mr Speaker and honourable councillors, this Council has invested
considerable energy and resources to consolidate the position of Hibiscus Coast municipality as
a premier tourist destination and the economic backbone of our region. In this regard Council

6 | P a g e
took a resolution to revive the Hibiscus Coast Development Agency, a pivotal pillar to unlock
development to advance our macro-economic projects. A few days ago we also launched our
Economic Advisory Council, which will work closely with this institution and the office of the
Mayor.
It is along the same line that Council has resolved to support the Ugu Jazz Festival and the
International Women‟s Golf Tournament, the iBeach Festival and Africa Bike Week in next
financial year‟s budget.
The overall effect of all adjustments is that:
The projected annual Operating budget increases to R593 002 986
The proposed Capital budget is projected at R139 521 229
In total Mr Speaker, the budget we table in this house today is R732 525 215
As I conclude I wish to place on record sincere appreciation to everyone who has made a
meaningful contribution to this process. The commitment and goodwill of this council,
represented by both the political and administrative components, has ensured that we are able
to table this budget within the stipulations of the MFMA and Municipal Budget and Reporting
Regulations.
Last but not least I would like to thank Amakhosi for the role they play in our communities and
the cooperation they show in ensuring that communities are participating fully in matters of
government and service delivery at large. I am quite confident that with the continued support
from traditional leadership, the lives of our communities will be better.
In those few words, thank you,
Cllr NCP Mqwebu
Mayor
2. Resolutions(Not available at the time of publishing this documents)

7 | P a g e
3. Executive Summary The application of sound financial management principles for the compilation of the Hibiscus Coast Municipality‟s Draft Budget is essential and critical to ensure that the municipality remains financially viable and that municipal services are provided sustainability, economically and equitably to all communities. The Hibiscus Coast Municipality‟s business and service delivery priorities were reviewed as part of this year‟s planning and budget process. Where appropriate, funds were transferred from low- to high-priority programmes so as to maintain sound financial stewardship. A critical review was also undertaken of expenditures on noncore and „nice to have‟ items. The municipality has embarked on implementing a range of revenue collection strategies to optimize the collection of debt owed by consumers. Furthermore, the municipality has undertaken various customer care initiatives to ensure the municipality truly involves all citizens in the process of ensuring a people lead government. National Treasury‟s MFMA Circular No. 66 and 67 and annexure to circular 67 were used to guide the compilation of the 2013/14 MTREF. The main challenges experienced during the compilation of the Draft Budget 2013/14 MTREF can be summarized as follows:
• The ongoing difficulties in the national and local economy; • Aging and poorly maintained roads and electricity infrastructure; • The need to reprioritize projects and expenditure within the existing resource envelope
given the cash flow realities and declining cash position of the municipality; • The increased cost and electricity (due to tariff increases from Eskom), which is placing
upward pressure on service tariffs to residents. Continuous high tariff increases are not sustainable - as there will be point where services will no-longer be affordable;
• Wage increases for municipal staff that continue to exceed consumer inflation, as well as the need to fill critical vacancies;
The following budget principles and guidelines directly informed the compilation of the 2013/14 Draft Budget: • The 2012/13 Adjustments Budget priorities and targets, as well as the base line
allocations contained in that Adjustments Budget were adopted as the upper limits for the new baselines for the 2013/14 annual budget;
• The Mid-Year Budget assessment 2012/2013 was also used as a guide for the compilation of the 2013/14 Draft Budget.
• Intermediate service level standards were used to inform the measurable objectives, targets and backlog eradication goals;
• The 2013 Division of Revenue Bill issued on 27 February 2013 and a revised that details the allocations that the municipality need to be reflected in the budget
• Tariff and property rate increases should be affordable and should generally not exceed inflation as measured by the CPI, except where there are price increases in the inputs of services that are beyond the control of the municipality, for instance the cost of bulk electricity. In addition, tariffs need to remain or move towards being cost reflective, and should take into account the need to address infrastructure backlogs;

8 | P a g e
• There will be no budget allocated to national and provincial funded projects unless the necessary grants to the municipality are reflected in the national and provincial budget and have been gazette as required by the annual Division of Revenue Act;
• The relevant policy developments in the different sectors proposals from the National Energy Regulator of South Africa (NERSA)).
• The multi-year Salary and Wage Collective Agreement for the period 1 July 2012 to 30 June 2015. The agreement provides for a wage increase based on the average CPI for the period 1 February 2012 until 31 January 2013, plus 1.25 per cent for the 2013/14 financial year.
• The upper limit was set for the following items and allocations to these items had to be supported by a list and/or motivation setting out the intention and cost of the expenditure which was used to priorities expenditures:
- Special Projects;
- Consultant Fees;
- Furniture and office equipment;
- Special Events;
- Refreshments and entertainment;
- Ad-hoc travelling; and
- Subsistence, Travelling & Conference fees In view of the aforementioned, the following table is a consolidated overview of the proposed 2013/14 Medium-term Revenue and Expenditure Framework: 4. Table 1 Consolidated Overview
Total operating revenue has grown by 8 per cent for the 2013/14 financial year when compared to the 2012/13 Adjustments Budget of R546 million . For the two outer years, operational revenue will increase by 6 per cent. Total operating expenditure for the 2013/14 financial year has been appropriated at R593 million and when compared to the 2012/13 Adjustments Budget, operational expenditure has grown by 8 per cent in the 2013/14 budget and by 6 for the respective outer years of the MTREF. The capital budget of R139 million has grown by 16. 96 per cent or R23 million for 2013/14 when compared to the 2012/13 Adjustment Budget. The reason for an increase is the housing projects that has increased significantly .A substantial portion of the capital budget will be funded from government grants over the MTREF with anticipated grants of R94.3 million which contributes 68 per cent of the capital budget. The balance will be funded from internally generated funds which contributes 32 per cent of the capital budget.
Description
Adjustment
Budget
2012/13
Budget Year
2013/14
Budget Year +1
2014/15
Budget Year +2
2015/16
Total Operating Revenue 546,237,000 593,002,986 628,583,000 666,297,980
Total Operating Expenditure 546,237,000 593,002,986 628,583,000 666,297,980
Surplus(Deficit) for the year – – – –
Capital Expenditure 115,850,606 139,521,229 146,886,000 155,699,160

9 | P a g e
5. Operating Revenue Framework
For Hibiscus Coast Municipality to continue improving the quality of services provided to its citizens it needs to generate the required revenue. In these tough economic times strong revenue management is fundamental to the financial sustainability of every municipality. The reality is that we are faced with development backlogs and poverty. The expenditure required to address these challenges will inevitably always exceed available funding; hence difficult choices have to be made in relation to tariff increases and balancing expenditures against realistically anticipated revenues. The municipality‟s revenue strategy is built around the following key components: • National Treasury‟s guidelines and macroeconomic policy; • Growth in the municipality and continued economic development; • Efficient revenue management, which aims to ensure a 100 per cent annual collection
rate for property rates and other key service charges; • Electricity tariff increases as approved by the National Electricity Regulator of South
Africa (NERSA); • Achievement of full cost recovery of specific user charges especially in relation to trading
services; • Determining the tariff escalation rate by establishing/calculating the revenue requirement
of each service; • The municipality‟s Property Rates Policy approved in terms of the Municipal Property
Rates Act, 2004 (Act 6 of 2004) (MPRA); • Increase ability to extend new services and recover costs; • The municipality‟s Indigent Policy and rendering of free basic services; and
The following table is a summary of the 2013/14 MTREF (classified by main revenue source): Table 2 Summary of revenue classified by main revenue source
2009/10 2010/11 2011/12
R thousandAudited
Outcome
Audited
Outcome
Audited
Outcome
Original
Budget
Adjusted
Budget
Budget
Year
2013/14
Budget
Year +1
2014/15
Budget
Year +2
2015/16
Revenue By Source
Property rates 211,264 220,524 241,359 266,249 266,249 289,374 306,736 325,140
Property rates - penalties 70 117 108 77 77 – – –
Service charges - electricity revenue 59,838 66,129 81,126 85,835 86,782 93,383 98,986 104,925
Service charges - refuse revenue 25,637 31,071 33,311 46,024 46,024 49,331 52,291 55,428
Rental of facilities and equipment 2,168 2,325 2,308 2,833 2,833 2,414 2,559 2,712
Interest earned - external investments 11,312 9,632 8,266 10,996 5,250 5,525 5,856 6,207
Interest earned - outstanding debtors 9,530 7,068 6,610 6,049 8,558 9,488 10,057 10,660
Fines 4,432 1,419 1,265 3,386 3,386 9,904 10,498 11,128
Licences and permits 5,119 5,841 5,444 5,786 5,786 6,435 6,821 7,230
Agency services 2,916 3,214 3,734 3,300 3,300 3,960 4,198 4,449
Transfers recognised - operational 71,914 70,295 122,859 95,398 100,734 111,786 117,963 125,041
Other revenue 14,503 9,433 40,129 17,377 17,258 11,406 12,620 13,377
Gains on disposal of PPE 10 8,728 – – – – – –
Total Revenue(Excl Capital grants) 418,712 435,796 546,518 543,310 546,237 593,003 628,583 666,298
2013/14 Medium Term Revenue
& Expenditure Framework
Current Year
2012/13

10 | P a g e
Table 3 Revenue source percentage of the total revenue
In line with the formats prescribed by the Municipal Budget and Reporting Regulations, capital transfers and contributions are excluded from the operating statement, as inclusion of these revenue sources would distort the calculation of the operating surplus/deficit. Revenue generated from rates, services charges and transfers from grants forms a significant percentage of the revenue basket for the municipality. Rates, service charge revenues and grants operational comprise more than two thirds of the total revenue mix. In the 2013/14 financial year, revenue from rates, services charges and grants operational totaled R543 million or 92 per cent. This growth can be mainly attributed to the increased share that the sale of electricity contributes to the total revenue mix, which in turn is due to rapid increases in the Eskom tariffs for bulk electricity. Property rates are the first largest revenue source totaling 49 per cent or R289 million rand and increases to R306 million by 2014/15.The second and third largest sources is revenue from grants operational and electricity totaling 18.85 per cent or R111 million and 16.68 per cent or R93 million respectively. Other revenue‟ which consists of various items such as income received from permits and licenses, building plan fees, connection fees, transport fees and advertisement fees. Departments have been urged to review the tariffs of these items on an annual basis to ensure they are cost reflective and market related. Operating grants and transfers totals R111 million in the 2013/14 financial year and steadily increases to R117.9 million by 2014/15. The following table gives a breakdown of the various operating grants and subsidies allocated to the municipality over the medium term:
Description
R thousandAudjusted
Budget%
Budget
Year
2013/14
%
Budget
Year+1
2014/15
%
Budget
Year+2
2015/16
%
Revenue By Source
Property rates 266,249 48.74 289,374 48.80 306,736 49.50 325,140 48.80
Property rates - penalty charges 77 0.01 – - – 0.02 – -
Service charges - electricity revenue 86,782 15.89 93,383 15.75 98,986 16.22 104,925 15.75
Service charges - refuse revenue 46,024 8.43 49,331 8.32 52,291 9.02 55,428 8.32
Rental of facilities and equipment 2,833 0.52 2,414 0.41 2,559 0.33 2,712 0.41
Interest earned - external investments 5,250 0.96 5,525 0.93 5,856 2.16 6,207 0.93
Interest earned - outstanding debtors 8,558 1.57 9,488 1.60 10,057 1.72 10,660 1.60
Fines 3,386 0.62 9,904 1.67 10,498 0.35 11,128 1.67
Licences and permits 5,786 1.06 6,435 1.09 6,821 1.83 7,230 1.09
Agency services 3,300 0.60 3,960 0.67 4,198 0.54 4,449 0.67
Transfers recognised - operational 100,734 18.44 111,786 18.85 117,963 14.96 125,041 18.77
Other revenue 17,258 3.16 11,405 1.92 12,620 3.36 13,377 2.01
Total Revenue (excluding capital
transfers and contributions)
546,237 100.00 593,003 100.00 628,583 100.02 666,298 100.00
Current Year 2013/14 Medium Term Revenue & Expenditure

11 | P a g e
Table 4 Operating Transfers and Grant Receipts
Tariff-setting is a pivotal and strategic part of the compilation of any budget. When rates, tariffs and other charges were revised, local economic conditions, input costs and the affordability of services were taken into account to ensure the financial sustainability of the municipality.
National Treasury continues to encourage municipalities to keep increases in rates, tariffs and other charges as low as possible. Municipalities must justify in their budget documentation all increases in excess of the 5. 6 per cent upper boundary of the South African Reserve Bank‟s inflation target. Excessive increases are likely to be counterproductive, resulting in higher levels of non-payment.
The percentage increases of Eskom bulk tariffs are far beyond the mentioned inflation target. Given that these tariff increases are determined by external agencies, the impact they have on the municipality‟s electricity and in these tariffs are largely outside the control of the municipality It must also be appreciated that the consumer price index, as measured by CPI, is not a good measure of the cost increases of goods and services relevant to municipalities. The basket of goods and services utilized for the calculation of the CPI consist of items such as food, petrol and medical services, whereas the cost drivers of a municipality are informed by items such as the cost of remuneration, bulk purchases of electricity, petrol, diesel, chemicals, cement etc. The current challenge facing the municipality is managing the gap between cost drivers and tariffs levied, as any shortfall must be made up by either operational efficiency gains or service level reductions.
5.1. Property Rates
Property rates cover the cost of the provision of general services. Determining the effective property rate tariff is therefore an integral part of the municipality‟s budgeting process. National Treasury‟s MFMA Circular No. 58 and 59 deals, inter alia with the implementation of the Municipal Property Rates Act, with the regulations issued by the Department of Co-operative Governance. These regulations came into effect on 1 July 2009 and prescribe the rate ratio for
R thousandAudited
Outcome
Audited
Outcome
Original
Budget
2012/13
Adjusted
Budget
2012/13
Budget
Year
2013/14
Budget
Year +1
2014/15
Budget
Year +2
2015/16
RECEIPTS:
Operating Transfers and Grants
National Government: 57,395 72,245 87,682 87,682 95,040 100,790 106,837
Local Government Equitable Share 56,245 70,295 85,382 85,382 92,600 98,156 104,045
Finance Management 750 1,200 1,500 1,500 1,550 1,700 1,802
Municipal Systems Improvement 400 750 800 800 890 934 990
Provincial Government: 756 4,064 11,846 22,846 16,746 17,173 18,204
KZN Arts and Culture(Libraries) 756 3,912 7,846 12,846 7,196 7,580 8,085
KZN Housing – – – – 2,900 3,074 3,258
Cogta Grants – – 4,000 9,000 5,000 5,300 5,568
Expanded Public Works Programme – – – 1,000 1,000 1,060 1,124
Operational Support for Thusong Centres – – – – 500 530 562
Ugu District Municipality – 152 – – – – –
Dept of Sport and Recreation – – – – 150 159 169
Total Operating Transfers and Grants 58,151 76,309 99,528 110,528 111,786 117,963 125,041
12 | P a g e
the non-residential categories, public service infrastructure and agricultural properties relative to residential properties. The implementation of these regulations was done in the previous budget process and the Property Rates Policy of the Municipality has been amended accordingly. The following stipulations in the Property Rates Policy are highlighted: • The first R15 000 of the market value of a property used for residential purposes is
excluded from the rate-able value (Section 17(h) of the MPRA). In addition to this rebate, a further R85 000 and R50 000 reduction on the market value of a property and on categories for vacant stands respectively will be granted in terms of the municipality‟s own Property Rates Policy;
• 100 per cent rebate will be granted to registered indigents and child headed household in terms of the Indigent Policy;
• For pensioners, physically and mentally disabled persons whose household income equal 2 state pensions, 4 state pensions and 6 state pensions will receive a rebate of 75%, 50% and 25 % respectively.
• Indigents, in terms of the indigent policy are exempt from paying rates if the value of the property is less than R320 000.00 (The threshold has been changed from R290 00 to R320 000 after consultation during the budget comments)
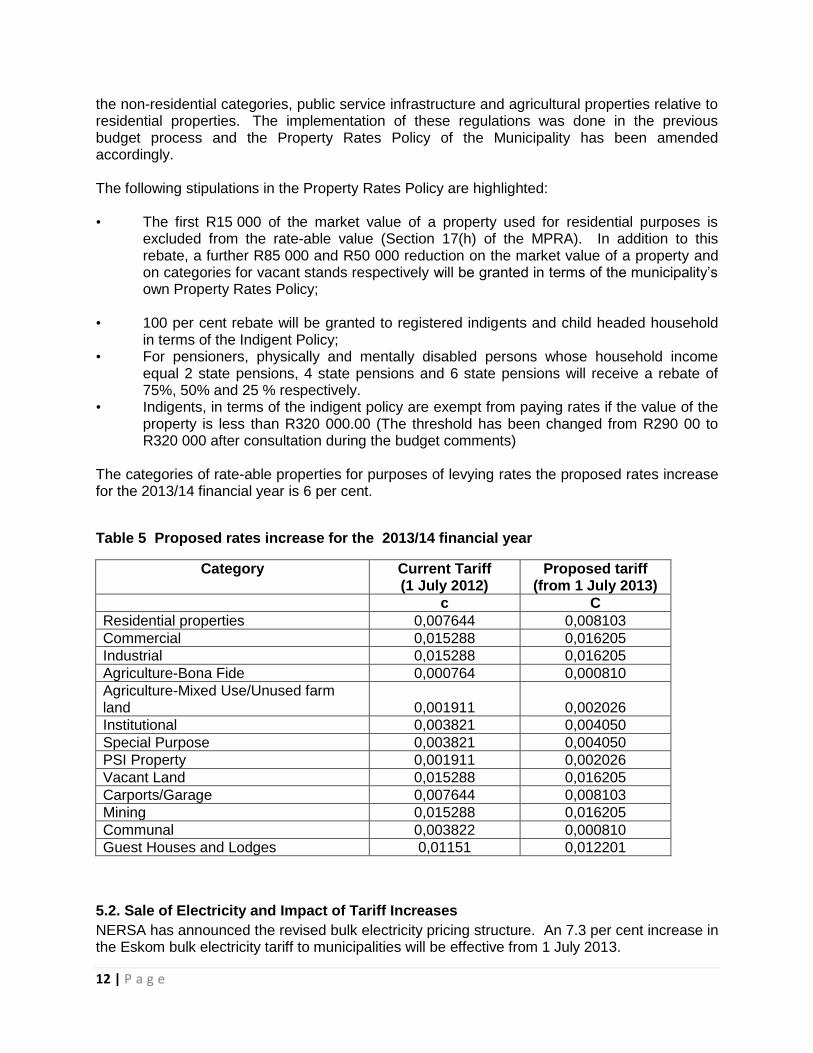
The categories of rate-able properties for purposes of levying rates the proposed rates increase for the 2013/14 financial year is 6 per cent.
Table 5 Proposed rates increase for the 2013/14 financial year
Category Current Tariff (1 July 2012)
Proposed tariff (from 1 July 2013)
c C
Residential properties 0,007644 0,008103
Commercial 0,015288 0,016205
Industrial 0,015288 0,016205
Agriculture-Bona Fide 0,000764 0,000810
Agriculture-Mixed Use/Unused farm land 0,001911 0,002026
Institutional 0,003821 0,004050
Special Purpose 0,003821 0,004050
PSI Property 0,001911 0,002026
Vacant Land 0,015288 0,016205
Carports/Garage 0,007644 0,008103
Mining 0,015288 0,016205
Communal 0,003822 0,000810
Guest Houses and Lodges 0,01151 0,012201
5.2. Sale of Electricity and Impact of Tariff Increases
NERSA has announced the revised bulk electricity pricing structure. An 7.3 per cent increase in the Eskom bulk electricity tariff to municipalities will be effective from 1 July 2013.
13 | P a g e
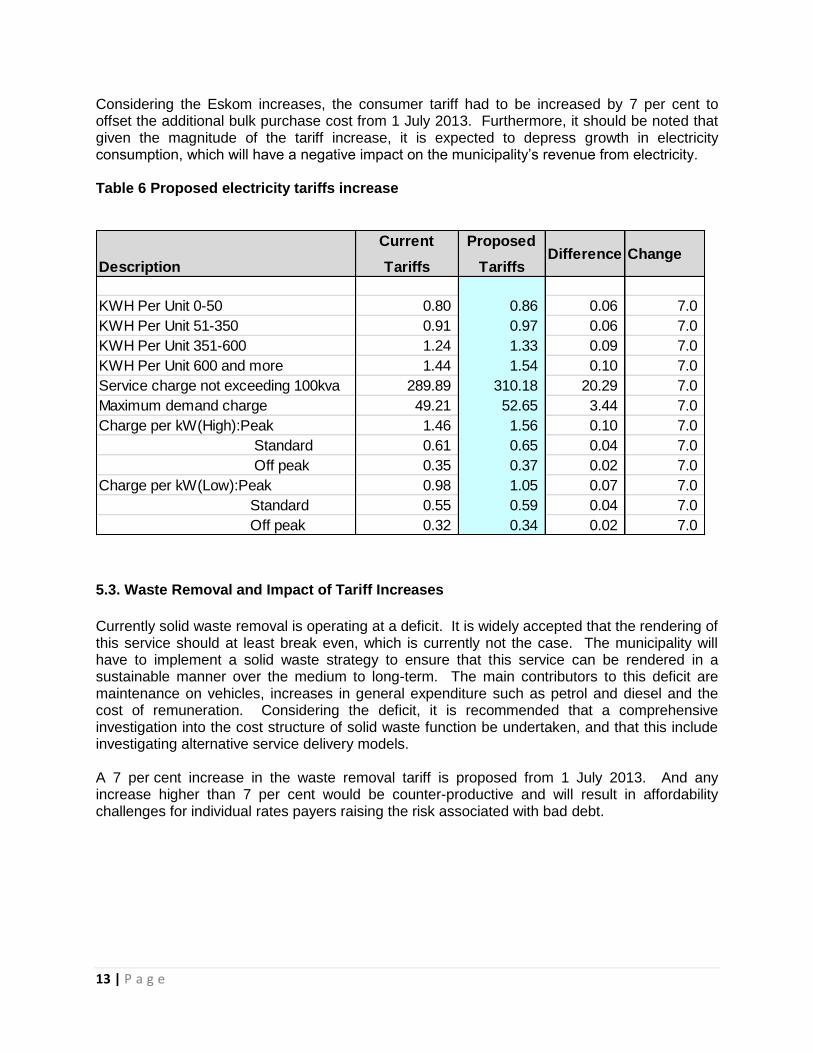
Considering the Eskom increases, the consumer tariff had to be increased by 7 per cent to offset the additional bulk purchase cost from 1 July 2013. Furthermore, it should be noted that given the magnitude of the tariff increase, it is expected to depress growth in electricity consumption, which will have a negative impact on the municipality‟s revenue from electricity. Table 6 Proposed electricity tariffs increase
5.3. Waste Removal and Impact of Tariff Increases
Currently solid waste removal is operating at a deficit. It is widely accepted that the rendering of this service should at least break even, which is currently not the case. The municipality will have to implement a solid waste strategy to ensure that this service can be rendered in a sustainable manner over the medium to long-term. The main contributors to this deficit are maintenance on vehicles, increases in general expenditure such as petrol and diesel and the cost of remuneration. Considering the deficit, it is recommended that a comprehensive investigation into the cost structure of solid waste function be undertaken, and that this include investigating alternative service delivery models. A 7 per cent increase in the waste removal tariff is proposed from 1 July 2013. And any increase higher than 7 per cent would be counter-productive and will result in affordability challenges for individual rates payers raising the risk associated with bad debt.
Description
Current
Tariffs
Proposed
TariffsDifference Change
KWH Per Unit 0-50 0.80 0.86 0.06 7.0
KWH Per Unit 51-350 0.91 0.97 0.06 7.0
KWH Per Unit 351-600 1.24 1.33 0.09 7.0
KWH Per Unit 600 and more 1.44 1.54 0.10 7.0
Service charge not exceeding 100kva 289.89 310.18 20.29 7.0
Maximum demand charge 49.21 52.65 3.44 7.0
Charge per kW(High):Peak 1.46 1.56 0.10 7.0
Standard 0.61 0.65 0.04 7.0
Off peak 0.35 0.37 0.02 7.0
Charge per kW(Low):Peak 0.98 1.05 0.07 7.0
Standard 0.55 0.59 0.04 7.0
Off peak 0.32 0.34 0.02 7.0
14 | P a g e
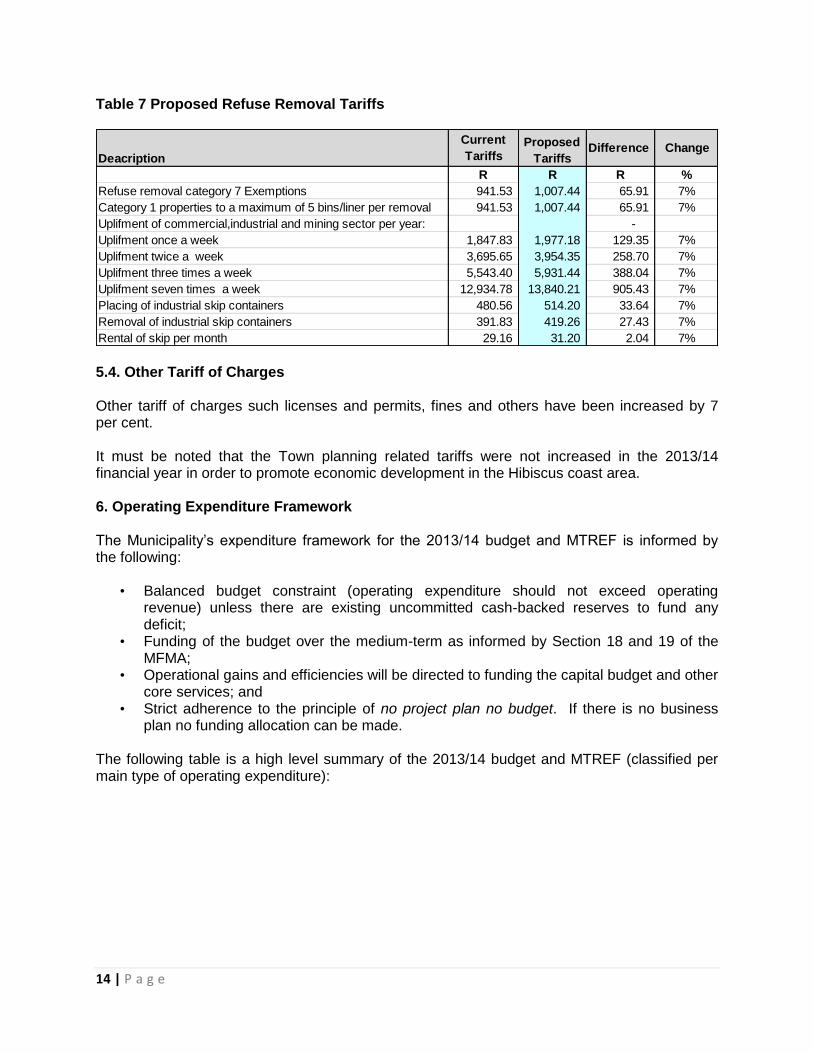
Table 7 Proposed Refuse Removal Tariffs
5.4. Other Tariff of Charges Other tariff of charges such licenses and permits, fines and others have been increased by 7 per cent. It must be noted that the Town planning related tariffs were not increased in the 2013/14 financial year in order to promote economic development in the Hibiscus coast area. 6. Operating Expenditure Framework The Municipality‟s expenditure framework for the 2013/14 budget and MTREF is informed by the following:
• Balanced budget constraint (operating expenditure should not exceed operating revenue) unless there are existing uncommitted cash-backed reserves to fund any deficit;
• Funding of the budget over the medium-term as informed by Section 18 and 19 of the MFMA;
• Operational gains and efficiencies will be directed to funding the capital budget and other core services; and
• Strict adherence to the principle of no project plan no budget. If there is no business plan no funding allocation can be made.
The following table is a high level summary of the 2013/14 budget and MTREF (classified per main type of operating expenditure):
Deacription
Current
TariffsProposed
TariffsDifference Change
R R R %
Refuse removal category 7 Exemptions 941.53 1,007.44 65.91 7%
Category 1 properties to a maximum of 5 bins/liner per removal 941.53 1,007.44 65.91 7%
Uplifment of commercial,industrial and mining sector per year: -
Uplifment once a week 1,847.83 1,977.18 129.35 7%
Uplifment twice a week 3,695.65 3,954.35 258.70 7%
Uplifment three times a week 5,543.40 5,931.44 388.04 7%
Uplifment seven times a week 12,934.78 13,840.21 905.43 7%
Placing of industrial skip containers 480.56 514.20 33.64 7%
Removal of industrial skip containers 391.83 419.26 27.43 7%
Rental of skip per month 29.16 31.20 2.04 7%

15 | P a g e
Table 8 Summary of operating expenditure by standard classification item
The budgeted allocation for employee related costs for the 2013/14 financial year totals R265 million, which equals 44 per cent of the total operating expenditure. The salary increases have been factored into this budget at a percentage increase of 7 per cent for the 2013/14 financial year and also it must be noted that there are other line items within employee costs e.g. overtime, standby allowances, salaries temps, pension funds contributions which were not kept at 7 per cent increase as compared to basic salary increase. The cost associated with the remuneration of councilors is determined by the Minister of Co-operative Governance and Traditional Affairs in accordance with the Remuneration of Public Office Bearers Act, 1998 (Act 20 of 1998). The most recent proclamation in this regard has been taken into account in compiling the municipality‟s budget. Provision for depreciation and asset impairment has been informed by the Municipality‟s Asset Management Policy. Depreciation is widely considered a proxy for the measurement of the rate asset consumption. Budget appropriations in this regard total R48 million for the 2013/14 financial and equates to 8 per cent of the total operating expenditure. Note that the implementation of GRAP 17 accounting standard has meant bringing a range of assets previously not included in the assets register onto the register. This has resulted in a significant increase in depreciation relative to previous years. Finance charges consist primarily of the repayment of interest on long-term borrowing (Cost of capital).Finance charges make up 1.18 per cent (R6 million) of operating expenditure budget excluding annual redemption. Bulk purchases are directly informed by the purchase of electricity from Eskom. The annual price increases have been factored into the budget appropriations and directly inform the revenue provisions. The increase is 7.3 per cent as per NERSA Guidelines. Repairs and maintenance comprises of amongst others the purchase of fuel, diesel, materials for maintenance, potholes, cleaning materials and chemicals. This group of expenditure has
Description 2009/10 2010/11 2011/12
R thousandAudited
Outcome
Audited
Outcome
Audited
Outcome
Original
Budget
Adjusted
Budget
Budget
Year
2013/14
Budget
Year +1
2014/15
Budget
Year +2
2015/16
Expenditure By Type
Employee related costs 193,211 218,859 233,883 242,652 240,928 265,522 281,454 298,341
Remuneration of councillors 13,932 14,613 15,701 18,223 18,223 17,708 18,771 19,897
Depreciation & asset impairment 42,548 43,487 48,578 48,652 47,108 48,440 51,347 54,427
Finance charges 1,834 3,714 9,133 2,365 8,966 6,998 7,418 7,863
Bulk purchases 35,870 45,912 57,007 64,517 59,801 64,496 68,366 72,468
Other materials 24,255 25,565 26,306 26,306 31,533 38,244 40,539 42,971
Contracted services 16,439 18,369 23,196 23,757 23,757 26,365 27,947 29,624
Transfers and grants 17,598 6,967 5,785 5,716 5,716 4,036 4,278 4,535
Other expenditure 92,821 231,677 150,942 111,122 110,205 121,193 128,465 136,172
Loss on disposal of PPE 638 – 1,658 – – – – –
Total Expenditure 439,147 609,163 572,189 543,310 546,237 593,003 628,584 666,299
2013/14 Medium Term
Revenue & Expenditure
Framework
Current Year 2012/13

16 | P a g e
been prioritized to ensure sustainability of the municipality‟s infrastructure especially potholes. For 2013/14 the appropriation against this group of expenditure equals 6 per cent (R38 million) Of the R38 million repairs and maintenance budget, R10 million relates to potholes and it must also be noted that roads rehabilitation has been considered in the capital budget. Contracted services equals 4 per cent of the expenditure budget and has been budgeted at R26 million. For the two outer years growth has been limited to 6 per cent. Other expenditure comprises of various line items relating to the daily operations of the municipality. This group of expenditure has also been identified as an area in which cost savings and efficiencies can be achieved. The salient features of general expenses have been the following:
Special functions – R1,3 million
Subscriptions –R1,9 million
Ward Secretaries Allowance –R1,9 million
Back to School Campaign –R500,000
Caucus Fees R290,000
Women Golf Tournament- R1 million
Youth Empowerment-R1 000,000
Gender Empowerment- R400,000
Food for Waste R1,5 million
EPWP-R1 million
Grant to Hibiscus Coast Development Agency R1.5 million
Valuation fees R2.5 million and Valuation appeals board R 1 million
Rents and Leases R15 million
Professional fees R6 million
Electricity charges R 6 million
Plant hire R2 million
Free basic indigents R 2.8 million
Income forgone R31 million
Leasing of properties R1.2 million
Insurance R2 million
Training and workshops R1.9 million
SPCA Pound fees R336 000
Refuse site disposal charges R4.3 million
Refuse bags R1.5 million
Property rates rebates R31 million.
The following table gives a breakdown of the main expenditure categories for the 2013/14 financial year. Figure 1 Main operational expenditure categories for the 2013/14 financial year

17 | P a g e
6.1. Priority given to repairs and maintenance During the compilation of the 2013/14 MTREF operational repairs and maintenance was identified as a strategic imperative owing to the aging of the municipality‟s infrastructure and historic deferred maintenance especially roads . To this end, repairs and maintenance was substantially increased from R31 million to R38 million by R7 million and also an amount of R16 million for roads rehabilitation has been provided under capital budget. . Potholes have been budgeted for R10 million under repairs and maintenance of R38 million. 6.2 Free Basic Services: Basic Social Service Package The social package assists households that are poor or face circumstances that limit their ability to pay for services. To receive these free services the households are required to register in terms of the Municipality‟s Indigent Policy and the policy is reviewed annually. The cost of the social package of the registered indigent households is largely financed by national government through the local government equitable share received in terms of the annual Division of Revenue Act.
Employee related costs 45%
Remuneration of councillors
3% Bulk purchases
11%
Contracted services 4%
Other Materials 6%
Transfers and grants
1%
Other Expenditure 30%

18 | P a g e
7. Capital Expenditure Framework The following table provides a breakdown of budgeted capital expenditure by clusters Table 9 Capital expenditure by clusters
The above cluster projects budget will be funded as follows and graphically presented below: Table 10 Medium-term capital budget funding
The main source of funding of the 2013/14 Capital budget of R139 million is the grant from Provincial government which is housing Grants for R51 million or 37 per cent followed by Internally generated funds and National Government at R45 million and R43 million or 32 per cent or 31 per cent respectively. The above information can be graphically presented as follows:
DescriptionOriginal
Budget
Adjusted
Budget
Draft Budget
2013/14
R thousands
Cluster 1 Capital projects 16,261 11,538 12,513
Cluster 2 Capital projects 6,797 18,798 28,360
Cluster 3 Capital projects 35,616 12,941 22,729
Cluster 4 Capital projects 5,403 6,502 3,904
Cluster 5 Capital projects 22,732 12,409 10,317
Cluster 6 Capital projects 18,607 15,692 20,338
Cluster 7 Capital projects 7,412 6,893 7,796
Departmental capital 6,747 6,747 7,100
Municipal wide projects 18,919 24,333 26,466
Total Capital projects 138,494 115,851 139,521
Description
R thousand
Budget
Year
2013/14
%
Budget
Year +1
2014/15
%
Budget
Year +2
2015/16
%
Funded by:
National Government 42,997 30.82 45,576 30.82 48,311 30.82
Provincial Government 51,363 36.81 54,444 36.81 57,711 36.81
Internally generated funds 45,162 32.37 47,872 32.37 50,744 32.37
Total Capital Funding 139,521 100.00 147,893 100.00 156,766 100.00
2013/14 Medium Term Revenue & Expenditure
Framework
19 | P a g e
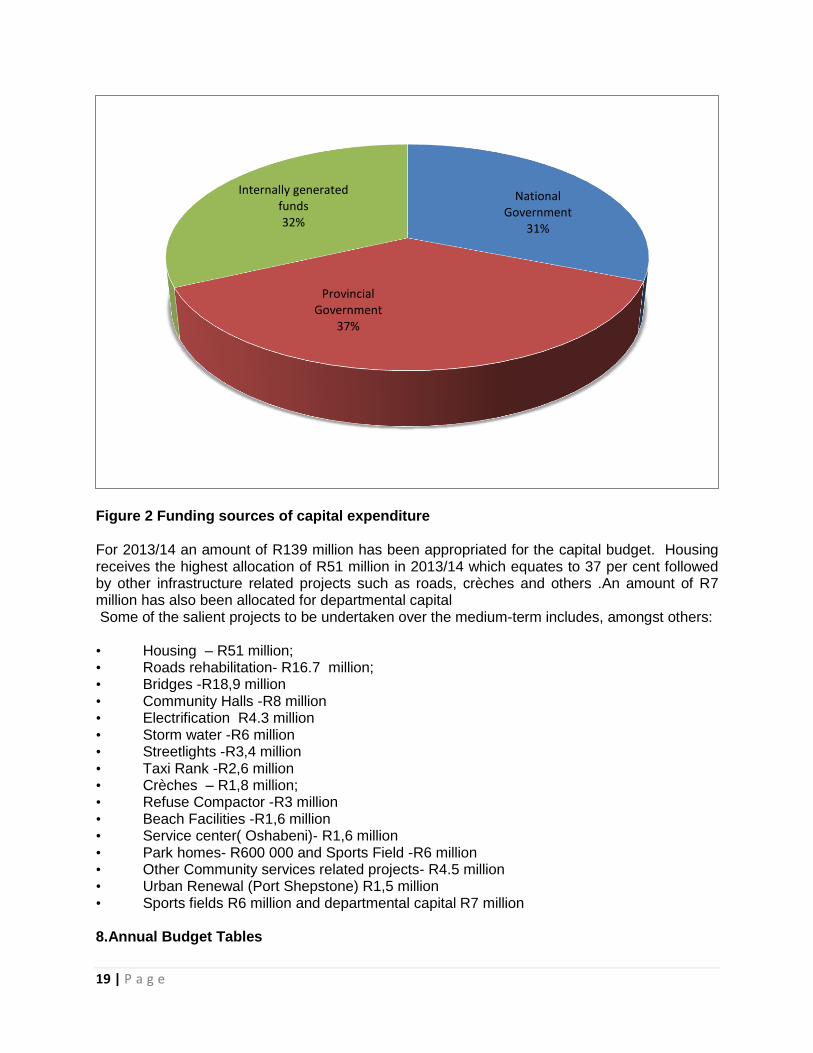
Figure 2 Funding sources of capital expenditure For 2013/14 an amount of R139 million has been appropriated for the capital budget. Housing receives the highest allocation of R51 million in 2013/14 which equates to 37 per cent followed by other infrastructure related projects such as roads, crèches and others .An amount of R7 million has also been allocated for departmental capital Some of the salient projects to be undertaken over the medium-term includes, amongst others:
• Housing – R51 million; • Roads rehabilitation- R16.7 million; • Bridges -R18,9 million • Community Halls -R8 million • Electrification R4.3 million • Storm water -R6 million • Streetlights -R3,4 million • Taxi Rank -R2,6 million • Crèches – R1,8 million; • Refuse Compactor -R3 million • Beach Facilities -R1,6 million • Service center( Oshabeni)- R1,6 million • Park homes- R600 000 and Sports Field -R6 million • Other Community services related projects- R4.5 million • Urban Renewal (Port Shepstone) R1,5 million • Sports fields R6 million and departmental capital R7 million 8.Annual Budget Tables
National Government
31%
Provincial Government
37%
Internally generated funds 32%

20 | P a g e
The following are the main budget tables as required in terms of section 8 of the Municipal Budget and Reporting Regulations. Table 11 MBRR Table A1 - Budget Summary
Description 2009/10 2010/11 2011/12
R thousandsAudited
Outcome
Audited
Outcome
Audited
Outcome
Original
Budget
Adjusted
Budget
Full Year
Forecast
Budget
Year
2013/14
Budget
Year +1
2014/15
Budget
Year +2
2015/16
Financial Performance
Property rates 211,333 220,641 241,467 266,326 266,326 266,326 289,374 306,736 325,140
Service charges 85,475 97,200 114,437 131,859 132,806 132,806 142,714 151,277 160,353
Investment revenue 11,312 9,632 8,266 10,996 5,250 5,250 5,525 5,856 6,207
Transfers recognised - operational 71,914 70,295 122,859 95,398 100,734 100,734 110,786 117,433 124,479
Other own revenue 38,678 38,027 59,489 38,731 41,121 41,121 44,605 47,281 50,118
Total Revenue (excluding capital
transfers and contributions)
418,712 435,795 546,518 543,310 546,237 546,237 593,003 628,583 666,298
Employee costs 193,211 218,859 233,883 242,652 240,928 240,928 265,522 281,449 298,336
Remuneration of councillors 13,932 14,613 15,701 18,223 18,223 18,223 17,708 18,771 19,897
Depreciation & asset impairment 42,548 43,487 48,578 48,652 47,108 47,108 48,440 51,346 54,427
Finance charges 1,834 3,714 9,133 2,365 8,966 8,966 6,998 7,418 7,863
Materials and bulk purchases 60,125 71,477 83,313 96,050 93,235 93,235 102,740 108,904 115,438
Transfers and grants 17,598 6,967 5,785 5,716 5,716 5,716 4,036 5,776 6,035
Other expenditure 109,899 250,046 175,797 129,652 132,061 132,061 147,559 154,920 164,303
Total Expenditure 439,147 609,163 572,189 543,310 546,237 546,237 593,003 628,583 666,298
Surplus/(Deficit) (20,435) (173,368) (25,671) – – – – – –
Transfers recognised - capital 83,790 79,796 44,044 – – – – – –
Contributions recognised - capital & contributed assets– – – – – – – – –
Surplus/(Deficit) after capital transfers
& contributions
63,355 (93,572) 18,373 – – – – – –
Surplus/(Deficit) for the year 63,355 (93,572) 18,373 – – – – – –
Capital expenditure & funds sources
Capital expenditure 108,633 54,578 74,931 138,494 115,851 115,851 139,521 146,886 155,699
Transfers recognised - capital 78,973 23,872 29,322 98,423 70,507 70,507 94,359 100,021 106,022
Public contributions & donations – – – – – – – – –
Borrowing 24,698 20,416 – – 5,500 5,500 – – –
Internally generated funds 4,962 10,289 45,609 40,071 39,844 39,844 45,162 46,865 49,677
Total sources of capital funds 108,633 54,578 74,931 138,494 115,851 115,851 139,521 146,886 155,699
Financial position
Total current assets 286,806 309,527 281,217 390,071 390,071 390,071 269,464 284,284 299,920
Total non current assets 821,107 812,768 861,037 778,474 778,474 778,474 821,290 866,461 914,117
Total current liabilities 213,977 184,411 179,504 206,085 206,085 206,085 141,057 148,815 157,000
Total non current liabilities 50,564 106,018 105,858 137,273 137,273 137,273 79,122 83,474 88,065
Community wealth/Equity 843,372 831,866 856,892 825,187 825,187 825,187 870,575 918,457 968,972
Cash flows
Net cash from (used) operating 87,961 21,328 34,584 101,844 71,561 71,561 108,867 161,759 171,030
Net cash from (used) investing 66,832 (58,913) 3,733 (128,392) (104,504) (104,504) (129,845) (136,679) (144,880)
Net cash from (used) financing (37,957) 48,803 (3,822) (4,578) (4,578) (4,578) (6,032) (5,986) (4,769)
Cash/cash equivalents at the year end 131,494 142,711 177,206 146,080 108,559 108,559 81,549 100,643 158,465
Cash backing/surplus reconciliation
Cash and investments available 191,494 207,712 177,206 255,471 154,583 154,583 119,297 128,113 173,855
Application of cash and investments 137,114 114,773 128,220 115,182 115,917 115,917 27,137 28,215 28,457
Balance - surplus (shortfall) 54,380 92,939 48,986 140,289 38,666 38,666 92,160 99,898 145,398
Asset management
Depreciation & asset impairment 42,548 43,487 48,578 48,652 47,108 47,108 48,440 51,346 54,427
2013/14 Medium Term
Revenue & Expenditure
Framework
Current Year 2012/13

21 | P a g e
Table A1 is a budget summary and provides a concise overview of the municipality‟s budget from all of the major financial perspectives (operating, capital expenditure, financial position, cash flow, and MFMA funding compliance).
The table provides an overview of the amounts approved by Council for operating performance, resources deployed to capital expenditure, financial position, cash and funding compliance, as well as the municipality‟s commitment to eliminating basic service delivery backlogs.
Table 12 MBRR Table A2 - Budgeted Financial Performance (revenue and expenditure by standard classification)
Standard Classification Description 2009/10 2010/11 2011/12
R thousandAudited
Outcome
Audited
Outcome
Audited
Outcome
Original
Budget
Adjusted
Budget
Full Year
Forecast
Budget
Year
2013/14
Budget
Year +1
2014/15
Budget
Year +2
2015/16
Revenue - Standard
Governance and administration 388,687 393,036 438,235 375,805 373,208 373,208 403,884 427,767 453,433
Executive and council 152,136 150,064 175,461 86,182 86,182 86,182 93,490 99,099 105,045
Budget and treasury office 234,234 240,963 258,389 286,065 283,705 283,705 308,212 326,355 345,936
Corporate services 2,318 2,009 4,385 3,558 3,321 3,321 2,182 2,313 2,452
Community and public safety 8,819 8,507 18,714 14,155 18,622 18,622 32,766 34,732 36,816
Community and social services 724 1,087 9,440 5,121 5,718 5,718 8,132 8,620 9,138
Public safety 4,894 4,310 5,543 4,241 4,112 4,112 20,584 21,819 23,128
Housing 147 150 155 – 4,000 4,000 4,050 4,293 4,551
Health 3,053 2,961 3,576 4,793 4,793 4,793 – – –
Economic and environmental services 16,220 13,314 13,612 16,298 17,428 17,428 8,700 9,222 9,776
Planning and development 7,962 4,051 2,626 7,016 8,146 8,146 6,370 6,753 7,158
Road transport 8,258 9,262 10,986 9,282 9,282 9,282 2,330 2,470 2,618
Trading services 85,809 97,643 114,875 132,488 133,386 133,386 143,581 152,196 161,327
Electricity 60,172 66,547 81,558 86,334 87,282 87,282 94,250 99,905 105,899
Waste management 25,637 31,096 33,317 46,154 46,104 46,104 49,331 52,291 55,428
Other 2,966 3,122 3,364 4,563 3,593 3,593 4,072 4,666 4,946
Total Revenue - Standard 502,502 515,621 588,800 543,309 546,237 546,237 593,003 628,583 666,298
Expenditure - Standard
Governance and administration 171,435 301,854 222,046 175,077 180,667 180,667 183,923 194,958 206,656
Executive and council 117,660 241,025 155,120 103,690 110,020 110,020 112,452 119,199 126,351
Budget and treasury office 29,267 34,834 38,925 42,826 42,310 42,310 47,459 50,306 53,325
Corporate services 24,508 25,994 28,001 28,561 28,337 28,337 24,013 25,453 26,981
Community and public safety 92,011 112,664 107,383 116,996 116,902 116,902 123,567 130,980 138,839
Community and social services 29,155 39,152 35,862 37,907 37,655 37,655 59,582 63,157 66,947
Public safety 44,933 53,385 51,296 57,937 66,033 66,033 52,073 55,197 58,509
Housing 5,958 5,538 5,477 5,942 5,942 5,942 6,903 7,317 7,756
Health 11,965 14,590 14,748 15,211 7,272 7,272 5,009 5,309 5,628
Economic and environmental services 44,748 51,308 78,392 70,123 72,832 72,832 81,283 86,160 91,330
Planning and development 18,234 17,481 18,458 24,184 25,427 25,427 28,157 29,846 31,637
Road transport 26,514 33,826 59,934 45,939 47,405 47,405 53,127 56,314 59,693
Trading services 126,320 139,442 158,780 177,015 172,188 172,188 199,388 211,351 224,032
Electricity 45,525 54,866 67,026 76,248 71,756 71,756 79,053 83,797 88,824
Waste management 80,796 84,576 91,754 100,767 100,432 100,432 120,335 127,555 135,208
Other 4,631 3,926 3,826 4,099 3,650 3,650 4,842 5,133 5,440
Total Expenditure - Standard 439,147 609,193 570,427 543,310 546,237 546,237 593,003 628,583 666,298
Surplus/(Deficit) for the year 63,355 (93,572) 18,373 0 0 0 (0) 0 (0)
Current Year 2012/13
2013/14 Medium Term
Revenue & Expenditure
Framework

22 | P a g e
Explanatory notes to MBRR Table A2 - Budgeted Financial Performance (revenue and expenditure by standard classification)
Table A2 is a view of the budgeted financial performance in relation to revenue and expenditure per standard classification. The modified GFS standard classification divides the municipal services into 15 functional areas. Municipal revenue, operating expenditure and capital expenditure are then classified in terms if each of these functional areas which enables the National Treasury to compile „whole of government‟ reports.
Note that as a general principle the revenues for the Trading Services should exceed their expenditures. The table highlights that this is the case for Electricity functions, but not the Waste management function. As already noted above, the municipality will be undertaking a detailed study of this function to explore ways of improving efficiencies and provide a basis for re-evaluating the function‟s tariff structure.
• Other functions that show a deficit between revenue and expenditure are being financed from rates revenues and other revenue sources.
Table 13 MBRR Table A3 - Budgeted Financial Performance (revenue and expenditure by municipal vote)
Explanatory notes to MBRR Table A3 - Budgeted Financial Performance (revenue and expenditure by municipal vote)
Table A3 is a view of the budgeted financial performance in relation to the revenue and expenditure per municipal vote. This table facilitates the view of the budgeted operating performance in relation to the organisational structure of the municipality. This means it
Vote Description 2009/10 2010/11 2011/12
R thousandAudited
Outcome
Audited
Outcome
Audited
Outcome
Original
Budget
Adjusted
Budget
Full Year
Forecast
Budget
Year
2013/14
Budget
Year +1
2014/15
Budget
Year +2
2015/16
Revenue by Vote
Treasury 234,234 240,963 258,389 286,066 283,705 283,705 308,212 326,355 345,936
Corporate Services 2,318 2,009 4,385 3,558 3,321 3,321 2,182 2,313 2,452
Strategic Planning and Governance 152,136 150,064 175,461 86,182 86,182 86,182 93,490 99,099 105,045
Human Settlements and Infrastructure 60,319 66,697 81,713 86,334 91,282 91,282 100,630 106,667 113,067
Planning and Economic Development 7,962 4,051 2,626 7,016 8,146 8,146 8,617 9,222 9,776
Community and Social Services 45,533 51,837 66,226 74,154 73,601 73,601 79,872 84,927 90,022
Total Revenue by Vote 502,502 515,621 588,800 543,310 546,237 546,237 593,003 628,583 666,298
Expenditure by Vote
Treasury 29,267 34,834 38,925 42,827 42,310 42,310 47,459 50,306 53,325
Corporate Services 24,508 25,994 28,001 28,561 28,337 28,337 24,013 25,453 26,981
Strategic Planning and Governance 117,660 241,025 155,120 103,690 110,020 110,020 112,452 119,199 126,351
Human Settlements and Infrastructure 67,817 82,977 97,990 115,775 112,691 112,691 139,083 147,427 156,273
Planning and Economic Development 18,234 17,481 18,458 24,184 25,427 25,427 28,157 29,846 31,637
Community and Social Services 181,661 206,881 231,933 228,274 227,452 227,452 241,839 256,352 271,731
Total Expenditure by Vote 439,147 609,193 570,427 543,310 546,237 546,237 593,003 628,583 666,298
Surplus/(Deficit) for the year 63,354 (93,571) 18,373 – – – 0 – –
Current Year 2012/13
2013/14 Medium Term
Revenue & Expenditure
Framework
23 | P a g e
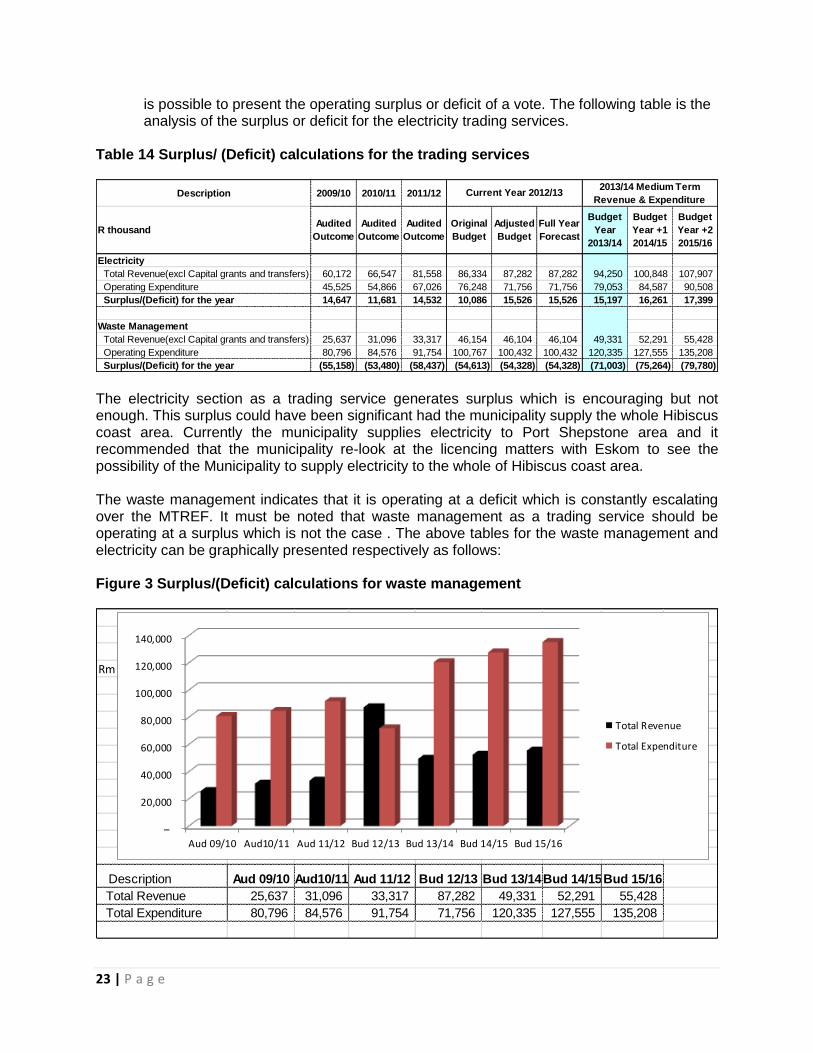
is possible to present the operating surplus or deficit of a vote. The following table is the analysis of the surplus or deficit for the electricity trading services.
Table 14 Surplus/ (Deficit) calculations for the trading services
The electricity section as a trading service generates surplus which is encouraging but not enough. This surplus could have been significant had the municipality supply the whole Hibiscus coast area. Currently the municipality supplies electricity to Port Shepstone area and it recommended that the municipality re-look at the licencing matters with Eskom to see the possibility of the Municipality to supply electricity to the whole of Hibiscus coast area. The waste management indicates that it is operating at a deficit which is constantly escalating over the MTREF. It must be noted that waste management as a trading service should be operating at a surplus which is not the case . The above tables for the waste management and electricity can be graphically presented respectively as follows: Figure 3 Surplus/(Deficit) calculations for waste management
Description 2009/10 2010/11 2011/12
R thousandAudited
Outcome
Audited
Outcome
Audited
Outcome
Original
Budget
Adjusted
Budget
Full Year
Forecast
Budget
Year
2013/14
Budget
Year +1
2014/15
Budget
Year +2
2015/16
Electricity
Total Revenue(excl Capital grants and transfers) 60,172 66,547 81,558 86,334 87,282 87,282 94,250 100,848 107,907
Operating Expenditure 45,525 54,866 67,026 76,248 71,756 71,756 79,053 84,587 90,508
Surplus/(Deficit) for the year 14,647 11,681 14,532 10,086 15,526 15,526 15,197 16,261 17,399
Waste Management
Total Revenue(excl Capital grants and transfers) 25,637 31,096 33,317 46,154 46,104 46,104 49,331 52,291 55,428
Operating Expenditure 80,796 84,576 91,754 100,767 100,432 100,432 120,335 127,555 135,208
Surplus/(Deficit) for the year (55,158) (53,480) (58,437) (54,613) (54,328) (54,328) (71,003) (75,264) (79,780)
2013/14 Medium Term
Revenue & Expenditure Current Year 2012/13
Rm
Description Aud 09/10 Aud10/11 Aud 11/12 Bud 12/13 Bud 13/14Bud 14/15Bud 15/16
Total Revenue 25,637 31,096 33,317 87,282 49,331 52,291 55,428
Total Expenditure 80,796 84,576 91,754 71,756 120,335 127,555 135,208
–
20,000
40,000
60,000
80,000
100,000
120,000
140,000
Aud 09/10 Aud10/11 Aud 11/12 Bud 12/13 Bud 13/14 Bud 14/15 Bud 15/16
Total Revenue
Total Expenditure
24 | P a g e
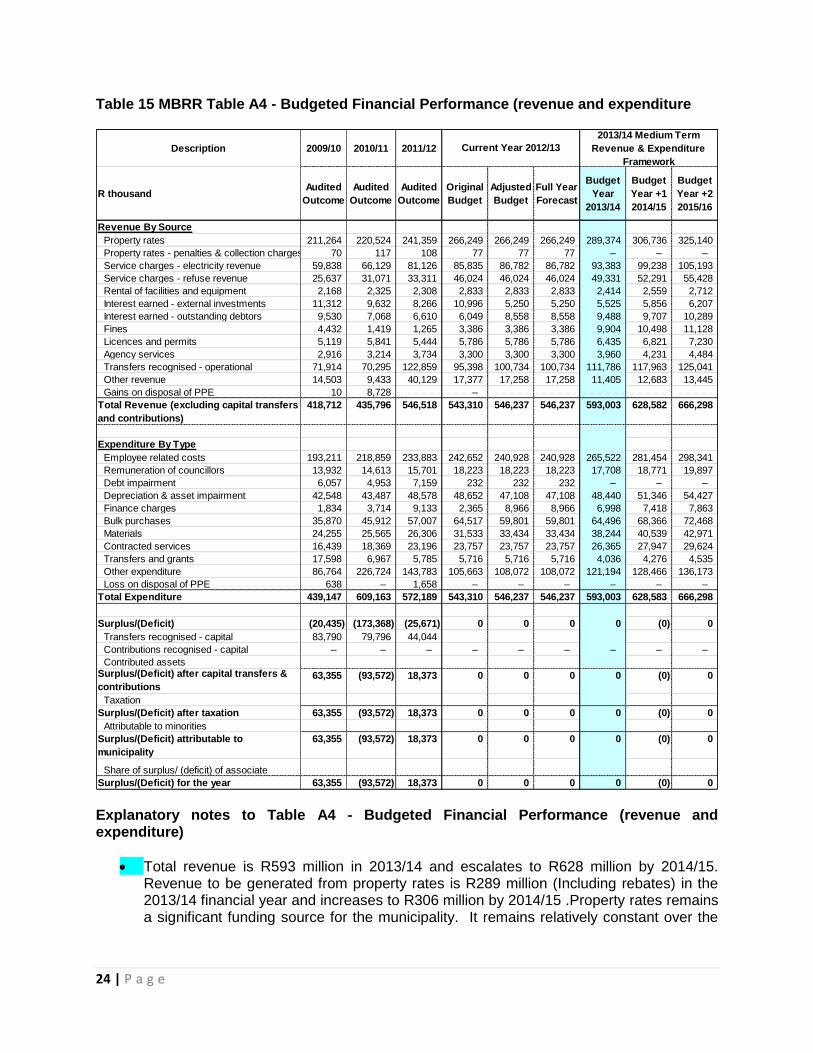
Table 15 MBRR Table A4 - Budgeted Financial Performance (revenue and expenditure
Explanatory notes to Table A4 - Budgeted Financial Performance (revenue and expenditure)
Total revenue is R593 million in 2013/14 and escalates to R628 million by 2014/15. Revenue to be generated from property rates is R289 million (Including rebates) in the 2013/14 financial year and increases to R306 million by 2014/15 .Property rates remains a significant funding source for the municipality. It remains relatively constant over the
Description 2009/10 2010/11 2011/12
R thousandAudited
Outcome
Audited
Outcome
Audited
Outcome
Original
Budget
Adjusted
Budget
Full Year
Forecast
Budget
Year
2013/14
Budget
Year +1
2014/15
Budget
Year +2
2015/16
Revenue By Source
Property rates 211,264 220,524 241,359 266,249 266,249 266,249 289,374 306,736 325,140
Property rates - penalties & collection charges 70 117 108 77 77 77 – – –
Service charges - electricity revenue 59,838 66,129 81,126 85,835 86,782 86,782 93,383 99,238 105,193
Service charges - refuse revenue 25,637 31,071 33,311 46,024 46,024 46,024 49,331 52,291 55,428
Rental of facilities and equipment 2,168 2,325 2,308 2,833 2,833 2,833 2,414 2,559 2,712
Interest earned - external investments 11,312 9,632 8,266 10,996 5,250 5,250 5,525 5,856 6,207
Interest earned - outstanding debtors 9,530 7,068 6,610 6,049 8,558 8,558 9,488 9,707 10,289
Fines 4,432 1,419 1,265 3,386 3,386 3,386 9,904 10,498 11,128
Licences and permits 5,119 5,841 5,444 5,786 5,786 5,786 6,435 6,821 7,230
Agency services 2,916 3,214 3,734 3,300 3,300 3,300 3,960 4,231 4,484
Transfers recognised - operational 71,914 70,295 122,859 95,398 100,734 100,734 111,786 117,963 125,041
Other revenue 14,503 9,433 40,129 17,377 17,258 17,258 11,405 12,683 13,445
Gains on disposal of PPE 10 8,728 –
Total Revenue (excluding capital transfers
and contributions)
418,712 435,796 546,518 543,310 546,237 546,237 593,003 628,582 666,298
Expenditure By Type
Employee related costs 193,211 218,859 233,883 242,652 240,928 240,928 265,522 281,454 298,341
Remuneration of councillors 13,932 14,613 15,701 18,223 18,223 18,223 17,708 18,771 19,897
Debt impairment 6,057 4,953 7,159 232 232 232 – – –
Depreciation & asset impairment 42,548 43,487 48,578 48,652 47,108 47,108 48,440 51,346 54,427
Finance charges 1,834 3,714 9,133 2,365 8,966 8,966 6,998 7,418 7,863
Bulk purchases 35,870 45,912 57,007 64,517 59,801 59,801 64,496 68,366 72,468
Materials 24,255 25,565 26,306 31,533 33,434 33,434 38,244 40,539 42,971
Contracted services 16,439 18,369 23,196 23,757 23,757 23,757 26,365 27,947 29,624
Transfers and grants 17,598 6,967 5,785 5,716 5,716 5,716 4,036 4,276 4,535
Other expenditure 86,764 226,724 143,783 105,663 108,072 108,072 121,194 128,466 136,173
Loss on disposal of PPE 638 – 1,658 – – – – – –
Total Expenditure 439,147 609,163 572,189 543,310 546,237 546,237 593,003 628,583 666,298
Surplus/(Deficit) (20,435) (173,368) (25,671) 0 0 0 0 (0) 0
Transfers recognised - capital 83,790 79,796 44,044
Contributions recognised - capital – – – – – – – – –
Contributed assetsSurplus/(Deficit) after capital transfers &
contributions63,355 (93,572) 18,373 0 0 0 0 (0) 0
Taxation
Surplus/(Deficit) after taxation 63,355 (93,572) 18,373 0 0 0 0 (0) 0
Attributable to minorities
Surplus/(Deficit) attributable to
municipality
63,355 (93,572) 18,373 0 0 0 0 (0) 0
Share of surplus/ (deficit) of associate
Surplus/(Deficit) for the year 63,355 (93,572) 18,373 0 0 0 0 (0) 0
2013/14 Medium Term
Revenue & Expenditure
Framework
Current Year 2012/13

25 | P a g e
medium-term and tariff increases have been factored in at 6 per cent, for each of the respective financial years of the MTREF.
Services charges relating to electricity and refuse removal constitutes the biggest component of the revenue basket of the municipality totalling R142 million for the 2013/14.
Transfers recognised – operating includes the local government equitable share and other operating grants from national and provincial government. It needs to be noted that in real terms the grants receipts from national government are growing rapidly over the MTREF for the two outer years.
Employee related costs and bulk purchases are the main cost drivers within the municipality and alternative operational gains and efficiencies will have to be identified to lessen the impact of wage and bulk tariff increases in future years.
The following graph illustrates the major expenditure items per type.
Figure 4 Main cost drivers
Bulk purchases have steadily increased over the 2007/08 to 2013/14 period escalating from R35 million to R64 million. These increases can be attributed to the increase in the cost of bulk electricity from Eskom .
Employee related costs and bulk purchases are the main cost drivers within the municipality and alternative operational gains and efficiencies will have to be identified to lessen the impact of wage and bulk tariff increases in future years.
Rm
Details Depreciation General Expenses Bulk purchases Employee costs
07/08 Audited 42,548 86,764 35,870 193,211
08/09 Audited 43,487 134,000 45,912 218,859
09/10 Audited 48,578 143,783 57,007 233,883
Budget Year 11/12 49,500 155,646 58,408 225,754
Budget Year 12/13 47,108 176,892 59,801 240,928
Budget Year 13/14 48,440 159,191 64,496 265,522
0
50,000
100,000
150,000
200,000
250,000
300,000
07/08 Audited 08/09 Audited 09/10 Audited Budget Year11/12
Budget Year12/13
Budget Year13/14
Depreciation
General Expenses
Bulk purchases
Employee costs
26 | P a g e
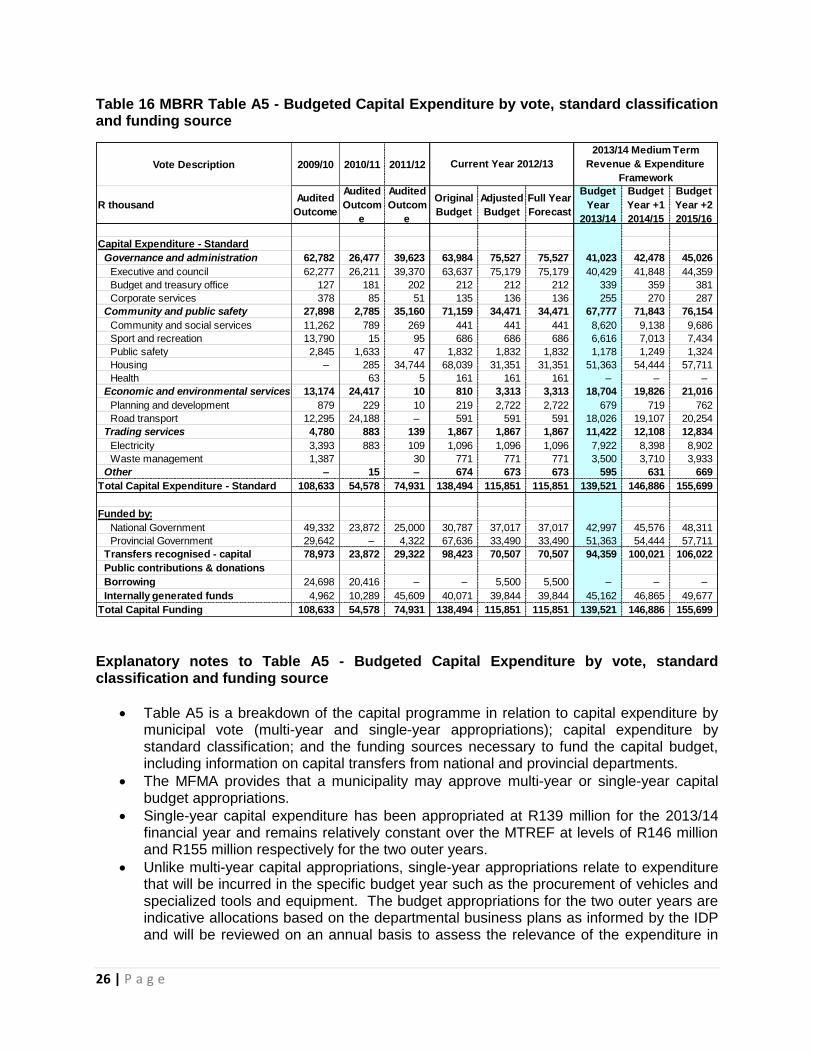
Table 16 MBRR Table A5 - Budgeted Capital Expenditure by vote, standard classification and funding source
Explanatory notes to Table A5 - Budgeted Capital Expenditure by vote, standard classification and funding source
Table A5 is a breakdown of the capital programme in relation to capital expenditure by municipal vote (multi-year and single-year appropriations); capital expenditure by standard classification; and the funding sources necessary to fund the capital budget, including information on capital transfers from national and provincial departments.
The MFMA provides that a municipality may approve multi-year or single-year capital budget appropriations.
Single-year capital expenditure has been appropriated at R139 million for the 2013/14 financial year and remains relatively constant over the MTREF at levels of R146 million and R155 million respectively for the two outer years.
Unlike multi-year capital appropriations, single-year appropriations relate to expenditure that will be incurred in the specific budget year such as the procurement of vehicles and specialized tools and equipment. The budget appropriations for the two outer years are indicative allocations based on the departmental business plans as informed by the IDP and will be reviewed on an annual basis to assess the relevance of the expenditure in
Vote Description 2009/10 2010/11 2011/12
R thousandAudited
Outcome
Audited
Outcom
e
Audited
Outcom
e
Original
Budget
Adjusted
Budget
Full Year
Forecast
Budget
Year
2013/14
Budget
Year +1
2014/15
Budget
Year +2
2015/16
Capital Expenditure - Standard
Governance and administration 62,782 26,477 39,623 63,984 75,527 75,527 41,023 42,478 45,026
Executive and council 62,277 26,211 39,370 63,637 75,179 75,179 40,429 41,848 44,359
Budget and treasury office 127 181 202 212 212 212 339 359 381
Corporate services 378 85 51 135 136 136 255 270 287
Community and public safety 27,898 2,785 35,160 71,159 34,471 34,471 67,777 71,843 76,154
Community and social services 11,262 789 269 441 441 441 8,620 9,138 9,686
Sport and recreation 13,790 15 95 686 686 686 6,616 7,013 7,434
Public safety 2,845 1,633 47 1,832 1,832 1,832 1,178 1,249 1,324
Housing – 285 34,744 68,039 31,351 31,351 51,363 54,444 57,711
Health 63 5 161 161 161 – – –
Economic and environmental services 13,174 24,417 10 810 3,313 3,313 18,704 19,826 21,016
Planning and development 879 229 10 219 2,722 2,722 679 719 762
Road transport 12,295 24,188 – 591 591 591 18,026 19,107 20,254
Trading services 4,780 883 139 1,867 1,867 1,867 11,422 12,108 12,834
Electricity 3,393 883 109 1,096 1,096 1,096 7,922 8,398 8,902
Waste management 1,387 30 771 771 771 3,500 3,710 3,933
Other – 15 – 674 673 673 595 631 669
Total Capital Expenditure - Standard 108,633 54,578 74,931 138,494 115,851 115,851 139,521 146,886 155,699
Funded by:
National Government 49,332 23,872 25,000 30,787 37,017 37,017 42,997 45,576 48,311
Provincial Government 29,642 – 4,322 67,636 33,490 33,490 51,363 54,444 57,711
Transfers recognised - capital 78,973 23,872 29,322 98,423 70,507 70,507 94,359 100,021 106,022
Public contributions & donations
Borrowing 24,698 20,416 – – 5,500 5,500 – – –
Internally generated funds 4,962 10,289 45,609 40,071 39,844 39,844 45,162 46,865 49,677
Total Capital Funding 108,633 54,578 74,931 138,494 115,851 115,851 139,521 146,886 155,699
2013/14 Medium Term
Revenue & Expenditure
Framework
Current Year 2012/13

27 | P a g e
relation to the strategic objectives and service delivery imperatives of the municipality. For the purpose of funding assessment of the MTREF, these appropriations have been included but no commitments will be incurred against single-year appropriations for the two outer-years.
The capital programme is funded from capital and provincial grants and transfers and internally generated funds.
Table 17 MBRR Table A6 - Budgeted Financial Position
Explanatory notes to Table A6 - Budgeted Financial Position
Table A6 is consistent with international standards of good financial management practice, and improves understand ability for councillors and management of the impact of the budget on the statement of financial position (balance sheet).
Description 2009/10 2010/11 2011/12
R thousandAudited
Outcome
Audited
Outcome
Audited
Outcome
Original
Budget
Adjusted
Budget
Full Year
Forecast
Budget
Year
2013/14
Budget
Year +1
2014/15
Budget
Year +2
2015/16
ASSETS
Current assets
Cash 131,494 142,712 177,206 142,712 142,712 142,712 8,500 8,968 9,461
Call investment deposits 60,000 65,000 – 143,884 143,884 143,884 151,798 160,146 168,955
Consumer debtors 80,501 92,839 95,545 94,500 94,500 94,500 99,698 105,181 110,966
Other debtors 10,425 5,013 4,711 5,013 5,013 5,013 5,289 5,580 5,886
Current portion of long-term debtors 1,062 1,673 1,189 1,673 1,673 1,673 1,765 1,862 1,965
Inventory 3,324 2,289 2,565 2,289 2,289 2,289 2,415 2,548 2,688
Total current assets 286,806 309,527 281,217 390,071 390,071 390,071 269,464 284,284 299,920
Non current assets
Long-term debtors 13,337 12,040 11,340 12,040 12,040 12,040 12,702 13,401 14,138
Investment property 61,259 260,856 310,105 260,856 260,856 260,856 275,203 290,339 306,308
Property, plant and equipment 745,630 539,146 539,077 505,000 505,000 505,000 532,775 562,078 592,992
Intangible 835 680 468 531 531 531 560 591 624
Other non-current assets 47 47 47 47 47 47 49 52 55
Total non current assets 821,107 812,768 861,037 778,474 778,474 778,474 821,290 866,461 914,117
TOTAL ASSETS 1,107,913 1,122,295 1,142,253 1,168,545 1,168,545 1,168,545 1,090,754 1,150,746 1,214,037
LIABILITIES
Current liabilities
Bank overdraft
Borrowing 5,578 8,398 6,194 8,398 8,398 8,398 8,860 9,347 9,861
Consumer deposits 14,470 15,373 16,760 15,373 15,373 15,373 16,219 17,111 18,052
Trade and other payables 163,030 131,392 125,244 155,320 155,320 155,320 87,500 92,313 97,390
Provisions 30,899 29,248 31,307 26,994 26,994 26,994 28,479 30,045 31,697
Total current liabilities 213,977 184,411 179,504 206,085 206,085 206,085 141,057 148,815 157,000
Non current liabilities
Borrowing 13,951 58,841 54,499 58,841 58,841 58,841 62,077 65,492 69,094
Provisions 36,613 47,177 51,359 78,432 78,432 78,432 17,045 17,982 18,971
Total non current liabilities 50,564 106,018 105,858 137,273 137,273 137,273 79,122 83,474 88,065
TOTAL LIABILITIES 264,541 290,429 285,362 343,358 343,358 343,358 220,179 232,289 245,065
NET ASSETS 843,372 831,866 856,892 825,187 825,187 825,187 870,575 918,457 968,972
COMMUNITY WEALTH/EQUITY
Accumulated Surplus/(Deficit) 429,532 423,692 454,243 417,013 417,013 417,013 473,427 526,809 582,824
Reserves 413,840 408,174 402,648 408,174 408,174 408,174 397,148 391,648 386,148
Minorities' interests
TOTAL COMMUNITY WEALTH/EQUITY843,372 831,866 856,892 825,187 825,187 825,187 870,575 918,457 968,972
2013/14 Medium Term Revenue &
Expenditure FrameworkCurrent Year 2012/13
28 | P a g e
This format of presenting the statement of financial position is aligned to GRAP1, which is generally aligned to the international version which presents Assets less Liabilities as “accounting” Community Wealth. The order of items within each group illustrates items in order of liquidity; i.e. assets readily converted to cash, or liabilities immediately required to be met from cash, appear first.
• Call investments deposits; • Consumer debtors; • Property, plant and equipment; • Trade and other payables; • Provisions non -current; • Changes in net assets; and • Reserves • The municipal equivalent of equity is Community Wealth/Equity. The justification is that
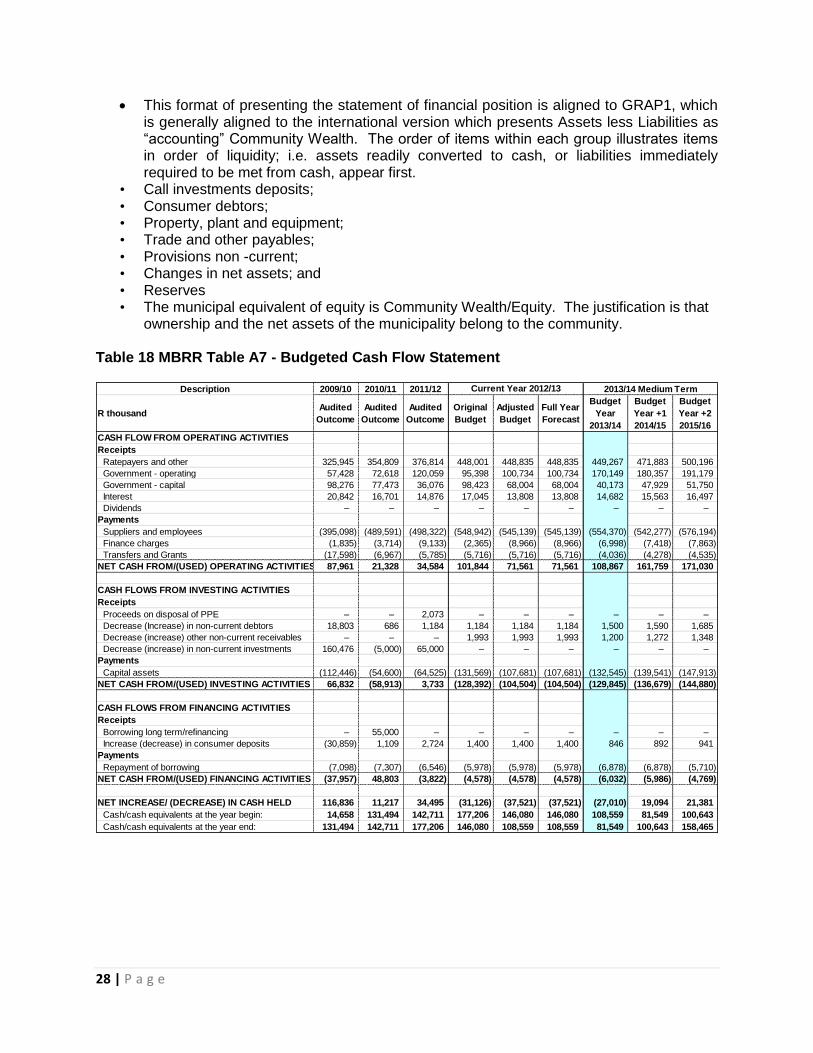
ownership and the net assets of the municipality belong to the community. Table 18 MBRR Table A7 - Budgeted Cash Flow Statement
Description 2009/10 2010/11 2011/12
R thousandAudited
Outcome
Audited
Outcome
Audited
Outcome
Original
Budget
Adjusted
Budget
Full Year
Forecast
Budget
Year
2013/14
Budget
Year +1
2014/15
Budget
Year +2
2015/16
CASH FLOW FROM OPERATING ACTIVITIES
Receipts
Ratepayers and other 325,945 354,809 376,814 448,001 448,835 448,835 449,267 471,883 500,196
Government - operating 57,428 72,618 120,059 95,398 100,734 100,734 170,149 180,357 191,179
Government - capital 98,276 77,473 36,076 98,423 68,004 68,004 40,173 47,929 51,750
Interest 20,842 16,701 14,876 17,045 13,808 13,808 14,682 15,563 16,497
Dividends – – – – – – – – –
Payments
Suppliers and employees (395,098) (489,591) (498,322) (548,942) (545,139) (545,139) (554,370) (542,277) (576,194)
Finance charges (1,835) (3,714) (9,133) (2,365) (8,966) (8,966) (6,998) (7,418) (7,863)
Transfers and Grants (17,598) (6,967) (5,785) (5,716) (5,716) (5,716) (4,036) (4,278) (4,535)
NET CASH FROM/(USED) OPERATING ACTIVITIES 87,961 21,328 34,584 101,844 71,561 71,561 108,867 161,759 171,030
CASH FLOWS FROM INVESTING ACTIVITIES
Receipts
Proceeds on disposal of PPE – – 2,073 – – – – – –
Decrease (Increase) in non-current debtors 18,803 686 1,184 1,184 1,184 1,184 1,500 1,590 1,685
Decrease (increase) other non-current receivables – – – 1,993 1,993 1,993 1,200 1,272 1,348
Decrease (increase) in non-current investments 160,476 (5,000) 65,000 – – – – – –
Payments
Capital assets (112,446) (54,600) (64,525) (131,569) (107,681) (107,681) (132,545) (139,541) (147,913)
NET CASH FROM/(USED) INVESTING ACTIVITIES 66,832 (58,913) 3,733 (128,392) (104,504) (104,504) (129,845) (136,679) (144,880)
CASH FLOWS FROM FINANCING ACTIVITIES
Receipts
Borrowing long term/refinancing – 55,000 – – – – – – –
Increase (decrease) in consumer deposits (30,859) 1,109 2,724 1,400 1,400 1,400 846 892 941
Payments
Repayment of borrowing (7,098) (7,307) (6,546) (5,978) (5,978) (5,978) (6,878) (6,878) (5,710)
NET CASH FROM/(USED) FINANCING ACTIVITIES (37,957) 48,803 (3,822) (4,578) (4,578) (4,578) (6,032) (5,986) (4,769)
NET INCREASE/ (DECREASE) IN CASH HELD 116,836 11,217 34,495 (31,126) (37,521) (37,521) (27,010) 19,094 21,381
Cash/cash equivalents at the year begin: 14,658 131,494 142,711 177,206 146,080 146,080 108,559 81,549 100,643
Cash/cash equivalents at the year end: 131,494 142,711 177,206 146,080 108,559 108,559 81,549 100,643 158,465
2013/14 Medium Term Current Year 2012/13

29 | P a g e
Table 19 MBRR Table A8 - Cash Backed Reserves/Accumulated Surplus Reconciliation
Explanatory notes to Table A7 - Budgeted Cash Flow Statement
The budgeted cash flow statement is the first measurement in determining if the budget is funded.
It shows the expected level of cash in-flow versus cash out-flow that is likely to result from the implementation of the budget.
It can be seen that the cash levels of the Municipality fell significantly over the 2012/13 to 2013/14 with an increase in outer years.
The approved 2012/13 MTREF provide for a further net decrease in cash of R34 million for the 2013/1 financial year.
Cash and cash equivalents totals R81 million as at the end of the 2013/14 financial year and escalates to R158 million by 2015/146
Explanatory notes to Table A8 - Cash Backed Reserves/Accumulated Surplus Reconciliation
The cash backed reserves/accumulated surplus reconciliation is aligned to the requirements of MFMA Circular 42 – Funding a Municipal Budget.
In essence the table evaluates the funding levels of the budget by firstly forecasting the cash and investments at year end and secondly reconciling the available funding to the liabilities/commitments that exist.
The outcome of this exercise would either be a surplus or deficit. A deficit would indicate that the applications exceed the cash and investments available and would be indicative of non-compliance with the MFMA requirements that the municipality‟s budget must be “funded”.
Non-compliance with section 18 of the MFMA is assumed because a shortfall would indirectly indicate that the annual budget is not appropriately funded.
From the table it can be seen that for the period 2012/13 to 2013/14 the surplus deteriorated from R38 million to R93 million.
Considering the requirements of section 18 of the MFMA, it can be concluded that the adopted 2013/14 MTREF was funded owing to the significant surplus.
Description 2009/10 2010/11 2011/12
R thousandAudited
Outcome
Audited
Outcome
Audited
Outcome
Original
Budget
Adjusted
Budget
Full Year
Forecast
Budget
Year
2013/14
Budget
Year +1
2014/15
Budget
Year +2
2015/16
Cash and investments available
Cash/cash equivalents at the year end 131,494 142,711 177,206 146,080 108,559 108,559 81,549 100,643 158,465
Other current investments > 90 days 60,000 65,001 – 109,391 46,024 46,024 37,748 27,470 15,391
Non current assets - Investments – – – – – – – – –
Cash and investments available: 191,494 207,712 177,206 255,471 154,583 154,583 119,297 128,113 173,855
Application of cash and investments
Unspent conditional transfers 83,634 46,548 37,755 – – – – – –
Unspent borrowing – – – – – – – – –
Statutory requirements 17,543 19,543 21,543 22,500 22,500 22,500 23,000 24,300 25,842
Other working capital requirements (21,905) (27,744) (13,744) 50,682 51,417 51,417 (23,417) (23,640) (24,939)
Other provisions 57,842 76,425 82,666 42,000 42,000 42,000 27,554 27,554 27,554
Long term investments committed – – – – – – – – –
Reserves to be backed by cash/investments – – – – – – – – –
Total Application of cash and investments: 137,114 114,773 128,220 115,182 115,917 115,917 27,137 28,215 28,457
Surplus(shortfall) 54,380 92,939 48,986 140,289 38,666 38,666 92,160 99,898 145,398
2013/14 Medium Term Current Year 2012/13

30 | P a g e
Table 20 MBRR Table A9 - Asset Management
Explanatory notes to Table A9 - Asset Management
Table A9 provides an overview of municipal capital allocations to building new assets and depreciation and asset impairment.
National Treasury has recommended that municipalities should allocate at least 40 per cent of their capital budget to the renewal of existing assets, and allocations to repairs and maintenance should be 8 per cent of PPE. The Municipality is unable to quantify these due to systems and processes not being in place.
9. Overview of the annual budget process Section 53 of the MFMA requires the Mayor of the municipality to provide general political guidance in the budget process and the setting of priorities that must guide the preparation of the budget. In addition Chapter 2 of the Municipal Budget and Reporting Regulations states that the Mayor of the municipality must establish a Budget Steering Committee to provide technical assistance to the Mayor in discharging the responsibilities set out in section 53 of the Act. 9.1. Budget Process Overview In terms of section 21 of the MFMA the Mayor is required to table in Council ten months before the start of the new financial year (i.e. in August 2012) a time schedule that sets out the process to revise the IDP and prepare the budget.
Description 2009/10 2010/11 2011/12
R thousandAudited
Outcome
Audited
Outcome
Audited
Outcome
Original
Budget
Adjusted
Budget
Full Year
Forecast
Budget
Year
2013/14
Budget
Year +1
2014/15
Budget
Year +2
2015/16
CAPITAL EXPENDITURE
Total New Assets 108,746 54,579 74,931 138,494 115,851 115,851 139,521 146,866 155,699
Infrastructure - Road transport 81,820 34,515 39,526 27,795 27,795 27,795 44,962 45,076 56,384
Infrastructure - Electricity – 4,373 5,153 5,052 16,594 16,594 7,570 7,600 6,700
Infrastructure - Other 3,118 4,502 2,101 1,808 1,808 1,808 500 – –
Infrastructure 84,938 43,390 46,780 34,655 69,654 69,654 53,032 52,676 63,084
Community 17,367 6,626 19,667 24,573 27,076 27,076 22,877 15,750 16,600
Heritage assets 26 – 45 250 250 250 – 20 20
Other assets 6,302 4,562 8,441 79,016 42,328 42,328 63,612 78,420 75,995
Intangibles 113 – – – – – – – –
Total Capital Expenditure
Infrastructure - Road transport 81,820 34,515 39,526 27,795 30,298 30,298 44,962 45,076 56,384
Infrastructure - Electricity – 4,373 5,153 5,052 16,594 16,594 7,570 7,600 6,700
Infrastructure - Other 3,118 4,502 2,101 1,808 1,808 1,808 500 – –
Infrastructure 84,938 43,390 46,780 34,655 48,700 48,700 53,032 52,676 63,084
Community 17,367 6,626 19,667 24,573 24,573 24,573 22,877 15,750 16,600
Heritage assets 26 – 45 250 250 250 – 20 20
Other assets 6,302 4,562 8,441 79,016 42,328 42,328 63,612 78,420 75,995
Intangibles 113 – – – – – – – –
TOTAL CAPITAL EXPENDITURE - Asset class108,746 54,579 74,931 138,494 115,851 115,851 139,521 146,866 155,699
EXPENDITURE OTHER ITEMS
Depreciation & asset impairment 42,548 43,487 48,578 48,652 47,108 47,108 48,440 51,346 54,427
TOTAL EXPENDITURE OTHER ITEMS42,548 43,487 48,578 48,652 47,108 47,108 48,440 51,346 54,427
Current Year 2012/132013/14 Medium Term
Revenue & Expenditure

31 | P a g e
The Mayor tabled in Council the required the IDP and budget time schedule on 28 August 2012. Key dates applicable to the process were:
August 2012-Through the IDP review process, determines strategic objectives for service delivery and development for next three-year budgets including review of Provincial and National government sector strategic plans.
November 2012-Mayor holds public hearing to identify the needs of the Community.
January 2013-Submit the mid-year performance assessment report to the council not later than 25th January 2013.
February 2013-The Manager Budget schedules meetings with HOD‟s to submit their operating budget proposals and departmental capital for inclusion in the draft budget.
March 2013-Tabling in Council of the draft 2013/14 IDP and 2013/14 MTREF for public consultation.
April – 29 April 2013-Public consultation
03 May 2013- Closing date for written comments
03 to 20 May 2013-Finalisation of the 2013/14 IDP and 2013/14 ,taking into account comments received from public, comments from National Treasury and updated information from the most recent Division of Revenue Bill and financial framework.
28 May 2013-Tabling of the 2013/14 MTREF before Council for consideration and approval.
9.2. IDP and Service Delivery and Budget Implementation Plan The Municipality‟s IDP is its principal strategic planning instrument, which directly guides and informs its planning, budget, management and development actions. This framework is rolled out into objectives, key performance indicators and targets for implementation which directly inform the Service Delivery and Budget Implementation Plan. The Process Plan applicable to the fourth revision cycle included the following key IDP processes and deliverables:
• Compilation of departmental business plans including key performance indicators and targets;
• Financial planning and budgeting process;
• Public participation process and registration of community needs;
• Compilation of the SDBIP, and
• The review of the performance management and monitoring processes. The IDP has been taken into a business and financial planning process leading up to the 2013/14 MTREF, based on the approved 2013/14 MTREF, Mid-year Review and adjustments budget. The business planning process has subsequently been refined in the light of current economic circumstances and the resulting revenue projections. With the compilation of the 2013/14 MTREF, each department/function had to review the business planning process, including the setting of priorities and targets after reviewing the mid-year and third quarter performance against the 2012/13 Departmental Service Delivery and Budget Implementation Plan. Business planning links back to priority needs and master planning, and essentially informed the detail operating budget appropriations and three-year capital programme.

32 | P a g e
9.3. Financial Modelling and Key Planning Drivers As part of the compilation of the 2013/14 MTREF, extensive financial modelling was undertaken to ensure affordability and long-term financial sustainability. The following key factors and planning strategies have informed the compilation of the 2013/14 MTREF: • Municipality‟s growth
• Policy priorities and strategic objectives
• Asset maintenance
• Economic climate and trends (i.e. inflation, Eskom increases, household debt, migration patterns)
• Performance trends
• The approved 2012/13 adjustments budget and performance against the SDBIP
• Cash Flow Management Strategy
• Debtor payment levels
• Loan and investment possibilities
• The need for tariff increases versus the ability of the community to pay for services;
• Improved and sustainable service delivery
In addition to the above, the strategic guidance given in National Treasury‟s MFMA Circulars 66 and 67 has been taken into consideration in the planning and prioritisation process. 9.4. Community Consultation The draft 2013/14 MTREF as tabled before Council on 28 March 2013 and on 04 April 2013 it was published on the municipality‟s website for public consultation , and hard copies were made available at customer care offices, municipal notice boards and various libraries. The opportunity to give electronic feedback was also communicated on the Municipality website. All documents in the appropriate format (electronic and printed) were provided to National Treasury, and other national and provincial departments in accordance with section 23 of the MFMA, to provide an opportunity for them to make inputs. The applicable dates and venues were published in all the local newspapers and on average attendance were recorded per meeting. This is up on the previous year‟s process. This can be attributed to the additional initiatives that were launched during the consultation process, including the specific targeting of ratepayer associations. Individual sessions were scheduled with organised business and imbizo‟s were held to further ensure transparency and interaction. Submissions received during the community consultation process and additional information regarding revenue and expenditure and individual capital projects were addressed, and where relevant considered as part of the finalisation of the 2013/14 MTREF. Feedback responses to the submissions received are available on request. The following are some of the issues and concerns raised as well as comments received during the consultation process.
• Several complaints were received regarding poor service delivery, especially waste
removal backlogs and the state of road infrastructure;
33 | P a g e
• Poor performance of contractors relating to infrastructure development and maintenance
especially in the areas of road construction and maintenance were raised;
• Capital expenditure is not allocated to the areas in the same ratio as the income derived
from those areas. This is a normal practice in a collective taxation environment. The Municipality is responsible for managing the equitable use of resources to ensure that constitutional imperative to progressively improve basic services in undeveloped areas is realized in a sustainable manner over a reasonable period of time;
• Packages of council officials were criticized as being very high,
• The affordability of tariff increases, especially electricity, was raised on numerous
occasions. This concern was also raised by organized business as an obstacle to economic growth;
• Pensioners cannot afford the tariff increases due to low annual pension increases; and
• During the community consultation process large sections of the community made it
clear that they are not in favour of any further tariff increases to fund additional budget requests. They indicated that the municipality must do more to ensure efficiencies and value for money.
The following submissions were received from B&B Network South Coast • “Bed & Breakfast” means dwellings with four bed rooms or less on the property, which
will be categorized as Residential: • This to now read as: - “Bed & Breakfast means dwellings with SIX LETTABLE BED
ROOMS on the property (which shall exclude the bed room/s used by the B&B establishment owner for his/her/their own private use) which will be categorized as Residential 1:1 Differential Rating.
Our motivation to have this definition altered is that many B&B's were granted & given permission to operate under the previous Town Planning Schemes of their particular areas (I.E. Umtentweni & Southbroom), and it would now be unfair to apply this restriction. • Allowance for private living space must also be taken into consideration as the existing
B&B License granted determines that a B&B owner/manager MUST reside on the property; and thus we feel this space should not be counted as Lettable bed rooms.
• “Guest Houses Lodges” means dwellings with five bed rooms and more on the property, and will be categorized as such;
• This to now read as:- “Guest House/Lodges means dwellings with SEVEN – SIXTEEN LETTABLE BED ROOMS on the property (which shall exclude the bed room/s used by the Guest house/Lodge establishment owner for his/her/their own private use) which will be categorized as (no definition as such yet for the newly created valuation between residential & commercial property) 1:1.51 Differential rating.
• Our motivation once again to have this definition altered is that many Guest House/Lodges were granted & given permission to operate under the previous Town Planning Schemes of their particular areas (I.E. Umtentweni & Southbroom), and it would now be unfair to apply this restriction.
• Allowance for private living space must also be taken into consideration as the existing Guest House/Lodge License granted determines that the owner/manager MUST reside on the property; and thus we feel this space should not be counted as Lettable bed rooms.
• We are very pleased that Minister Davies has initiated “The Business Licensing Bill” that is to be “a cheap, easy & accessible process of registering any business activity at local level, and we will support this bill.

34 | P a g e
Table 21 Budget Road Shows Time Table
DATE CLUSTER WARDS VENUE TIME
Wednesday,17 April 2013
6 05,07,08,09&29 Thokothe Sports Ground
10h00
Thursday,18 April 2013 7 01,10,&11 Thongasi Community Hall
10h00
Friday, 19 April 2013 01 13,14,15 &16 Fairview Sports Ground 10h00
Friday, 19 April 2013 5 02,03,06 &19 Uvongo Community Hall
17h00
Monday, 22 April 2013 2 04,12,17,&18 Port Shepstone Civic Centre
17h00
Tuesday, 23 April 2013 4 25,26,27&28 Olwandle High School 17h00
Monday,29 April 2013 3 20,21,22,23 &24 Bhuqu Sports Ground 10h00
The following are the changes effected in the final 2013/14 MTREF compared to the draft 2013/14 MTREF that was tabled for community consultation, include:
• Bulk electricity purchase by the municipality , was factored at 7.3 per cent and tariff
Increase applicable to municipalities from 01 July 2013 is 7 per cent,
• An amount of R700 000 was added in the Capital Budget to fund road rehabilitation;
• Youth empowerment has been increased from R800 000 to R1 million;
• The 2013 Division of Revenue Act (DORA) grant allocations were finalized and aligned
to the gazetted allocations; and
• An amount of R300 000 was allocated to By-law review, development and review; • The revised circular 67 that specifically deals with electricity tariffs and bulk purchases
was considered. • An amount of R100 000 Entabeni hall renovation was added to the capital budget. • The indigent support threshold of the rates policy has been increased to R320,000. • The town planning related tariffs were not increased as they were previously increased
by 7 per cent. • Disaster relief has been increased from R160 500 to R365 000.00; • The refuse removal charge for the vacant land category has been reduced by 40 per
cent of the residential amount as per resolution C114/08/2012. • The Port Shepstone peace monument for R250 000 that was budgeted for the 2012/13
financial year has been transferred to the 2013/14 financial year. • The bed and breakfast and guest houses definition in the rates policy have been
amended. 10. Overview of Alignment of annual budget with IDP The Constitution mandates local government with the responsibility to exercise local developmental and cooperative governance. The eradication of imbalances in South African society can only be realized through a credible integrated developmental planning process. Municipalities in South Africa need to utilise integrated development planning as a method to plan future development in their areas and so find the best solutions to achieve sound long-term development goals. A municipal IDP provides a five year strategic programme of action aimed at setting short, medium and long term strategic and budget priorities to create a development
35 | P a g e
platform, which correlates with the term of office of the political incumbents. The plan aligns the resources and the capacity of a municipality to its overall development aims and guides the municipal budget. An IDP is therefore a key instrument which municipalities use to provide vision, leadership and direction to all those that have a role to play in the development of a municipal area. The IDP enables municipalities to make the best use of scarce resources and speed up service delivery. Integrated developmental planning in the South African context is amongst others, an approach to planning aimed at involving the municipality and the community to jointly find the best solutions towards sustainable development. Furthermore, integrated development planning provides a strategic environment for managing and guiding all planning, development and decision making in the municipality. It is important that the IDP developed by municipalities correlate with National and Provincial intent. It must aim to co-ordinate the work of local and other spheres of government in a coherent plan to improve the quality of life for all the people living in that area. Applied to the Municipality, issues of national and provincial importance should be reflected in the IDP of the municipality. A clear understanding of such intent is therefore imperative to ensure that the Municipality strategically complies with the key national and provincial priorities. The aim of this revision cycle was to develop and coordinate a coherent plan to improve the quality of life for all the people living in the area, also reflecting issues of national and provincial importance. One of the key objectives is therefore to ensure that there exists alignment between national and provincial priorities, policies and strategies and the Municipality‟s response to these requirements. The national and provincial priorities, policies and strategies of importance include amongst others: • Green Paper on National Strategic Planning of 2009;
• Government Programme of Action;
• Development Facilitation Act of 1995;
• Provincial Growth and Development Strategy (GGDS);
• National and Provincial spatial development perspectives;
• Relevant sector plans such as transportation, legislation and policy;
• National Key Performance Indicators (NKPIs);
• Accelerated and Shared Growth Initiative (ASGISA);
• National 2014 Vision;
• National Spatial Development Perspective (NSDP) and
• The National Priority Outcomes. The Constitution requires local government to relate its management, budgeting and planning functions to its objectives. This gives a clear indication of the intended purposes of municipal integrated development planning. Legislation stipulates clearly that a municipality must not only give effect to its IDP, but must also conduct its affairs in a manner which is consistent with its IDP. The following table highlights the IDP‟s five strategic objectives for the 2013/14 MTREF and further planning refinements that have directly informed the compilation of the budget:

36 | P a g e
Table 22 IDP Strategic Objectives
2012/2013 Financial Year
2013/2014 MTREF
1.The provision of quality basic services and infrastructure
1.Provision of quality basic services and infrastructure
2.Municipal financial viability and management.
2.1. Implementing revenue enhancement strategy. 2.2. Uphold treasury norms and standards in terms of budgeting and reporting. 2.3. Manage municipal expenditure.
3.Local economic development and social development
3.Economic growth and development that leads to sustainable job creation
4.Good governance and public participation.
4.1. Promote culture of participatory democracy and social cohesion. 4.2. To promote and uphold principle of good governance. 4.3 Implementation of effective Organisational Performance Management System(OPMS)
5.Spatial and environmental 5 .Implementation of the Spatial Development Framework.
In order to ensure integrated and focused service delivery between all spheres of government it was important for the Municipality to align its budget priorities with that of national and provincial government. All spheres of government place a high priority on infrastructure development, economic development and job creation, efficient service delivery, poverty alleviation and building sound institutional arrangements. Local priorities were identified as part of the IDP review process which is directly aligned to that of the national and provincial priorities. The key performance areas can be summarised as follows against the five strategic objectives: 1. Provision of quality basic services and infrastructure which includes, amongst others:
o Provide electricity;
o Provide waste removal;
o Provide housing;
o Provide roads and storm water;
o maintaining the infrastructure of the Municipality.
2. Economic growth and development that leads to sustainable job creation by:
o Ensuring the is a clear structural plan for the municipality;
o Ensuring planning processes function in accordance with set timeframes;
o Facilitating the use of labour intensive approaches in the delivery of services and the
building of infrastructure. 3.1 Fight poverty and build clean, healthy, safe and sustainable communities:
o Effective implementation of the Indigent

37 | P a g e
o Working with the provincial department of health to provide primary health care
services;
o Extending waste removal services and ensuring effective municipality cleansing;
o Working with strategic partners such as SAPS to address crime;
o Ensuring save working environments by effective enforcement of building and health
regulations;
o Promote viable, sustainable communities through proper zoning; and
o Promote environmental sustainability by protecting wetlands and key open spaces.
3.2 Integrated Social Services for empowered and sustainable communities
o Work with provincial departments to ensure the development of community
infrastructure such as schools and clinics is properly co-ordinated with the informal settlements upgrade programme
4. Foster participatory democracy and Batho Pele principles through a caring, accessible and accountable service by:
o Optimising effective community participation in the ward committee system; and
o Implementing Batho Pele in the revenue management strategy.
5.1 Promote sound governance through:
o Publishing the outcomes of all tender processes on the municipal website
5.2 Ensure financial sustainability through:
o Reviewing the use of contracted services
o Continuing to implement the infrastructure renewal strategy and the repairs and
maintenance plan 5.3 Optimal institutional transformation to ensure capacity to achieve set objectives
o Review of the organizational structure to optimize the use of personnel;
The 2013/14 MTREF has therefore been directly informed by the IDP revision process and the following tables provide a reconciliation between the IDP strategic objectives and operating revenue, operating expenditure and capital expenditure. Table 23 MBRR Table SA4 & Table 24 MBRR SA5- Reconciliation between the IDP strategic objectives and budgeted revenue and budgeted expenditure

38 | P a g e
Strategic Objective Goal 2009/10 2010/11 2011/12
R thousand
Audited
Outcome
Audited
Outcome
Audited
Outcome
Original
Budget
Adjusted
Budget
Full Year
Forecast
Budget
Year
2013/14
Budget
Year +1
2014/15
Budget
Year +2
2015/16
Good Governance and public
participation
Clean
administration &
sound public
participation
69,252 76,202 81,443 89,740 89,740 89,740 93,737 99,361 105,322
Service delivery and
Infrastructure
Electricty, Roads ,
Housing and
accelerate capital
expenditure
59,801 78,546 97,150 90,282 90,282 90,282 94,250 99,905 105,899
Social, Economic
Development and Planning
Youth
empowerment,LED
strategy,supporting
SMMEs
5,651 6,210 6,370 7,016 7,016 7,016 6,370 6,753 7,158
Municipal Financial viability Sound financial
management
295,540 303,987 326,000 275,185 278,112 278,112 320,057 339,261 359,617
Spatial and Environment Health hygienically
safe environment
58,428 39,145 49,331 46,154 46,154 46,154 49,331 52,290 55,428
Public Safety 9,501 7,601 20,584 18,066 18,066 18,066 21,501 22,791 24,158
Community
Facilities
4,330 3,900 9,684 16,867 16,867 16,867 7,757 8,222 8,716
Total Revenue 502,502 515,591 590,562 543,310 546,237 546,237 593,003 628,583 666,298
Current Year 2012/13
2013/14 Medium Term
Revenue & Expenditure
Framework
Strategic Objective Goal 2009/10 2010/11 2011/12
R thousand
Audited
Outcome
Audited
Outcome
Audited
Outcome
Original
Budget
Adjusted
Budget
Full Year
Forecast
Budget
Year
2013/14
Budget
Year +1
2014/15
Budget
Year +2
2015/16
Good Governance and
public participation
Clean administration
& sound public
participation
53,502 67,146 71,434 99,987 99,987 99,987 136,465 144,653 153,332
Service delivery and
Infrastructure
Electricty, Roads ,
Housing and
accelerate capital
expenditure
85,001 95,005 98,756 121,003 121,003 121,003 139,330 147,695 156,556
Social, Economic
Development and
Planning
Youth
empowerment,LED
strategy,supporting
SMMEs
3,101 5,650 6,101 24,028 24,028 24,028 28,157 29,846 31,637
Municipal Financial
viability
Sound financial
management
167,040 314,846 315,987 125,492 125,492 125,492 47,459 50,307 53,325
Spatial and
Environment
Health hygienically
safe environment
85,001 75,005 79,635 98,514 98,514 98,514 120,335 127,555 135,208
Public Safety 40,001 45,010 275 62,298 62,298 62,298 56,668 60,068 63,672
Community Facilities 5,501 6,501 – 11,988 14,915 14,915 64,589 68,459 72,567
Total Expenditure 439,146 609,163 572,190 543,310 546,237 546,237 593,003 628,583 666,298
Current Year 2012/13 2013/14 Medium Term

39 | P a g e
Table 25 MBRR Table SA7 - Reconciliation between the IDP strategic objectives and budgeted capital expenditure
10.1 Measurable performance objectives and indicators Performance Management is a system intended to manage and monitor service delivery progress against the identified strategic objectives and priorities. In accordance with legislative requirements and good business practices as informed by the National Framework for Managing Programme Performance Information, the Municipality has developed and implemented a performance management system of which system is constantly refined as the integrated planning process unfolds. The Municipality targets, monitors, assess and reviews organisational performance which in turn is directly linked to individual employee‟s performance. At any given time within government, information from multiple years is being considered; plans and budgets for next year; implementation for the current year; and reporting on last year's performance. Although performance information is reported publicly during the last stage, the performance information process begins when policies are being developed, and continues through each of the planning, budgeting, implementation and reporting stages. The planning, budgeting and reporting cycle can be graphically illustrated as follows:
Strategic Objective Goal 2009/10 2010/11 2011/12
R thousand
Audited
Outcome
Audited
Outcom
e
Audited
Outcom
e
Original
Budget
Adjusted
Budget
Full Year
Forecast
Budget
Year
2013/14
Budget
Year +1
2014/15
Budget
Year +2
2015/16
Good Governance and
public participation
Clean administration &
sound public
participation
62,655 26,296 39,421 63,772 75,315 75,315 40,565 41,993 44,512
Service delivery and
Infrastructure
Electricty, Roads ,
Housing and accelerate
capital expenditure
15,688 25,356 34,853 69,726 33,038 33,038 77,311 81,950 86,867
Social, Economic
Development and
Planning
Youth
empowerment,LED
strategy,supporting
SMMEs
879 229 10 219 2,722 2,722 2,722 2,885 3,058
Municipal Financial
viability
Sound financial
management
127 181 102 212 212 212 339 359 381
Spatial and Environment Health hygienically safe
environment
1,387 – 30 771 771 771 3,500 3,710 3,933
Public Safety 2,845 1,633 47 1,832 1,832 1,832 1,178 1,249 1,324
Community Facilities 25,052 883 468 1,962 1,961 1,961 13,906 14,740 15,625
Total Capital Expenditure 108,633 54,578 74,931 138,494 115,851 115,851 139,521 146,886 155,699
Current Year 2012/13 2013/14 Medium Term

40 | P a g e
Figure 5 Planning, budgeting and reporting cycle The performance of the Municipality relates directly to the extent to which it has achieved success in realising its goals and objectives, complied with legislative requirements and meeting stakeholder expectations. The Municipality therefore has adopted one integrated performance management system which encompasses:
• Planning (setting goals, objectives, targets and benchmarks);
• Monitoring (regular monitoring and checking on the progress against plan);
• Measurement (indicators of success);
• Review (identifying areas requiring change and improvement);
• Reporting (what information, to whom, from whom, how often and for what purpose); and
• Improvement (making changes where necessary).

41 | P a g e
The performance information concepts used by the Municipality in its integrated performance management system are aligned to the Framework of Managing Programme Performance Information issued by the National Treasury:
10.2.Performance indicators and benchmarks The following table sets out the municipalities main performance objectives and benchmarks for the 2011/12 MTREF. Table 26 MBRR Table SA8 - Performance indicators and benchmarks

42 | P a g e
2009/10 2010/11 2011/12
Audited
Outcom
e
Audited
Outcom
e
Audited
Outcom
e
Original
Budget
Adjusted
Budget
Budget
Year
2013/14
Budget
Year +1
2014/15
Budget
Year +2
2015/16
Borrowing Management
Capital Charges to
Operating Expenditure
Interest & Principal Paid
/Operating Expenditure
2.0% 1.8% 2.7% 1.4% 2.5% 2.3% 2.3% 2.0%
Capital Charges to Own
Revenue
Finance charges &
Repayment of borrowing
/Own Revenue
2.6% 3.0% 3.7% 1.6% 3.0% 2.9% 2.8% 2.5%
Borrowed funding of 'own'
capital expenditure
Borrowing/Capital
expenditure excl.
transfers and grants and
contributions
0.0% 179.1% 0.0% 0.0% 0.0% 0.0% 0.0% 0.0%
Safety of Capital
Gearing Long Term Borrowing/
Funds & Reserves
3.4% 14.4% 13.5% 14.4% 14.4% 14.4% 14.4% 14.4%
Liquidity
Current Ratio Current assets/current
liabilities
1.3 1.7 1.6 1.9 1.9 1.9 1.9 1.9
Current Ratio adjusted for
aged debtors
Current assets less
debtors > 90 days/current
liabilities
1.3 1.7 1.0 1.5 1.5 1.5 1.5 1.6
Liquidity Ratio Monetary Assets/Current
Liabilities
0.9 1.1 1.0 1.4 1.4 1.1 1.1 1.1
Revenue Management
Annual Debtors Collection
Rate (Payment Level %)
Last 12 Mths
Receipts/Last 12 Mths
Billing
102.8% 102.4% 91.0% 94.5% 93.8% 94.8% 94.0%
Current Debtors Collection
Rate (Cash receipts % of
Ratepayer & Other
revenue)
97.2% 102.2% 90.7% 93.8% 93.1% 94.2% 93.4%
Outstanding Debtors to
Revenue
Total Outstanding
Debtors to Annual
Revenue
25.2% 25.6% 20.6% 19.6% 19.5% 20.1% 20.0% 20.0%
Longstanding Debtors
Recovered
Debtors > 12 Mths
Recovered/Total Debtors
> 12 Months Old
15.0% 25.0% 30.0% 85.0% 85.0% 100.0% 100.0% 100.0%
Creditors Management
Creditors to Cash and
Investments
60.4% 59.3% 49.4% 87.6% 64.6% 71.4% 65.2% 59.7%
Other Indicators
Electricity Distribution Losses (2)Total Cost of Losses
(Rand '000) 1,249 2,321 1,865 1,500 1,500 1,000 500 500
Employee costs Employee costs/(Total
Revenue - capital
revenue)
46.1% 50.2% 42.8% 41.9% 41.4% 44.8% 44.8% 44.8%
Remuneration Total remuneration/(Total
Revenue - capital
revenue)
49.5% 54.9% 47.9% 45.1% 44.6% 47.8% 47.8% 47.8%
Finance charges &
Depreciation
FC&D/(Total Revenue -
capital revenue)
10.6% 10.8% 10.6% 8.8% 9.6% 9.3% 9.3% 9.3%
IDP regulation financial
viability indicators
i. Debt coverage (Total Operating Revenue
- Operating Grants)/Debt
service payments due
within financial year)
14.4 17.1 18.9 25.1 25.1 21.5 23.0 24.4
ii.O/S Service Debtors to
Revenue
Total outstanding service
debtors/annual revenue
received for services
30.8% 31.1% 28.3% 23.2% 23.1% 24.6% 24.5% 24.3%
iii. Cost coverage (Available cash +
Investments)/monthly
fixed operational
expenditure
4.9 4.2 5.2 5.1 6.8 3.3 3.6 3.9
Description of financial
indicator
2013/14 Medium Term
Revenue & Expenditure
FrameworkBasis of calculation
Current Year 2012/13

43 | P a g e
10.2.1 Performance indicators and benchmarks 10.2.1.1 Borrowing Management The following financial performance indicators have formed part of the compilation of the 2013/14 MTREF: • Capital charges to operating expenditure is a measure of the cost of borrowing in
relation to the operating expenditure. It can be seen that the cost of borrowing has been constant from 2.0 per cent in 2009/10 to 2.3 per cent in 2013/14.
• Borrowing funding of own capital expenditure measures the degree to which own capital
expenditure (excluding grants and contributions) has been funded by way of borrowing. It can be seen that from 2010/11 to 2013/14 the average is 0 per cent that indicates that the municipality has not borrowed since 2010/11 to fund capital expenditure.
The municipality ‟s debt profile provides some interesting insights on the municipality „s future borrowing capacity. Firstly, the use of amortising loans leads to high debt service costs at the beginning of the loan, which declines steadily towards the end of the loan‟s term.
The municipality has raised mainly amortising loans over the past two years, ie the R 55 million loan from Standard Bank to fund capital expenditure.
10.2.1.2 Safety of Capital • The gearing ratio is a measure of the total long term borrowings over funds and
reserves. Between 2009/10 and 2013/14 the gearing ratio has been constant at 14 per cent. This was primarily a result of the increased borrowing levels and decreasing funds and reserves in 2010/11.
10.2.1.3 Liquidity • Current ratio is a measure of the current assets divided by the current liabilities and as a
benchmark the Municipality has set a limit of 1, hence at no point in time should this ratio be less than 1. For the 2013/14 MTREF the current ratio is 1.9 and also for the two outer years of the MTREF. Going forward it will be necessary to maintain these levels.
• The liquidity ratio is a measure of the ability of the municipality to utilize cash and cash
equivalents to extinguish or retire its current liabilities immediately. Ideally the municipality should have the equivalent cash and cash equivalents on hand to meet at least the current liabilities, which should translate into a liquidity ratio of 1. Anything below 1 indicates a shortage in cash to meet creditor obligations. For the 2013/14 financial year the ratio was 1.1 and for the two outer years over MTREF. This needs to be considered a pertinent risk for the municipality as any under collection of revenue will translate into serious financial challenges for the Municipality. As part of the longer term financial planning objectives this ratio will have to be set at a minimum of 1.

44 | P a g e
10.2.1.4 Revenue Management • As part of the financial sustainability strategy, an aggressive revenue management
framework has been implemented to increase cash inflow, not only from current billings but also from debtors that are in arrears in excess of 95 days. The intention of the strategy is to streamline the revenue value chain by ensuring accurate billing, customer service, credit control and debt collection.
10.2.1.5 Creditors Management • The Municipality has managed to ensure that creditors are settled within the legislated
30 days of invoice. While the liquidity ratio is of concern, by applying daily cash flow management the municipality has managed to ensure a 100 per cent compliance rate to this legislative obligation. This has had a favourable impact on suppliers‟ perceptions of risk of doing business with the Municipality, which is expected to benefit the Municipality in the form of more competitive pricing of tenders, as suppliers compete for the Municipality‟s business.
10.2.1.6 Other Indicators • The electricity distribution losses have been managed downwards from R2.3 million in
the 2010/11 financial year to R1 million over the MTREF. The initiatives to ensure these targets are achieved include managing illegal connections and theft of electricity by rolling out smart metering systems, including prepaid meters.
• Employee costs as a percentage of operating revenue continues to increase over the
MTREF. This is primarily owing to the high increase in bulk purchases which directly increase revenue levels, as well as increased allocation relating to operating grants and transfers.
• Similar to that of employee costs, repairs and maintenance as percentage of operating
revenue is also decreasing owing directly to cost drivers such as bulk purchases increasing far above inflation. In real terms, repairs and maintenance has increased as part of the Municipality‟s strategy to ensure the management of its asset base.
10.2.2 Free Basic Services: basic social services package for indigent households The social package assists residents that have difficulty paying for services and are registered as indigent households in terms of the Indigent Policy of the Municipality. Only registered indigents qualify for the free basic services. The subsidy provided by the municipality will be limited to property rates, electricity and refuse .In terms of the municipality‟s indigent policy registered households are entitled to 100% subsidy up to 50 kWh per month electricity . For property rates , pensioners, physically and mentally disabled persons whose household income equal 2 state pensions, 4 state pensions and 6 state pensions will receive a rebate of 75%, 50% and 25 % respectively and Indigents, in terms of the indigent policy are exempt from paying rates if the value of the property is less than R320 000.00

45 | P a g e
Regarding the refuse all residential dwellings valued R100,000 or less receive the Indigent
Refuse, plus those who have applied and qualify for Indigent Support in terms of HCM‟s
Indigent Support Policy.
11. Overview of budget related-policies The Municipality‟s budgeting process is guided and governed by relevant legislation, frameworks, strategies and related policies.
11.1. Review of credit control and debt collection procedures/policies
The Collection Policy as approved by Council in May 2012 has been reviewed and adopted. While the adopted policy is credible, sustainable, manageable and informed by affordability and value for money there has been a need to review certain components to achieve a higher collection rate. The 2013/14MTREF has been prepared on the basis of achieving an average debtors‟ collection rate of 95 per cent on current billings. In addition the collection of debt in excess of 90 days has been prioritised as a pertinent strategy in increasing the municipality‟s cash levels. In addition, the potential of a payment incentive scheme is being investigated and if found to be viable will be incorporated into the policy.
10.2. Budget and Virement Policy
The Budget and Virement Policy aims to empower senior managers with an efficient financial and budgetary amendment and control system to ensure optimum service delivery within the legislative framework of the MFMA and the municipality‟s system of delegations. The Budget and Virement Policy was approved by Council in May 2012 and in there are no changes from the previous year. Also covered under budget policy process is the adjustment budget that is governed by various provisions in the MFMA and is aimed at instilling and establishing an increased level of discipline, responsibility and accountability in the financial management practices of municipalities. To ensure that the municipality continues to deliver on its core mandate and achieves its developmental goals, the mid-year review and adjustment budget process will be utilised to ensure that underperforming functions are identified and funds redirected to performing functions. There are no changes from last year‟s budget policy.
11.3. Tariff Policies
The Municipality‟s tariff policies provide a broad framework within which the Council can determine fair, transparent and affordable charges that also promote sustainable service delivery. The policies have been approved on various dates and a consolidated tariff policy is envisaged to be compiled for ease of administration and implementation of the next two years.
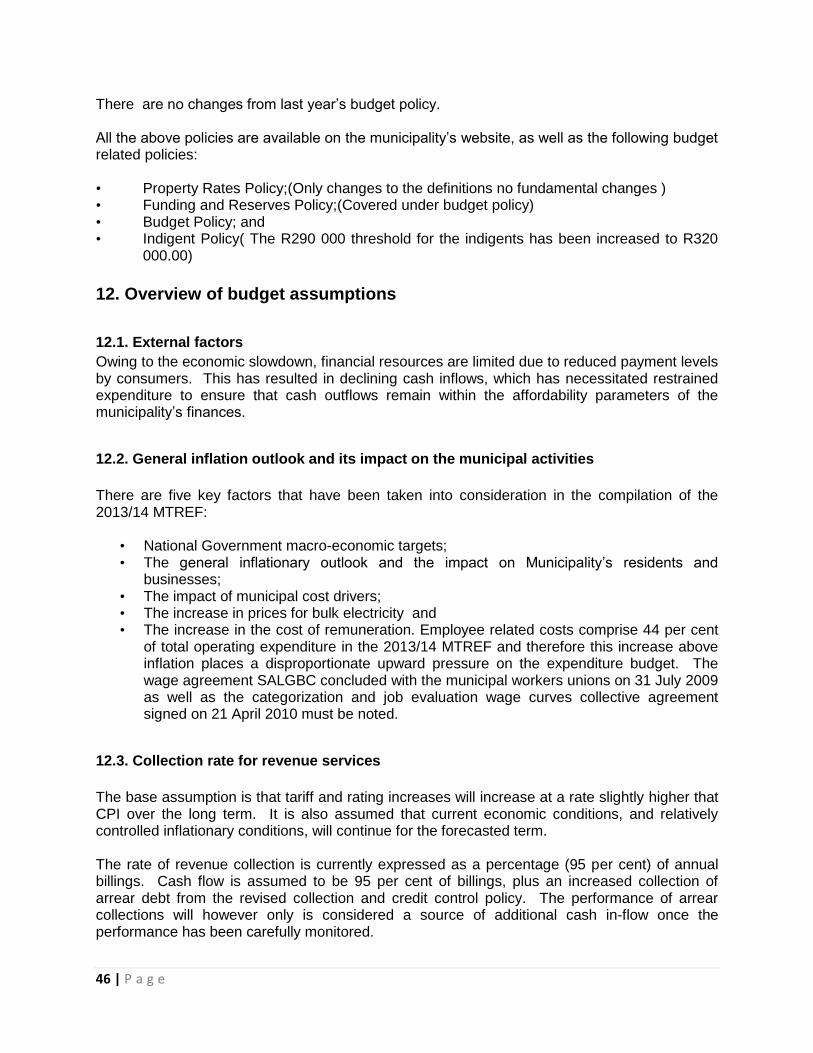
46 | P a g e
There are no changes from last year‟s budget policy. All the above policies are available on the municipality‟s website, as well as the following budget related policies: • Property Rates Policy;(Only changes to the definitions no fundamental changes ) • Funding and Reserves Policy;(Covered under budget policy) • Budget Policy; and • Indigent Policy( The R290 000 threshold for the indigents has been increased to R320
000.00)
12. Overview of budget assumptions
12.1. External factors
Owing to the economic slowdown, financial resources are limited due to reduced payment levels by consumers. This has resulted in declining cash inflows, which has necessitated restrained expenditure to ensure that cash outflows remain within the affordability parameters of the municipality‟s finances.
12.2. General inflation outlook and its impact on the municipal activities
There are five key factors that have been taken into consideration in the compilation of the 2013/14 MTREF:
• National Government macro-economic targets; • The general inflationary outlook and the impact on Municipality‟s residents and
businesses; • The impact of municipal cost drivers; • The increase in prices for bulk electricity and • The increase in the cost of remuneration. Employee related costs comprise 44 per cent
of total operating expenditure in the 2013/14 MTREF and therefore this increase above inflation places a disproportionate upward pressure on the expenditure budget. The wage agreement SALGBC concluded with the municipal workers unions on 31 July 2009 as well as the categorization and job evaluation wage curves collective agreement signed on 21 April 2010 must be noted.
12.3. Collection rate for revenue services
The base assumption is that tariff and rating increases will increase at a rate slightly higher that CPI over the long term. It is also assumed that current economic conditions, and relatively controlled inflationary conditions, will continue for the forecasted term. The rate of revenue collection is currently expressed as a percentage (95 per cent) of annual billings. Cash flow is assumed to be 95 per cent of billings, plus an increased collection of arrear debt from the revised collection and credit control policy. The performance of arrear collections will however only is considered a source of additional cash in-flow once the performance has been carefully monitored.

47 | P a g e
12.4. Growth or decline in tax base of the municipality
Debtor‟s revenue is assumed to increase at a rate that is influenced by the consumer debtor‟s collection rate, tariff/rate pricing, real growth rate of the municipality, household formation growth rate and the poor household change rate. Household formation is the key factor in measuring municipal revenue and expenditure growth, as servicing „households‟ is a greater municipal service factor than servicing individuals. Household formation rates are assumed to convert to household dwellings. In addition the change in the number of poor households influences the net revenue benefit derived from household formation growth, as it assumes that the same costs incurred for servicing the household exist, but that no consumer revenue is derived as the „poor household‟ limits consumption to the level of free basic services.
12.5. Impact of national, provincial and local policies
Integration of service delivery between national, provincial and local government is critical to ensure focussed service delivery and in this regard various measures were implemented to align IDPs, provincial and national strategies around priority spatial interventions. In this regard, the following national priorities form the basis of all integration initiatives: • Creating jobs; • Enhancing education and skill development; • Improving Health services; • Rural development and agriculture; and • Fighting crime and corruption. To achieve these priorities integration mechanisms are in place to ensure integrated planning and execution of various development programs. The focus will be to strengthen the link between policy priorities and expenditure thereby ensuring the achievement of the national, provincial and local objectives.

48 | P a g e
13. Overview of budget funding 13.1. Medium –term outlook: Operating revenue The following table is a breakdown of the operating revenue over the medium-term: Table 27 Breakdown of the operating revenue over the medium-term
The following graph is a breakdown of the operational revenue per main category for the 2013/14 financial year:
Description
R thousand
Budget
Year
2013/14
%
Budget
Year+1
2014/15
%
Budget
Year+2
2015/16
%
Property rates 289,374 49% 306,736 49% 325,140 49%
Service charges 142,952 24% 151,529 24% 160,621 24%
Investment revenue 5,525 1% 5,857 1% 6,208 1%
Transfers recognised - operational 111,286 19% 117,963 19% 125,041 19%
Other own revenue 43,867 7% 46,499 7% 49,289 7%
Total Revenue (Excl Capital
transfers
593,003 100% 628,584 100% 666,299 100%
2013/14 Medium Term Revenue & Expenditure
Property rates 49%
Service charges 24%
Investment revenue
1% Transfers recognised - operational
19%
Other own revenue 7%

49 | P a g e
Figure 6 Breakdown of operating revenue over the 2013/14 MTREF
Tariff setting plays a major role in ensuring desired levels of revenue. Getting tariffs right assists in the compilation of a credible and funded budget. The Municipality derives most of its operational revenue from the provision of goods and services such as, electricity and solid waste removal. Property rates, operating and capital grants from organs of state and other minor charges (such as building plan fees, licenses and permits etc). The revenue strategy is a function of key components such as: • Growth in the Municipality and economic development;
• Revenue management and enhancement;
• Achievement of a 95 per cent annual collection rate for consumer revenue;
• National Treasury guidelines; • Electricity tariff increases within the National Electricity Regulator of South Africa
(NERSA) approval;
• Achievement of full cost recovery of specific user charges;
• Determining tariff escalation rate by establishing/calculating revenue requirements;
• The Property Rates Policy in terms of the Municipal Property Rates Act, 2004 (Act 6 of
2004) (MPRA), and
• And the ability to extend new services and obtain cost recovery levels.
The above principles guide the annual increase in the tariffs charged to the consumers and the ratepayers aligned to the economic forecasts. The proposed tariff increases for the 2013/14 MTREF on the different revenue categories are:
Table 28 Proposed tariff increase over the medium-term
Revenue category 2013/14 proposed
tariff increase
2014/15 proposed
tariff increase
2015/16 proposed
tariff increase
% % %
Property rates 6 6.5 7
Solid Waste 7 7 7
Electricity 7 7 7
Revenue to be generated from property rates for the 2013/14 financial year will increase by 6 per cent ,6.5 per cent in 2014/15 and 7 per cent in 2015/16 . With the implementation of the Municipal Property Rates Act the basis of rating significantly changed. The Municipality implemented a new valuation roll in 2012/13 and is still in a process of further data verification and validation relating to the valuation roll. In addition there are still outstanding objections, although significant progress was made in dealing with these objections in the current financial year. Services charges relating to electricity and refuse removal constitutes the biggest component of the revenue basket of the municipality and has been increased by 7 per cent.

50 | P a g e
Operational grants and subsidies amount to R11 million, R117 million and R125 million for each of the respective financial years of the MTREF.
13.2.Medium –term outlook: Capital revenue
The following is a breakdown of the funding composition of the 2013/14 medium-term capital
programme:
Table 29 Sources of capital revenue over MTREF
The above table is graphically represented as follows for the 2013/14 financial year.
Figure 7 Sources of Capital revenue for the 2013/14 financial year
Description
R thousand
Budget
Year
2013/14
%
Budget
Year +1
2014/15
%
Budget
Year +2
2015/16
%
Funded by:
National Government 42,997 30.82 45,576 31.03 48,311 31.03
Provincial Government 51,363 36.81 54,444 37.07 57,711 37.07
Internally generated funds 45,162 32.37 46,865 31.91 49,677 31.91
Total Capital Funding 139,521 100.00 146,886 100.00 155,699 100.00
2013/14 Medium Term Revenue & Expenditure
Framework
National Government
31%
Provincial Government
37%
Internally generated funds 32%
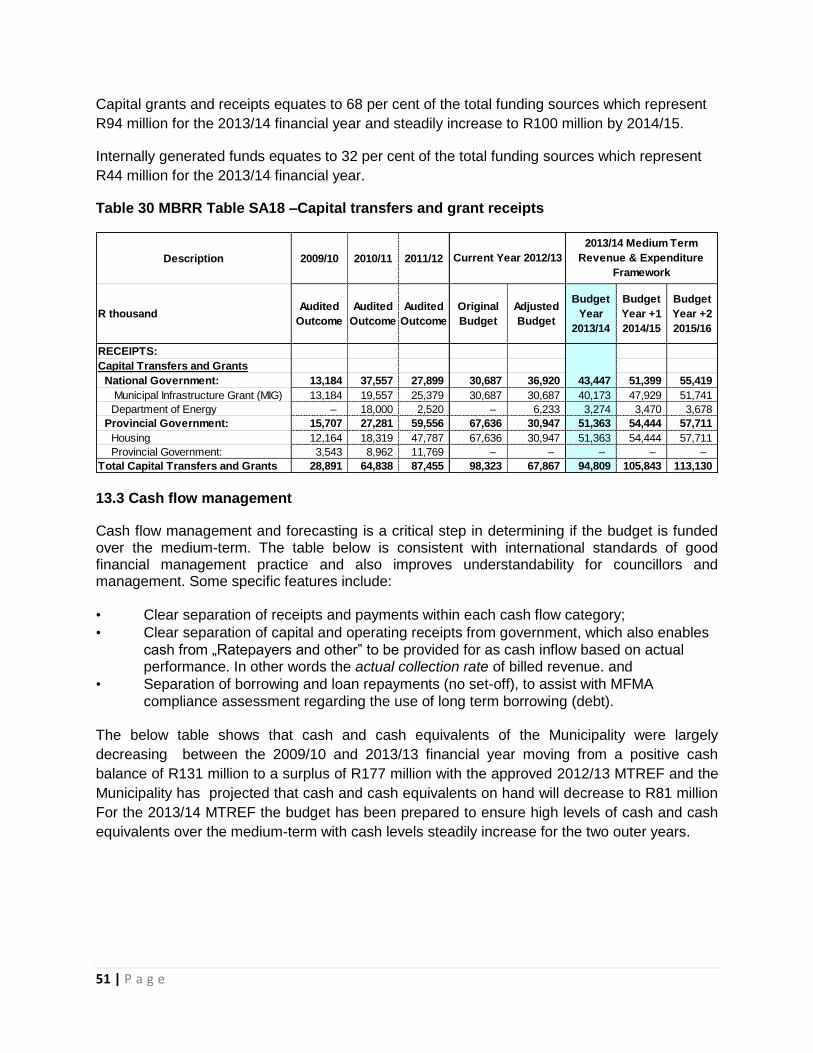
51 | P a g e
Capital grants and receipts equates to 68 per cent of the total funding sources which represent
R94 million for the 2013/14 financial year and steadily increase to R100 million by 2014/15.
Internally generated funds equates to 32 per cent of the total funding sources which represent
R44 million for the 2013/14 financial year.
Table 30 MBRR Table SA18 –Capital transfers and grant receipts
13.3 Cash flow management
Cash flow management and forecasting is a critical step in determining if the budget is funded over the medium-term. The table below is consistent with international standards of good financial management practice and also improves understandability for councillors and management. Some specific features include: • Clear separation of receipts and payments within each cash flow category;
• Clear separation of capital and operating receipts from government, which also enables
cash from „Ratepayers and other‟ to be provided for as cash inflow based on actual performance. In other words the actual collection rate of billed revenue. and
• Separation of borrowing and loan repayments (no set-off), to assist with MFMA
compliance assessment regarding the use of long term borrowing (debt). The below table shows that cash and cash equivalents of the Municipality were largely
decreasing between the 2009/10 and 2013/13 financial year moving from a positive cash
balance of R131 million to a surplus of R177 million with the approved 2012/13 MTREF and the
Municipality has projected that cash and cash equivalents on hand will decrease to R81 million
For the 2013/14 MTREF the budget has been prepared to ensure high levels of cash and cash
equivalents over the medium-term with cash levels steadily increase for the two outer years.
Description 2009/10 2010/11 2011/12
R thousandAudited
Outcome
Audited
Outcome
Audited
Outcome
Original
Budget
Adjusted
Budget
Budget
Year
2013/14
Budget
Year +1
2014/15
Budget
Year +2
2015/16
RECEIPTS:
Capital Transfers and Grants
National Government: 13,184 37,557 27,899 30,687 36,920 43,447 51,399 55,419
Municipal Infrastructure Grant (MIG) 13,184 19,557 25,379 30,687 30,687 40,173 47,929 51,741
Department of Energy – 18,000 2,520 – 6,233 3,274 3,470 3,678
Provincial Government: 15,707 27,281 59,556 67,636 30,947 51,363 54,444 57,711
Housing 12,164 18,319 47,787 67,636 30,947 51,363 54,444 57,711
Provincial Government: 3,543 8,962 11,769 – – – – –
Total Capital Transfers and Grants 28,891 64,838 87,455 98,323 67,867 94,809 105,843 113,130
Current Year 2012/13
2013/14 Medium Term
Revenue & Expenditure
Framework

52 | P a g e
Table 31 MBRR Table A7-Budget cash flow statement
13.4 Cash Backed Reserves/Accumulated Surplus Reconciliation
This following table meets the requirements of MFMA Circular 42 which deals with the funding
of a municipal budget in accordance with sections 18 and 19 of the MFMA. The table seeks to
answer three key questions regarding the use and availability of cash:
• What are the predicted cash and investments that are available at the end of the budget year?
• How are those funds used? • What is the net funds available or funding shortfall? A surplus would indicate the cash-backed accumulated surplus that was/is available. A shortfall (applications > cash and investments) is indicative of non-compliance with section 18 of the MFMA requirement that the municipality‟s budget must be „funded‟. Non-compliance with section 18 is assumed because a shortfall would indirectly indicate that the annual budget is not appropriately funded (budgeted spending is greater than funds available or to be collected). It is also important to analyse trends to understand the consequences, e.g. the budget year might indicate a small surplus situation, which in itself is an appropriate outcome, but if in prior years
Description 2009/10 2010/11 2011/12
R thousandAudited
Outcome
Audited
Outcome
Audited
Outcome
Original
Budget
Adjusted
Budget
Full Year
Forecast
Budget
Year
2013/14
Budget
Year +1
2014/15
Budget
Year +2
2015/16
CASH FLOW FROM OPERATING ACTIVITIES
Receipts
Ratepayers and other 325,945 354,809 376,814 448,001 448,835 448,835 449,267 471,883 500,196
Government - operating 57,428 72,618 120,059 95,398 100,734 100,734 170,149 180,357 191,179
Government - capital 98,276 77,473 36,076 98,423 68,004 68,004 40,173 47,929 51,750
Interest 20,842 16,701 14,876 17,045 13,808 13,808 14,682 15,563 16,497
Dividends – – – – – – – – –
Payments
Suppliers and employees (395,098) (489,591) (498,322) (548,942) (545,139) (545,139) (554,370) (542,277) (576,194)
Finance charges (1,835) (3,714) (9,133) (2,365) (8,966) (8,966) (6,998) (7,418) (7,863)
Transfers and Grants (17,598) (6,967) (5,785) (5,716) (5,716) (5,716) (4,036) (4,278) (4,535)
NET CASH FROM/(USED) OPERATING ACTIVITIES 87,961 21,328 34,584 101,844 71,561 71,561 108,867 161,759 171,030
CASH FLOWS FROM INVESTING ACTIVITIES
Receipts
Proceeds on disposal of PPE – – 2,073 – – – – – –
Decrease (Increase) in non-current debtors 18,803 686 1,184 1,184 1,184 1,184 1,500 1,590 1,685
Decrease (increase) other non-current receivables – – – 1,993 1,993 1,993 1,200 1,272 1,348
Decrease (increase) in non-current investments 160,476 (5,000) 65,000 – – – – – –
Payments
Capital assets (112,446) (54,600) (64,525) (131,569) (107,681) (107,681) (132,545) (139,541) (147,913)
NET CASH FROM/(USED) INVESTING ACTIVITIES 66,832 (58,913) 3,733 (128,392) (104,504) (104,504) (129,845) (136,679) (144,880)
CASH FLOWS FROM FINANCING ACTIVITIES
Receipts
Borrowing long term/refinancing – 55,000 – – – – – – –
Increase (decrease) in consumer deposits (30,859) 1,109 2,724 1,400 1,400 1,400 846 892 941
Payments
Repayment of borrowing (7,098) (7,307) (6,546) (5,978) (5,978) (5,978) (6,878) (6,878) (5,710)
NET CASH FROM/(USED) FINANCING ACTIVITIES (37,957) 48,803 (3,822) (4,578) (4,578) (4,578) (6,032) (5,986) (4,769)
NET INCREASE/ (DECREASE) IN CASH HELD 116,836 11,217 34,495 (31,126) (37,521) (37,521) (27,010) 19,094 21,381
Cash/cash equivalents at the year begin: 14,658 131,494 142,711 177,206 146,080 146,080 108,559 81,549 100,643
Cash/cash equivalents at the year end: 131,494 142,711 177,206 146,080 108,559 108,559 81,549 100,643 158,465
2013/14 Medium Term Current Year 2012/13

53 | P a g e
there were much larger surpluses then this negative trend may be a concern that requires closer examination. Table 32 MBRR Table A8 - Cash backed reserves/accumulated surplus reconciliation
From the above table it can be seen that the cash and investments available total R119 million
in the 203/14 financial year and progressively increase to R128 million by 2015/16, including the
projected cash and cash equivalents as determined in the cash flow forecast. The following is a
breakdown of the application of this funding:
• Conditional transfers (grants) are automatically assumed to be an obligation as the
municipality has received government transfers in advance of meeting the conditions.
Ordinarily, unless there are special circumstances, the municipality is obligated to return
unspent conditional grant funds to the national revenue fund at the end of the financial
year. In the past these have been allowed to „roll-over‟ and be spent in the ordinary
course of business, but this practice has been discontinued.
For the 2013/14 financial year no provision has been made for this liability as the
municipality plans to spend all its conditional grants .
• There is no unspent borrowing from the previous financial years. In terms of the
municipality‟s Borrowing and Investments Policy, borrowings are only drawn down once
the expenditure has been incurred against the particular project. Unspent borrowing is
ring-fenced and reconciled on a monthly basis to ensure no unnecessary liabilities are
incurred.
• Provisions for statutory requirements include VAT owing to timing differences resulting
from year- end obligations. The liability has been estimated at R23 million for the
2013/14 financial year.
• The main purpose of other working capital is to ensure that sufficient funds are available
to meet obligations as they fall due. A key challenge is often the mismatch between the
Description 2009/10 2010/11 2011/12
R thousandAudited
Outcome
Audited
Outcome
Audited
Outcome
Original
Budget
Adjusted
Budget
Full Year
Forecast
Budget
Year
2013/14
Budget
Year +1
2014/15
Budget
Year +2
2015/16
Cash and investments available
Cash/cash equivalents at the year end 131,494 142,711 177,206 146,080 108,559 108,559 81,549 100,643 158,465
Other current investments > 90 days 60,000 65,001 – 109,391 46,024 46,024 37,748 27,470 15,391
Non current assets - Investments – – – – – – – – –
Cash and investments available: 191,494 207,712 177,206 255,471 154,583 154,583 119,297 128,113 173,855
Application of cash and investments
Unspent conditional transfers 83,634 46,548 37,755 – – – – – –
Unspent borrowing – – – – – – – – –
Statutory requirements 17,543 19,543 21,543 22,500 22,500 22,500 23,000 24,300 25,842
Other working capital requirements (21,905) (27,744) (13,744) 50,682 51,417 51,417 (23,417) (23,640) (24,939)
Other provisions 57,842 76,425 82,666 42,000 42,000 42,000 27,554 27,554 27,554
Long term investments committed – – – – – – – – –
Reserves to be backed by cash/investments – – – – – – – – –
Total Application of cash and investments: 137,114 114,773 128,220 115,182 115,917 115,917 27,137 28,215 28,457
Surplus(shortfall) 54,380 92,939 48,986 140,289 38,666 38,666 92,160 99,898 145,398
2013/14 Medium Term Current Year 2012/13

54 | P a g e
timing of receipts of funds from debtors and payments due to employees and creditors.
High levels of debtor non-payment and receipt delays will have a greater requirement for
working capital.
• Against other provisions an amount R27 million has been provided for the 2013/14
financial year and remain constant in 2014/15. This liability is informed by, amongst
others, the supplementary pension liability.
It can be concluded that the Municipality has a surplus against the cash backed and
accumulated surpluses reconciliation.
13.5 Funding compliance measurement
National Treasury requires that the municipality assess its financial sustainability against
fourteen different measures that look at various aspects of the financial health of the
municipality. These measures are contained in the following table. All the information comes
directly from the annual budgeted statements of financial performance, financial position and
cash flows. The funding compliance measurement table essentially measures the degree to
which the proposed budget complies with the funding requirements of the MFMA. Each of the
measures is discussed below.
Table 33 MBRR SA10 – Funding compliance measurement
13.5.1 Cash/cash equivalent position The Municipality‟s forecast cash position was discussed as part of the budgeted cash flow
statement. A „positive‟ cash position, for each year of the MTREF would generally be a
minimum requirement, subject to the planned application of these funds such as cash-backing
of reserves and working capital requirements.
If the municipality‟s forecast cash position is negative, for any year of the medium term budget,
the budget is very unlikely to meet MFMA requirements or be sustainable and could indicate a
risk of non-compliance with section 45 of the MFMA which deals with the repayment of short
term debt at the end of the financial year. The forecasted cash and cash equivalents for the
2009/10 2010/11 2011/12
Audited
Outcome
Audited
Outcome
Audited
Outcome
Original
Budget
Adjusted
Budget
Full Year
Forecast
Budget
Year
2013/14
Budget
Year +1
2014/15
Budget
Year +2
2015/16
Funding measures
Cash/cash equivalents at the year end - R'000 18(1)b 131,494 142,711 177,206 146,080 108,559 108,559 81,549 100,643 158,465
Cash + investments at the yr end less applications - R'000 18(1)b 54,380 92,939 48,986 140,289 38,666 38,666 92,160 99,898 145,398
Cash year end/monthly employee/supplier payments 18(1)b 4.9 4.2 5.2 5.1 6.8 8.6 3.3 3.6 3.9
Surplus/(Deficit) excluding depreciation offsets: R'000 18(1) 63,355 (93,572) 23,899 0 1 1 0 (0) (0)
Service charge rev % change - macro CPIX target exclusive 18(1)a,(2) N.A. 1.1% 6.0% 15.8% (5.8%) (6.0%) (6.6%) 0.0% (0.0%)
Cash receipts % of Ratepayer & Other revenue 18(1)a,(2) 97.2% 102.2% 90.7% 93.8% 93.1% 93.1% 94.2% 93.4% 93.4%
Debt impairment expense as a % of total billable revenue 18(1)a,(2) 2.0% 1.5% 2.0% 0.1% 0.1% 0.1% 0.0% 0.0% 0.0%
Capital payments % of capital expenditure 18(1)c;19 103.5% 100.0% 86.1% 85.0% 85.0% 85.0% 92.4% 95.0% 95.0%
Borrowing receipts % of capital expenditure (excl. transfers) 18(1)c 0.0% 179.1% 0.0% 0.0% 0.0% 0.0% 0.0% 0.0% 0.0%
Grants % of Govt. legislated/gazetted allocations 18(1)a 100.0% 100.0% 100.0%
Current consumer debtors % change - incr(decr) 18(1)a N.A. 8.2% 1.9% (0.3%) 0.0% 0.0% 5.5% 5.5% 5.5%
Long term receivables % change - incr(decr) 18(1)a N.A. (9.7%) (5.8%) 6.2% 0.0% 0.0% 5.5% 5.5% 5.5%
Description
2013/14 Medium Term
Revenue & Expenditure MFMA
section
Current Year 2012/13

55 | P a g e
2013/14 MTREF shows R81 million , R100 million and R158 million for each respective financial
year.
13.5.2 Cash plus investments less application of funds
The purpose of this measure is to understand how the municipality has applied the available
cash and investments as identified in the budgeted cash flow statement. The detail
reconciliation of the cash backed reserves/surpluses is contained in Table 25. The reconciliation
is intended to be a relatively simple methodology for understanding the budgeted amount of
cash and investments available with any planned or required applications to be made. This has
been extensively discussed above.
13.5.3 Monthly average payments covered by cash or cash equivalents
The purpose of this measure is to understand the level of financial risk should the municipality
be under stress from a collection and cash in-flow perspective. Regardless of the annual cash
position an evaluation should be made of the ability of the Municipality to meet monthly
payments as and when they fall due. It is especially important to consider the position should
the municipality be faced with an unexpected disaster that threatens revenue collection such as
rate boycotts.
Notably, the ratio has been increasing significantly for the period 2010/11 to 2012/13, moving
from 5.1 to 6.8 with the adopted 2012/13 MTREF. As part of the 2013/14 MTREF the
municipalities improving cash position causes the ratio to move downwards to 3.3 and then
increases slightly to 3.6 and 3.9 for the outer years. As indicated above the Municipality aims
to achieve at least one month‟s cash coverage in the medium term, and then gradually move
towards two months coverage. This measure will have to be carefully monitored going forward.
13.5.4 Surplus/deficit excluding depreciation offsets
The main purpose of this measure is to understand if the revenue levels are sufficient to
conclude that the community is making a sufficient contribution for the municipal resources
consumed each year. An „adjusted‟ surplus/deficit is achieved by offsetting the amount of
depreciation related to externally funded assets. Municipalities need to assess the result of this
calculation taking into consideration its own circumstances and levels of backlogs. If the
outcome is a deficit, it may indicate that rates and service charges are insufficient to ensure that
It needs to be noted that a surplus does not necessarily mean that the budget is funded from a
cash flow perspective and the first two measures in the table are therefore critical
13.5.5 Cash receipts as a percentage of ratepayer and other revenue
This factor is a macro measure of the rate at which funds are „collected‟. This measure is
intended to analyse the underlying assumed collection rate for the MTREF to determine the
relevance and credibility of the budget assumptions contained in the budget. It can be seen that
the outcome is at 94.2, 93.4 and 93.4 per cent for each of the respective financial years. Given
that the assumed collection rate was based on a 95 per cent performance target, the cash flow
statement has been conservatively determined. In addition the risks associated with objections

56 | P a g e
to the valuation roll need to be clarified and hence the conservative approach, also taking into
consideration the cash flow challenges experienced in the current financial year. This measure
and performance objective will have to be meticulously managed. Should performance with the
mid-year review and adjustments be positive in relation to actual collections of billed revenue,
the adjustments budget will be amended accordingly.
13.5.6 Capital payments percentage of capital expenditure
The purpose of this measure is to determine whether the timing of payments has been taken
into consideration when forecasting the cash position. It can be seen that a 7.6 per cent timing
discount has been factored into the cash position forecasted over the entire financial year. The
municipality aims to keep this as low as possible through strict compliance with the legislative
requirement that debtors be paid within 30 days.
13.5.7 Transfers/grants revenue as a percentage of Government transfers/grants available
The purpose of this measurement is mainly to ensure that all available transfers from national
and provincial government have been budgeted for. A percentage less than 100 per cent could
indicate that not all grants as contained in the Division of Revenue Act (DoRA) have been
budgeted for. The Municipality has budgeted for all transfers.
13.6 Expenditure on grants and reconciliations of unspent funds
Table 34 MBRR SA19 - Expenditure on transfers and grant programmes
Description 2009/10 2010/11 2011/12
R thousandAudited
Outcome
Audited
Outcome
Audited
Outcome
Original
Budget
Adjusted
Budget
Budget
Year
2013/14
Budget
Year +1
2014/15
Budget
Year +2
2015/16
EXPENDITURE:
Operating expenditure of Transfers and Grants
National Government: 57,428 90,618 60,969 87,682 93,915 107,040 126,309 149,170
Local Government Equitable Share 56,245 70,295 56,805 85,382 85,382 92,600 103,875 126,653
Finance Management 827 1,529 1,470 1,500 1,500 1,550 1,700 1,750
Municipal Systems Improvement 356 794 174 800 800 890 934 967
Energy Efficiency and Demand Management – – – – – 5,000 9,800 9,800
Integrated National Electrification Programme – 18,000 2,520 – 6,233 7,000 10,000 10,000
Provincial Government: 12,287 44,674 41,615 75,482 43,533 59,059 62,602 65,519
Housing 11,531 40,762 41,284 67,636 30,687 51,363 54,444 57,711
Other Provincial Grants 756 3,912 331 7,846 12,846 7,696 8,158 7,808
Other grant providers: – – – – 1,000 1,000 1,000 1,000
Expanded Public works programme – – – – 1,000 1,000 1,000 1,000
Total operating expenditure of Transfers and Grants: 69,715 135,292 102,584 163,164 138,448 167,099 189,911 215,689
Capital expenditure of Transfers and Grants
National Government: 83,790 34,427 31,771 30,687 30,687 40,173 47,929 51,741
Municipal Infrastructure Grant (MIG) 83,790 34,427 31,771 30,687 30,687 40,173 47,929 51,741
Provincial Government: 2,270 837 5,810 4,000 9,000 – – –
Provincial Government: 2,270 837 5,810 4,000 9,000 – – –
Total capital expenditure of Transfers and Grants 86,060 35,264 37,581 34,687 39,687 40,173 47,929 51,741
TOTAL EXPENDITURE OF TRANSFERS AND GRANTS 155,775 170,556 140,165 197,851 178,135 207,272 237,840 267,430
Current Year 2012/13 2013/14 Medium Term

57 | P a g e
Table 35 MBRR SA 20 - Reconciliation between grant receipts and unspent funds
13.7 Councillor and employee benefits
Table 36 MBRR SA23 - Salaries, allowances and benefits (political office
bearers/councillors/ senior managers)
Description 2009/10 2010/11 2011/12
R thousandAudited
Outcome
Audited
Outcom
e
Audited
Outcome
Original
Budget
Adjusted
Budget
Full Year
Forecast
Budget
Year
2013/14
Budget
Year +1
2014/15
Budget
Year +2
2015/16
Operating transfers and grants:
National Government:
Balance unspent at beginning of the year 826 749 20 616 616 616 –
Current year receipts 56,995 53,719 59,144 87,682 87,682 87,682 107,040 113,462 120,270
Conditions met - transferred to revenue 57,072 54,448 58,548 87,682 87,682 87,682 107,040 113,462 120,270
Conditions still to be met - transferred to liabilities 749 20 616 616 616 616
Provincial Government:
Balance unspent at beginning of the year 42,600 43,309 39,629 26,754 – – – – –
Current year receipts 13,320 10,065 51,436 75,352 46,542 46,542 60,059 63,663 67,482
Conditions met - transferred to revenue 12,611 13,745 64,311 102,106 46,542 46,542 60,059 63,663 67,482
Conditions still to be met - transferred to liabilities 43,309 39,629 26,754
District Municipality:
Balance unspent at beginning of the year – 1,312 – – – – – – –
Current year receipts 3,543 152 – – – – – – –
Conditions met - transferred to revenue 2,231 39 – – – – – – –
Conditions still to be met - transferred to liabilities 1,312 1,424
Total operating transfers and grants revenue 71,915 68,232 122,859 189,788 134,224 134,224 167,099 177,125 187,752
Total operating transfers and grants - CTBM 45,370 41,073 27,370 616 616 616 – – –
Capital transfers and grants:
National Government:
Balance unspent at beginning of the year 91,868 26,078 39,763 6,233 – – – – –
Current year receipts 13,184 37,557 6,617 30,787 37,017 37,017 40,173 42,583 45,138
Conditions met - transferred to revenue 78,974 23,872 40,147 37,020 37,017 37,017 40,173 42,583 45,138
Conditions still to be met - transferred to liabilities 26,078 39,763 6,233
Provincial Government:
Balance unspent at beginning of the year – – 1,000 – – – – – –
Current year receipts – 1,000 7,457 – – – – – –
Conditions met - transferred to revenue – – 4,305 – – – – – –
Conditions still to be met - transferred to liabilities 1,000 4,152 –
Total capital transfers and grants revenue 78,974 23,872 44,452 37,020 37,017 37,017 40,173 42,583 45,138
Total capital transfers and grants - CTBM 26,078 40,763 10,385 – – – – – –
TOTAL TRANSFERS AND GRANTS REVENUE 150,888 92,104 167,311 226,808 171,241 171,241 207,272 219,708 232,891
TOTAL TRANSFERS AND GRANTS - CTBM 71,448 81,836 37,755 616 616 616 – – –
Current Year 2012/13 2013/14 Medium Term

58 | P a g e
Table 37 MBRR SA22 - Summary of councillor and staff benefits
Disclosure of Salaries, Allowances & Benefits Contribu
tions
Total
Package
Rand per annum 0 0
Councillors
Speaker 572,424 11,048 19,872 603,344
Chief Whip 536,648 10,357 19,872 566,877
Mayor 715,531 13,810 19,872 749,213
Deputy Executive Mayor 572,424 11,048 19,872 603,344
Executive Committee 4,293,186 82,858 158,976 4,535,020
Total for all other councillors 9,889,409 190,575 570,216 10,650,200
Total Councillors 16,579,624 319,696 808,680 17,708,000
Senior Managers of the Municipality
Municipal Manager 1,089,850 23,930 12,000 1,125,780
Chief Finance Officer 894,902 70,198 4,800 969,900
Head of Department -Human Settlements 794,371 17,945 4,800 817,116
Head of Department -Corporate Services 894,902 19,130 4,800 918,832
Head of Department -Strategic Planning and Governance 894,902 19,981 4,800 919,683
Head of Department -Community Services 894,902 19,981 4,800 919,683
Head of Department -Planning and Development 894,902 19,983 4,800 919,685
Total Senior Managers of the Municipality 6,358,729 191,148 40,800 6,590,677
TOTAL COST OF COUNCILLOR, DIRECTOR and
EXECUTIVE REMUNERATION22,938,352 510,844 849,480 24,298,677
AllowancesSalary
Summary of Employee and Councillor
remuneration2009/10 2010/11 2011/12
R thousandAudited
Outcome
Audited
Outcome
Audited
Outcome
Original
Budget
Adjusted
Budget
Full Year
Forecast
Budget
Year
2013/14
Budget
Year +1
2014/15
Budget
Year +2
2015/16
Councillors (Political Office Bearers plus Other)
Basic Salaries and Wages 13,242 13,882 14,708 17,233 17,233 17,233 16,565 17,724 18,965
Cellphone Allowance 690 731 765 990 990 990 809 865 926
Other benefits and allowances 335 182 6,872.68
Sub Total - Councillors 13,932 14,613 15,473 18,223 18,223 18,223 17,708 18,771 19,897
Senior Managers of the Municipality
Basic Salaries and Wages 6,068 6,563 5,985 5,724 5,724 5,724 6,592 6,987 7,406
Sub Total - Senior Managers of Municipality 6,068 6,563 5,985 5,724 5,724 5,724 6,592 6,987 7,406
Other Municipal Staff
Basic Salaries and Wages 122,898 122,894 141,453 164,447 165,539 165,539 175,045 184,709 194,894
Pension and UIF Contributions 21,538 22,748 24,124 29,988 29,988 29,988 33,234 35,561 38,050
Medical Aid Contributions 5,720 6,807 8,001 9,850 9,850 9,850 12,458 13,330 14,263
Overtime 6,786 6,543 13,456 6,701 9,609 9,609 10,095 10,802 11,558
Performance Bonus 8,796 633 11,043 12,373 6,649 6,649 13,210 14,134 15,124
Motor Vehicle Allowance 5,394 9,887 6,920 7,519 7,519 7,519 7,770 8,314 8,896
Cellphone Allowance 470 10,967 – – – – 495 530 567
Housing Allowances 787 855 870 843 843 843 1,220 1,306 1,397
Other benefits and allowances 5,374 30,982 29,247 5,207 5,207 5,207 5,402 5,781 6,185
Post-retirement benefit obligations 9,380 5,708 5,034 – – – – – –
Sub Total - Other Municipal Staff 187,143 218,022 240,148 236,928 235,204 235,204 258,930 274,466 290,934
Total Parent Municipality 207,143 239,199 261,606 260,875 259,151 259,151 283,230 300,225 318,238
Current Year 2012/132013/14 Medium Term
Revenue & Expenditure

59 | P a g e
13.8 Monthly targets for revenue, expenditure and cash flow
Table 38 MBRR SA25 - Budgeted monthly revenue and expenditure
Table 39 MBRR SA26 - Budgeted monthly revenue and expenditure (municipal vote)
Description
R thousand July August Sept. OctoberNovemb
er
Decemb
erJanuary
Februar
yMarch April May June
Budget
Year
2013/14
Budget
Year +1
2014/15
Budget
Year +2
2015/16
Revenue By Source
Property rates 21,637 19,535 25,647 24,551 22,647 19,647 19,885 25,637 27,647 24,501 27,545 30,497 289,374 306,736 325,140
Service charges - electricity revenue 7,782 7,782 7,782 7,782 7,782 7,782 7,782 7,782 7,782 7,782 7,782 7,781 93,383 98,986 104,925
Service charges - refuse revenue 3,565 3,305 3,900 4,016 3,980 3,677 4,287 4,101 3,701 4,201 4,310 6,286 49,331 52,291 55,428
Rental of facilities and equipment 201 199 180 202 202 356 143 146 181 210 151 243 2,414 2,559 2,712
Interest earned - external investments 460 471 445 381 434 450 432 445 455 461 551 539 5,525 5,856 6,207
Interest earned - outstanding debtors 820 820 820 820 820 820 820 820 820 820 820 466 9,488 10,057 10,660
Fines 801 802 800 821 823 837 751 825 822 831 835 956 9,904 10,498 11,128
Licences and permits 500 512 503 565 454 501 523 523 535 541 545 734 6,435 6,821 7,230
Agency services 330 330 330 330 330 330 330 330 330 330 330 330 3,960 4,198 4,449
Transfers recognised - operational 32,417 2,448 2,100 1,901 30,867 1,547 1,301 1,501 30,867 2,400 1,410 2,028 110,786 117,433 124,479
Other revenue 963 963 963 963 963 963 963 963 963 963 963 1,817 12,406 13,150 13,939
Gains on disposal of PPE – – – –
Total Revenue (excluding capital transfers and contributions)69,475 37,168 43,469 42,331 69,301 36,909 37,218 43,072 74,102 43,039 45,243 51,676 593,003 628,583 666,298
Expenditure By Type
Employee related costs 17,434 18,946 21,647 23,988 19,435 22,501 19,746 24,544 22,122 23,544 24,646 26,969 265,522 281,449 298,336
Remuneration of councillors 1,475 1,475 1,475 1,475 1,475 1,475 1,475 1,475 1,475 1,475 1,475 1,483 17,708 18,771 19,897
Depreciation & asset impairment 4,036 4,036 4,036 4,036 4,036 4,036 4,036 4,036 4,036 4,036 4,036 4,044 48,440 51,346 54,427
Finance charges 3 3 3 2,021 3 1,400 3 3 3 2,153 3 1,400 6,998 7,418 7,863
Bulk purchases 4,653 4,986 4,501 5,301 4,986 4,510 5,342 4,977 4,900 5,501 6,101 8,738 64,496 68,366 72,468
Other materials 3,187 3,187 3,187 3,187 3,187 3,187 3,187 3,187 3,187 3,187 3,187 3,187 38,244 40,538 42,970
Contracted services 2,197 2,197 2,197 2,197 2,197 2,197 2,197 2,197 2,197 2,197 2,197 2,198 26,365 27,947 29,624
Transfers and grants – – – – – – 1,345 1,345 – – – 1,346 4,036 5,776 6,035
Other expenditure 6,753 6,601 5,444 7,934 7,966 6,576 7,410 12,645 13,523 14,534 15,634 16,172 121,194 126,973 134,679
Total Expenditure 39,739 41,430 42,490 50,139 43,285 45,881 44,742 54,409 51,443 56,627 57,279 65,537 593,003 628,583 666,298
Surplus/(Deficit) 29,736 (4,263) 979 (7,808) 26,016 (8,972) (7,524) (11,337) 22,659 (13,588) (12,036) (13,861) 0 (0) (0)
Budget Year 2013/14Medium Term Revenue and
Expenditure Framework
Description
R thousand July August Sept. OctoberNovemb
er
Decemb
erJanuary
Februar
yMarch April May June
Budget
Year
2013/14
Budget
Year +1
2014/15
Budget
Year +2
2015/16
Revenue by Vote
Treasury 22,544 23,543 26,544 22,747 26,544 22,544 24,535 25,647 25,434 28,645 27,646 31,838 308,212 326,355 345,936
Corporate Services 182 182 182 182 182 182 182 182 182 182 182 182 2,182 2,313 2,452
Strategic Planning and Governance 30,866 – – – 30,866 0 0 0 31,758 – – (0) 93,490 99,099 105,045
Human Settlements and Infrastructure8,380 7,955 8,001 8,501 8,653 8,324 8,301 8,401 8,501 8,301 8,801 8,512 100,630 106,667 113,067
Planning and Economic Development 651 667 670 551 701 781 791 801 721 751 777 756 8,617 9,222 9,776
Community Services 6,660 6,660 6,660 6,660 6,660 6,660 6,660 6,660 6,660 6,660 6,660 6,612 79,872 84,927 90,022
Total Revenue by Vote 69,283 39,007 42,057 38,640 73,605 38,491 40,469 41,690 73,256 44,539 44,065 47,900 593,003 628,583 666,298
Expenditure by Vote to be appropriated
Treasury 3,954 4,476 4,435 5,465 4,001 4,300 3,977 4,101 2,985 3,301 3,401 3,064 47,459 50,306 53,325
Corporate Services 2,001 1,991 2,001 1,790 1,801 1,901 2,101 2,110 2,101 2,201 2,001 2,016 24,013 25,453 26,981
Strategic Planning and Governance 9,371 10,756 9,901 9,565 8,898 9,455 9,301 9,401 8,901 7,965 7,646 11,294 112,452 119,199 126,351
Human Settlements and Infrastructure11,591 10,746 9,646 10,868 11,501 9,909 10,857 10,988 9,986 11,501 15,657 15,834 139,083 147,427 156,273
Planning and Economic Development 2,346 2,265 1,905 2,060 2,101 2,207 2,501 2,009 2,310 2,465 2,655 3,335 28,157 29,846 31,637
Community Services 17,546 16,746 15,647 16,455 17,546 17,646 16,456 19,747 24,656 25,434 26,545 27,416 241,839 256,352 271,731
Total Expenditure by Vote 46,808 46,980 43,534 46,202 45,847 45,416 45,192 48,355 50,938 52,866 57,904 62,960 593,003 628,583 666,298
Surplus/(Deficit) 22,474 (7,973) (1,477) (7,562) 27,759 (6,925) (4,723) (6,664) 22,317 (8,328) (13,839) (15,060) 0 – –
Budget Year 2013/14Medium Term Revenue and
Expenditure Framework
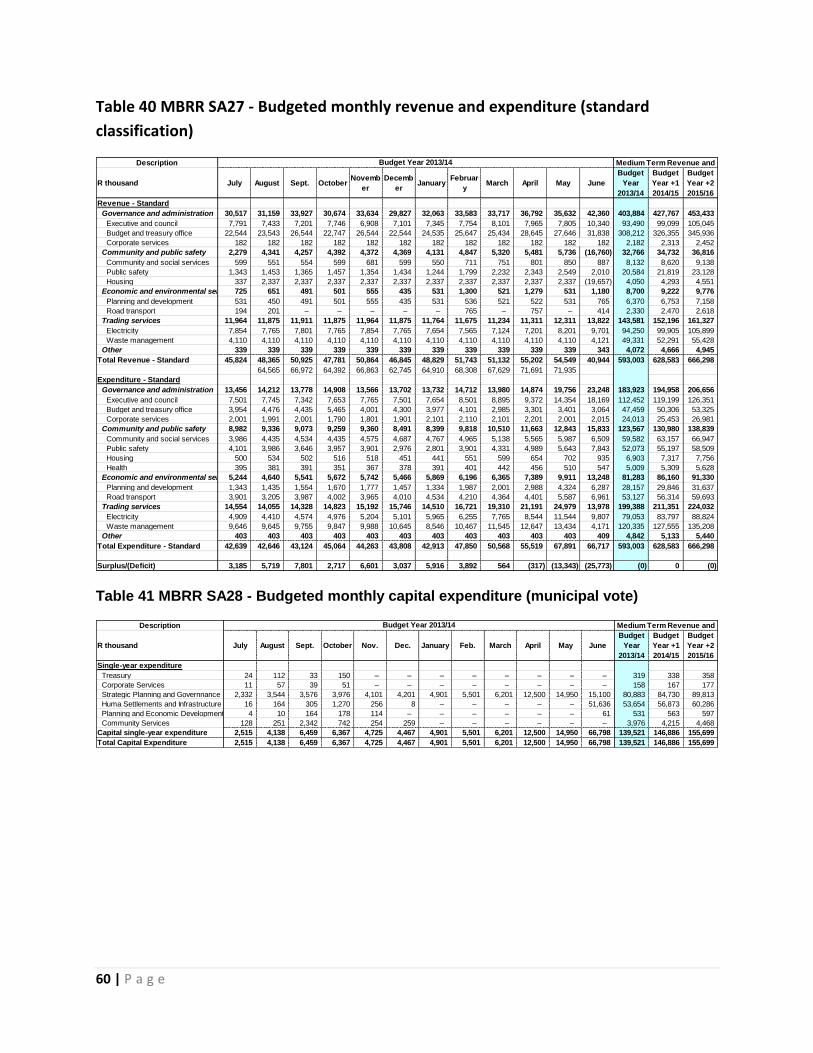
60 | P a g e
Table 40 MBRR SA27 - Budgeted monthly revenue and expenditure (standard
classification)
Table 41 MBRR SA28 - Budgeted monthly capital expenditure (municipal vote)
Description
R thousand July August Sept. OctoberNovemb
er
Decemb
erJanuary
Februar
yMarch April May June
Budget
Year
2013/14
Budget
Year +1
2014/15
Budget
Year +2
2015/16
Revenue - Standard
Governance and administration 30,517 31,159 33,927 30,674 33,634 29,827 32,063 33,583 33,717 36,792 35,632 42,360 403,884 427,767 453,433
Executive and council 7,791 7,433 7,201 7,746 6,908 7,101 7,345 7,754 8,101 7,965 7,805 10,340 93,490 99,099 105,045
Budget and treasury office 22,544 23,543 26,544 22,747 26,544 22,544 24,535 25,647 25,434 28,645 27,646 31,838 308,212 326,355 345,936
Corporate services 182 182 182 182 182 182 182 182 182 182 182 182 2,182 2,313 2,452
Community and public safety 2,279 4,341 4,257 4,392 4,372 4,369 4,131 4,847 5,320 5,481 5,736 (16,760) 32,766 34,732 36,816
Community and social services 599 551 554 599 681 599 550 711 751 801 850 887 8,132 8,620 9,138
Public safety 1,343 1,453 1,365 1,457 1,354 1,434 1,244 1,799 2,232 2,343 2,549 2,010 20,584 21,819 23,128
Housing 337 2,337 2,337 2,337 2,337 2,337 2,337 2,337 2,337 2,337 2,337 (19,657) 4,050 4,293 4,551
Economic and environmental services725 651 491 501 555 435 531 1,300 521 1,279 531 1,180 8,700 9,222 9,776
Planning and development 531 450 491 501 555 435 531 536 521 522 531 765 6,370 6,753 7,158
Road transport 194 201 – – – – – 765 – 757 – 414 2,330 2,470 2,618
Trading services 11,964 11,875 11,911 11,875 11,964 11,875 11,764 11,675 11,234 11,311 12,311 13,822 143,581 152,196 161,327
Electricity 7,854 7,765 7,801 7,765 7,854 7,765 7,654 7,565 7,124 7,201 8,201 9,701 94,250 99,905 105,899
Waste management 4,110 4,110 4,110 4,110 4,110 4,110 4,110 4,110 4,110 4,110 4,110 4,121 49,331 52,291 55,428
Other 339 339 339 339 339 339 339 339 339 339 339 343 4,072 4,666 4,945
Total Revenue - Standard 45,824 48,365 50,925 47,781 50,864 46,845 48,829 51,743 51,132 55,202 54,549 40,944 593,003 628,583 666,298
64,565 66,972 64,392 66,863 62,745 64,910 68,308 67,629 71,691 71,935
Expenditure - Standard
Governance and administration 13,456 14,212 13,778 14,908 13,566 13,702 13,732 14,712 13,980 14,874 19,756 23,248 183,923 194,958 206,656
Executive and council 7,501 7,745 7,342 7,653 7,765 7,501 7,654 8,501 8,895 9,372 14,354 18,169 112,452 119,199 126,351
Budget and treasury office 3,954 4,476 4,435 5,465 4,001 4,300 3,977 4,101 2,985 3,301 3,401 3,064 47,459 50,306 53,325
Corporate services 2,001 1,991 2,001 1,790 1,801 1,901 2,101 2,110 2,101 2,201 2,001 2,015 24,013 25,453 26,981
Community and public safety 8,982 9,336 9,073 9,259 9,360 8,491 8,399 9,818 10,510 11,663 12,843 15,833 123,567 130,980 138,839
Community and social services 3,986 4,435 4,534 4,435 4,575 4,687 4,767 4,965 5,138 5,565 5,987 6,509 59,582 63,157 66,947
Public safety 4,101 3,986 3,646 3,957 3,901 2,976 2,801 3,901 4,331 4,989 5,643 7,843 52,073 55,197 58,509
Housing 500 534 502 516 518 451 441 551 599 654 702 935 6,903 7,317 7,756
Health 395 381 391 351 367 378 391 401 442 456 510 547 5,009 5,309 5,628
Economic and environmental services5,244 4,640 5,541 5,672 5,742 5,466 5,869 6,196 6,365 7,389 9,911 13,248 81,283 86,160 91,330
Planning and development 1,343 1,435 1,554 1,670 1,777 1,457 1,334 1,987 2,001 2,988 4,324 6,287 28,157 29,846 31,637
Road transport 3,901 3,205 3,987 4,002 3,965 4,010 4,534 4,210 4,364 4,401 5,587 6,961 53,127 56,314 59,693
Trading services 14,554 14,055 14,328 14,823 15,192 15,746 14,510 16,721 19,310 21,191 24,979 13,978 199,388 211,351 224,032
Electricity 4,909 4,410 4,574 4,976 5,204 5,101 5,965 6,255 7,765 8,544 11,544 9,807 79,053 83,797 88,824
Waste management 9,646 9,645 9,755 9,847 9,988 10,645 8,546 10,467 11,545 12,647 13,434 4,171 120,335 127,555 135,208
Other 403 403 403 403 403 403 403 403 403 403 403 409 4,842 5,133 5,440
Total Expenditure - Standard 42,639 42,646 43,124 45,064 44,263 43,808 42,913 47,850 50,568 55,519 67,891 66,717 593,003 628,583 666,298
Surplus/(Deficit) 3,185 5,719 7,801 2,717 6,601 3,037 5,916 3,892 564 (317) (13,343) (25,773) (0) 0 (0)
Budget Year 2013/14 Medium Term Revenue and
Description
R thousand July August Sept. October Nov. Dec. January Feb. March April May June
Budget
Year
2013/14
Budget
Year +1
2014/15
Budget
Year +2
2015/16
Single-year expenditure
Treasury 24 112 33 150 – – – – – – – – 319 338 358
Corporate Services 11 57 39 51 – – – – – – – – 158 167 177
Strategic Planning and Governnance 2,332 3,544 3,576 3,976 4,101 4,201 4,901 5,501 6,201 12,500 14,950 15,100 80,883 84,730 89,813
Huma Settlements and Infrastructure 16 164 305 1,270 256 8 – – – – – 51,636 53,654 56,873 60,286
Planning and Economic Development 4 10 164 178 114 – – – – – – 61 531 563 597
Community Services 128 251 2,342 742 254 259 – – – – – – 3,976 4,215 4,468
Capital single-year expenditure 2,515 4,138 6,459 6,367 4,725 4,467 4,901 5,501 6,201 12,500 14,950 66,798 139,521 146,886 155,699
Total Capital Expenditure 2,515 4,138 6,459 6,367 4,725 4,467 4,901 5,501 6,201 12,500 14,950 66,798 139,521 146,886 155,699
Budget Year 2013/14 Medium Term Revenue and

61 | P a g e
Table 42 MBRR SA29 - Budgeted monthly capital expenditure (standard classification)
Table 43 MBRR SA30 - Budgeted monthly cash flow
Description
R thousand July August Sept. October Nov. Dec. January Feb. March April May June
Budget
Year
2013/14
Budget
Year +1
2014/15
Budget
Year +2
2015/16
Capital Expenditure - Standard
Governance and administration 1,351 2,139 4,854 3,310 3,103 1,812 1,913 2,458 3,036 3,615 4,049 9,382 41,023 42,478 45,026
Executive and council 1,331 2,108 4,782 3,261 3,057 1,785 1,885 2,422 2,991 3,561 3,989 9,257 40,429 41,848 44,359
Budget and treasury office 11 18 41 28 26 15 16 21 26 31 34 71 339 359 381
Corporate services 9 14 31 21 20 12 12 16 19 23 26 54 255 270 287
Community and public safety 2,285 3,618 8,210 5,599 5,248 3,064 3,236 4,157 5,136 6,114 6,848 14,260 67,777 71,843 76,154
Community and social services 291 460 1,044 712 668 390 412 529 653 778 871 1,814 8,620 9,138 9,686
Sport and recreation 223 353 801 547 512 299 316 406 501 597 668 1,392 6,616 7,013 7,434
Public safety 40 63 143 97 91 53 56 72 89 106 119 248 1,178 1,249 1,324
Housing 1,732 2,742 6,222 4,243 3,977 2,322 2,452 3,151 3,892 4,633 5,189 10,807 51,363 54,444 57,711
Economic and environmental services631 999 2,266 1,545 1,448 846 893 1,147 1,417 1,687 1,890 3,935 18,704 19,826 21,016
Planning and development 23 36 82 56 53 31 32 42 51 61 69 143 679 719 762
Road transport 608 962 2,184 1,489 1,396 815 861 1,106 1,366 1,626 1,821 3,793 18,026 19,107 20,254
Trading services 385 610 1,384 944 885 516 545 701 866 1,030 1,154 2,403 11,422 12,108 12,834
Electricity 267 423 960 654 613 358 378 486 600 715 800 1,667 7,922 8,398 8,902
Waste management 118 187 424 289 271 158 167 215 265 316 354 736 3,500 3,710 3,933
Other 20 32 72 49 46 27 28 36 45 54 60 125 595 631 669
Total Capital Expenditure -
Standard 4,672 7,398 16,786 11,447 10,731 6,265 6,616 8,500 10,500 12,500 14,000 30,106 139,521 146,886 155,699
Budget Year 2013/14 Medium Term Revenue and
MONTHLY CASH FLOWS
R thousand July August Sept. OctoberNovemb
er
Decemb
erJanuary February March April May June
Budget
Year
2013/14
Budget
Year +1
2014/15
Budget
Year +2
2015/16
Cash Receipts By Source 1
Property rates 24,115 24,115 24,115 24,115 24,115 24,115 24,115 24,115 24,115 24,115 24,115 24,110 289,374 306,736 325,141
Service charges - electricity 7,781 7,781 7,781 7,781 7,781 7,781 7,781 7,781 7,781 7,781 7,781 7,791 93,382 98,985 104,924
Service charges - refuse 4,110 4,110 4,110 4,110 4,110 4,110 4,110 4,110 4,110 4,110 4,110 4,121 49,331 52,291 55,428
Rental of facilities and equipment 201 201 201 201 201 201 201 201 201 201 201 201 2,414 2,559 2,712
Interest earned - external investments460 460 460 460 460 460 460 460 460 460 460 465 5,525 5,856 6,207
Interest earned - outstanding debtors 805 799 750 766 801 790 785 775 800 810 855 752 9,488 10,057 10,660
Fines 825 805 830 811 830 790 755 761 825 830 840 1,002 9,904 10,498 11,128
Licences and permits 511 536 525 501 512 521 535 499 501 519 599 676 6,435 6,821 7,230
Agency services 330 330 330 330 330 330 330 330 330 330 330 330 3,960 4,198 4,449
Transfer receipts - operational 32,416 890 10,100 – 30,866 – – – 36,514 – – – 110,786 117,433 124,479
Other revenue 1,034 1,034 1,034 1,034 1,034 1,034 1,034 1,034 1,034 1,034 1,034 1,034 12,406 13,150 13,939
Cash Receipts by Source 72,587 41,061 50,236 40,109 71,040 40,132 40,106 40,066 76,671 40,190 40,325 40,480 593,003 628,583 666,298
Other Cash Flows by Source
Transfer receipts - capital 26,951 8,560 – 9,154 28,951 – 2,869 – 22,551 – – 0 99,036 104,978 111,277
Increase (decrease) in consumer deposits– – – – – – – – – – – 846 846 897 951
Decrease (Increase) in non-current debtors– – – – – – – – – – 1,500 1,500 1,590 1,685
Decrease (increase) other non-current receivables 1,200 1,200 1,272 1,348
Total Cash Receipts by Source 99,538 49,621 50,236 49,263 99,991 40,132 42,975 40,066 99,222 40,190 40,325 44,026 695,585 737,320 781,559
Cash Payments by Type
Employee related costs 22,126 22,126 22,126 22,126 22,126 22,126 22,126 22,126 22,126 22,126 22,126 22,136 265,522 281,453 298,341
Remuneration of councillors 1,475 1,475 1,475 1,475 1,475 1,475 1,475 1,475 1,475 1,475 1,475 1,483 17,708 18,771 19,897
Finance charges 583 583 583 583 583 583 583 583 583 583 583 585 6,998 7,418 7,863
Bulk purchases - Electricity 5,374 5,374 5,374 5,374 5,374 5,374 5,374 5,374 5,374 5,374 5,374 5,382 64,496 68,366 72,468
Other materials 3,187 3,187 3,187 3,187 3,187 3,187 3,187 3,187 3,187 3,187 3,187 3,187 38,244 40,539 42,971
Contracted services 2,219 2,219 2,219 2,219 2,219 2,219 2,219 2,219 2,219 2,219 2,219 1,956 26,365 27,947 29,624
Transfers and grants - other 336 336 336 336 336 336 336 336 336 336 336 340 4,036 4,278 4,535
Other expenditure 10,099 10,099 10,099 10,099 10,099 10,099 10,099 10,099 10,099 10,099 10,099 10,105 121,194 128,466 136,174
Cash Payments by Type 45,399 45,399 45,399 45,399 45,399 45,399 45,399 45,399 45,399 45,399 45,399 45,174 544,563 577,237 611,871
Other Cash Flows/Payments by Type
Capital assets 2,453 3,301 3,901 4,501 5,101 11,095 12,095 15,950 14,645 22,858 25,677 26,172 147,748 156,613 166,010
Repayment of borrowing 573 573 573 573 573 573 573 573 573 573 573 575 6,878 7,291 7,728
Total Cash Payments by Type 48,425 49,273 49,873 50,473 51,073 57,067 58,067 61,922 60,617 68,830 71,649 71,921 699,189 741,141 785,609
NET INCREASE/(DECREASE)
IN CASH HELD51,113 348 363 (1,210) 48,918 (16,935) (15,092) (21,856) 38,605 (28,640) (31,324) (27,895) (3,604) (3,821) (4,050)
Cash/cash equivalents at the month/year begin:66,876 117,990 118,338 118,701 117,490 166,408 149,473 134,381 112,525 151,130 122,490 91,167 66,876 63,272 59,452
Cash/cash equivalents at the month/year end:117,990 118,338 118,701 117,490 166,408 149,473 134,381 112,525 151,130 122,490 91,167 63,272 63,272 59,452 55,402
Medium Term Revenue and
Expenditure FrameworkBudget Year 2013/14

62 | P a g e
Table 44 MBRR SA 34a - Capital expenditure on new assets by asset class
Description 2009/10 2010/11 2011/12
R thousandAudited
Outcome
Audited
Outcom
e
Audited
Outcom
e
Original
Budget
Adjusted
Budget
Full Year
Forecast
Budget
Year
2013/14
Budget
Year +1
2014/15
Budget
Year +2
2015/16
Capital expenditure on new assets by Asset Class/Sub-class
Infrastructure 84,938 43,390 46,780 34,655 46,197 46,197 53,982 52,676 63,084
Infrastructure - Road transport 81,820 34,515 39,526 27,795 27,795 27,795 45,912 45,076 56,384
Roads, Pavements & Bridges 81,820 34,515 39,526 27,795 27,795 27,795 45,912 45,076 56,384
Infrastructure - Electricity – 4,373 5,153 5,052 16,594 16,594 7,570 7,600 6,700
Transmission & Reticulation – 357 3,057 850 12,392 12,392 4,670 4,600 3,500
Street Lighting – 4,017 2,096 4,202 4,202 4,202 2,900 3,000 3,200
Infrastructure - Other 3,118 4,502 2,101 1,808 1,808 1,808 500 – –
Waste Management 3,118 2,356 1,060 1,024 1,024 1,024 500 – –
Other – 2,146 1,041 784 784 784 – –
Community 17,367 6,626 19,667 24,573 24,573 24,573 22,877 15,750 16,600
Parks & gardens – – 2,347 325 325 325 – 200 150
Sportsfields & stadia 397 1,003 805 4,027 4,027 4,027 8,733 6,000 6,200
Swimming pools – – – 170 170 170 – – –
Community halls 1,887 218 4,118 10,476 10,476 10,476 8,379 4,500 5,000
Libraries – – 9,541 – – – – – –
Recreational facilities 14,266 4,298 619 1,775 1,775 1,775 2,090 2,000 2,000
Security and policing – – – 600 600 600 – – –
Cemeteries – – – – – – 350 50 50
Other 817 1,107 2,235 7,200 7,200 7,200 3,324 3,000 3,200
Heritage assets 26 – 45 250 250 250 – 20 20
Buildings
Other 26 45 250 250 250 20 20
Investment properties – – – – – – – – –
Housing development
Other
Other assets 6,302 4,562 8,441 79,016 42,328 42,328 62,662 78,420 75,995
General vehicles 542 315 4,623 5,420 5,420 5,420 3,208 3,000 3,000
Specialised vehicles – 1,479 – – – – 3,000 6,000 3,400
Plant & equipment 1,934 1,279 1,199 2,311 2,311 2,311 1,300 1,500 1,500
Computers - hardware/equipment 339 462 2,538 451 451 451 538 550 550
Furniture and other office equipment 1,432 861 874 874 874 1,020 1,020 1,020
Abattoirs 403 – – – – – – – –
Markets – – 100 100 100 – – –
Civic Land and Buildings 161 65 56 1,216 1,216 1,216 1,864 1,200 1,350
Other Buildings – – – 68,633 31,945 31,945 51,363 65,000 65,000
Other Land 1,400 15 – – – – – – –
Other 91 86 25 12 12 12 370 150 175
Intangibles 113 – – – – – – – –
Computers - software & programming 113 – – – – – – – –
Total Capital Expenditure on new assets 108,746 54,579 74,931 138,494 113,348 113,348 139,521 146,866 155,699
Current Year 2012/13 2013/14 Medium Term

63 | P a g e
Table 45 MBRR SA34b - Capital expenditure on the renewal of existing assets by asset
class
14. Legislation and compliance status
Compliance with the MFMA implementation requirements have been substantially adhered to through the following activities: 1. In year reporting
Reporting to National Treasury in electronic format was fully complied with on a monthly basis. Section 71 reporting to the Executive Mayor (within 10 working days) has progressively improved and includes monthly published financial performance on the municipality‟s website.
2. Internship programme
The municipality is participating in the Municipal Financial Management Internship programme and has employed five interns undergoing training in various divisions of the Financial Services Department. There are two positions that have been advertised and will be filled at the start of the financial year 2013/2014 that will make a total of seven interns.
3. Budget and Treasury Office
The Budget and Treasury Office has been established in accordance with the MFMA. 4. Audit Committee
An Audit Committee has been established and is fully functional.
Description 2009/10 2010/11 2011/12
R thousand
Audited
Outcom
e
Audited
Outcom
e
Audited
Outcom
e
Original
Budget
Adjuste
d
Budget
Full
Year
Forecas
t
Budget
Year
2013/14
Budget
Year +1
2014/15
Budget
Year +2
2015/16
Depreciation by Asset Class/Sub-class
Infrastructure 24,232 27,178 29,740 29,196 28,203 28,203 29,049 30,791 32,638
Infrastructure - Road transport 24,232 27,178 29,740 29,196 28,203 28,203 29,049 30,791 32,638
Roads, Pavements & Bridges 24,232 27,178 29,740 29,196 28,203 28,203 29,049 30,791 32,638
Community 4,649 4,926 5,115 5,260 4,926 4,926 5,074 5,378 5,700
Other 4,649 4,926 5,115 5,260 4,926 4,926 5,074 5,378 5,700
Other assets 13,378 11,133 13,441 13,911 13,694 13,694 14,032 14,877 15,732
Specialised vehicles 1,092 239 605 605 605 605 605 605 605
Civic Land and Buildings 4,815 4,929 5,005 5,305 4,929 4,929 5,077 5,381 5,703
Other Buildings 838 – – – – – – – –
Other 6,632 5,964 7,831 8,001 8,160 8,160 8,350 8,891 9,424
Intangibles 289 251 282 285 285 285 285 300 357
Computers - software & programming
Other (list sub-class) 289 251 282 285 285 285 285 300 357
Total Depreciation 42,547 43,487 48,578 48,652 47,108 47,108 48,440 51,346 54,427
Current Year 2012/13 2013/14 Medium Term

64 | P a g e
5. Service Delivery and Implementation Plan The detail SDBIP document is at a draft stage and will be finalized after approval of the 2013/14 MTREF in June 2013 directly aligned and informed by the 2013/14 MTREF.
6. Annual Report
Annual report is compiled in terms of the MFMA and National Treasury requirements. 7. MFMA Training
The MFMA training module in electronic format is presented at the Municipality‟s internal centre and training is ongoing.

65 | P a g e
15. QUALITY CERTIFICATE
I, Sihle Maxwell Mbili , the Municipal Manager of the Hibiscus Coast Municipality, hereby
certify that the Draft Budget 2013/14 and supporting documentation have been prepared in
accordance with the Municipal Finance Management Act and Regulations made under the Act,
and that the Draft Budget and supporting documentation are consistent with the Integrated
Development Plan of the municipality.
……………………………………………………………
Sihle Maxwell Mbili ( Municipal manager) Hibiscus Coast Municipality ………………………… Date


