47
Intermountain Consumer Professional Engineers, Inc. 1145 East South Union Avenue Midvale, Utah 84047 (801) 255-1111 Washington City Capital Facilities Plan- Electrical September 2007

Intermountain Consumer
Professional Engineers, Inc.
1145 East South Union Avenue
Midvale, Utah 84047
(801) 255-1111
Washington City
Capital Facilities Plan- Electrical
September 2007

Intermountain Consumer Professional Engineers, Inc.
Washington City: Capital Facilities Study 2007 Page i
TABLE OF CONTENTS
Page
INTRODUCTION ............................................................................................................................................. 1
SUMMARY ............................................................................................................................................... 2
TRANSMISSION EVALUATION ................................................................................................................... 15
SUBSTATION EVALUATION ....................................................................................................................... 16
DISTRIBUTION EVALUATION .................................................................................................................... 22
SYSTEM IMPROVEMENT SUMMARY ........................................................................................................ 32
WORKSTUDY PROJECT ESTIMATES ........................................................................................................ 33
APPENDIX
Projected Electrical Load Growth with no action
Projected Electrical Load Growth with adjustments
Single Circuit 138 kV transmission line cost estimate
Distribution Substation Cost Estimates
Substation Transformer Loading Guidelines
Substation Equipment Information
Map #3 – Proposed Transmission Lines by 2012
Map #2012 – Proposed 2012 Electrical Distribution System

Intermountain Consumer Professional Engineers, Inc.
Washington City: Capital Facilities Study 2007 Page ii
TABLES, FIGURES AND DRAWINGS
Page
TABLES
1. Electrical Load History ....................................................................................................................... 7
2. City System Load Forecast .................................................................................................................. 8
3. Substation Load Forecast with no action ............................................................................................. 11
4. Substation Load Forecast with adjustments for growth ...................................................................... 12
5. Substation Equipment Ratings ............................................................................................................ 19
6. Substation Capacity ratings ................................................................................................................. 20
7. Distribution Line Capacity ratings ...................................................................................................... 26
8. Historical Load Growth vs. Projected Load Growth ........................................................................... 29
9. Load projection for City at full build-out ............................................................................................ 30
10. Work Study Project Estimates by Year ............................................................................................... 33
MAPS
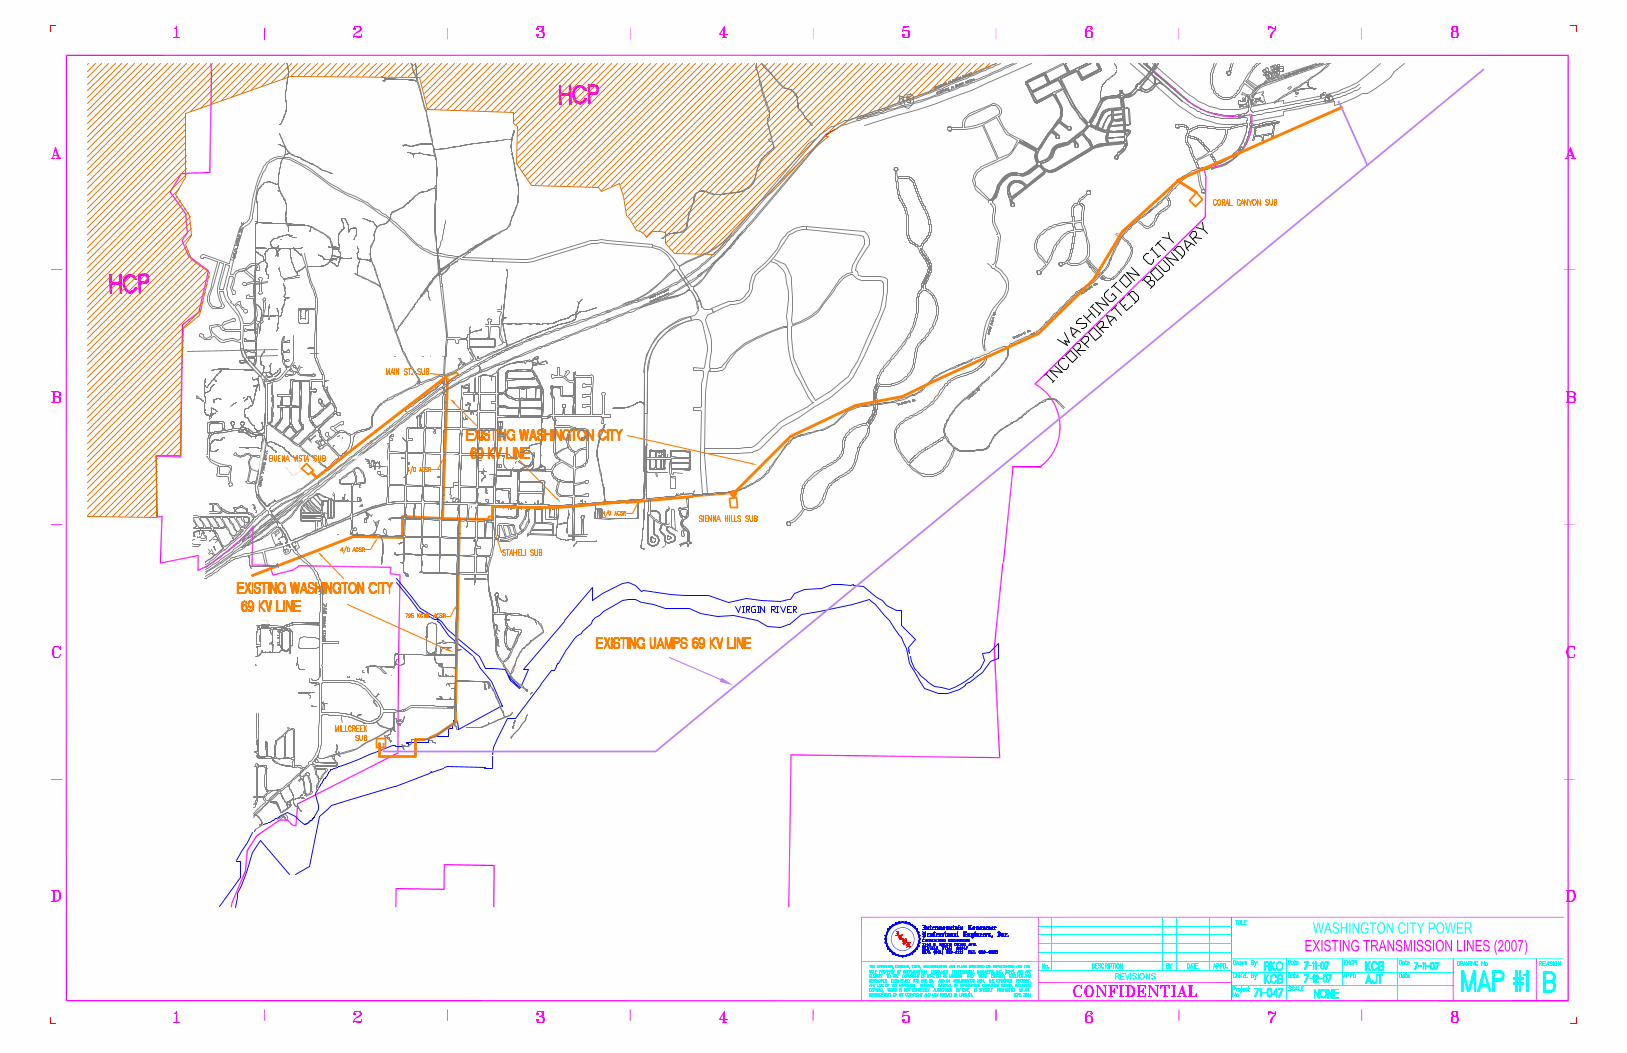
1. Washington City Transmission System (Present) ............................................................................... 12
2. Washington City Distribution System Main Feeders (Present) ........................................................... 13
3. Proposed transmission line projects ....................................................................................................Appendix
4. City Distribution feeders proposed by 2012 ........................................................................................Appendix
GRAPHS
1. Electrical Load History ....................................................................................................................... 8
2. Electrical System Summer Peak Load Forecast .................................................................................. 9
3. City Load Projection ........................................................................................................................... 14
4. Historical load growth compared to trend ........................................................................................... 27
5. City System Power Factor History ...................................................................................................... 28

Intermountain Consumer Professional Engineers, Inc.
Washington City: Capital Facilities Study 2007 Page 1
INTRODUCTION
Intermountain Consumer Professional Engineers (ICPE) has prepared this electrical system study and Five Year Work
Plan Update at the request of Washington City. The intent of the work plan is to anticipate future demand for
electricity, and evaluate the capacity of the City’s electrical system to supply it. Improvements to the system are
proposed to insure that capacity is in place to supply power to customers when needed. Where appropriate,
improvements to safety, reliability, and efficiency of the electric system are recommended. This report has been
prepared to provide Washington City information for budgeting and planning purposes. Detailed design work is not
included as part of this study.
General findings and recommendations of the work plan update are presented in the summary section of the work plan.
The project summary section lists major projects that are proposed in the work plan, the general timeframe when these
projects should be completed, and the estimated cost of the projects in 2007 dollars.
The system load history and forecast section includes tabular data on past load, projected load, and prospective
development in the City, and a table showing forecast loads for each substation. The load forecast identifies expected
loads for existing substations, as well as the addition of the Green Springs North Substation and the Sienna Hills
Substation. Load transfers between substations are projected on the basis of maximizing the utilization of existing
substation transformers. Capacity additions are only scheduled when the transfer of load to adjacent substations would
result in overloading those facilities. Maximizing the utilization of existing and future resources produces the least cost
option. Distribution facilities are planned for construction in the time frames necessary to facilitate the load transfers as
dictated by the “Action Plan”. Backup capacity for substation transformers/equipment and provisions for improved
transmission and distribution reliability are also issues addressed in the study.
Detailed information is provided in the report for each element of the power system evaluated as part of the work plan.
Sections are included on transmission, substation, distribution, large known residential and commercial development
projects, protection and coordination, and system power factor.
A long term planning map showing prospective distribution line routes is included with the work plan.

Intermountain Consumer Professional Engineers, Inc.
Washington City: Capital Facilities Study 2007 Page 2
SUMMARY
Major projects that are proposed in the work plan are listed in the project summary section with the recommended
completion date and the estimated cost of the project in 2007 dollars. Actual timing of these projects may vary
depending on the actual load growth of the electrical system. Additional information for each of these projects is
included in the work plan.
Load Forecasts
The demand on the City’s electrical system has grown at a high rate since 1994. The high rate of commercial and
residential growth is expected to continue because of the City’s location and the continued interest of developers. The
number of requests Washington City has received for project approval supports the expectation of continued rapid
growth for the period of time covered by this work plan.
The load forecast assumes a steady rate of growth within the City. Due to the continued high rate of growth in the last
few years, a load forecast was developed to define expected growth based on the current growth rate, compared to a full
build-out of developable land area per Washington City’s General Land Use Plan. Advanced planning is required so
facilities will be in place when needed and the financial impact to the City’s budget can be identified and incorporated.
Historical and forecast data can be found in Tables 1 and 2. This same data is shown graphically in Graphs 1 and 2.
Transmission
Washington City is served from a 69 kV transmission line originating in the UAMPS River Substation. UAMPS owns
the 138 kV transmission line feeding the River Substation and the 69 kV line running from the River Substation to the
Millcreek Substation. UAMPS meters the Washington City Power system at Millcreek Substation. (Meters are also
located on the 12.5 kV bus at each substation.) Washington owns the 69 kV line that connects the Millcreek Substation
to the Staheli, Main Street, and Buena Vista Substations. The City owns these three substations. Washington City also
owns the 69 kV line from the Purgatory tap to the Coral Canyon Substation and then along Telegraph Road to
approximately 1100 East. The City’s 69 kV transmission line is 795 ACSR from the Millcreek Substation to
approximately 100 East 200 South and is able to provide up to 80 MVA of electrical power to the City system before
approaching a thermal overload condition. The remainder of the transmission line to Staheli and Main Street Substations
is 4/0 ACSR. The 4/0 ACSR conductor will reach thermal overload at approximately 28 MVA. The 69 kV line between
the Main Street Substation and the Buena Vista Substation is 795 ACSR. The UAMPS Creek 69 kV line (795 ACSR) is
able to provide a total of 80 MVA of power to the entities it serves. This UAMPS line also serves the electrical needs of
Hurricane City and Twin Cities areas.
When the electrical demand on the 4/0 ACSR line section feeding Staheli and Main Street Substations exceeds 28
MVA, it will have to be replaced or rebuilt. Current load forecast indicates a need to replace the 4/0 ACSR line from
100 East 200 South to the Main Street Substation during 2013 to avoid putting 29.9 MVA on it in 2014. The 4/0 ACSR
wire serving Staheli, Sienna Hills, and Coral Canyon Substations will not require replacement until 2016 to avoid an
overload of 30.1 MVA during 2017. These projects are beyond the scope of this study and will need to be reviewed as
part of future Capital Facilities Plan updates. Limited capacity is available from the Purgatory Tap 69kV line until the
proposed Hurricane-Washington 138/69 kV Substation is constructed.
Any UAMPS or countywide plans to upgrade the transmission system is critical for power system planning and should
be considered before the City makes major construction commitments.

Intermountain Consumer Professional Engineers, Inc.
Washington City: Capital Facilities Study 2007 Page 3
Service Area
This study considers the electrical load growth within the Washington City Power service area. It does not provide any
information or evaluation for the loads on the south side of the Virgin River. Washington City Power serves the area
north of the Virgin River and within the City limits. The north side of the I-15 Freeway corridor is also served by
Washington City Power. The Tortoise Habitat area provides the northern and western boundaries to this portion of the
service area.
Substations
The existing Staheli, Main Street, Coral Canyon, and Buena Vista Substations should be used to supply electrical
energy within the City boundaries. These substations are well placed to supply power in the areas around them for
many years. As the City continues to expand into undeveloped areas, additional substations, transmission lines, and
distribution feeder lines will be required. The new electrical facilities will be connected to the system in such a way that
they can provide backup support to adjacent circuits and substations. The existing substations should be maintained and
expanded as necessary to handle future load growth within the neighborhoods they serve. The Staheli Substation is
located to serve the existing downtown area, the general area between the substation and the Virgin River, and to
provide backup to the Wal-Mart/Home Depot commercial area. The Coral Canyon Substation provides electrical
service to the Coral Canyon Development Area. The Main Street Substation is located to serve existing commercial
businesses and new developments along I-15. The new Buena Vista Substation has been built to deliver power to the
Buena Vista residential area and to the expanding commercial area on the west side of Washington City.
The Staheli and Main Street transformers will need to be replaced with larger units or have additional units installed to
sustain the rate of growth within their service areas. The new Coral Canyon substation has been constructed to serve the
growth in the Coral Canyon Development area. The area surrounding the I-15 exit to State Road #9 (to Hurricane) is
expected to fill in with commercial loads, light industrial loads, as well as a significant amount of residential housing.
This substation will provide electrical power for these customers.
The construction of the Mile Post 13 interchange has opened additional lands for development. This development
includes the construction of the Washington Parkway Boulevard between Telegraph Road and I-15. Development plans
for this area include residential, commercial and light industrial customers. A new substation will be required to serve
this area. The Sienna Hills Substation will serve customers between the freeway and Telegraph Road and between the
Sod Farm and Coral Canyon Development Area. This substation will also serve the loads that develop on the south side
of Telegraph Road.
The rapid growth in the Buena Vista area has prompted the building of the Buena Vista Substation to alleviate loading
stress on existing electrical facilities Buena Vista Substation will also provide for expected development along the
north side of the I-15 corridor and for the area west of the Main Street Substation. Another new substation (Green
Springs North) is proposed to support the northern end of the Buena Vista area growth. It will provide for the
northward growth of the Buena Vista area and the general area north of I-15. It will also provide interconnection points
with the Main Street Substation for maintenance and reliability purposes.
The timetable for substation capacity increase and the construction of new substations is presented in the Washington
City Electrical Load Growth Mitigation Plan, (Table 9).
Distribution
General guidelines for main feeder distribution line construction are included in the distribution section. The guidelines
emphasize construction of power lines with capacity to handle current and expected future load, provide backup
capacity, maintain reliability, and minimize losses.

Intermountain Consumer Professional Engineers, Inc.
Washington City: Capital Facilities Study 2007 Page 4
The long-range planning map included with the work plan shows prospective routes for new main feeder distribution
lines. The lines run along existing and future road right-of-ways, as shown on the Washington City Master
Transportation Plan. Potential locations for switches to interconnect major feeders are shown on the map.
The distribution routes on the long-range map are intended as a guide to aid in planning new distribution facilities. Line
routing will vary from the plan depending on where development occurs and the actual alignment of the roads at the
time of construction.
The present 12 kV distribution system has adequate capacity to handle existing load, under normal conditions, with
limited backup capacity for contingency situations. Prospective load growth will require changes to the distribution
system, including new feeders from the Coral Canyon Substation and construction of new substations at Sienna Hills
and Green Springs North. Other modifications and additions will be projected through the term of the study. New
distribution feeders to serve growth areas should be engineered to provide for overall distribution feeder system
reliability improvement. Ongoing engineering evaluation of the distribution system is recommended to prevent low
voltage and overloaded facilities, provide for power factor correction, maintain over-current coordination, and provide
backup capacity to maintain reliability. Mapping of facilities serving newly developed areas will be increasingly critical
as electrical facilities expand and more complex service configurations are installed.
Power Factor Correction
In power purchase contracts with UAMPS, Washington City has agreed to correct system power factor to at least 95%.
No penalties are stipulated in these contracts. During winter and spring, Washington City typically complies with
contract power factor requirements at the metering point. Installation of capacitors on Washington City’s system allows
the City to comply with contract power factor requirements. Since the Washington County transmission system is
voltage limited, proper VAR support from each utility is critical. Each utility should correct the distribution power
factor as close to unity (100%) as possible. Capacitors that are properly located on distribution feeders will provide the
VAR support needed to attain unity power factor on the Washington City Power System. In addition to VAR support,
other benefits of power factor correction are:
1. Line losses are reduced resulting in a more efficient system and savings in power purchase costs.
2. Capacity of feeders and substation transformers is increased because electrical current required to serve the load is
reduced and the circuit voltage profile is improved.
3. Reduce VAR demand on the transmission system, which improves overall voltage support.
Protective Device Coordination
A review of distribution system coordination should be done as soon as possible for each circuit. A review of all system
coordination should be done in 2007-08, after the distribution circuits are reconfigured with the additional feeders from
Coral Canyon Substation and Sienna Hills Substation. Any contemplated load transfers between substations to alleviate
summer load peaking problems should be completed before this review is implemented. The system coordination study
would insure the integrity of protection zones, establish the optimal relay settings and fuse sizes necessary for system
protection, and identify the need for any ancillary devices to limit customer exposure during abnormal system operation.
Over-current devices such as fuses, reclosers, and sectionalizers are used to protect substation equipment and power
lines from damage. Proper operation of these devices is mandatory to protect equipment and to avoid possible human
injury. Coordinated application of the protective devices will reduce the frequency and length of outages, assist
response personnel in locating the cause of outages, and will improve protection of lines and equipment. Proper fuse-
breaker coordination limits the number of customers affected by a system fault. Cost savings will result from fewer and
shorter outages, and a lower frequency of equipment failure. Customer satisfaction will improve and operating cost will
be lower as the number of service interruptions/outages is reduced.

Intermountain Consumer Professional Engineers, Inc.
Washington City: Capital Facilities Study 2007 Page 5
Typically, coordination work is done on the electrical system for specific equipment installations, such as the
installation of a substation transformer or a piece of switchgear. This approach only insures proper coordination for a
limited part of the system and only at the time of installation. Periodically, a review of the entire system should be done
to insure that protective devices are still coordinated. Any distribution circuit reconfiguration or new line equipment
installation must be reviewed to insure proper coordination with any upstream protective devices. Protective devices
(fuses, sectionalizers and reclosers) should be thoroughly reviewed for line extensions or new load additions. In the
past, large subdivisions or extensions to commercial developments have relied on overhead fuses for protection. Due to
the increasing size of developing loads, consideration should be given to the use of automatic devices, such as vacuum
fault interrupters (VFI’s) and electronic sectionalizers, to maintain the integrity of protected zones and provide
sufficient capacity to serve the load without compromising system coordination.
System Load History and Forecast
Management of an electric utility system requires careful planning. Load forecasts are essential to planning. New
facilities must be designed, ordered, and installed in time to meet the needs of new residences and businesses; power
resource contracts must be in place to supply growing demand at the most economical rate. In addition, budgetary
estimates for new facilities need to be created for short term and long range financial planning.
Washington City peak electrical loads have been projected based on load history, zoning requirements, and applications
for subdivision and property development. The forecasts are intended to show growth trends for planning. Many
factors may cause variation in the annual kilowatt peak including weather, construction schedules of developers and
businesses, annexations, and factors affecting the general economy of the region. The short-term forecasts are most
reliable. Longer-term forecasts need to be periodically updated based on current information and forecast trends.
Load history is the obvious indicator of what load to expect in the future. During the eighties, Washington City load
growth was low (due to the introduction of natural gas), but began growing at about 5% during the early nineties. In the
late nineties, the growth rate increased to about 8%. From 2000 until the present, the rate of growth has remained high,
averaging 10-12% per year. A high rate of growth is expected to continue because of Washington City’s location,
continued interest of developers, favorable interest rates for investment, and the availability of manpower resources.
Urban growth has historically moved along the I-15 Freeway from St. George City northward. As St. George has
grown, new customers have become established along the freeway. Washington is now seeing this growth within its
boundaries. Many city residents choose to live in Washington City, but commute to St. George to work. Others
commute northward to the Cedar City area. The Mile Post 13 project, the Coral Canyon expansion, and the continued
expansion in the Buena Vista area support the expectation of a continued high rate of growth.
Historical load data and forecast load data for Washington City are listed in Tables 1 and 2, and shown graphically in
Graphs 1, 2, and 3. Data for each substation is included along with the total City load.
The forecast shows a high rate of growth for the next 5-10 years. This appears to be a certainty for the next five years.
The following five years are sufficiently far away that an educated guess is the best we can offer. The substation loading
forecasts are based on an evaluation of the following criteria and assumptions:
• Washington City General Plan Land Use Map
• Historical data on the area being developed per year; number residential lots, etc. per unit of developable
area.
• For each substation service area, the total amount of developable land according to the parameters in the “Land Use Plan”
• That all new developments, loads, etc. within Washington City’s corporate city limits and located north of the Virgin River would be served by Washington City Power Department.

Intermountain Consumer Professional Engineers, Inc.
Washington City: Capital Facilities Study 2007 Page 6
In planning for additions to Washington City’s electrical system, summer loads are used. Washington City’s load has
been summer peaking since 1994. Loading of all system equipment, such as transformers and lines, is more critical in
summer due to the higher ambient temperatures.
TABLE 1
WASHINGTON CITY ELECTRICAL DEMAND HISTORY
Year Summer % Growth Winter
Peak (Summer) Peak
1987 3,639 6,498
1988 3,840 5.52% 6,146
1989 4,360 13.54% 6,851
1990 4,514 3.53% 6,520
1991 4,433 -1.79% 6,500
1992 5,121 15.52% 5,616
1993 5,615 9.65% 6,083
1994 6,514 16.01% 6,268
1995 6,984 7.22% 6,376
1996 8,112 16.15% 6,436
1997 8,590 5.89% 6,665
1998 9,883 15.05% 6,410
1999 10,646 7.72% 7,154
2000 11,956 12.31% 6,976
2001 14,490 21.19% 8,144
2002 15,638 7.92% 8,930
2003 17,782 13.71% 8,714
2004 19,840 11.57% 9,716
2005 23,971 20.82% 11,302
2006 25,093 4.68% 12,966

16,000
18,000
20,000
22,000
24,000
26,000
28,000
KW
D
EM
AN
D
GRAPH 1
Washington City Demand History
Summer Peak
Winter Peak
0
2,000
4,000
6,000
8,000
10,000
12,000
14,000
1987 1988 1989 1990 1991 1992 1993 1994 1995 1996 1997 1998 1999 2000 2001 2002 2003 2004 2005 2006
KW
D
EM
AN
D
YEARS

Intermountain Consumer Professional Engineers, Inc.
Washington City: Capital Facilities Study 2007 Page 8
TABLE 2
WASHINGTON CITY ELECTRICAL LOAD FORECAST
PEAK KW
Year Historical Projected
1991 4,433
1992 5,121
1993 5,615
1994 6,514
1995 6,984
1996 8,112
1997 8,590
1998 9,883
1999 10,646
2000 11,956
2001 14,490
2002 15,638
2003 17,782
2004 19,840
2005 23,971
2006 25,093 25,093
2007 27,602
2008 30,363
2009 33,399
2010 36,739
2011 40,413
2012 44,454
2013 47,788
2014 51,372
2015 55,225
2016 59,367
2017 63,819

0
10,000
20,000
30,000
40,000
50,000
60,000
70,000
2000 2002 2004 2006 2008 2010 2012 2014 2016 2018
KW Demand
YEARS
GRAPH #2Washington City Power
Load Growth Projection 2000-2017
Projected

TABLE 3
WASHINGTON CITY
SUBSTATION LOAD FORECAST Present System -- 10% growth per year 2007-2012 and 7.5% growth per year 2013-2017
No Mitigation Adjustments
YEAR Transformer
KW-Demand Base Rating
Substation 2004 2005 2006 2007 2008 2009 2010 2011 2012 2013 2014 2015 2016 2017
Staheli
Bank #1 6,761 8,168 7,172 7,889 8,678 9,546 10,501 11,551 12,706 13,659 14,683 15,784 16,968 18,241 10,000 kVA
Main Street
Bank #1 7,519 9,086 6,681 7,349 8,084 8,892 9,782 10,760 11,836 12,723 13,678 14,704 15,806 16,992 10,000 kVA
Bank #2 5,560 6,717 2,451 2,696 2,966 3,262 3,589 3,947 4,342 4,668 5,018 5,394 5,799 6,234 10,000 kVA
Coral Canyon
Bank #1 0 0 4,050 4,455 4,901 5,391 5,930 6,523 7,175 7,713 8,291 8,913 9,582 10,300 12,000 kVA
Buena Vista
Bank #1 0 0 4,739 5,213 5,734 6,308 6,938 7,632 8,395 9,025 9,702 10,430 11,212 12,053 12,000 kVA
Sienna Hills
Bank #1
Green Springs No.
Bank #1
Total 19,840 23,971 25,093 27,602 30,363 33,399 36,739 40,413 44,454 47,788 51,372 55,225 59,367 63,819 54,000 kVA
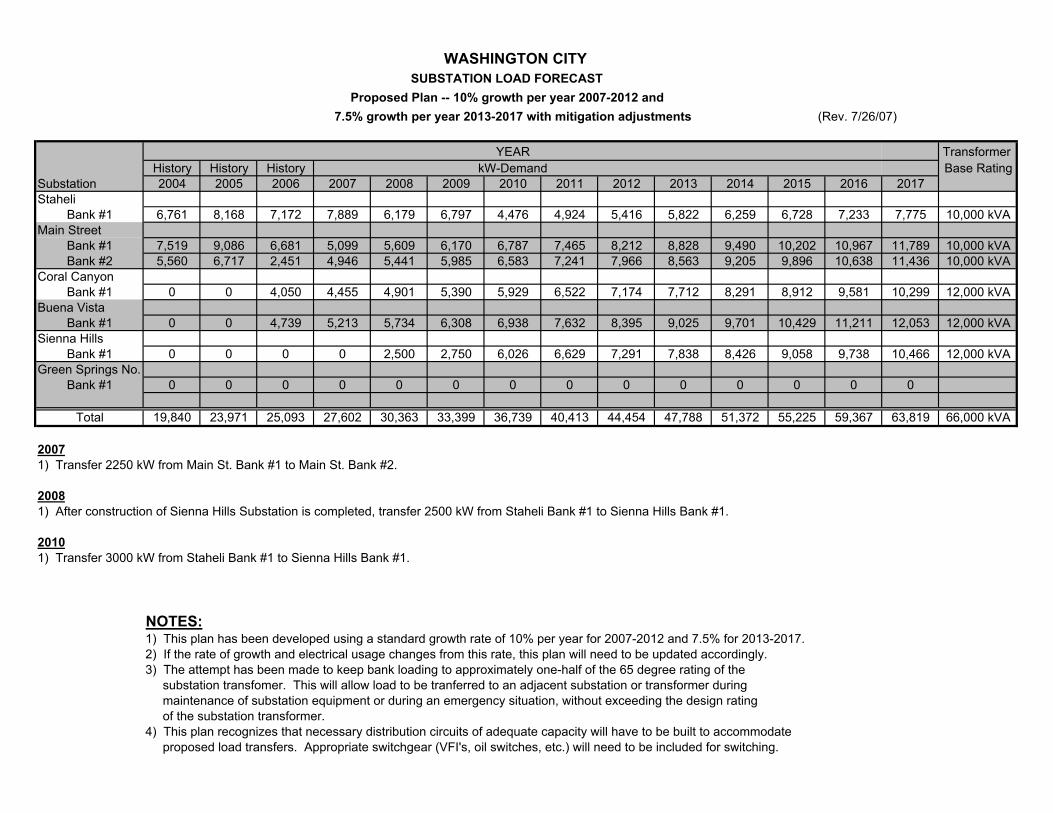
WASHINGTON CITY
SUBSTATION LOAD FORECAST
Proposed Plan -- 10% growth per year 2007-2012 and
7.5% growth per year 2013-2017 with mitigation adjustments (Rev. 7/26/07)
YEAR Transformer
History History History kW-Demand Base Rating
Substation 2004 2005 2006 2007 2008 2009 2010 2011 2012 2013 2014 2015 2016 2017
Staheli
Bank #1 6,761 8,168 7,172 7,889 6,179 6,797 4,476 4,924 5,416 5,822 6,259 6,728 7,233 7,775 10,000 kVA
Main Street
Bank #1 7,519 9,086 6,681 5,099 5,609 6,170 6,787 7,465 8,212 8,828 9,490 10,202 10,967 11,789 10,000 kVA
Bank #2 5,560 6,717 2,451 4,946 5,441 5,985 6,583 7,241 7,966 8,563 9,205 9,896 10,638 11,436 10,000 kVA
Coral Canyon
Bank #1 0 0 4,050 4,455 4,901 5,390 5,929 6,522 7,174 7,712 8,291 8,912 9,581 10,299 12,000 kVA
Buena Vista
Bank #1 0 0 4,739 5,213 5,734 6,308 6,938 7,632 8,395 9,025 9,701 10,429 11,211 12,053 12,000 kVA
Sienna Hills
Bank #1 0 0 0 0 2,500 2,750 6,026 6,629 7,291 7,838 8,426 9,058 9,738 10,466 12,000 kVA
Green Springs No.
Bank #1 0 0 0 0 0 0 0 0 0 0 0 0 0 0
Total 19,840 23,971 25,093 27,602 30,363 33,399 36,739 40,413 44,454 47,788 51,372 55,225 59,367 63,819 66,000 kVA
2007
1) Transfer 2250 kW from Main St. Bank #1 to Main St. Bank #2.
2008
1) After construction of Sienna Hills Substation is completed, transfer 2500 kW from Staheli Bank #1 to Sienna Hills Bank #1.
2010
1) Transfer 3000 kW from Staheli Bank #1 to Sienna Hills Bank #1.
NOTES:1) This plan has been developed using a standard growth rate of 10% per year for 2007-2012 and 7.5% for 2013-2017.
2) If the rate of growth and electrical usage changes from this rate, this plan will need to be updated accordingly.
3) The attempt has been made to keep bank loading to approximately one-half of the 65 degree rating of the
substation transfomer. This will allow load to be tranferred to an adjacent substation or transformer during
maintenance of substation equipment or during an emergency situation, without exceeding the design rating
of the substation transformer.
4) This plan recognizes that necessary distribution circuits of adequate capacity will have to be built to accommodate
proposed load transfers. Appropriate switchgear (VFI's, oil switches, etc.) will need to be included for switching.


70,000
GRAPH # 3
Washington City Load Projection
40,000
50,000
60,000
Historical
20,000
30,000
40,000
kW
De
ma
nd Historical
Projected
0
10,000
1991
1992
1993
1994
1995
1996
1997
1998
1999
2000
2001
2002
2003
2004
2005
2006
2007
2008
2009
2010
2011
2012
2013
2014
2015
2016
2017
2018

Intermountain Consumer Professional Engineers, Inc.
Washington City: Capital Facilities Study 2007 Page 15
TRANSMISSION EVALUATION
The primary transmission source for Washington City runs from the UAMPS River Substation (138/69 kV) to the
Millcreek Substation. Washington City takes metered delivery at 69 kV at this substation and owns the radial feed from
Millcreek Substation to Main Street and Staheli Substations. A UAMPS 69 kV line borders Washington City on the
east and provides the initial source of power for the Coral Canyon Substation. The radial fed substations are very
vulnerable to outage if any abnormal events occur on the 69 kV line between Millcreek Substation and Staheli or Main
St. Substations. The Coral Canyon Substation is equally vulnerable to abnormal events on the UAMPS 69 kV line
between Millcreek and Coral Canyon Substations. To eliminate this vulnerability, construction of a 69 kV line from
the Coral Canyon Substation to the Sienna Hills Substation, to the north side of I-15, to the Main St. Substation, and
then to the Green Springs North Substation is recommended. This will create a 69 kV loop between the existing and
proposed Washington City substations. With appropriate switching capability at each substation, this loop will allow
the City to maintain transmission service to each substation during abnormal operating conditions. These might include
line maintenance work or an outage to any segment of the loop. This versatility will enhance the City’s ability to operate
the electrical system and improve service reliability to all City customers.
Washington does have another existing 69 kV transmission line connection. Before the Millcreek Substation meter
point for Washington City was built, Washington City received transmission service from the Skyline to Twin Lakes
69 kV line. In an emergency, this line would be able to support approximately 28 MVA of Washington City load before
reaching a thermal overload condition. All of the City’s current load could not be supported from this source.
The proposed transmission line construction will be built with 1272 kcmil ACSR at 138 kV or 795 ACSR at 69 kV. At
69,000 volts, the 795 kcmil ACSR wire can supply 80 MVA of power to the City’s customers. The 1272 kcmil ACSR
wire would be capable of 130 MVA at 69 kV. The implementation of a loop-type transmission system will allow each
substation to have an adequate power source for present and future needs. Some of the existing transmission wire is
4/0 AWG ACSR. This wire is limited at a capacity of 28 MVA. In order to provide for the needs of the City, some
portions of the 4/0 AWG ACSR conductor may have to be rebuilt with 795 kcmil ACSR.
ICPE is currently working with UAMPS, St. George, Santa Clara, Hurricane, PacifiCorp, and Dixie-Escalante to
coordinate Washington County transmission system improvement needs. Capacitors were installed on the transmission
system to improve power factor and voltage regulation on the line. As electrical growth continues in the Washington
County area, other system improvement projects will be needed to meet electrical power needs. Some of the anticipated
projects were identified by a joint system study, conducted by UAMPS and PacifiCorp.
Through these joint system studies it was determined that major system improvements would be necessary on the
UAMPS and PacifiCorp systems to support expected loads. The results of the joint studies and recommended system
improvements are detailed in two (2) study reports entitled “Southwest Utah – Planning Study” dated May 12, 2003 and
(Southwest Utah –Joint Planning Study Report - Part II 138/69 kV Sub Transmission” dated July 08, 2003. In general,
the reports indicate that along with system improvements that are necessary on both PacifiCorp and UAMPS primary
transmission (345 kV and 138 kV) systems, improvements and system additions are also necessary on UAMPS’s
138 kV and 69 kV systems. The addition of a 138/69 kV Substation to be located in the vicinity of the Washington
City/Hurricane City boundary will be necessary in the 2010-2012 timeframe. The installation of that substation will
necessitate construction of an additional interconnecting 138 kV line.

Intermountain Consumer Professional Engineers, Inc.
Washington City: Capital Facilities Study 2007 Page 16
SUBSTATION EVALUATION
Substations
Washington City receives power delivery from UAMPS through a high voltage metering point in the Millcreek
Substation. The billing meter for Washington City is located in this substation. There is a 69 kV circuit breaker on the
Washington City 69 kV line within this substation. A 69 kV transmission line, part 795 KCMIL ACSR and part 4/0
AWG ACSR, delivers the power to the City’s Staheli, Main Street, and Buena Vista substations. These substations step
the voltage from 69 kV to 12.47 kV for distribution delivery. The major equipment ratings and capacities of each
substation are listed in Tables 6 and 7. Historical load and forecast load for each substation is listed in Table 2.
Two capacity ratings, normal and maximum are listed for each substation. Normal capacity is used in planning and
should match or exceed the forecast substation load. The normal capacity rating is based on the ability to back up loss
of a transformer using another transformer within the substation and/or using adjacent substations and distribution lines.
The maximum rating is based on transformer forced air rating at 65E C winding temperature rise. This is the maximum
load that should be placed on the substation transformer and should be used only when necessary to back up loss of
another transformer or system element.
Good engineering practice requires that the electrical system be able to withstand the loss of a single substation
transformer (typically the largest on the system), without leaving any customers out of power. This is most often
referred to as the “N-1” condition. The Washington City Power System is currently at the limits of the “N-1” condition.
In order to accomplish this, loading of these substation transformers should not exceed the normal capacity of the
substation transformer. The remaining capacity is then available to provide power to customers who would otherwise
be without power when a substation transformer fails. If any one of the substation transformers in the system fails, the
remaining transformers and distribution main feeder lines can continue to serve the entire load. It is critical that
adequate ties are created between distribution circuits to allow load transfers from one circuit to another or from one
substation to another. These interconnection points on the distribution system are best accomplished with three-phase
air break switches for overhead or with pad-mounted three-phase operated switchgear for underground applications.
Growth projections indicate that the new Green Springs North Substation will need to be built during the 2016-2017
time period to relieve loading on the Main Street substation and to provide for the needs of the Buena Vista
development as it continues to expand northward. The transmission line to serve this substation would be built from the
Main Street 69 kV Substation to the Green Springs North Substation. This is a distance of approximately 1.5 miles.
Load growth projections also dictate that a new substation (Sienna Hills) will be necessary to serve the Mile Post 13
area sometime during the 2007-2008 timeframe. Timing of the installation will be heavily dependent on the type of
load that is added by the Mile Post 13 Project. It is anticipated that this substation will be served by extending the
69 kV line built from the UAMPS Purgatory Tap to the Coral Canyon Substation. This is a distance of approximately
3.4 miles. This line segment will be part of the City’s 69 kV transmission loop.
Long-range projections indicate a need for the construction of the Parkway North Substation, near the I-15 freeway and
on the north end of the new Washington Parkway Boulevard. This substation will be needed to serve customers along
the I-15 corridor and to provide load relief to the Main Street and Coral Canyon substations. Distribution circuits need
to be built into the area as the load develops. The substation would need to be built when the distribution feeders cannot
maintain adequate voltage in the area, when the adjacent substation transformers do not have sufficient capacity to
support the load, or when the reliability of the circuit is no longer acceptable.
Note: In cold weather, substation transformers can be temporarily loaded above the maximum rating. ANSI
Standard C57.92 provides a guide for loading transformers at various temperatures. The standard indicates
that if the average daily temperature is 30E F, a transformer can be loaded to about 120% of nameplate rating
with the same life expectancy as if it were loaded to nameplate. If the average daily temperature exceeds
86E F, the transformer loading should be reduced below nameplate rating. Average daily temperature of 86E
F is often exceeded in the Washington City area. This demands that the loading on each substation

Intermountain Consumer Professional Engineers, Inc.
Washington City: Capital Facilities Study 2007 Page 17
transformer during the summer peaking time be maintained below the nameplate rating. Recommended
summer peak maximum loading guidelines are included in the appendix.
Substation Assessment
The Washington City power system is served by four substations with Staheli Substation in the downtown area, Main
Street Substation on the north side of the I-15 Freeway, Buena Vista Substation on the west end, and Coral Canyon on
the east end. Transmission service to these substations is provided from the UAMPS Millcreek 69 kV substation.
Washington City owns the 69 kV transmission line that connects the City substations to the Millcreek Substation. This
69 kV line is metered at the Millcreek Substation.
The existing Staheli, Main Street, Coral Canyon, and Buena Vista Substations should continue to be used to supply
electrical energy within the City boundaries. These substations are well placed to supply power in the areas around
them for many years. As the City continues to expand into undeveloped areas, additional substations, transmission
lines, and distribution feeder lines will be required. The new electrical facilities will be connected to the system in such
a way that they can provide backup support to adjacent circuits and substations. The existing substations should be
maintained and expanded as necessary to handle future load growth within the neighborhoods they serve. The Staheli
Substation is located to serve the existing downtown area, the general area between the substation and the Virgin River,
and to provide backup to the Wal-Mart/Home Depot commercial area. The Coral Canyon Substation provides electrical
service to the Coral Canyon Development Area. The Main Street Substation is located to serve existing commercial
businesses and new developments along I-15. The new Buena Vista Substation has been built to deliver power to the
Buena Vista residential area and to the expanding commercial area on the west side of Washington City.
The recommendation of the work plan is that existing substations be maintained and expanded as necessary to handle
future Washington City loads. Substation additions proposed to meet forecast load are described in the following
sections of the work plan. These plans may be easily adapted if conditions change in the City, such as construction of a
new transmission line or development of a new heavy load center.
Staheli Substation
Staheli Substation consists of one 69/12.5 kV, 10/12.5 MVA transformer. It currently serves two distribution circuits.
The Coral Canyon Substation can be utilized to manage some of the projected load increases, with the Sienna Hills
Substation serving the remainder of the load growth. This substation provides load relief and backup to the Main Street
Substation and to the Coral Canyon Substation.
Projected loading indicates the need to replace the 10/12.5 MVA transformer with a 12/16/20 MVA transformer, or
install a second transformer in the substation to share the area load. This would require a second substation bay to be
constructed within the existing substation property boundaries. The existing substation site is such that the addition of a
second transformer is possible. The timetable for this installation is dependent on the load growth experienced during
the next 5-8 years. Current projections suggest that this project would need to be built during the years 2011-2012. (See
Proposed Projects and Proposed Projects Map Exhibit for additional information).
Note: The existing transformer was rebuilt in the 1970’s and has aluminum windings. There is some concern about
how reliable it may be. As the electrical load increases, the internal winding temperature will climb higher
than it has been in the past. ICPE recommends that the loading on this transformer be limited to roughly 80%
of its nameplate rating to avoid the possibility of damaging the internal components of this transformer. This
will avoid the heating and its effects that is associated with loading the transformer to a higher kVA.
Main Street Substation
The Main Street Substation consists of two-69/12.47 kV, 10/12.5 MVA transformers, with a combined rating of 20/25
MVA. Three single-phase substation regulators are connected to each transformer bank to provide voltage regulation
on each transformer bus. Each transformer has two circuits in service. This substation provides load relief and backup

Intermountain Consumer Professional Engineers, Inc.
Washington City: Capital Facilities Study 2007 Page 18
to the existing Staheli, Buena Vista, and the future Green Springs North substations. As the load grows, these
transformers may need to be upgraded to 12/16/20 MVA units. The timing for the transformer upgrade is beyond the
timeframe of this study. The addition of a third transformer at this location is not possible due to space limitations.
[See Proposed Projects in Table 10 and Proposed Projects Map in the Appendix for additional information].
Coral Canyon Substation
Residential and commercial developments in the Coral Canyon Development, loads along the I-15 Freeway and growth
south of Telegraph Road are served from this substation. This substation provides relief and backup for the Main Street
and Staheli Substation transformers and distribution circuits. One circuit serves the Coral Canyon development and
provides backup to the city eastside loads served by the Staheli Substation. The other circuit serves north to the I-15
Freeway interchange area. Hurricane City is serving the southeast quadrant of the interchange, while Washington City
will be serving the other three quadrants. The northwest and northeast quadrants are currently inside of the HCP
(Tortoise Habitat). This may slow the development of new loads within these two quadrants. The load growth around
this interchange and on adjacent properties requires the support of a main feeder. A third circuit is anticipated when the
area south of Telegraph Road begins to develop.
Buena Vista Substation
Residential and commercial developments in the Buena Vista area, loads developing on the northern end of Main Street,
and the need for load relief for the Main Street Substation forced the construction of a new substation named Buena
Vista Substation. This substation provides voltage relief in the Buena Vista area and to the commercial district on the
south side of the I-15 corridor.
New Sienna Hills Substation
The Sienna Hills Substation is to be located on the south side of Telegraph Road, near the intersection with Washington
Parkway Boulevard. Load growth on the east side of the downtown area, new residential and commercial growth south
and northwest of Telegraph Road require that this substation be built before the summer peak of 2008. This substation
will provide load relief and backup support to the Coral Canyon and Staheli Substations. Initially, three distribution
circuits will be installed. They will connect to existing circuits to the east, to the west, and provide a new feeder into the
area east of the Washington Parkway Boulevard. The Mile Post 13 development includes low, medium and high-
density residential areas, as well as multiple commercial, retail, and light industrial areas.

Intermountain Consumer Professional Engineers, Inc.
Washington City: Capital Facilities Study 2007 Page 19
TABLE 5 WASHINGTON CITY SUBSTATION EQUIPMENT RATINGS
SUBSTATION TRANSFORMER REGULATOR RECLOSERS
Staheli Sub
Bank #1
10/12.5 MVA @55°C (OA/FA)
14.4 MVA @ 65°C (OA/FA)
43800 X 67000 –12470Y/7200
X 24940Y /14400 volts
3-509 kVA (15.3 MVA) Ckt #301:
Cooper WE w/ 4C control
560 Amp Rating
Ckt #302:
Cooper WE w/ 4C control
560 Amp Rating
Main Street
Bank #1
10/12.5 MVA @55°C(OA/FA)
14.4 MVA @ 65°C (OA/FA)
67000 – 12470Y/7200 volts
3-509 kVA (15.3 MVA) Ckt #101:
Cooper VWE w/ 4C control
800 Amp Rating
Ckt #102:
Cooper VWE w/ 4C control
800 Amp Rating
Main Street
Bank #2
10/12.5 MVA @55°C (OA/FA)
14.4 MVA @ 65°C (OA/FA)
67000 – 12470Y/7200 volts
3-509 kVA (15.3 MVA) Ckt #201:
Cooper VWE w/ 4C control
800 Amp Rating
Ckt #202:
Cooper VWE w/ 4C control
800 Amp Rating
Coral Canyon
Bank #1
12/16/20 MVA @55°C
(OA/FA/FA)
22.4 MVA @ 65°C (OA/FA/FA)
67000 – 12470Y/7200 volts
3-887 kVA (26.6 MVA) Ckt #401:
G&W Solid Dielectric Sw.
800 Amp continuous
Ckt #402:
G&W Solid Dielectric Sw.
800 Amp continuous
Ckt: #403:
G&W Solid Dielectric Sw.
800 Amp continuous
Buena Vista
Bank #1
12/16/20 MVA @55°C
(OA/FA/FA)
22.4 MVA @ 65°C (OA/FA/FA)
67000 – 12470Y/7200 volts
3-887 kVA (26.6 MVA) Ckt #501:
G&W Solid Dielectric Sw.
800 Amp continuous
Ckt #502:
G&W Solid Dielectric Sw.
800 Amp continuous
Ckt: #503:
G&W Solid Dielectric Sw.
800 Amp continuous

Intermountain Consumer Professional Engineers, Inc.
Washington City: Capital Facilities Study 2007 Page 20
TABLE 6 SUBSTATION CAPACITY
CAPACITY OF CIRCUITS LEAVING
TOTAL CAPACITY (MVA)(1) THE SUBSTATION (AMPS)
LIMITING MAXIMUM(2)
SUBSTATION NORMAL MAXIMUM ELEMENT CIRCUIT CONDUCTOR AMPS
14.4 @ 65OC
Transformer--
STAHELI BANK #1 10 OA/FA Alum. Wndgs.
or regulators #301 4/0 ACSR 340
Regulators:
15.3 MVA @ #302 4/0 ACSR 340
65OC
MAIN STREET BANK #1 10 14.4 @ 65
OC Transformer
(South Unit) OA/FA or regulators #101 477 ACSR 670
Regulators: #102 4/0 AL CN 15 248
15.3 MVA @
65OC
MAIN STREET BANK #2 (North Unit)
10 14.4 @ 65
OC Transformer
OA/FA or regulators #201 750 AL CN 15 497
Regulators: #202 750 AL CN 15 497
15.3 MVA @
65OC
CORAL CANYON BANK #1
12
22.4 @ 65
OC
OA/FA/FA
Regulators: 26.6 MVA @ 55
OC
Transformer
#401
750 AL CN 15
497
#402 750 AL CN 15 497
#403 750 AL CN 15 497
BUENA VISTA BANK #1
12
22.4 @ 65
OC
OA/FA/FA
Regulators: 26.6 MVA @ 55
OC
Transformer
#501
750 AL CN 15
497
#502 750 AL CN 15 497
#503 750 AL CN 15 497

Intermountain Consumer Professional Engineers, Inc.
Washington City: Capital Facilities Study 2007 Page 21
NOTES:
(1) Normal capacity of the substation should be exceeded only temporarily for emergencies or maintenance.
The normal rating is based on the ability to backup loss of a transformer using another transformer within the substation or using adjacent substations and lines. The maximum capacity is based on transformer forced air rating at 65
o C rise. This is the maximum load that should be placed on the substation
transformer and should be used only when necessary to backup loss of another transformer or system element. In cold weather, maximum rating can be increased in accordance with ANSI Standard C57.92. For example, if average daily temperature is 30
o F, the transformer can be loaded to about 120% of the
nameplate rating. However, if the average daily temperature is over 100o F, the loading of the transformer
should be at or less than the nameplate rating for a 65o C rise above ambient.
(2) Ampacity ratings for overhead lines given are for extreme summer conditions (100
o F). Underground
cable ampacity ratings given are for earth at 68o F. Conservative loading of underground three phase
circuits is recommended where single cables are run in metallic conduits. Circuit MVA ratings assume 10% imbalance of phase currents.

Intermountain Consumer Professional Engineers, Inc.
Washington City: Capital Facilities Study 2007 Page 22
DISTRIBUTION EVALUATION
Distribution: General Recommendations
The existing electrical distribution system will not support future projected loads. New main feeder distribution circuits
will be needed to supply power to new customers. General recommendations to be followed as these new feeders are
built are listed herein. Following these guidelines will make the operation and maintenance of the expanding system
more manageable and cost less to operate.
Distribution lines are used to deliver power from substations to customers throughout the City. Safe, reliable, electrical
service is dependent on these lines. To maintain quality service requires engineering, planning, quality construction,
and regular maintenance. This work plan will provide input to the planning process. During this period of rapid
growth, the City should continue to work closely with engineering. Decisions made now will affect utility operations
for many years. Construction depends on trained and experienced line crews, who are well-supported and well-
equipped, and with good material and construction specifications. Maintenance requires a commitment in labor and
materials to keep facilities in good operating order. All of these measures require funding. However, neglecting or
delaying these actions carries a penalty of a less reliable power system, and higher operational and maintenance costs.
Emergency loading capacities of three-phase distribution lines are listed in Table 8. Overhead line ampacities are given
for conductors in 77E F in air. These ratings must be reduced when the temperature is above 77E F. Summer ratings
for air at 100E F are listed for 477 ACSR and 4/0 ACSR. The table refers to overload ampacities only. Capacity to
supply power over specific lines in the City may be restricted by voltage drop or other constraints.
A planning rating is listed in the table for each conductor type. This rating is based on a load level of about 50% of line
capacity. The planning rating is recommended as a general guide to maximum line loading for normal conditions.
Limiting load to the planning rating has the following benefits: line loss is reduced significantly since loss increases by
the square of the current, capacity is available in the line for backing up load or for other contingencies, voltage drop is
reduced and is more likely to remain at acceptable levels under a range of conditions, and capacity is available in the
line for unanticipated new load.
The planning rating should not be considered as a strict limitation on loading a line. Where line sections are short,
losses or voltage drop may not be a significant factor, even at heavy load. On the other hand, where lines are long,
voltage drop may be excessive when loaded to the planning rating. More detailed analysis is recommended for these
lines.
Recommended general guidelines for new distribution line construction are:
$ Use a minimum of 477 kcmil ACSR (overhead) or 750 kcmil Aluminum underground cable for all distribution
feeders leaving a substation, for all main feeders supplying heavy load centers, and for feeders in which extra
capacity is needed to back up or provide an alternate source for another main feeder. A network of “main feeders”
should be developed between substations to allow for needed load transfers between substations.
$ Use a minimum of # 4/0 ACSR (overhead) or #4/0 Aluminum underground cable for all three-phase main feeders
within the City. If lines extend more than 2 miles or are expected to supply loads in excess of 2000 kW, consult
engineering.
$ Use a minimum of # 1/0 ACSR (overhead) or #1/0 Aluminum underground cable for all distribution system tap lines
and branch segments.
$ Use at least two underground cable entries to serve multiple lot subdivisions. Interconnect the cables using pad-
mounted switchgear within the subdivision.

Intermountain Consumer Professional Engineers, Inc.
Washington City: Capital Facilities Study 2007 Page 23
The work plan recommends that switches be installed throughout the distribution system to interconnect main three-
phase feeders. The switches that interconnect main trunk lines will improve reliability and reduce costs. The ability to
quickly restore service to customers when outages occur will be improved by this action. Line sections can be taken out
of service or bypassed for maintenance or construction. This will reduce customer outage time and reduce construction
costs. Switches should be installed where main trunks from the same or different feeders intersect. Load-break
switches, overhead or pad-mounted, should be used where frequent switching is anticipated or where paralleling is
required. Taps from the main trunk lines should use over-current protective devices such as fuses and/or Vacuum Fault
Interrupters (VFI’s) to minimize the area affected by a system fault.
Distribution Evaluation: Staheli Substation
Load flow analysis was done on each circuit previously. This was based on the information provided to ICPE by
Washington City. All feeders deliver good quality voltage when supplying existing power levels and with the system
switched for normal operation. Circuit #301 supplies power to the west and to the south from the substation location.
Circuit #302 provides power to eastern part of the downtown area.
Distribution Evaluation: Main Street Substation
The south transformer bank serves two distribution circuits. Circuit #101 has traditionally served the load on Main
Street and much of the City’s central and west area. The 477 ACSR conductor makes this feeder an effective backup to
the Staheli Substation. Load can be transferred between substations without worry of overloading the conductor.
The north transformer bank has two distribution circuits. Circuit #201 currently serves the loads located to the north,
east, along the northern side of the I-15 Freeway. It has some very long lines that serve City wells and water storage
tanks. The underground feeder is 750 kcmil Aluminum Concentric Neutral cable. It parallels the Freeway, going east
from the substation. The 750 kcmil Aluminum cable terminates in pad-mounted switchgear, where it transitions to
overhead construction with 1/0 ACSR conductor. It can provide some limited backup capacity to the Coral Canyon
service area. The 750 kcmil Aluminum conductor runs approximately one-fourth of the distance from the Main Street
Substation to the new Mile Post 13 interchange. This feeder is not heavily loaded, but a careful watch will be needed to
avoid low voltage conditions at its extremities as new load develops along the Freeway frontage road. Circuit #202
leaves the substation underground to the north. There is a planned circuit tie with a circuit from the Green Springs
North Substation, when it is built. This circuit is 750 kcmil Aluminum conductor and serves the area developing north
of the Main Street Substation.
Distribution Evaluation: Coral Canyon Substation
The load in the Coral Canyon Development is increasing as the remaining undeveloped areas are under construction or
will be in the near future. Additional load from this expansion and the established load in the surrounding area are
served from the Coral Canyon Substation. The substation site is adjacent to the Washington City Water Treatment
Plant, on the south side of Telegraph Road. It has two 12.5 kV distribution circuits, served by a 67,000-12470Y/7200
volt 12/16/20 MVA substation transformer. One circuit connects to the existing 750 Aluminum Concentric Neutral
circuit that loops through the developed part of the Coral Canyon area. The second circuit is installed along Telegraph
Road to serve the loads on the north side of Telegraph Road, west of the new substation. The planned third circuit will
serve the loads located on the south side of Telegraph Road between the Coral Canyon Substation and Washington
Parkway Boulevard. This circuit will not be installed until the areas on the south side of Telegraph Road begin
construction.

Intermountain Consumer Professional Engineers, Inc.
Washington City: Capital Facilities Study 2007 Page 24
Distribution Evaluation: Buena Vista Substation Residential and commercial developments in the Buena Vista area, loads developing on the northern end of Main Street,
and the need for load relief for the Main Street Substation forced the construction of a new substation named Buena
Vista Substation. This substation provides voltage relief in the Buena Vista area. There are three circuits leaving this
substation. One serves northward, another serves to the west, and the third supplies power to the Commercial area
south of the I-15 Freeway.
Distribution Evaluation: New Sienna Hills Substation
The new Sienna Hills Substation is planned to be on the south side of Telegraph Road, near the Washington Parkway
Boulevard. The substation will have provisions for one transformer bay and for three distribution feeders. A 67,000-
12,470Y/7200 volt, 12/16/20 MVA substation transformer will be installed. This transformer will serve three
distribution circuits. One circuit will serve the area north of the substation (part of the Mile Post 13 project area). The
second will serve load on the north side of Telegraph Road and east of the substation. The third circuit will serve load
west of the substation. Each of these circuits will provide power to new customers, as well as providing reliability
backup connections to the Coral Canyon Substation, the Staheli Substation, and the future Parkway North Substation.
Distribution Evaluation: Parkway North Substation (Future)
The Parkway North Substation is planned to be located on the north side of the I-15 Freeway and a little west of the
Mile Post 13 Interchange. This substation will be built with one substation transformer (67,000-12,470Y/7200 volts
and 12/16/20 MVA) and three distribution circuits. The need for construction of this substation will be determined by
the commercial and retail businesses that are built near the interchange. The circuits from this substation are planned to
serve (generally) to the north, to the east, and to the south from the substation site. This substation will provide power
service to new customers and reliability backup connections with the Coral Canyon Substation, Sienna Hills Substation,
Main Street Substation, and the Green Springs North Substation. As the development plans are reviewed and approved
for the area on the north side of the freeway at the Mile Post 13 interchange, the City should obtain a site for this
substation.
Distribution Evaluation: Green Springs North Substation (Future)
The new Green Springs North Substation is planned to be located approximately one mile north and one-quarter mile
west of the Main Street Substation. The City owns property in this area and would like to use a portion of it for this
substation. This substation will have one transformer (67,000-12,470Y/7200 volts and 12/16/20 MVA) with three
distribution circuits. The three circuits will serve load to the east, west, and south from the substation location. The
Buena Vista area is in severe need of support from another source. It is currently fed from the Buena Vista Substation.
The circuit to be built to the west is planned to interconnect with the Main St. #102 circuit. This will allow new and
existing load to be served without low voltage difficulties. It will also provide a means of reliable backup service
between the Green Springs North Substation and the Main Street Substation. The east circuit will serve new customers
to the east of the substation and will serve the existing rural load on what is now the Main St. #201 circuit. The south
circuit is planned to serve new and existing customers along the extension of Main Street as it expands north from the
Freeway. The east circuit is planned to interconnect with the Main St. #202 circuit. This connection will allow load
management and provide reliability backup service between the Green Springs North Substation, the Main St.
Substation, the Buena Vista Substation, and eventually the Parkway North Substation.

Intermountain Consumer Professional Engineers, Inc.
Washington City: Capital Facilities Study 2007 Page 25
Distribution: Long Term Plans
Long-term distribution plans are intended as a guide to be followed as service is provided for new customers. Most new
construction can be delayed until forecasts are certain. However, duplication and waste can be avoided if conformance
to the City’s master plan is verified before line improvements or extensions are made. The long-term plans are
speculative and should be adapted as circumstances change, such as the location of electrical load and routing of streets.
The City should use the long-term plans as a guide to assure proper Right-of-Ways are obtained as each development is
approved. Another benefit of following the long-term plan is to assure that feeder cables installed will be properly sized
to meet the future needs of the area. This will minimize the need to upgrade these cables in the future. Having adequate
right-of-ways secured in advance will streamline the construction process for the City Power Department.
Prospective locations for main distribution feeders in Washington City are shown on the Long-term Planning Map. The
map also shows existing main feeders, existing interconnection points, and proposed interconnection points between
feeders. New feeder routes will need to be selected to supply load in the east and northeast part of the City. As these
areas develop, heavy backbone feeders need to be extended along major streets. Main feeders from each substation
should intersect to form a looped system. This will permit load to be transferred between substations, and will establish
alternate sources of power during outages or for maintenance work.

Intermountain Consumer Professional Engineers, Inc.
Washington City: Capital Facilities Study 2007 Page 26
TABLE 7
DISTRIBUTION LINE CAPACITY RATINGS(1)
THREE PHASE 12.47 kV SERVICE
LINE
CONDUCTOR
OVERHEAD
LINES(2)
(AMPS or MVA)
UNDERGROUND LINES(2)
SUMMER
RATING(3)
(MVA)
PLANNING
RATING(4)
(MVA)
3 Conductors
in 1 Duct
3 Conductors in
3 PVC Ducts
1000 AL CN Cable 574 or 12.3 707 or 15.2 11.0 6.0
750 AL CN Cable 497 or 10.7 601 or 12.9 9.8 5.0
500 AL CN Cable 400 or 8.6 472 or 10.1 8.0 4.0
4/0 AL CN Cable 230 or 5.0 268 or 5.8 4.6 2.5
477 ACSR 670 or 14.4 12.0 7.0
4/0 ACSR 340 or 7.3 6.0 3.5
1/0 ACSR 230 or 4.9 4.0 2.5
2 ACSR 180 or 3.8 3.1 2.0
2/0 Copper 360 or 7.7 6.3 3.5
6 Copper 120 or 2.5 2.0 1.5
NOTES:
(1) Thermal overload ratings are listed. Capacity to supply power over specific lines in the City may
be restricted by voltage drop or other constraints.
(2) Ampacities for underground cable: 194EF conductor, 68EF earth, 75% load factor. From Okonite
Engineering data book. Ampacities for overhead conductor: 77EF air, 167EF conductor, wind 1.4
mph.
(3) Summer rating for overhead conductor: 100EF air, 176EF conductor. Wind 1.4 mph. Underground
conductor: 3 cables in single direct-buried conduit, 194EF conductor, 68EF earth, 75% load factor.
(4) Planning rating is established at approximately 50% loading.
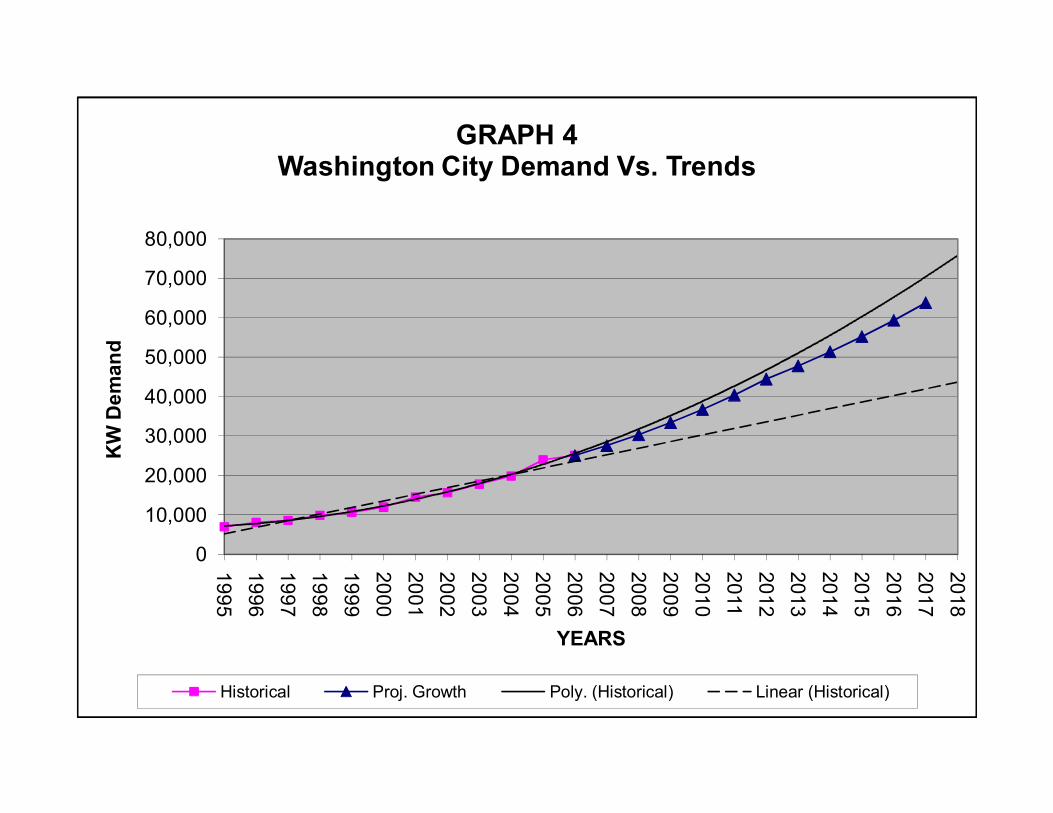
0
10,000
20,000
30,000
40,000
50,000
60,000
70,000
80,000
1995
1996
1997
1998
1999
2000
2001
2002
2003
2004
2005
2006
2007
2008
2009
2010
2011
2012
2013
2014
2015
2016
2017
2018
KW Demand
YEARS
GRAPH 4 Washington City Demand Vs. Trends
Historical Proj. Growth Poly. (Historical) Linear (Historical)

97
98
99
100
Power Factor (lagging)
GRAPH 5Washington City Power Factor History(Measured at Millcreek Meter Point)
91
92
93
94
95
96
97
Power Factor (lagging)
Month & Year

Intermountain Consumer Professional Engineers, Inc.
Washington City: Capital Facilities Study 2007 Page 29
TABLE 8
Washington City Historical Demand vs. Growth
PEAK KW
Year Historical Projected
1995 6,984
1996 8,112
1997 8,590
1998 9,883
1999 10,646
2000 11,956
2001 14,490
2002 15,638
2003 17,782
2004 19,840
2005 23,971
2006 25,093 25,093
2007 27,602
2008 30,363
2009 33,399
2010 36,739
2011 40,413
2012 44,454
2013 47,788
2014 51,372
2015 55,225
2016 59,367
2017 63,819

Intermountain Consumer Professional Engineers, Inc.
Washington City: Capital Facilities Study 2007 Page 30
TABLE 9
WASHINGTON CITY AREA Fully Developed Load Projection with HCP restrictions
Section Dimensions Total Sq.Ft Acres in Useable Acres Estimated Estimated Existing Add'l Expected Expected
Section within City * Developed Portion Undeveloped Portion * Load Load Total
23 5280' X 5280' 27,878,400 640 384 115 269 1,120 3,228 4,348
24 5280' X 5280' 27,878,400 640 32 0 32 0 384 384
19 5706' X 5280' 30,127,680 692 173 0 173 0 2,076 2,076
18 5706' X 5280' 30,127,680 692 415 0 415 0 4,980 4,980
17 5280' X 5280' 27,878,400 640 64 0 64 0 768 768
8 5280' X 5280' 27,878,400 640 320 16 304 156 3,648 3,804
7 5743' X 4984' 28,623,112 657 329 0 329 0 3,948 3,948
6 5187' X 5280' 27,387,360 629 126 0 126 + HCP 0 1,512 1,512
5 5280' X 5558' 29,346,240 674 404 303 101 + HCP 2,951 1,212 4,163
31 5280' X 5743' 30,323,040 696 0 0 HCP 0 0 0
32 5280' X 5280' 27,878,400 640 0 0 HCP 0 0 0
1 5280' X 5280' 27,878,400 640 0 0 HCP 0 0 0
2 5410' X 5558' 30,038,780 690 173 0 173 + HCP 0 2,076 2,076
3 5336' X 5410' 28,867,760 663 265 0 265 + HCP 0 3,180 3,180
34 5280' X 5280' 27,878,400 640 0 0 HCP 0 0 0
35 5280' X 5280' 27,878,400 640 0 0 HCP 0 0 0
36 5280' X 5280' 27,878,400 640 0 0 HCP 0 0 0
9 5280' X 5280' 27,878,400 640 64 10 54 97 648 745
10 5280' X 5280' 27,878,400 640 576 288 288 2,805 3,456 6,261
11 5280' X 5280' 27,878,400 640 544 54 490 526 5,880 6,406
12 5248' X 5302' 27,824,896 639 383 0 383 0 4,596 4,596
13 5280' X 5373' 28,369,440 651 553 184 369 1,792 4,428 6,220
14 5280' X 5373' 28,369,440 651 586 527 59 5,133 708 5,841
15 5280' X 5373' 28,369,440 651 586 527 59 5,133 708 5,841
16 5280' X 5280' 27,878,400 640 128 13 115 127 1,380 1,507
TOTALS: 710,194,068 16,304 6,105 2037 4,068 19,840 48,816 68,656
square feet acres acres acres acres kW Demand kW Demand kW Demand
* (HCP acres not incl.) * (HCP acres not incl.) (2004 Peak)

Intermountain Consumer Professional Engineers, Inc.
Washington City: Capital Facilities Study 2007 Page 31
TABLE 9 (continued)
NOTE: Overall Average: 11.25 kW /Ac.
1) 19,840 kW /2037 acres = 9.74 kW/Acre for existing load
(a) Low kW per acre may be a result of the cooler weather during the summer of 2004.
(b) A lower than expected load peak may be caused in part by electric customers who migrate to cooler areas during the summer heat.
(c) Developed areas may not be fully occupied at the present time.
2) Additional Expected Load calculated at 12 kW per Acre, based on Coral Canyon and Mile Post 13 developments.
3) Application of a general power factor of 90% results in a total expected load of 76,284 kVA.
4) This load projection only includes the portion of Washington City located north of the Virgin River.

Intermountain Consumer Professional Engineers, Inc.
Washington City: Capital Facilities Study 2007
Page 32
SYSTEM IMPROVEMENT SUMMARY
The following Project Summary details the anticipated projects and expenditures necessary to sustain the projected
growth rate for Washington City’s electrical system for the next 5 years. There is greater confidence in projecting
requirements for 2 to 3 years than there is for a 5-year outlook. However it is necessary to forecast future projects due
to the magnitude (and cost) of the modifications necessary should the annual rate of growth established during the last 6
years continue as projected. Substation, distribution, and transmission line requirements need to be addressed to meet
future needs of the City in a timely fashion.
The proposed projects will provide a method for Washington City to plan and budget for the facilities necessary to serve
the anticipated electrical load growth.
The projects were developed based on the following parameters:
1. Existing Washington City Substations would be served at 69 kV and the proposed new substations would be served
at 69kV by a new transmission line to be built from the UAMPS Purgatory Tap to the Coral Canyon Substation, to
the Sienna Hills Substation, to the Parkway North Substation site (future), to the Main St. Substation, and finally to
the Green Springs North Substation (future). The connection to the UAMPS Purgatory Tap, coupled with the new
transmission line to the Main Street Substation, will create a 69 kV loop within the City electrical system.
Installation of switches at each substation tap point will allow line segments within the loop to be de-energized for
maintenance and repair. This arrangement also provides a significant improvement over the radial 69kV system
currently in operation.
2. To minimize expenditures and the capital procurement of new equipment existing substation transformers and
equipment would be utilized as long as possible.
3. Backup capacity would have to be built into the distribution system for load transfers between substations in order
to defer purchasing additional substation transformers, which would only be required for N–1 contingency.

TABLE 10
Washington City Workstudy Estimates Substation, Transmission and Distribution Projects
All Estimates Are In 2007 Dollars
Item Total For Prior Running Item and Description Cost Year Years Total
2007
2007 Total Estimate $0 $0 $0 $020081. Construct 69 kV line with underbuild from 1100 E Increase of estimate used in 2005 Telegraph Rd. to Main St. Substation. 949,000 949,000
2008 Total Estimate $949,000 $949,000 $0 $949,0002009
2009 Total Estimate $0 $0 $949,000 $949,0002010
2010 Total Estimate $0 $0 $949,000 $949,0002011
2011 Total Estimate $0 $0 $949,000 $949,0002012
2012 Total Estimate $0 $0 $949,000 $949,000
Assumptions:1-Basis is Washington City Electrical Load Growth Projection
2-Actual timing will vary depending on system load growth type and timeframe.
3-Cost estimates do not include Right-of-Way acquisition expense.
4-Cost estimates are based on per unit budgetary values only.
No design or engineering work has been done to create these estimates.
5-Substation estimates do not include property purchase.

Intermountain Consumer Professional Engineers, Inc.
Washington City: Capital Facilities Study 2007
Page 34
APPENDIX
TABLE OF CONTENTS
Projected Electrical Load Growth Management Plan –with no action
Projected Electrical Load Growth Management Plan –with load adjustments
Single Circuit 138 kV transmission line cost estimate
Distribution Substation cost estimates
Green Springs North Substation
Sienna Hills Substation
Substation Transformer Loading Guidelines
Substation Equipment Information
Map #3 – Proposed Transmission lines
Map #2012 – Projected 2012 Electrical System

WASHINGTON CITY
SUBSTATION LOAD FORECAST Present System -- 10% growth per year 2007-2012 and 7.5% growth per year 2013-2017
No Mitigation Adjustments
YEAR Transformer
KW-Demand Base Rating
Substation 2004 2005 2006 2007 2008 2009 2010 2011 2012 2013 2014 2015 2016 2017
Staheli
Bank #1 6,761 8,168 7,172 7,889 8,678 9,546 10,501 11,551 12,706 13,659 14,683 15,784 16,968 18,241 10,000 kVA
Main Street
Bank #1 7,519 9,086 6,681 7,349 8,084 8,892 9,782 10,760 11,836 12,723 13,678 14,704 15,806 16,992 10,000 kVA
Bank #2 5,560 6,717 2,451 2,696 2,966 3,262 3,589 3,947 4,342 4,668 5,018 5,394 5,799 6,234 10,000 kVA
Coral Canyon
Bank #1 0 0 4,050 4,455 4,901 5,391 5,930 6,523 7,175 7,713 8,291 8,913 9,582 10,300 12,000 kVA
Buena Vista
Bank #1 0 0 4,739 5,213 5,734 6,308 6,938 7,632 8,395 9,025 9,702 10,430 11,212 12,053 12,000 kVA
Sienna Hills
Bank #1
Green Springs No.
Bank #1
Total 19,840 23,971 25,093 27,602 30,363 33,399 36,739 40,413 44,454 47,788 51,372 55,225 59,367 63,819 54,000 kVA

WASHINGTON CITY
SUBSTATION LOAD FORECAST
Proposed Plan -- 10% growth per year 2007-2012 and
7.5% growth per year 2013-2017 with mitigation adjustments (Rev. 7/26/07)
YEAR Transformer
History History History kW-Demand Base Rating
Substation 2004 2005 2006 2007 2008 2009 2010 2011 2012 2013 2014 2015 2016 2017
Staheli
Bank #1 6,761 8,168 7,172 7,889 6,179 6,797 4,476 4,924 5,416 5,822 6,259 6,728 7,233 7,775 10,000 kVA
Main Street
Bank #1 7,519 9,086 6,681 5,099 5,609 6,170 6,787 7,465 8,212 8,828 9,490 10,202 10,967 11,789 10,000 kVA
Bank #2 5,560 6,717 2,451 4,946 5,441 5,985 6,583 7,241 7,966 8,563 9,205 9,896 10,638 11,436 10,000 kVA
Coral Canyon
Bank #1 0 0 4,050 4,455 4,901 5,390 5,929 6,522 7,174 7,712 8,291 8,912 9,581 10,299 12,000 kVA
Buena Vista
Bank #1 0 0 4,739 5,213 5,734 6,308 6,938 7,632 8,395 9,025 9,701 10,429 11,211 12,053 12,000 kVA
Sienna Hills
Bank #1 0 0 0 0 2,500 2,750 6,026 6,629 7,291 7,838 8,426 9,058 9,738 10,466 12,000 kVA
Green Springs No.
Bank #1 0 0 0 0 0 0 0 0 0 0 0 0 0 0
Total 19,840 23,971 25,093 27,602 30,363 33,399 36,739 40,413 44,454 47,788 51,372 55,225 59,367 63,819 66,000 kVA
2007
1) Transfer 2250 kW from Main St. Bank #1 to Main St. Bank #2.
2008
1) After construction of Sienna Hills Substation is completed, transfer 2500 kW from Staheli Bank #1 to Sienna Hills Bank #1.
2010
1) Transfer 3000 kW from Staheli Bank #1 to Sienna Hills Bank #1.
NOTES:1) This plan has been developed using a standard growth rate of 10% per year for 2007-2012 and 7.5% for 2013-2017.
2) If the rate of growth and electrical usage changes from this rate, this plan will need to be updated accordingly.
3) The attempt has been made to keep bank loading to approximately one-half of the 65 degree rating of the
substation transfomer. This will allow load to be tranferred to an adjacent substation or transformer during
maintenance of substation equipment or during an emergency situation, without exceeding the design rating
of the substation transformer.
4) This plan recognizes that necessary distribution circuits of adequate capacity will have to be built to accommodate
proposed load transfers. Appropriate switchgear (VFI's, oil switches, etc.) will need to be included for switching.

PROJECT: Telegraph Road - Green Springs 138 kV Line BASIS OF ESTIMATE:
DESCRIPTION: Cost Estimate Summary CODE A - (Schematic Design)
CODE B - (Preliminary Design)
CODE C - (Final Design) 100%
ENGINEER: Les Bell OTHER - Conceptual Configuration
ESTIMATOR: Les Bell CHECKED:
DESCRIPTION UNIT TOTAL TOTAL PER TOTAL TOTAL
QTY UNIT MH MH LABOR $ UNIT MATERIAL COST ($)
Wood Poles 1 LS 356.00 356.00 $25,632.00 $157,150.00 $157,150.00 $182,782.00
Steel Poles 1 LS 1,257.80 1,257.80 $90,561.60 $589,982.50 $589,982.50 $680,544.10
Trans. Tangent PTA 2 1/2" 1 LS 372.00 372.00 $26,784.00 $87,947.00 $87,947.00 $114,731.00
Trans. Tangent PTA 3" 1 LS 264.00 264.00 $19,008.00 $78,254.00 $78,254.00 $97,262.00
Trans. DDE PTA 1 LS 384.00 384.00 $27,648.00 $41,520.00 $41,520.00 $69,168.00
Dist. Tangent PTA 1 LS 672.00 672.00 $48,384.00 $67,200.00 $67,200.00 $115,584.00
Dist. DDE PTA 1 LS 216.00 216.00 $15,552.00 $15,264.00 $15,264.00 $30,816.00
138 kV Switches 1 LS 180.00 180.00 $12,960.00 $105,000.00 $105,000.00 $117,960.00
Install 1272 kcmil ACSR 121,000 Ft. 0.015 1,815.00 $130,680.00 $2.15 $260,150.00 $390,830.00
Install 477 kcmil ACSR 77,500 Ft. 0.015 1,162.50 $83,700.00 $1.35 $104,625.00 $188,325.00
Install 3/8" EHS Steel 20,000 Ft. 0.011 220.00 $15,840.00 $0.35 $7,000.00 $22,840.00
Concrete Foundations 1 LS 1,120.00 1,120.00 $80,640.00 $380,400.00 $380,400.00 $461,040.00
Wood Pole Grounds 31 Ea. 1.50 46.50 $3,348.00 $100.00 $3,100.00 $6,448.00
Access Road Const/Maint 1 LS 350.00 350.00 $25,200.00 $25,200.00
ROW Restoration/Seeding 1 LS 250.00 250.00 $18,000.00 $5,000.00 $5,000.00 $23,000.00
SUBTOTALS 8,665.80 $623,937.60 $1,902,592.50 $2,526,530.10
Average Labor Rate $72.00
Subtotal Labor Hours/$ 8,665.80 $623,937.60 $623,937.60
Subtotal Material $1,902,592.50 $1,902,592.50
Contractor Markup On Material $76,103.70
Sales Tax (7%) $133,181.48
Special Equipment Rental (Total Labor Hours / 5 x $50.00) $86,658.00
Contractor Mobilization/Demobilization/Bonding $56,449.47
TOTAL ESTIMATED CONSTRUCTION COST $2,878,922.74
Engineering $172,735.36
Construction Period Services $71,973.07
PacifiCorp Coordination $35,000.00
Commissioning $10,000.00
Surveying - Subcontractor $45,000.00
Geotech - Subcontractor $30,000.00
TOTAL ESTIMATED ENGINEER'S COST $364,708.43
Contingency $486,544.68
Right Of Way Acquisition $96,195.92
Right Of Way Payments $857,331.211
TOTAL ESTIMATE $4,683,702.98
* Cost estimate excludes right of way costs.
WASHINGTON CITY
Total Cost Estimate Summary
QUANTITY LABOR MATERIAL $
1100 EAST/TELEGRAPH ROAD- GREEN SPRINGS 138 KV LINE
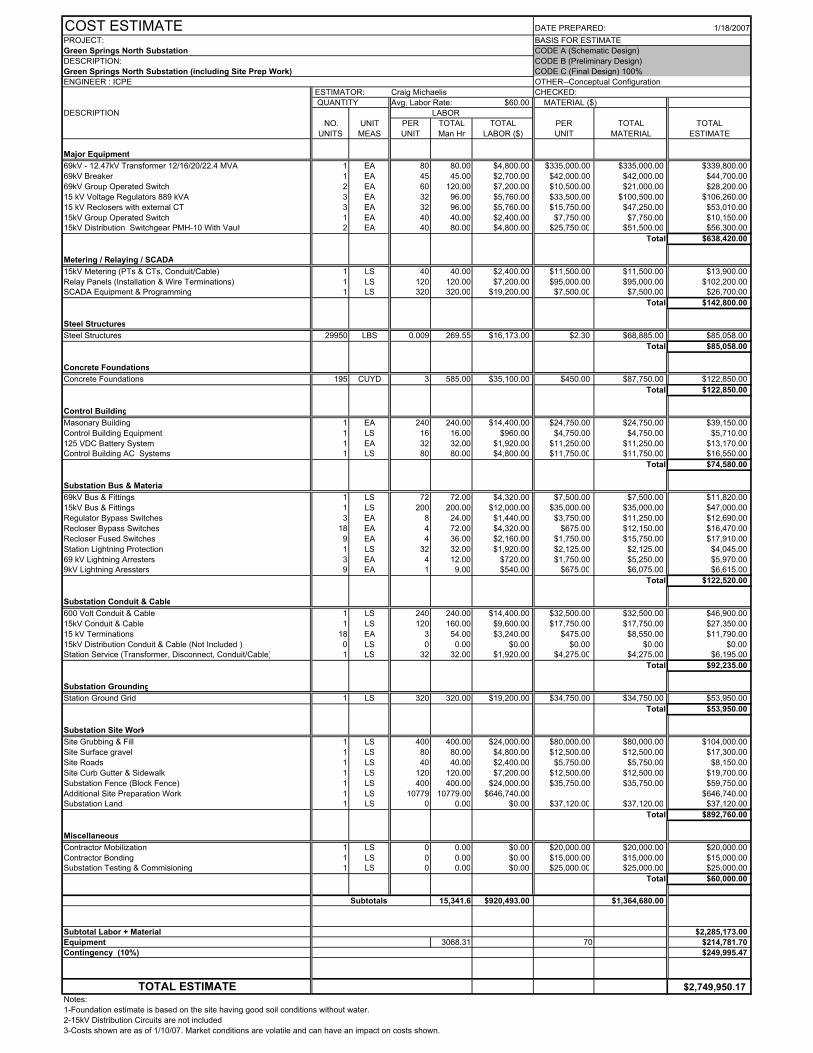
COST ESTIMATE DATE PREPARED: 1/18/2007
PROJECT: BASIS FOR ESTIMATE
Green Springs North Substation CODE A (Schematic Design)
DESCRIPTION: CODE B (Preliminary Design)
Green Springs North Substation (including Site Prep Work) CODE C (Final Design) 100%
ENGINEER : ICPE OTHER--Conceptual Configuration
ESTIMATOR: Craig Michaelis CHECKED:
QUANTITY Avg. Labor Rate: $60.00 MATERIAL ($)
DESCRIPTION LABOR
NO. UNIT PER TOTAL TOTAL PER TOTAL TOTAL
UNITS MEAS UNIT Man Hr LABOR ($) UNIT MATERIAL ESTIMATE
Major Equipment
69kV - 12.47kV Transformer 12/16/20/22.4 MVA 1 EA 80 80.00 $4,800.00 $335,000.00 $335,000.00 $339,800.00
69kV Breaker 1 EA 45 45.00 $2,700.00 $42,000.00 $42,000.00 $44,700.00
69kV Group Operated Switch 2 EA 60 120.00 $7,200.00 $10,500.00 $21,000.00 $28,200.00
15 kV Voltage Regulators 889 kVA 3 EA 32 96.00 $5,760.00 $33,500.00 $100,500.00 $106,260.00
15 kV Reclosers with external CT 3 EA 32 96.00 $5,760.00 $15,750.00 $47,250.00 $53,010.00
15kV Group Operated Switch 1 EA 40 40.00 $2,400.00 $7,750.00 $7,750.00 $10,150.0015kV Distribution Switchgear PMH-10 With Vault 2 EA 40 80.00 $4,800.00 $25,750.00 $51,500.00 $56,300.00
Total $638,420.00
Metering / Relaying / SCADA
15kV Metering (PTs & CTs, Conduit/Cable) 1 LS 40 40.00 $2,400.00 $11,500.00 $11,500.00 $13,900.00
Relay Panels (Installation & Wire Terminations) 1 LS 120 120.00 $7,200.00 $95,000.00 $95,000.00 $102,200.00SCADA Equipment & Programming 1 LS 320 320.00 $19,200.00 $7,500.00 $7,500.00 $26,700.00
Total $142,800.00
Steel Structures
Steel Structures 29950 LBS 0.009 269.55 $16,173.00 $2.30 $68,885.00 $85,058.00
Total $85,058.00
Concrete Foundations
Concrete Foundations 195 CUYD 3 585.00 $35,100.00 $450.00 $87,750.00 $122,850.00
Total $122,850.00
Control Building
Masonary Building 1 EA 240 240.00 $14,400.00 $24,750.00 $24,750.00 $39,150.00
Control Building Equipment 1 LS 16 16.00 $960.00 $4,750.00 $4,750.00 $5,710.00
125 VDC Battery System 1 EA 32 32.00 $1,920.00 $11,250.00 $11,250.00 $13,170.00Control Building AC Systems 1 LS 80 80.00 $4,800.00 $11,750.00 $11,750.00 $16,550.00
Total $74,580.00
Substation Bus & Material
69kV Bus & Fittings 1 LS 72 72.00 $4,320.00 $7,500.00 $7,500.00 $11,820.00
15kV Bus & Fittings 1 LS 200 200.00 $12,000.00 $35,000.00 $35,000.00 $47,000.00
Regulator Bypass Switches 3 EA 8 24.00 $1,440.00 $3,750.00 $11,250.00 $12,690.00
Recloser Bypass Switches 18 EA 4 72.00 $4,320.00 $675.00 $12,150.00 $16,470.00
Recloser Fused Switches 9 EA 4 36.00 $2,160.00 $1,750.00 $15,750.00 $17,910.00
Station Lightning Protection 1 LS 32 32.00 $1,920.00 $2,125.00 $2,125.00 $4,045.00
69 kV Lightning Arresters 3 EA 4 12.00 $720.00 $1,750.00 $5,250.00 $5,970.009kV Lightning Aressters 9 EA 1 9.00 $540.00 $675.00 $6,075.00 $6,615.00
Total $122,520.00
Substation Conduit & Cable
600 Volt Conduit & Cable 1 LS 240 240.00 $14,400.00 $32,500.00 $32,500.00 $46,900.00
15kV Conduit & Cable 1 LS 120 160.00 $9,600.00 $17,750.00 $17,750.00 $27,350.00
15 kV Terminations 18 EA 3 54.00 $3,240.00 $475.00 $8,550.00 $11,790.00
15kV Distribution Conduit & Cable (Not Included ) 0 LS 0 0.00 $0.00 $0.00 $0.00 $0.00Station Service (Transformer, Disconnect, Conduit/Cable) 1 LS 32 32.00 $1,920.00 $4,275.00 $4,275.00 $6,195.00
Total $92,235.00
Substation Grounding
Station Ground Grid 1 LS 320 320.00 $19,200.00 $34,750.00 $34,750.00 $53,950.00
Total $53,950.00
Substation Site Work
Site Grubbing & Fill 1 LS 400 400.00 $24,000.00 $80,000.00 $80,000.00 $104,000.00
Site Surface gravel 1 LS 80 80.00 $4,800.00 $12,500.00 $12,500.00 $17,300.00
Site Roads 1 LS 40 40.00 $2,400.00 $5,750.00 $5,750.00 $8,150.00
Site Curb Gutter & Sidewalk 1 LS 120 120.00 $7,200.00 $12,500.00 $12,500.00 $19,700.00
Substation Fence (Block Fence) 1 LS 400 400.00 $24,000.00 $35,750.00 $35,750.00 $59,750.00
Additional Site Preparation Work 1 LS 10779 10779.00 $646,740.00 $646,740.00Substation Land 1 LS 0 0.00 $0.00 $37,120.00 $37,120.00 $37,120.00
Total $892,760.00
Miscellaneous
Contractor Mobilization 1 LS 0 0.00 $0.00 $20,000.00 $20,000.00 $20,000.00
Contractor Bonding 1 LS 0 0.00 $0.00 $15,000.00 $15,000.00 $15,000.00Substation Testing & Commisioning 1 LS 0 0.00 $0.00 $25,000.00 $25,000.00 $25,000.00
Total $60,000.00
Subtotals 15,341.6 $920,493.00 $1,364,680.00
Subtotal Labor + Material $2,285,173.00
Equipment 3068.31 70 $214,781.70
Contingency (10%) $249,995.47
TOTAL ESTIMATE $2,749,950.17Notes:
1-Foundation estimate is based on the site having good soil conditions without water.
2-15kV Distribution Circuits are not included
3-Costs shown are as of 1/10/07. Market conditions are volatile and can have an impact on costs shown.

COST ESTIMATE DATE PREPARED: 1/11/2007 0:00
PROJECT: BASIS FOR ESTIMATE
Sienna Hills Substation CODE A (Schematic Design)
DESCRIPTION: CODE B (Preliminary Design)
Sienna Hills Substation (including Site Prep Work) CODE C (Final Design) 100%
ENGINEER : ICPE OTHER--Conceptual Configuration
ESTIMATOR: Craig Michaelis CHECKED:
QUANTITY Avg. Labor Rate: $60.00 MATERIAL ($)
DESCRIPTION LABOR
NO. UNIT PER TOTAL TOTAL PER TOTAL TOTAL
UNITS MEAS UNIT Man Hr LABOR ($) UNIT MATERIAL ESTIMATE
Major Equipment
69kV - 12.47kV Transformer 12/16/20/22.4 MVA 1 EA 80 80.00 $4,800.00 $335,000.00 $335,000.00 $339,800.00
69kV Breaker 1 EA 45 45.00 $2,700.00 $42,000.00 $42,000.00 $44,700.00
69kV Group Operated Switch 2 EA 60 120.00 $7,200.00 $10,500.00 $21,000.00 $28,200.00
15 kV Voltage Regulators 889 kVA 3 EA 32 96.00 $5,760.00 $33,500.00 $100,500.00 $106,260.00
15 kV Reclosers with external CT 3 EA 32 96.00 $5,760.00 $15,750.00 $47,250.00 $53,010.00
15kV Group Operated Switch 1 EA 40 40.00 $2,400.00 $7,750.00 $7,750.00 $10,150.0015kV Distribution Switchgear PMH-10 With Vault 2 EA 40 80.00 $4,800.00 $25,750.00 $51,500.00 $56,300.00
Total $638,420.00
Metering / Relaying / SCADA
15kV Metering (PTs & CTs, Conduit/Cable) 1 LS 40 40.00 $2,400.00 $11,500.00 $11,500.00 $13,900.00
Relay Panels (Installation & Wire Terminations) 1 LS 120 120.00 $7,200.00 $95,000.00 $95,000.00 $102,200.00SCADA Equipment & Programming 1 LS 320 320.00 $19,200.00 $7,500.00 $7,500.00 $26,700.00
Total $142,800.00
Steel Structures
Steel Structures 29950 LBS 0.009 269.55 $16,173.00 $2.30 $68,885.00 $85,058.00
Total $85,058.00
Concrete Foundations
Concrete Foundations 195 CUYD 3 585.00 $35,100.00 $450.00 $87,750.00 $122,850.00
Total $122,850.00
Control Building
Masonary Building 1 EA 240 240.00 $14,400.00 $24,750.00 $24,750.00 $39,150.00
Control Building Equipment 1 LS 16 16.00 $960.00 $4,750.00 $4,750.00 $5,710.00
125 VDC Battery System 1 EA 32 32.00 $1,920.00 $11,250.00 $11,250.00 $13,170.00Control Building AC Systems 1 LS 80 80.00 $4,800.00 $11,750.00 $11,750.00 $16,550.00
Total $74,580.00
Substation Bus & Material
69kV Bus & Fittings 1 LS 72 72.00 $4,320.00 $7,500.00 $7,500.00 $11,820.00
15kV Bus & Fittings 1 LS 200 200.00 $12,000.00 $35,000.00 $35,000.00 $47,000.00
Regulator Bypass Switches 3 EA 8 24.00 $1,440.00 $3,750.00 $11,250.00 $12,690.00
Recloser Bypass Switches 18 EA 4 72.00 $4,320.00 $675.00 $12,150.00 $16,470.00
Recloser Fused Switches 9 EA 4 36.00 $2,160.00 $1,750.00 $15,750.00 $17,910.00
Station Lightning Protection 1 LS 32 32.00 $1,920.00 $2,125.00 $2,125.00 $4,045.00
69 kV Lightning Arresters 3 EA 4 12.00 $720.00 $1,750.00 $5,250.00 $5,970.009kV Lightning Aressters 9 EA 1 9.00 $540.00 $675.00 $6,075.00 $6,615.00
Total $122,520.00
Substation Conduit & Cable
600 Volt Conduit & Cable 1 LS 240 240.00 $14,400.00 $32,500.00 $32,500.00 $46,900.00
15kV Conduit & Cable 1 LS 120 160.00 $9,600.00 $17,750.00 $17,750.00 $27,350.00
15 kV Terminations 18 EA 3 54.00 $3,240.00 $475.00 $8,550.00 $11,790.00
15kV Distribution Conduit & Cable (Not Included ) 0 LS 0 0.00 $0.00 $0.00 $0.00 $0.00Station Service (Transformer, Disconnect, Conduit/Cable) 1 LS 32 32.00 $1,920.00 $4,275.00 $4,275.00 $6,195.00
Total $92,235.00
Substation Grounding
Station Ground Grid 1 LS 320 320.00 $19,200.00 $34,750.00 $34,750.00 $53,950.00
Total $53,950.00
Substation Site Work
Site Grubbing & Fill 1 LS 400 400.00 $24,000.00 $80,000.00 $80,000.00 $104,000.00
Site Surface gravel 1 LS 80 80.00 $4,800.00 $12,500.00 $12,500.00 $17,300.00
Site Roads 1 LS 40 40.00 $2,400.00 $5,750.00 $5,750.00 $8,150.00
Site Curb Gutter & Sidewalk 1 LS 120 120.00 $7,200.00 $12,500.00 $12,500.00 $19,700.00
Substation Fence (Block Fence) 1 LS 400 400.00 $24,000.00 $35,750.00 $35,750.00 $59,750.00
Additional Site Preparation Work 1 LS 7278 7,278.00 $436,680.00 $436,680.00Substation Land 1 LS 0 0.00 $0.00 $37,120.00 $37,120.00 $37,120.00
Total $682,700.00
Miscellaneous
Contractor Mobilization 1 LS 0 0.00 $0.00 $20,000.00 $20,000.00 $20,000.00
Contractor Bonding 1 LS 0 0.00 $0.00 $15,000.00 $15,000.00 $15,000.00Substation Testing & Commisioning 1 LS 0 0.00 $0.00 $25,000.00 $25,000.00 $25,000.00
Total $60,000.00
Subtotals 11,840.6 $710,433.00 $1,364,680.00
Subtotal Labor + Material $2,075,113.00
Equipment 2368.11 70 $165,767.70
Contingency (10%) $224,088.07
TOTAL ESTIMATE $2,464,968.77Notes:
1-Foundation estimate is based on the site having good soil conditions without water.
2-15kV Distribution Circuits are not included
3-Costs shown are as of 1/10/07. Market conditions are volatile and can have an impact on costs shown.

Substation Transformer Loading Guidelines per ANSI/IEEE C57.92-1981
1. Assumes that the daily average ambient temperature is between 0oC to 30
oC and 30
oC to
50oC.
2. Temperature rise of transformer oil is assumed to be 65oC.
3. These numbers are usable for daily average ambient temperature range of 0oC to 50
oC (32
oF to 122
oF).
Decrease load rating by 1% for each 1oC rise Increase Loading by 0.75% for each 1
oC drop
of average ambient temperature above 30oC. of average ambient temperature below 30
oC .
OA/FA or OA/FA/FA type cooling = 1% deduction OA/FA or OA/FA/FA type cooling = 0.75% increase
Substation Transformer OA/FA/FA 65oC nameplate rating: 22,400 Substation Transformer OA/FA/FA 65
oC nameplate rating: 22,400
Daily Average % Load Reduction Revised Transformer RatingoF Daily Average % Increase Allowed Revised Transformer Rating
oF
Ambient Temp. Ambient Temp.
kVA kVA
300C 0 22,400 86.0 30
0C 0.00 22,400 86.0
310C 1 22,176 87.8 29
0C 0.75 22,568 84.2
320C 2 21,952 89.6 28
0C 1.50 22,736 82.4
330C 3 21,728 91.4 27
0C 2.25 22,904 80.6
340C 4 21,504 93.2 26
0C 3.00 23,072 78.8
350C 5 21,280 95.0 25
0C 3.75 23,240 77.0
400C 10 20,160 104.0 20
0C 7.50 24,080 68.0
450C 15 19,040 113.0 15
0C 11.25 24,920 59.0
500C 20 17,920 122.0 10
0C 15.00 25,760 50.0
5oC 18.75 26,600 41.0
0oC 22.50 27,440 32.0
Note:
The Daily Average Ambient Temperature is defined as the high ambient temperature plus the low ambient temperature (on the same day)
divided by two for each day of the month. The sum of these daily averages divided by the number of days in the month generates the Average
Daily value for the month. The ANSI/IEEE C57.92-1981 standard recommends using this average daily ambient temperature value when
applying the above chart to a substation transformer.

Washington City Substation Equipment Information July 2007
Staheli Transformer: Serial # H880407
General Electric-Class OA/FA –3 phase
Voltage Rating = 43800 X 67000 – 12470Y/7200 X 24940Y/14400 – 5 tap positions
kVA =10,000/12,500 @ 55C &14,400 @65C
Impedance =7.53%
Staheli Regulators: Cooper, McGraw Edison VR 32 type A
Voltage Rating = 7620/13200y
Load Amps = 656/668
KVA Rating: 500/509
5 A & 5 C Control Panels
Staheli Reclosers: Cooper Type WE 15.5 kV
Control: Kyle 4 C
Interrupting Capacity Rating: 10 kA
Continuous Current Rating: 560 Amps
Main Street 1 Transformer: Serial # AO363V
Waukesha Class OA/FA – 3 phase
Voltage Rating = 67000 55C BIL 350 kV – 12470y/7200 55C BIL 110 kV
MVA = 10/12.5 @ 55C & 14.4 @65C – 5 tap positions.
Impedance = 5.41%
Main Street 1 Regulators Cooper, McGraw-Edison VR 32 type A
Voltage Rating = 7620/13200Y (Set for 7200/12470Y operation)
Load Amps = 656/668
kVA Rating = 500/509
Bank #1: Type 5A Control Panels
Main Street 1 Reclosers: Cooper Type VWE 15.5 KV
Control: Kyle 4 C
Interrupting Capacity Rating: 12 kA
Continuous Current Rating: 800 A
Main Street 2 Transformer: Serial # 47010MAO54
Virginia Class OA/FA – 3 Phase
Voltage Rating = 67000 55 C BIL 350 kV – 12470y/7200 55C BIL 110 kV
MVA = 10/12.5 @ 55C &14.4 @ 65C - 5 tap positions.
Impedance = 5.10%
Main Street 2 Regulators Cooper, McGraw-Edison VR 32 type A
Voltage Rating = 7620/13200Y (Set for 7200/12470Y operation)
Load Amps = 656/668
kVA Rating = 500/509
Bank #2: Type 5E Control Panels

Washington City Substation Equipment Information July 2007
Main Street 2 Reclosers: Cooper Type VWE 15.5 KV
Control: Kyle 4 C
Interrupting Capacity Rating: 12 kA
Continuous Current Rating: 800 A
Coral Canyon Transformer: Serial # 47012MA071– A655A
Virginia Class OA/FA – 3 Phase
Voltage Rating = 67000 55C BIL 350 kV – 12470y/7200 55C BIL 110 kV
MVA= 12/16/20 @ 55C & 22.4 @ 65C – 5 tap positions.
Impedance = 7.72%
Coral Canyon 69kV Breaker: Siemens Type SPS2-72.5 – 40.2
Serial # S.O. 54751– 2
Rated Continuous Current 1200 Amp
Coral Canyon Regulators: Cooper Power Systems VR – 32
Voltage Rating 7200/13200Y
Load Amps: 1164/1303 ONAF
KVA Rating: 887/994 ONAF
Coral Canyon Reclosers: G&W Recloser Solid Dielectric Switch
Max Volt 15.5
BIL 110kV
Rated Continuous Current: 800 Amp (RMS)
Buena Vista Transformer: Serial # 47012MA071– A655B
Virginia Class OA/FA – 3 Phase
Voltage Rating = 67000 55C BIL 350 kV – 12470y/7200 55C BIL 110 kV
MVA = 12/16/20 @ 55C & 22.4 @ 65C – 5 tap positions.
Impedance = 7.82%
Buena Vista 69kV Breaker: Siemens Type SPS2 –72.5 – 40.2
Serial # S.O. 54751–1
Rated Continuous Current: 1200 Amp
Buena Vista Regulators: Cooper Power Systems VR –32
Voltage Rating 7200/13200Y
Load Amps 1164/1303 ONAF
KVA Rating 887/994 ONAF
Buena Vista Reclosers: G&W Recloser Solid Dielectric Switch
Max Volt 15.5kV
BIL 110kV
Rated Continuous Current: 800 Amp (RMS)


