274

Final D
raft
June
12,
202
0

Final D
raft
June
12,
202
0

Final D
raft
June
12,
202
0

Introductory Section Financial Section (continued)
3 Letter of Transmittal Required Supplementary Information (Unaudited)—12 Professional Awards Health Care Trust Funds14 Board Chairman's Report 104 Schedule of Changes in Net OPEB Liability16 Report of the Colorado PERA Audit Committee 106 Schedule of Net OPEB Liability18 Board of Trustees 107 Schedule of Contributions from Employers and Other20 Administrative Organizational Chart and Executive Management Contributing Entities21 Consultants 108 Schedule of Investment Returns
109 Notes to the Required Supplementary Information (Unaudited) -Financial Section Health Care Trust Funds
109 Note 1—Significant Changes in Plan Provisions Affecting25 Report of the Independent Auditor Trends in Actuarial Information29 Management's Discussion and Analysis (Unaudited) 109 Note 2—Significant Changes in Assumptions or Other Inputs
Affecting Trends in Actuarial InformationBasic Financial Statements 112 Note 3—Methods and Assumptions Used in Calculations of ADCFund Financial Statements
44 Statements of Fiduciary Net Position Supplementary Schedules46 Statements of Changes in Fiduciary Net Position 114 Schedule of Administrative Expenses48 Notes to the Financial Statements 116 Schedule of Other Additions48 Note 1—Plan Description 116 Schedule of Other Deductions58 Note 2—Summary of Significant Accounting Policies 117 Schedule of Investment Expenses59 Note 3—Interfund Transfers and Balances 117 Schedule of Payments to Consultants60 Note 4—Contributions64 Note 5—Investments Investment Section74 Note 6—Derivative Instruments Defined Benefit Plans74 Note 7—Commitments and Contingencies 121 Introduction75 Note 8—Voluntary Investment Program, Defined Contribution 121 Report on Investment Activity
Retirement Plan, and Deferred Compensation Plan 123 Investment Brokers/Advisers (Internally Managed Assets)77 Note 9—Health Care Trust Funds-Defined Benefit Health 123 Schedule of Commissions
Care Plans 124 Schedule of Investment Expenses80 Note 10—Net Pension Liability of the Division Trust Funds 124 Schedule of Internal and External Asset Management83 Note 11—Net OPEB Liability of the Health Care Trust Funds 125 Schedule of Investment Income and Expense by Asset Class86 Note 12—Subsequent Events 125 Schedule of Private Market Investment Contributions,
Distributions, and Paid Carried InterestRequired Supplementary Information (Unaudited)— 126 Investment SummaryDivision Trust Funds 127 Schedule of Investment Results
88 Schedule of Changes in Net Pension Liability 129 Fund Performance Evaluation93 Schedule of Net Pension Liability 131 Profile of Investments in Colorado96 Schedule of Employer and Nonemployer Contributions 132 Largest Equity Holdings by Fair Value98 Schedule of Investment Returns 132 Largest Fixed Income Holdings by Fair Value99 Notes to the Required Supplementary Information (Unaudited) -
Division Trust Funds Defined Contribution and Deferred Compensation Plans99 Note 1—Significant Changes in Plan Provisions Affecting 133 Report on Investment Activity
Trends in Actuarial Information 136 Schedule of Investment Results100 Note 2—Significant Changes in Assumptions or Other Inputs 137 Investment Summary
Affecting Trends in Actuarial Information103 Note 3—Methods and Assumptions Used in Calculations of ADC
Table of Contents
Final D
raft
June
12,
202
0

Actuarial Section Statistical Section
141 Actuary's Certification Letter 207 Overview208 Changes in Fiduciary Net Position
Division Trust Funds—Pension 219 Benefits and Refund Deductions From Fiduciary Net147 Actuarial Topics Position by Type155 Actuarial Assumptions: Exhibits A-I 224 Member and Benefit Recipient Statistics161 Summary of Funding Progress 225 Breakdown of Membership by Percentage161 Solvency Test 226 Schedule of Average Retirement Benefits Payable–All164 Unfunded Actuarial Accrued Liability Division Trust Funds167 Actuarial Gains and Loses 226 Schedule of Average Retirement Benefits Payable169 Actuarial Valuation Results 229 Colorado PERA Benefit Payments–All Division Trust Funds176 Plan Data 231 Schedule of Retirees and Survivors by Types of Benefits
236 Schedule of Average Benefit PaymentsHealth Care Trust Funds—OPEB 243 Schedule of Contribution Rate History186 Actuarial Topics 251 Principal Participating Employers191 Actuarial Assumptions: Exhibits J-N 254 Schedule of Affiliated Employers194 Summary of Funding Progress194 Solvency Test Commonly Used Acronyms195 Unfunded Actuarial Accrued Liability197 Actuarial Gains and Losses 265 Commonly Used Acronyms197 Actuarial Valuation Results201 Plan Data
Table of Contents
Final D
raft
June
12,
202
0

Final D
raft
June
12,
202
0

Final D
raft
June
12,
202
0

June 19, 2020
Dear Colorado PERA Members, Benefit Recipients, Employers, andMembers of the Board of Trustees:
Ron BakerExecutive Director
This Comprehensive Annual Financial Report (CAFR) prepared by the PublicEmployees’ Retirement Association of Colorado (PERA) details the plan’sperformance from January 1, 2019, through December 31, 2019.
As I write this letter, the world is still reeling from the global pandemic thathas had a profound impact to our economy, our citizens, and our everydaylives. Throughout this difficult and uncertain time, many PERA memberswere on the front lines of this crisis. Your work serving all Coloradans is vitaland essential in countless ways. We are very proud of the work our membersdo for Colorado, and it is our privilege to serve you.
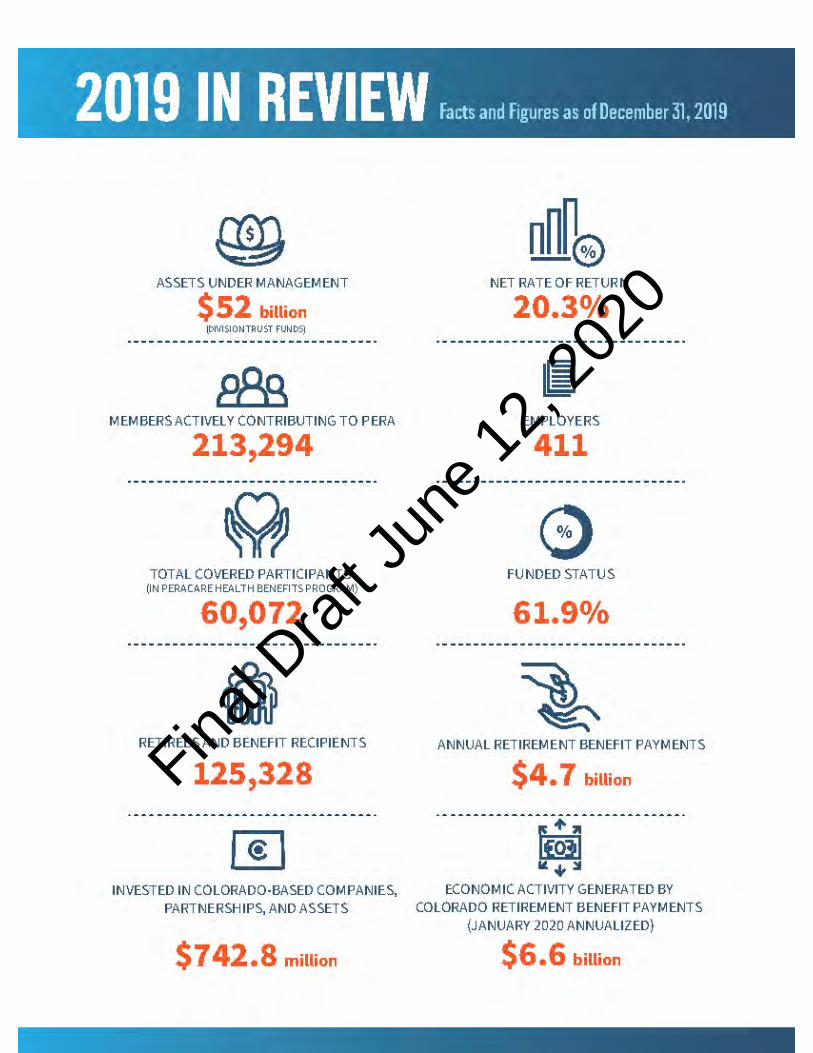
Entering this crisis, PERA was showing signs of strength and makingprogress toward our path to full funding. Aided by a robust global equitymarket, our 2019 investment returns were strong, and for the year endedDecember 31, 2019, the defined benefit funds had a time-weighted rate ofreturn of 20.3 percent net-of-fees. PERA’s total fund policy benchmarkreturned 19.8 percent for 2019.
Positive investment returns are only one component of a plan’s funded status. The degree to which demographic andemployment assumptions align with actual experience are also crucial, and PERA will continue monitoring thesefactors closely.
While we recognize the strong 2019 performance and the effect of the first full year of Senate Bill (SB) 18-200 reforms,the fiscal impact of the current pandemic permeates throughout the public sector of Colorado and includes PERA. Asthe Joint Budget Committee (JBC) grappled with balancing the State’s budget, the Committee moved forward withintroduction of two bills in 2020 as part of the budget-related package concerning PERA:
House Bill (HB) 20-1379: Concerning Suspending the Direct Distribution to the Public Employees’ Retirement Association forthe 2020-21 State Fiscal Year
SB 18-200 requires that a direct distribution of $225 million from State funds be paid annually to PERA, allocated tothe State, School, Judicial, and DPS Divisions. This direct distribution payment is to continue annually until theunfunded liabilities for each division receiving the payments are paid down. HB 20-1379 will suspend the July 1, 2020,$225 million direct distribution payment from the State to PERA for the 2020-21 State fiscal year. This one-yearsuspension means PERA will not receive a direct distribution until the payment scheduled July 1, 2021.
House Bill (HB) 20-1394: Concerning a Modification to the Contribution Rates to the Public Employees’ Retirement Associationfor the Judicial Division of the Association for Certain Fiscal Years
For the State’s fiscal years 2020-21 and 2021-22 only, this bill will decrease the employer contribution rate foremployers in the Judicial Division by 5.0 percent and increase the member contribution rate for employees in theJudicial Division by 5.0 percent. For the State’s 2020-21 fiscal year, the employer contribution rate is decreased from13.91 percent to 8.91 percent of salary and the member contribution rate is increased from 9.5 percent to 14.5 percent ofsalary. For the State’s 2021-22 fiscal year, the employer contribution rate is decreased from 13.91 percent to 8.91 percentof salary and the member contribution rate is increased from 10.0 percent to 15.0 percent of salary. This does not applyto the employer or member contribution rates for judges employed by the Denver County Court.
The contribution rates for the Judicial Division will continue to be subject to the automatic adjustment provision(AAP) in PERA law. More information about these changes can be found in Note 12 of the Notes to the FinancialStatements in the Financial Section.
Mail: PO Box 5800, Denver, CO 80217-5800 | 1.800.759.PERA (7372) | www.copera.org
Introductory Section
LETTER OF TRANSMITTAL
Colorado PERA Comprehensive Annual Financial Report 2019 � Introductory Section 3
Final D
raft
June
12,
202
0

A strong and sustainable PERA plan is important notonly to our membership, but also to the state ofColorado, where our members live and work in ourcommunities and support our economy. PERAretirement distributions are a steady source of reliable,predictable income for PERA retirees in communitiesacross Colorado. These distributions provide $6.6 billionin economic output for the state, adding critical valueand stimulus to the economy. The 2019 Colorado PERAEconomic and Fiscal Impacts Report, prepared by theeconomic and business analysis firm Pacey Economics,shows that the billions of dollars PERA pays indistributions to more than 104,000 Colorado residentshave a significant benefit to local economies in everycorner of the state.
The modifications from SB 18-200 and 2019’s stronginvestment returns have improved PERA’s fundedstatus and are crucial in building resilience for the plan.However, the COVID-19 crisis will present somechallenges for PERA. Like most defined benefit pensionplans, we expect an impact on our investment gains/demographic experience and future performance.The extent of the impact is uncertain at this time.However, a highly likely outcome is that, when 2020concludes, the automatic adjustment will be triggered. Ifthis occurs, the results will be announced in June 2021,with the contribution increases and a decrease in theAnnual Increase, taking effect in July 2022.
PERA has weathered many unprecedented challengesespecially over the past two decades, and we willcontinue to make our way through these uncertain timesthe same way we have made it through other volatilemarkets. We will continue to be prudent with ourmembers’ and employers’ contributions and beresponsible stewards in making investments on behalfof our membership.
Challenging times present opportunities, and we plan tomeet these challenges on behalf of our membership, inpartnership with stakeholders and constituents, andwith steady leadership as we remain diligent andfocused on fortifying PERA’s sustainability for the longterm knowing that many across Colorado depend onPERA for their retirement security.
2019 LegislationDuring the 2019 legislative session, two bills affectingPERA were introduced, one of which was signedinto law.
House Bill 19-1217: PERA Local Government DivisionMember Contribution RateGovernor Polis signed this bill into law on May 20, 2019,and it eliminated the scheduled 2.0 percent increase inthe member contribution rate for the Local GovernmentDivision that was included in legislation passed in 2018.That legislation increased contributions paid by allPERA members. While this new bill eliminates those
increased contributions for members in the LocalGovernment Division, all members are still subject toany adjustments in contributions required to keep PERAon the path to full funding in 30 years. Contributions forall members can increase (or decrease) by up to0.5 percent per year.
The PERA Board of Trustees' (Board) originalrecommendation to the General Assembly presented inlate 2017 included increases in member contributionsacross all divisions.
House Bill 19-1270: PERA Board Assess Climate-Related Financial RisksThe bill would have required that the PERA Board retaina third-party organization by October 31, 2019, toperform a study to include:
• A comprehensive analysis of any climate-relatedfinancial risk to PERA’s portfolio, and exposure of thefund to long-term risks.
• A summary of climate-related financial risk-relatedengagement activities undertaken by PERA.
• A description of additional action that should betaken, or planned to be taken, by PERA to addressclimate-related financial risk, including a list ofproxy votes and shareholder proposals initiated bythe Board.
The PERA Board had concerns about the redundancy ofthis study with other required reporting and directedstaff to continue to work with the bill sponsors andmembers of the General Assembly to educate them onthese concerns.
This bill was postponed indefinitely by the HouseFinance Committee on April 8, 2019.
Economic Environment2019 started out in what would become the longestgovernment shutdown in U.S. history. Protracted tradenegotiations with China and four Federal Reserve (Fed)rate increases in 2018, combined with the governmentshutdown, added to concerns about a recession hittingthe U.S. economy. These concerns grew quieterthroughout 2019 as the U.S. reached a phase one tradedeal with China and the Fed provided monetarystimulus with three rate cuts to end the year in a rangeof 1.25 to 1.50 percent. By mid-year, the U.S. hadexperienced the longest economic expansion in U.S.history and by year end the U.S. economy had notched126 consecutive months of gross domestic product(GDP) growth. In December 2019, more than a decadeafter the fallout of the global financial crisis of 2008, theU.S. set another milestone by achieving the longest bullmarket in history, with the S&P 500 up 378 percent(price return) from its low in March 2009.
Consumer spending and confidence, boosted bydeclining interest rates, generally remained strong, but
Introductory Section
LETTER OF TRANSMITTAL
4 Introductory Section � Colorado PERA Comprehensive Annual Financial Report 2019
Final D
raft
June
12,
202
0

ongoing trade uncertainty held down economic growthin the U.S. with the real rate of growth slowing to2.3 percent in 2019. Wage growth continued into 2019,with the lowest paid workers experiencing the largestincreases as state and local governments across thenation increased their minimum wages. While wagegrowth increased, it remained lower than expectedgiven record low unemployment. The unemploymentrate continued to decline throughout 2019, ending theyear at 3.5 percent, which marked its lowest level sincethe 1960s after having recorded 22 consecutive monthsat or below 4.0 percent at year end. Both headlineinflation and core inflation, which does not includemore volatile components such as food and energy,ended the year at 2.3 percent. The risk of rising inflationis muted against the backdrop of a tight labor marketand modest wage growth, with the larger concern forthe Fed being inflation persistently coming in under its2.0 percent target. Moreover, the Personal ConsumptionExpenditures index, the Fed’s preferred measurement ofinflation, ended 2019 at 1.6 percent.
Growth in the world economy notably slowed to anestimated rate of 2.4 percent in 2019, the lowest levelsince the global financial crisis. Among advancedeconomies, growth in the United States held uprelatively well at 2.3 percent, while the Euro area andJapan measured at just 1.1 percent. Emerging marketsand developing economies fared better than advancedeconomies with overall growth of 3.5 percent, but this isa marked drop from prior years. The ongoing U.S.-China trade war, and the ensuing tariffs, have givenrise to more widespread protectionism amongeconomies, resulting in reduced trade and subduedeconomic growth. Moreover, increasing levels of debt ineconomies around the world have further slowedeconomic growth, although the rising debt burdens aresomewhat offset by increasingly accommodativemonetary policies with some economies, notably theEuro area, taking rates deeper into negative territory. Inthe U.S., the dollar continued to strengthen given thecomparatively strong economy, while the tail windsprovided by tax cuts have shown signs of shifting toheadwinds as the increasing deficit may begin to weighon economic growth.
Colorado, although it began to moderate in its rankingamong states, has again shown to be one of the strongerperforming U.S. state economies in 2019. This is due, inpart, to its employment sector diversification and highlyeducated workforce, ranking second nationally forpercent of workforce with a bachelor’s degree or higher.Colorado ranked seventh in the country for real GDPgrowth in 2019 and well above U.S. GDP of 2.3 percent,at 3.5 percent.
After a slight increase in the unemployment rate in 2018it began trending down again in 2019 to a historic low of2.5 percent, among the lowest in the nation, and a fullpercent lower than the U.S. unemployment rate.
Colorado continues to have one of the highest laborforce participation rates (LFPR) in the nation, rankingfourth nationally, at 69.4 percent and exceeding thenational average of 63.0 percent. Furthermore,Colorado’s population continues to grow at a pacenearly double the U.S. average with positive netmigration of working age adults contributing to the highLFPR and employment growth. A tight labor market in2019 aided in boosting personal income growth and percapita personal income growth, with Colorado rankingfourth and tenth nationally, respectively.
On the housing front, Colorado has consistently beenamong the markets experiencing the highestappreciation in home values, but this moderated furtherin 2019 to a rate of 5.5 percent, which still placesColorado in the top third for appreciation. The growthin housing units has now exceeded householdformations for the last two years, helping to easerelentless price pressure, but it will take time for themarket to find a balance after years of undersupply.
InvestmentsInvestment portfolio income is a significant source ofrevenue to PERA. The Board’s Investment Committee isresponsible for assisting the Board in overseeing PERA’sinvestment program.
In 2019, there was a net investment income of$9.9 billion compared with total member contributionsof $1.0 billion, employer contributions of $1.9 billion andnonemployer contributions of $225 million.
For the year ended December 31, 2019, the definedbenefit funds had a time-weighted rate of return of20.3 percent net-of-fees. The annualized, net-of-fees,time-weighted, rates of return over the last three andfive years were 11.1 percent and 8.4 percent,respectively, and over the last 10 years it was 9.1 percent.The 30-year annualized, gross-of-fees rate of return was8.6 percent.
Prudent funding and healthy investment returns areimportant to the financial soundness of PERA. Moreinformation on the composition of the portfolio isreflected in the Investment Summary on page 126.
An integral part of the overall investment policy is thestrategic asset allocation policy. The strategic assetallocation is designed to provide appropriatediversification and balance expected total rates of returnwith the volatility of expected returns. The fund is to bebroadly diversified across and within asset classes tolimit the volatility of the total fund investment returnsand to limit the impact of large losses on individualinvestments. Both traditional and nontraditional assetsare incorporated into the asset allocation mix.
In addition to asset class targets, the Board sets rangeswithin which asset classes are maintained. The interimand long-term asset allocation mix and the specifiedranges for each asset class are presented on page 121. All
Introductory Section
LETTER OF TRANSMITTAL
Colorado PERA Comprehensive Annual Financial Report 2019 � Introductory Section 5
Final D
raft
June
12,
202
0

of the asset classes were within their specified ranges atyear end.
PERA’s investment policy is summarized in the Reporton Investment Activity on page 121.
Investment StewardshipIt is PERA’s fiduciary duty to serve as stewards ofcapital for over 620,000 members, participants, andbeneficiaries. In 2019, PERA established the InvestmentStewardship Division to fortify our longstandingcommitment to the financial sustainability of the Fund.Foundational to PERA’s investment stewardship arecost-consciousness, materiality to PERA’s portfolio,regulatory and market advocacy, and the ongoingevaluation of our investments. Collectively, these effortsare intended to demonstrate PERA’s investmentstewardship across all asset classes in the portfolio as wecontinue to prioritize financial sustainability.
Corporate governance advocacy has been one of ourmost in-depth investment stewardship efforts. In 2019,PERA management reassigned corporate governancefunctions, including proxy voting, from the LegalDepartment to the Investment Department in adherenceto industry best practices and PERA’s strategic vision.The aim of this reorganization is to streamline andadvance our stewardship efforts to encourage profitablebusiness practices at the companies in which we invest.In addition, PERA continues to be active in the securitieslitigation arena, fulfilling the Board’s commitment tosupport corporate governance reforms such astransparency, accountability, and enforcement ofshareholders’ rights.
Actuarial ResultsActuarial valuations involve assumptions about theprobability of events far into the future in order toestimate the financial and actuarial status of the definedbenefit trust funds. Two types of actuarial valuations arerequired to be performed for PERA’s five defined benefitpension and two Other Postemployment Benefit (OPEB)trust funds: one for financial accounting and reportingpurposes and the other for funding purposes. Theresults of both actuarial valuations are included in thisCAFR. The actuarial valuations performed for financialaccounting and reporting purposes are prepared inaccordance with governmental accounting standards.Pension liabilities, OPEB liabilities, and other relatedamounts calculated in accordance with these standardsemphasize the costs incurred by PERA-affiliatedemployers for providing benefits to their employees aspart of the employment-exchange process. Assets arerequired to be stated at fair value and the liabilities aredetermined using a consistent, standardizedmethodology, which allows for transparency and thecomparability of amounts calculated for financialaccounting and reporting purposes across U.S.governmental defined benefit pension andOPEB systems.
The actuarial valuations for funding purposes areprepared in accordance with Actuarial Standards ofPractice and the Board’s pension and OPEB fundingpolicies. Liabilities and other actuarial metrics arecalculated for the purpose of determining a systematicapproach to pre-funding costs of the five defined benefitpension and two OPEB trust funds, as well as to assessthe adequacy of moneys that are available to pay post-employment benefits earned by the membership. Pre-funding future liabilities defrays the ultimate cost ofproviding benefits as dollars held in the trust fundsgenerate investment returns. The amount of actuarialaccrued liability (AAL) in excess of the actuarial value ofassets is referred to as the unfunded actuarial accruedliability (UAAL). The ratio of assets to AAL representsthe funded status of each plan.
For the year ended December 31, 2019, the UAALcalculated for purposes of systematically funding thefive defined benefit pension trust funds was $29.8 billioncompared to the unfunded liabilities, referred to as thenet pension liabilities calculated for accounting andfinancial reporting purposes of $26.1 billion. Althoughsome of the objectives and calculation methodologies ofthese valuations are similar, the liabilities calculated forfinancial reporting purposes and funding purposes canbe notably different under certain circumstances. For theyear ended, December 31, 2018, the UAAL calculated forpurposes of systematically funding the five definedbenefit pension trust funds was $31.0 billion comparedto the net pension liabilities calculated for accountingand financial reporting purposes of $31.5 billion.
The decrease in the unfunded liabilities calculated foraccounting and financial reporting purposes is primarilydue to favorable investment performance during 2019and the reduced annual increase (AI) maximum, knownas the AI cap, from 1.50 percent to 1.25 percent, perannum. In accordance with GASB 67, the discount ratedetermination for 2019 required the use of the long-termexpected rate of return of 7.25 percent for the fivedefined benefit pension trust funds. When calculatingthe AAL for purposes of funding, the discount rate usedis always equal to the long-term expected rate of returnset by the Board.
Information on certain actuarial metrics that assess themoneys required to systematically fund the five definedbenefit pension and two OPEB trust funds can be foundin the Management's Discussion and Analysis (MD&A)on pages 35-38 of the Financial Section. Acomprehensive discussion of the results of the actuarialvaluation performed for financial accounting andreporting purposes can be found in the MD&A onpages 40-42, as well as in Notes 10 and 11 of the Notes tothe Financial Statements in the Financial Section. Acomprehensive discussion of the results of the actuarialvaluations performed for funding purposes, as well asother analysis utilized by PERA can be found below andalso in the Actuarial Section.
Introductory Section
LETTER OF TRANSMITTAL
6 Introductory Section � Colorado PERA Comprehensive Annual Financial Report 2019
Final D
raft
June
12,
202
0
FundingOn December 31, 2019, the funded ratio for PERA’s fivedefined benefit pension trust funds was 61.9 percentcompared to 59.8 percent on December 31, 2018. Theunfunded liability as of December 31, 2019, was$29.8 billion, a decrease of approximately $1.2 billionfrom the previous year. The increase in the funded ratioin 2019 is attributable mainly to favorable investmentperformance for 2019 compared to the long-termexpected rate of return of 7.25 percent and the reducedAI cap, from 1.50 percent to 1.25 percent, per annum.
The development and ongoing review of a pensionfunding policy are responsibilities of the Board. PERA’scurrent pension funding policy was initially adopted bythe Board in March 2015, and last revised in November2018, for the five defined benefit pension trust funds.The Board adopted a similarly structured OPEB fundingpolicy in January 2018. Both policies focus on thedetermination of an actuarially determined contributionreflecting closed and layered 30-year amortizationperiods. The purpose of each policy is three-fold: (1) todefine the overall funding benchmarks of the trust fund,(2) to assess the adequacy of the contribution rates set bythe Colorado Legislature by comparing each trust fund’sstatutorily set contribution rate to an actuariallydetermined contribution benchmark, and (3) to definethe annual actuarial metrics which will assist inassessing the sustainability of the plan. The results ofthese three items help guide the Board whenconsidering whether to pursue or support proposedcontribution and benefit legislation.
A goal of the Board’s pension and OPEB fundingpolicies is the achievement of a combined Division TrustFund and a combined Health Care Trust Fund actuarialfunded ratio equal to or greater than 110 percent.
Investment income is the most significant driver of thefunded status in a defined benefit plan. To understandthe significance of this assumption, a sensitivity analysisis included in the Actuarial Section on page 175 for theDivision Trust Funds and page 200 for the Health CareTrust Funds. Additional information on PERA’s fundedratio, unfunded liabilities, and actuarial assumptionsmay be found in the Actuarial Section starting on page147 for the Division Trust Funds and on page 186 for theHealth Care Trust Funds.
Employer contributions are also a driver of the fundedstatus. In 2019, actual employer contributions receivedpursuant to statute for the five defined benefit pensiontrust funds were $132.9 million less than the actuariallydetermined contributions required. During the past17 years, this contribution deficiency totaled $5.5 billion.See page 37 of Management’s Discussion and Analysis(MD&A) in the Financial Section for additional details.
Investment Rate of Return Sensitivity Effect onProjected Amortization PeriodsIn addition to the annual actuarial funding valuation,the Board’s actuary performs actuarial projections foreach Division Trust Fund. These projections are forward-looking and take into consideration the many tiers ofPERA benefit provisions and the statutory contributionrate structures, including the effective date of each tieror contribution rate. The projections also reflectapplicable salary, demographic, and economic actuarialassumptions, as well as anticipated member growth.Considering the various benefit tiers currently in effectwithin PERA, the Board believes the results of theactuarial projections to be the most comprehensive viewand best indication of the adequacy of the statutorilyprescribed pension contribution schedule.
The main focus of these projections is to provide theamortization period, or rather, the expected fundingperiod, by division, of the estimated number of yearsuntil full funding status is achieved. The projectedamortization periods reflect all actuarial assumptionsand the benefit and contribution provisions currentlyenacted, even if not yet effective.
The table below shows the projected amortizationperiods under three scenarios: (1) as of theDecember 31, 2018, actuarial valuation, (2) as of theDecember 31, 2019, actuarial valuation, reflecting thegreater than expected 2019 investment return and otherplan experience, and the anticipated adjustments,resulting from the AAP enacted through SB 18-200, and(3) as of the December 31, 2019, actuarial valuation,reflecting plan experience and the revised contributionprovisions enacted under HB 20-1379 and HB 20-1394(see Note 12 of the Notes to the Financial Statements inthe Financial Section for additional details).
Projected Amortization Periods (in years)
Division Trust Fund
2019 Valuation Results
Considering HB 20-1379 and
HB 20-1394
2019ValuationResults
2018ValuationResults
State 22 22 28School 24 24 34Local Government 14 14 29Judicial 12 12 21DPS 11 11 17
Since the projections are based on a wide variety ofassumptions, it is important to understand the risksrelated to defined benefit plans, specifically the risksassociated with the selection and application of the long-term expected rate of return on investments. Given thelong-term funding horizon and anticipated ongoingaspect of such defined benefit plans, particularly thoseproviding benefits in the public sector, it is generallyunderstood that the existence of the plan, itself, is not
Introductory Section
LETTER OF TRANSMITTAL
Colorado PERA Comprehensive Annual Financial Report 2019 � Introductory Section 7
Final D
raft
June
12,
202
0

tied to the financial performance of private enterprise,but rather to the ongoing nature of governmentalservices. Therefore, it is common practice for plansponsors/administrators of governmental or publicsector pension plans also to apply the expected long-term rate of return as the discount rate used todetermine the liabilities of the plan.
In order to derive the long-term rate of returnassumption, the PERA Board looks to the expertise of itsinvestment and actuarial consultants to perform acomprehensive asset/liability study on a periodic basis(generally every three to five years). In conjunction withthis study, the Board reviews capital market data fromnumerous sources. PERA concluded the most recentasset/liability study in November 2019. As a result ofthat study, the Board updated and approved long-termasset allocations and target ranges effectiveJanuary 1, 2020, and reaffirmed the current 7.25 percentlong-term expected rate of return applicable to all fiveDivision Trust Funds as well as the two Health CareTrust Funds.
The table below illustrates the projected amortizationperiods, in years, of the School Division Trust Fundunder the various return scenarios (used for bothassumed investment return and to discount liabilities ofthe plan) which correspond to the confidence levels(probabilities of investment return) as indicated.
This table reflects the results and experience of theDecember 31, 2019, actuarial funding valuation, theeffect of the adjustments due to the results of the 2018AAP assessment, and the revised contributionprovisions enacted under HB 20-1379 and HB 20-1394.The projected funding periods below reflect 50-yearprobability outlooks (Monte Carlo simulations),provided by the Board’s actuaries, and based on 30-yearcapital market assumptions, employed in the mostrecent asset/liability study as described above, providedby the Board’s investment consultants.
Projected Amortization Periods—School Division Trust FundProbability of Achievingat Least the Rate ofReturn Displayed (or Better), Per Annum
Long-Term Expected Investment Return& Discount Rate
4.35% 6.18% 7.25% 8.63% 10.47%95th Percentile Infinite75th Percentile 4553rd Percentile 2425th Percentile 11 5th Percentile 3
Signal Light MethodologyAnother way of understanding PERA’s financialcondition was adopted by the Colorado GeneralAssembly’s Legislative Audit Committee in 2015, andfurther enhanced by the Board in 2019 to incorporatestochastic rather than deterministic modeling. By
definition, uncertain or variable factors are built into astochastic model, whereas variable factors are externalto a deterministic model. The stochastic model betterreflects actual market activity including the effect of thetiming and order of investment returns. Thismethodology also considers PERA’s portfolio, moreprecisely reflecting capital market assumptions, byinvestment category within PERA’s asset allocation.
Generally, the “signal light” methodology determinesthe funded position of each division on a projectedbasis. The results are categorized based on an expandedspectrum of signal light colors ranging from dark green,indicating a well-funded position, to dark red,indicating potential insolvency in the near future.
PERA updates the signal light indicators each yearfollowing the release of its CAFR. Recognizing the planexperience as of the December 31, 2019, actuarialvaluation, including the effect of HB 20-1379 andHB 20-1394, and better reflecting the effect of pathdependency, the signal light designation is green for theState and School Divisions and dark green for the LocalGovernment, Judicial and DPS Divisions.
PERAPlus 401(k)/457 and Defined ContributionRetirement PlansPERA offers members opportunities to save forretirement through the PERAPlus 401(k), PERAPlus 457,and Defined Contribution (DC) Retirement Plans. As ofDecember 31, 2019, there were a total of 184 employerswho recognized the value of offering more choices insavings by affiliating into the PERAPlus 457 Plan. TheRoth option was added to the PERAPlus 401(k) and457 Plans at the end of 2014. As of December 31, 2019,there were a total of 79 employers who have adoptedthe Roth option. The Roth option in these plansoffers advantages over a Roth IRA, includinghigher contribution limits and no income-basedcontribution limitations.
The fiduciary net position of the PERAPlus 401(k) Plan,PERAPlus 457, and DC Retirement Plans increased forthe year ended December 31, 2019. The PERAPlus 401(k), PERAPlus 457, and DC Retirement Plans earned$700.3 million, $163.9 million, and $48.6 million ofinvestment income with a fiduciary net position of$3.7 billion, $989.6 million, and $265.9 million,respectively.
Overview of Colorado PERAEstablished in 1931, PERA operates by authority of theColorado General Assembly and is administered underTitle 24, Article 51 of the Colorado Revised Statutes.Initially covering all State employees, PERA hasexpanded to include all Colorado school districts, theState’s judicial system, and many municipalities andother local government entities.
Introductory Section
LETTER OF TRANSMITTAL
8 Introductory Section � Colorado PERA Comprehensive Annual Financial Report 2019
Final D
raft
June
12,
202
0
Board CompositionPERA is governed by a 16-member Board of Trustees;11 Trustees are elected by the membership for staggeredfour-year terms and serve without compensation exceptfor necessary expenses. In addition, there are threeGovernor-appointed Trustees confirmed by the Senatewho receive limited compensation. The State Treasurerserves as a voting ex officio Trustee, and the DPSDivision seat serves as a non-voting ex officio Trustee.
In January 2019, The Honorable Walker Stapleton leftthe Board when his term as State Treasurer ended. TheHonorable Dave Young was elected State Treasurer inNovember 2018, and he began serving as an ex officioTrustee effective January 2019.
In March 2019, the Board appointed The HonorableRebecca R. Freyre to the Judicial Division seat andreappointed Timothy M. O’Brien to the retiree seat. Eachwas the sole candidate duly nominated and eligible tobe elected to these seats. Terms for both Trustees beganJuly 1, 2019, and end June 30, 2023.
The Honorable Will Bain did not seek re-election for theJudicial Division seat, which was up for election in 2019.Also in March 2019, Trustee Robert Lamb announced hisretirement with Boulder County effective May 1, 2019.
By law, the Board was responsible for appointing areplacement for the vacant Local Government position,and an ad hoc search committee of the Board wasformed in March 2019. Cheryl Pattelli was appointedto the vacant Local Government Division seat onJune 21, 2019, serving until the next Board election in2020. Pattelli is the Chief Financial Officer at the Cityof Boulder.
At the March 2020 Board meeting, the Board re-appointed Trustee Pattelli since her seat wasuncontested in the Local Government Division election.She will begin serving a two-year term on July 1, 2020,which completes the term originally held by TrusteeLamb. At this meeting, the Board also re-appointed AmyGrant to the DPS Division seat, and she will beginserving a four-year term beginning on July 1, 2020.Additionally, the Board appointed Nathan Geroche, ascience teacher in the Jefferson County School District,to the School Division seat as he was the sole candidatefor this seat, which was held by Trustee William Parkerwho did not seek re-election. Trustee Geroche alsobegins serving a four-year term on July 1, 2020.
On behalf of the PERA executive team, we thankTrustees Bain, Lamb, Parker, and Stapleton for theircontributions and service to the PERA membership.
Management ChangesIn August 2019, Rebecca Shelton was promoted toInvestment Operating Officer in the Investment
Administration Division. Rebecca joined PERA inMarch 2011 as an Investment Business Analyst in theInvestment Operations Division and, in 2013, waspromoted to Investment Operations Manager. In hernew position, Rebecca is responsible for the overallbusiness management functions in the InvestmentDepartment working in conjunction with the ChiefInvestment Officer.
Also in August 2019, Tara Stacy was promoted toDirector of Investment Stewardship in the newly createdInvestment Stewardship Division. Tara joined PERA inAugust 2017 as an Investment Compliance andPerformance Analyst in the Investment AdministrationDivision. In this new role, Tara is responsible for thedevelopment and implementation of PERA’s investmentstewardship initiatives.
In October 2019, Ryan Ericson was promoted to Directorof Application Development replacing Rich Krough whoretired after 17 years of service. Ryan joined PERA inMarch 2011 as a Team Manager in the ApplicationDevelopment Division. In his new role, Ryan isresponsible for directing the development, management,and modification of all internal application softwaredeveloped at PERA.
In January 2020, Keith Tayman was promoted toDirector of Fixed Income in the Investment Departmentreplacing Mark Walter who left PERA in October 2019after nine years of service. Keith joined PERA in April2008 as a Senior Fixed Income Portfolio Manager. In hisnew role, Keith is responsible for the leadership of theFixed Income Division’s operations and staff, as well asthe overall management of PERA’s fixed income assetclass in accordance with established investment policiesand portfolio risk and return objectives.
In April 2020, Patrick Lane was hired as Chief BenefitsOfficer, a position previously held by Donna Baros whoretired in January 2019. Patrick joined PERA from theOklahoma Public Employees Retirement System, wherehe was Director of Member Services. In his new role,Patrick is responsible for providing strategic oversightand management of PERA’s retirement, disability, andsurvivor benefit payments; member account services;benefit counseling; and customer service programs.
In May 2020, Patrick von Keyserling was hired as SeniorDirector of Communications. This new position wascreated following the departure of former ChiefCommunications Officer, Tara May, who left PERA inJanuary 2020 after four years of service. Previously,Patrick was the Communication Director at the City ofBoulder. In this position, Patrick will advance PERA’sstrategic communications, government and publicaffairs, marketing, and public relations efforts with avariety of stakeholders locally and nationally.
Introductory Section
LETTER OF TRANSMITTAL
Colorado PERA Comprehensive Annual Financial Report 2019 � Introductory Section 9
Final D
raft
June
12,
202
0
Financial Information and ManagementResponsibilityOur CAFR must comply with the reportingrequirements under Title 24, Article 51, Section 204(8) ofthe Colorado Revised Statutes (C.R.S.).
PERA’s financial statements are prepared bymanagement, who is responsible for the integrity andfairness of the data presented, including the manyamounts which must, out of necessity, be based onestimates and judgments. This CAFR was prepared toconform to the accounting principles generally acceptedin the United States of America. Financial informationpresented through the annual report is consistent withthat which is displayed in the basic financial statements.
Ultimate responsibility for the basic financial statementsand annual report rests with PERA management; theBoard provides an oversight role over financialreporting. The Board is assisted in its responsibilities bythe Audit Committee, which consists of seven Boardmembers and two independent outside members. TheAudit Committee is responsible for overseeing theadequacy and effectiveness of PERA’s system of internalcontrol and the accounting and financial reportingsystems. A more detailed description of the AuditCommittee’s role can be found in their report onpages 16-17.
Management is responsible for establishing andmaintaining adequate internal control over financialreporting. PERA’s internal control over financialreporting is designed to provide reasonable, but notabsolute assurance, regarding the reliability of financialreporting and the preparation of financial statements forexternal purposes in accordance with generally acceptedaccounting principles. The internal control over financialreporting includes those policies and procedures that:
• Pertain to the maintenance of records that, inreasonable detail, accurately and fairly reflect thetransactions and dispositions of assets;
• Provide reasonable assurance that transactions arerecorded as necessary to permit preparation offinancial statements in accordance with generallyaccepted accounting principles, and that receipts andexpenditures are being made only in accordance withauthorizations of management; and
• Provide reasonable assurance regarding prevention ortimely detection of unauthorized acquisition, use ordisposition of assets that could have a material effecton the financial statements.
Management has concluded that, as ofDecember 31, 2019, the system of internal controlsover financial reporting is effective.
There are inherent limitations in the effectiveness of anysystem of internal control, including the possibility ofhuman error, the circumvention or overriding of
controls, and that the cost of a control should not exceedthe benefits to be derived. Accordingly, even an effectiveinternal control system may not prevent or detectmisstatements and can provide only reasonableassurance with respect to financial statementpreparation. Also, projections of any evaluation ofeffectiveness to future periods are subject to the risk thatcontrols may become inadequate because of changes inconditions or that the degree of compliance with thepolicies or procedures may deteriorate.
State law requires that the State Auditor conducts orcauses to be conducted an annual audit of PERA.Pursuant to this requirement, the State Auditor selectedCliftonLarsonAllen LLP in 2015 to perform theindependent audit of PERA's annual financialstatements, beginning with the year endedDecember 31, 2015. Under the direction of the StateAuditor, CliftonLarsonAllen LLP audited PERA’s 2019basic financial statements in accordance with auditingstandards generally accepted in the United States ofAmerica and Government Auditing Standards.CliftonLarsonAllen LLP issued an unmodified opinionon PERA's financial statements, which can be found inthe Independent Auditors' Report within the FinancialSection on pages 25-27. Management has provided theauditors with full and unrestricted access to PERA’srecords and staff to discuss their audit and relatedfindings to facilitate independent validation of theintegrity of the plan’s financial reporting and to considerthe effectiveness of internal controls.
The Financial Section of the CAFR also contains theMD&A that serves as a narrative introduction, overview,and analysis of the basic financial statements. This Letterof Transmittal is designed to complement the MD&Aand should be read in conjunction with it.
Recognition of Achievements The Government Finance Officers Association of theUnited States and Canada (GFOA) awarded aCertificate of Achievement for Excellence in FinancialReporting to PERA for its CAFR for the year endedDecember 31, 2018. This was the 34th consecutive yearthat PERA has achieved this prestigious award. In orderto be awarded a Certificate of Achievement, agovernment must publish an easily readable andefficiently organized CAFR. This report must satisfyboth generally accepted accounting principles andapplicable legal requirements.
A Certificate of Achievement is valid for a period of oneyear only. We believe that our current CAFR continues tomeet the Certificate of Achievement Program’srequirements, and we are submitting it to the GFOA todetermine its eligibility for another certificate.
The GFOA also awarded PERA an Award forOutstanding Achievement in Popular Annual FinancialReporting for its Popular Annual Financial Report for theyear ended December 31, 2018. The Award for
Introductory Section
LETTER OF TRANSMITTAL
10 Introductory Section � Colorado PERA Comprehensive Annual Financial Report 2019
Final D
raft
June
12,
202
0
Outstanding Achievement in Popular Annual FinancialReporting is a prestigious national award recognizingconformance with the highest standards for preparationof state and local government popular reports.
In order to receive an Award for OutstandingAchievement in Popular Annual Financial Reporting, agovernment unit must publish a Popular AnnualFinancial Report, whose contents conform to programstandards of creativity, presentation, understandability,and reader appeal.
An award for Outstanding Achievement in PopularAnnual Financial Reporting is valid for a period of oneyear only. PERA has received a Popular Award for thelast 17 consecutive years. We believe our current reportcontinues to conform to the Popular Annual FinancialReporting requirements, and we are submitting it tothe GFOA.
PPCC Standards Award ProgramThe Public Pension Coordinating Council (PPCC)presented PERA with its Recognition Award forAdministration for meeting professional standards in2019 for plan administration as set forth in the PublicPension Standards. This is the 17th consecutive year thatPERA has received this annual award. In 2019, the PPCCpresented PERA with its Recognition Award forFunding by demonstrating the funding adequacy of thepension system. The PPCC is a coalition of threenational associations that represent public retirementsystems and administrators—the National Associationof State Retirement Administrators, National Council onTeacher Retirement, and National Conference on PublicEmployee Retirement Systems. These three associationsrepresent more than 500 of the largest pension plans inthe U.S.
In MemoriamRecently, PERA lost a visionary and true leader whotouched the lives of many. Robert (Bob) J. Scott, formerPERA Executive Director, passed away on April 20, 2020.Bob served as PERA’s Executive Director fromNovember 1984 until his retirement in July 2000. Prior tobeing appointed Executive Director, he was Colorado’sState Auditor from 1977 to 1984 and served as a Trusteeon the PERA Board for seven years.
During Bob’s tenure as PERA’s fourth ExecutiveDirector, the PERA trust fund grew to more than$28 billion. Under his leadership, PERA implementedthe 401(k) Voluntary Investment Plan program, theretiree health care program, and earned Certificates ofExcellence in Financial Reporting for its CAFR for15 successive years.
Bob was a leader in the public pension industry holdingseveral positions with the National Association of StateRetirement Administrators including serving as itsPresident. He served as Chairman of the National PublicPension Coordinating Council, on the ExecutiveCommittee of National Conference of State Legislatures,and on the Government Finance Officers AssociationCommittee on Public Employee RetirementAssociations. Bob’s exemplary credentials prepared himfor a life-long career in public service that also includedserving as the Executive Director of the Denver PublicSchools Retirement System from 2004-2005.
Bob earned the respect of members, retirees, employers,legislators, and peers across the country and will beremembered for his commitment to improve upon pastprograms and philosophies while drawing blueprintsfor the future. PERA and Colorado’s public employeesare still benefitting today from his vision and dedicationfor a better retirement plan for all PERA members.
It is with profound gratitude that I recognize andmemorialize Bob for his many contributions andaccomplishments during his 16-year career as PERA’sExecutive Director.
AcknowledgementsThe cooperation of our affiliated employers issignificant to the success of PERA, and we thank thestaff and management of these employers for theircontinuing support.
Copies of this CAFR are provided to all PERA-affiliatedemployers and other interested parties; a summary(Popular Annual Financial Report) will be sent to membersand benefit recipients. Electronic versions of bothpublications are available on the PERA website atwww.copera.org. For questions concerning any of theinformation provided in this CAFR, please [email protected].
I also thank the PERA staff and Board of Trustees fortheir commitment and efforts to ensure that PERA meetsthe needs of all public employees in Colorado. We arecognizant of the current challenges and uncertaintiesand will remain diligent and focused on keeping PERAstrong and sustainable.
Respectfully submitted,
Ron BakerColorado PERA Executive Director
Introductory Section
LETTER OF TRANSMITTAL
Colorado PERA Comprehensive Annual Financial Report 2019 � Introductory Section 11
Final D
raft
June
12,
202
0

Introductory Section
PROFESSIONAL AWARDS
12 Introductory Section � Colorado PERA Comprehensive Annual Financial Report 2019
Final D
raft
June
12,
202
0

Introductory Section
PROFESSIONAL AWARDS
Colorado PERA Comprehensive Annual Financial Report 2019 � Introductory Section 13
Final D
raft
June
12,
202
0

Timothy M. O'Brien Board Chairman
June 19, 2020
Dear Colorado PERA Members, Benefit Recipients, and Employers:
As Chairman of the Board of Trustees (Board) of the Public Employees’ RetirementAssociation of Colorado, I am pleased to present Colorado PERA’s ComprehensiveAnnual Financial Report for the year ended December 31, 2019.
PERA’s investments generated a return of 20.3 percent for 2019. Strong investmentperformance fortifies overall funding; however, during all market cycles, it isimportant to remember that PERA is a long-term investor whose goal is to provideretirement benefits in perpetuity.
While PERA experienced solid progress toward its funding goal during 2019, theuncertainty and significant market declines related to the 2020 global pandemic willno doubt impact PERA as it will nearly all other investors. The Board recognizes the
severity of this crisis and its expected impact on any gains made toward the funding goal and will remain vigilant inmonitoring PERA’s financial condition. Despite these unprecedented challenges, the Board’s top priority is ensuringthe long-term viability and sustainability of the PERA fund as we recognize the importance of PERA to ourmembership and the citizens of Colorado.
Although much of the current focus is related to the COVID-19 crisis, in 2019, several initiatives were completed or inprogress as part of the Board’s five-year strategic plan, which officially started in 2019. I would like to highlight a fewof these initiatives below.
As part of the Board’s ongoing commitment to sound stewardship, the Board commissioned an asset/liability studyduring 2019, which was prepared by Aon Hewitt Investment Consulting, Inc. (Aon). The objective of the study was todetermine the optimal strategic asset allocation policy that will ultimately allow PERA to meet its financial obligations,while also ensuring that PERA incurs appropriate levels of risk and liquidity. There will be a range of investmentreturns in any given short period but, over the long term, Aon’s modeling indicated 7.25 percent was near the medianexpectation. As a result of this study, the Board slightly modified the asset allocation ranges and targets, whilereaffirming the investment return assumption of 7.25 percent.
Additionally, in August 2019, the Board directed PERA staff to issue a Request for Proposal from qualified firms toprovide investment consulting services for the Voluntary Investment Program (401(k) Plan), Deferred CompensationPlan (457 Plan), and Defined Contribution Retirement Plan (DC Plan), collectively referred to as the CapitalAccumulation Plans (CAP). In November 2019, the Board identified three finalists and ultimately selected Callan LLCas the CAP Investment Consultant in December 2019.
Throughout 2019, the Board spent considerable time completing a comprehensive review of the Governance Manualas outlined in the Strategic Plan. This document codifies the policies and practices of the Board and provides a soundgovernance framework for the Board’s mandate to set policy and oversee the programs and operations of PERA. Tohelp streamline the operation of the Board, some roles and responsibilities were realigned within the committeestructure and a few committees were eliminated and absorbed into other committees. As a result, the responsibilitiesof the Shareholder Relations Committee transferred to the Investment Committee and the Stakeholder RelationsCommittee was eliminated with the responsibility to oversee and report on communications to the Board transferredto the Executive Director. Additionally, the CAP investment responsibilities transferred from the Benefits Committeeto the Investment Committee.
Finally, as outlined in the Strategic Plan as a goal to clarify the role and value of PERA to members and retirees, thePERA Communications Department completed a significant research project in 2019 to better understand satisfactionamong the PERA membership. Using existing data as well as new data from survey results, areas of servicestrengths and weaknesses within the organization were identified with recommendations for ways to increasemember satisfaction.
Mail: PO Box 5800, Denver, CO 80217-5800 | 1.800.759.PERA (7372) | www.copera.org
Introductory Section
BOARD CHAIRMAN'S REPORT
14 Introductory Section � Colorado PERA Comprehensive Annual Financial Report 2019
Final D
raft
June
12,
202
0
In addition to the work related to the Strategic Plan, the Board also amended its Statement on Divestment inJanuary 2019. As referenced in the revised Statement: “The issues facing our world today are not easily separated intogradations of severity or importance. Consensus as to the priority of these types of issues and the proper recourse isdifficult to achieve. As a result, once a divestment mandate is imposed to address one issue, the resulting 'slipperyslope' makes differentiation among the remaining issues contentious and divisive. Increased divestment is costly andlimits PERA’s ability to effectively seek the best risk-adjusted returns to secure the retirement benefits of publicservants. For these reasons, PERA will oppose divestment efforts unless such opposition is inconsistent with itsfiduciary duty, but will implement divestment mandates passed by the Colorado General Assembly.”
These initiatives and many others highlight the Board’s continued commitment to sound stewardship on behalf of allPERA members. I would like to recognize the following Trustees, who left the Board in 2019, for their diligence andthoughtful contributions while serving on the Board: The Honorable Will Bain (Judicial Division), Bob Lamb (LocalGovernment Division), and The Honorable Walker Stapleton (outgoing State Treasurer). With these departures wealso welcomed the following new Trustees to the Board: The Honorable Rebecca R. Freyre (Judicial Division), TheHonorable Dave Young (new State Treasurer), and Cheryl Pattelli (Local Government Division), who was appointedto fill the Local Government seat due to Bob Lamb’s retirement. Trustees devote many hours in fulfilling theirfiduciary duties while serving the membership, and all Trustees are recognized for their significant contributions oftime and service.
As we continue to work through challenging times, requiring PERA to be adaptive and responsible, I would liketo extend my gratitude to the Trustees for their dedication and continued perseverance as we work on behalf ofour members, beneficiaries, and employers. The Board’s guidance and support are essential to the success ofPERA. As Trustees, we are committed to ensuring the integrity and sustainability of the plan for all of Colorado’spublic employees.
Sincerely,
Timothy M. O’BrienChairman, Colorado PERA Board of Trustees
Introductory Section
BOARD CHAIRMAN'S REPORT
Colorado PERA Comprehensive Annual Financial Report 2019 � Introductory Section 15
Final D
raft
June
12,
202
0

As described more fully in its Charter, the purpose of the Colorado PERA Audit Committee (Audit Committee) is toassist the Board of Trustees (Board) in fulfilling its fiduciary responsibilities as they relate to accounting policies andfinancial reporting, the system of internal control, PERA’s Standards of Professional and Ethical Conduct, the internalaudit process, and the practices of the Director of Internal Audit. Management is responsible for the preparation,presentation, and integrity of PERA’s financial statements; accounting and financial reporting principles; internalcontrol; and procedures designed to reasonably ensure compliance with accounting standards, applicable laws, andregulations. PERA has a full-time Internal Audit Division that reports functionally to the Audit Committee. TheInternal Audit Division is responsible for independently and objectively reviewing and evaluating the effectivenessand efficiency of PERA’s system of internal control.
In 2015, the State Auditor selected CliftonLarsonAllen LLP to perform the independent audit of PERA’s annualfinancial statements, commencing with the year ended December 31, 2015. CliftonLarsonAllen LLP is responsible forperforming an independent audit of PERA’s financial statements in accordance with generally accepted auditingstandards and the standards applicable to financial audits contained in Government Auditing Standards issued bythe Comptroller General of the United States. In accordance with law, the State Auditor has ultimate authority andresponsibility for selecting, evaluating, and, when appropriate, replacing PERA’s Independent Auditor.
The Audit Committee serves a Board-level oversight role in which it provides advice, counsel, and direction tomanagement and to the Internal Audit function on the basis of the information it receives, discussions withmanagement and Internal Audit, and the experience of the Audit Committee’s members in business, financial, andaccounting matters. In this role, the Audit Committee also reviews the audit plan of the Independent Auditor, theresults of the audit, and the status of management’s actions to implement recommendations from the audit.
The Audit Committee believes that a candid, substantive, and focused dialogue with the internal auditors and theIndependent Auditor is fundamental to the Audit Committee’s oversight responsibilities. To support this belief, theAudit Committee periodically meets separately with both the Director of Internal Audit and the IndependentAuditor, without management present. In the course of its discussions in these meetings, the Audit Committee askeda number of questions intended to bring to light any areas of potential concern related to PERA’s financial reportingand internal control. These questions include, but are not limited to:
• Are there any significant accounting judgments, estimates, or adjustments made by management in preparing thefinancial statements that would have been made differently had the Independent Auditor prepared and beenresponsible for the financial statements?
• Based on the Independent Auditors' expertise, and their knowledge of PERA and PERA’s financial statements, havesubsequent events been appropriately disclosed in the financial statements?
• Based on the Independent Auditors’ experience, and their knowledge of PERA, do PERA’s financial statementsfairly present to users, with clarity and completeness, PERA’s financial position and performance for the reportingperiod in accordance with generally accepted accounting principles?
• Based on the Independent Auditors’ experience, and their knowledge of PERA, has PERA implemented internalcontrol and internal audit procedures that are appropriate for PERA?
• Are the Independent Auditor and internal auditors getting the support they need from management to executetheir duties?
Questions raised by the Audit Committee regarding these matters were answered to the Audit Committee’ssatisfaction.
The Audit Committee had an agenda for 2019 that included the following items:
• Recommending the Comprehensive Annual Financial Report (CAFR) to the Board for its approval;
• Recruiting and hiring a new Director of Internal Audit;
Mail: PO Box 5800, Denver, CO 80217-5800 | 1.800.759.PERA (7372) | www.copera.org
Introductory Section
REPORT OF THE COLORADO PERA AUDIT COMMITTEE
16 Introductory Section � Colorado PERA Comprehensive Annual Financial Report 2019
Final D
raft
June
12,
202
0
• Reviewing and approving the plan and budget of the Internal Audit Division;
• Reviewing the adequacy of resources made available to the Internal Audit Division;
• Reviewing the scope, objectives, and timing of the annual independent audit of PERA’s financial statements;
• Providing input into the Executive Director’s annual performance evaluation of the Director of Internal Audit;
• Reviewing PERA’s compliance with its Standards of Professional and Ethical Conduct;
• Meeting with the Independent Auditor separately, without management present;
• Meeting separately with the Executive Director, Director of Internal Audit, Controller, and General Counsel; and
• Meeting with the Director of Internal Audit and with management to discuss the effectiveness of PERA’sinternal control.
The Audit Committee has reviewed and discussed the audited financial statements for the year ended December 31, 2019, with management and the Independent Auditor. Management represented to the AuditCommittee that PERA’s audited financial statements were prepared in accordance with accounting principlesgenerally accepted in the United States of America that apply to governmental accounting for fiduciary funds. TheIndependent Auditor represented that their presentations to the Audit Committee included the matters required byauditing standards on auditor communication to be discussed with the Independent Auditor. This review included adiscussion with management of the quality (not merely the acceptability) of PERA’s accounting principles, thereasonableness of significant estimates and judgments, and the clarity of disclosure in PERA’s financial statements,including the disclosures related to critical accounting estimates.
In reliance on these reviews and discussions, and the reports of the Independent Auditor, the Audit Committee hasrecommended to the Board, and the Board has approved PERA’s CAFR for the year ended December 31, 2019.
Audit Committee as of June 19, 2020
David Hall, Chairman
Ramon Alvarado
Honorable Rebecca R. Freyre
Julie Friedemann
A. Tom Hall
Tammie Lowrie
Susan G. Murphy
Timothy M. O’Brien
Cheryl Pattelli
Introductory Section
REPORT OF THE COLORADO PERA AUDIT COMMITTEE
Colorado PERA Comprehensive Annual Financial Report 2019 � Introductory Section 17
Final D
raft
June
12,
202
0

By State law, authority over the public employees’ retirement association is vested in the Board of Trustees (Board).The Board is composed of the following 16 Trustees:
• Nine members elected by members from their respective Divisions to serve on the Board for four-year terms; fourfrom the School Division, three from the State Division, one from the Local Government Division, and one from theJudicial Division.
• Two retirees elected by retirees to serve on the Board for four-year terms.
• Three Trustees appointed by the Governor and confirmed by the State Senate to serve on the Board for four-year terms.
• The State Treasurer.
• One ex officio (non-voting) member or retiree elected by members and retirees of the Denver Public Schools (DPS)Division to serve on the Board for a four-year term.
If a Board member resigns, a new Trustee is appointed from the respective Division until the next election of Trustees.
Timothy M. O’BrienChairmanElected by RetireesRetired Colorado State AuditorOffice of the State AuditorCurrent term expires June 30, 2023
Thomas J. BarrettAppointed by the GovernorCurrent term expires July 10, 2022
Marcus PennellVice Chairman
Elected by School Members Physics Teacher Jefferson County School District Current term expires June 30, 2021
Guillermo BarrigaElected by School MembersProject Manager Aurora Public Schools Current term expires June 30, 2022
Ramon AlvaradoElected by State MembersAdjunct FacultyMetropolitan State University of DenverCurrent term expires June 30, 2022
Honorable Rebecca R. FreyreAppointed to Judicial Division seatJudge Colorado Court of AppealsCurrent term expires June 30, 2023
Honorable Will BainElected by Judicial Members Judge 4th Judicial District Term expired June 30, 2019
Julie FriedemannAppointed to Retiree seat Retired Mathematics Teacher Jefferson County School District Current term expires June 30, 2021
Introductory Section
BOARD OF TRUSTEES
18 Introductory Section � Colorado PERA Comprehensive Annual Financial Report 2019
Final D
raft
June
12,
202
0

Amy GrantNon-voting, Ex officio member Elected by DPS Division active members
and retirees Former Chair of the Denver Public Schools
Retirement System Board Retired Secretary Current term expires June 30, 2024
Susan G. MurphyAppointed by the Governor Current term expires July 10, 2021
David HallElected by State Members Sergeant and Legislative Liaison Colorado State Patrol Current term expires June 30, 2020
William N. ParkerElected by School Members International Baccalaureate
Coordinator and Literacy TeacherBrighton School District 27J Term to expire June 30, 2020
Roger P. JohnsonAppointed by the Governor Current term expires July 10, 2020
Cheryl PattelliAppointed to Local Government
Division seatChief Financial Officer City of Boulder Current term expires June 30, 2022
Suzanne E. KubecAppointed to State Division seat Liability Claims Manager State Office of Risk Management Current term expires June 30, 2021
Eric RothausDeputy State Treasurer Delegated Substitute for the State
Treasurer Continuous term effective January 2019
Robert LambElected by Local Government MembersFinance Division Director Boulder County Retired May 2019
Honorable Walker StapletonEx officio member State Treasurer Term ended January 2019
Tina MuehElected by School Members Middle School Science Teacher Boulder Valley School District Current term expires June 30, 2021
Honorable Dave YoungEx officio member State Treasurer Continuous term effective January 2019
Introductory Section
BOARD OF TRUSTEES
Colorado PERA Comprehensive Annual Financial Report 2019 � Introductory Section 19
Final D
raft
June
12,
202
0
Introductory Section
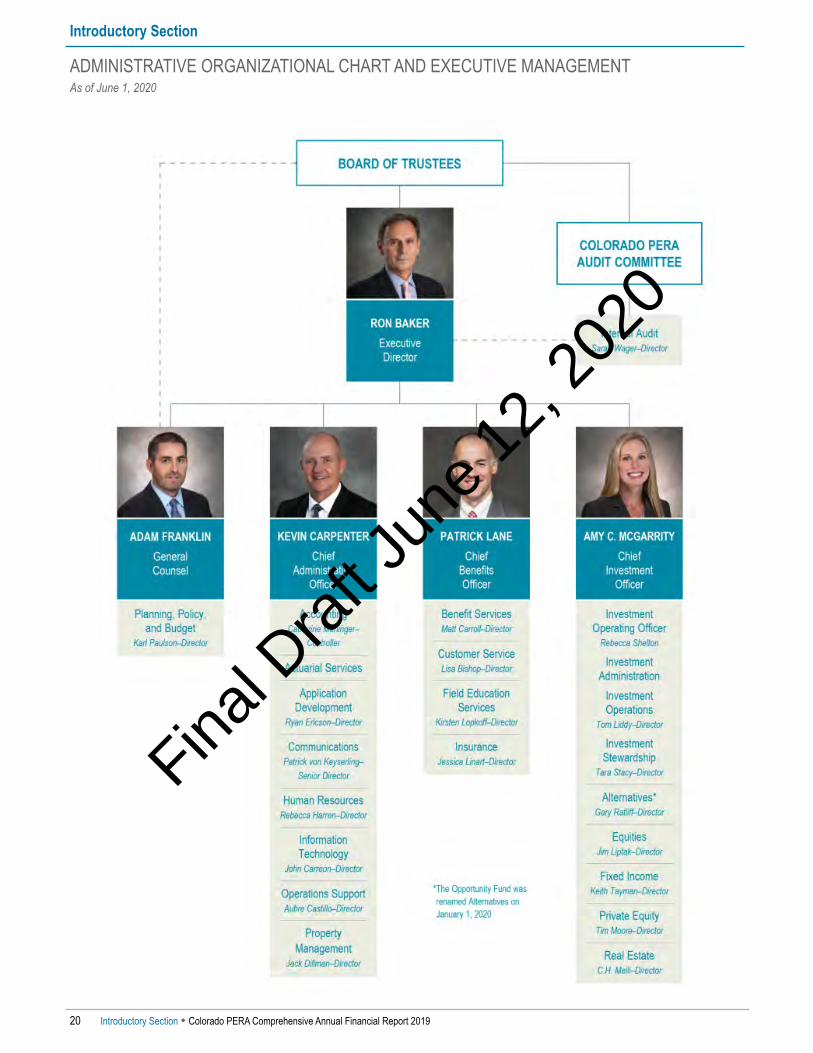
ADMINISTRATIVE ORGANIZATIONAL CHART AND EXECUTIVE MANAGEMENTAs of June 1, 2020
20 Introductory Section � Colorado PERA Comprehensive Annual Financial Report 2019
Final D
raft
June
12,
202
0

Fiduciary CounselBrownstein Hyatt Farber Schreck410 17th Street Suite 2200 Denver, CO 80202
Governance ConsultantCortex Applied Research, Inc. 2489 Bloor Street West Suite 304 Toronto, ON M6S 1R6 Canada
Health Care Program ConsultantIMA Financial Group, Inc. 1705 17th Street Suite 100 Denver, CO 80202
Independent AuditorsCliftonLarsonAllen LLP 370 Interlocken Boulevard Suite 500 Broomfield, CO 80021
Investment Performance ConsultantsAon Hewitt Investment Consulting, Inc. 200 East Randolph Street Suite 1500 Chicago, IL 60601
The Northern Trust Company50 South LaSalle Street Chicago, IL 60603
Investments—Portfolio ConsultantAon Hewitt Investment Consulting, Inc. 200 East Randolph Street Suite 1500 Chicago, IL 60601
Investments—Real Estate PerformanceAon Hewitt Investment Consulting, Inc. 200 East Randolph Street Suite 1500 Chicago, IL 60601
Master CustodianThe Northern Trust Company 50 South LaSalle Street Chicago, IL 60603
Pension and Health Care Program ActuarySegal 7951 East Maplewood AvenueSuite 327Greenwood Village, CO 80111
Pharmacy Benefits ConsultantsARMSRx Pharmacy Benefit Consulting 105 Down Court Windermere, FL 34786
Risk ManagementIMA of Colorado 1705 17th Street Suite 100 Denver, CO 80202
Voluntary Investment Program, DefinedContribution Retirement, and DeferredCompensation Plan Investment andPerformance ConsultantRVK, Inc. 1211 SW 5th Avenue Suite 900 Portland, OR 97204
Voluntary Investment Program, DefinedContribution Retirement, and DeferredCompensation Plan Service ProviderVoya Institutional Plan Services, LLC 30 Braintree Hill Office Park Braintree, MA 02184
A list of PERA’s Investment Brokers/Advisers, the Schedule of Commissions, and other information related to investment expenses can be found inthe Investment Section on pages 123-125.
Introductory Section
CONSULTANTSAs of December 31, 2019
Colorado PERA Comprehensive Annual Financial Report 2019 � Introductory Section 21
Final D
raft
June
12,
202
0

Final D
raft
June
12,
202
0

Final D
raft
June
12,
202
0

Final D
raft
June
12,
202
0

Financial Section
REPORT OF THE INDEPENDENT AUDITOR
Colorado PERA Comprehensive Annual Financial Report 2019 � Financial Section 25
Final D
raft
June
12,
202
0
Financial Section
REPORT OF THE INDEPENDENT AUDITOR
26 Financial Section � Colorado PERA Comprehensive Annual Financial Report 2019
Final D
raft
June
12,
202
0

Financial Section
REPORT OF THE INDEPENDENT AUDITOR
Colorado PERA Comprehensive Annual Financial Report 2019 � Financial Section 27
Final D
raft
June
12,
202
0

Final D
raft
June
12,
202
0

This Management’s Discussion and Analysis (MD&A)section provides a narrative overview and analysis ofthe financial activities of the Public Employees'Retirement Association of Colorado (PERA) for the yearended December 31, 2019. Please consider theinformation presented here in conjunction withadditional information in the Letter of Transmittalstarting on page 3 of this Comprehensive Annual FinancialReport (CAFR) and with the basic financial statements ofPERA on pages 44-47.
In addition to historical information, this MD&Aincludes forward-looking statements, which involvecertain risks and uncertainties. PERA’s actual results,performance, and achievements may differ materiallyfrom the results, performance, and achievementsexpressed or implied in such forward-lookingstatements, due to a wide range of factors, includingchanges in interest rates, changes in the capital markets,general economic conditions, legislative changes, as wellas other factors.
Overview of the AssociationPERA administers the following 11 fiduciary funds:
Plan NameDefined Benefit Pension Plans(Division Trust Funds)State Division Trust FundSchool Division Trust FundLocal Government Division Trust FundJudicial Division Trust FundDenver Public Schools (DPS) Division Trust Fund
Defined Benefit Other Postemployment Benefit Plans (Health Care Trust Funds)Health Care Trust Fund (HCTF)Denver Public Schools Health Care Trust Fund (DPS HCTF)
Defined Contribution PlansVoluntary Investment ProgramDefined Contribution Retirement Plan
Deferred Compensation PlanDeferred Compensation Plan
Private Purpose Trust FundLife Insurance Reserve
Additional information regarding the contribution andbenefit provisions of the plans can be found in Notes 1,8, and 9 of the Notes to the Financial Statements.
Legislative InitiativesGovernor Polis signed House Bill (HB) 19-1217:Concerning the Elimination of the Two Percent Increase in theMember Contribution Rate to the Public Employees'
Retirement Association in the Local Government of theAssociation into law on May 20, 2019, which eliminatedthe scheduled 2.0 percent increase in the membercontribution rate for the Local Government Division thatwas included in legislation passed in 2018. Thatlegislation increased contributions paid by all PERAmembers. While this new bill eliminates those increasedcontributions for members in the Local GovernmentDivision, all members are still subject to anyadjustments in contributions required to keep PERA onthe path to full funding by 2048 as defined within SenateBill (SB) 18-200. Contributions for all members, withincertain constraints, can increase (or decrease) by up to0.5 percent per year.
Financial Statement OverviewPERA’s financial statements are prepared inaccordance with governmental accounting standardsand the actuarial valuations that are reported in theActuarial Section are prepared in accordance with theActuarial Standards of Practice and the PERA Board’sFunding Policy.
Basic Financial StatementsPERA’s financial statements include the followingcomponents:
1. Basic Financial Statements
-Statements of Fiduciary Net Position
-Statements of Changes in Fiduciary Net Position
2. Notes to the Basic Financial Statements
3. Required Supplementary Information - Unaudited
4. Supplementary Schedules
The Statements of Fiduciary Net Position presentsinformation on PERA’s assets and liabilities, with thedifference between the two reported as fiduciary netposition. Over time, the increase or decrease in fiduciarynet position serves as an indicator of PERA’s financialcondition and our ability to fund future benefits.
The Statements of Changes in Fiduciary Net Positionreflects how PERA’s fiduciary net position (FNP)changed during the fiscal year, and includes additionssuch as contributions and investment income anddeductions such as benefit payments andadministrative expenses.
Notes to the Financial StatementsThe Notes to the Financial Statements provideinformation essential to understanding the basicfinancial statements.
Note 1—Plan Description: provides a generaldescription of PERA, the funds administered by PERA,
Financial Section
MANAGEMENT'S DISCUSSION AND ANALYSIS (UNAUDITED)(Dollars in Thousands)
Colorado PERA Comprehensive Annual Financial Report 2019 � Financial Section 29
Final D
raft
June
12,
202
0

and a general overview of plan provisions for thedefined benefit pension trust funds.
Note 2—Summary of Significant Accounting Policies:provides a summary of significant accounting policies,including the basis of accounting for PERA, andmanagement’s use of estimates.
Note 3—Interfund Transfers and Balances: providesinformation related to interfund activity and balances.
Note 4—Contributions: provides information related tocontribution requirements of the defined benefit pensiontrust funds and the authority for establishing oramending those requirements.
Note 5—Investments: provides information related todeposits and investments, required investmentdisclosures, and risks related to credit (includingcustodial credit and concentrations of credit risk),interest rate and foreign currency.
Note 6—Derivative Instruments: provides informationon PERA’s investment derivative instruments.
Note 7—Commitments and Contingencies: provides asummary of PERA’s significant commitments andgenerally describes any potential contingencies ofPERA.
Note 8—Voluntary Investment Program, DefinedContribution Retirement Plan, and DeferredCompensation Plan: identifies and describes the definedcontribution plans and deferred compensation plan.
Note 9—Health Care Trust Funds: identifies anddescribes the types of defined benefit otherpostemployment benefit (OPEB) plans.
Note 10—Net Pension Liability (NPL) of the DivisionTrust Funds: provides a summary of the NPL ofemployers and the nonemployer contributing entity inaccordance with GASB Statement No. 67, FinancialReporting for Pension Plans.
Note 11—Net OPEB Liability (NOL) of the Health CareTrust Funds: provides a summary of the NOL ofemployers in accordance with GASB Statement No. 74,Financial Reporting for Postemployment Benefit Plans OtherThan Pension Plans.
Note 12—Subsequent Events: provides a summary ofconditions that did not exist at the date of theStatements of Fiduciary Net Position but arosesubsequent to that date.
Required Supplementary Information (RSI)The following 10 year RSI is found after the notes to thebasic financial statements:
Division Trust Funds
Health Care Trust Funds
Schedule of Changes inNet Pension Liability
Schedule of Changes inNet OPEB Liability
Schedule of Net Pension Liability
Schedule of Net OPEB Liability
Schedule of Employerand Nonemployer
Contributions
Schedule of Contributionsfrom Employers and Other
Contributing EntitiesSchedule of
Investment ReturnsSchedule of
Investment Returns
Supplementary Information (SI)The SI section includes details on expenses of PERA anda breakdown of other additions and deductions. Theschedules available in the SI section include:
-Schedule of Administrative Expenses
-Schedule of Other Additions
-Schedule of Other Deductions
-Schedule of Investment Expenses
-Schedule of Payments to Consultants
Comparative Financial StatementsFollowing are the comparative condensed statements offiduciary net position and changes in fiduciary netposition for five Division Trust Funds, two Health CareTrust Funds, and the Life Insurance Reserve. Thisinformation has been derived from PERA’s auditedfinancial statements. For the year endedDecember 31, 2019, the FNP for five Division TrustFunds, two Health Care Trust Funds, and the LifeInsurance Reserve increased by $6,871,234, $93,925, and$3,299, respectively. The increase was principally due toan increase in investment income. While the annualchanges in FNP can provide meaningful insight into thefinancial activities and financial status, long-term viewsand trend analysis is a critical factor in reporting andunderstanding the financial status of PERA.
Financial Section
MANAGEMENT'S DISCUSSION AND ANALYSIS (UNAUDITED)(Dollars in Thousands)
30 Financial Section � Colorado PERA Comprehensive Annual Financial Report 2019
Final D
raft
June
12,
202
0

FIDUCIARY NET POSITIONAs of December 31
Division Trust Funds Health Care Trust Funds Private Purpose Trust Fund2019 2018 % Chg 2019 2018 % Chg 2019 2018 % Chg
AssetsCash and short-term investments $679,525 $414,063 64.1% $4,932 $2,827 74.5% $312 $181 72.4%Securities lending collateral 1,302,451 814,060 60.0% 9,452 5,558 70.1% 600 356 68.5%Receivables 443,179 777,943 (43.0%) 53,459 44,588 19.9% 131 274 (52.2%)Investments, at fair value 50,908,381 44,215,308 15.1% 369,463 301,889 22.4% 23,403 19,319 21.1%Capital assets, net of accumulated depreciation 14,315 13,824 3.6% — — —% — — —%
Total assets 53,347,851 46,235,198 15.4% 437,306 354,862 23.2% 24,446 20,130 21.4%
LiabilitiesInvestment settlements and other liabilities 268,014 515,909 (48.1%) 30,711 46,093 (33.4%) 2,706 1,933 40.0%Securities lending obligations 1,301,955 812,641 60.2% 9,449 5,548 70.3% 599 355 68.7%
Total liabilities 1,569,969 1,328,550 18.2% 40,160 51,641 (22.2%) 3,305 2,288 44.4%Fiduciary net position $51,777,882 $44,906,648 15.3% $397,146 $303,221 31.0% $21,141 $17,842 18.5%
CHANGES IN FIDUCIARY NET POSITIONFor the Years Ended December 31
Division Trust Funds Health Care Trust Funds Private Purpose Fund2019 2018 % Chg 2019 2018 % Chg 2019 2018 % Chg
AdditionsEmployer contributions $1,754,628 $1,632,725 7.5% $99,660 $93,976 6.0% $— $— —%Nonemployer contributions 225,000 225,000 —% — — —% — — —%Member contributions 817,241 737,781 10.8% — — —% — — —%Purchased service 66,453 61,956 7.3% — — —% — — —%Investment income (loss) 8,927,933 (1,604,013) 656.6% 58,759 (10,572) 655.8% 3,901 (684) 670.3%Other 10,127 17,680 (42.7%) 7,172 8,578 (16.4%) — 4 (100.0%)
Total additions 11,801,382 1,071,129 1001.8% 165,591 91,982 80.0% 3,901 (680) 673.7%
DeductionsBenefit payments 4,708,541 4,611,125 2.1% 61,865 65,935 (6.2%) — — —%Refunds 161,202 168,387 (4.3%) — — —% — — —%Disability and life
insurance premiums 6,162 6,487 (5.0%) — — —% 479 433 10.6%Administrative expenses 39,186 41,089 (4.6%) 9,767 21,246 (54.0%) 123 111 10.8%Other 15,057 14,813 1.6% 34 110 (69.1%) — — —%
Total deductions 4,930,148 4,841,901 1.8% 71,666 87,291 (17.9%) 602 544 10.7%Change in fiduciary net position 6,871,234 (3,770,772) 282.2% 93,925 4,691 1902.2% 3,299 (1,224) 369.5%Fiduciary net position
Beginning of year 44,906,648 48,677,420 (7.7%) 303,221 298,530 1.6% 17,842 19,066 (6.4%)End of year $51,777,882 $44,906,648 15.3% $397,146 $303,221 31.0% $21,141 $17,842 18.5%
Financial Section
MANAGEMENT'S DISCUSSION AND ANALYSIS (UNAUDITED)(Dollars in Thousands)
Colorado PERA Comprehensive Annual Financial Report 2019 � Financial Section 31
Final D
raft
June
12,
202
0
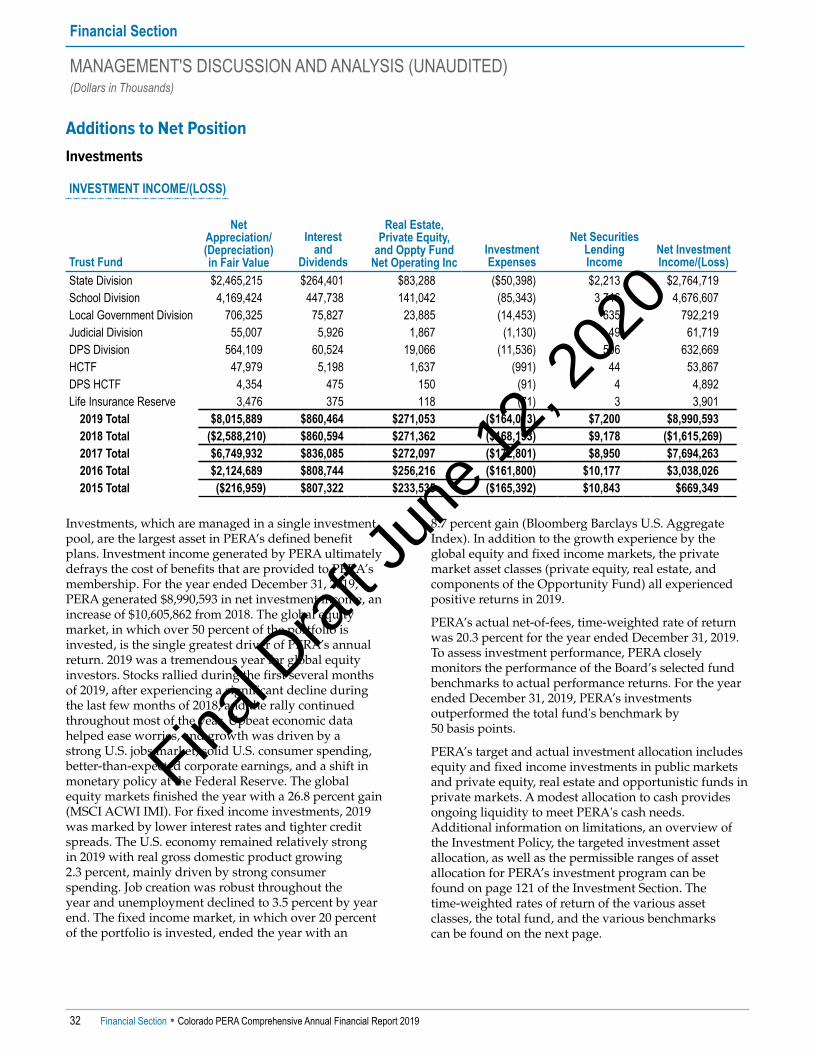
Additions to Net PositionInvestments
INVESTMENT INCOME/(LOSS)
Trust Fund
NetAppreciation/(Depreciation) in Fair Value
Interest and
Dividends
Real Estate, Private Equity,
and Oppty Fund Net Operating Inc
Investment Expenses
Net SecuritiesLendingIncome
Net InvestmentIncome/(Loss)
State Division $2,465,215 $264,401 $83,288 ($50,398) $2,213 $2,764,719School Division 4,169,424 447,738 141,042 (85,343) 3,746 4,676,607Local Government Division 706,325 75,827 23,885 (14,453) 635 792,219Judicial Division 55,007 5,926 1,867 (1,130) 49 61,719DPS Division 564,109 60,524 19,066 (11,536) 506 632,669HCTF 47,979 5,198 1,637 (991) 44 53,867DPS HCTF 4,354 475 150 (91) 4 4,892Life Insurance Reserve 3,476 375 118 (71) 3 3,901
2019 Total $8,015,889 $860,464 $271,053 ($164,013) $7,200 $8,990,5932018 Total ($2,588,210) $860,594 $271,362 ($168,193) $9,178 ($1,615,269)2017 Total $6,749,932 $836,085 $272,097 ($172,801) $8,950 $7,694,2632016 Total $2,124,689 $808,744 $256,216 ($161,800) $10,177 $3,038,0262015 Total ($216,959) $807,322 $233,535 ($165,392) $10,843 $669,349
Investments, which are managed in a single investmentpool, are the largest asset in PERA’s defined benefitplans. Investment income generated by PERA ultimatelydefrays the cost of benefits that are provided to PERA’smembership. For the year ended December 31, 2019,PERA generated $8,990,593 in net investment income, anincrease of $10,605,862 from 2018. The global equitymarket, in which over 50 percent of the portfolio isinvested, is the single greatest driver of PERA’s annualreturn. 2019 was a tremendous year for global equityinvestors. Stocks rallied during the first several monthsof 2019, after experiencing a significant decline duringthe last few months of 2018, and the rally continuedthroughout most of the year. Upbeat economic datahelped ease worries, and growth was driven by astrong U.S. jobs market, solid U.S. consumer spending,better-than-expected corporate earnings, and a shift inmonetary policy at the Federal Reserve. The globalequity markets finished the year with a 26.8 percent gain(MSCI ACWI IMI). For fixed income investments, 2019was marked by lower interest rates and tighter creditspreads. The U.S. economy remained relatively strongin 2019 with real gross domestic product growing2.3 percent, mainly driven by strong consumerspending. Job creation was robust throughout theyear and unemployment declined to 3.5 percent by yearend. The fixed income market, in which over 20 percentof the portfolio is invested, ended the year with an
8.7 percent gain (Bloomberg Barclays U.S. AggregateIndex). In addition to the growth experience by theglobal equity and fixed income markets, the privatemarket asset classes (private equity, real estate, andcomponents of the Opportunity Fund) all experiencedpositive returns in 2019.
PERA’s actual net-of-fees, time-weighted rate of returnwas 20.3 percent for the year ended December 31, 2019.To assess investment performance, PERA closelymonitors the performance of the Board’s selected fundbenchmarks to actual performance returns. For the yearended December 31, 2019, PERA’s investmentsoutperformed the total fund's benchmark by50 basis points.
PERA’s target and actual investment allocation includesequity and fixed income investments in public marketsand private equity, real estate and opportunistic funds inprivate markets. A modest allocation to cash providesongoing liquidity to meet PERA's cash needs.Additional information on limitations, an overview ofthe Investment Policy, the targeted investment assetallocation, as well as the permissible ranges of assetallocation for PERA’s investment program can befound on page 121 of the Investment Section. The time-weighted rates of return of the various assetclasses, the total fund, and the various benchmarkscan be found on the next page.
Financial Section
MANAGEMENT'S DISCUSSION AND ANALYSIS (UNAUDITED)(Dollars in Thousands)
32 Financial Section � Colorado PERA Comprehensive Annual Financial Report 2019
Final D
raft
June
12,
202
0
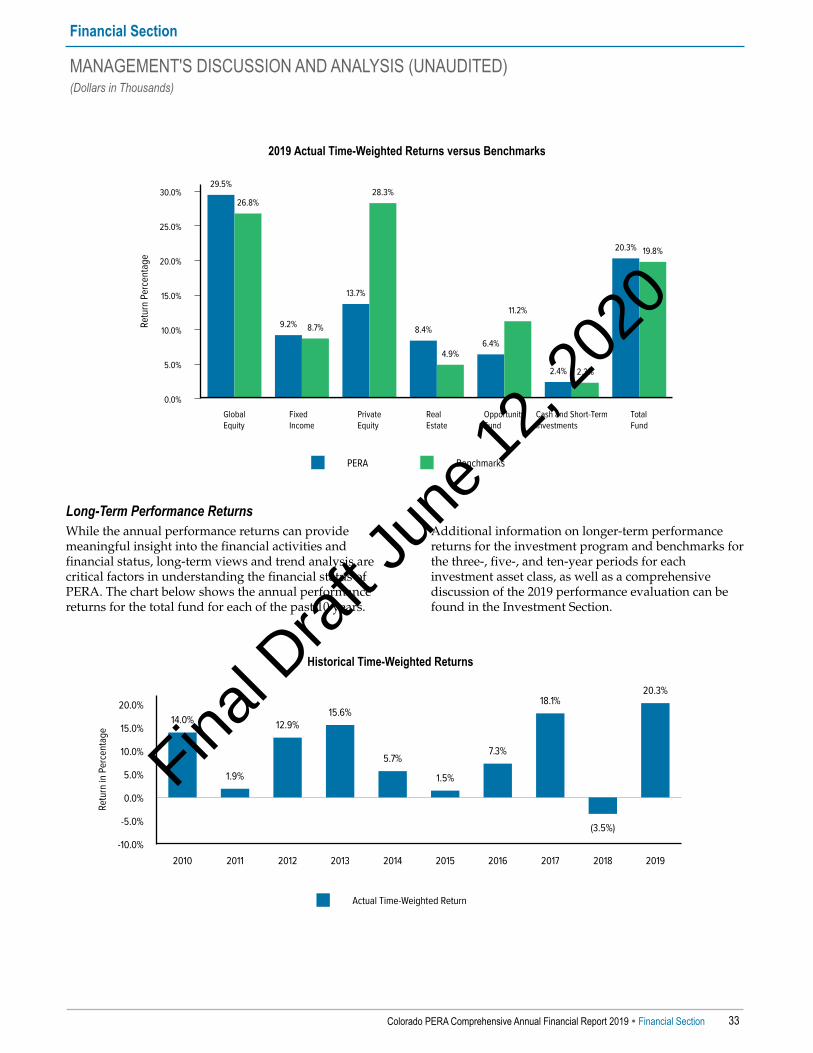
PERA Benchmarks
2019 Actual Time-Weighted Returns versus Benchmarks
30.0%
25.0%
20.0%
15.0%
10.0%
5.0%
0.0%
Retu
rnPe
rcen
tage
GlobalEquity
FixedIncome
PrivateEquity
RealEstate
OpportunityFund
Cash and Short-TermInvestments
TotalFund
29.5%
9.2%
13.7%
8.4%
6.4%
2.4%
20.3%
26.8%
8.7%
28.3%
4.9%
11.2%
2.3%
19.8%
Long-Term Performance ReturnsWhile the annual performance returns can providemeaningful insight into the financial activities andfinancial status, long-term views and trend analysis arecritical factors in understanding the financial status ofPERA. The chart below shows the annual performancereturns for the total fund for each of the past 10 years.
Additional information on longer-term performancereturns for the investment program and benchmarks forthe three-, five-, and ten-year periods for eachinvestment asset class, as well as a comprehensivediscussion of the 2019 performance evaluation can befound in the Investment Section.
Actual Time-Weighted Return
Historical Time-Weighted Returns
20.0%
15.0%
10.0%
5.0%
0.0%
-5.0%
-10.0%
Retu
rnin
Perc
enta
ge
2010 2011 2012 2013 2014 2015 2016 2017 2018 2019
14.0%
1.9%
12.9%15.6%
5.7%
1.5%
7.3%
18.1%
(3.5%)
20.3%
Financial Section
MANAGEMENT'S DISCUSSION AND ANALYSIS (UNAUDITED)(Dollars in Thousands)
Colorado PERA Comprehensive Annual Financial Report 2019 � Financial Section 33
Final D
raft
June
12,
202
0

Contributions
TOTAL CONTRIBUTIONS FOR DIVISION AND HEALTH CARE TRUST FUNDS
Trust FundEmployer
Contributions1NonemployerContributions2
MemberContributions
PurchasedService
Retiree Health
and LifePremiums
EmployerDisaffiliation
Payment Other
Total Contributions
and OtherState Division $612,282 $77,088 $257,803 $29,494 $— $— $22 $976,689School Division 1,002,760 127,367 436,899 25,992 — — 364 1,593,382Local GovernmentDivision 85,597 — 55,003 7,820 — — 14 148,434Judicial Division 10,649 1,344 4,575 612 — — 6,697 23,877DPS Division 43,340 19,201 62,961 2,535 — — 3,030 131,067HCTF 92,011 — — — — — 6,984 98,995DPS HCTF 7,649 — — — — — 188 7,837
2019 Total $1,854,288 $225,000 $817,241 $66,453 $— $— $17,299 $2,980,2812018 Total $1,726,701 $225,000 $737,781 $61,956 $— $— $26,258 $2,777,6962017 Total $1,625,673 $— $706,499 $67,454 $— $1,159 $32,231 $2,433,0162016 Total $1,522,319 $— $687,202 $58,152 $144,759 $— $24,362 $2,436,7942015 Total $1,409,632 $— $665,662 $61,383 $134,148 $— $18,686 $2,289,511
1 Employer contributions include the employer statutory rate, AED, and SAED, less an offset of 13.48 percent in 2019 for the DPS Division as required byC.R.S. § 24-51-412 et seq.
2 Contributions from a nonemployer contributing entity are required by C.R.S. § 24-51-414 et seq.
Contribution rates are set in statute and are thusdetermined by the Colorado General Assembly. Seepages 243-250 in the Statistical Section for the Scheduleof Contribution Rate History.
Contributions 2019 2018From members to theDivision Trust Funds $817,241 $737,781From employers to theDivision Trust Funds,HCTF, and DPS HCTF 1,854,288 1,726,701
Contributions increased due to increases in payroll andincreases in member and contribution rates subject toC.R.S. § 24-51-413. The contribution of $225 million(actual dollars) from the nonemployer contributingentity commenced in 2018 in accordance withC.R.S. § 24-51-414. At the end of 2019, PERA hadreceivables in the amount of $208,702 which primarilyrepresents contributions owed by members andemployers for service credit earned in December 2019and anticipated health care subsidies. Over the past30 years, member contributions represent 17 percent ofthe inflows into the Division Trust Funds, andcontributions from employer and nonemployercontributing entities represent 21 percent of theinflows into the Division Trust Funds and Health CareTrust Funds.
C.R.S. § 24-51-412 et seq. provides for a unique offset tothe employer contributions that otherwise would go
toward financing the unfunded actuarial accruedliability (UAAL) of the DPS Division, allowing relief toDPS Division employers by recognizing the dollars theycontribute toward the pension certificates ofparticipation (PCOPs). The statute states that as long asthe funded status of the DPS Division exceeds that of theSchool Division, the Denver Public Schools is allowedthis offset to the DPS Division employer contributionrate. The offset, expressed as a percentage of payroll, isequal to the annual assumed payment obligations forPCOPs issued in 1997 and 2008, including subsequentrefinancing by the Denver Public Schools at a fixedeffective annual interest rate of 8.50 percent. At aminimum, the DPS Division employer contribution ratemust be sufficient to fund the DPS HCTF (1.02 percent)and the Annual Increase Reserve (AIR) (1.00 percent)applicable to the DPS Division. The annual increase (AI)is a post-retirement, cost-of-living adjustment meetingcertain criteria as described in Note 1 of the Notes to theFinancial Statements. The staff of Denver Public Schoolscalculated the PCOP offset rate of 13.48 percent for 2019.
C.R.S. § 24-51-401(1.7)(e) requires a periodic ”true-up”calculation to be performed beginning in 2015 and everyfive years following, with the purpose of determiningthe total DPS Division employer contribution rate thatwould result in the equalization of the ratio of unfundedactuarial accrued liability (UAAL) over payroll betweenthe DPS and School Divisions at the end of the 30-yearperiod beginning January 1, 2010. Both the 2015calculation and the 2020 calculation indicated that a
Financial Section
MANAGEMENT'S DISCUSSION AND ANALYSIS (UNAUDITED)(Dollars in Thousands)
34 Financial Section � Colorado PERA Comprehensive Annual Financial Report 2019
Final D
raft
June
12,
202
0
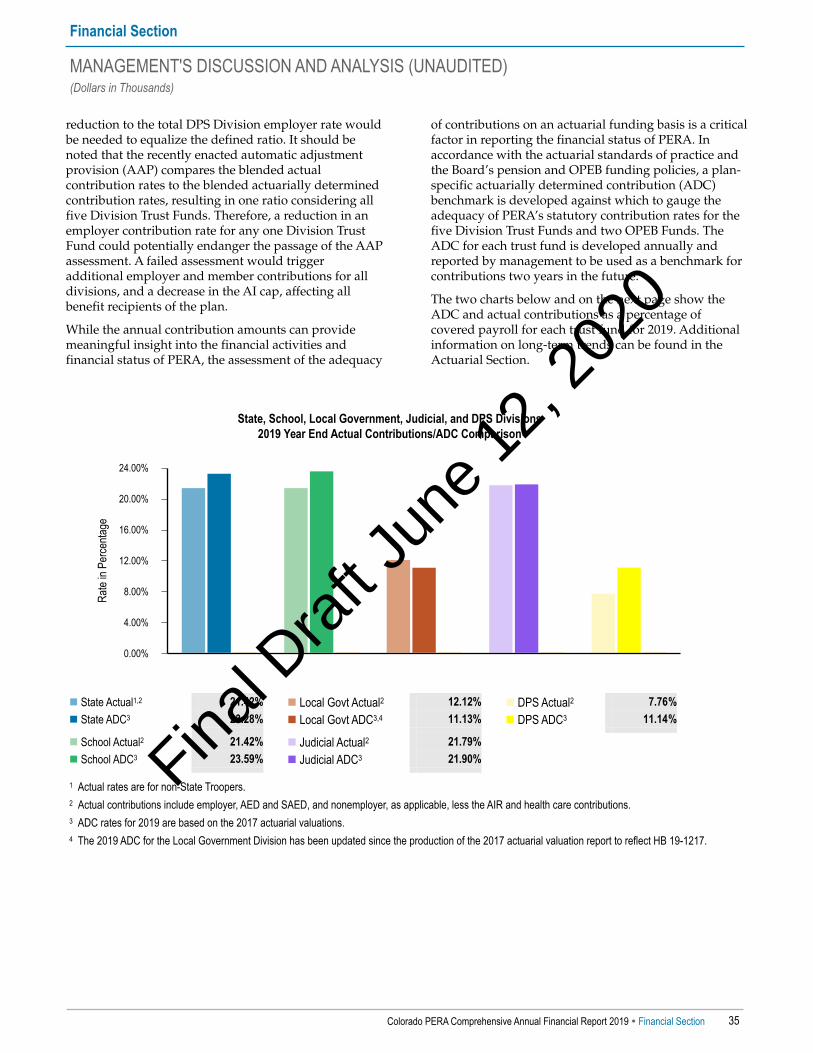
reduction to the total DPS Division employer rate wouldbe needed to equalize the defined ratio. It should benoted that the recently enacted automatic adjustmentprovision (AAP) compares the blended actualcontribution rates to the blended actuarially determinedcontribution rates, resulting in one ratio considering allfive Division Trust Funds. Therefore, a reduction in anemployer contribution rate for any one Division TrustFund could potentially endanger the passage of the AAPassessment. A failed assessment would triggeradditional employer and member contributions for alldivisions, and a decrease in the AI cap, affecting allbenefit recipients of the plan.
Financial Section
MANAGEMENT'S DISCUSSION AND ANALYSIS (UNAUDITED)(Dollars in Thousands)
Colorado PERA Comprehensive Annual Financial Report 2019 � Financial Section 35
While the annual contribution amounts can providemeaningful insight into the financial activities andfinancial status of PERA, the assessment of the adequacy
of contributions on an actuarial funding basis is a criticalfactor in reporting the financial status of PERA. Inaccordance with the actuarial standards of practice andthe Board’s pension and OPEB funding policies, a plan-specific actuarially determined contribution (ADC)benchmark is developed against which to gauge theadequacy of PERA’s statutory contribution rates for thefive Division Trust Funds and two OPEB Funds. TheADC for each trust fund is developed annually andreported by management to be used as a benchmark forcontributions two years in the future.
The two charts below and on the next page show theADC and actual contributions as a percentage ofcovered payroll for each trust fund for 2019. Additionalinformation on long-term trends can be found in theActuarial Section.
State, School, Local Government, Judicial, and DPS Divisions2019 Year End Actual Contributions/ADC Comparison
24.00%
20.00%
16.00%
12.00%
8.00%
4.00%
0.00%
Rate
inPe
rcenta
ge
n State Actual1,2 21.42% n Local Govt Actual2 12.12% n DPS Actual2 7.76%n State ADC3 23.28% n Local Govt ADC3,4 11.13% n DPS ADC3 11.14%
n School Actual2 21.42% n Judicial Actual2 21.79%n School ADC3 23.59% n Judicial ADC3 21.90%
1 Actual rates are for non-State Troopers. 2 Actual contributions include employer, AED and SAED, and nonemployer, as applicable, less the AIR and health care contributions. 3 ADC rates for 2019 are based on the 2017 actuarial valuations. 4 The 2019 ADC for the Local Government Division has been updated since the production of the 2017 actuarial valuation report to reflect HB 19-1217.
Final D
raft
June
12,
202
0
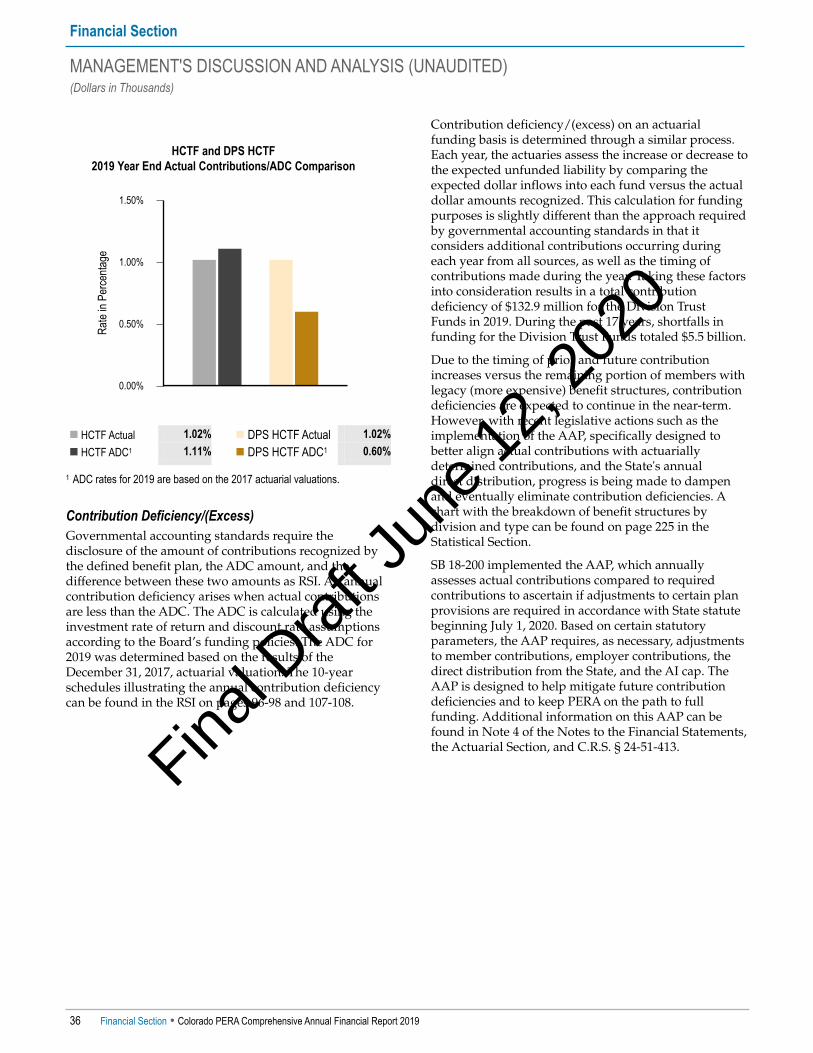
HCTF and DPS HCTF2019 Year End Actual Contributions/ADC Comparison
1.50%
1.00%
0.50%
0.00%
Rate
inPe
rcenta
ge
n HCTF Actual 1.02% n DPS HCTF Actual 1.02%n HCTF ADC1 1.11% n DPS HCTF ADC1 0.60%
1 ADC rates for 2019 are based on the 2017 actuarial valuations.
Contribution Deficiency/(Excess)Governmental accounting standards require thedisclosure of the amount of contributions recognized bythe defined benefit plan, the ADC amount, and thedifference between these two amounts as RSI. An annualcontribution deficiency arises when actual contributionsare less than the ADC. The ADC is calculated using theinvestment rate of return and discount rate assumptionsaccording to the Board’s funding policies. The ADC for2019 was determined based on the results of theDecember 31, 2017, actuarial valuation. The 10-yearschedules illustrating the annual contribution deficiencycan be found in the RSI on pages 96-98 and 107-108.
Contribution deficiency/(excess) on an actuarialfunding basis is determined through a similar process.Each year, the actuaries assess the increase or decrease tothe expected unfunded liability by comparing theexpected dollar inflows into each fund versus the actualdollar amounts recognized. This calculation for fundingpurposes is slightly different than the approach requiredby governmental accounting standards in that itconsiders additional contributions occurring duringeach year from all sources, as well as the timing ofcontributions made during the year. Taking these factorsinto consideration results in a total contributiondeficiency of $132.9 million for the Division TrustFunds in 2019. During the past 17 years, shortfalls infunding for the Division Trust Funds totaled $5.5 billion.
Due to the timing of prior and future contributionincreases versus the remaining portion of members withlegacy (more expensive) benefit structures, contributiondeficiencies are expected to continue in the near-term.However, with recent legislative actions such as theimplementation of the AAP, specifically designed tobetter align actual contributions with actuariallydetermined contributions, and the State's annualdirect distribution, progress is being made to dampenand eventually eliminate contribution deficiencies. Achart with the breakdown of benefit structures bydivision and type can be found on page 225 in theStatistical Section.
SB 18-200 implemented the AAP, which annuallyassesses actual contributions compared to requiredcontributions to ascertain if adjustments to certain planprovisions are required in accordance with State statutebeginning July 1, 2020. Based on certain statutoryparameters, the AAP requires, as necessary, adjustmentsto member contributions, employer contributions, thedirect distribution from the State, and the AI cap. TheAAP is designed to help mitigate future contributiondeficiencies and to keep PERA on the path to fullfunding. Additional information on this AAP can befound in Note 4 of the Notes to the Financial Statements,the Actuarial Section, and C.R.S. § 24-51-413.
Financial Section
MANAGEMENT'S DISCUSSION AND ANALYSIS (UNAUDITED)(Dollars in Thousands)
36 Financial Section � Colorado PERA Comprehensive Annual Financial Report 2019
Final D
raft
June
12,
202
0

CONTRIBUTION DEFICIENCY/(EXCESS)(Dollars in Millions)
Trust Fund 2019 2018 2017 2016 2015
Cumulative Deficiency/(Excess)
2003–2019State Division $21.1¹ $117.8¹ $32.2 $59.9 $116.7 $1,756.5School Division 94.2¹ 261.2¹ 133.0 144.4 187.7 2,767.5State and School Division2 N/A N/A N/A N/A N/A 685.5Local Government Division (6.3) 17.8 (7.1)³ (3.3) 8.4 (194.7)Judicial Division (0.1)¹ 4.4¹ (0.2) (0.1) 2.6 23.9DPS Division4 24.0¹ 48.8¹ 37.3 48.7 65.5 463.1
Total Division Trust Funds $132.9 $450.0 $195.2 $249.6 $380.9 $5,501.8
HCTF ($1.0) ($0.9) ($5.0) 3 ($3.6) $0.1 ($90.0)DPS HCTF4 (3.5) (2.9) (2.6) (2.2) (1.6) (17.6)
Total OPEB Trust Funds ($4.5) ($3.8) ($7.6) ($5.8) ($1.5) ($107.6) 1 Includes contributions from a nonemployer contributing entity as required by C.R.S. § 24-51-412 et seq. 2 The State and School Divisions merged July 1, 1997, and separated on January 1, 2006. 3 Includes the receipt of the disaffiliation payment for Cunningham Fire Protection District. See “2017 Changes in Plan Provisions Since 2016,” in Note 1 of the
Notes to the RSI—Division Trust Funds for more information. 4 The DPS Division and DPS HCTF were established on January 1, 2010.
Amortization of Unfunded Actuarial Accrued LiabilitiesThe table below shows the amortization periods for theDivision Trust Funds and Health Care Trust Funds forthe prior and current valuation year. The amortizationperiods determined as of the December 31, 2019,actuarial valuation are shown prior to and afterconsideration of the contribution provisions enactedunder HB 20-1379 and HB 20-1394:
Actuarial Funding Valuation Results
Trust Fund
2019AmortizationPeriod After
Considerationof HB 20-1379
and HB 20-1394
2019Amortization
Period
2018Amortization
PeriodState Division 27 Years 27 Years 35 YearsSchool Division 28 Years 27 Years 37 YearsLocal Govt Division 22 Years 22 Years 37 YearsJudicial Division 16 Years 16 Years 23 YearsDPS Division 25 Years 24 Years InfiniteHCTF 20 Years 20 Years 25 YearsDPS HCTF 6 Years 6 Years 8 Years
The amortization periods for the Judicial Divisionconsider the future additional contributions ofAmortization Equalization Disbursement (AED) andSupplemental Amortization Equalization Disbursement(SAED) which began in 2019 with continued increasesscheduled through 2023. Additionally, no adjustmenthas been made to the DPS Division for the current PCOPoffset. However, considering anticipated reductions in
the future PCOP offset to DPS employer contributionrequirements for the cost of certain PCOPs as currentlystructured, the realized amortization period isexpected to be lower if the DPS Division’s statutoryemployer contribution amounts are maintained at theircurrent level.
The amortization periods for the five Division TrustFunds do not include the full effect of legislation enactedin 2006, 2010, and 2018. This legislation includes planchanges designed to lower the normal cost over time asnew members are added to PERA’s population, and toallow a greater proportion of the employers’contribution to be used to amortize the unfundedliability. The 2018 legislation also increases futurecontributions to the Division Trust Funds in order tofurther accelerate the amortization of the unfundedliability. The decrease in amortization periods from 2018to the baseline calculations for 2019 is primarily due tofavorable investment experience during 2019, and thereduced AI cap from 1.50 percent to 1.25 percent, perannum. The first column in the table to the left reflectsthe impact of the revised contribution provisionsenacted under HB 20-1379 and HB 20-1394.
Unless otherwise temporarily altered by statute, theamortization periods shown in the table to the leftconsider ongoing employer, member, AED, and SAEDcontributions, including any future statutory increases,and the direct distribution, where applicable.
C.R.S. § 24-51-211 states that a maximum amortizationperiod of 30 years shall be deemed actuarially sound.
Financial Section
MANAGEMENT'S DISCUSSION AND ANALYSIS (UNAUDITED)(Dollars in Thousands)
Colorado PERA Comprehensive Annual Financial Report 2019 � Financial Section 37
Final D
raft
June
12,
202
0
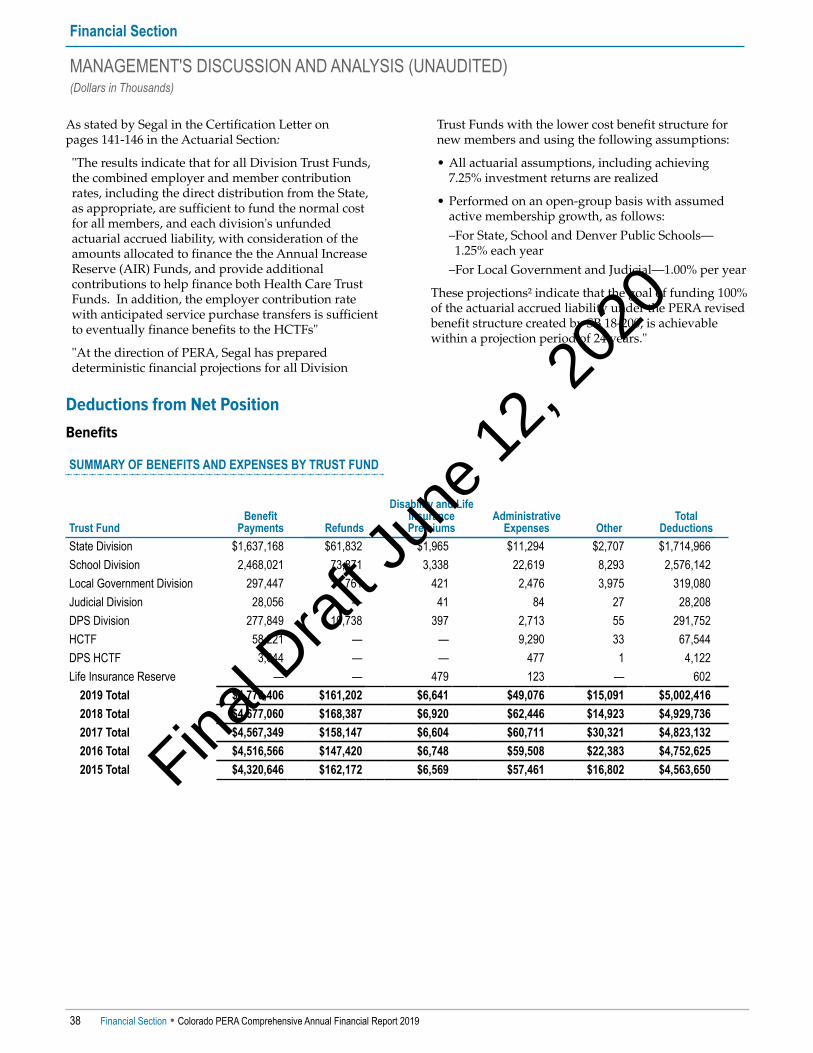
As stated by Segal in the Certification Letter onpages 141-146 in the Actuarial Section:
"The results indicate that for all Division Trust Funds,the combined employer and member contributionrates, including the direct distribution from the State,as appropriate, are sufficient to fund the normal costfor all members, and each division's unfundedactuarial accrued liability, with consideration of theamounts allocated to finance the the Annual IncreaseReserve (AIR) Funds, and provide additionalcontributions to help finance both Health Care TrustFunds. In addition, the employer contribution ratewith anticipated service purchase transfers is sufficientto eventually finance benefits to the HCTFs"
"At the direction of PERA, Segal has prepareddeterministic financial projections for all Division
Trust Funds with the lower cost benefit structure fornew members and using the following assumptions:
• All actuarial assumptions, including achieving7.25% investment returns are realized
• Performed on an open-group basis with assumedactive membership growth, as follows:
–For State, School and Denver Public Schools—1.25% each year
–For Local Government and Judicial—1.00% per year
These projections² indicate that the goal of funding 100%of the actuarial accrued liability under the PERA revisedbenefit structure created by SB 18-200, is achievablewithin a projection period of 24 years."
Financial Section
MANAGEMENT'S DISCUSSION AND ANALYSIS (UNAUDITED)(Dollars in Thousands)
38 Financial Section � Colorado PERA Comprehensive Annual Financial Report 2019
Deductions from Net PositionBenefits
SUMMARY OF BENEFITS AND EXPENSES BY TRUST FUND
Trust FundBenefit
Payments Refunds
Disability and LifeInsurance Premiums
AdministrativeExpenses Other
Total Deductions
State Division $1,637,168 $61,832 $1,965 $11,294 $2,707 $1,714,966School Division 2,468,021 73,871 3,338 22,619 8,293 2,576,142Local Government Division 297,447 14,761 421 2,476 3,975 319,080Judicial Division 28,056 — 41 84 27 28,208DPS Division 277,849 10,738 397 2,713 55 291,752HCTF 58,221 — — 9,290 33 67,544DPS HCTF 3,644 — — 477 1 4,122Life Insurance Reserve — — 479 123 — 602
2019 Total $4,770,406 $161,202 $6,641 $49,076 $15,091 $5,002,4162018 Total $4,677,060 $168,387 $6,920 $62,446 $14,923 $4,929,7362017 Total $4,567,349 $158,147 $6,604 $60,711 $30,321 $4,823,1322016 Total $4,516,566 $147,420 $6,748 $59,508 $22,383 $4,752,6252015 Total $4,320,646 $162,172 $6,569 $57,461 $16,802 $4,563,650Fina
l Dra
ft Ju
ne 1
2, 2
020
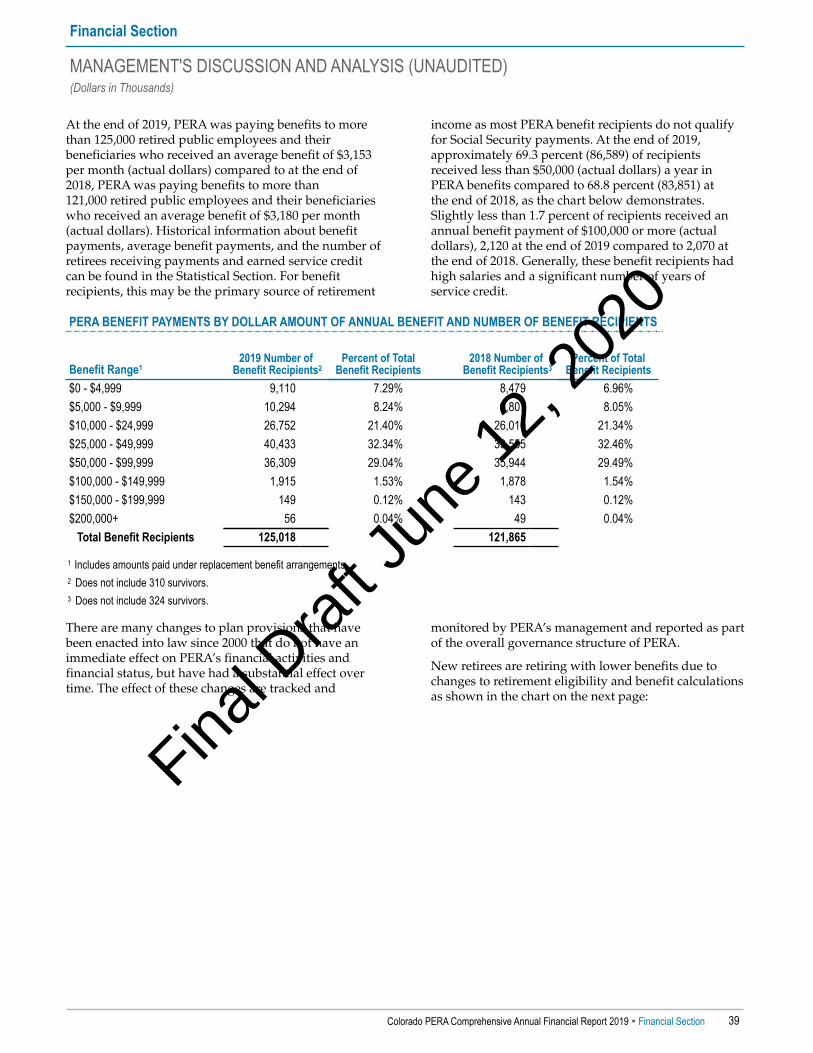
At the end of 2019, PERA was paying benefits to morethan 125,000 retired public employees and theirbeneficiaries who received an average benefit of $3,153per month (actual dollars) compared to at the end of2018, PERA was paying benefits to more than121,000 retired public employees and their beneficiarieswho received an average benefit of $3,180 per month(actual dollars). Historical information about benefitpayments, average benefit payments, and the number ofretirees receiving payments and earned service creditcan be found in the Statistical Section. For benefitrecipients, this may be the primary source of retirement
income as most PERA benefit recipients do not qualifyfor Social Security payments. At the end of 2019,approximately 69.3 percent (86,589) of recipientsreceived less than $50,000 (actual dollars) a year inPERA benefits compared to 68.8 percent (83,851) atthe end of 2018, as the chart below demonstrates.Slightly less than 1.7 percent of recipients received anannual benefit payment of $100,000 or more (actualdollars), 2,120 at the end of 2019 compared to 2,070 atthe end of 2018. Generally, these benefit recipients hadhigh salaries and a significant number of years ofservice credit.
PERA BENEFIT PAYMENTS BY DOLLAR AMOUNT OF ANNUAL BENEFIT AND NUMBER OF BENEFIT RECIPIENTS
Benefit Range12019 Number of
Benefit Recipients2Percent of Total
Benefit Recipients2018 Number of
Benefit Recipients3Percent of Total
Benefit Recipients$0 - $4,999 9,110 7.29% 8,479 6.96%$5,000 - $9,999 10,294 8.24% 9,807 8.05%$10,000 - $24,999 26,752 21.40% 26,010 21.34%$25,000 - $49,999 40,433 32.34% 39,555 32.46%$50,000 - $99,999 36,309 29.04% 35,944 29.49%$100,000 - $149,999 1,915 1.53% 1,878 1.54%$150,000 - $199,999 149 0.12% 143 0.12%$200,000+ 56 0.04% 49 0.04%
Total Benefit Recipients 125,018 121,865 1 Includes amounts paid under replacement benefit arrangements. 2 Does not include 310 survivors. 3 Does not include 324 survivors.
There are many changes to plan provisions that havebeen enacted into law since 2000 that do not have animmediate effect on PERA’s financial activities andfinancial status, but have had a substantial effect overtime. The effect of these changes are tracked and
monitored by PERA’s management and reported as partof the overall governance structure of PERA.
New retirees are retiring with lower benefits due tochanges to retirement eligibility and benefit calculationsas shown in the chart on the next page:
Financial Section
MANAGEMENT'S DISCUSSION AND ANALYSIS (UNAUDITED)(Dollars in Thousands)
Colorado PERA Comprehensive Annual Financial Report 2019 � Financial Section 39
Final D
raft
June
12,
202
0

For All Retirees For Members Who Retired During Year
Average Benefits Payable Per Month (In Actual Dollars)
$4,000
$3,000
$2,000
$1,000
$0
2019 2018 2017 2016 2015
$3,179 $3,208 $3,232 $3,193 $3,153
$2,482 $2,523 $2,555 $2,519 $2,531
Financial Section
MANAGEMENT'S DISCUSSION AND ANALYSIS (UNAUDITED)(Dollars in Thousands)
40 Financial Section � Colorado PERA Comprehensive Annual Financial Report 2019
Other ChangesFor the year ended December 31, 2019, PERA had cashand short‑term investments of $684,769, an increase of$267,698 from 2018. The increase was primarily due to agreater overall need for liquidity.
For the year ended December 31, 2019, PERA hadsecurities lending collateral of $1,312,503 and securitieslending obligations of $1,312,003, an increase of $492,529and $493,459, respectively, from 2018. The securitieslending collateral and obligations increased primarilydue to an increase in the securities on loan as a result ofincreased borrower demand.
For the year ended December 31, 2019, PERA hadinvestment settlements and other liabilities of $301,431,a decrease of $262,504 from 2018. The decrease wasprimarily due to lower pending settlements of fixedincome investment purchases.
For the year ended December 31, 2019, PERA had totalreceivables of $496,769, a decrease of $326,036 from 2018.The decrease was primarily due to lower pendingsettlements of fixed income investment sales.
For the year ended December 31, 2019, other additionsfor the Division Trust Funds decreased by $7,553. Thedecrease was primarily due to a one-time investmentsettlement income received in 2018.
Administrative expenses of the Health Care Trust Fundsdecreased from $21,246 in 2018 to $9,767 in 2019. Thedecrease was primarily due to the Medicare portion ofAnthem changing to fully insured. This change resultedin reduced membership in the self-insured portionthereby lowering the administrative expense paid.
For the year ended December 31, 2019, other deductionsdecreased by $76 for the Health Care Trust Funds. Thedecrease was primarily due to lower self-insuredmembership counts, as a result of the change in theMedicare plan, used to calculate the health care feesrelated to the Affordable Care Act.
Actuarial Valuations: Accounting Separate actuarial valuations are prepared foraccounting and funding purposes for the Division TrustFunds and the Health Care Trust Funds. Calculations forpurposes of financial reporting for the pension andOPEB plans are determined in accordance with GASB 67and GASB 74, respectively.
The actuarial valuation for accounting purposesemphasizes the obligation an employer incurs toemployees through the employment-exchange process.The primary purpose of the valuation for accountingpurposes is to provide a consistent, standardizedmethodology that allows comparability of amounts andincreased transparency of liabilities across U.S. planscomplying with GASB 67 and GASB 74. One of the keymeasurements in the accounting valuation whichassesses the pension liabilities for financial reportingpurposes is the NPL. The NPL is the difference betweenthe FNP and the total pension liability (TPL). Similarly,one of the key measurements which assesses the OPEBliabilities for financial reporting purposes is the NOL.The NOL is the difference between the FNP and the totalOPEB liability (TOL). The individual components whichcollectively comprise the FNP can be found in theStatements of Fiduciary Net Position on pages 44-45.
Final D
raft
June
12,
202
0

PERA-affiliated employers who comply with GASB 68and GASB 75 are required to report their proportionateshare of the collective NPL, collective NOL, and otherrelated amounts for the plan(s) they participate in.GASB requires that employer contributions andnonemployer contributions (if applicable) be used asa basis for the proportion.
The schedules below show the collective NPLs andNOLs as of December 31, 2019, and December 31, 2018,as well as the breakdown of changes in the collectiveNPLs and NOLs for 2019. The reduction of the liabilitiesfor the Division Trust Funds is primarily due to positiveinvestment performance during 2019.
SCHEDULE OF CHANGES IN NET PENSION LIABILITY
State DivisionTrust Fund
School DivisionTrust Fund
LocalGovernment
Division Trust Fund
JudicialDivision
Trust FundDPS DivisionTrust Fund
All Division Trust Funds1
2018 Net pension liability $11,378,673 $17,707,054 $1,257,213 $141,258 $1,022,901 $31,507,099Service cost 344,666 618,937 75,305 8,774 91,764 1,139,446Interest 1,800,848 2,938,492 373,200 32,105 301,210 5,445,855Changes of benefit terms (501,768) (856,299) (105,812) (8,459) (82,064) (1,554,402)Differences between expectedand actual experience 408,792 770,676 65,687 2,732 86,001 1,333,888
Changes of assumptions or other inputs — — — — — —Contributions—employer (612,282) (1,002,760) (85,597) (10,649) (43,340) (1,754,628)Contributions—nonemployer (77,088) (127,367) — (1,344) (19,201) (225,000)Contributions—active member(includes purchased service) (287,297) (462,891) (62,823) (5,187) (65,496) (883,694)
Net investment gain (2,764,719) (4,676,607) (792,219) (61,719) (632,669) (8,927,933)Administrative expense 11,294 22,619 2,476 84 2,713 39,186Other 2,685 7,929 3,961 (6,670) (2,975) 4,9302019 Net pension liability $9,703,804 $14,939,783 $731,391 $90,925 $658,844 $26,124,747
1 The data in this table is aggregated for informational purposes. The assets of each trust fund are for the sole purpose of its members and cannot be used byanother fund.
SCHEDULE OF CHANGES IN NET OPEB LIABILITY
Health CareTrust Fund
DPS Health CareTrust Fund
All Health CareTrust Funds1
2018 Net OPEB liability $1,360,542 $45,170 $1,405,712Service cost 18,159 1,342 19,501Interest 117,840 4,970 122,810Changes of benefit terms — — —Differences between expected and actual experience (224,212) (2,070) (226,282)Changes of assumptions or other inputs 2,006 — 2,006Contributions—employer (92,011) (7,649) (99,660)Purchased service transfers (4,484) (36) (4,520)Net investment gain (53,867) (4,892) (58,759)Administrative expense2 2,492 154 2,646Other (2,467) (152) (2,619)2019 Net OPEB liability $1,123,998 $36,837 $1,160,835
1 The data in this table is aggregated for informational purposes. The assets of each trust fund are for the sole purpose of its members and cannot be used byanother fund.
2 Excludes administrative and other health care claims processing fees.
Financial Section
MANAGEMENT'S DISCUSSION AND ANALYSIS (UNAUDITED)(Dollars in Thousands)
Colorado PERA Comprehensive Annual Financial Report 2019 � Financial Section 41
Final D
raft
June
12,
202
0

Additional information regarding the net pensionliabilities and net OPEB liabilities, assumptions used todetermine these liabilities, sensitivity analysis of pensionliabilities based on different discount rates, sensitivityanalysis based on different discount and health caretrend rates, and development of the investment rate ofreturn assumption can be found in Notes 10 and 11 ofthe Notes to the Financial Statements.
Financial Section
MANAGEMENT'S DISCUSSION AND ANALYSIS (UNAUDITED)(Dollars in Thousands)
42 Financial Section � Colorado PERA Comprehensive Annual Financial Report 2019
Defined Contribution and DeferredCompensation PlansComparative Financial StatementsPERA administers two defined contribution plans and adeferred compensation plan. Below and to the right arethe comparative condensed statements of fiduciary netposition and changes in fiduciary net position for theVoluntary Investment Program (PERAPlus 401(k) Plan),Defined Contribution Retirement Plan (DC Plan), andDeferred Compensation Plan (PERAPlus 457 Plan). Thisinformation has been derived from PERA’s auditedfinancial statements. While the annual changes in FNPcan provide meaningful insight into the financialactivities and financial status of PERA, long-term viewsand trend analysis are critical factors in reporting andunderstanding the financial status of the plans.
DEFINED CONTRIBUTION AND DEFERRED COMPENSATION PLANS FIDUCIARY NET POSITIONAs of December 31
2019 2018 % ChgAssetsCash and short-term investments $38,047 $33,070 15.0%Securities lending collateral 111,317 21,772 411.3%Receivables 101,728 107,788 (5.6%)Investments, at fair value 4,813,786 3,955,337 21.7%
Total assets 5,064,878 4,117,967 23.0%
LiabilitiesInvestment settlements and other liabilities 25,233 30,101 (16.2%)Securities lending obligations 111,299 21,729 412.2%
Total liabilities 136,532 51,830 163.4%Fiduciary net position $4,928,346 $4,066,137 21.2%
DEFINED CONTRIBUTION AND DEFERRED COMPENSATION PLANS CHANGES IN FIDUCIARY NET POSITIONFor the Years Ended December 31
2019 2018 % ChgAdditionsEmployer contributions $20,917 $18,639 12.2%Member contributions 217,637 200,743 8.4%Investment income
(loss) 912,712 (228,294) 499.8%Other 3,042 2,907 4.6%
Total additions 1,154,308 (6,005) 19,322.4%
DeductionsRefunds 283,772 271,974 4.3%Administrative
expenses 5,777 5,223 10.6%Other 2,550 2,520 1.2%
Total deductions 292,099 279,717 4.4%Change in fiduciary net position 862,209 (285,722) 401.8%Fiduciary net position
Beginning of year 4,066,137 4,351,859 (6.6%)End of year $4,928,346 $4,066,137 21.2%
InvestmentsInvestments for the two defined contribution plans andthe deferred compensation plan are managed in a singleinvestment pool. Underlying investments are groupedinto one of 16 white label PERAdvantage funds whichparticipants can choose to contribute to and/or maketransfers from on a daily basis. In addition, participantscan choose to select their own investments bytransferring funds into a TD Ameritrade Self-DirectedBrokerage Account. The PERAdvantage investmentsprovide diversification and cover a wide risk/returnspectrum within each of the seven primary investmentoptions and nine target retirement date funds. Thetarget retirement date funds are broadly diversifiedacross global asset classes and automatically adjust theunderlying asset allocation to become more conservativeover time. By investing in a single target retirementdate fund, participants may capture diversifiedinvestment opportunities without having to managemultiple funds. More information about investmentoptions and results can be found in the InvestmentSection on pages 133-138.
Final D
raft
June
12,
202
0
For the year ended December 31, 2019, the definedcontribution and deferred compensation plans netinvestment income changed from a loss of $228,294 in2018 to a gain of $912,712 in 2019, an increase of$1,141,006. Investments at fair value increased by$858,449 or 21.7 percent for the year endedDecember 31, 2019. The increase was primarily due topositive investment returns arising from global equitymarkets. Additional information on longer-termperformance and benchmarks for the three- and five-year periods for each investment class can be foundin the Investment Section.
Plan FeesPlan administrative fees consist of a flat $1.00 (actualdollars) per month per plan for all participants and anasset-based fee of up to 0.03 percent. Participants alsopay asset-based investment management fees whichvary for each investment option. As a result ofPERAdvantage U.S. Small and Mid Cap Stock Fund andPERAdvantage Socially Responsible Investment Fundrestructures in 2019, asset based fees were reduced by 28and 14 basis points respectively, as shown in the tablebelow. See "2019 Changes" in the Investment Section onpage 135 for additional information.
Fund 2019 2018PERAdvantage Capital Preservation Fund 0.24% 0.24%PERAdvantage Fixed Income Fund 0.21% 0.23%PERAdvantage Real Return Fund 0.20% 0.20%PERAdvantage U.S. Large Cap Stock Fund 0.08% 0.08%PERAdvantage International Stock Fund 0.30% 0.31%PERAdvantage U.S. Small and Mid Cap Stock Fund 0.18% 0.46%PERAdvantage Socially Responsible Investment Fund 0.23% 0.37%PERAdvantage Target Retirement Funds 0.10% 0.10%
Note: Fees shown include both administrative fees and investment management fees.Participants who have a Self-Directed Brokerage Account pay an annual $50 (actual dollars)self-directed brokerage fee, with no asset-based administrative fee (revenue sharing offsetsadministrative fees).
Securities Lending For the year ended December 31, 2019, the securitieslending collateral and securities lending obligations inthe defined contribution and deferred compensationplans increased by $89,545 and $89,570, respectively,from 2018. The securities lending collateral andobligations were higher due to an increase in the marketvalue of securities on loan due to additional investmentportfolios added to the securities lending program. Seeinformation about securities lending transactions inNote 5 of the Notes to the Financial Statements onpages 69-70.
Plan Participants and ContributionsIn 2019, overall participation in the PERAPlus 401(k) Plan, DC Plan, and PERAPlus 457 Plan increased by1,236 participants from 2018. The following table showsnumber of participants in each plan at the end of fiscalyears 2019 and 2018.
Plan 2019 2018 ChangePERAPlus 401(k) Plan 68,920 68,700 220DC Plan 6,939 6,363 576PERAPlus 457 Plan 18,919 18,479 440 Total 94,778 93,542 1,236
The table below shows the breakdown of the number ofparticipant accounts for the specified ranges incontributions recognized during 2019 within thePERAPlus 401(k) Plan and PERAPlus 457 Plan. Seecurrent annual contribution limits in Note 8 of the Notesto the Financial Statements on pages 75-77.
PERAPlus 401(k)Plan
PERAPlus 457Plan
Annual contributionranges (actual dollars) 2019 2018 2019 2018 $0 - $5,000 20,307 20,656 7,237 7,339 $5,001 - $10,000 3,515 3,411 1,151 1,066$10,001 - $15,000 1,320 1,296 530 503$15,001 and above 2,265 2,173 1,614 1,510
DistributionsParticipants can take normal distributions when theyreach a certain age depending on the plan, in-servicewithdrawals and transfer of funds after termination ofemployment. For the year ended December 31, 2019, thedefined contribution and deferred compensation planshad refunds of $283,772, an increase of $11,798 from2018. The increase was primarily due to an increase inparticipant distributions. See Note 8 of the Notes to theFinancial Statements for additional information aboutallowable in-service withdrawals in each plan.
Other Significant MattersIn 2020, Governor Polis signed two bills that impactPERA. HB 20-1379 suspends the $225,000 (actualdollars) direct distribution payment for the State's2020-2021 fiscal year. HB 20-1394 adjusts member andemployer contributions for the Judicial Division duringthe State’s 2020-2021 and 2021-2022 fiscal years.
Please see Note 12 of the Notes to the FinancialStatements for further details and information on thisand other subsequent events.
Financial Section
MANAGEMENT'S DISCUSSION AND ANALYSIS (UNAUDITED)(Dollars in Thousands)
Colorado PERA Comprehensive Annual Financial Report 2019 � Financial Section 43
Final D
raft
June
12,
202
0

State Division
Trust Fund
School Division
Trust Fund
Local GovernmentDivision
Trust Fund
Judicial Division
Trust Fund
Denver PublicSchools Division
Trust Fund
Total Defined BenefitPension Plans
AssetsCash and short-term investments
Cash and short-term investments $209,607 $356,722 $60,361 $4,765 $48,070 $679,525Securities lending collateral 401,755 683,732 115,695 9,133 92,136 1,302,451
Total cash and short-term investments 611,362 1,040,454 176,056 13,898 140,206 1,981,976
ReceivablesBenefit 71,476 71,181 7,797 2,221 4,642 157,317Interfund 223 380 65 5 51 724Investment settlements and income 87,954 149,685 25,328 1,999 20,172 285,138
Total receivables 159,653 221,246 33,190 4,225 24,865 443,179
Investments, at fair valueGlobal equity 8,985,946 15,292,842 2,587,726 204,272 2,060,782 29,131,568Fixed income 3,447,652 5,867,429 992,837 78,373 790,664 11,176,955Private equity 1,291,510 2,197,972 371,922 29,359 296,187 4,186,950Real estate 1,418,101 2,413,413 408,377 32,237 325,220 4,597,348Opportunity fund 560,029 953,092 161,274 12,731 128,434 1,815,560Multi-asset class funds — — — — — —Self-directed brokerage — — — — — —
Total investments, at fair value 15,703,238 26,724,748 4,522,136 356,972 3,601,287 50,908,381Capital assets, at cost, net of accumulated
depreciation of $27,797 4,082 8,315 910 30 978 14,315Total assets 16,478,335 27,994,763 4,732,292 375,125 3,767,336 53,347,851
LiabilitiesInvestment settlements and other liabilities 83,870 139,894 23,679 1,762 18,809 268,014Securities lending obligations 401,602 683,472 115,651 9,129 92,101 1,301,955Interfund — — — — — —
Total liabilities 485,472 823,366 139,330 10,891 110,910 1,569,969
Commitments and contingencies (Note 7)
Fiduciary net position restricted for pensions and other postemployment benefits, and held in trust for deferred compensation benefits and private purpose trust fund participants $15,992,863 $27,171,397 $4,592,962 $364,234 $3,656,426 $51,777,882
The accompanying notes are an integral part of these financial statements.
Financial Section
STATEMENTS OF FIDUCIARY NET POSITIONAs of December 31, 2019(Dollars in Thousands)
44 Financial Section � Colorado PERA Comprehensive Annual Financial Report 2019
Final D
raft
June
12,
202
0

Voluntary Investment
Program
Defined Contribution
Retirement Plan
DeferredCompensation
Plan
Health Care
Trust Fund
Denver PublicSchools HealthCare Trust Fund
Life Insurance Reserve
Combined Total
$24,602 $5,151 $8,294 $4,512 $420 $312 $722,81680,563 5,526 25,228 8,647 805 600 1,423,820
105,165 10,677 33,522 13,159 1,225 912 2,146,636
64,928 2,427 16,258 49,128 2,257 — 292,315— — — 5 — — 729
13,441 829 3,845 1,893 176 131 305,45378,369 3,256 20,103 51,026 2,433 131 598,497
2,082,480 96,513 476,560 193,416 18,004 13,392 32,011,933590,160 25,461 243,138 74,208 6,908 5,138 12,121,968
— — — 27,798 2,588 1,925 4,219,261— — — 30,524 2,841 2,113 4,632,826— — — 12,054 1,122 835 1,829,571
885,577 131,638 226,114 — — — 1,243,32930,467 4,930 20,748 — — — 56,145
3,588,684 258,542 966,560 338,000 31,463 23,403 56,115,033
— — — — — — 14,3153,772,218 272,475 1,020,185 402,185 35,121 24,446 58,874,481
18,380 942 5,182 29,031 1,680 2,706 325,93580,538 5,526 25,235 8,644 805 599 1,423,302
493 67 169 — — — 72999,411 6,535 30,586 37,675 2,485 3,305 1,749,966
$3,672,807 $265,940 $989,599 $364,510 $32,636 $21,141 $57,124,515
Financial Section
STATEMENTS OF FIDUCIARY NET POSITIONAs of December 31, 2019(Dollars in Thousands)
Colorado PERA Comprehensive Annual Financial Report 2019 � Financial Section 45
Final D
raft
June
12,
202
0

State Division
Trust Fund
School Division
Trust Fund
Local GovernmentDivision
Trust Fund
Judicial Division
Trust Fund
Denver PublicSchools Division
Trust Fund
Total Defined BenefitPension Plans
AdditionsContributions
Employers $612,282 $1,002,760 $85,597 $10,649 $43,340 $1,754,628Nonemployer 77,088 127,367 — 1,344 19,201 225,000Members 257,803 436,899 55,003 4,575 62,961 817,241Purchased service 29,494 25,992 7,820 612 2,535 66,453
Total contributions 976,667 1,593,018 148,420 17,180 128,037 2,863,322
Investment incomeNet appreciation in fair value of
investments 2,465,215 4,169,424 706,325 55,007 564,109 7,960,080Interest 97,829 165,664 28,056 2,193 22,394 316,136Dividends 166,572 282,074 47,771 3,733 38,130 538,280Real estate, private equity, and
opportunity fund net operating income 83,288 141,042 23,885 1,867 19,066 269,148Less investment expense (50,398) (85,343) (14,453) (1,130) (11,536) (162,860)
Net income from investing activities 2,762,506 4,672,861 791,584 61,670 632,163 8,920,784Securities lending income 2,482 4,203 712 55 568 8,020Less securities lending expense (269) (457) (77) (6) (62) (871)
Net income from securities lending 2,213 3,746 635 49 506 7,149Net investment income 2,764,719 4,676,607 792,219 61,719 632,669 8,927,933
Other additions 22 364 14 6,697 3,030 10,127Total additions 3,741,408 6,269,989 940,653 85,596 763,736 11,801,382
DeductionsBenefits
Benefits paid to retirees/cobeneficiaries 1,622,172 2,452,143 294,858 27,705 276,314 4,673,192Benefits paid to survivors 14,996 15,878 2,589 351 1,535 35,349Benefits paid on behalf of health care
participants — — — — — —Total benefits 1,637,168 2,468,021 297,447 28,056 277,849 4,708,541
Refunds of contribution accounts,including match and interest 61,832 73,871 14,761 — 10,738 161,202
Disability and life insurance premiums 1,965 3,338 421 41 397 6,162Administrative expenses 11,294 22,619 2,476 84 2,713 39,186Other deductions 2,707 8,293 3,975 27 55 15,057
Total deductions 1,714,966 2,576,142 319,080 28,208 291,752 4,930,148Net increase in fiduciary net position 2,026,442 3,693,847 621,573 57,388 471,984 6,871,234Fiduciary net position restricted for pensions and other postemployment benefits, and held in trust for deferred compensation benefits and private purpose trust fund participantsBeginning of year 13,966,421 23,477,550 3,971,389 306,846 3,184,442 44,906,648End of year $15,992,863 $27,171,397 $4,592,962 $364,234 $3,656,426 $51,777,882
The accompanying notes are an integral part of these financial statements.
Financial Section
STATEMENTS OF CHANGES IN FIDUCIARY NET POSITIONFor the Year Ended December 31, 2019(Dollars in Thousands)
46 Financial Section � Colorado PERA Comprehensive Annual Financial Report 2019
Final D
raft
June
12,
202
0
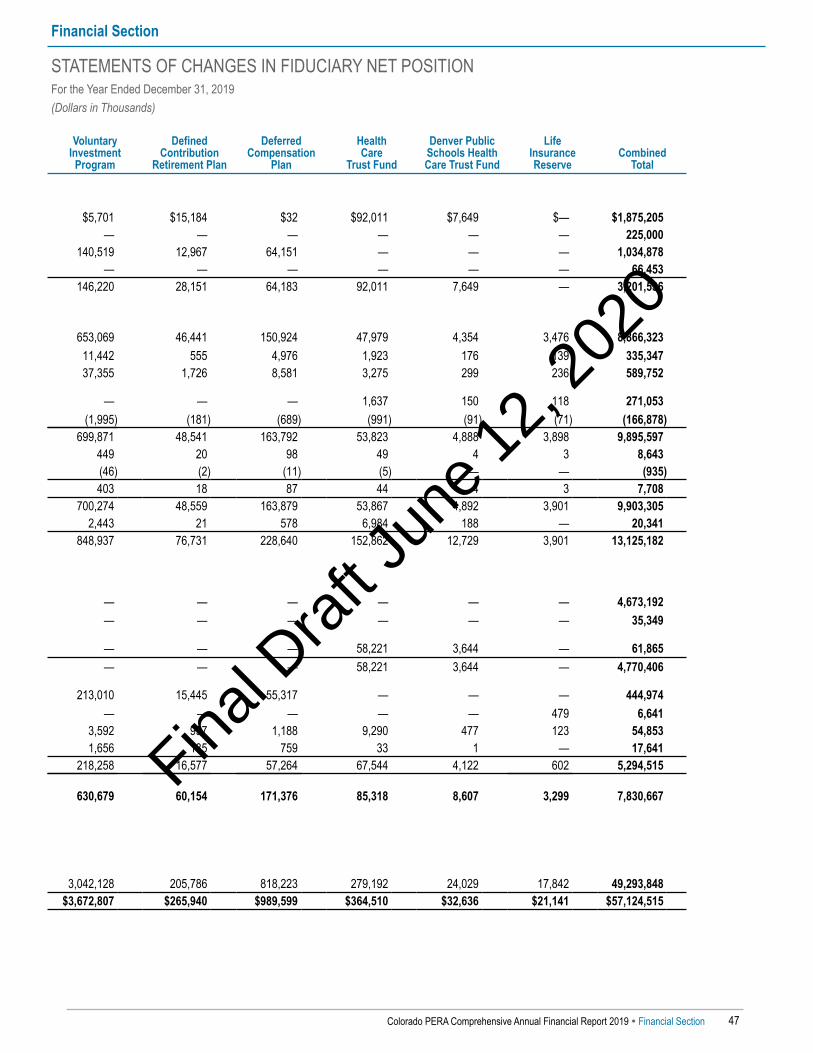
VoluntaryInvestment
Program
DefinedContribution
Retirement Plan
DeferredCompensation
Plan
HealthCare
Trust Fund
Denver PublicSchools HealthCare Trust Fund
LifeInsuranceReserve
Combined Total
$5,701 $15,184 $32 $92,011 $7,649 $— $1,875,205— — — — — — 225,000
140,519 12,967 64,151 — — — 1,034,878— — — — — — 66,453
146,220 28,151 64,183 92,011 7,649 — 3,201,536
653,069 46,441 150,924 47,979 4,354 3,476 8,866,32311,442 555 4,976 1,923 176 139 335,34737,355 1,726 8,581 3,275 299 236 589,752
— — — 1,637 150 118 271,053(1,995) (181) (689) (991) (91) (71) (166,878)
699,871 48,541 163,792 53,823 4,888 3,898 9,895,597449 20 98 49 4 3 8,643(46) (2) (11) (5) — — (935)403 18 87 44 4 3 7,708
700,274 48,559 163,879 53,867 4,892 3,901 9,903,3052,443 21 578 6,984 188 — 20,341
848,937 76,731 228,640 152,862 12,729 3,901 13,125,182
— — — — — — 4,673,192— — — — — — 35,349
— — — 58,221 3,644 — 61,865— — — 58,221 3,644 — 4,770,406
213,010 15,445 55,317 — — — 444,974— — — — — 479 6,641
3,592 997 1,188 9,290 477 123 54,8531,656 135 759 33 1 — 17,641
218,258 16,577 57,264 67,544 4,122 602 5,294,515
630,679 60,154 171,376 85,318 8,607 3,299 7,830,667
3,042,128 205,786 818,223 279,192 24,029 17,842 49,293,848$3,672,807 $265,940 $989,599 $364,510 $32,636 $21,141 $57,124,515
Financial Section
STATEMENTS OF CHANGES IN FIDUCIARY NET POSITIONFor the Year Ended December 31, 2019(Dollars in Thousands)
Colorado PERA Comprehensive Annual Financial Report 2019 � Financial Section 47
Final D
raft
June
12,
202
0

Financial Section
NOTES TO THE FINANCIAL STATEMENTS(Dollars in Thousands)
48 Financial Section � Colorado PERA Comprehensive Annual Financial Report 2019
Note 1—Plan DescriptionOrganizationPublic Employees’ Retirement Association of Colorado (PERA) was established in 1931. The statute governing PERA isTitle 24, Article 51 of the Colorado Revised Statutes (C.R.S.). PERA administers the following plans:
Plan Name Type of PlanDefined Benefit Pension Plans (Division Trust Funds)State Division Trust Fund Cost-sharing multiple-employerSchool Division Trust Fund Cost-sharing multiple-employerLocal Government Division Trust Fund Cost-sharing multiple-employerJudicial Division Trust Fund Cost-sharing multiple-employerDenver Public Schools (DPS) Division Trust Fund Single-employer
Defined Benefit Other Postemployment Benefit Plans (Health Care Trust Funds)Health Care Trust Fund (HCTF) Cost-sharing multiple-employerDenver Public Schools Health Care Trust Fund (DPS HCTF) Single-employer
Defined Contribution PlansVoluntary Investment Program Multiple-employerDefined Contribution Retirement Plan Multiple-employer
Deferred Compensation PlanDeferred Compensation Plan Multiple-employer
Private Purpose Trust FundLife Insurance Reserve Multiple-employer
Responsibility for the organization and administration ofthese plans rests with the PERA Board of Trustees (Board).The Board is composed of the following 16 Trustees:
• Nine members elected by members from their respectiveDivisions to serve on the Board for four–year terms; fourfrom the School Division, three from the State Division,one from the Local Government Division, and one fromthe Judicial Division.
• Two retirees elected by retirees to serve on the Board forfour-year terms.
• Three Trustees appointed by the Governor andconfirmed by the State Senate to serve on the Board forfour-year terms.
• The State Treasurer.
• One ex officio (non-voting) member or retiree elected bymembers and retirees of the DPS Division to serve onthe Board for a four-year term.
Listed below is the number of active participatingemployers for the five Division Trust Funds. Guidanceunder the Governmental Accounting Standards Board(GASB) Statement No. 67 classifies a primary governmentand its component units as one employer.
Division As of December 31, 20191
State 32School 235Local Government 141Judicial 2DPS 1
Total employers 411 1 This employer count is presented for purposes of complying with GASB 67
only. For all other purposes, the definition of an employer is governed byTitle 24, Article 51 of the C.R.S., PERA’s Rules, 8 CCR 1502-1, and, ifapplicable, the employer’s affiliation agreement with PERA.
Final D
raft
June
12,
202
0

Membership—Division Trust Funds-Defined Benefit Pension PlansBenefit recipients and members of PERA consisted of the following as of December 31, 2019, with comparative combinedtotals for 2018:
State Division
School Division
LocalGovernment
DivisionJudicial Division
DPS Division 2019 2018
Retirees and beneficiaries 41,305 68,523 7,951 401 7,148 125,328 122,189Inactive members eligible but not yet receiving benefits 7,412 17,693 2,677 14 1,988 29,784 28,563Inactive members not eligible for benefits 81,012 132,833 26,274 6 13,522 253,647 241,844Active members
Vested general employees 30,065 69,254 6,124 267 7,508 113,218 111,558Vested State Troopers 672 — — — — 672 651Non-vested general employees 24,315 59,684 6,962 72 8,171 99,204 99,138Non-vested State Troopers 200 — — — — 200 237
Total active members 55,252 128,938 13,086 339 15,679 213,294 211,584Total 184,981 347,987 49,988 760 38,337 622,053 604,180
Membership—Voluntary Investment Program,Defined Contribution Retirement Plan, and Deferred Compensation PlanSee Note 8.
Membership—Health Care Trust FundsSee Note 9.
Benefit Provisions—Division Trust FundsPlan benefits are specified in Title 24, Article 51 of theC.R.S. and applicable provisions of the federal InternalRevenue Code (IRC). Colorado State law provisions maybe amended from time to time by the ColoradoGeneral Assembly.
The Colorado General Assembly passed significantpension reform through Senate Bill (SB) 18-200: ConcerningModifications To the Public Employees’ Retirement AssociationHybrid Defined Benefit Plan Necessary To Eliminate with aHigh Probability the Unfunded Liability of the Plan Within theNext Thirty Years. The bill was signed into law byGovernor Hickenlooper on June 4, 2018. SB 18-200 makeschanges to certain benefit provisions of the plansadministered by PERA. Some, but not all, of these changeswere in effect at the end of 2019.
Plan EligibilityAll employees of PERA employers who work in a positioneligible for PERA membership must be enrolled in thePERA Hybrid Defined Benefit Plan, except for employeeswho are hired into a position that makes them eligible fora choice between enrolling in the PERA Defined BenefitPlan or the PERA Defined Contribution Retirement Plan(PERAChoice). PERAChoice eligibility applies to certainnew employees of State agencies and departments, most
community colleges, and the District Attorney within eachJudicial District. If authorized by the county and theDistrict Attorney, the attorneys within that Judicial Districtmay also have access to PERAChoice. Pursuant toC.R.S. § 24-51-1501(4), effective January 1, 2019,PERAChoice was extended to certain new employees inthe Local Government Division and certain new classifiedemployees at State Colleges and Universities. If an eligibleemployee does not make a choice of which plan toparticipate in within 60 days of the starting date ofemployment, the employee is automatically enrolled in thePERA Defined Benefit Plan. Between the second and fifthyear of participation in their original plan, employees maymake a one-time, irrevocable election to switch to theother plan. After the fifth year of participation, this optionto switch plan participation no longer exists.
Some positions within PERA-affiliated employers are noteligible for PERA membership and may be covered byanother separate retirement program.
Benefit ProvisionsThe Division Trust Funds have various benefit provisionsdepending upon the member’s date of hire or upon themember’s date of retirement. The differences in planbenefit provisions are detailed in the following pages inthis Note as of December 31, 2019. On January 1, 2010, theDenver Public Schools Retirement System (DPSRS)merged with PERA. On that date, all liabilities and assetsof DPSRS transferred to and became liabilities and assetsof the DPS Division of PERA. The benefit provisions ofDPSRS were incorporated into PERA as the DPS benefitstructure. The benefit provisions of existing members ofPERA on the merger date and all new hires post-mergerdate are identified as the PERA benefit structure.
Financial Section
NOTES TO THE FINANCIAL STATEMENTS(Dollars in Thousands)
Colorado PERA Comprehensive Annual Financial Report 2019 � Financial Section 49
Final D
raft
June
12,
202
0

Member AccountsDuring 2019, most members, with the exception ofmembers in the Local Government Division and membersclassified as State Troopers (as defined in the nextparagraph), contributed 8.00 percent of their PERA-includable salary to their member accounts from January 1to June 30 and contributed 8.75 percent from July 1 toDecember 31. State Troopers and Colorado Bureau ofInvestigation (CBI) agents contributed 10.00 percent fromJanuary 1 to June 30 and contributed 10.75 percent fromJuly 1 to December 31. Members of the Local GovernmentDivision contributed 8.00 percent of their PERA-includablesalary during 2019.
"State Trooper" means an employee of the Colorado StatePatrol or CBI vested with the powers of peace officers. Fornew members, "State Trooper" also includes a countysheriff, undersheriff, deputy sheriff, noncertified deputysheriff, or detention officer hired by a Local GovernmentDivision employer on or after January 1, 2020, and acorrections officer classified as I through IV by a StateDivision employer on or after January 1, 2020.
State law authorizes the Board to determine annually theinterest to be credited to member accounts, but in no eventmay the Board specify a rate that exceeds 5 percent.Effective January 1, 2009, the annual rate was set at3 percent and has been reconfirmed each Novembersince adoption.
Service CreditMembers earn service credit for each month of workperformed as an employee of a PERA-affiliated employerfor which salary is earned for such services.
A full month of service credit is earned for each month ofwork where the salary earned by the employee is equal toor greater than 80 multiplied by the federal minimumhourly wage in effect for that month. Earned salary whichis less than this amount results in a partial month ofservice credit.
Eligible members may purchase additional service creditbased upon (1) other employment that is not covered byPERA or another retirement program or (2) the servicecredit forfeited as the result of a withdrawn PERA memberaccount. Such service credit purchases are subject to limitsin State and federal law. The amounts used to purchaseservice credit are credited to the member’s account andmay include tax-paid funds and eligible rollovers of tax-deferred funds. Such amounts are eligible for an interestaccrual, but no match if the member account is refundedin a lump-sum distribution.
Refund or Distribution ProvisionsUpon termination of employment with all PERAemployers, members have the following optionsconcerning their member account:
• Leave the account invested in the Division Trust Fundsfor a future distribution or retirement benefit; however,a distribution must begin by April 1 in the yearfollowing the year in which the member reaches age70½. Due to the passage of the federal SECURE Act of2019, for members who have not yet reached 70½ onDecember 31, 2019, the member must begin adistribution by April 1 in the year following the year inwhich the member reaches age 72, rather than age 70½.
• Request a distribution of the member account plus anapplicable match. Such a distribution cancels therefunding member’s service credit and any benefitentitlements associated with the account. Thedistribution may be taken as cash with the resultingtax consequences or as a rollover to an eligiblequalified plan.
Matching AmountsMembers under the PERA benefit structure who withdrawtheir accounts on or after reaching retirement eligibility orage 65 receive their member account plus a 100 percentmatch on eligible amounts. For members under the PERAbenefit structure who withdraw their accounts beforereaching retirement eligibility, all contributions receivedprior to January 1, 2011, are eligible for the 50 percentmatch regardless of how much service credit the memberhas earned. However, contributions received afterJanuary 1, 2011, will not be eligible for the 50 percentmatch until the member earns five years of service credit.
Members under the DPS benefit structure who terminatedemployment on or after January 1, 2001, and withdrawtheir accounts on or after reaching retirement eligibilityreceive their member account plus a 100 percent match oneligible amounts. Members under the DPS benefitstructure who withdraw their accounts before reachingretirement eligibility receive a refund of their memberaccounts, but do not receive any match.
Members reaching retirement eligibility who choose totake a retirement benefit are entitled to a minimummonthly benefit which incorporates the member’s accountplus a 100 percent match on eligible amounts, annuitizedinto a monthly benefit using PERA’s expected rateof return.
Financial Section
NOTES TO THE FINANCIAL STATEMENTS(Dollars in Thousands)
50 Financial Section � Colorado PERA Comprehensive Annual Financial Report 2019
Final D
raft
June
12,
202
0
Highest Average SalaryPlan benefits, described below, generally are calculated asa percentage of the member’s three- or five- year HighestAverage Salary (HAS). The following conditions apply tothe HAS calculation:
• For all members of the PERA benefit structure, exceptjudges, who were eligible to retire as of January 1, 2011,who were hired before January 1, 2007, and who retireon or after January 1, 2009: HAS is determined by thehighest annual salaries associated with four periods of12 consecutive months of service credit. The four12 month periods selected do not have to be consecutivenor do they have to include the last four years ofmembership. The lowest of the four periods becomes abase year used as a starting point for a 15 percent cap onannual salary increases for the next three periods usedto determine the applicable HAS. This salary cap appliesregardless of when the annual salaries used in the HAScalculation occurred.
• For all members of the PERA benefit structure, exceptjudges, who were not eligible to retire as ofJanuary 1, 2011, or members of the PERA benefitstructure who are hired on or after January 1, 2007, whohave at least five years of service credit onDecember 31, 2019: HAS is determined by the highestannual salaries associated with four periods of 12consecutive months of service credit. The four 12-monthperiods selected do not have to be consecutive nor dothey have to include the last four years of membership.The lowest of the four periods becomes a base yearused as a starting point for an 8 percent cap on annualsalary increases for the next three periods used todetermine the applicable HAS. This salary cap appliesregardless of when the annual salaries used in the HAScalculation occurred.
• For all members of the PERA and DPS benefitstructures, except judges, regardless of hire date, who donot have at least five years of service credit onDecember 31, 2019: HAS is determined by the highestannual salaries associated with six periods of 12consecutive months of service credit. The six 12-monthperiods selected do not have to be consecutive nor dothey have to include the last six years of membership.The lowest of the six periods becomes a base year usedas a starting point for an 8 percent cap on annual salaryincreases for the next five periods used to determine theapplicable HAS. This salary cap applies regardlessof when the annual salaries used in the HAScalculation occurred.
• For members of the Judicial Division Trust Fund(judges) who have at least five years of service credit onDecember 31, 2019: HAS is one-twelfth of the highestannual salary associated with one period of 12consecutive months of service credit.
• For members of the Judicial Division Trust Fund(judges) who do not have at least five years of servicecredit on December 31, 2019, regardless of the date ofhire: HAS is determined by the highest annual salariesassociated with four periods of 12 consecutive months ofservice credit. The four 12-month periods selected donot have to be consecutive nor do they have to includethe last four years of membership. The lowest of the fourperiods becomes a base year used as a starting point foran 8 percent cap on annual salary increases for the nextthree periods used to determine the applicable HAS.This salary cap applies regardless of when the annualsalaries used in the HAS calculation occurred.
• For members of the DPS benefit structure who areeligible to retire as of January 1, 2011: HAS is theaverage monthly salary of the 36 months of earnedservice having the highest salaries.
• For members of the DPS benefit structure who are noteligible to retire as of January 1, 2011, and have at leastfive years of service credit on December 31, 2019: HAS isdetermined by the highest annual salaries associatedwith four periods of 12 consecutive months of servicecredit. The four 12-month periods selected do not haveto be consecutive nor do they have to include the lastfour years of membership. The lowest of the fourperiods becomes a base year used as a starting point foran 8 percent cap on annual salary increases for the nextthree periods used to determine the applicable HAS.This salary cap applies regardless of when the annualsalaries used in the HAS calculation occurred.
Service Retirement Benefits for Members Other ThanState Troopers—PERA Benefit StructureUpon termination of PERA-covered employment andreaching eligibility for service retirement benefits, amember may begin receipt of benefits as shown below andon the next page.
Members Hired Before July 1, 2005, With Five Years of Service Credit on January 1, 2011
Age Requirement Service Credit Requirement(in years) (in years)
50 3055 Age and Service = 80 or more60 2065 565 Less than 5 but 60 payroll postings1
1 Retiring members who are age 65 and have less than five years of servicecredit and less than 60 payroll postings will receive a service retirementbenefit under the Money Purchase Formula only.
Financial Section
NOTES TO THE FINANCIAL STATEMENTS(Dollars in Thousands)
Colorado PERA Comprehensive Annual Financial Report 2019 � Financial Section 51
Final D
raft
June
12,
202
0

Members Hired on or After July 1, 2005, But Before January 1, 2007,
With Five Years of Service Credit on January 1, 2011Age Requirement Service Credit Requirement
(in years) (in years)Any Age 35
55 Age and Service = 80 or more60 2065 565 Less than 5 but 60 payroll postings1
1 Retiring members who are age 65 and have less than five years of servicecredit and less than 60 payroll postings will receive a service retirementbenefit under the Money Purchase Formula only.
Members Hired on or After January 1, 2007, But Before January 1, 2011,
With Five Years of Service Credit on January 1, 2011Age Requirement Service Credit Requirement
(in years) (in years)Any Age 35
55 3055 Age and Service = 85 or more60 2565 565 Less than 5 but 60 payroll postings1
1 Retiring members who are age 65 and have less than five years of servicecredit and less than 60 payroll postings will receive a service retirementbenefit under the Money Purchase Formula only.
Members Hired Before January 1, 2011, With Less Than Five Years of Service Credit on January 1, 2011
Age Requirement Service Credit Requirement(in years) (in years)Any Age 35
55 3055 Age and Service = 85 or more60 2565 565 Less than 5 but 60 payroll postings1
1 Retiring members who are age 65 and have less than five years of servicecredit and less than 60 payroll postings will receive a service retirementbenefit under the Money Purchase Formula only.
Members Hired on or After January 1, 2011, But Before January 1, 2017, or Hired on or After January 1, 2017,
But Before January 1, 2020, Whose Most Recent 10 Years of Service are in the School or DPS Divisions
Age Requirement Service Credit Requirement(in years) (in years)Any Age 35
58 3058 Age and Service = 88 or more60 2865 565 Less than 5 but 60 payroll postings1
1 Retiring members who are age 65 and have less than five years of servicecredit and less than 60 payroll postings will receive a service retirementbenefit under the Money Purchase Formula only.
Members Hired on or After January 1, 2017, But Before January 1, 2020, Whose Most Recent 10
Years of Service are not in the School or DPS DivisionsAge Requirement Service Credit Requirement
(in years) (in years)Any Age 35
60 3060 Age and Service = 90 or more65 565 Less than 5 but 60 payroll postings1
1 Retiring members who are age 65 and have less than five years of servicecredit and less than 60 payroll postings will receive a service retirementbenefit under the Money Purchase Formula only.
Members Hired on or After January 1, 2020Age Requirement Service Credit Requirement
(in years) (in years)Any Age 35
64 3064 Age and Service = 94 or more65 565 Less than 5 but 60 payroll postings1
1 Retiring members who are age 65 and have less than five years of servicecredit and less than 60 payroll postings will receive a service retirementbenefit under the Money Purchase Formula only.
Financial Section
NOTES TO THE FINANCIAL STATEMENTS(Dollars in Thousands)
52 Financial Section � Colorado PERA Comprehensive Annual Financial Report 2019
Final D
raft
June
12,
202
0

Service Retirement Benefits for State Troopers—PERABenefit StructureUpon termination of PERA-covered employment andreaching eligibility for service retirement benefits, a StateTrooper may begin receipt of benefits as shown below.
State Troopers Hired Before January 1, 2020Age Requirement Service Credit Requirement
(in years) (in years)Any Age 30
50 2555 2060 Age and Service = 80 or more65 565 Less than 5 but 60 payroll postings1
1 Retiring members who are age 65 and have less than five years of servicecredit and less than 60 payroll postings will receive a service retirementbenefit under the Money Purchase Formula only.
State Troopers Hired on or After January 1, 2020Age Requirement Service Credit Requirement
(in years) (in years)Any Age 35
55 2555 Age and Service = 80 or more65 565 Less than 5 but 60 payroll postings1
1 Retiring members who are age 65 and have less than five years of servicecredit and less than 60 payroll postings will receive a service retirementbenefit under the Money Purchase Formula only.
The service retirement benefit for all retiring members isthe greater of the Defined Benefit Formula or the MoneyPurchase Formula as explained below:
• Defined Benefit Formula HAS multiplied by 2.5 percent and then multiplied byyears of service credit. The service retirement benefit islimited to 100 percent of HAS.
• Money Purchase Formula Values the retiring member’s account plus a 100 percentmatch on eligible amounts as of the member’sretirement date. This amount is then annuitized into amonthly benefit using the retiring member’s lifeexpectancy, expected rates of return, and otheractuarial factors.
In all cases, a service retirement benefit cannot exceed themaximum benefit amount allowed by federal law.
Reduced Service Retirement—PERA Benefit StructureReduced service retirement benefits are calculated in thesame manner as a service retirement benefit with areduction for each month prior to the member’s firsteligible date for a service retirement. The benefitcalculation reduction factors applicable to members whowere eligible to retire as of January 1, 2011, are specified inC.R.S. § 24-51-605.
Members and State Troopers Hired Before January 1, 2020Age Requirement Service Credit Requirement
(in years) (in years)50 2550 (State Troopers only) 2055 2060 5
Members and State Troopers Hired on or After January 1, 2020Age Requirement Service Credit Requirement
(in years) (in years)55 2555 (State Troopers only) 2060 5
For members not eligible to retire as of January 1, 2011, theearly retirement reduction factors used to determine thereduced service retirement benefit reflect an actuarialequivalent reduction.
Service Retirement Benefits—DPS Benefit StructureMembers in the DPS benefit structure are eligible toreceive a monthly retirement benefit when they meet theage and service requirements listed below.
Members With Five Years of Service Credit on January 1, 2011Age Requirement Service Credit Requirement
(in years) (in years)50 3055 251
65 51 15 years must be earned service credit
Member With Less Than Five Years of Service Credit on January 1, 2011Age Requirement Service Credit Requirement
(in years) (in years)Any Age 35
55 301
55 Age and Service = 85 or more1
60 2565 5
1 20 years must be earned service credit
Financial Section
NOTES TO THE FINANCIAL STATEMENTS(Dollars in Thousands)
Colorado PERA Comprehensive Annual Financial Report 2019 � Financial Section 53
Final D
raft
June
12,
202
0
Reduced Service Retirement Benefits—DPS BenefitStructure
Member With Five Years of Service Credit on January 1, 2011Age Requirement Service Credit Requirement
(in years) (in years)Less than 50 30Less than 55 25
55 15
Member With Less Than Five Years of Service Credit on January 1, 2011Age Requirement Service Credit Requirement
(in years) (in years)50 2555 2060 5
If the member has less than five years of service creditunder the DPS benefit structure, the member does nothave the option to apply for a benefit and the member isonly eligible for a refund of his or her account.
The service retirement benefit for all retiring members isthe greater of the two calculations as explained below:
• HAS multiplied by 2.5 percent and then multiplied byyears of service credit.
• $15 (actual dollars) times the first 10 years of servicecredit plus $20 (actual dollars) times service credit over10 years plus a monthly amount equal to the annuitizedmember balance (which may include matching dollars ifeligible) using the retiring member’s life expectancy,expected rates of return, and other actuarial factors.
In all cases, a service retirement benefit is limited to100 percent of HAS and cannot exceed the maximumbenefit amount allowed by federal law.
Disability ProgramEligible active members, other than judges, with five ormore years of earned service credit are covered by thePERA Disability Program. Judges are immediately coveredunder the disability program. The earned service creditrequirement may be waived for State Troopers whobecome disabled as the result of injuries in the line of duty.
Medical determinations for the disability program aremade by UNUM, PERA's disability program administratorpursuant to C.R.S. § 24-51-703. Applicants found to bedisabled receive payments under one of two tiers:
• Short-Term Disability: Disability applicants are eligiblefor short-term disability payments if they are found tobe mentally or physically incapacitated fromperformance of essential job duties after reasonableaccommodation, and who are medically unable to earnat least 75 percent of their pre-disability earnings from
any job, but who are not totally and permanentlyincapacitated from regular and substantial gainfulemployment. PERA’s short-term disability program isan insurance product with PERA’s disability programadministrator, and payments are made directly to theindividual from PERA’s disability programadministrator. The maximum income replacement is60 percent of the member’s pre-disability PERA salaryfor up to 22 months.
• Disability Retirement Benefits: Disability applicantswho are found to be totally and permanently mentallyor physically incapacitated from regular and substantialgainful employment are eligible for disability retirementbenefits. These benefits are paid by PERA for as long asthe disability retiree remains disabled. The benefit iscalculated as a percentage of the disabled member’sHAS using accrued, and in some cases, projectedservice credit.
Benefit OptionsService retirees in the PERA benefit structure and allmembers in either the DPS benefit structure or the PERAbenefit structure who meet the requirements of a disabilityretirement may elect to receive their retirement ordisability retirement benefits in the form of a single-lifebenefit payable for the retiree’s lifetime only or one of twojoint-life benefits payable for the lifetime of the retiree witha continuing benefit paid upon the retiree’s death to theretiree’s cobeneficiary. Such option designations may onlybe changed under limited conditions specified in State law.The options are as follows:
• Option 1: A single-life benefit payable for the life of theretiree and, upon the death of the retiree, no furthermonthly benefits are payable.
• Option 2: A joint-life benefit payable for the life of theretiree and, upon the death of the retiree, one-half of thebenefit becomes payable to the cobeneficiary of theretiree for life. Upon the death of the cobeneficiary priorto the death of the retiree, an Option 1 benefit becomespayable to the retiree.
• Option 3: A joint-life benefit payable for the life of theretiree and, upon the death of the retiree, the samebenefit becomes payable to the cobeneficiary of theretiree for life. Upon the death of the cobeneficiary priorto the death of the retiree, an Option 1 benefit becomespayable to the retiree.
Options 2 and 3 are reduced to be the actuarial equivalentof Option 1, to ensure equitable benefits are providedregardless of the payment option chosen.
Service retirees in the DPS benefit structure have thefollowing options:
• Option A: A single-life benefit payable for the life of theretiree and, upon the death of the retiree, no furthermonthly benefits are payable.
Financial Section
NOTES TO THE FINANCIAL STATEMENTS(Dollars in Thousands)
54 Financial Section � Colorado PERA Comprehensive Annual Financial Report 2019
Final D
raft
June
12,
202
0

• Option B: A single-life benefit, reduced from an Option Abenefit to provide benefits to designated beneficiariesfor a fixed period of time after retirement. As part of theretirement calculation, a guaranteed payment period isdetermined and if the retiree dies before the guaranteedperiod ends, the benefit will continue to the Option Bbeneficiary(ies) for the remainder of the guaranteedperiod. If the death of the retiree occurs after theguaranteed period, the benefit ends.
• Option P2: A joint-life benefit payable for the life of theretiree and, upon the death of the retiree, one-half of thebenefit becomes payable to the cobeneficiary of theretiree for life. Upon the death of the cobeneficiary priorto the death of the retiree, an Option A benefit becomespayable to the retiree.
• Option P3: A joint-life benefit payable for the life of theretiree and, upon the death of the retiree, the samebenefit becomes payable to the cobeneficiary of theretiree for life. Upon the death of the cobeneficiary priorto the death of the retiree, an Option A benefit becomespayable to the retiree.
Options B, P2, and P3 are reduced to be the actuarialequivalent of Option A, to ensure equitable benefits areprovided regardless of the payment option chosen.
Survivor Benefits Program—PERA Benefit StructureMembers who have at least one year of earned servicecredit are covered by the PERA survivor benefits program.This one-year requirement is waived if a member’s deathis job-incurred.
In the event of the covered member’s death, monthlysurvivor benefits may be paid to the qualified survivors ofthe deceased. Qualified survivors generally include minorchildren, a surviving spouse, dependent parents, or acobeneficiary (for deceased members who were eligible forretirement at the time of death).
Monthly benefits are specified in statute and vary basedupon the deceased’s HAS, years of service credit, thequalified survivor to whom benefits are to be paid, and thenumber of qualified survivors receiving benefits.
If at the time of death, a member has less than one year ofearned service credit or does not have any qualifiedsurvivors, the deceased’s named beneficiary or the estatereceives a lump-sum payment of the deceased member’saccount plus a 100 percent match on eligible amounts.
Survivor Benefits Program—DPS Benefit StructureActive members who have at least five years of continuousservice under the DPS benefit structure prior to the date ofdeath and DPS disability retirements (prior to age 65) arecovered by the survivor benefits program applicable to theDPS benefit structure.
In the event of the covered member’s death, the member’squalified survivors are eligible for survivor benefits as
long as the named beneficiary(ies) waive their right toreceive a refund of the member’s contributions. Qualifiedsurvivors generally include minor children, a survivingspouse, or dependent parents.
Monthly benefits are specified in statute and vary basedupon the deceased’s HAS, years of service credit, thequalified survivor to whom benefits are to be paid, and thenumber of qualified survivors receiving benefits.
If at the time of death, a member has not met the eligibilityrequirements for the DPS benefit structure survivorbenefits program that are specified in statute, themember’s named beneficiary(ies) will receive a lump-sumpayment of the deceased member’s account withouta match.
Annual IncreasesOn an annual basis, eligible benefit recipients receive post-retirement, cost-of-living adjustments called annualincreases (AI). The AI eligibility and amounts aredetermined by the date the retiree or deceased memberbegan membership in PERA.
The AI provisions are explained below:
• For benefit recipients of the PERA benefit structure whobegan membership before January 1, 2007, and whosebenefit is paid based on a retirement date prior toJanuary 1, 2011, and benefit recipients of the DPS benefitstructure whose benefit is paid based on a retirementdate prior to January 1, 2011:
▪ Payment Month: The AI is paid in July.
▪ Eligibility: The benefit recipient has been receivingbenefits for at least seven months immediatelypreceding the July in which the AI is to be paid.
▪ AI Amount: The AI for 2019 is 0 percent and will be1.25 percent in 2020. Thereafter, the AI is 1.25 percentper year unless it is adjusted by the automaticadjustment provision (AAP). The AAP may raise orlower the amount of the AI by up 0.25 percent if theAAP ratio of the Division Trust Funds is outside theparameters specified in C.R.S. § 24-51-413. Theamount of the first AI will be prorated from the monthof retirement to the first AI payment date.
• For benefit recipients of the PERA benefit structure whobegan membership before January 1, 2007, and whosebenefit is paid based on a retirement date on or afterJanuary 1, 2011, and benefit recipients of the DPS benefitstructure whose benefit is paid based on a retirementdate on or after January 1, 2011, the following eligibilitycriteria is required:
▪ Payment Month: The AI is paid in July.
▪ Eligibility: For full service retirees, disability retirees,and reduced service retirees who are eligible to receivea benefit on January 1, 2011, and survivor benefit
Financial Section
NOTES TO THE FINANCIAL STATEMENTS(Dollars in Thousands)
Colorado PERA Comprehensive Annual Financial Report 2019 � Financial Section 55
Final D
raft
June
12,
202
0
recipients, who already received the first AI on orbefore May 1, 2018, the benefit recipient has receivedbenefit payments for the 12 months prior to the July inwhich the AI is to be paid.
For full service retirees, disability retirees, andreduced service retirees who are eligible to receive abenefit on January 1, 2011, and survivor benefitrecipients, who had not yet received the first AI on orbefore May 1, 2018, the benefit recipient has receivedbenefit payments for 36 months total, including forthe 12 months prior to the July in which the AI is tobe paid.
For reduced service retirees who are not eligible toretire as of January 1, 2011, but who already receivedthe first AI on or before May 1, 2018: A reducedservice retiree is eligible to receive the AI in July of theyear in which both of the following conditions aremet: (1) the retiree has received benefit payments for12 months immediately preceding the July in whichthe AI is to be paid and (2) as of January 1 of the yearthe AI is paid, the retiree has either reached age 60 orthe age and service Rule for unreduced serviceretirement applicable to the retiree’s Plan.
For reduced service retirees who are not eligible toretire as of January 1, 2011, and who had not yetreceived the AI on or before May 1, 2018: A reducedservice retiree is eligible to receive the AI in July of theyear in which all of the following conditions are met:(1) the retiree has received benefit payments for 36months total; (2) the retiree has received benefitpayments for 12 months immediately preceding theJuly in which the AI is to be paid; and (3) as of January1 of the year the AI is paid, the retiree has eitherreached age 60 or the age and service Rule forunreduced service retirement applicable to theretiree’s Plan.
▪ AI Amount: The AI for 2019 is 0 percent and will be1.25 percent in 2020. Thereafter, the AI is 1.25 percentper year unless it is adjusted by the AAP. The AAPmay raise or lower the amount of the AI by up to0.25 percent if the AAP ratio of the Division TrustFunds is outside the parameters specified inC.R.S. § 24-51-413.
• For benefit recipients of the PERA benefit structure whobegan membership on and after January 1, 2007:
▪ Payment Month: The AI is paid in July.
▪ Eligibility: For full service retirees, disability retirees,and survivor benefit recipients who had alreadyreceived an AI on or before May 1, 2018: The benefitrecipient becomes eligible in July of the calendar yearfollowing the calendar year in which the benefitrecipient has received 12 months of benefit payments.
For full service retirees, disability retirees, andsurvivor benefit recipients who had not yet receivedan AI on or before May 1, 2018: The benefit recipientbecomes eligible in July if the benefit recipient hasreceived 36 months of benefit payments totalincluding 12 months of benefit payments in the priorcalendar year.
A reduced service retiree who had already received anAI on or before May 1, 2018, is eligible to receive theAI in July of the year in which both of the followingconditions are met: (1) as of January 1 of the year theAI is to be paid, the retiree has received 12 months ofbenefit payments in the prior calendar year and (2) asof January 1 of the year the AI is paid, the retiree haseither reached age 60 or the age and service Rule forunreduced service retirement applicable to theretiree’s Plan.
A reduced service retiree who had not yet received anAI on or before May 1, 2018, is eligible to receive theAI in July of the year in which all of the followingconditions are met: (1) as of January 1 of the year theAI is to be paid, the retiree has received 36 months ofbenefit payments total; (2) the retiree received 12months of benefit payments in the prior calendar year;and (3) as of January 1 of the year the AI is paid, theretiree has either reached age 60 or the age and serviceRule for unreduced service retirement applicable tothe retiree’s Plan.
▪ AI Amount: The AI for 2019 is 0 percent and will be1.25 percent in 2020. Thereafter, the AI is the lesser of1.25 percent (unless adjusted by the AAP) or theaverage of the monthly Consumer Price Index forUrban Wage Earners and Clerical Workers (CPI-W)amounts for the prior calendar year. In no case can thepresent value of the year's AIs paid to a Division’sbenefit recipients exceed 10 percent of the Division'sAnnual Increase Reserve (AIR).
Changes to the AI Cap: If PERA’s overall funded status(actuarial value of assets/actuarial accrued liability) is ator above 103 percent, the AI cap will increase by0.25 percent. This adjustment will occur separately fromany impact of the AAP.
Automatic Adjustment ProvisionAdjustments may be made to the AI cap, member andemployer contribution rates, and, under certaincircumstances, the direct distribution from the State ofColorado (State).
Based on the results of the AAP assessment which utilizedthe December 31, 2019, actuarial valuation performed forfunding purposes, including the consideration of HouseBill (HB) 20-1379 and HB 20-1394, effective July 1, 2021, noadjustment to the AI cap is required at this time.
A summary of AAP provisions is provided in Note 4.
Financial Section
NOTES TO THE FINANCIAL STATEMENTS(Dollars in Thousands)
56 Financial Section � Colorado PERA Comprehensive Annual Financial Report 2019
Final D
raft
June
12,
202
0

Indexing of Benefits Inactive members, who meet the following conditions,have their benefit amounts increased by the applicable AIgranted by PERA from their date of membershiptermination to their effective date of retirement.
• Covered by the plan as of December 31, 2006;
• Eligible to retire as of January 1, 2011;
• Have 25 or more years of service credit; and
• Have not started receiving monthly benefits.
Suspending BenefitsIf a retiree suspends retirement on or after January 1, 2011,returns to membership, and earns at least one year ofservice credit, a separate benefit will be earned. In thiscase, the retiree may opt to refund the contributionsremitted with interest and an applicable match or receive asecond, separate benefit. The original benefit will not berecalculated. Individuals who suspended retirement priorto January 1, 2011, are eligible to have their original benefitrecalculated upon re-retirement.
If less than one year of service credit is earned during thereturn to membership, the retiree will be required torefund the contributions remitted with interest and anapplicable match before the original benefit will resume.
Working After Retirement Without Suspending Benefits• Retiree Contributions: With a few statutory exceptions,
employers are required to remit employer contributions,Amortization Equalization Disbursement (AED), andSupplemental Amortization Equalization Disbursement(SAED) on salary earned by retirees who work for them,but do not suspend retirement and return tomembership. Beginning January 1, 2011, workingretirees are required to make contributions ata percentage equal to the member contribution rate.Under C.R.S. § 24-51-101(53), working retireecontributions are nonrefundable and are not depositedinto member accounts. PERA deposits thesecontributions into the employer reserve.
• Limits on Working After Retirement: With a fewstatutory exceptions, retirees may work up to 110days/720 hours per calendar year for a PERA employerwith no reduction in benefits. In addition, eachemployer assigned to the School Division Trust Fund,DPS Division Trust Fund, and each Higher EducationInstitution assigned to the State Division Trust Fundmay designate on a calendar year basis, up to 10 serviceretirees who may work up to 30 additional days for atotal of 140 days/916 hours in a calendar year. Theemployer contributions, AED, SAED, and workingretiree contributions are due on all salary earned.
• PERA Retirees Employed By Rural School Districts:Through June 30, 2023, a service retiree who is a teacher,a school bus driver, or a school food services cook andwho is hired by an employer in the School Division thatsatisfies the criteria below may receive salary without areduction in retirement benefits for any length ofemployment in a calendar year if the service retiree hasnot worked for any PERA employer during the month ofthe effective date of retirement.
▪ The employer that hires the service retiree is a ruralschool district as determined by the Department ofEducation based on certain criteria and the schooldistrict enrolls 6,500 students or fewer in kindergartenthrough 12th grade;
▪ The school district hires the service retiree for thepurpose of providing classroom instruction or schoolbus transportation to students enrolled by the districtor for the purpose of being a school food servicescook; and
▪ The school district determines that there is a criticalshortage of qualified teachers, school bus drivers, orschool food services cooks, as applicable, and that theservice retiree has specific experience, skills, orqualifications that would benefit the district.
The following provisions concerning employment forthe service retiree also apply:
▪ Is not required to resume PERA membershipupon employment.
▪ Will not have a benefit recalculation reflectingadditional service credit or any increase in HAS.
▪ Will not receive a PERA health care premium subsidyduring employment.
▪ May not be employed by the school district fromwhich he or she retired until two years afterretirement if he or she retired without a full serviceretirement benefit.
▪ May not receive salary without reduction in benefitsand without limitation in a calendar year for morethan six consecutive years.
In addition, the employer that hires the service retireeis required to provide full payment of all PERAemployer contributions, disbursements, and workingretiree contributions.
Benefit Provisions—Voluntary Investment Program,Defined Contribution Retirement Plan, and Deferred Compensation PlanSee Note 8.
Benefit Provisions—Health Care Trust FundsSee Note 9.
Financial Section
NOTES TO THE FINANCIAL STATEMENTS(Dollars in Thousands)
Colorado PERA Comprehensive Annual Financial Report 2019 � Financial Section 57
Final D
raft
June
12,
202
0

Life Insurance Reserve PERA offers an optional life insurance program wheremembers can purchase varying amounts of coverage. TheLife Insurance Reserve is an accumulation of dividendsreceived in the past from the insurance company basedupon plan experience. The investment income from theLife Insurance Reserve is used to pay the currentadministrative costs of the plan.
Termination of PERAIf PERA is partially or fully terminated for any reason,C.R.S. § 24-51-217 provides that the rights of allmembers and benefit recipients to all benefits on thedate of termination, to the extent then funded, willbecome nonforfeitable.
Financial Section
NOTES TO THE FINANCIAL STATEMENTS(Dollars in Thousands)
58 Financial Section � Colorado PERA Comprehensive Annual Financial Report 2019
Note 2—Summary of Significant AccountingPoliciesReporting EntityThe Board oversees all funds included in the financialstatements of PERA and has the ability to influenceoperations. The Board’s responsibilities includedesignation of management, membership eligibility,investment of funds, and accountability for fiscal matters.
PERA is an instrumentality of the State; it is not an agencyof State government. In addition, it is not subject toadministrative direction by any department, commission,board, bureau, or agency of the State. Accordingly, PERA’sfinancial statements are not included in the financialstatements of any other organization.
Basis of PresentationThe accompanying financial statements are preparedin accordance with accounting principles generallyaccepted in the United States of America that apply togovernmental accounting for fiduciary funds.
Basis of AccountingThe accompanying financial statements for the definedbenefit and defined contribution pension trust funds (DBand DC trust funds), the deferred compensation trustfund, the private purpose trust fund, the HCTF, and theDPS HCTF are prepared using the economic resourcesmeasurement focus and the accrual basis of accounting.The preparation of financial statements in conformity withaccounting principles generally accepted in the UnitedStates of America requires PERA to use estimates andassumptions that affect the accompanying financialstatements and disclosures. Actual results could differfrom those estimates. Member and employer contributionsare recognized as revenues in the period in which thecompensation becomes payable to the member and theemployer is statutorily committed to pay thesecontributions to the DB and DC trust funds, the deferredcompensation trust fund, the HCTF, and the DPS HCTF.
Benefits and refunds are recognized when dueand payable.
Fund AccountingThe financial activities of the State Division Trust Fund,the School Division Trust Fund, the Local GovernmentDivision Trust Fund, the Judicial Division Trust Fund, theDPS Division Trust Fund, the HCTF, the DPS HCTF, theLife Insurance Reserve, the Voluntary InvestmentProgram, the Defined Contribution Retirement Plan, andthe Deferred Compensation Plan are recorded in separatefunds. The State, School, Local Government, Judicial, andDPS Division Trust Funds maintain separate accounts, andall actuarial determinations are made using separatedivision-based information.
The Division Trust Funds, the HCTF, the DPS HCTF, andthe Life Insurance Reserve pool their investments into acombined investment portfolio. Investment value andearnings of the investment pool are allocated among thefunds based on each fund’s percentage ownership. As ofDecember 31, 2019, the ownership percentages of eachfund are shown in the following table.
Trust Fund Ownership PercentagesState Division 30.61%School Division 52.09%Local Government Division 8.81%Judicial Division 0.70%DPS Division 7.02%HCTF 0.66%DPS HCTF 0.06%Life Insurance Reserve 0.05%
Total 100.00%
The administrative activities and operating assets andliabilities are pooled and recorded in a CommonOperating Fund. Expenses incurred and net operatingassets are allocated from the Common Operating Fund tothe Division Trust Funds based on administrative staffworkload devoted to these funds and the ratio of thenumber of active and retired members in each division tothe total for all the Division Trust Funds. Expenses areallocated to the HCTF and DPS HCTF based onadministrative fees charged to participants. Expenses areallocated to the Voluntary Investment Program, theDefined Contribution Retirement Plan, and the DeferredCompensation Plan based on administrative staffworkload and the ratio of fiduciary net position (FNP) ofeach program or plan to the total for the program andplans. Expenses are allocated to the Life Insurance Reservebased on administrative staff workload.
Fair Value of InvestmentsPlan investments are presented at fair value in theStatements of Fiduciary Net Position. See Note 5 foradditional information.
Final D
raft
June
12,
202
0

Note 3—Interfund Transfers and BalancesInterfund transfers of assets take place on a regular basisbetween the Division Trust Funds. The transfers occurupon the initiation of a retirement or survivor benefitwhere the member earned or purchased service in anotherdivision in addition to the Fund that is paying the benefit.
Transfers also occur from the Division Trust Funds to theHealth Care Trust Funds to allocate a portion of theamount paid by members to purchase service credit. Thetransfers for the year ended December 31, 2019, consistedof the following amounts:
INTERFUND TRANSFERS
State Division
Trust Fund
School Division
Trust Fund
LocalGovernment
Division Trust Fund
Judicial Division
Trust Fund
DPS Division
Trust Fund HCTFDPS
HCTFTransfers in from other Funds for retirements $19,236 $16,444 $4,347 $6,745 $8,262 $— $—Transfers out to other Funds for retirements (19,835) (22,528) (7,352) (50) (5,269) — —Transfers in from other Funds for survivor benefits 399 101 1 — — — —Transfers out to other Funds for survivor benefits (102) (399) — — — — —Transfers out to Health Care Trust Fundsfor purchased service credit (1,849) (1,798) (809) (27) (35) — —
Transfers in to Health Care Trust Fundsfor purchased service credit — — — — — 4,483 35
As of December 31, 2019, interfund balances existed between funds due to unreimbursed internal operating expenses. Theinterfund balances consisted of the following amounts:
INTERFUND BALANCES
Trust Fund AmountState Division $223School Division 380Local Government Division 65Judicial Division 5DPS Division 51Voluntary Investment Program (493)Defined Contribution Retirement Plan (67)Deferred Compensation Plan (169)HCTF 5
Total $—
Financial Section
NOTES TO THE FINANCIAL STATEMENTS(Dollars in Thousands)
Colorado PERA Comprehensive Annual Financial Report 2019 � Financial Section 59
Final D
raft
June
12,
202
0
Note 4—Contributions
Division Trust Funds—Defined BenefitPension PlansMembers and employers are required to contribute toPERA at a rate set by Colorado statute. The contributionrequirements of plan members and affiliated employersare established under C.R.S. § 24-51-401 et seq. ColoradoState law provisions may be amended from time to timeby the Colorado General Assembly.
SB 18-200 makes changes to contribution provisions of thedefined benefit pension plans administered by PERA.Some, but not all, of these changes to contributionprovisions were in effect at the end of 2019.
Members are required to contribute a percent of theirPERA-includable salary as shown in the contribution ratetables on the next page. PERA records these contributionsin individual member accounts. Member contributions aretax-deferred for federal and Colorado income taxpurposes, effective July 1, 1984, (January 1, 1986, formembers of the DPS benefit structure) and January 1, 1987,respectively. Prior to those dates, contributions were on anafter-tax basis. PERA-affiliated employers contributea percentage of active member covered payrollsdepending on division as shown on the next page.
Employers that rehire a PERA retiree as an employee orunder any other work arrangement (working retiree) arerequired to report and pay employer contributions on theamounts paid to the working retiree. In addition, effectiveJanuary 1, 2011, working retirees are required to makecontributions at a percentage of salary equal tothe member contribution rate. However, underC.R.S. § 24-51-101(53), these contributions are not membercontributions, are not deposited into a member account,and, therefore, are nonrefundable to the working retiree.
For purposes of deferring federal income tax imposed onsalary, member contributions and working retireecontributions shall be treated as employer contributionspursuant to the provisions of 26 U.S.C. § 414 (h)(2), asamended. For all other purposes, these contributions shallbe treated as member contributions and working retireecontributions as described above.
Beginning January 1, 2006, employers are required to paythe AED, and beginning January 1, 2008, employers arerequired to pay the SAED. The employers pay theseamounts on the PERA-includable salary for all employeesworking for the employer who are members of PERA, orwho are eligible to elect to become members of PERA onor after January 1, 2006, including any amounts paid inconnection with the employment of a retiree by anemployer. PERA uses these payments to help amortize theunfunded actuarial accrued liability (UAAL). The AEDand SAED are set to increase in future years for theJudicial Division Trust Fund, as described in the table on
page 62. SB 10-001 provides for adjustment of the AEDand SAED based on the year end funded status within aparticular Division Trust Fund. If a particular DivisionTrust Fund reaches a funded status of 103 percent, adecrease in the AED and SAED is mandated and if itsubsequently falls below a funded status of 90 percent, anincrease in the AED and SAED is mandated. For the LocalGovernment and Judicial Divisions, if the funded ratioreaches 90 percent and subsequently falls below90 percent, an increase in the AED and SAED is mandated.AED and SAED rates cannot exceed the maximums listedin the table on page 62.
C.R.S. § 24-51-412 permits a pension certificates ofparticipation (PCOP) offset to the DPS Division employercontribution rate. The offset, expressed as a percentage ofcovered payroll, is equal to the annual assumed paymentobligations for PCOPs issued in 1997 and 2008, includingsubsequent refinancing, by the DPS at a fixed effectiveannual interest rate of 8.50 percent. At a minimum, theDPS Division employer rate, after applying the PCOPoffset, must be sufficient to fund the DPS HCTF and theAIR contribution rates applicable to the DPS Division. Thestaff of Denver Public Schools provided the PCOP offsetrate of 13.48 percent for 2019, which is reviewed andanalyzed by PERA staff.
C.R.S. § 24-51-401(1.7)(e) requires a periodic ”true-up”calculation to be performed beginning in 2015 and everyfive years following, with the purpose of determining thetotal DPS Division employer contribution rate that wouldresult in the equalization of the ratio of UAAL over payrollbetween the DPS and School Divisions at the end of the30-year period beginning January 1, 2010. Both the 2015calculation and the 2020 calculation indicated that areduction to the total DPS Division employer rate wouldbe needed to equalize the defined ratio. As ofDecember 31, 2019, the ratio of UAAL over payroll is333.3 percent for the School Division and 115.9 percent forthe DPS Division. It should be noted that a reduction in anemployer contribution rate for any one Division TrustFund could potentially influence the outcome of theassessment of contributions (actual versus actuariallydetermined) considering all five Division Trust Funds,annually performed under the recently adopted AAP,enacted through SB 18-200, and described in greaterdetail below.
PERA-affiliated employers forward the contributions toPERA for deposit. PERA transfers a portion of thesecontributions, equal to 1.02 percent of the reportedsalaries, into the HCTF or DPS HCTF for health carebenefits. Beginning in 2007, the AIR was created withineach division for the purpose of funding future benefitincreases. Funding for this reserve comes from theemployer contributions and is calculated at 1.0 percentof the salary reported for members in the PERA benefit
Financial Section
NOTES TO THE FINANCIAL STATEMENTS(Dollars in Thousands)
60 Financial Section � Colorado PERA Comprehensive Annual Financial Report 2019
Final D
raft
June
12,
202
0
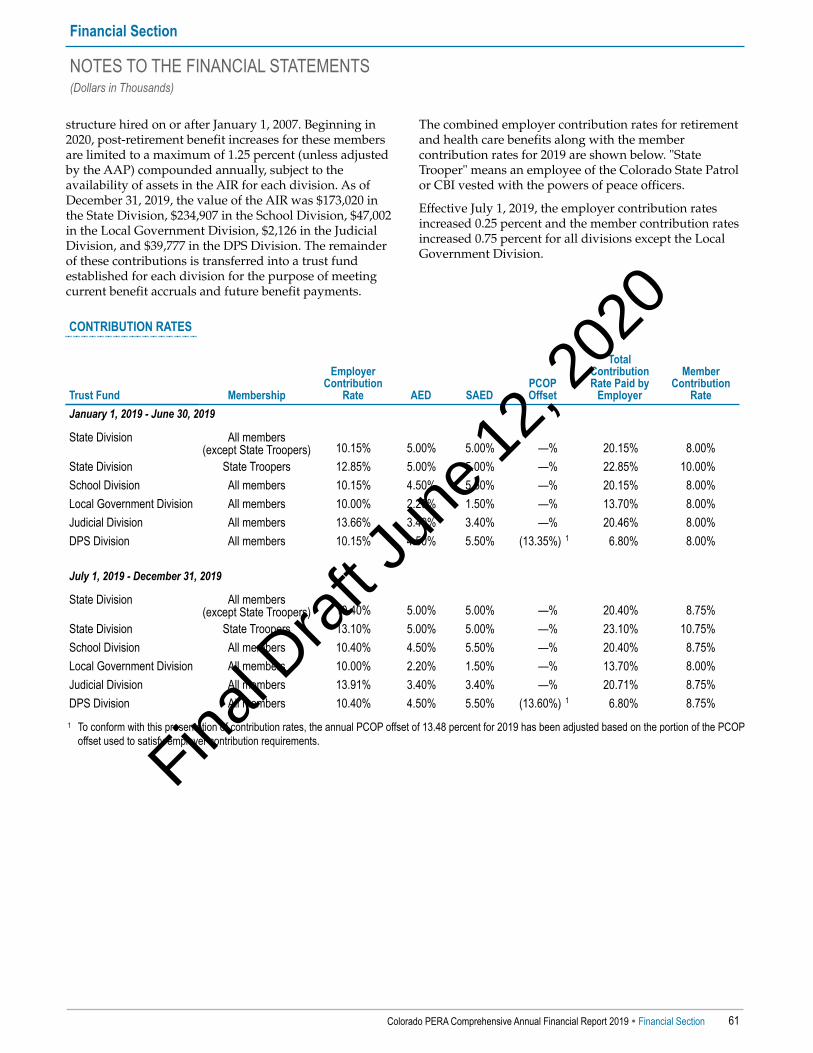
structure hired on or after January 1, 2007. Beginning in2020, post-retirement benefit increases for these membersare limited to a maximum of 1.25 percent (unless adjustedby the AAP) compounded annually, subject to theavailability of assets in the AIR for each division. As ofDecember 31, 2019, the value of the AIR was $173,020 inthe State Division, $234,907 in the School Division, $47,002in the Local Government Division, $2,126 in the JudicialDivision, and $39,777 in the DPS Division. The remainderof these contributions is transferred into a trust fundestablished for each division for the purpose of meetingcurrent benefit accruals and future benefit payments.
The combined employer contribution rates for retirementand health care benefits along with the membercontribution rates for 2019 are shown below. "StateTrooper" means an employee of the Colorado State Patrolor CBI vested with the powers of peace officers.
Effective July 1, 2019, the employer contribution ratesincreased 0.25 percent and the member contribution ratesincreased 0.75 percent for all divisions except the LocalGovernment Division.
CONTRIBUTION RATES
Trust Fund Membership
EmployerContribution
Rate AED SAEDPCOP Offset
Total Contribution Rate Paid by
Employer
MemberContribution
RateJanuary 1, 2019 - June 30, 2019
State Division All members (except State Troopers) 10.15% 5.00% 5.00% —% 20.15% 8.00%
State Division State Troopers 12.85% 5.00% 5.00% —% 22.85% 10.00%School Division All members 10.15% 4.50% 5.50% —% 20.15% 8.00%Local Government Division All members 10.00% 2.20% 1.50% —% 13.70% 8.00%Judicial Division All members 13.66% 3.40% 3.40% —% 20.46% 8.00%DPS Division All members 10.15% 4.50% 5.50% (13.35%) 1 6.80% 8.00%
July 1, 2019 - December 31, 2019
State Division All members (except State Troopers) 10.40% 5.00% 5.00% —% 20.40% 8.75%
State Division State Troopers 13.10% 5.00% 5.00% —% 23.10% 10.75%School Division All members 10.40% 4.50% 5.50% —% 20.40% 8.75%Local Government Division All members 10.00% 2.20% 1.50% —% 13.70% 8.00%Judicial Division All members 13.91% 3.40% 3.40% —% 20.71% 8.75%DPS Division All members 10.40% 4.50% 5.50% (13.60%) 1 6.80% 8.75%
1 To conform with this presentation of contribution rates, the annual PCOP offset of 13.48 percent for 2019 has been adjusted based on the portion of the PCOPoffset used to satisfy employer contribution requirements.
Financial Section
NOTES TO THE FINANCIAL STATEMENTS(Dollars in Thousands)
Colorado PERA Comprehensive Annual Financial Report 2019 � Financial Section 61
Final D
raft
June
12,
202
0

FUTURE AED AND SAED RATES
2020 RatesFuture Annual Increases in Rates
Prescribed by Colorado Revised StatutesMaximum Allowable
LimitationsTrust Fund AED SAED AED SAED AED SAEDState Division 5.00% 5.00% N/A N/A 5.00% 5.00%School Division 4.50% 5.50% N/A N/A 4.50% 5.50%Local Government Division 2.20% 1.50% N/A N/A 5.00% 5.00%Judicial Division 3.80% 3.80% Yes1 Yes2 5.00% 5.00%DPS Division3 4.50% 5.50% N/A N/A 4.50% 5.50%
1 C.R.S. § 24-51-411(4.5) increased the AED payment to 3.80 percent of PERA-includable salary for 2020 and requires the AED payment to increaseby 0.40 percent at the start of each of the following three calendar years through 2023 at which time the AED payment will be 5.00 percent of PERA-includable salary.
2 C.R.S. § 24-51-411(7.5) increased the SAED payment to 3.80 percent of PERA-includable salary for 2020 and requires the SAED payment to increaseby 0.40 percent at the start of each of the following three calendar years through 2023 at which time the SAED payment will be 5.00 percent of PERA-includable salary.
3 DPS Division employers are permitted to reduce the AED and SAED by the PCOP offset, as specified in C.R.S. § 24-51-412 et seq.
Funding of the plan assumes statutory contributions willbe made on a timely basis. Any significant reduction incontributions would have an impact on the ability of theplan to make benefit payments in the future.
Direct DistributionPursuant to C.R.S. § 24-51-414, PERA is to receive anannual direct distribution from the State in the amount of$225 million (in actual dollars). Beginning in 2018, thedistribution will occur each July 1 until there are nounfunded actuarial accrued liabilities in the trust fund ofany division that receives such distribution. PERA shallallocate the distribution to the trust funds as it would anemployer contribution in a manner that is proportionate tothe annual payroll of each division except there shall be noallocation to the Local Government Division.
The allocation for 2019 was as follows:
Trust Fund Direct DistributionState Division $77,088School Division 127,367Judicial Division 1,344DPS Division 19,201
Total $225,000
HB 20-1379, signed by Governor Polis on June xx, 2020,suspends the July 1, 2020, direct distribution. Please seeNote 12 for more information.
Future Contribution ChangesSubject to C.R.S. § 21-51-413, the member contributionrates incrementally increase as follows:
▪ 0.75 percent on July 1, 2020.
▪ 0.50 percent on July 1, 2021.
HB 19-1217 repealed the member contribution increasesscheduled for the Local Government Division pursuant toSB 18-200.
Pursuant to HB 20-1394, effective for the State's 2020-21and 2021-22 fiscal years, the employer contribution rate forthe Judicial Division decreases by 5.0 percent and themember contribution rate for the Judicial Divisionincreases by 5.0 percent. This does not apply to theemployer or member contribution rates for judgesemployed by the Denver County Court. See Note 12 formore information.
Effective January 1, 2021, and every year thereafter,C.R.S. § 24-51-415 adjusts employer contribution rates forthe State and Local Government Divisions to include adefined contribution supplement. The definedcontribution supplement for these two divisions will bedetermined based on the employer contribution amountspaid on behalf of eligible employees who commenceemployment on or after January 1, 2019, to definedcontribution plan participant accounts that would haveotherwise gone to the defined benefit trusts to pay downthe unfunded liability. This calculation includes definedbenefit investment earnings thereon, and is expressed asa percentage of salary on which employer contributionsare made.
Financial Section
NOTES TO THE FINANCIAL STATEMENTS(Dollars in Thousands)
62 Financial Section � Colorado PERA Comprehensive Annual Financial Report 2019
Final D
raft
June
12,
202
0

Automatic Adjustment ProvisionThe primary intent of the AAP is to gauge the adequacy ofthe contributions coming into the pension trust fundagainst the amount required, and if determined necessary,to initiate automatic changes to member and employercontribution rates, the AI cap, and, under certaincircumstances, the direct distribution from the State.This assessment commenced with the December 31, 2018,actuarial funding valuation and is performedannually, thereafter.
Pursuant to C.R.S. § 24-51-413, the AAP assessmentinvolves the comparison of two blended rates, weightedacross all five Division Trust Funds, defined as: the"Blended Total Contribution Amount" (employercontribution rates + member contribution rate + directdistribution as a rate of pay) divided by the “Blended TotalRequired Contribution” (actuarially determinedcontribution (ADC) rate + member contribution rate),determining a resulting ratio. If the resulting ratio fallswithin an acceptable corridor (98 percent to 119 percent),no adjustments are made. If the resulting ratio does notachieve a minimum benchmark (less than 98 percent),adjustments are applied in an equitable manner of impactresulting in increases in contributions and a decrease inthe AI cap. If the resulting ratio exceeds the acceptablecorridor (120 percent or greater), adjustments are appliedin an equitable manner of impact resulting in decreases incontributions and an increase in the AI cap.
Per statute, the first adjustment required as a result of theAAP cannot occur prior to July 1, 2020. The AAP definesthe limited amounts of total adjustment available in eachcategory, and also the increments of adjustments that canoccur in any one year. Multiple steps over multiple yearsare allowed for a required adjustment as is necessary, butcannot exceed the ultimate limits as set forth in statute. Anadjustment (increase or decrease) to each of the employercontribution rates and the member contribution ratescannot exceed 0.50 percent in any one year, and cannotexceed 2.00 percent above or fall below the contributionrates in effect prior to the enactment of SB 18-200. Anadjustment to the direct distribution cannot exceed$20 million (actual dollars) in any one year, and cannotexceed the initially legislated annual $225 million (actualdollars) amount, but can be reduced to $0.
Further, adjustments that are required because funding isbelow the 98 percent AAP ratio threshold will be made toan extent that will bring the revised AAP ratio to 103percent following the corrective efforts but in no event can
the adjustments in one year be greater than the limits asdescribed above. Similarly, adjustments that are requiredbecause funding has reached the 120 percent AAP ratiothreshold must not cause the AAP ratio to fall below103 percent.
Based on the results of the AAP assessment which utilizedthe December 31, 2018, actuarial valuation performed forfunding purposes, effective July 1, 2020, there will be anincrease to both member and employer contribution ratesof 0.50 percent. While the AAP assessment did not resultin an adjustment to the scheduled direct distributionpayment of $225 million (actual dollars) on July 1, 2020,HB 20-1379 suspends this payment for the State's2020-2021 fiscal year. More information can be found inNote 12.
Based on the results of the AAP assessment which utilizedthe December 31, 2019, actuarial valuation performed forfunding purposes, effective July 1, 2021, no adjustmentsregarding the member and employer contribution rates orthe direct distribution are required at this time.
Replacement Benefit ArrangementsIRC § 415 limits the amount of the benefit payable to aretiree or survivor in a defined benefit plan. In some cases,the IRC limit is lower than the benefit calculated under theplan provisions. For 2019, this limit is set at $225,000(actual dollars) for retirees who are age 62 or older. Thisdollar amount is actuarially decreased for retirees youngerthan 62. IRC § 415(m) allows a government plan to set upa “qualified governmental excess benefit arrangement” topay the difference to those retirees. To accomplish this,PERA has entered into agreements with the employerswho last employed the affected retirees. Under theagreement, the employer pays the benefit difference to theretiree from a portion of the current employercontributions. In 2019, employers under these agreementsused current employer contributions to pay retirees $2,954in the State Division; $969 in the School Division; $1,724 inthe Local Government Division; $0 in the Judicial Division,and $0 in the DPS Division.
Contributions—Voluntary Investment Program,Defined Contribution Retirement Plan, andDeferred Compensation PlanSee Note 8.
Contributions—Health Care Trust FundsSee Note 9.
Financial Section
NOTES TO THE FINANCIAL STATEMENTS(Dollars in Thousands)
Colorado PERA Comprehensive Annual Financial Report 2019 � Financial Section 63
Final D
raft
June
12,
202
0
Financial Section
NOTES TO THE FINANCIAL STATEMENTS(Dollars in Thousands)
64 Financial Section � Colorado PERA Comprehensive Annual Financial Report 2019
Note 5—InvestmentsInvestment AuthorityUnder C.R.S. § 24-51-206, the Board has completeresponsibility for the investment of PERA’s funds, withthe following investment limitations:
• The aggregate amount of moneys invested incorporate stocks or corporate bonds, notes, ordebentures that are convertible into corporate stock orin investment trust shares cannot exceed 65 percent ofthe then book value of the fund.
• No investment of the fund in common or preferredstock (or both) of any single corporation can exceed5 percent of the then book value of the fund.
• The fund cannot acquire more than 12 percent of theoutstanding stock or bonds of any single corporation.
• The origination of mortgages or deeds of trust on realresidential property is prohibited.
Additionally, C.R.S. § 24-54.8-201 et seq. imposestargeted divestment from companies that have economicprohibitions against Israel.
Colorado PERA Board’s Statutory FiduciaryResponsibilityBy State law, the management of PERA’s retirementfund is vested in the Board who is held to the standardof conduct of fiduciaries in discharging theirresponsibilities. According to C.R.S. § 24-51-207(2),the Board, as fiduciaries, must carry out theirfunctions solely in the interest of PERA members andbenefit recipients and for the exclusive purpose ofproviding benefits.
Investment CommitteeThe Investment Committee is responsible for assistingthe Board in overseeing the PERA investment program.Specific responsibilities include recommending to/advising the Board of the following:
• Written statements of investment policy andphilosophy, and any amendments thereto.
• Strategies to achieve investment goals and objectives.
• New investment mandates.
• Use of internal or external management for theinvestment mandates.
• On any other investment matters and makerecommendations for Board action when necessary.
Overview of Investment PolicyPERA’s investment policy is established and may beamended by a majority vote of the Board. The policyoutlines the investment philosophy and guidelines
within which the fund’s investments will be managed,and includes the following:
• Strategic asset allocation is the most significant factorinfluencing long-term investment performance andasset volatility.
• The fund’s liabilities are long term and the investmentstrategy will therefore be long term in nature.
• The asset allocation policy will be periodically re-examined to ensure its appropriateness to the thenprevailing liability considerations.
• As a long-term investor, PERA will invest across awide spectrum of investments in a prudent manner.
• Active management may be expected to add valueover passive investment alternatives underappropriate conditions.
The Board determines the strategic asset allocationpolicy for the fund. This strategic asset allocationcontains a long-term target allocation and specificranges within which each asset class may operate.Because the long-term target allocation will be achievedover time, an interim target allocation was alsoapproved. See current asset allocation targets and rangesin the Investment Section on page 121.
The asset allocation policy is determined by an intensiveasset/liability study which considers expectedinvestment returns, risks, and correlations of returns.The characteristics of the fund’s liabilities are analyzedin conjunction with expected investment risks andreturns. The targeted strategic asset allocation isdesigned to provide appropriate diversification and tobalance the expected returns, while ensuring anappropriate level of risk is incurred.
The asset allocation targets are adhered to through theimplementation of a rebalancing policy. Investments aremanaged and monitored in a manner which seeks tobalance return and risk within the asset/liabilityframework. The Chief Investment Officer is authorizedto execute investment transactions on behalf of theBoard. Assets are managed both internally andexternally. In making investment decisions, the Boardand staff utilize external experts in various fieldsincluding risk and performance analysis, and otherimportant investment functions and issues.
See information on the most recent asset/liability studyin the Investment Section on page 122.
Investment PerformanceFor the year ended December 31, 2019, the net-of-fees,money-weighted rate of return on the pooledinvestment assets was 20.4 percent.
Final D
raft
June
12,
202
0
A money-weighted rate of return considers the effect oftiming of transactions that increase the amount ofpension plan investments (such as contributions) andthose that decrease the amount of pension planinvestments (such as benefit payments). Additionally,the money-weighted rate of return provides informationthat is comparable with the long-term assumed rate ofreturn on the pooled investment assets.
Financial Section
NOTES TO THE FINANCIAL STATEMENTS(Dollars in Thousands)
Colorado PERA Comprehensive Annual Financial Report 2019 � Financial Section 65
Fair ValueInvestments are measured at fair value in accordancewith GASB 72. Fair value is defined as the amount forwhich an investment could be sold in an orderlytransaction between market participants at themeasurement date in the principal or mostadvantageous market of the investment. This Statementestablishes a three-tier, hierarchical disclosureframework which prioritizes and ranks the level ofmarket price observability used in measuring fair value.The hierarchy is based on the valuation inputs used tomeasure the fair value of the investment and gives thehighest priority to unadjusted quoted prices in activemarkets for identical assets or liabilities (Level 1measurements) and the lowest priority to unobservableinputs (Level 3 measurements). Inputs refer broadly tothe assumptions that market participants would use inpricing the asset or liability, including assumptionsabout risk, for example, the risk inherent in a particularvaluation technique used to measure fair value (such as
a pricing model) and/or the risk inherent in the inputsto the valuation technique. The categorization ofinvestments within the hierarchy is based upon thepricing transparency of the instrument and should notbe perceived as the particular investment’s risk. Thethree-tier framework is summarized below:
• Level 1—Unadjusted quoted prices for identicalinstruments in active markets.
• Level 2—Quoted prices for similar instruments inactive markets; quoted prices for identical or similarinstruments in markets that are not active; and model-derived valuations in which all significantinputs are observable.
• Level 3—Valuations derived from valuationtechniques in which significant inputs areunobservable.
Investments in certain entities that calculate a net assetvalue (NAV) per share (or its equivalent) sometimes donot have a readily determinable fair value. For theseinvestments, governmental accounting standards permitestablishment of fair value using a practical expedientbased on the NAV per share (or its equivalent).
The table on the next page presents PERA’s investmentswithin the hierarchical framework, as well asinvestments where fair value is determined using thepractical expedient, as of December 31, 2019.
Final D
raft
June
12,
202
0

INVESTMENTS MEASURED AT FAIR VALUE
Fair Value Measurements Using
12/31/2019
Quoted Prices inActive Markets forIdentical Assets
(Level 1)
Significant OtherObservable Inputs
(Level 2)
Significant Unobservable Inputs
(Level 3)Global EquityPublic market investments1
Information technology $5,978,659 $5,930,580 $47,987 $92Financials 4,743,077 4,663,940 79,014 123Health care 4,125,406 4,085,662 39,744 —Consumer discretionary 3,861,422 3,792,484 68,902 36Industrials 3,526,928 3,468,637 58,264 27Communication services 2,341,133 2,312,241 28,892 —Consumer staples 2,185,591 2,160,012 25,579 —Energy 1,232,032 1,219,190 12,832 10Materials 1,189,113 1,169,463 19,650 —Real estate 988,090 979,854 8,236 —Utilities 693,926 688,707 5,219 —
Non-public market investments and other 64 — — 64Total global equity investments 30,865,441 30,470,770 394,319 352
Fixed IncomeU.S. government treasuries 4,000,009 4,000,009 — —U.S. government mortgage-backed securities 3,053,907 9,373 3,044,534 —U.S. corporate bonds 2,158,177 — 2,158,177 —Non-U.S. corporate bonds 492,111 — 491,898 213Non-U.S. government/agency bonds 365,947 — 365,947 —Non-agency MBS/CMBS 253,859 — 253,859 —U.S. municipal bonds 84,802 — 77,308 7,494U.S. government agencies 76,604 — 76,604 —Fixed income mutual funds 10,349 10,349 — —
Total fixed income investments 10,495,765 4,019,731 6,468,327 7,707
Real estate 1,045,617 — — 1,045,617Self-directed brokerage 56,145 55,891 254 —
Total investments by fair value level $42,462,968 $34,546,392 $6,862,900 $1,053,676
Investments Measured at the NAVGlobal equity 1,146,492Fixed income 1,210,451Private equity 4,219,261Real estate 3,587,209Opportunity fund 1,829,571Multi-asset class funds 1,243,329
Total investments measured at the NAV 13,236,313Total investments measured at fair value $55,699,281
1 Approximately $374,000 of public market investments are classified in Level 2 due to the election of fair value pricing for international equity portfolios. This election employsthe use of intra-day movements of the Russell 1000 index as a factor in pricing individual equity investments to ensure equitability between participants in the PERAdvantageInternational Stock Fund.
Financial Section
NOTES TO THE FINANCIAL STATEMENTS(Dollars in Thousands)
66 Financial Section � Colorado PERA Comprehensive Annual Financial Report 2019
Final D
raft
June
12,
202
0
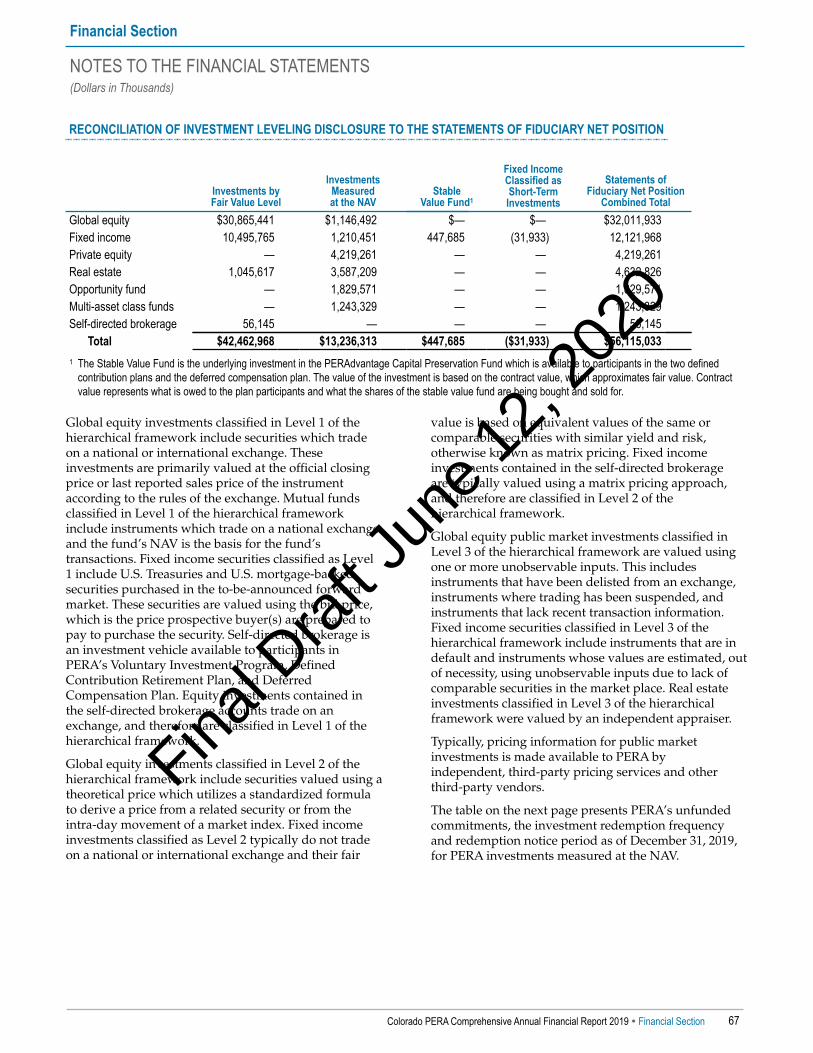
RECONCILIATION OF INVESTMENT LEVELING DISCLOSURE TO THE STATEMENTS OF FIDUCIARY NET POSITION
Investments by Fair Value Level
Investments Measured at the NAV
Stable Value Fund1
Fixed Income Classified as Short-Term Investments
Statements of Fiduciary Net Position
Combined TotalGlobal equity $30,865,441 $1,146,492 $— $— $32,011,933Fixed income 10,495,765 1,210,451 447,685 (31,933) 12,121,968Private equity — 4,219,261 — — 4,219,261Real estate 1,045,617 3,587,209 — — 4,632,826Opportunity fund — 1,829,571 — — 1,829,571Multi-asset class funds — 1,243,329 — — 1,243,329Self-directed brokerage 56,145 — — — 56,145
Total $42,462,968 $13,236,313 $447,685 ($31,933) $56,115,033 1 The Stable Value Fund is the underlying investment in the PERAdvantage Capital Preservation Fund which is available to participants in the two defined
contribution plans and the deferred compensation plan. The value of the investment is based on the contract value, which approximates fair value. Contractvalue represents what is owed to the plan participants and what the shares of the stable value fund are being bought and sold for.
Global equity investments classified in Level 1 of thehierarchical framework include securities which tradeon a national or international exchange. Theseinvestments are primarily valued at the official closingprice or last reported sales price of the instrumentaccording to the rules of the exchange. Mutual fundsclassified in Level 1 of the hierarchical frameworkinclude instruments which trade on a national exchangeand the fund’s NAV is the basis for the fund’stransactions. Fixed income securities classified as Level1 include U.S. Treasuries and U.S. mortgage-backedsecurities purchased in the to-be-announced forwardmarket. These securities are valued using the bid price,which is the price prospective buyer(s) are prepared topay to purchase the security. Self-directed brokerage isan investment vehicle available to participants inPERA’s Voluntary Investment Program, DefinedContribution Retirement Plan, and DeferredCompensation Plan. Equity investments contained inthe self-directed brokerage accounts trade on anexchange, and therefore are classified in Level 1 of thehierarchical framework.
Global equity investments classified in Level 2 of thehierarchical framework include securities valued using atheoretical price which utilizes a standardized formulato derive a price from a related security or from theintra-day movement of a market index. Fixed incomeinvestments classified as Level 2 typically do not tradeon a national or international exchange and their fair
value is based on equivalent values of the same orcomparable securities with similar yield and risk,otherwise known as matrix pricing. Fixed incomeinvestments contained in the self-directed brokerageare typically valued using a matrix pricing approach,and therefore are classified in Level 2 of thehierarchical framework.
Global equity public market investments classified inLevel 3 of the hierarchical framework are valued usingone or more unobservable inputs. This includesinstruments that have been delisted from an exchange,instruments where trading has been suspended, andinstruments that lack recent transaction information.Fixed income securities classified in Level 3 of thehierarchical framework include instruments that are indefault and instruments whose values are estimated, outof necessity, using unobservable inputs due to lack ofcomparable securities in the market place. Real estateinvestments classified in Level 3 of the hierarchicalframework were valued by an independent appraiser.
Typically, pricing information for public marketinvestments is made available to PERA byindependent, third-party pricing services and otherthird-party vendors.
The table on the next page presents PERA’s unfundedcommitments, the investment redemption frequencyand redemption notice period as of December 31, 2019,for PERA investments measured at the NAV.
Financial Section
NOTES TO THE FINANCIAL STATEMENTS(Dollars in Thousands)
Colorado PERA Comprehensive Annual Financial Report 2019 � Financial Section 67
Final D
raft
June
12,
202
0

INVESTMENTS MEASURED AT THE NET ASSET VALUE
12/31/2019Unfunded
CommitmentsRedemption Frequency
(If Currently Eligible)Redemption
Notice PeriodGlobal equity commingled funds $1,146,492 $— Daily 1 - 3 daysFixed income commingled funds 1,210,451 — Daily 1 - 3 daysPrivate equity partnerships 4,219,261 2,384,259 N/A N/APrivate real estate1
Directly held joint ventures 574,532 23,008 N/A N/AReal estate partnerships 1,075,850 399,904 Quarterly 90 daysCommingled open-end funds 1,936,827 98,406 Daily, Quarterly 30 - 90 days
Opportunity fundOpportunity fund partnerships 837,359 1,020,673 Quarterly, Biennial, Quinquennial 30 - 180 days
Commingled open-end funds 992,212 246,973 Daily, Monthly, Quarterly, Annually,Biennial 1 - 180 days
Multi-asset class commingled funds 1,243,329 — Daily 1 - 3 daysTotal investments measured at the NAV $13,236,313 $4,173,223
1 Excludes $129,406 of unfunded commitments related to real estate presented in Level 3 of the hierarchical framework.
The fair value of the investments in global equity, fixedincome, and multi-asset class commingled funds hasbeen determined using NAV of the units held atDecember 31, 2019. Commingled funds are only offeredto a limited group of investors, and the most significantelement of the NAV is the fair value of the underlyinginvestment holdings of the fund. Unit values aredetermined by dividing each fund’s net assets by thenumber of units outstanding on the valuation date.Global equity commingled funds include seven fundswhich primarily consist of investments whose objectiveis to produce returns that either match or exceed thetotal rate of return of a particular benchmark. Fixedincome commingled funds include four funds that seekresults which correspond generally to the price andyield performance of a particular index or to producereturns in excess of the total rate of return of a particularbenchmark. Multi-asset class commingled funds includenine target date retirement funds which are broadlydiversified across global asset classes, where assetallocations become more conservative over time withthe objective of providing for retirement outcomesconsistent with investor preferences throughout thesavings and drawdown phase. Additionally, this assetclass also includes one fund whose objective is toproduce returns that exceed inflation.
Private equity partnerships include 164 private equitylimited partnership funds, with various strategiesincluding: buyout, venture capital, generalist debt,mezzanine debt, distressed debt, secondary funds, fund-of-funds, and energy-related strategies. The fair valuesof the investments in this type have been determinedusing the NAV per share (or its equivalent) of PERA’sownership interest in partners’ capital. The most
significant element of NAV is the fair value of theinvestment holdings. The valuation techniques varybased on investment type and involve a certain degreeof expert judgment. These holdings are valued by thegeneral partners in conjunction with management,investment advisers, and valuation specialists and aregenerally audited annually. These investments cannot beredeemed during the term of the partnership. Typically,private equity partnerships have an approximate life of10 years, with the first four to six years deemed as theinvestment period when capital is deployed. Theremaining years are typically the harvest period inwhich distributions are received through the liquidationof the underlying assets of the fund. The fair value forthese investments could differ significantly if a readymarket for these assets existed.
Private real estate includes 75 funds that investprimarily in U.S. institutional quality commercial realestate across a broad range of real estate asset types andlocations. The fair values of the investments in this typehave been determined using the NAV per share (or itsequivalent) of PERA’s ownership interest in partners’capital. The most significant element of NAV is the fairvalue of the investment holdings. The valuationtechniques vary based on investment type and involve acertain degree of expert judgment. These holdings arevalued by the general partners in conjunction withmanagement, investment advisers, and valuationspecialists and are generally audited annually. There are54 real estate closed-end limited partnership funds,which are considered illiquid as these investmentscannot typically be redeemed during the term of thepartnership. Distributions can be made periodicallybased on the sole discretion of the General Partner.
Financial Section
NOTES TO THE FINANCIAL STATEMENTS(Dollars in Thousands)
68 Financial Section � Colorado PERA Comprehensive Annual Financial Report 2019
Final D
raft
June
12,
202
0

There are four majority owned joint venture investmentswhich consist of industrial and multifamily assets invarious locations throughout the U.S. These investmentsare considered illiquid. There are 17 real estatecommingled open-ended funds which are consideredliquid real estate funds by nature of the open-endstructure of the fund. Open-end funds generally offerperiodic distributions of net cash flow, which investorsmay elect to reinvest. Additionally, open-end fundsgenerally offer quarterly redemption windows forrequesting portions, or all, of PERA’s investments. Twoof the open-ended funds contain a lock-out period withrespect to redemptions. The fair value for theseinvestments could differ significantly if a ready marketfor these assets existed.
The Opportunity Fund includes 27 funds that invest intimber, real assets, tactical, credit, global macro, multi-strategy, and other opportunistic strategies. The fairvalues of the investments in this type have beendetermined using the NAV per share (or its equivalent)of PERA’s ownership interest in partners’ capital. Themost significant element of NAV is the fair value of theinvestment holdings. The valuation techniques varybased on investment type and involve a certain degreeof expert judgment. These holdings are valued by thegeneral partners in conjunction with management,investment advisers, and valuation specialists and aregenerally audited annually. There are 16 partnershipswithin the Opportunity Fund that are consideredilliquid as these investments cannot be redeemed duringthe term of the partnership. Illiquid funds representapproximately 30.7 percent of the value of theOpportunity Fund. There are seven investments withinthe Opportunity Fund that are considered liquid bynature of the open-end structure of the fund. Open-endfunds generally offer periodic distributions of net cashflow, which investors may elect to reinvest. Additionally,open-end funds generally offer daily and monthlyredemption windows for requesting portions, or all, ofPERA’s investments. Distributions from each fund willbe received as the underlying investments of the fundsare liquidated. It is expected that the underlying assetsof the funds will be liquidated over the next two to 10years. The fair value for these investments could differsignificantly if a ready market for these assets existed.
Financial Section
NOTES TO THE FINANCIAL STATEMENTS(Dollars in Thousands)
Colorado PERA Comprehensive Annual Financial Report 2019 � Financial Section 69
Cash and Short-Term InvestmentsCash balances represent both operating cash accountsand investment cash on deposit held by banks. Tomaximize investment income, the float caused byoutstanding checks is invested, thus causing a possiblenegative book balance. Negative book balances arereflected in the liabilities section of the Statements ofFiduciary Net Position.
The carrying value of cash and short-term investmentsat December 31, 2019, in the Statements of Fiduciary Net
Position includes short-term fixed income securities of$31,933, pending foreign exchange contracts of $49, anddeposit and short-term investment funds of $690,834 fora total of $722,816. PERA considers fixed incomesecurities with a remaining maturity of 12 months orless to be short-term investments.
The table below presents the PERA combined totaldeposits and short-term investment funds as ofDecember 31, 2019.
Carrying Value
Deposits with banks (held in accounts insured bythe FDIC) $18,364
Deposits held at bank (uncollateralized, held byPERA’s agent in PERA’s name) 19,403
Short-term investment funds held at bank (sharesin commingled funds, held by PERA’s agent inPERA’s name) 653,067
Total deposits and short-term investment funds $690,834
Securities Lending TransactionsC.R.S. § 24-51-206 and Board policies permit PERA tolend its securities to broker-dealers and other entitieswith a simultaneous agreement to return the collateralfor the same securities in the future. PERA utilized twolending agents in 2019, its custodian, The Northern TrustCompany (Northern Trust) and Deutsche Bank AG,New York Branch (Deutsche Bank).
Northern Trust primarily lends international equity andfixed income securities for cash collateral. U.S. securitiesare loaned versus collateral valued at 102 percent of thefair value of the securities plus any accrued interest.Non-U.S. securities are loaned versus collateral valuedat 105 percent of the fair value of the securities plus anyaccrued interest. Collateral is marked-to-market daily.PERA cannot pledge or sell the collateral securitiesunless the borrower defaults.
Northern Trust invests the cash collateral related toPERA’s loaned securities in a separate account accordingto guidelines stipulated by PERA. Northern Trust’sSenior Credit Committee sets borrower credit limits. Asof December 31, 2019, the total fair value of securities onloan with Northern Trust cannot exceed $600,000.
Deutsche Bank lends domestic and international equitiesfor cash collateral. U.S. securities are loaned versuscollateral valued at a minimum of 102 percent of the fairvalue of the securities. International securities areloaned versus collateral valued at a minimum of105 percent of the fair value of the securities. Collateralis marked-to-market daily. PERA cannot pledge or sellthe collateral securities unless the borrower defaults.
Deutsche Bank invests the cash collateral related toPERA’s loaned securities in a separate account accordingto guidelines stipulated by PERA. Deutsche Bank’s
Final D
raft
June
12,
202
0
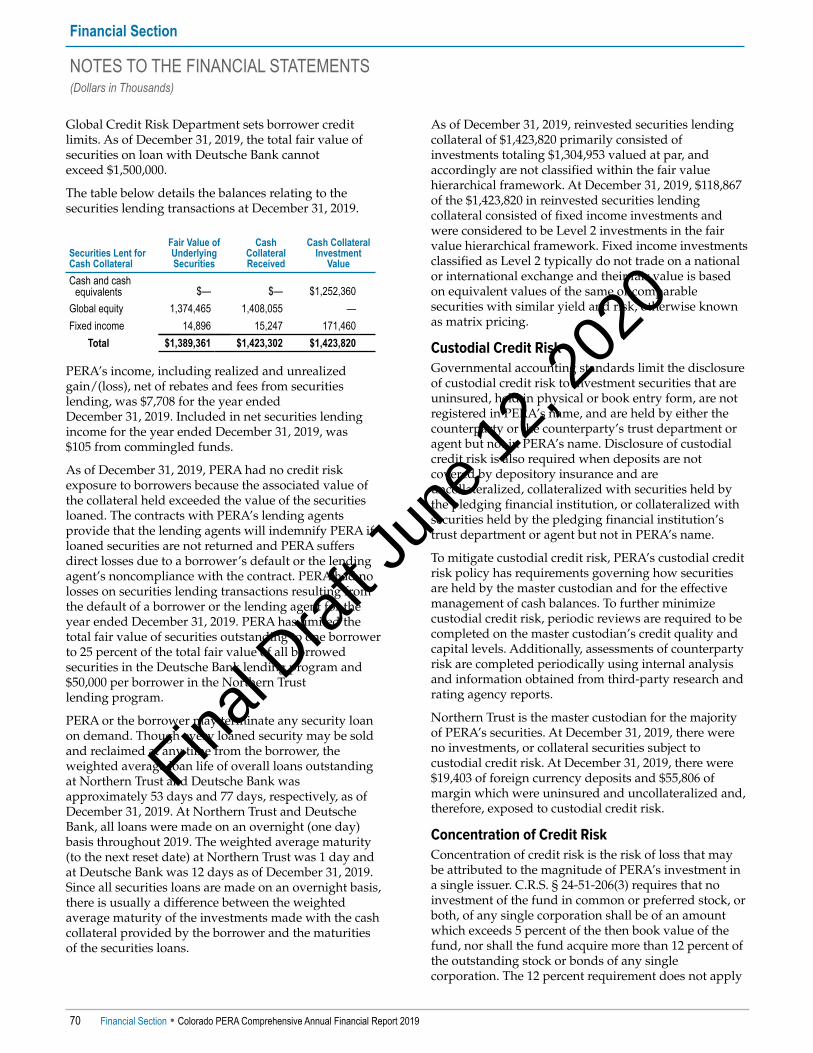
Global Credit Risk Department sets borrower creditlimits. As of December 31, 2019, the total fair value ofsecurities on loan with Deutsche Bank cannotexceed $1,500,000.
The table below details the balances relating to thesecurities lending transactions at December 31, 2019.
Securities Lent for Cash Collateral
Fair Value ofUnderlyingSecurities
Cash Collateral Received
Cash Collateral Investment
ValueCash and cash
equivalents $— $— $1,252,360Global equity 1,374,465 1,408,055 —Fixed income 14,896 15,247 171,460
Total $1,389,361 $1,423,302 $1,423,820
PERA’s income, including realized and unrealized gain/(loss), net of rebates and fees from securitieslending, was $7,708 for the year endedDecember 31, 2019. Included in net securities lendingincome for the year ended December 31, 2019, was$105 from commingled funds.
As of December 31, 2019, PERA had no credit riskexposure to borrowers because the associated value ofthe collateral held exceeded the value of the securitiesloaned. The contracts with PERA’s lending agentsprovide that the lending agents will indemnify PERA ifloaned securities are not returned and PERA suffersdirect losses due to a borrower’s default or the lendingagent’s noncompliance with the contract. PERA had nolosses on securities lending transactions resulting fromthe default of a borrower or the lending agent for theyear ended December 31, 2019. PERA has limited thetotal fair value of securities outstanding to one borrowerto 25 percent of the total fair value of all borrowedsecurities in the Deutsche Bank lending program and$50,000 per borrower in the Northern Trustlending program.
PERA or the borrower may terminate any security loanon demand. Though every loaned security may be soldand reclaimed at any time from the borrower, theweighted average loan life of overall loans outstandingat Northern Trust and Deutsche Bank wasapproximately 53 days and 77 days, respectively, as ofDecember 31, 2019. At Northern Trust and DeutscheBank, all loans were made on an overnight (one day)basis throughout 2019. The weighted average maturity(to the next reset date) at Northern Trust was 1 day andat Deutsche Bank was 12 days as of December 31, 2019.Since all securities loans are made on an overnight basis,there is usually a difference between the weightedaverage maturity of the investments made with the cashcollateral provided by the borrower and the maturitiesof the securities loans.
As of December 31, 2019, reinvested securities lendingcollateral of $1,423,820 primarily consisted ofinvestments totaling $1,304,953 valued at par, andaccordingly are not classified within the fair valuehierarchical framework. At December 31, 2019, $118,867of the $1,423,820 in reinvested securities lendingcollateral consisted of fixed income investments andwere considered to be Level 2 investments in the fairvalue hierarchical framework. Fixed income investmentsclassified as Level 2 typically do not trade on a nationalor international exchange and their fair value is basedon equivalent values of the same or comparablesecurities with similar yield and risk, otherwise knownas matrix pricing.
Financial Section
NOTES TO THE FINANCIAL STATEMENTS(Dollars in Thousands)
70 Financial Section � Colorado PERA Comprehensive Annual Financial Report 2019
Custodial Credit RiskGovernmental accounting standards limit the disclosureof custodial credit risk to investment securities that areuninsured, held in physical or book entry form, are notregistered in PERA’s name, and are held by either thecounterparty or the counterparty’s trust department oragent but not in PERA’s name. Disclosure of custodialcredit risk is also required when deposits are notcovered by depository insurance and areuncollateralized, collateralized with securities held bythe pledging financial institution, or collateralized withsecurities held by the pledging financial institution’strust department or agent but not in PERA’s name.
To mitigate custodial credit risk, PERA’s custodial creditrisk policy has requirements governing how securitiesare held by the master custodian and for the effectivemanagement of cash balances. To further minimizecustodial credit risk, periodic reviews are required to becompleted on the master custodian’s credit quality andcapital levels. Additionally, assessments of counterpartyrisk are completed periodically using internal analysisand information obtained from third-party research andrating agency reports.
Northern Trust is the master custodian for the majorityof PERA’s securities. At December 31, 2019, there wereno investments, or collateral securities subject tocustodial credit risk. At December 31, 2019, there were$19,403 of foreign currency deposits and $55,806 ofmargin which were uninsured and uncollateralized and,therefore, exposed to custodial credit risk.
Concentration of Credit RiskConcentration of credit risk is the risk of loss that maybe attributed to the magnitude of PERA’s investment ina single issuer. C.R.S. § 24-51-206(3) requires that noinvestment of the fund in common or preferred stock, orboth, of any single corporation shall be of an amountwhich exceeds 5 percent of the then book value of thefund, nor shall the fund acquire more than 12 percent ofthe outstanding stock or bonds of any singlecorporation. The 12 percent requirement does not apply
Final D
raft
June
12,
202
0

to governmental securities (U.S. Treasuries, sovereigns,etc.), Government Sponsored Enterprise securities(agencies including FNMA, FHLMC, etc.), mortgage-backed securities (agency or non-agency), commercialmortgage-backed securities (CMBS), asset-backedsecurities, or municipal securities. There is no singleissuer exposure that comprises 5 percent of the thenbook value of the fund and no holdings greater than12 percent of the outstanding stock or bonds of anysingle corporation at December 31, 2019.
RECONCILIATION OF CREDIT AND INTEREST RATE RISKDISCLOSURES TO FINANCIAL STATEMENTS
As of December 31, 2019Fixed income $12,121,968Fixed income securities classified as short term 31,933
Total fixed income securities $12,153,901
Financial Section
NOTES TO THE FINANCIAL STATEMENTS(Dollars in Thousands)
Colorado PERA Comprehensive Annual Financial Report 2019 � Financial Section 71
Credit RiskCredit risk is the risk that an issuer or othercounterparty to an investment will not fulfill itsobligation. As of December 31, 2019, PERA heldinvestments across the credit ratings spectrum, with themajority invested in investment grade issuers defined ashaving a minimum rating of Baa3/BBB-/BBB-, issuedby Moody’s, Standard and Poor’s (S&P), and Fitch,respectively. PERA’s credit risk policy is as follows:Fixed income portfolios generally have guidelines thatestablish limits on holdings within each credit ratingcategory. Some investment grade managers are allowedto purchase below investment grade securities, but ingeneral are limited to no more than 5 percent exposureto below investment grade securities. The tablebelow provides Moody’s credit quality ratings forPERA’s fixed income holdings as of December 31, 2019.
CREDIT QUALITY RATING DISPERSION SCHEDULE
Quality Rating Moody’s Total
U.S. GovtMortgage-
BackedSecurities
U.S. CorporateBonds
Non-U.S.Corporate
BondsStable
Value Fund
Non-U.S.Govt/
AgencyBonds
Non-AgencyMBS/CMBS
U.S.Municipal
BondsU.S. GovtAgencies1
Aaa $459,889 $2,850 $14,477 $— $— $191,832 $163,014 $11,112 $76,604Aa1 69,570 — 35,173 — — 18,414 1,537 14,446 —Aa2 166,925 — 89,795 24,905 — 26,905 5,437 19,883 —Aa3 121,928 — 80,701 22,858 — — 2,129 16,240 —A1 163,862 — 82,186 49,136 — 25,681 — 6,859 —A2 519,652 — 439,108 61,955 — 7,358 — 11,231 —A3 523,056 — 437,910 59,256 — 25,890 — — —Baa1 320,643 — 207,078 109,110 — 4,455 — — —Baa2 372,483 — 251,566 92,866 — 28,051 — — —Baa3 356,930 — 288,957 42,028 — 25,923 — 22 —Ba1 184,365 — 154,344 29,784 — 237 — — —Ba2 14,080 — 14,080 — — — — — —B2 10,043 — 10,043 — — — — — —Not rated2 2,909,107 2,310,498 52,759 213 447,685 11,201 81,742 5,009 —Subtotal $6,192,533 $2,313,348 $2,158,177 $492,111 $447,685 $365,947 $253,859 $84,802 $76,604U.S. govt treasuries 4,000,009
Explicit U.S. govtagencies3 740,559
Fixed incomecommingled funds2,4 1,210,451
Fixed income mutualfunds2 10,349
Total $12,153,901
1 Includes bonds issued by Federal Home Loan Bank, Federal Home Loan Mortgage Corporation, Federal National Mortgage Association, and othergovernment-sponsored agencies.
2 Not rated by Moody’s. 3 Bonds issued by the Government National Mortgage Association. 4 The fair value and fund-level credit quality ratings as reported by the commingled fund managers are: $8,053—Aaa; $1,104,413—Aa2; $97,985—A1.
Final D
raft
June
12,
202
0
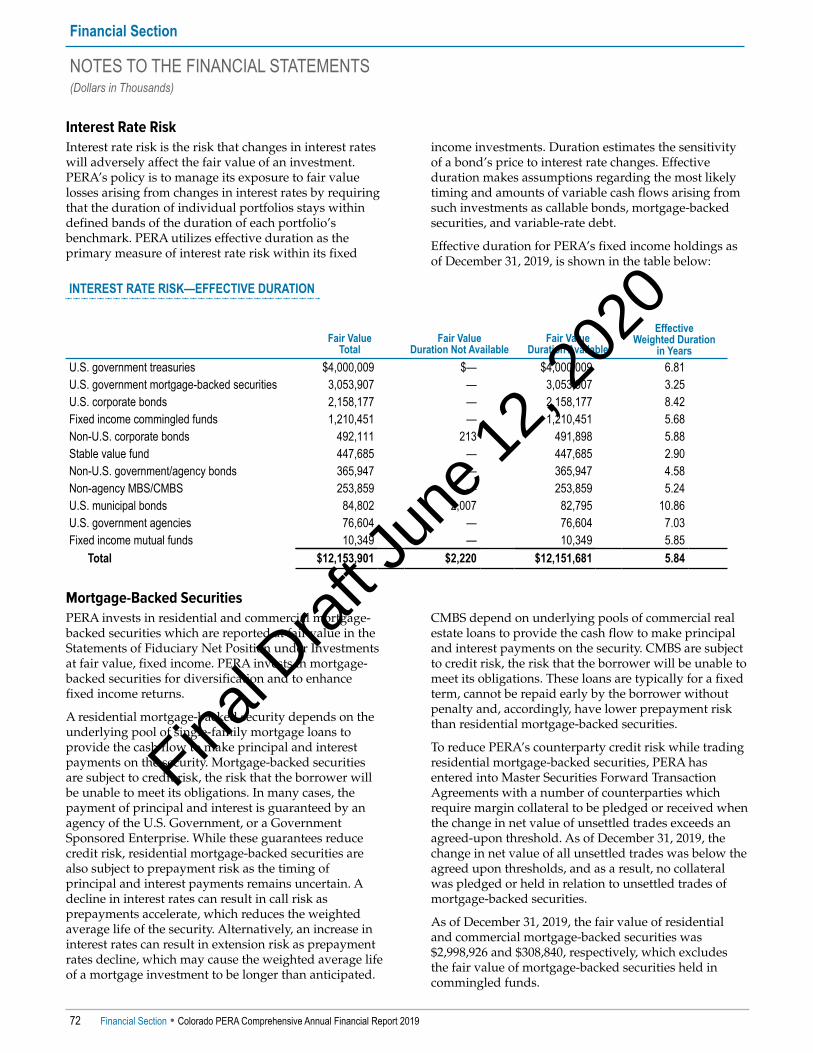
Interest Rate Risk Interest rate risk is the risk that changes in interest rateswill adversely affect the fair value of an investment.PERA’s policy is to manage its exposure to fair valuelosses arising from changes in interest rates by requiringthat the duration of individual portfolios stays withindefined bands of the duration of each portfolio’sbenchmark. PERA utilizes effective duration as theprimary measure of interest rate risk within its fixed
income investments. Duration estimates the sensitivityof a bond’s price to interest rate changes. Effectiveduration makes assumptions regarding the most likelytiming and amounts of variable cash flows arising fromsuch investments as callable bonds, mortgage-backedsecurities, and variable-rate debt.
Effective duration for PERA’s fixed income holdings asof December 31, 2019, is shown in the table below:
INTEREST RATE RISK—EFFECTIVE DURATION
Fair Value Total
Fair Value Duration Not Available
Fair Value Duration Available
Effective Weighted Duration
in YearsU.S. government treasuries $4,000,009 $— $4,000,009 6.81U.S. government mortgage-backed securities 3,053,907 — 3,053,907 3.25U.S. corporate bonds 2,158,177 — 2,158,177 8.42Fixed income commingled funds 1,210,451 — 1,210,451 5.68Non-U.S. corporate bonds 492,111 213 491,898 5.88Stable value fund 447,685 — 447,685 2.90Non-U.S. government/agency bonds 365,947 — 365,947 4.58Non-agency MBS/CMBS 253,859 — 253,859 5.24U.S. municipal bonds 84,802 2,007 82,795 10.86U.S. government agencies 76,604 — 76,604 7.03Fixed income mutual funds 10,349 — 10,349 5.85
Total $12,153,901 $2,220 $12,151,681 5.84
Financial Section
NOTES TO THE FINANCIAL STATEMENTS(Dollars in Thousands)
72 Financial Section � Colorado PERA Comprehensive Annual Financial Report 2019
Mortgage-Backed Securities PERA invests in residential and commercial mortgage-backed securities which are reported at fair value in theStatements of Fiduciary Net Position under Investmentsat fair value, fixed income. PERA invests in mortgage-backed securities for diversification and to enhancefixed income returns.
A residential mortgage-backed security depends on theunderlying pool of single-family mortgage loans toprovide the cash flow to make principal and interestpayments on the security. Mortgage-backed securitiesare subject to credit risk, the risk that the borrower willbe unable to meet its obligations. In many cases, thepayment of principal and interest is guaranteed by anagency of the U.S. Government, or a GovernmentSponsored Enterprise. While these guarantees reducecredit risk, residential mortgage-backed securities arealso subject to prepayment risk as the timing ofprincipal and interest payments remains uncertain. Adecline in interest rates can result in call risk asprepayments accelerate, which reduces the weightedaverage life of the security. Alternatively, an increase ininterest rates can result in extension risk as prepaymentrates decline, which may cause the weighted average lifeof a mortgage investment to be longer than anticipated.
CMBS depend on underlying pools of commercial realestate loans to provide the cash flow to make principaland interest payments on the security. CMBS are subjectto credit risk, the risk that the borrower will be unable tomeet its obligations. These loans are typically for a fixedterm, cannot be repaid early by the borrower withoutpenalty and, accordingly, have lower prepayment riskthan residential mortgage-backed securities.
To reduce PERA’s counterparty credit risk while tradingresidential mortgage-backed securities, PERA hasentered into Master Securities Forward TransactionAgreements with a number of counterparties whichrequire margin collateral to be pledged or received whenthe change in net value of unsettled trades exceeds anagreed-upon threshold. As of December 31, 2019, thechange in net value of all unsettled trades was below theagreed upon thresholds, and as a result, no collateralwas pledged or held in relation to unsettled trades ofmortgage-backed securities.
As of December 31, 2019, the fair value of residentialand commercial mortgage-backed securities was$2,998,926 and $308,840, respectively, which excludesthe fair value of mortgage-backed securities held incommingled funds.
Final D
raft
June
12,
202
0

Foreign Currency RiskForeign currency risk is the risk that changes inexchange rates will adversely impact the fair value of aninvestment or a deposit. PERA’s currency risk exposureresides primarily within the Global Equity asset class. Inaccordance with governmental accounting standards,this disclosure is limited to investments denominated innon-U.S. dollars. There may be additional foreigncurrency risk in investments that contain underlyingsecurities or business operations exposed to a foreigncurrency. PERA’s formal policy regarding foreigncurrency risk is to evaluate the risk as part of the fund’s
periodic asset/liability study and to consider it indetermining the total fund asset allocation. At December 31, 2019, PERA did not have a currencyhedging program at the total fund level. However, at themanager level, hedging currency risk may be permittedwhich allows the manager to actively manage currencyexposure at their discretion in accordance with theirindividual investment guidelines. PERA monitorscurrency risk at the total fund, asset class, andportfolio levels.
PERA’s exposure to foreign currency risk as ofDecember 31, 2019, is shown in the following table.
FOREIGN CURRENCY RISK
Currency TotalGlobal Equity
Private Equity Real Estate
IncomeReceivable
Cash and Short-TermInvestments
CorporateBonds
Pending Trades
PendingForeign
ExchangeTrades
Euro $3,176,144 $2,722,613 $378,618 $35,745 $17,966 $7,358 $— ($123) $13,967Japanese yen 1,979,786 1,976,527 — — 3,034 81 — (2,408) 2,552British pound sterling 1,666,178 1,613,153 48,689 — 3,081 877 — 515 (137)Hong Kong dollar 842,310 841,595 — — 34 697 — — (16)Swiss franc 735,271 719,577 — — 15,692 2 — — —Canadian dollar 697,883 694,511 — — 1,149 2,223 — — —Australian dollar 448,495 446,400 — — 732 1,363 — (527) 527Swedish krona 358,541 357,956 — — 557 28 — (91) 91South Korean won 217,388 213,877 — — 2,267 1,244 — — —Indian rupee 214,980 213,489 — — — 2,027 — (536) —New Taiwan dollar 195,910 195,172 — — 629 109 — — —Danish krone 192,657 188,751 — — 3,892 14 — — —Singapore dollar 165,471 165,011 — — 406 54 — (471) 471Brazilian real 153,899 152,904 — — 489 375 131 — —Chinese yuan renminbi (offshore) 75,744 75,163 — — — 581 — — —South African rand 59,006 58,973 — — — 33 — — —Norwegian krone 51,900 51,900 — — — — — — —Mexican peso 48,305 47,963 — — 1 341 — — —Indonesian rupiah 47,338 47,338 — — — — — — —Israeli shekel 40,799 40,767 — — 7 84 — (59) —Malaysian ringgit 33,521 33,241 — — 9 271 — 1 (1)Turkish lira 21,629 21,099 — — 1 529 — — —Thai baht 20,197 20,109 — — 85 2 — (1,181) 1,182New Zealand dollar 19,752 19,413 — — — 339 — — —Hungarian forint 15,929 15,929 — — — — — — —United Arab Emirates dirham 14,984 14,828 — — — 156 — — —Czech koruna 12,308 12,147 — — 149 12 — — —Polish zloty 10,807 10,345 — — 10 452 — (483) 483Philippine peso 5,381 5,346 — — — 35 — — —Russian ruble 4,006 4,006 — — — — — — —Qatari riyal 3,269 3,171 — — — 98 — — —Saudi riyal 1,867 1,858 — — — 9 — — —Colombian peso 294 291 — — 1 2 — — —Peruvian sol 7 — — — — 7 — — —Egyptian pound 4 4 — — — — — — —
Total $11,531,960 $10,985,427 $427,307 $35,745 $50,191 $19,403 $131 ($5,363) $19,119
Financial Section
NOTES TO THE FINANCIAL STATEMENTS(Dollars in Thousands)
Colorado PERA Comprehensive Annual Financial Report 2019 � Financial Section 73
Final D
raft
June
12,
202
0
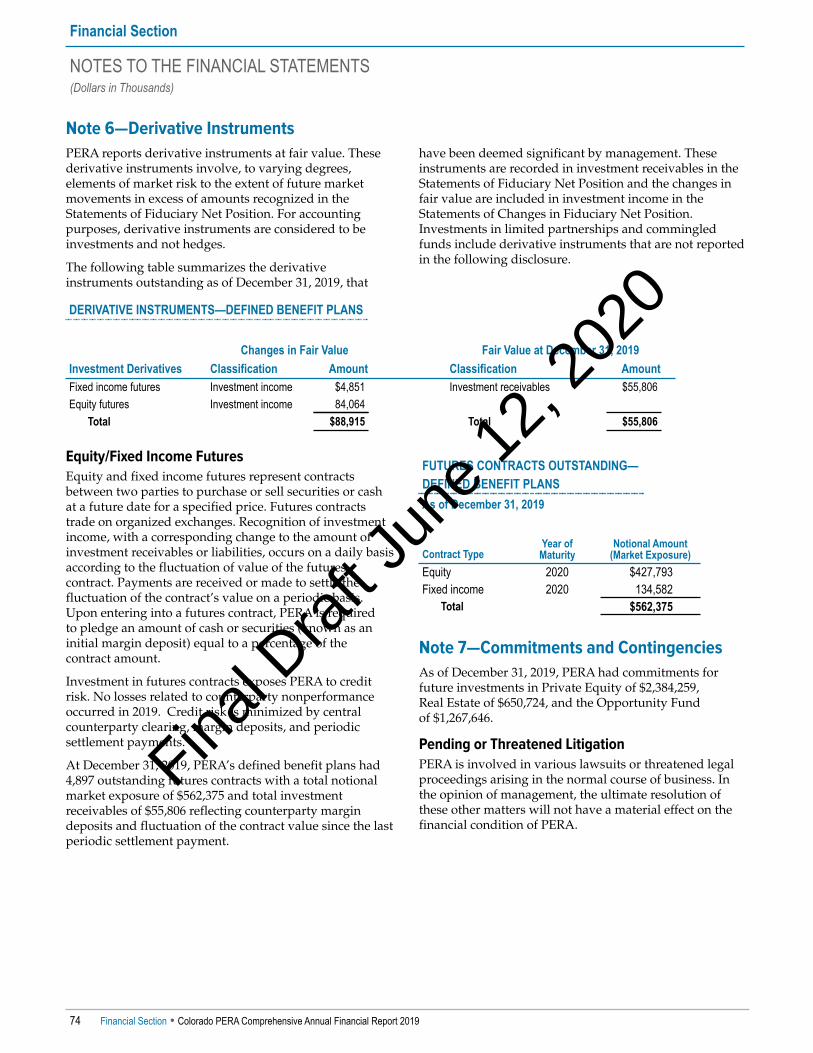
Note 6—Derivative Instruments PERA reports derivative instruments at fair value. Thesederivative instruments involve, to varying degrees,elements of market risk to the extent of future marketmovements in excess of amounts recognized in theStatements of Fiduciary Net Position. For accountingpurposes, derivative instruments are considered to beinvestments and not hedges.
The following table summarizes the derivativeinstruments outstanding as of December 31, 2019, that
have been deemed significant by management. Theseinstruments are recorded in investment receivables in theStatements of Fiduciary Net Position and the changes infair value are included in investment income in theStatements of Changes in Fiduciary Net Position.Investments in limited partnerships and commingledfunds include derivative instruments that are not reportedin the following disclosure.
DERIVATIVE INSTRUMENTS—DEFINED BENEFIT PLANS
Investment DerivativesChanges in Fair Value Fair Value at December 31, 2019
Classification Amount Classification AmountFixed income futures Investment income $4,851 Investment receivables $55,806Equity futures Investment income 84,064
Total $88,915 Total $55,806
Equity/Fixed Income FuturesEquity and fixed income futures represent contractsbetween two parties to purchase or sell securities or cashat a future date for a specified price. Futures contractstrade on organized exchanges. Recognition of investmentincome, with a corresponding change to the amount ofinvestment receivables or liabilities, occurs on a daily basisaccording to the fluctuation of value of the futurescontract. Payments are received or made to settle thefluctuation of the contract’s value on a periodic basis.Upon entering into a futures contract, PERA is requiredto pledge an amount of cash or securities (known as aninitial margin deposit) equal to a percentage of thecontract amount.
Investment in futures contracts exposes PERA to creditrisk. No losses related to counterparty nonperformanceoccurred in 2019. Credit risk is minimized by centralcounterparty clearing, margin deposits, and periodicsettlement payments.
At December 31, 2019, PERA’s defined benefit plans had4,897 outstanding futures contracts with a total notionalmarket exposure of $562,375 and total investmentreceivables of $55,806 reflecting counterparty margindeposits and fluctuation of the contract value since the lastperiodic settlement payment.
FUTURES CONTRACTS OUTSTANDING—DEFINED BENEFIT PLANSAs of December 31, 2019
Contract TypeYear of Maturity
Notional Amount (Market Exposure)
Equity 2020 $427,793Fixed income 2020 134,582
Total $562,375
Financial Section
NOTES TO THE FINANCIAL STATEMENTS(Dollars in Thousands)
74 Financial Section � Colorado PERA Comprehensive Annual Financial Report 2019
Note 7—Commitments and ContingenciesAs of December 31, 2019, PERA had commitments forfuture investments in Private Equity of $2,384,259,Real Estate of $650,724, and the Opportunity Fundof $1,267,646.
Pending or Threatened LitigationPERA is involved in various lawsuits or threatened legalproceedings arising in the normal course of business. Inthe opinion of management, the ultimate resolution ofthese other matters will not have a material effect on thefinancial condition of PERA.
Final D
raft
June
12,
202
0

Note 8—Voluntary Investment Program, Defined Contribution Retirement Plan, and Deferred Compensation PlanPERA administers the Voluntary Investment Program(PERAPlus 401(k) Plan), the Defined ContributionRetirement Plan (DC Plan), and the DeferredCompensation Plan (PERAPlus 457 Plan), collectively,Plans. The PERAPlus 401(k) Plan and DC Plan are bothdefined contribution plans. The PERAPlus 457 Plan is adeferred compensation plan. The Board has the authorityto establish and amend the Plans pursuant toC.R.S. § 24-51-1401, C.R.S. § 24-51-1501, andC.R.S. § 24-51-1601, respectively. The complete provisionsof the PERAPlus 401(k) Plan and the DC Plan areincorporated into PERA’s 401(k) and Defined ContributionPlan and Trust Document. The complete provisions of thePERAPlus 457 Plan are incorporated into The PERADeferred Compensation Plan Document.
All PlansThe following investment, distribution, and fee provisionsare the same under all three Plans.
• Participants have the choice of contributing to 17different investment options. In addition, participantsmay also make transfers, at any time, among thefollowing listed investment options:
▪ PERAdvantage Capital Preservation Fund
▪ PERAdvantage Fixed Income Fund
▪ PERAdvantage Real Return Fund
▪ PERAdvantage U.S. Large Cap Stock Fund
▪ PERAdvantage International Stock Fund
▪ PERAdvantage U.S. Small and Mid-Cap Stock Fund
▪ PERAdvantage Socially Responsible Investment(SRI) Fund
▪ PERAdvantage Income Fund
▪ PERAdvantage 2025 Fund
▪ PERAdvantage 2030 Fund
▪ PERAdvantage 2035 Fund
▪ PERAdvantage 2040 Fund
▪ PERAdvantage 2045 Fund
▪ PERAdvantage 2050 Fund
▪ PERAdvantage 2055 Fund
▪ PERAdvantage 2060 Fund
▪ TD Ameritrade Self-Directed Brokerage Account
• The participant’s entire account balance becomesavailable for distribution upon termination from allPERA-affiliated and/or PERAPlus 457-affiliatedemployers. All distributions are in accordance with thePlan documents and IRC requirements.
• Voya Institutional Plan Services, LLC, administers therecordkeeping for all participant transactions. NorthernTrust provides an array of financial services in supportof day to day operations of the Plans, includingcustodial services.
• TD Ameritrade, Inc. provides brokerage services for theSelf-Directed Brokerage Account. The TD AmeritradeSelf-Directed Brokerage Account, which consists of cash,equities, fixed income, mutual funds, and exchangetraded funds, is presented at fair value.
• The Great-West Stable Value Fund is offered withinPERAdvantage Capital Preservation Fund through agroup fixed and variable deferred annuity contractissued by Great-West Life & Annuity InsuranceCompany. As of December 31, 2019, the value of thevariable deferred annuity contract including interestreceivable and pending trade payable was $447,685. Fairvalue as of December 31, 2019, was $451,575.
• Cash balances represent both operating cash accountsand investment cash on deposit held by the custodians.
• Plan administration expenses are paid through amonthly administrative fee charged to participantaccounts and an asset-based fee paid directly from eachPERAdvantage fund. In addition, the underlyinginvestment portfolio managers within eachPERAdvantage fund charge an investment managementfee, which is paid directly from investment proceeds.
PERAPlus 401(k) PlanThe PERAPlus 401(k) Plan was establishedJanuary 1, 1985, and is an IRC § 401(k) plan that allows forvoluntary participation to provide additional benefits atretirement for PERA members. All employees working fora PERA-affiliated employer may contribute to thePERAPlus 401(k) Plan. There were 411 employers eligibleto participate in 2019 (see Note 1). The employer count ispresented for purposes of complying with GASB 67 only.For all other purposes, the definition of an employer isgoverned by Title 24, Article 51 of the C.R.S., PERA’sRules, 8 CCR 1502-1, and, if applicable, the employer’saffiliation agreement with PERA.
In 2019, participants could contribute the lesser of $19,000(actual dollars) or 100 percent of compensation less PERAmember contributions. Catch-up contributions up to$6,000 (actual dollars) in 2019 were allowed forparticipants who had attained age 50 before the close of
Financial Section
NOTES TO THE FINANCIAL STATEMENTS(Dollars in Thousands)
Colorado PERA Comprehensive Annual Financial Report 2019 � Financial Section 75
Final D
raft
June
12,
202
0
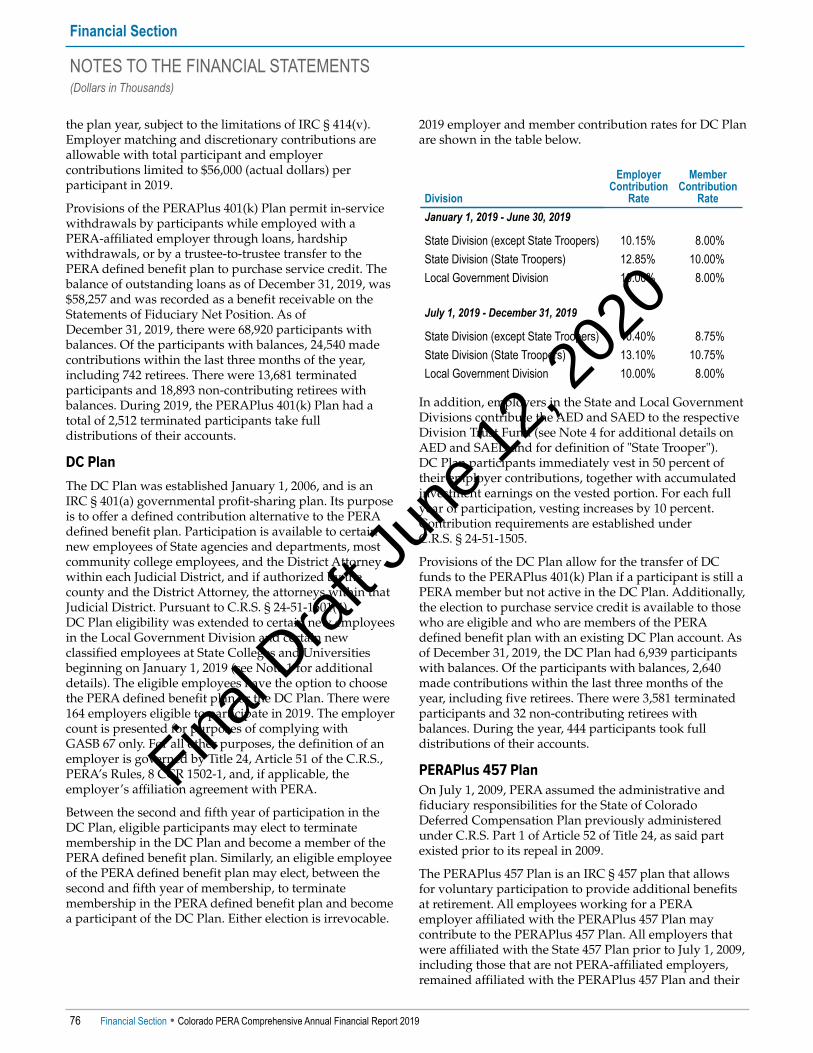
the plan year, subject to the limitations of IRC § 414(v).Employer matching and discretionary contributions areallowable with total participant and employercontributions limited to $56,000 (actual dollars) perparticipant in 2019.
Provisions of the PERAPlus 401(k) Plan permit in-servicewithdrawals by participants while employed with aPERA-affiliated employer through loans, hardshipwithdrawals, or by a trustee-to-trustee transfer to thePERA defined benefit plan to purchase service credit. Thebalance of outstanding loans as of December 31, 2019, was$58,257 and was recorded as a benefit receivable on theStatements of Fiduciary Net Position. As ofDecember 31, 2019, there were 68,920 participants withbalances. Of the participants with balances, 24,540 madecontributions within the last three months of the year,including 742 retirees. There were 13,681 terminatedparticipants and 18,893 non-contributing retirees withbalances. During 2019, the PERAPlus 401(k) Plan had atotal of 2,512 terminated participants take fulldistributions of their accounts.
DC PlanThe DC Plan was established January 1, 2006, and is anIRC § 401(a) governmental profit-sharing plan. Its purposeis to offer a defined contribution alternative to the PERAdefined benefit plan. Participation is available to certainnew employees of State agencies and departments, mostcommunity college employees, and the District Attorneywithin each Judicial District, and if authorized by thecounty and the District Attorney, the attorneys within thatJudicial District. Pursuant to C.R.S. § 24-51-1501(4),DC Plan eligibility was extended to certain new employeesin the Local Government Division and certain newclassified employees at State Colleges and Universitiesbeginning on January 1, 2019 (see Note 1 for additionaldetails). The eligible employees have the option to choosethe PERA defined benefit plan or the DC Plan. There were164 employers eligible to participate in 2019. The employercount is presented for purposes of complying withGASB 67 only. For all other purposes, the definition of anemployer is governed by Title 24, Article 51 of the C.R.S.,PERA’s Rules, 8 CCR 1502-1, and, if applicable, theemployer’s affiliation agreement with PERA.
Between the second and fifth year of participation in theDC Plan, eligible participants may elect to terminatemembership in the DC Plan and become a member of thePERA defined benefit plan. Similarly, an eligible employeeof the PERA defined benefit plan may elect, between thesecond and fifth year of membership, to terminatemembership in the PERA defined benefit plan and becomea participant of the DC Plan. Either election is irrevocable.
2019 employer and member contribution rates for DC Planare shown in the table below.
Division
EmployerContribution
Rate
MemberContribution
RateJanuary 1, 2019 - June 30, 2019
State Division (except State Troopers) 10.15% 8.00%State Division (State Troopers) 12.85% 10.00%Local Government Division 10.00% 8.00%
July 1, 2019 - December 31, 2019
State Division (except State Troopers) 10.40% 8.75%State Division (State Troopers) 13.10% 10.75%Local Government Division 10.00% 8.00%
In addition, employers in the State and Local GovernmentDivisions contribute the AED and SAED to the respectiveDivision Trust Fund (see Note 4 for additional details onAED and SAED and for definition of "State Trooper").DC Plan participants immediately vest in 50 percent oftheir employer contributions, together with accumulatedinvestment earnings on the vested portion. For each fullyear of participation, vesting increases by 10 percent.Contribution requirements are established underC.R.S. § 24-51-1505.
Provisions of the DC Plan allow for the transfer of DCfunds to the PERAPlus 401(k) Plan if a participant is still aPERA member but not active in the DC Plan. Additionally,the election to purchase service credit is available to thosewho are eligible and who are members of the PERAdefined benefit plan with an existing DC Plan account. Asof December 31, 2019, the DC Plan had 6,939 participantswith balances. Of the participants with balances, 2,640made contributions within the last three months of theyear, including five retirees. There were 3,581 terminatedparticipants and 32 non-contributing retirees withbalances. During the year, 444 participants took fulldistributions of their accounts.
PERAPlus 457 PlanOn July 1, 2009, PERA assumed the administrative andfiduciary responsibilities for the State of ColoradoDeferred Compensation Plan previously administeredunder C.R.S. Part 1 of Article 52 of Title 24, as said partexisted prior to its repeal in 2009.
The PERAPlus 457 Plan is an IRC § 457 plan that allowsfor voluntary participation to provide additional benefitsat retirement. All employees working for a PERAemployer affiliated with the PERAPlus 457 Plan maycontribute to the PERAPlus 457 Plan. All employers thatwere affiliated with the State 457 Plan prior to July 1, 2009,including those that are not PERA-affiliated employers,remained affiliated with the PERAPlus 457 Plan and their
Financial Section
NOTES TO THE FINANCIAL STATEMENTS(Dollars in Thousands)
76 Financial Section � Colorado PERA Comprehensive Annual Financial Report 2019
Final D
raft
June
12,
202
0

employees remained eligible to contribute. In 2019,participants could defer the lesser of $19,000 (actualdollars) or 100 percent of compensation less PERAmember contributions. Catch-up deferrals, up to thegreater of $6,000 (actual dollars) for participants who hadattained age 50 before the close of the plan year or thelimits of the special section 457 plan catch-up, wereallowed in 2019, subject to the limitations of IRC § 414(v)and § 457(b).
Provisions of the PERAPlus 457 Plan permit in-servicewithdrawals by participants while employed with aPERAPlus 457 Plan-affiliated employer through loans,unforeseen emergency withdrawals, de minimisdistributions, or by a trustee-to-trustee transfer to thePERA defined benefit plan to purchase service credit. Thebalance of outstanding loans as of December 31, 2019, was$11,902 and was recorded as a benefit receivable on theStatements of Fiduciary Net Position. As ofDecember 31, 2019, there were 18,919 participants withbalances. Of the participants with balances, 9,355 madecontributions within the last three months of the year,including 233 retirees. There were 3,044 terminatedparticipants and 4,279 non-contributing retirees withbalances. During the year, the PERAPlus 457 Plan had atotal of 781 terminated participants take full distributionsof their accounts.
Financial Section
NOTES TO THE FINANCIAL STATEMENTS(Dollars in Thousands)
Colorado PERA Comprehensive Annual Financial Report 2019 � Financial Section 77
Note 9—Health Care Trust Funds—Defined Benefit Health Care PlansPERA offers two defined benefit other postemploymentbenefit (OPEB) health care plans to benefit recipients andretirees. The HCTF and the DPS HCTF were created underC.R.S. § 24-51-1201(1) and (2), respectively. The HCTF is acost-sharing multiple-employer plan and the DPS HCTF isa single-employer plan. These funds provide a health carepremium subsidy to eligible participating PERA benefitrecipients and retirees who choose to enroll in one of thePERA health care plans; however, the subsidy is notavailable if only enrolled in the dental and/or vision plan(s). The health care premium subsidy is based upon thebenefit structure under which the member retires and themember’s years of service credit. For members who retirehaving service credit with employers in the DPS Divisionand one or more of the other four divisions, the premiumsubsidy is allocated between the two Health Care TrustFunds. The basis for the amount of the premium subsidyfunded by each trust fund is the percentage of the membercontribution account balance from each division as itrelates to the total member contribution account balancefrom which the retirement benefit is paid.
PERA Board AuthorityTitle 24, Article 51, Part 12 of the C.R.S., as amended, setsforth a framework that grants authority to the Board tocontract, self-insure, and authorize disbursementsnecessary in order to carry out the purposes of the
PERACare program, including the administration of thepremium subsidies. PERA contracts with a nationalinsurance carrier to administer claims for the self-insuredhealth care plans, with a national prescription benefitmanager to administer a pharmacy benefit for the self-insured plans, and with health insurance companies toprovide fully insured health care plans providing serviceswithin Colorado.
Plan Description and Benefit ProvisionsC.R.S. § 24-51-1202 et seq. specifies the eligibility forenrollment in the health care plans offered by PERA andthe amount of the premium subsidy. The law governing abenefit recipient’s eligibility for the subsidy and theamount of the subsidy differs slightly depending underwhich benefit structure the benefits are calculated. Allbenefit recipients under the PERA benefit structure and allretirees under the DPS benefit structure are eligible for apremium subsidy, if enrolled in a health care plan underPERACare. Upon the death of a DPS benefit structureretiree, no further subsidy is paid.
Membership EligibilityEnrollment in the PERACare health benefits program isvoluntary and available to the following eligibleindividuals:
• Benefit recipients and their dependents.
• Guardians of children receiving PERA survivor benefitsif the children are enrolled in the health care program.
• Surviving spouses of deceased retirees who chosesingle-life annuity options, if the surviving spousewas enrolled in the program when the retiree’sdeath occurred.
• Divorced spouses of retirees who are not receivingPERA benefits, but were enrolled in the program whenthe divorce occurred.
• Members while receiving short-term disabilityprogram payments.
• Members whose employers have elected to providecoverage through the health care program and suchmembers’ dependents.
Available Health Care Premium SubsidyPERA Benefit StructureThe maximum service-based premium subsidy is $230(actual dollars) per month for benefit recipients who areunder 65 years of age and who are not entitled toMedicare; the maximum service-based subsidy is $115(actual dollars) per month for benefit recipients who are65 years of age or older or who are under 65 years of ageand entitled to Medicare. The basis for the maximumservice-based subsidy, in each case, is for benefit recipientswith retirement benefits based on 20 or more years ofservice credit. There is a 5 percent reduction in the subsidy
Final D
raft
June
12,
202
0

for each year less than 20. The benefit recipient pays theremaining portion of the premium to the extent thesubsidy does not cover the entire amount.
For benefit recipients who have not participated in SocialSecurity and who are not otherwise eligible for premium-free Medicare Part A for hospital-related services,C.R.S. § 24-51-1206(4) provides an additional subsidy.According to the statute, PERA cannot charge premiumsto benefit recipients without Medicare Part A that aregreater than premiums charged to benefit recipients withPart A for the same plan option, coverage level, andservice credit. Currently, for each individual PERACareenrollee, the total premium for Medicare coverage isdetermined assuming plan participants have bothMedicare Part A and Part B and the difference in premiumcost is paid by the HCTF or the DPS HCTF on behalf ofbenefit recipients not covered by Medicare Part A.
DPS Benefit StructureThe maximum service-based premium subsidy is $230(actual dollars) per month for retirees who are under 65years of age and who are not entitled to Medicare; themaximum service-based subsidy is $115 (actual dollars)per month for retirees who are 65 years of age or older orwho are under 65 years of age and entitled to Medicare.The basis for the maximum subsidy, in each case, is forretirees with retirement benefits based on 20 or more yearsof service credit. There is a 5 percent reduction in thesubsidy for each year less than 20. The retiree pays theremaining portion of the premium to the extent thesubsidy does not cover the entire amount.
For retirees who have not participated in Social Securityand who are not otherwise eligible for premium-freeMedicare Part A for hospital-related services, the HCTF orthe DPS HCTF pays an alternate service-based premiumsubsidy. Each individual retiree meeting these conditionsreceives the maximum $230 (actual dollars) per monthsubsidy reduced appropriately for service less than20 years, as described above. Retirees who do not haveMedicare Part A pay the difference between the totalpremium and the monthly subsidy.
Medicare Prescription DrugsThe Medicare Prescription Drug, Improvement, andModernization Act of 2003 established prescription drugcoverage for Medicare beneficiaries under MedicarePart D. Beginning January 1, 2014, PERACare’sprescription drug coverage for the self-insured Medicaresupplement plans was moved to Employer Group WaiverPlan (EGWP) Medicare Part D prescription drug coverage.The EGWP provides three types of anticipated subsidieswhich the HCTF and DPS HCTF use to reduce therequired premiums collected from the enrollees. Each fund
pays for the full claims during the year and recoups theadditional cost offsetting claims expense when thesubsidies are received from the EGWP.
The subsidies provided by the EGWP includethe following:
• A monthly direct subsidy based on the number ofenrollees in the plan.
• A quarterly Coverage Gap Discount Program which isfunded by pharmaceutical manufacturers andreimburses the funds a portion of the cost of certaindrugs retirees have filled.
• An annual catastrophic coverage federal reinsurancewhich reimburses a portion of drug costs for retireeswho reach a certain level of drug costs in a year.
The following amounts were recognized by the fundsin 2019:
Subsidy HCTF DPS HCTFMonthly direct subsidy $1,679 $75Quarterly Coverage Gap Discount 18,021 799Annual federal reinsurance 31,813 1,403
Total $51,513 $2,277
ContributionsContribution requirements are established by statuteunder C.R.S. § 24-51-208. Colorado State law provisionsmay be amended from time to time by the ColoradoGeneral Assembly. PERA-affiliated employers mustsubmit contributions for all PERA members equal to1.02 percent of covered salaries. PERA-affiliatedemployers of the State Division, School Division, LocalGovernment Division, and Judicial Division contribute tothe HCTF. Affiliated employers of the DPS Divisioncontribute to the DPS HCTF.
Listed below is the number of active participatingemployers for the two Health Care Trust Funds. Guidanceunder GASB 74 classifies a primary government and itscomponent units as one employer.
Trust Fund As of December 31, 20191
HCTF 410DPS HCTF 1
Total employers 411 1 This employer count is presented for purposes of complying with GASB 74
only. For all other purposes, the definition of an employer is governed byTitle 24, Article 51 of the C.R.S., PERA’s Rules, 8 CCR 1502-1, and, ifapplicable, the employer’s affiliation agreement with PERA.
Employer contributions and investment earnings on theassets primarily pay for the cost of the premium subsidiesand the administrative costs incurred by the funds.
Financial Section
NOTES TO THE FINANCIAL STATEMENTS(Dollars in Thousands)
78 Financial Section � Colorado PERA Comprehensive Annual Financial Report 2019
Final D
raft
June
12,
202
0

Plan DataBenefit recipients and members of PERA consisted of thefollowing as of December 31, 2019:
MEMBERSHIP—HEALTH CARE TRUST FUNDS1
HCTF DPS HCTF 2019Retirees and beneficiaries2 118,180 7,148 125,328Inactive members eligible but
not yet receiving benefits3 27,796 1,988 29,784Active members3 197,615 15,679 213,294
Total 343,591 24,815 368,406 1 PERA's inactive members not eligible for benefits are not included in this
membership count for Health Care Trust Funds. 2 Currently receiving or eligible for OPEB benefits. 3 May be eligible for future OPEB benefits.
PARTICIPATION IN PERACARE FOR ELIGIBLERETIREES AND BENEFICIARIES
HCTF DPS HCTF TotalEnrolled in PERACare
Under age 65 10,853 475 11,328Age 65 and older 45,599 3,145 48,744
56,452 3,620 60,072Not enrolled in PERACare
Under age 65 14,561 588 15,149Age 65 and older 47,167 2,940 50,107
61,728 3,528 65,256Total eligible retirees
and beneficiaries 118,180 7,148 125,328
Summary of HCTF and DPS HCTFPERA offers two general types of health plans: fullyinsured plans offered through a health care organizationand self-insured plans administered by third-partyvendors. The plans offered include HMO, PPO, andMedicare Advantage plans.
Premiums collected and payments made are reported intwo ways, depending on whether or not the funds bearany level of risk with regard to the health coverage. Whenthere is no transfer of risk to the funds, the premiumscollected are reported as a liability and the liability isrelieved when the premiums are paid to the healthinsurance company that provides the fully insured healthplan. When there is no health coverage risk, the onlybenefit payment reported is the subsidy benefit which isequal to the difference between the premiums collectedfrom the enrollees and the full premium due to the healthinsurance company.
When the health care plan bears risk, all claims paid arereported as benefit payments and premiums collected are
reported as a reduction to benefit payments. The healthcare plan that involves risk to the funds is the self-insuredplan administered by Anthem Blue Cross Blue Shield(Anthem). In 2019, the prescription portion of claimsremained self-insured, while the Medicare portion ofmedical claims changed to fully insured. Due to PERA'spremium structure, these Medicare premiums paid toAnthem are reported as an expense within the Anthemplan and included in benefit payments. PERA uses anoutside consultant to determine the premiums required tocover anticipated health claims. The cost to the enrollee isreduced by the amount of the enrollee’s calculatedsubsidy, if applicable. Implicit in this process is the riskthat actual claims experience and the subsidies receivedfrom the EGWP could be different from the consultant’sdetermination resulting in either a gain or a loss to thefunds. In addition, other estimates and assumptions aremade for these funds. It is possible that actual resultscould significantly differ from these estimates.
Dental and Vision PlansDental and vision plans are also available to benefitrecipients. PERA offers fully insured and self-insureddental plans and self-insured vision plans. The fundsprovide no subsidy and the participants pay the fullpremiums for dental and vision coverage. For the fullyinsured dental plan, premiums collected are reported as aliability and the liability is relieved when the premiumsare paid to the insurance company who provides thecoverage. For this plan, the risk is borne by the insurancecompany contracted to provide the coverage. The claimspaid for the self-insured dental and vision plans arerecorded as benefit payments and the premiums collectedare recorded as a reduction to benefit payments. PERAuses an outside consultant to determine the premiumsrequired to cover anticipated claims. The risk to theseplans is that actual claims experience could be differentfrom the estimates resulting in either a gain or loss tothe funds. As of December 31, 2019, there were64,568 participants enrolled in the dental plans and52,027 participants enrolled in the vision plans in both theHCTF and the DPS HCTF.
PERA-Affiliated Employer Program ParticipationIn addition, fully insured pre-Medicare health plansoffered through Anthem and Kaiser Permanente areavailable to any PERA-affiliated employer who voluntarilyelects to provide health care coverage through the healthcare plan for its employees who are PERA members. Theprogram acts as a purchaser of private insurance toobtain economies of scale for the employers that electto join in the joint purchasing arrangement. As ofDecember 31, 2019, there were 15 employers in theprogram with 150 active members enrolled.
Fully insured dental and vision plans are also available toeligible employees of employers who have elected toprovide health care coverage through PERA. As of
Financial Section
NOTES TO THE FINANCIAL STATEMENTS(Dollars in Thousands)
Colorado PERA Comprehensive Annual Financial Report 2019 � Financial Section 79
Final D
raft
June
12,
202
0

December 31, 2019, there were 216 participants enrolledin the dental plans and 254 participants enrolled in thevision plans.
The insurance companies, who provide coverage throughthe program, set the rates for each employer group. Thereis no transfer of risk to the funds, PERA, or between the
participating employers. The funds provide no subsidyand the insurance companies providing the benefits bearthe risk for the plans. The participants and/or employerspay the full premiums for the coverage. PERA collects thepremiums and remits them to the insurance companieswho provide the coverage.
Financial Section
NOTES TO THE FINANCIAL STATEMENTS(Dollars in Thousands)
80 Financial Section � Colorado PERA Comprehensive Annual Financial Report 2019
Note 10—Net Pension Liability of the Division Trust FundsThe components of the net pension liability (NPL) for participating employers for each Division Trust Fund as ofDecember 31, 2019, are as follows:
State Division
School Division
LocalGovernment
DivisionJudicial Division
DPS Division
Total pension liability $25,696,667 $42,111,180 $5,324,353 $455,159 $4,315,270Plan fiduciary net position 15,992,863 27,171,397 4,592,962 364,234 3,656,426Net pension liability $9,703,804 $14,939,783 $731,391 $90,925 $658,844Plan fiduciary net position as a percentageof the total pension liability 62.24% 64.52% 86.26% 80.02% 84.73%
Actuarial Methods and AssumptionsActuarial valuations involve estimates of the value ofreported amounts and assumptions about the probabilityof events far into the future. Actuarially determinedamounts are subject to continual revision as actual resultsare compared to past expectations and new estimates aremade about the future. A Schedule of Net Pension Liabilityis included in the RSI, which follows the Notes to theFinancial Statements. It presents multi-year trendinformation about whether the FNP is increasing ordecreasing over time relative to the total pension liability(TPL). Calculations are based on the benefits provided
under the terms of the substantive plan in effect at thetime of each pension actuarial valuation and on thepattern of sharing of costs between employers of eachDivision Trust Fund and/or plan members to that point.Actuarial calculations reflect a long-term perspective.
The TPL for the Division Trust Funds was determined byactuarial valuations as of December 31, 2018, andgenerally accepted actuarial techniques were applied toroll forward the TPL to December 31, 2019 (measurementdate). The December 31, 2018, actuarial valuations usedthe following actuarial cost method and key actuarialassumptions and other inputs:
State Division
School Division
LocalGovernment
DivisionJudicial Division
DPS Division
Actuarial cost method Entry age Entry age Entry age Entry age Entry agePrice inflation 2.40% 2.40% 2.40% 2.40% 2.40%Real wage growth 1.10% 1.10% 1.10% 1.10% 1.10%Wage inflation 3.50% 3.50% 3.50% 3.50% 3.50%Salary increases, including wage inflation 3.50%–9.17% 3.50%–9.70% 3.50%–10.45% 4.00%–5.00% 3.50%–9.70%Long-term investment rate of return, net of pensionplan investment expenses, including price inflation 7.25% 7.25% 7.25% 7.25% 7.25%
Discount rate at prior measurement date 7.25% 7.25% 7.25% 7.25% 7.25%Discount rate at measurement date 7.25% 7.25% 7.25% 7.25% 7.25%Post-retirement benefit increases:PERA benefit structure hired prior to 1/1/07 and DPS benefit structure1 1.25% 1.25% 1.25% 1.25% 1.25%
PERA benefit structure hired after 12/31/061,2Financed by
the AIRFinanced by
the AIRFinanced by
the AIRFinanced by
the AIRFinanced by
the AIR 1 For 2019, the AI was 0.00 percent. 2 Post-retirement benefit increases are provided by the AIR, accounted separately within each Division Trust Fund, and subject to moneys being available;
therefore, liabilities related to increases for members of these benefit tiers can never exceed available assets.
Final D
raft
June
12,
202
0

The TPL as of December 31, 2019, included the anticipatedadjustments to contribution rates and the AI cap, resultingfrom the 2018 AAP assessment, statutorily recognizedJuly 1, 2019, and effective July 1, 2020.
Healthy mortality assumptions for active members werebased on the RP-2014 White Collar Employee MortalityTable, a table specifically developed for actively workingpeople. To allow for an appropriate margin of improvedmortality prospectively, the mortality rates incorporate a70 percent factor applied to male rates and a 55 percentfactor applied to female rates.
Post-retirement non-disabled mortality assumptions forState and Local Government Divisions were based on theRP-2014 Healthy Annuitant Mortality Table, adjustedas follows:
• Males: Mortality improvement projected to 2018 usingthe MP-2015 projection scale, a 73 percent factor appliedto rates for ages less than 80, a 108 percent factor appliedto rates for ages 80 and above, and further adjustmentsfor credibility.
• Females: Mortality improvement projected to 2020 usingthe MP-2015 projection scale, a 78 percent factor appliedto rates for ages less than 80, a 109 percent factor appliedto rates for ages 80 and above, and further adjustmentsfor credibility.
Post-retirement non-disabled mortality assumptions forSchool, Judicial, and DPS Divisions were based on theRP-2014 White Collar Healthy Annuitant Mortality Table,adjusted as follows:
• Males: Mortality improvement projected to 2018 usingthe MP-2015 projection scale, a 93 percent factor appliedto rates for ages less than 80, a 113 percent factor appliedto rates for ages 80 and above, and further adjustmentsfor credibility.
• Females: Mortality improvement projected to 2020 usingthe MP-2015 projection scale, a 68 percent factor appliedto rates for ages less than 80, a 106 percent factor appliedto rates for ages 80 and above, and further adjustmentsfor credibility.
The mortality assumption for disabled retirees was basedon 90 percent of the RP-2014 Disabled RetireeMortality Table.
The actuarial assumptions used in the December 31, 2018,valuations were based on the results of the 2016experience analysis for the periods January 1, 2012,through December 31, 2015, as well as theOctober 28, 2016, actuarial assumptions workshop andwere adopted by the Board during the November 18, 2016,Board meeting.
The long-term expected return on plan assets is reviewedas part of regular experience studies prepared every fouror five years for PERA. Recently, this assumption has been
reviewed more frequently. The most recent analyses wereoutlined in presentations to the Board on October 28, 2016.
Several factors were considered in evaluating the long-term rate of return assumption, including long-termhistorical data, estimates inherent in current market data,and a log-normal distribution analysis in which best-estimate ranges of expected future real rates of return(expected return, net of investment expense and inflation)were developed for each major asset class. These rangeswere combined to produce the long-term expected rate ofreturn by weighting the expected future real rates ofreturn by the target asset allocation percentage and thenadding expected inflation. The capital market assumptionsmay cover a shorter investment horizon and may not beuseful in setting the long-term rate of return for fundingpension plans which covers a longer time frame. Theassumption is intended to be a long-term assumption andis not expected to change absent a significant change in theasset allocation, a change in the inflation assumption, or afundamental change in the market that alters expectedreturns in future years.
As of the most recent adoption of the long-term rate ofreturn by the Board, the target asset allocation and bestestimates of geometric real rates of return for each majorasset class are summarized in the table as follows:
Asset ClassTarget
Allocation
30-Year Expected Geometric Real Rate of Return
U.S. Equity – Large Cap 21.20% 4.30%U.S. Equity – Small Cap 7.42% 4.80%Non-U.S. Equity – Developed 18.55% 5.20%Non-U.S. Equity – Emerging 5.83% 5.40%Core Fixed Income 19.32% 1.20%High Yield 1.38% 4.30%Non-U.S. Fixed Income – Developed 1.84% 0.60%Emerging Market Debt 0.46% 3.90%Core Real Estate 8.50% 4.90%Opportunity Fund 6.00% 3.80%Private Equity 8.50% 6.60%Cash 1.00% 0.20%
Total 100.00% Note: In setting the long-term expected rate of return for the plan,
projections employed to model future returns provide a range of expectedlong-term returns that, including expected inflation, ultimately support along-term expected rate of return assumption of 7.25 percent.
Discount Rate/Single Equivalent Interest Rate The projection of cash flows used to determine thediscount rate was performed in accordance with GASB 67.The basis for the projection of the liabilities and theFNP was an actuarial valuation performed as ofDecember 31, 2018, and the financial status of the funds asof the prior measurement date (December 31, 2018). In
Financial Section
NOTES TO THE FINANCIAL STATEMENTS(Dollars in Thousands)
Colorado PERA Comprehensive Annual Financial Report 2019 � Financial Section 81
Final D
raft
June
12,
202
0
addition to the actuarial cost method and assumptions ofthe December 31, 2018, actuarial valuation presentedearlier, the projection of cash flows applied the followingmethods and assumptions:
• Total covered payroll for the initial projection yearconsists of the covered payroll of the active membershippresent on the valuation date and the covered payroll offuture plan members assumed to be hired during theyear. In subsequent projection years, total coveredpayroll was assumed to increase annually at a rate of3.50 percent.
• Employee contributions were assumed to be made at themember contribution rates in effect for each year,including the scheduled increases in SB 18-200 and theadditional 0.50 percent for each of the five Division TrustFunds, resulting from the 2018 AAP assessment,statutorily recognized July 1, 2019, and effectiveJuly 1, 2020. Employee contributions for future planmembers were used to reduce the estimated amount oftotal service costs for future plan members.
• Employer contributions were assumed to be made atrates equal to the fixed statutory rates specified in lawfor each year, including the scheduled increase inSB 18-200 and the additional 0.50 percent for each of thefive Division Trust Funds, resulting from the 2018 AAPassessment, statutorily recognized July 1, 2019, andeffective July 1, 2020. Employer contributions alsoinclude current and estimated future AED and SAED,until the actuarial value funding ratio reaches103 percent, at which point the AED and SAED will eachdrop 0.50 percent every year until they are zero.Additionally, estimated employer contributions reflectreductions for the funding of the AIR and retiree healthcare benefits. For future plan members, employercontributions were further reduced by the estimatedamount of total service costs for future plan membersnot financed by their member contributions.
• Employer contributions for the DPS Division Trust Fundare reduced by an amount equal to the principalpayments plus interest necessary each year to financethe PCOPs issued in 1997 and 2008 andrefinanced thereafter.
• As specified in law, the State, as a nonemployercontributing entity, provides an annual directdistribution of $225 million (actual dollars), whichcommenced July 1, 2018, that is proportioned betweenthe State, School, Judicial, and DPS Division Trust Fundsbased upon the covered payroll of each Division. Theannual direct distribution ceases when all Division TrustFunds are fully funded.
• Employer contributions and the amount of total servicecosts for future plan members were based upon aprocess to estimate future ADCs assuming an analogousfuture plan member growth rate.
• The AIR balance was excluded from the initial FNP, asper statute, AIR amounts cannot be used to pay benefitsuntil transferred to either the retirement benefits reserveor the survivor benefits reserve, as appropriate. AIRtransfers to the FNP and the subsequent AIR benefitpayments were estimated and included inthe projections.
• The projected benefit payments reflect the lowered AIcap, from 1.50 percent to 1.25 percent, resulting from the2018 AAP assessment, statutorily recognizedJuly 1, 2019, and effective July 1, 2020.
• Benefit payments and contributions were assumed to bemade at the middle of the year.
Based on those methods and assumptions and the GASB67 projection test methodology, the FNP for all DivisionTrust Funds were projected to be available to make allprojected future benefit payments of current planmembers and were not projected to reach a depletion date.Therefore, the long-term expected rate of return on planinvestments was applied to all periods of projected benefitpayments to determine the TPL for each fund. Thediscount rate determination did not use a municipal bondindex rate, and therefore, the discount rate used tomeasure the TPL for these funds as of the measurementdate (December 31, 2019) was 7.25 percent.
The results of the GASB 67 projection test methodologyand development of the discount rate for each fund do notnecessarily indicate the fund’s ability to make benefitpayments in the future.
Sensitivity of the Net Pension Liability to Changes inthe Discount RateThe following presents the NPL for participatingemployers for each fund using the current discount rate,as well the fund's NPL if calculated using a discount ratethat is one percentage point lower or one percentage pointhigher than the current rate:
Trust Fund
1.0 PercentDecrease
in Discount Rate Net Pension LiabilityState Division 6.25% $12,483,645School Division 6.25% 19,813,351Local Government Division 6.25% 1,343,511Judicial Division 6.25% 137,205DPS Division 6.25% 1,168,699
Trust FundCurrent
Discount Rate Net Pension LiabilityState Division 7.25% $9,703,804School Division 7.25% 14,939,783Local Government Division 7.25% 731,391Judicial Division 7.25% 90,925DPS Division 7.25% 658,844
Financial Section
NOTES TO THE FINANCIAL STATEMENTS(Dollars in Thousands)
82 Financial Section � Colorado PERA Comprehensive Annual Financial Report 2019
Final D
raft
June
12,
202
0
Trust Fund
1.0 PercentIncrease
in Discount Rate Net Pension LiabilityState Division 8.25% $7,351,374School Division 8.25% 10,847,998Local Government Division 8.25% 216,604Judicial Division 8.25% 51,020DPS Division 8.25% 234,736
As shown above, if there is a significant deviation, over along period, in the actual rate of return compared to theassumed discount rate, the measurement of the NPLcould be materially under- or over-reported as ofDecember 31, 2019.
Financial Section
NOTES TO THE FINANCIAL STATEMENTS(Dollars in Thousands)
Colorado PERA Comprehensive Annual Financial Report 2019 � Financial Section 83
Note 11—Net OPEB Liability of the HealthCare Trust Funds The components of the net OPEB liability (NOL) forparticipating employers for each Health Care Trust Fundas of December 31, 2019, are as follows:
HCTF DPS HCTFTotal OPEB liability $1,488,508 $69,473Plan fiduciary net position 364,510 32,636Net OPEB liability $1,123,998 $36,837Plan fiduciary net position as apercentage of the total OPEB liability 24.49% 46.98%
Actuarial Methods and AssumptionsActuarial valuations involve estimates of the value ofreported amounts and assumptions about the probabilityof events far into the future. Actuarially determinedamounts are subject to continual revision as actualresults are compared to past expectations and newestimates are made about the future. A Schedule of NetOPEB Liability is included in the RSI, which follows theNotes to the Financial Statements. It presents multi-yeartrend information about whether the FNP is increasing ordecreasing over time relative to the total OPEB liability(TOL). Calculations are based on the benefitsprovided under the terms of the substantive plan ineffect at the time of each actuarial valuation and onthe pattern of sharing of costs between employers ofeach fund to that point. Actuarial calculations reflect along-term perspective.
The TOL for the Health Care Trust Funds was determinedby actuarial valuations as of December 31, 2018, andgenerally accepted actuarial techniques were applied toroll forward the TOL to December 31, 2019 (measurementdate). The December 31, 2018, actuarial valuations usedthe following actuarial cost method and key actuarialassumptions and other inputs:
HCTF DPS HCTFActuarial cost method Entry age Entry agePrice inflation 2.40% 2.40%Real wage growth 1.10% 1.10%Wage inflation 3.50% 3.50%Salary increases, including wage inflation 3.50% in aggregate 3.50% in aggregateLong-term investment rate of return, net of OPEB planinvestment expenses, including price inflation 7.25% 7.25%
Discount rate at prior measurement date 7.25% 7.25%Discount rate at measurement date 7.25% 7.25%Health care cost trend rates
PERA benefit structure:Service-based premium subsidy 0.00% 0.00%
PERACare Medicare plans5.60% in 2019, gradually
decreasing to 4.50% in 20295.60% in 2019, gradually
decreasing to 4.50% in 2029
Medicare Part A premiums3.50% in 2019, gradually
increasing to 4.50% in 20293.50% in 2019, gradually
increasing to 4.50% in 2029DPS benefit structure:
Service-based premium subsidy 0.00% 0.00%PERACare Medicare plans N/A N/AMedicare Part A premiums N/A N/A
Final D
raft
June
12,
202
0
In determining the additional liability for PERACareenrollees who are age 65 or older and who are not eligiblefor premium-free Medicare Part A, the following monthlycosts/premiums (in actual dollars) are assumed for 2019for the PERA benefit structure:
Medicare Plan
Cost forMembersWithout
Medicare Part A
Premiums forMembersWithout
Medicare Part AMedicare Advantage/Self-Insured Prescription $601 $240
Kaiser Permanente MedicareAdvantage HMO 605 237
The 2019 Medicare Part A premium is $437 (actual dollars)per month.
In determining the additional liability for PERACareenrollees in the PERA benefit structure who are age 65or older and who are not eligible for premium–freeMedicare Part A, the following chart details the initialexpected value of Medicare Part A benefits (in actualdollars), age adjusted to age 65 for the year followingthe valuation date:
Medicare Plan
Cost for Members Without Medicare Part A
Medicare Advantage/Self-Insured Prescription $562Kaiser Permanente Medicare Advantage HMO 571
All costs are subject to the health care cost trend rates, asdiscussed below.
Health care cost trend rates reflect the change in per capitahealth costs over time due to factors such as medicalinflation, utilization, plan design, and technologyimprovements. For the PERA benefit structure, health carecost trend rates are needed to project the future costsassociated with providing benefits to those PERACareenrollees not eligible for premium-free Medicare Part A.
Health care cost trend rates for the PERA benefit structureare based on published annual health care inflationsurveys in conjunction with actual plan experience (ifcredible), building block models and industry methodsdeveloped by health plan actuaries and administrators. Inaddition, projected trends for the Federal HospitalInsurance Trust Fund (Medicare Part A premiums)provided by the Centers for Medicare & Medicaid Servicesare referenced in the development of these rates. EffectiveDecember 31, 2018, the health care cost trend rates forMedicare Part A premiums were revised to reflect thecurrent expectation of future increases in rates of inflationapplicable to Medicare Part A premiums.
The PERA benefit structure health care cost trend ratesthat were used to measure the TOL are summarized in thetable below:
YearPERACare
Medicare PlansMedicare Part A
Premiums2019 5.60% 3.50%2020 8.60% 3.50%2021 7.30% 3.50%2022 6.00% 3.75%2023 5.70% 3.75%2024 5.50% 3.75%2025 5.30% 4.00%2026 5.10% 4.00%2027 4.90% 4.25%2028 4.70% 4.25%2029+ 4.50% 4.50%
Mortality assumptions detailed in Note 10 for thedetermination of the TPL for each the Division TrustFunds as shown below are applied, as applicable, in thedetermination of the TOL for the Health Care Trust Funds.Affiliated employers of the State, School, LocalGovernment, and Judicial Divisions participate in theHCTF. Affiliated employers of the DPS Divisionparticipate in the DPS HCTF.
Healthy mortality assumptions for active members werebased on the RP-2014 White Collar Employee MortalityTable, a table specifically developed for actively workingpeople. To allow for an appropriate margin of improvedmortality prospectively, the mortality rates incorporate a70 percent factor applied to male rates and a 55 percentfactor applied to female rates.
Post-retirement non-disabled mortality assumptions forState and Local Government Divisions were based on theRP-2014 Healthy Annuitant Mortality Table, adjustedas follows:
• Males: Mortality improvement projected to 2018 usingthe MP-2015 projection scale, a 73 percent factor appliedto rates for ages less than 80, a 108 percent factor appliedto rates for ages 80 and above, and further adjustmentsfor credibility.
• Females: Mortality improvement projected to 2020 usingthe MP-2015 projection scale, a 78 percent factor appliedto rates for ages less than 80, a 109 percent factor appliedto rates for ages 80 and above, and further adjustmentsfor credibility.
Post-retirement non-disabled mortality assumptions forSchool, Judicial, and DPS Divisions were based on theRP-2014 White Collar Healthy Annuitant Mortality Table,adjusted as follows:
Financial Section
NOTES TO THE FINANCIAL STATEMENTS(Dollars in Thousands)
84 Financial Section � Colorado PERA Comprehensive Annual Financial Report 2019
Final D
raft
June
12,
202
0

• Males: Mortality improvement projected to 2018 usingthe MP-2015 projection scale, a 93 percent factor appliedto rates for ages less than 80, a 113 percent factor appliedto rates for ages 80 and above, and further adjustmentsfor credibility.
• Females: Mortality improvement projected to 2020 usingthe MP-2015 projection scale, a 68 percent factor appliedto rates for ages less than 80, a 106 percent factor appliedto rates for ages 80 and above, and further adjustmentsfor credibility.
The mortality assumption for disabled retirees was basedon 90 percent of the RP-2014 Disabled RetireeMortality Table.
The following health care costs assumptions were updatedand used in the measurement of the obligations for theHCTF and DPS HCTF:
• Initial per capita health care costs for those PERACareenrollees under the PERA benefit structure who areexpected to attain age 65 and older ages and are noteligible for premium-free Medicare Part A benefits wereupdated to reflect the change in costs for the 2019plan year.
• The morbidity assumptions were updated to reflect theassumed standard aging factors.
• The health care cost trend rates for Medicare Part Apremiums were revised to reflect the then-currentexpectation of future increases in rates of inflationapplicable to Medicare Part A premiums.
The actuarial assumptions used in the December 31, 2018,valuations were based on the results of the 2016experience analysis for the periods January 1, 2012,through December 31, 2015, as well as, theOctober 28, 2016, actuarial assumptions workshop andwere adopted by the Board during the November 18, 2016,Board meeting. In addition, certain actuarial assumptionspertaining to per capita health care costs and their relatedtrend rates are analyzed and updated annually by theBoard’s actuary, as discussed above.
The long-term expected return on plan assets is reviewedas part of regular experience studies prepared every fouror five years for PERA. Recently, this assumption has beenreviewed more frequently. The most recent analyses wereoutlined in presentations to the Board on October 28, 2016.
Several factors were considered in evaluating the long-term rate of return assumption, including long-termhistorical data, estimates inherent in current market data,and a log-normal distribution analysis in which best-estimate ranges of expected future real rates of return(expected return, net of investment expense and inflation)were developed for each major asset class. These rangeswere combined to produce the long-term expected rate ofreturn by weighting the expected future real rates ofreturn by the target asset allocation percentage and thenadding expected inflation. The capital market assumptionsmay cover a shorter investment horizon and may not beuseful in setting the long-term rate of return for fundingOPEB plans which covers a longer time frame. Theassumption is intended to be a long-term assumption andis not expected to change absent a significant change in theasset allocation, a change in the inflation assumption, or afundamental change in the market that alters expectedreturns in future years.
As of the most recent adoption of the long-term rate ofreturn by the Board, the target asset allocation and bestestimates of geometric real rates of return for each majorasset class are summarized in the table as follows:
Asset ClassTarget
Allocation
30-Year ExpectedGeometric RealRate of Return
U.S. Equity – Large Cap 21.20% 4.30%U.S. Equity – Small Cap 7.42% 4.80%Non-U.S. Equity – Developed 18.55% 5.20%Non-U.S. Equity – Emerging 5.83% 5.40%Core Fixed Income 19.32% 1.20%High Yield 1.38% 4.30%Non-U.S. Fixed Income – Developed 1.84% 0.60%Emerging Market Debt 0.46% 3.90%Core Real Estate 8.50% 4.90%Opportunity Fund 6.00% 3.80%Private Equity 8.50% 6.60%Cash 1.00% 0.20%
Total 100.00%Note: In setting the long-term expected rate of return for the plan,projections employed to model future returns provide a range of expectedlong-term returns that, including expected inflation, ultimately support along-term expected rate of return assumption of 7.25 percent.
Financial Section
NOTES TO THE FINANCIAL STATEMENTS(Dollars in Thousands)
Colorado PERA Comprehensive Annual Financial Report 2019 � Financial Section 85
Final D
raft
June
12,
202
0

Sensitivity of the Net OPEB Liability to Changes inthe Health Care Cost Trend RatesThe following presents the NOL using the current healthcare cost trend rates applicable to the PERA benefitstructure, as well as the fund’s NOL if calculated usinghealth care cost trend rates that are one percentagepoint lower or one percentage point higher than thecurrent rates:
1.0 PercentDecrease inTrend Rates
Current Trend Rates
1.0 PercentIncrease inTrend Rates
Initial PERACare Medicare trend rate 4.60% 5.60% 6.60%Ultimate PERACare
Medicare trend rate 3.50% 4.50% 5.50%Initial Medicare Part A trend rate 2.50% 3.50% 4.50%Ultimate Medicare Part A trend rate 3.50% 4.50% 5.50%Net OPEB liability HCTF $1,097,298 $1,123,998 $1,154,852 DPS HCTF 36,829 36,837 36,845
Discount Rate/Single Equivalent Interest Rate The projection of cash flows used to determine thediscount rate was performed in accordance with GASB 74.The basis for the projections of the liabilities and theFNP was an actuarial valuation performed as ofDecember 31, 2018 and the financial status of the fundas of the prior measurement date (December 31, 2018). Inaddition to the actuarial cost method and assumptions ofthe December 31, 2018, actuarial valuation presentedearlier, the projection of cash flows applied the followingmethods and assumptions:
• Updated health care cost trend rates for MedicarePart A premiums as of the December 31, 2019,measurement date.
• Total covered payroll for the initial projection yearconsists of the covered payroll of the active membershippresent on the valuation date and the covered payroll offuture plan members assumed to be hired during theyear. In subsequent projection years, total coveredpayroll was assumed to increase annually at a rate of3.50 percent.
• Employer contributions were assumed to be made atrates equal to the fixed statutory rates specified in lawand effective as of the measurement date.
• Employer contributions and the amount of total servicecosts for future plan members were based upon aprocess to estimate future ADCs assuming an analogousfuture plan member growth rate.
• Benefit payments and contributions were assumed to bemade at the middle of the year.
Based on those methods and assumptions and the GASB74 projection test methodology, the FNP for the HCTF andDPS HCTF were projected to be available to make allprojected future benefit payments of current planmembers and were not projected to reach a depletion date.Therefore, the long-term expected rate of return on planinvestments was applied to all periods of projected benefitpayments to determine the TOL for each fund. Thediscount rate determination did not use a municipal bondindex rate, and therefore, the discount rate used tomeasure the TOL for these funds as of the measurementdate (December 31, 2019) was 7.25 percent.
The results of the GASB 74 projection test methodologyand development of the discount rate for each fund do notnecessarily indicate the fund’s ability to make benefitpayments in the future.
Sensitivity of the Net OPEB Liability to Changes inthe Discount RateThe following presents the NOL for participatingemployers for each fund using the current discount rate,as well as the fund’s NOL if calculated using a discountrate that is one percentage point lower or one percentagepoint higher than the current rate:
1.0 Percent Decrease in Discount Rate Net OPEB Liability
HCTF 6.25% $1,270,906DPS HCTF 6.25% 43,544
Current Discount Rate Net OPEB LiabilityHCTF 7.25% $1,123,998DPS HCTF 7.25% 36,837
1.0 Percent Increase in Discount Rate Net OPEB Liability
HCTF 8.25% $998,361DPS HCTF 8.25% 31,112
As shown above, if there is a significant deviation, over along period, in the actual rate of return compared to theassumed discount rate, the measurement of the NOLcould be materially under- or over-reported as ofDecember 31, 2019.
Financial Section
NOTES TO THE FINANCIAL STATEMENTS(Dollars in Thousands)
86 Financial Section � Colorado PERA Comprehensive Annual Financial Report 2019
Note 12—Subsequent EventsSubsequent to December 31, 2019, as a result of theCOVID-19 pandemic, the global economic outlook haschanged. The duration and full effects of the pandemic arecurrently unknown, as the global picture continues toevolve. Although unprecedented federal fiscal andmonetary stimulus have helped to stabilize and soften the
Final D
raft
June
12,
202
0
impact of economic contraction, the near-term negativeimpact on PERA's investment portfolio, as well the short-medium term impact on PERA's membership anddemographics, remains uncertain.
HB 20-1379: Suspend Direct Distribution to PERA PublicEmployees Retirement Association for 2020-21 Fiscal Year,passed during the 2020 legislative session and signed byGovernor Polis on June X, 2020, suspends the July 1, 2020,$225 million (actual dollars) direct distribution allocated tothe State, School, Judicial, and DPS Divisions, as requiredunder SB 18-200.
HB 20-1394: Public Employees' Retirement Association JudicialDivision Contribution Rate Modification, passed during the2020 legislative session and signed by Governor Polis onJune X, 2020, modifies the source of the dollars otherwiseanticipated to be contributed to the pension plan over the
next three-year period (plan years 2020-2022). The bill’smain provision requires 5.0 percent of the Judicial Divisionbase employer contributions rate to be paid by themembers of the Judicial Division for the State's 2020-21and 2021-22 fiscal years. This does not apply to theemployer or member contribution rates for judgesemployed by the Denver County Court.
Governmental accounting standards require the netpension liabilities for financial reporting purposes bemeasured using the plan provisions in effect as of thepension plan’s year end. The passage of HB 20-1379 andHB 20-1394 into law is considered a nonrecognizedsubsequent event as these statutory changes to planprovisions did not exist as of the December 31, 2019,measurement date.
Financial Section
NOTES TO THE FINANCIAL STATEMENTS(Dollars in Thousands)
Colorado PERA Comprehensive Annual Financial Report 2019 � Financial Section 87
Final D
raft
June
12,
202
0
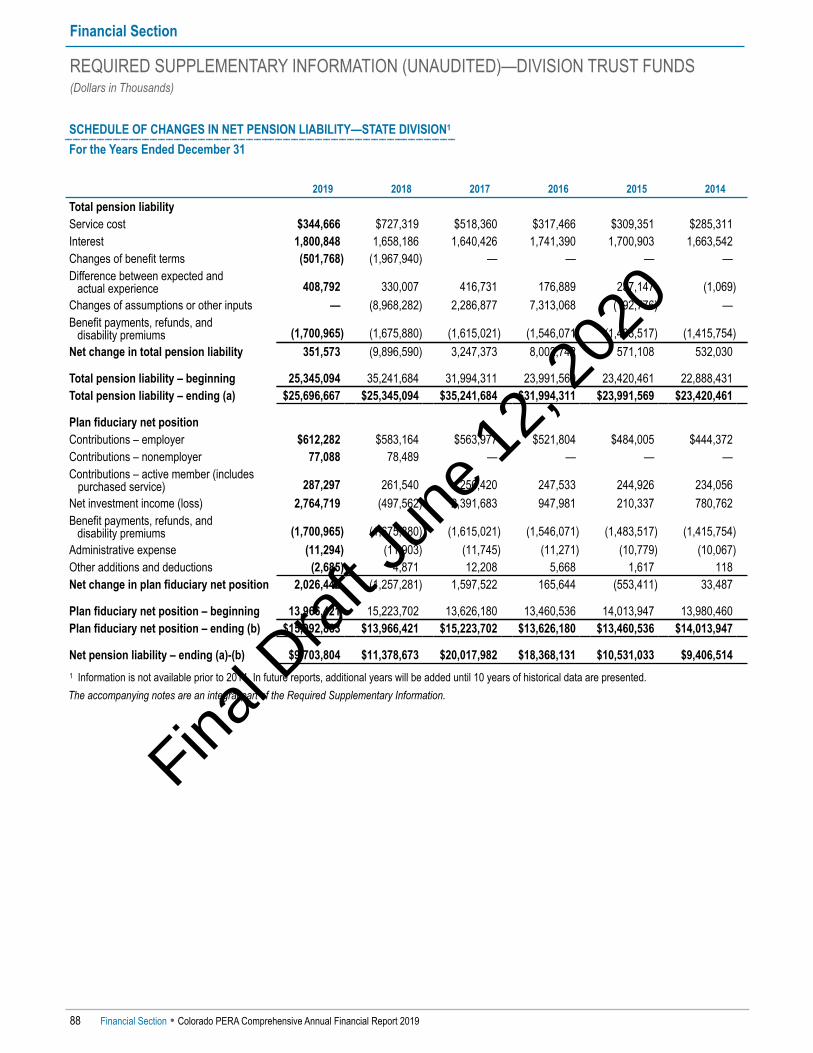
SCHEDULE OF CHANGES IN NET PENSION LIABILITY—STATE DIVISION1
For the Years Ended December 31
2019 2018 2017 2016 2015 2014Total pension liabilityService cost $344,666 $727,319 $518,360 $317,466 $309,351 $285,311Interest 1,800,848 1,658,186 1,640,426 1,741,390 1,700,903 1,663,542Changes of benefit terms (501,768) (1,967,940) — — — —Difference between expected and actual experience 408,792 330,007 416,731 176,889 237,147 (1,069)
Changes of assumptions or other inputs — (8,968,282) 2,286,877 7,313,068 (192,776) —Benefit payments, refunds, and disability premiums (1,700,965) (1,675,880) (1,615,021) (1,546,071) (1,483,517) (1,415,754)
Net change in total pension liability 351,573 (9,896,590) 3,247,373 8,002,742 571,108 532,030
Total pension liability – beginning 25,345,094 35,241,684 31,994,311 23,991,569 23,420,461 22,888,431Total pension liability – ending (a) $25,696,667 $25,345,094 $35,241,684 $31,994,311 $23,991,569 $23,420,461
Plan fiduciary net positionContributions – employer $612,282 $583,164 $563,977 $521,804 $484,005 $444,372Contributions – nonemployer 77,088 78,489 — — — —Contributions – active member (includes purchased service) 287,297 261,540 256,420 247,533 244,926 234,056Net investment income (loss) 2,764,719 (497,562) 2,391,683 947,981 210,337 780,762Benefit payments, refunds, and disability premiums (1,700,965) (1,675,880) (1,615,021) (1,546,071) (1,483,517) (1,415,754)
Administrative expense (11,294) (11,903) (11,745) (11,271) (10,779) (10,067)Other additions and deductions (2,685) 4,871 12,208 5,668 1,617 118Net change in plan fiduciary net position 2,026,442 (1,257,281) 1,597,522 165,644 (553,411) 33,487
Plan fiduciary net position – beginning 13,966,421 15,223,702 13,626,180 13,460,536 14,013,947 13,980,460Plan fiduciary net position – ending (b) $15,992,863 $13,966,421 $15,223,702 $13,626,180 $13,460,536 $14,013,947
Net pension liability – ending (a)-(b) $9,703,804 $11,378,673 $20,017,982 $18,368,131 $10,531,033 $9,406,514 1 Information is not available prior to 2014. In future reports, additional years will be added until 10 years of historical data are presented. The accompanying notes are an integral part of the Required Supplementary Information.
Financial Section
REQUIRED SUPPLEMENTARY INFORMATION (UNAUDITED)—DIVISION TRUST FUNDS(Dollars in Thousands)
88 Financial Section � Colorado PERA Comprehensive Annual Financial Report 2019
Final D
raft
June
12,
202
0

SCHEDULE OF CHANGES IN NET PENSION LIABILITY—SCHOOL DIVISION1
For the Years Ended December 31
2019 2018 2017 2016 2015 2014Total pension liabilityService cost $618,937 $1,270,011 $954,368 $567,247 $548,358 $511,059Interest 2,938,492 2,759,146 2,690,433 2,722,256 2,652,731 2,582,865Changes of benefit terms (856,299) (3,247,230) — — — —Difference between expected and actual experience 770,676 443,651 564,155 346,658 278,464 (1,387)
Changes of assumptions or other inputs — (15,247,222) 3,547,294 13,572,334 (298,005) —Benefit payments, refunds, and disability premiums (2,545,230) (2,492,928) (2,411,987) (2,300,644) (2,208,452) (2,113,547)
Net change in total pension liability 926,576 (16,514,572) 5,344,263 14,907,851 973,096 978,990
Total pension liability – beginning 41,184,604 57,699,176 52,354,913 37,447,062 36,473,966 35,494,976Total pension liability – ending (a) $42,111,180 $41,184,604 $57,699,176 $52,354,913 $37,447,062 $36,473,966
Plan fiduciary net positionContributions – employer $1,002,760 $923,910 $857,740 $812,740 $754,182 $686,323Contributions – nonemployer 127,367 126,505 — — — —Contributions – active member (includes purchased service) 462,891 414,336 399,053 386,481 372,378 356,520Net investment income (loss) 4,676,607 (838,899) 3,982,275 1,569,026 344,000 1,274,862Benefit payments, refunds, and disability premiums (2,545,230) (2,492,928) (2,411,987) (2,300,644) (2,208,452) (2,113,547)
Administrative expense (22,619) (23,560) (23,019) (21,991) (20,865) (19,290)Other additions and deductions (7,929) 5,456 (22,378) (17,334) (9,082) (4,264)Net change in plan fiduciary net position 3,693,847 (1,885,180) 2,781,684 428,278 (767,839) 180,604
Plan fiduciary net position – beginning 23,477,550 25,362,730 22,581,046 22,152,768 22,920,607 22,740,003Plan fiduciary net position – ending (b) $27,171,397 $23,477,550 $25,362,730 $22,581,046 $22,152,768 $22,920,607
Net pension liability – ending (a)-(b) $14,939,783 $17,707,054 $32,336,446 $29,773,867 $15,294,294 $13,553,359 1 Information is not available prior to 2014. In future reports, additional years will be added until 10 years of historical data are presented. The accompanying notes are an integral part of the Required Supplementary Information.
Financial Section
REQUIRED SUPPLEMENTARY INFORMATION (UNAUDITED)—DIVISION TRUST FUNDS(Dollars in Thousands)
Colorado PERA Comprehensive Annual Financial Report 2019 � Financial Section 89
Final D
raft
June
12,
202
0

SCHEDULE OF CHANGES IN NET PENSION LIABILITY—LOCAL GOVERNMENT DIVISION1
For the Years Ended December 31
2019 2018 2017 2016 2015 2014Total pension liabilityService cost $75,305 $84,331 $75,417 $65,250 $63,005 $58,676Interest 373,200 386,381 360,995 346,944 338,616 329,156Changes of benefit terms (105,812) (412,930) (110) — — —Difference between expected and actual experience 65,687 77,207 125,585 42,105 14,930 (322)
Changes of assumptions or other inputs — — — 179,802 (36,449) —Benefit payments, refunds, and disability premiums (312,629) (302,903) (289,218) (272,344) (265,789) (256,972)
Net change in total pension liability 95,751 (167,914) 272,669 361,757 114,313 130,538
Total pension liability – beginning 5,228,602 5,396,516 5,123,847 4,762,090 4,647,777 4,517,239Total pension liability – ending (a) $5,324,353 $5,228,602 $5,396,516 $5,123,847 $4,762,090 $4,647,777
Plan fiduciary net positionContributions – employer $85,597 $81,358 $78,291 $75,132 $70,415 $68,719Contributions – employer disaffiliation — — 1,063 — — 186,006Contributions – active member (includes purchased service) 62,823 58,063 56,797 52,451 51,986 49,290Net investment income (loss) 792,219 (142,476) 669,011 261,276 56,328 200,394Benefit payments, refunds, and disability premiums (312,629) (302,903) (289,218) (272,344) (265,789) (256,972)
Administrative expense (2,476) (2,621) (2,541) (2,395) (2,253) (2,091)Other additions and deductions (3,961) (3,118) (3,823) (1,123) (1,646) (2,190)Net change in plan fiduciary net position 621,573 (311,697) 509,580 112,997 (90,959) 243,156
Plan fiduciary net position – beginning 3,971,389 4,283,086 3,773,506 3,660,509 3,751,468 3,508,312Plan fiduciary net position – ending (b) $4,592,962 $3,971,389 $4,283,086 $3,773,506 $3,660,509 $3,751,468
Net pension liability – ending (a)-(b) $731,391 $1,257,213 $1,113,430 $1,350,341 $1,101,581 $896,309 1 Information is not available prior to 2014. In future reports, additional years will be added until 10 years of historical data are presented. The accompanying notes are an integral part of the Required Supplementary Information.
Financial Section
REQUIRED SUPPLEMENTARY INFORMATION (UNAUDITED)—DIVISION TRUST FUNDS(Dollars in Thousands)
90 Financial Section � Colorado PERA Comprehensive Annual Financial Report 2019
Final D
raft
June
12,
202
0

SCHEDULE OF CHANGES IN NET PENSION LIABILITY—JUDICIAL DIVISION1
For the Years Ended December 31
2019 2018 2017 2016 2015 2014Total pension liabilityService cost $8,774 $13,516 $14,364 $12,639 $10,813 $9,024Interest 32,105 30,417 27,480 25,774 25,005 24,820Changes of benefit terms (8,459) (33,997) — — — —Difference between expected and actual experience 2,732 3,122 16,644 22,804 7,289 (5)
Changes of assumptions or other inputs — (100,437) (14,394) 43,576 21,485 21,294Benefit payments, refunds, and disability premiums (28,097) (26,463) (25,298) (22,888) (21,200) (19,903)
Net change in total pension liability 7,055 (113,842) 18,796 81,905 43,392 35,230
Total pension liability – beginning 448,104 561,946 543,150 461,245 417,853 382,623Total pension liability – ending (a) $455,159 $448,104 $561,946 $543,150 $461,245 $417,853
Plan fiduciary net positionContributions – employer $10,649 $8,299 $8,080 $8,024 $7,702 $7,070Contributions – nonemployer 1,344 1,385 — — — —Contributions – active member (includes purchased service) 5,187 4,700 4,863 4,037 4,197 4,296Net investment income (loss) 61,719 (11,006) 51,173 19,783 4,149 15,299Benefit payments, refunds, and disability premiums (28,097) (26,463) (25,298) (22,888) (21,200) (19,903)
Administrative expense (84) (86) (86) (81) (77) (72)Other additions and deductions 6,670 155 2,226 2,678 3,081 156Net change in plan fiduciary net position 57,388 (23,016) 40,958 11,553 (2,148) 6,846
Plan fiduciary net position – beginning 306,846 329,862 288,904 277,351 279,499 272,653Plan fiduciary net position – ending (b) $364,234 $306,846 $329,862 $288,904 $277,351 $279,499
Net pension liability – ending (a)-(b) $90,925 $141,258 $232,084 $254,246 $183,894 $138,354 1 Information is not available prior to 2014. In future reports, additional years will be added until 10 years of historical data are presented. The accompanying notes are an integral part of the Required Supplementary Information.
Financial Section
REQUIRED SUPPLEMENTARY INFORMATION (UNAUDITED)—DIVISION TRUST FUNDS(Dollars in Thousands)
Colorado PERA Comprehensive Annual Financial Report 2019 � Financial Section 91
Final D
raft
June
12,
202
0

SCHEDULE OF CHANGES IN NET PENSION LIABILITY—DPS DIVISION1
For the Years Ended December 31
2019 2018 2017 2016 2015 2014Total pension liabilityService cost $91,764 $90,657 $91,986 $85,988 $82,079 $76,564Interest 301,210 313,294 295,838 283,862 281,752 274,862Changes of benefit terms (82,064) (318,480) — — — —Difference between expected and actual experience 86,001 35,147 47,121 (2,839) 45,767 (174)
Changes of assumptions or other inputs — — — 205,645 (113,772) —Benefit payments, refunds, and disability premiums (288,984) (287,825) (281,844) (272,071) (263,323) (255,434)
Net change in total pension liability 107,927 (167,207) 153,101 300,585 32,503 95,818
Total pension liability – beginning 4,207,343 4,374,550 4,221,449 3,920,864 3,888,361 3,792,543Total pension liability – ending (a) $4,315,270 $4,207,343 $4,374,550 $4,221,449 $3,920,864 $3,888,361
Plan fiduciary net positionContributions – employer $43,340 $35,994 $27,578 $17,071 $8,494 $18,478Contributions – nonemployer 19,201 18,621 — — — —Contributions – active member (includes purchased service) 65,496 61,098 56,820 54,852 53,558 49,409Net investment income (loss) 632,669 (114,070) 548,585 218,415 49,172 182,823Benefit payments, refunds, and disability premiums (288,984) (287,825) (281,844) (272,071) (263,323) (255,434)
Administrative expense (2,713) (2,919) (2,857) (2,754) (2,599) (2,377)Other additions and deductions 2,975 (4,497) 3,781 3,135 (1,764) (1,547)Net change in plan fiduciary net position 471,984 (293,598) 352,063 18,648 (156,462) (8,648)
Plan fiduciary net position – beginning 3,184,442 3,478,040 3,125,977 3,107,329 3,263,791 3,272,439Plan fiduciary net position – ending (b) $3,656,426 $3,184,442 $3,478,040 $3,125,977 $3,107,329 $3,263,791
Net pension liability – ending (a)-(b) $658,844 $1,022,901 $896,510 $1,095,472 $813,535 $624,570 1 Information is not available prior to 2014. In future reports, additional years will be added until 10 years of historical data are presented. The accompanying notes are an integral part of the Required Supplementary Information.
Financial Section
REQUIRED SUPPLEMENTARY INFORMATION (UNAUDITED)—DIVISION TRUST FUNDS(Dollars in Thousands)
92 Financial Section � Colorado PERA Comprehensive Annual Financial Report 2019
Final D
raft
June
12,
202
0
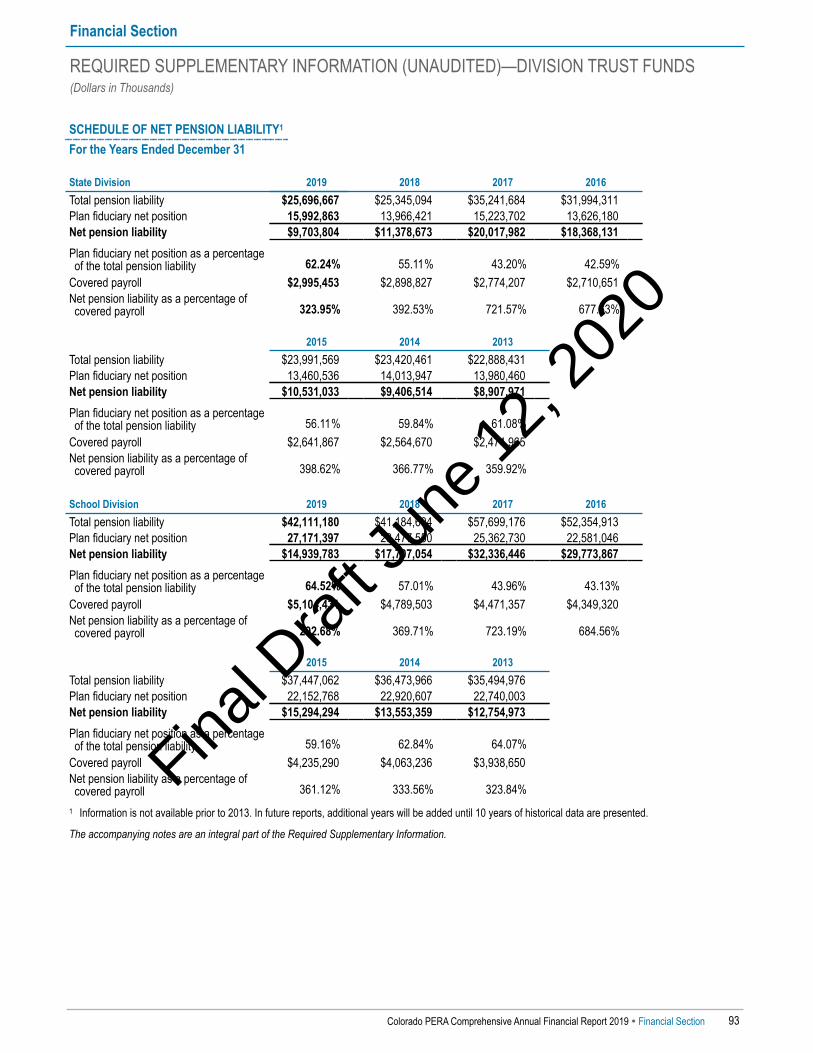
SCHEDULE OF NET PENSION LIABILITY1
For the Years Ended December 31
State Division 2019 2018 2017 2016Total pension liability $25,696,667 $25,345,094 $35,241,684 $31,994,311Plan fiduciary net position 15,992,863 13,966,421 15,223,702 13,626,180Net pension liability $9,703,804 $11,378,673 $20,017,982 $18,368,131Plan fiduciary net position as a percentageof the total pension liability 62.24% 55.11% 43.20% 42.59%
Covered payroll $2,995,453 $2,898,827 $2,774,207 $2,710,651Net pension liability as a percentage ofcovered payroll 323.95% 392.53% 721.57% 677.63%
2015 2014 2013Total pension liability $23,991,569 $23,420,461 $22,888,431Plan fiduciary net position 13,460,536 14,013,947 13,980,460Net pension liability $10,531,033 $9,406,514 $8,907,971Plan fiduciary net position as a percentageof the total pension liability 56.11% 59.84% 61.08%
Covered payroll $2,641,867 $2,564,670 $2,474,965Net pension liability as a percentage ofcovered payroll 398.62% 366.77% 359.92%
School Division 2019 2018 2017 2016Total pension liability $42,111,180 $41,184,604 $57,699,176 $52,354,913Plan fiduciary net position 27,171,397 23,477,550 25,362,730 22,581,046Net pension liability $14,939,783 $17,707,054 $32,336,446 $29,773,867Plan fiduciary net position as a percentageof the total pension liability 64.52% 57.01% 43.96% 43.13%
Covered payroll $5,104,431 $4,789,503 $4,471,357 $4,349,320Net pension liability as a percentage ofcovered payroll 292.68% 369.71% 723.19% 684.56%
2015 2014 2013Total pension liability $37,447,062 $36,473,966 $35,494,976Plan fiduciary net position 22,152,768 22,920,607 22,740,003Net pension liability $15,294,294 $13,553,359 $12,754,973Plan fiduciary net position as a percentageof the total pension liability 59.16% 62.84% 64.07%
Covered payroll $4,235,290 $4,063,236 $3,938,650Net pension liability as a percentage ofcovered payroll 361.12% 333.56% 323.84%
1 Information is not available prior to 2013. In future reports, additional years will be added until 10 years of historical data are presented.
The accompanying notes are an integral part of the Required Supplementary Information.
Financial Section
REQUIRED SUPPLEMENTARY INFORMATION (UNAUDITED)—DIVISION TRUST FUNDS(Dollars in Thousands)
Colorado PERA Comprehensive Annual Financial Report 2019 � Financial Section 93
Final D
raft
June
12,
202
0

SCHEDULE OF NET PENSION LIABILITY1 (CONTINUED)For the Years Ended December 31
Local Government Division 2019 2018 2017 2016Total pension liability $5,324,353 $5,228,602 $5,396,516 $5,123,847Plan fiduciary net position 4,592,962 3,971,389 4,283,086 3,773,506Net pension liability $731,391 $1,257,213 $1,113,430 $1,350,341Plan fiduciary net position as a percentageof the total pension liability 86.26% 75.96% 79.37% 73.65%
Covered payroll $681,093 $660,998 $632,768 $608,223Net pension liability as a percentage ofcovered payroll 107.38% 190.20% 175.96% 222.01%
2015 2014 2013Total pension liability $4,762,090 $4,647,777 $4,517,239Plan fiduciary net position 3,660,509 3,751,468 3,508,312Net pension liability $1,101,581 $896,309 $1,008,927Plan fiduciary net position as a percentageof the total pension liability 76.87% 80.72% 77.66%
Covered payroll $561,518 $540,468 $529,003Net pension liability as a percentage ofcovered payroll 196.18% 165.84% 190.72%
Judicial Division 2019 2018 2017 2016Total pension liability $455,159 $448,104 $561,946 $543,150Plan fiduciary net position 364,234 306,846 329,862 288,904Net pension liability $90,925 $141,258 $232,084 $254,246Plan fiduciary net position as a percentageof the total pension liability 80.02% 68.48% 58.70% 53.19%
Covered payroll $53,427 $50,506 $48,948 $48,700Net pension liability as a percentage ofcovered payroll 170.19% 279.69% 474.14% 522.07%
2015 2014 2013Total pension liability $461,245 $417,853 $382,623Plan fiduciary net position 277,351 279,499 272,653Net pension liability $183,894 $138,354 $109,970Plan fiduciary net position as a percentageof the total pension liability 60.13% 66.89% 71.26%
Covered payroll $46,870 $42,977 $39,942Net pension liability as a percentage ofcovered payroll 392.35% 321.93% 275.32%
1 Information is not available prior to 2013. In future reports, additional years will be added until 10 years of historical data are presented.
The accompanying notes are an integral part of the Required Supplementary Information.
Financial Section
REQUIRED SUPPLEMENTARY INFORMATION (UNAUDITED)—DIVISION TRUST FUNDS(Dollars in Thousands)
94 Financial Section � Colorado PERA Comprehensive Annual Financial Report 2019
Final D
raft
June
12,
202
0

1 Information is not available prior to 2013. In future reports, additional years will be added until 10 years of historical data are presented. The accompanying notes are an integral part of the Required Supplementary Information.
SCHEDULE OF NET PENSION LIABILITY1 (CONTINUED)For the Years Ended December 31
DPS Division 2019 2018 2017 2016Total pension liability $4,315,270 $4,207,343 $4,374,550 $4,221,449Plan fiduciary net position 3,656,426 3,184,442 3,478,040 3,125,977Net pension liability $658,844 $1,022,901 $896,510 $1,095,472Plan fiduciary net position as a percentageof the total pension liability 84.73% 75.69% 79.51% 74.05%
Covered payroll $736,264 $722,040 $658,198 $642,177Net pension liability as a percentage ofcovered payroll 89.48% 141.67% 136.21% 170.59%
2015 2014 2013Total pension liability $3,920,864 $3,888,361 $3,792,543Plan fiduciary net position 3,107,329 3,263,791 3,272,439Net pension liability $813,535 $624,570 $520,104Plan fiduciary net position as a percentageof the total pension liability 79.25% 83.94% 86.29%
Covered payroll $621,115 $584,319 $547,660Net pension liability as a percentage ofcovered payroll 130.98% 106.89% 94.97%
Financial Section
REQUIRED SUPPLEMENTARY INFORMATION (UNAUDITED)—DIVISION TRUST FUNDS(Dollars in Thousands)
Colorado PERA Comprehensive Annual Financial Report 2019 � Financial Section 95
Final D
raft
June
12,
202
0
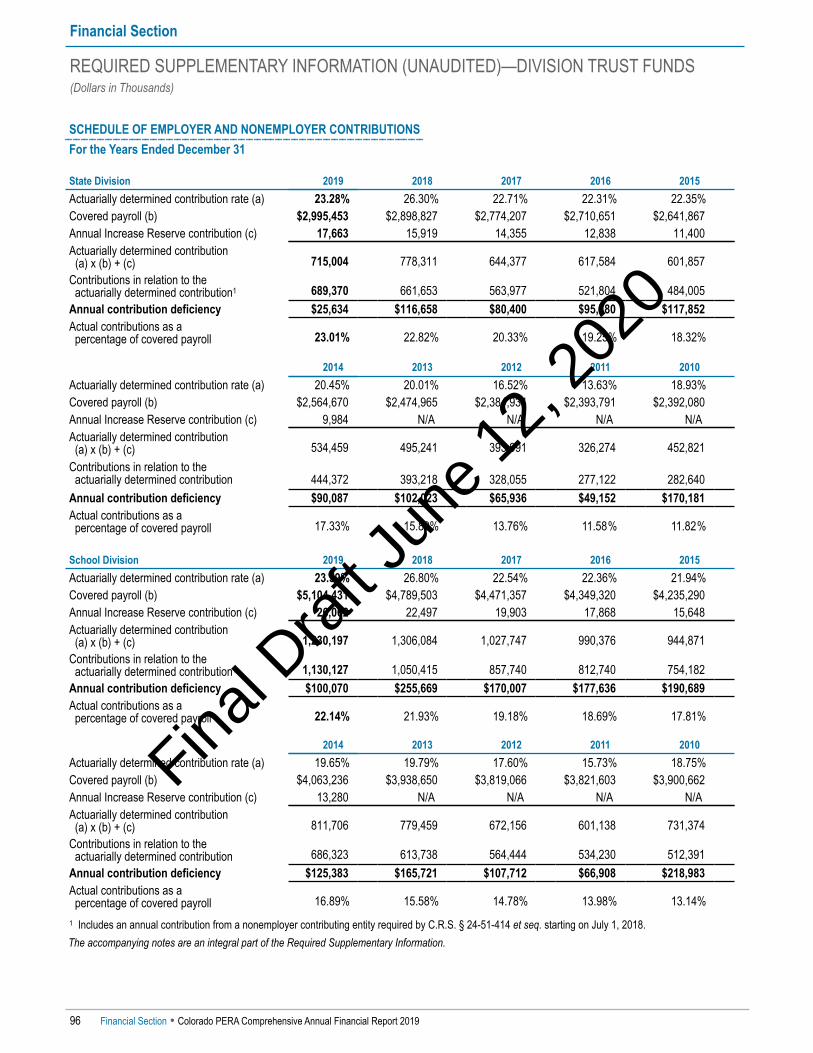
SCHEDULE OF EMPLOYER AND NONEMPLOYER CONTRIBUTIONSFor the Years Ended December 31
State Division 2019 2018 2017 2016 2015Actuarially determined contribution rate (a) 23.28% 26.30% 22.71% 22.31% 22.35%Covered payroll (b) $2,995,453 $2,898,827 $2,774,207 $2,710,651 $2,641,867Annual Increase Reserve contribution (c) 17,663 15,919 14,355 12,838 11,400Actuarially determined contribution
(a) x (b) + (c) 715,004 778,311 644,377 617,584 601,857Contributions in relation to the actuarially determined contribution1 689,370 661,653 563,977 521,804 484,005Annual contribution deficiency $25,634 $116,658 $80,400 $95,780 $117,852Actual contributions as a percentage of covered payroll 23.01% 22.82% 20.33% 19.25% 18.32%
2014 2013 2012 2011 2010Actuarially determined contribution rate (a) 20.45% 20.01% 16.52% 13.63% 18.93%Covered payroll (b) $2,564,670 $2,474,965 $2,384,934 $2,393,791 $2,392,080Annual Increase Reserve contribution (c) 9,984 N/A N/A N/A N/AActuarially determined contribution (a) x (b) + (c) 534,459 495,241 393,991 326,274 452,821Contributions in relation to the actuarially determined contribution 444,372 393,218 328,055 277,122 282,640Annual contribution deficiency $90,087 $102,023 $65,936 $49,152 $170,181Actual contributions as a percentage of covered payroll 17.33% 15.89% 13.76% 11.58% 11.82%
School Division 2019 2018 2017 2016 2015Actuarially determined contribution rate (a) 23.59% 26.80% 22.54% 22.36% 21.94%Covered payroll (b) $5,104,431 $4,789,503 $4,471,357 $4,349,320 $4,235,290Annual Increase Reserve contribution (c) 26,062 22,497 19,903 17,868 15,648Actuarially determined contribution (a) x (b) + (c) 1,230,197 1,306,084 1,027,747 990,376 944,871Contributions in relation to the actuarially determined contribution1 1,130,127 1,050,415 857,740 812,740 754,182Annual contribution deficiency $100,070 $255,669 $170,007 $177,636 $190,689Actual contributions as a percentage of covered payroll 22.14% 21.93% 19.18% 18.69% 17.81%
2014 2013 2012 2011 2010Actuarially determined contribution rate (a) 19.65% 19.79% 17.60% 15.73% 18.75%Covered payroll (b) $4,063,236 $3,938,650 $3,819,066 $3,821,603 $3,900,662Annual Increase Reserve contribution (c) 13,280 N/A N/A N/A N/AActuarially determined contribution (a) x (b) + (c) 811,706 779,459 672,156 601,138 731,374Contributions in relation to the actuarially determined contribution 686,323 613,738 564,444 534,230 512,391Annual contribution deficiency $125,383 $165,721 $107,712 $66,908 $218,983Actual contributions as a percentage of covered payroll 16.89% 15.58% 14.78% 13.98% 13.14%
1 Includes an annual contribution from a nonemployer contributing entity required by C.R.S. § 24-51-414 et seq. starting on July 1, 2018. The accompanying notes are an integral part of the Required Supplementary Information.
Financial Section
REQUIRED SUPPLEMENTARY INFORMATION (UNAUDITED)—DIVISION TRUST FUNDS(Dollars in Thousands)
96 Financial Section � Colorado PERA Comprehensive Annual Financial Report 2019
Final D
raft
June
12,
202
0

SCHEDULE OF EMPLOYER AND NONEMPLOYER CONTRIBUTIONS (CONTINUED)For the Years Ended December 31
Local Government Division 2019 2018 2017 2016 2015Actuarially determined contribution rate (a) 11.13% 14.27% 11.92% 11.98% 13.62%Covered payroll (b) $681,093 $660,998 $632,768 $608,223 $561,518Annual Increase Reserve contribution (c) 4,201 3,779 3,390 2,969 2,522Actuarially determined contribution (a) x (b) + (c) 80,007 98,103 78,816 75,834 79,001Contributions in relation to the actuarially determined contribution 85,597 81,358 78,291¹ 75,132 70,415Annual contribution deficiency (excess) ($5,590) $16,745 $525 $702 $8,586Actual contributions as a percentage of covered payroll 12.57% 12.31% 12.37% 12.35% 12.54%
2014 2013 2012 2011 2010Actuarially determined contribution rate (a) 11.78% 10.62% 9.79% 8.98% 12.31%Covered payroll (b) $540,468 $529,003 $523,668 $718,169 $705,265Annual Increase Reserve contribution (c) 2,180 N/A N/A N/A N/AActuarially determined contribution (a) x (b) + (c) 65,847 56,180 51,267 64,492 86,818Contributions in relation to the actuarially determined contribution 68,719² 65,329 83,816 89,536 87,731Annual contribution deficiency (excess) ($2,872) ($9,149) ($32,549) ($25,044) ($913)Actual contributions as a percentage of covered payroll 12.71% 12.35% 16.01% 12.47% 12.44%
Judicial Division 2019 2018 2017 2016 2015Actuarially determined contribution rate (a) 21.90% 27.26% 22.54% 22.07% 21.45%Covered payroll (b) $53,427 $50,506 $48,948 $48,700 $46,870Annual Increase Reserve contribution (c) 251 207 191 164 141Actuarially determined contribution (a) x (b) + (c) 11,952 13,975 11,224 10,912 10,195Contributions in relation to the actuarially determined contribution3 11,993 9,684 8,080 8,024 7,702Annual contribution deficiency (excess) ($41) $4,291 $3,144 $2,888 $2,493Actual contributions as a percentage of covered payroll 22.45% 19.17% 16.51% 16.48% 16.43%
2014 2013 2012 2011 2010Actuarially determined contribution rate (a) 20.07% 21.53% 18.28% 16.30% 18.63%Covered payroll (b) $42,977 $39,942 $39,045 $39,033 $37,412Annual Increase Reserve contribution (c) 116 N/A N/A N/A N/AActuarially determined contribution (a) x (b) + (c) 8,741 8,599 7,137 6,362 6,970Contributions in relation to the actuarially determined contribution 7,070 6,494 5,840 5,356 5,605Annual contribution deficiency $1,671 $2,105 $1,297 $1,006 $1,365Actual contributions as a percentage of covered payroll 16.45% 16.26% 14.96% 13.72% 14.98%
1 Contributions do not include the disaffiliation payment of $1,063 for Cunningham Fire Protection District. 2 Contributions do not include the disaffiliation payment of $186,006 for Memorial Health System. 3 Includes an annual contribution from a nonemployer contributing entity required by C.R.S. § 24-51-414 et seq. starting on July 1, 2018. The accompanying notes are an integral part of the Required Supplementary Information.
Financial Section
REQUIRED SUPPLEMENTARY INFORMATION (UNAUDITED)—DIVISION TRUST FUNDS(Dollars in Thousands)
Colorado PERA Comprehensive Annual Financial Report 2019 � Financial Section 97
Final D
raft
June
12,
202
0

SCHEDULE OF EMPLOYER AND NONEMPLOYER CONTRIBUTIONS (CONTINUED)For the Years Ended December 31
DPS Division 2019 2018 2017 2016 2015Actuarially determined contribution rate (a) 11.14% 13.50% 10.28% 10.46% 11.06%Covered payroll (b) $736,264 $722,040 $658,198 $642,177 $621,115Annual Increase Reserve contribution (c) 4,989 4,624 4,100 3,685 3,186Actuarially determined contribution (a) x (b) + (c) 87,009 102,099 71,763 70,857 71,881Contributions in relation to the actuarially determined contribution1 62,541 54,615 27,578 17,071 8,494Annual contribution deficiency $24,468 $47,484 $44,185 $53,786 $63,387Actual contributions as a percentage of covered payroll 8.49% 7.56% 4.19% 2.66% 1.37%
2014 2013 2012 2011 2010Actuarially determined contribution rate (a) 9.67% 11.53% 9.60% 11.85% 14.61%Covered payroll (b) $584,319 $547,660 $510,872 $491,646 $470,774Annual Increase Reserve contribution (c) 2,633 N/A N/A N/A N/AActuarially determined contribution (a) x (b) + (c) 59,137 63,145 49,044 58,260 68,780Contributions in relation to the actuarially determined contribution 18,478 23,104 13,145 11,722 5,733Annual contribution deficiency $40,659 $40,041 $35,899 $46,538 $63,047Actual contributions as a percentage of covered payroll 3.16% 4.22% 2.57% 2.38% 1.22%
1 Includes an annual contribution from a nonemployer contributing entity required by C.R.S. § 24-51-414 et seq. starting on July 1, 2018. The accompanying notes are an integral part of the Required Supplementary Information.
Financial Section
REQUIRED SUPPLEMENTARY INFORMATION (UNAUDITED)—DIVISION TRUST FUNDS(Dollars in Thousands)
98 Financial Section � Colorado PERA Comprehensive Annual Financial Report 2019
SCHEDULE OF INVESTMENT RETURNS1
For the Years Ended December 31
2019 2018 2017 2016 2015 2014Annual money-weighted rate of return,net of investment expenses 20.4% (3.3%) 18.1% 7.3% 1.6% 5.8%
1 Information is not available prior to 2014. In future reports, additional years will be added until 10 years of historical data are presented. The accompanying notes are an integral part of the Required Supplementary Information.
Final D
raft
June
12,
202
0

Financial Section
NOTES TO THE REQUIRED SUPPLEMENTARY INFORMATION (UNAUDITED)—DIVISION TRUST FUNDS(Dollars in Thousands)
Colorado PERA Comprehensive Annual Financial Report 2019 � Financial Section 99
Note 1—Significant Changes in Plan ProvisionsAffecting Trends in Actuarial Information2019 Changes in Plan Provisions Since 2018• Senate Bill (SB) 18-200 was enacted on June 4, 2018,
which included the adoption of the automaticadjustment provision (AAP). The following changesreflect the anticipated adjustments resulting from the2018 AAP assessment, statutorily recognizedJuly 1, 2019, and effective July 1, 2020:
▪ Member contribution rates increase by 0.50 percent.
▪ Employer contribution rates increase by 0.50 percent.
▪ Annual Increase (AI) cap is lowered from 1.50 percentper year to 1.25 percent per year.
• House Bill (HB) 19-1217, enacted May 20, 2019, repealedthe member contribution increases scheduled for theLocal Government Division pursuant to SB 18–200.
• Actual employer contributions to the DPS Division arereduced by an amount equal to the principal paymentsplus interest necessary each year to finance the pensioncertificates of participation (PCOPs) issued in 1997 and2008 and refinanced thereafter.
2018 Changes in Plan Provisions Since 2017• The following changes were made to the plan provisions
as part of SB 18-200:
▪ Member contribution rates increase by 0.75 percenteffective July 1, 2019, an additional 0.75 percenteffective July 1, 2020, and an additional 0.50 percenteffective July 1, 2021.
▪ Employer contribution rates increase by 0.25 percenteffective July 1, 2019 for State, School, Judicial, andDPS Divisions.
▪ An annual direct distribution of $225 million (actualdollars) from the State of Colorado, recognized as anonemployer contributing entity, is distributedbetween the State, School, Judicial, and DPS Divisionsproportionally based on payroll.
▪ AI cap is lowered from 2.00 percent per year to1.50 percent per year.
▪ Initial AI waiting period is extended from one yearafter retirement to three years after retirement.
▪ AI payments are suspended for 2018 and 2019.
▪ The number of years used in the Highest AverageSalary calculation for non-vested members as ofJanuary 1, 2020, increases from three to five years forthe State, School, Local Government, and DPSDivisions and increases from one to three years forthe Judicial Division.
• Actual employer contributions to the DPS Division arereduced by an amount equal to the principal paymentsplus interest necessary each year to finance the PCOPsissued in 1997 and 2008 and refinanced thereafter.
2017 Changes in Plan Provisions Since 2016• The Cunningham Fire Protection District (CFPD)
disaffiliated from the Local Government Divisionon December 2, 2017. For the purpose of theDecember 31, 2017, measurement date, liabilities weredetermined assuming no additional benefit accruals forthe disaffiliated membership of the CFPD that had notrefunded their PERA member contribution accounts.The total disaffiliation payment of $1,159 was allocatedto the Local Government Division Trust Fund and theHealth Care Trust Fund (HCTF) in the amount of $1,063and $96, respectively.
• Pursuant to HB 17-1265, the Amortization EqualizationDisbursement (AED) and Supplemental AmortizationEqualization Disbursement (SAED) contribution ratesare adjusted for employers in the Judicial Divisionas follows:
▪ For the calendar year beginning in 2019,C.R.S. § 24-51-411(4.5) increased the AED payment to3.40 percent of PERA-includable salary and requiresthe AED payment to increase by 0.40 percent at thestart of each of the following four calendar yearsthrough 2023 at which time the AED payment will be5.00 percent of PERA-includable salary.
▪ For the calendar year beginning in 2019,C.R.S. § 24-51-411(7.5) increased the SAED payment to3.40 percent of PERA-includable salary and requiresthe SAED payment to increase by 0.40 percent at thestart of each of the following four calendar yearsthrough 2023 at which time the SAED payment will be5.00 percent of PERA-includable salary.
• Actual employer contributions to the DPS Division arereduced by an amount equal to the principal paymentsplus interest necessary each year to finance the PCOPsissued in 1997 and 2008 and refinanced thereafter.
2016 Changes in Plan Provisions Since 2015• Actual employer contributions to the DPS Division are
reduced by an amount equal to the principal paymentsplus interest necessary each year to finance the PCOPsissued in 1997 and 2008 and refinanced thereafter.
2015 Changes in Plan Provisions Since 2014• Actual employer contributions to the DPS Division are
reduced by an amount equal to the principal paymentsplus interest necessary each year to finance the PCOPsissued in 1997 and 2008 and refinanced thereafter.
• As required under C.R.S. § 24-51-401(1.7)(e), PERAcalculated and provided to the Colorado General
Final D
raft
June
12,
202
0
Assembly an adjustment to the DPS Division’s employercontribution rate to assure the equalization of the SchoolDivision’s and the DPS Division’s ratios of unfundedactuarial accrued liability (UAAL) to payroll as ofDecember 31, 2039. Subsequently, the Colorado GeneralAssembly passed HB 15-1391, reducing the employercontribution rate of the DPS Division from 13.75 percentto 10.15 percent, effective January 1, 2015.
2014 Changes in Plan Provisions Since 2013• Actual employer contributions to the DPS Division are
reduced by an amount equal to the principal paymentsplus interest necessary each year to finance the PCOPsissued in 1997 and 2008 and refinanced thereafter.
2013 Changes in Plan Provisions Since 2012• Actual employer contributions to the DPS Division are
reduced by an amount equal to the principal paymentsplus interest necessary each year to finance the PCOPsissued in 1997 and 2008 and refinanced thereafter.
2012 Changes in Plan Provisions Since 2011• The valuation reflects the disaffiliation of Memorial
Health System (Memorial), formerly the largestemployer of the Local Government Division, as ofOctober 1, 2012. For the purposes of theDecember 31, 2012, actuarial valuation, liabilities weredetermined assuming no additional benefit accruals forthe disaffiliated membership of Memorial that had notrefunded their PERA member contribution accounts.Additionally, no additional incoming dollars wereassumed added to the Local Government Division TrustFund, as there was ongoing litigation regarding thepotential dollars owed to the Local GovernmentDivision Trust Fund due to the disaffiliation.
• Pursuant to SB 11-076, there was a short-termcontribution “swap” between employers and activemembers in the State and Judicial Divisions covering theperiod July 1, 2011, through June 30, 2012. Activemember contributions for the period were increased by2.5 percent of pensionable payroll and employercontributions were reduced by that amount.
• Actual employer contributions to the DPS Division arereduced by an amount equal to the principal paymentsplus interest necessary each year to finance the PCOPsissued in 1997 and 2008 and refinanced thereafter.
2011 Changes in Plan Provisions Since 2010• Pursuant to SB 10-146, there was a short-term
contribution ”swap” between employers and activemembers in the State and Judicial Divisions covering theperiod July 1, 2010, through June 30, 2011. Theenactment of SB 11-076 extended the contribution swapan additional year, from July 1, 2011, throughJune 30, 2012. Active member contributions for bothperiods were increased by 2.5 percent of pensionable
payroll and employer contributions were reduced bythat amount.
• Actual employer contributions to the DPS Division arereduced by an amount equal to the principal paymentsplus interest necessary each year to finance the PCOPsissued in 1997 and 2008 and refinanced thereafter.
2010 Changes in Plan Provisions Since 2009• The valuation reflects the addition of the DPS benefit
structure as a result of the merger of DPSRS into PERAas a separate division, effective January 1, 2010. Majorplan provisions adopted as part of the merger legislation(SB 09-282) include:
▪ Transfers from the DPS Division to other Divisionsmay build upon a DPS benefit structure benefit withinthose Divisions.
▪ Hourly and part-time employees of Denver PublicSchools become members of the DPS Division as ofJanuary 1, 2010, with no past service credit.
▪ Actual employer contributions to the DPS Division arereduced by an amount equal to the principalpayments plus interest necessary each year to financethe PCOPs issued in 1997 and 2008. Colorado statutescall for a ”true-up” in 2015, and every five yearsfollowing, with the expressed purpose of adjusting thetotal DPS contribution rate to ensure equalization ofthe ratio of UAAL over payroll between the DPS andSchool Divisions at the end of the 30-year periodbeginning January 1, 2010.
• Pursuant to SB 10-146, there was a short-termcontribution “swap” between employers and activemembers in the State and Judicial Divisions covering theperiod July 1, 2010, through June 30, 2011. Activemember contributions for this period were increased by2.5 percent of pensionable payroll and employercontributions were reduced by that amount.
Financial Section
NOTES TO THE REQUIRED SUPPLEMENTARY INFORMATION (UNAUDITED)—DIVISION TRUST FUNDS(Dollars in Thousands)
100 Financial Section � Colorado PERA Comprehensive Annual Financial Report 2019
Note 2—Significant Changes in Assumptions orOther Inputs Affecting Trends in ActuarialInformation2019 Changes in Assumptions or Other Inputs Since 2018• The assumption used to value the AI cap benefit
provision was changed from 1.50 percent to 1.25 percent.
2018 Changes in Assumptions or Other Inputs Since 2017• The single equivalent interest rate (SEIR) for the State
Division was increased from 4.72 percent to 7.25 percentto reflect the changes to the projection’s valuation basiswhich no longer resulted in a projected year of depletionof the fiduciary net position (FNP), thereby eliminatingthe need to apply the municipal bond index rate.
Final D
raft
June
12,
202
0

• The SEIR for the School Division was increased from4.78 percent to 7.25 percent to reflect the changes to theprojection’s valuation basis which no longer resulted ina projected year of depletion of the FNP, therebyeliminating the need to apply the municipal bondindex rate.
• The SEIR for the Judicial Division was increased from5.41 percent to 7.25 percent to reflect the changes to theprojection’s valuation basis which no longer resulted ina projected year of depletion of the FNP, therebyeliminating the need to apply the municipal bondindex rate.
2017 Changes in Assumptions or Other Inputs Since 2016• The SEIR for the State Division was lowered from
5.26 percent to 4.72 percent to reflect the changes to theprojection’s valuation basis, a projected year ofdepletion of the FNP, and the resulting application of themunicipal bond index rate.
• The SEIR for the School Division was lowered from5.26 percent to 4.78 percent to reflect the changes to theprojection’s valuation basis, a projected year ofdepletion of the FNP, and the resulting application of themunicipal bond index rate.
• The SEIR for the Judicial Division was increased from5.18 percent to 5.41 percent to reflect the changes to theprojection’s valuation basis, a projected year ofdepletion of the FNP, and the resulting application of themunicipal bond index rate.
• The municipal bond index rate used in thedetermination of the SEIR for the State, School, andJudicial Divisions changed from 3.86 percent on theprior measurement date to 3.43 percent on themeasurement date.
2016 Changes in Assumptions or Other Inputs Since 2015• The investment return assumption was lowered from
7.50 percent to 7.25 percent.
• The price inflation assumption was lowered from2.80 percent to 2.40 percent.
• The wage inflation assumption was lowered from3.90 percent to 3.50 percent.
• The post-retirement mortality assumption for healthylives for the State and Local Government Divisions waschanged to the RP-2014 Healthy Annuitant MortalityTable with adjustments for credibility and genderadjustments of a 73 percent factor applied to agesbelow 80 and a 108 percent factor applied to age 80and above, projected to 2018, for males, and a 78 percentfactor applied to ages below 80 and a 109 percentfactor applied to age 80 and above, projected to 2020,for females.
• The post-retirement mortality assumption for healthylives for the School, Judicial, and DPS Divisions waschanged to the RP-2014 White Collar Healthy AnnuitantMortality Table with adjustments for credibility andgender adjustments of a 93 percent factor applied toages below 80 and a 113 percent factor applied to age 80and above, projected to 2018, for males, and a 68 percentfactor applied to ages below 80 and a 106 percentfactor applied to age 80 and above, projected to 2020,for females.
• For disabled retirees, the mortality assumption waschanged to reflect 90 percent of RP-2014 DisabledRetiree Mortality Table.
• The mortality assumption for active members waschanged to RP-2014 White Collar Employee MortalityTable, a table specifically developed for actively workingpeople. To allow for an appropriate margin of improvedmortality prospectively, the mortality rates incorporate a70 percent factor applied to male rates and a 55 percentfactor applied to female rates.
• The rates of retirement, withdrawal, and disability wererevised to reflect more closely actual experience.
• The estimated administrative expense as a percentage ofcovered payroll was increased from 0.35 percent to0.40 percent.
• The SEIR for the State and School Divisions was loweredfrom 7.50 percent to 5.26 percent to reflect the changes tothe projection’s valuation basis, a projected year ofdepletion of the FNP, and the resulting application of themunicipal bond index rate of 3.86 percent on themeasurement date.
• The SEIR for the Local Government Division waslowered from 7.50 percent to 7.25 percent, reflecting thechange in the long-term expected rate of return.
• The SEIR for the Judicial Division was lowered from5.73 percent to 5.18 percent to reflect the changes to theprojection’s valuation basis, a projected year ofdepletion of the FNP, and the resulting application of themunicipal bond index rate from 3.57 percent on theprior measurement date to 3.86 percent on themeasurement date.
• The SEIR for the DPS Division was lowered from7.50 percent to 7.25 percent, reflecting the change in thelong-term expected rate of return.
2015 Changes in Assumptions or Other Inputs Since 2014• The SEIR for the Judicial Division was lowered from
6.14 percent to 5.73 percent to reflect the changes to theprojection’s valuation basis, a projected year ofdepletion of the FNP, and the resulting application of themunicipal bond index rate from 3.70 percent on the
Financial Section
NOTES TO THE REQUIRED SUPPLEMENTARY INFORMATION (UNAUDITED)—DIVISION TRUST FUNDS(Dollars in Thousands)
Colorado PERA Comprehensive Annual Financial Report 2019 � Financial Section 101
Final D
raft
June
12,
202
0
prior measurement date to 3.57 percent on themeasurement date.
• The following programming changes were made:
▪ Valuation of the full survivor benefit without anyreduction for possible remarriage.
▪ Reflection of the employer match on separationbenefits for all eligible years.
▪ Reflection of one year of service eligibility for survivorannuity benefit.
▪ Refinement of the 18-month AI timing.
▪ Refinements to directly value certain and life,modified cash refund and pop-up benefit forms.
• The following methodology changes were made:
▪ Recognition of merit salary increases in the firstprojection year.
▪ Elimination of the assumption that 35 percent offuture disabled members elect to receive a refund.
▪ Removal of the negative value adjustment forliabilities associated with refunds of futureterminating members.
▪ Adjustments to the timing of the normal cost andUAAL payment calculations to reflect contributionsthroughout the year.
2014 Changes in Assumptions or Other Inputs Since 2013• The SEIR for the Judicial Division was lowered from
6.66 percent to 6.14 percent to reflect the changes to theprojection’s valuation basis, a projected year ofdepletion of the FNP, and the resulting application of themunicipal bond index rate from 4.73 percent on theprior measurement date to 3.70 percent on themeasurement date.
• In 2012, a lawsuit was initiated to determine the amountowed to PERA by Memorial and the City of ColoradoSprings (City) for Memorial’s departure from PERA. InSeptember 2014, PERA and the City agreed to resolvethe lawsuit. The agreement provided for the City to payPERA $190,000 for the liabilities associated with theretirement and health care benefits already earned by7,666 Memorial employees for the work that theyperformed before Memorial ceased to be a PERAemployer. On October 3, 2014, PERA received adisaffiliation payment from the City, which wasallocated to the Local Government Division TrustFund and the HCTF in the amount of $186,006 and$3,994, respectively.
2013 Changes in Assumptions or Other Inputs Since 2012• The investment return assumption was lowered from
8.00 percent to 7.50 percent.
• The price inflation assumption was lowered from3.50 percent to 2.80 percent.
• The wage inflation assumption was lowered from4.25 percent to 3.90 percent.
2012 Changes in Assumptions or Other Inputs Since 2011• The price inflation assumption was lowered from
3.75 percent to 3.50 percent.
• The wage inflation assumption was lowered from4.50 percent to 4.25 percent.
• The rates of retirement, withdrawal, mortality anddisability were revised to more closely reflectactual experience.
• The post-retirement mortality tables used were changedto the RP-2000 Combined Mortality tables projectedwith Scale AA to 2020, set back one year for males andtwo years for females.
• The investment return assumption was changed to beonly net of investment expenses to better representthe investment consultant’s assumptions andpredictions and also to better align with recent changesin GASB accounting and reporting requirements. Anongoing estimated administrative expense of0.35 percent of pensionable payroll was added to thenormal cost beginning with the December 31, 2012,actuarial valuation.
• To reflect the short-term contribution “swap” betweenemployers and active members covering the periodJuly 1, 2010, through June 30, 2012, the actuariallydetermined contribution (ADC) has been adjusted in theState and Judicial Divisions.
2011 Changes in Assumptions or Other Inputs Since 2010• To reflect the short-term contribution ”swap” between
employers and active members covering the periodJuly 1, 2010, through June 30, 2012, the ADC has beenadjusted in the State and Judicial Division.
2010 Changes in Assumptions or Other Inputs Since 2009• Assumptions were supplemented to provide for the
valuation of the DPS benefit structure added as a resultof the merger of DPSRS into PERA as a separatedivision, effective January 1, 2010.
• To reflect the short-term contribution ”swap” betweenemployers and active members covering the periodJuly 1, 2010, through June 30, 2012, the ADC has beenadjusted in the State and Judicial Division.
Financial Section
NOTES TO THE REQUIRED SUPPLEMENTARY INFORMATION (UNAUDITED)—DIVISION TRUST FUNDS(Dollars in Thousands)
102 Financial Section � Colorado PERA Comprehensive Annual Financial Report 2019
Final D
raft
June
12,
202
0
Note 3—Methods and Assumptions Used inCalculations of ADC The ADC rates, as a percentage of covered payroll, used todetermine the ADC amounts in the Schedule of Employerand Nonemployer Contributions are calculated as ofDecember 31, two years prior to the end of the year inwhich ADC amounts are reported. The following actuarialmethods and assumptions from the December 31, 2017,actuarial valuation were used to determine contributionrates reported in that schedule for the year endingDecember 31, 2019:
Actuarial cost method Entry ageAmortization method Level percentage of payrollAmortization period 30 years, closed, layered1
Equivalent single amortization period28 years (26 years for State Division)
Asset valuation method 4-year smoothed marketPrice inflation 2.40 percentReal wage growth 1.10 percentWage inflation 3.50 percentSalary increases, including wage inflation 3.50 to 10.45 percent2
Long-term investment rate of return,net of pension plan investmentexpense, including price inflation 7.25 percent
Future post-retirement benefit increasesPERA benefit structure hired prior to
1/1/07 and DPS benefit structure1.50 percent compoundedannually
PERA benefit structure hired after 12/31/06
0.00 percent, as financed bythe AIR
1 Effective with the December 31, 2014, actuarial valuation, gains and lossesare to be amortized over a closed period.
2 Salary increases range by Division Trust Fund.
Financial Section
NOTES TO THE REQUIRED SUPPLEMENTARY INFORMATION (UNAUDITED)—DIVISION TRUST FUNDS(Dollars in Thousands)
Colorado PERA Comprehensive Annual Financial Report 2019 � Financial Section 103
Final D
raft
June
12,
202
0

Financial Section
REQUIRED SUPPLEMENTARY INFORMATION (UNAUDITED)—HEALTH CARE TRUST FUNDS(Dollars in Thousands)
104 Financial Section � Colorado PERA Comprehensive Annual Financial Report 2019
SCHEDULE OF CHANGES IN NET OPEB LIABILITY—HEALTH CARE TRUST FUND1
For the Years Ended December 31
2019 2018 2017Total OPEB liabilityService cost $18,159 $19,328 $20,036Interest 117,840 112,849 108,625Changes of benefit terms — — 5Difference between expected and actual experience (224,212) (2,482) 7,354
Changes of assumptions or other inputs 2,006 11,438 —Benefit payments and health care claims/ administrative processing fees (65,019) (77,221) (116,960)Net change in total OPEB liability (151,226) 63,912 19,060
Total OPEB liability – beginning 1,639,734 1,575,822 1,556,762Total OPEB liability – ending (a) $1,488,508 $1,639,734 $1,575,822
Plan fiduciary net positionContributions – employer $92,011 $86,559 $83,077Contributions – employer disaffiliation — — 96Other additions (includes purchased service transfers) 6,984 8,373 9,760Net investment income (loss) 53,867 (9,678) 44,990Benefit payments (58,221) (61,777) (102,665)Administrative expense (9,290) (20,401) (19,162)Other deductions (33) (106) (102)Net change in plan fiduciary net position 85,318 2,970 15,994
Plan fiduciary net position – beginning 279,192 276,222 260,228Plan fiduciary net position – ending (b) $364,510 $279,192 $276,222
Net OPEB liability – ending (a)-(b) $1,123,998 $1,360,542 $1,299,600 1 Information is not available prior to 2017. In future reports, additional years will be added until 10 years of historical data are presented. The accompanying notes are an integral part of the Required Supplementary Information.
Final D
raft
June
12,
202
0

SCHEDULE OF CHANGES IN NET OPEB LIABILITY—DPS HEALTH CARE TRUST FUND1
For the Years Ended December 31
2019 2018 2017Total OPEB liabilityService cost $1,342 $1,420 $1,591Interest 4,970 5,245 5,057Changes of benefit terms — — —Difference between expected and actual experience (2,070) (6,045) (35)
Changes of assumptions or other inputs — 5 —Benefit payments and health care claims/ administrative processing fees (3,968) (4,693) (6,191)Net change in total OPEB liability 274 (4,068) 422
Total OPEB liability – beginning 69,199 73,267 72,845Total OPEB liability – ending (a) $69,473 $69,199 $73,267
Plan fiduciary net positionContributions – employer $7,649 $7,417 $6,930Other additions (includes purchased service transfers) 188 205 242Net investment income (loss) 4,892 (894) 3,305Benefit payments (3,644) (4,158) (5,694)Administrative expense (477) (845) (808)Other deductions (1) (4) (4)Net change in plan fiduciary net position 8,607 1,721 3,971
Plan fiduciary net position – beginning 24,029 22,308 18,337Plan fiduciary net position – ending (b) $32,636 $24,029 $22,308
Net OPEB liability – ending (a)-(b) $36,837 $45,170 $50,959 1 Information is not available prior to 2017. In future reports, additional years will be added until 10 years of historical data are presented. The accompanying notes are an integral part of the Required Supplementary Information.
Financial Section
REQUIRED SUPPLEMENTARY INFORMATION (UNAUDITED)—HEALTH CARE TRUST FUNDS(Dollars in Thousands)
Colorado PERA Comprehensive Annual Financial Report 2019 � Financial Section 105
Final D
raft
June
12,
202
0

SCHEDULE OF NET OPEB LIABILITY1
For the Years Ended December 31
Health Care Trust Fund 2019 2018 2017 2016Total OPEB liability $1,488,508 $1,639,734 $1,575,822 $1,556,762Plan fiduciary net position 364,510 279,192 276,222 260,228Net OPEB liability $1,123,998 $1,360,542 $1,299,600 $1,296,534
Plan fiduciary net position as a percentageof the total OPEB liability 24.49% 17.03% 17.53% 16.72%
Covered payroll $8,834,404 $8,399,835 $7,927,280 $7,716,894Net OPEB liability as a percentage of covered payroll 12.72% 16.20% 16.39% 16.80%
DPS Health Care Trust Fund 2019 2018 2017 2016Total OPEB liability $69,473 $69,199 $73,267 $72,845Plan fiduciary net position 32,636 24,029 22,308 18,337Net OPEB liability $36,837 $45,170 $50,959 $54,508
Plan fiduciary net position as a percentageof the total OPEB liability 46.98% 34.72% 30.45% 25.17%
Covered payroll $736,264 $722,040 $658,198 $642,177Net OPEB liability as a percentage ofcovered payroll 5.00% 6.26% 7.74% 8.49%
1 Information is not available prior to 2016. In future reports, additional years will be added until 10 years of historical data are presented. The accompanying notes are an integral part of the Required Supplementary Information.
Financial Section
REQUIRED SUPPLEMENTARY INFORMATION (UNAUDITED)—HEALTH CARE TRUST FUNDS(Dollars in Thousands)
106 Financial Section � Colorado PERA Comprehensive Annual Financial Report 2019
Final D
raft
June
12,
202
0
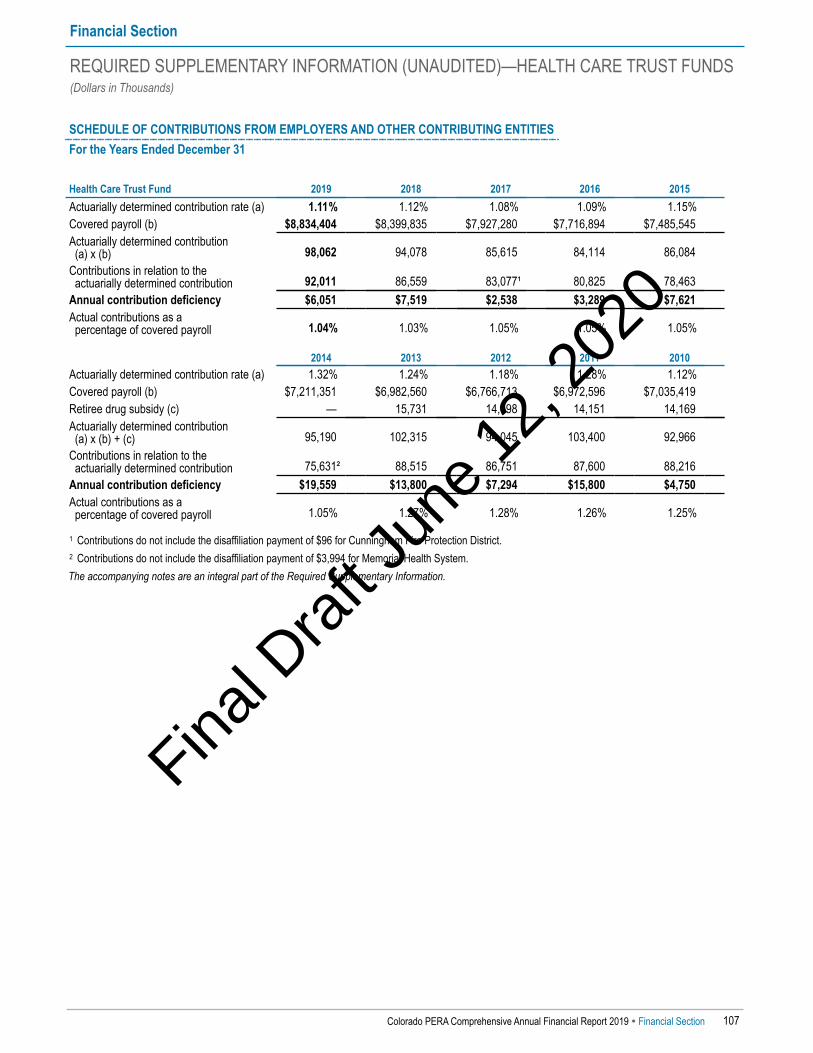
SCHEDULE OF CONTRIBUTIONS FROM EMPLOYERS AND OTHER CONTRIBUTING ENTITIESFor the Years Ended December 31
Health Care Trust Fund 2019 2018 2017 2016 2015Actuarially determined contribution rate (a) 1.11% 1.12% 1.08% 1.09% 1.15%Covered payroll (b) $8,834,404 $8,399,835 $7,927,280 $7,716,894 $7,485,545Actuarially determined contribution (a) x (b) 98,062 94,078 85,615 84,114 86,084Contributions in relation to the actuarially determined contribution 92,011 86,559 83,077¹ 80,825 78,463Annual contribution deficiency $6,051 $7,519 $2,538 $3,289 $7,621Actual contributions as a percentage of covered payroll 1.04% 1.03% 1.05% 1.05% 1.05%
2014 2013 2012 2011 2010Actuarially determined contribution rate (a) 1.32% 1.24% 1.18% 1.28% 1.12%Covered payroll (b) $7,211,351 $6,982,560 $6,766,713 $6,972,596 $7,035,419Retiree drug subsidy (c) — 15,731 14,198 14,151 14,169Actuarially determined contribution (a) x (b) + (c) 95,190 102,315 94,045 103,400 92,966Contributions in relation to the actuarially determined contribution 75,631² 88,515 86,751 87,600 88,216Annual contribution deficiency $19,559 $13,800 $7,294 $15,800 $4,750Actual contributions as a percentage of covered payroll 1.05% 1.27% 1.28% 1.26% 1.25%
1 Contributions do not include the disaffiliation payment of $96 for Cunningham Fire Protection District. 2 Contributions do not include the disaffiliation payment of $3,994 for Memorial Health System. The accompanying notes are an integral part of the Required Supplementary Information.
Financial Section
REQUIRED SUPPLEMENTARY INFORMATION (UNAUDITED)—HEALTH CARE TRUST FUNDS(Dollars in Thousands)
Colorado PERA Comprehensive Annual Financial Report 2019 � Financial Section 107
Final D
raft
June
12,
202
0
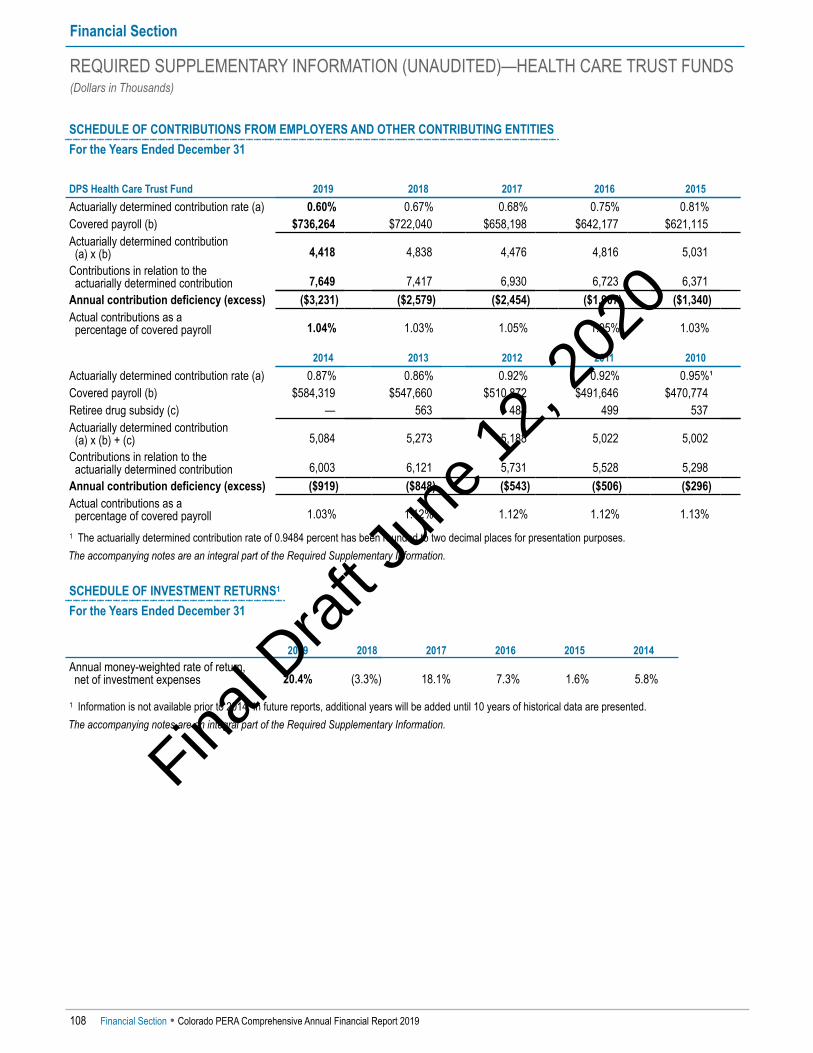
SCHEDULE OF CONTRIBUTIONS FROM EMPLOYERS AND OTHER CONTRIBUTING ENTITIESFor the Years Ended December 31
DPS Health Care Trust Fund 2019 2018 2017 2016 2015Actuarially determined contribution rate (a) 0.60% 0.67% 0.68% 0.75% 0.81%Covered payroll (b) $736,264 $722,040 $658,198 $642,177 $621,115Actuarially determined contribution (a) x (b) 4,418 4,838 4,476 4,816 5,031Contributions in relation to the actuarially determined contribution 7,649 7,417 6,930 6,723 6,371Annual contribution deficiency (excess) ($3,231) ($2,579) ($2,454) ($1,907) ($1,340)Actual contributions as a percentage of covered payroll 1.04% 1.03% 1.05% 1.05% 1.03%
2014 2013 2012 2011 2010Actuarially determined contribution rate (a) 0.87% 0.86% 0.92% 0.92% 0.95%¹Covered payroll (b) $584,319 $547,660 $510,872 $491,646 $470,774Retiree drug subsidy (c) — 563 488 499 537Actuarially determined contribution (a) x (b) + (c) 5,084 5,273 5,188 5,022 5,002Contributions in relation to the actuarially determined contribution 6,003 6,121 5,731 5,528 5,298Annual contribution deficiency (excess) ($919) ($848) ($543) ($506) ($296)Actual contributions as a percentage of covered payroll 1.03% 1.12% 1.12% 1.12% 1.13%
1 The actuarially determined contribution rate of 0.9484 percent has been rounded to two decimal places for presentation purposes. The accompanying notes are an integral part of the Required Supplementary Information.
Financial Section
REQUIRED SUPPLEMENTARY INFORMATION (UNAUDITED)—HEALTH CARE TRUST FUNDS(Dollars in Thousands)
108 Financial Section � Colorado PERA Comprehensive Annual Financial Report 2019
SCHEDULE OF INVESTMENT RETURNS1
For the Years Ended December 31
2019 2018 2017 2016 2015 2014Annual money-weighted rate of return,net of investment expenses 20.4% (3.3%) 18.1% 7.3% 1.6% 5.8%
1 Information is not available prior to 2014. In future reports, additional years will be added until 10 years of historical data are presented. The accompanying notes are an integral part of the Required Supplementary Information.
Final D
raft
June
12,
202
0
Financial Section
NOTES TO THE REQUIRED SUPPLEMENTARY INFORMATION (UNAUDITED)— HEALTH CARE TRUST FUNDS(Dollars in Thousands)
Colorado PERA Comprehensive Annual Financial Report 2019 � Financial Section 109
Note 1—Significant Changes in Plan ProvisionsAffecting Trends in Actuarial Information2019 Changes in Plan Provisions Since 2018• There were no changes made to plan provisions.
2018 Changes in Plan Provisions Since 2017• There were no changes made to plan provisions.
2017 Changes in Plan Provisions Since 2016• The Cunningham Fire Protection District (CFPD)
disaffiliated from the Local Government Division,thereby ending participation in the Health Care TrustFund (HCTF) on December 2, 2017. For the purpose ofdisclosure as of the December 31, 2017, measurementdate, liabilities were determined assuming no additionalservice accruals impacting possible future premiumsubsidies for the disaffiliated membership of the CFPDthat had not refunded their PERA member contributionaccounts. The total disaffiliation payment of $1,159was allocated to the Local Government DivisionTrust Fund and the HCTF in the amount of $1,063and $96, respectively.
2016 Changes in Plan Provisions Since 2015• There were no changes made to plan provisions.
2015 Changes in Plan Provisions Since 2014• There were no changes made to plan provisions.
2014 Changes in Plan Provisions Since 2013• There were no changes made to plan provisions.
2013 Changes in Plan Provisions Since 2012• There were no changes made to plan provisions.
2012 Changes in Plan Provisions Since 2011• The Memorial Health System (Memorial), disaffiliated
from the Local Government Division, hence endingparticipation in the HCTF, on October 1, 2012. For thepurpose of disclosure as of the December 31, 2012,measurement date, liabilities were determined assumingno additional service accruals impacting possible futurepremium subsidies for the disaffiliated membership ofMemorial that had not refunded their PERA membercontribution accounts. Additionally, no additionalincoming dollars were assumed added to the HCTF asof December 31, 2012, as there was ongoing litigationregarding the potential dollars owed to the LocalGovernment Division Trust Fund and the HCTF due tothe disaffiliation.
2011 Changes in Plan Provisions Since 2010• There were no changes made to plan provisions.
2010 Changes in Plan Provisions Since 2009• The Denver Public Schools Retirement System (DPSRS)
merged into PERA, effective January 1, 2010, as aseparate division, the Denver Public Schools (DPS)Division. Also effective January 1, 2010, the liabilitiesand assets of the Denver Public Schools Retiree HealthBenefit Trust were transferred into the newly createdDPS HCTF. The valuation reflects the addition of theDPS benefit structure as a result of the merger. Hence,transfers from the DPS Division to the other PERAdivisions covered by the HCTF may build upon a DPSbenefit structure benefit within the HCTF and transfersfrom the other PERA divisions to the DPS Divisioncovered by the DPS HCTF may build upon a PERAbenefit structure benefit within the DPS HCTF.
Note 2—Significant Changes in Assumptions orOther Inputs Affecting Trends in ActuarialInformation2019 Changes in Assumptions or Other Inputs Since 2018• There were no changes made to the actuarial methods
or assumptions.
2018 Changes in Assumptions or Other Inputs Since 2017• There were no changes made to the actuarial methods
or assumptions.
2017 Changes in Assumptions or Other Inputs Since 2016• There were no changes made to the actuarial methods
or assumptions.
2016 Changes in Assumptions or Other Inputs Since 2015• The following methodology change was made:
▪ The Entry Age Normal actuarial cost methodallocation basis has been changed from a level dollaramount to a level percentage of pay.
• The following changes were made to the actuarialassumptions:
▪ The investment rate of return assumption decreasedfrom 7.50 percent to 7.25 percent.
▪ The price inflation assumption decreased from2.80 percent to 2.40 percent.
▪ The wage inflation assumption decreased from3.90 percent to 3.50 percent.
▪ The mortality assumption for active members waschanged to RP-2014 White Collar Employee MortalityTable, a table specifically developed for activelyworking people. To allow for an appropriate marginof improved mortality prospectively, the mortalityrates incorporate a 70 percent factor applied to malerates and a 55 percent factor applied to female rates.
Final D
raft
June
12,
202
0

▪ The post-retirement mortality assumption for healthylives for the State and Local Government Divisionswas changed to the RP-2014 Healthy AnnuitantMortality Table with adjustments for credibility andgender adjustments of a 73 percent factor applied toages below 80 and a 108 percent factor applied to age80 and above, projected to 2018, for males, and a78 percent factor applied to ages below 80 and a109 percent factor applied to age 80 and above,projected to 2020, for females.
▪ The post-retirement mortality assumption for healthylives for the School, Judicial, and DPS Divisions waschanged to the RP-2014 White Collar HealthyAnnuitant Mortality Table with adjustments forcredibility and gender adjustments of a 93 percentfactor applied to ages below 80 and a 113 percentfactor applied to age 80 and above, projected to 2018,for males, and a 68 percent factor applied to agesbelow 80 and a 106 percent factor applied to age 80and above, projected to 2020, for females.
▪ For disabled retirees, the mortality assumption waschanged to reflect 90 percent of RP-2014 DisabledRetiree Mortality Table.
▪ The assumed rates of withdrawal, retirement, anddisability have been adjusted to more closelyreflect experience.
▪ The assumed rates of PERACare participation havebeen revised to reflect more closely actual experience.
▪ Initial per capita health care costs for those PERACareenrollees under the PERA benefit structure who areexpected to attain age 65 and older ages and are noteligible for premium-free Medicare Part A benefitshave been updated to reflect the change in costs forthe 2017 plan year.
▪ The percentage of PERACare enrollees who will attainage 65 and older ages and are assumed to not qualifyfor premium-free Medicare Part A coverage have beenrevised to reflect more closely actual experience.
▪ The percentage of disabled PERACare enrollees whoare assumed to not qualify for premium-free MedicarePart A coverage has been revised to reflect moreclosely actual experience.
▪ The health care cost trend rates for Medicare Part Apremiums have been revised to reflect the then-current expectation of future increases in rates ofinflation applicable to Medicare Part A premiums.
▪ Assumed election rates for the PERACare coverageoptions that would be available to future PERACareenrollees who will qualify for the “No Part A Subsidy”when they retire have been revised to more closelyreflect actual experience.
▪ Assumed election rates for the PERACare coverageoptions that will be available to those currentPERACare enrollees, who qualify for the “No Part ASubsidy” but have not reached age 65, have beenrevised to more closely reflect actual experience.
▪ The rates of PERACare coverage election for spousesof eligible inactive members and future retirees wasrevised to reflect more closely actual experience.
▪ The assumed age differences between future retireesand their participating spouses have been revised toreflect more closely actual experience.
2015 Changes in Assumptions or Other Inputs Since 2014• The following methodology changes were made:
▪ Rates of morbidity to model the growth in assumedclaims as a PERACare enrollee ages have been addedto the process used to project per capita health carecosts of those PERACare enrollees under the PERAbenefit structure who have attained age 65 and olderand are not eligible for premium-free MedicarePart A benefits.
▪ Adjustments were made to the timing of the normalcost and unfunded actuarial accrued liability (UAAL)payment calculations to reflect contributionsthroughout the year.
• The following changes were made to the actuarialassumptions:
▪ The percentage of PERACare enrollees who will attainage 65 and older ages and are assumed to not qualifyfor premium-free Medicare Part A coverage have beenrevised to more closely reflect actual experience.
▪ Initial per capita health care costs for those PERACareenrollees under the PERA benefit structure who areexpected to attain age 65 and older ages and are noteligible for premium-free Medicare Part A benefitshave been updated to reflect the change in costs forthe 2016 plan year.
▪ The health care cost trend rates for Medicare Part Apremiums have been revised to reflect the currentexpectation of future increases in rates of inflationapplicable to Medicare Part A premiums.
2014 Changes in Assumptions or Other Inputs Since 2013• The following change was made to the actuarial
assumptions:
▪ Initial per capita health care costs for those PERACareenrollees under the PERA benefit structure who areexpected to attain age 65 and older ages and are noteligible for premium-free Medicare Part A benefitshave been updated to reflect the change in costs forthe 2015 plan year.
Financial Section
NOTES TO THE REQUIRED SUPPLEMENTARY INFORMATION (UNAUDITED)— HEALTH CARE TRUST FUNDS(Dollars in Thousands)
110 Financial Section � Colorado PERA Comprehensive Annual Financial Report 2019
Final D
raft
June
12,
202
0

• The following other change was made:
▪ In 2012, a lawsuit was initiated to determine theamount owed to PERA by Memorial and the City ofColorado Springs (City) for Memorial’s disaffiliationfrom PERA. In September 2014, PERA and the Cityagreed to resolve the lawsuit. The agreement providedfor the City to pay PERA $190,000 for the liabilitiesassociated with the retirement and health care benefitsalready earned by 7,666 Memorial employees for thework that they performed before Memorial ceased tobe a PERA employer. On October 3, 2014, PERAreceived a disaffiliation payment from the City, whichwas allocated to the Local Government Division TrustFund and the HCTF in the amount of $186,006 and$3,994, respectively.
2013 Changes in Assumptions or Other Inputs Since 2012• The following changes were made to the actuarial
assumptions:
▪ The investment rate of return assumption decreasedfrom 8.00 percent to 7.50 percent per annum.
▪ The price inflation assumption decreased from3.50 percent to 2.80 percent per annum.
▪ The wage inflation assumption decreased from4.25 percent to 3.90 percent per annum.
▪ Effective January 1, 2014, PERACare no longerparticipates in the Centers for Medicare & MedicaidServices (CMS) Retiree Drug Subsidy (RDS) program.PERACare enrollees participating in the self-insuredMedicare supplement plans and the Medicare HMOplan offered by Rocky Mountain Health Plans nowreceive their prescription drug benefits through aMedicare Prescription Drug Plan. The liabilityassociated with the RDS has been eliminated.
▪ Initial per capita health care costs for those PERACareenrollees under the PERA benefit structure who areexpected to attain age 65 and older ages and are noteligible for premium-free Medicare Part A benefitshave been updated to reflect the change in costs forthe 2014 plan year.
▪ The health care cost trend rates for Medicare Part Apremiums have been revised to reflect the currentexpectation of future increases in rates of inflationapplicable to Medicare Part A premiums.
▪ The utilization rates for the No Part A subsidy of bothretirees and their spouses have been revised.
2012 Changes in Assumptions or Other Inputs Since 2011• The following changes were made to the actuarial
assumptions:
▪ The price inflation assumption decreased from3.75 percent to 3.50 percent.
▪ The wage inflation assumption decreased from4.50 percent to 4.25 percent.
▪ The post-retirement mortality assumption for healthylives changed to the RP-2000 Combined MortalityTable rates projected with Scale AA to 2020 (set backone year for males and two years for females).
▪ The active member mortality assumption was revisedto match the post-retirement mortality table. However,the percentages of the post-retirement mortality tablesreflected on active member lives were changed to55 percent for males and 40 percent for females.
▪ The RP-2000 Disability Mortality Table was retained.The setback applied to the male disability mortalityrates remains unchanged at two years, however, thesetback applied to the female mortality rates changedfrom five years to two years.
▪ The rates of withdrawal were revised to more closelyreflect actual experience.
▪ The rates of early, reduced retirement for all divisionsdecreased and the rates for unreduced retirementsincreased to more closely reflect actual experience.
▪ The rates of disability from active service decreasedslightly to more closely reflect actual experience.
▪ The investment return assumption was changed to beonly net of investment expenses to better represent theinvestment consultant’s assumptions and predictionsand also to better align with recent changes in GASBaccounting and reporting requirements.
▪ The rates of participation in PERACare for current andfuture participants of all divisions and DPS Divisiondeferred vested members have been revised to moreclosely reflect actual experience.
▪ The percentage of PERACare enrollees who will attainage 65 and older ages and are assumed to not qualifyfor premium-free Medicare Part A coverage have beenrevised to more closely reflect actual experience.
▪ The average age difference between covered maleand female spouses has been updated to reflectactual experience.
▪ Initial per capita health care costs for those PERACareenrollees under the PERA benefit structure who areexpected to attain age 65 and older ages and are noteligible for premium-free Medicare Part A benefitshave been updated to reflect the change in costs forthe 2013 plan year.
▪ The initial per capita payments estimated to bemade by CMS under the RDS program have beenupdated based upon the most recent attestation ofactuarial equivalence.
Financial Section
NOTES TO THE REQUIRED SUPPLEMENTARY INFORMATION (UNAUDITED)— HEALTH CARE TRUST FUNDS(Dollars in Thousands)
Colorado PERA Comprehensive Annual Financial Report 2019 � Financial Section 111
Final D
raft
June
12,
202
0

▪ The health care cost trend rates for MedicarePart A premiums and RDS payments have beenrevised to reflect the current expectation of futureincreases in rates of inflation applicable to MedicarePart A premiums.
▪ The last year in which the prescription drug benefitprovided to those members eligible for MedicarePart D is deemed to be actuarially equivalent has beenincreased to 2023.
2011 Changes in Assumptions or Other Inputs Since 2010• The following changes were made to the actuarial
assumptions:
▪ Initial per capita health care costs for those PERACareenrollees under the PERA benefit structure who areexpected to attain age 65 and older ages and are noteligible for premium-free Medicare Part A benefitshave been updated to reflect the change in costs forthe 2012 plan year.
▪ The initial per capita payments estimated to bemade by CMS under the RDS have been updatedbased upon the most recent attestation ofactuarial equivalence.
▪ The health care cost trend rates for MedicarePart A premiums and RDS payments have beenrevised to reflect the current expectation of futureincreases in rates of inflation applicable to MedicarePart A premiums.
▪ The last year in which the prescription drug benefitprovided to those members eligible for Medicare PartD is deemed to be actuarially equivalent has beenincreased to 2019.
2010 Changes in Assumptions or Other Inputs Since 2009• The following changes were made to the actuarial
assumptions:
▪ Assumptions were supplemented to provide for thevaluation of the DPS benefit structure added as aresult of the merger of the DPSRS into PERA, effectiveJanuary 1, 2010.
▪ DPS HCTF was created on January 1, 2010, toprovide health care subsidies for DPS retireesparticipating in PERACare.
▪ Initial per capita health care costs for those PERACareenrollees under the PERA benefit structure who areexpected to attain age 65 and older ages and are noteligible for premium-free Medicare Part A benefitshave been updated to reflect the change in costs forthe 2011 plan year.
▪ PERACare funding rates are used to determine thehealth care costs for participants enrolled in the self-insured plans who are expected to attain age 65 andolder ages and not eligible for premium-free MedicarePart A.
▪ The starting per capita payments estimated to bemade by the CMS under the RDS have beenupdated based upon the most recent attestation ofactuarial equivalence.
▪ The health care cost trend rates for MedicarePart A premiums and RDS payments have beenrevised to reflect the current expectation of futureincreases in rates of inflation applicable to MedicarePart A premiums.
▪ The percentage of PERACare enrollees who areprojected to be age 65 and older, and estimated to notbe eligible for premium-free Medicare Part A has beenrevised to reflect plan experience.
▪ The last year in which the prescription drug benefitprovided to those members eligible for Medicare PartD is deemed to be actuarially equivalent has beenincreased to 2018.
▪ Liabilities for those members represented under boththe PERA benefit structure and the DPS benefitstructure have been allocated based upon membercontribution account balances.
Financial Section
NOTES TO THE REQUIRED SUPPLEMENTARY INFORMATION (UNAUDITED)— HEALTH CARE TRUST FUNDS(Dollars in Thousands)
112 Financial Section � Colorado PERA Comprehensive Annual Financial Report 2019
Final D
raft
June
12,
202
0
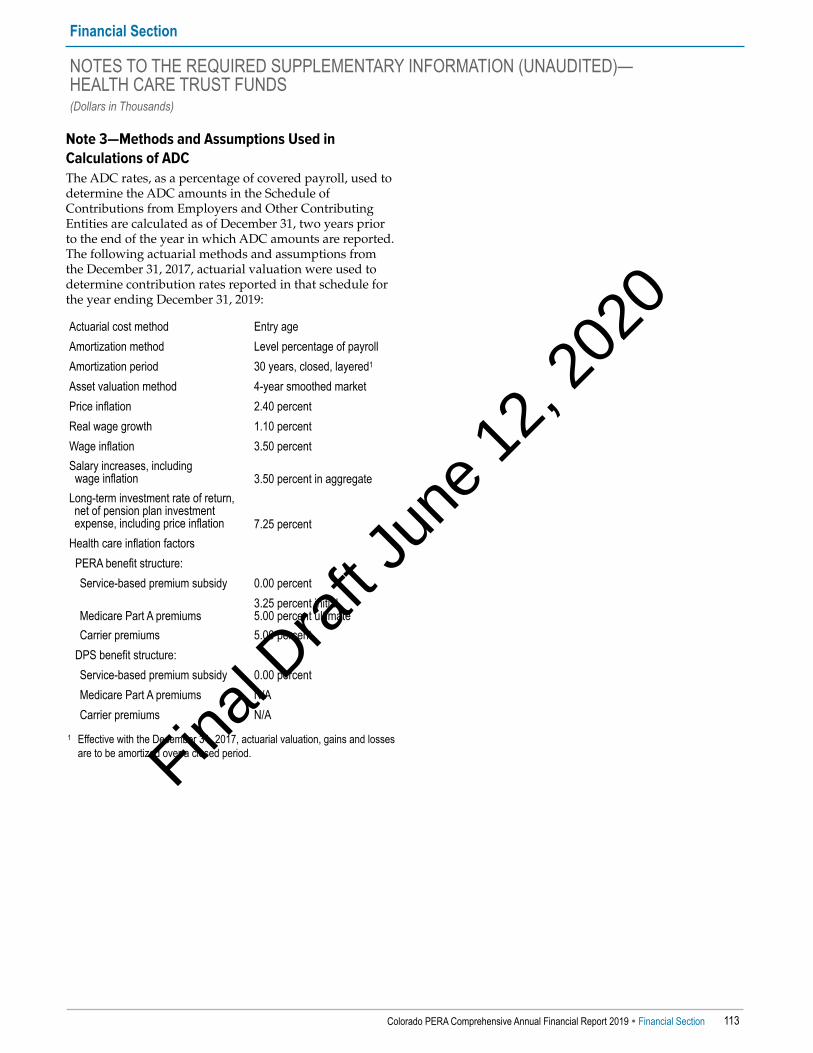
Note 3—Methods and Assumptions Used inCalculations of ADC The ADC rates, as a percentage of covered payroll, used todetermine the ADC amounts in the Schedule ofContributions from Employers and Other ContributingEntities are calculated as of December 31, two years priorto the end of the year in which ADC amounts are reported.The following actuarial methods and assumptions fromthe December 31, 2017, actuarial valuation were used todetermine contribution rates reported in that schedule forthe year ending December 31, 2019:
Actuarial cost method Entry ageAmortization method Level percentage of payrollAmortization period 30 years, closed, layered1
Asset valuation method 4-year smoothed marketPrice inflation 2.40 percentReal wage growth 1.10 percentWage inflation 3.50 percentSalary increases, including wage inflation 3.50 percent in aggregateLong-term investment rate of return,net of pension plan investmentexpense, including price inflation 7.25 percent
Health care inflation factorsPERA benefit structure:Service-based premium subsidy 0.00 percent
Medicare Part A premiums3.25 percent initial 5.00 percent ultimate
Carrier premiums 5.00 percentDPS benefit structure:Service-based premium subsidy 0.00 percentMedicare Part A premiums N/ACarrier premiums N/A
1 Effective with the December 31, 2017, actuarial valuation, gains and lossesare to be amortized over a closed period.
Financial Section
NOTES TO THE REQUIRED SUPPLEMENTARY INFORMATION (UNAUDITED)— HEALTH CARE TRUST FUNDS(Dollars in Thousands)
Colorado PERA Comprehensive Annual Financial Report 2019 � Financial Section 113
Final D
raft
June
12,
202
0
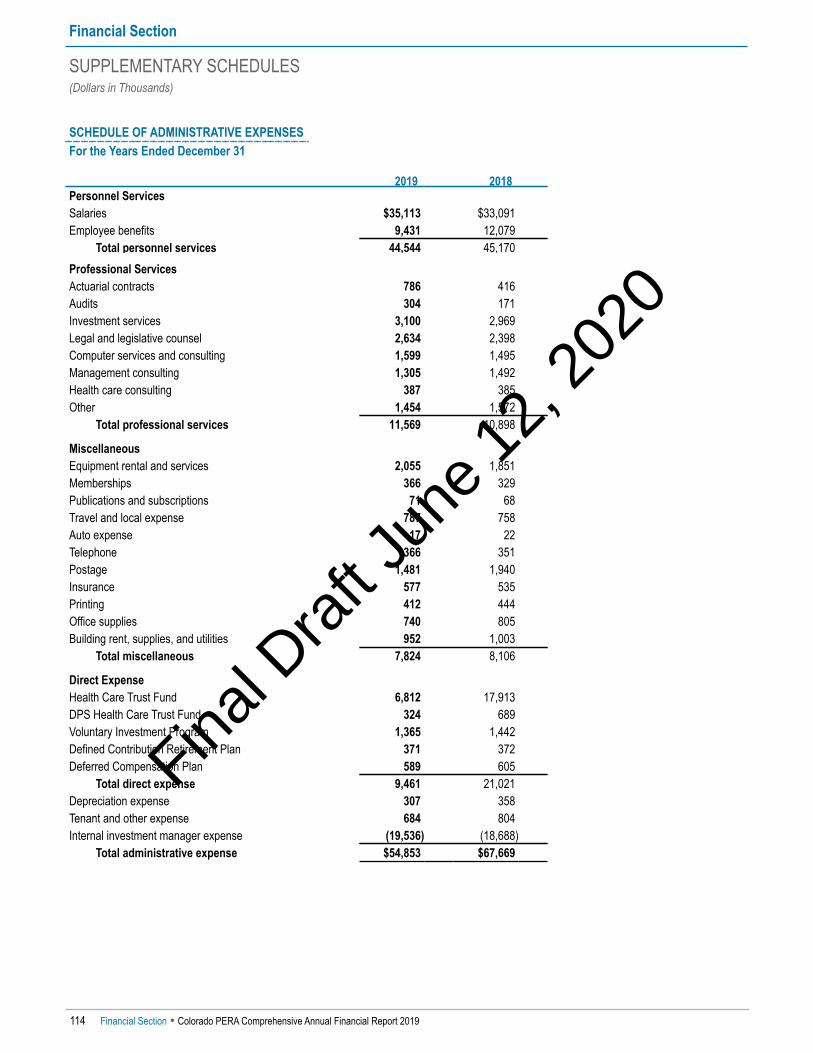
Financial Section
SUPPLEMENTARY SCHEDULES(Dollars in Thousands)
114 Financial Section � Colorado PERA Comprehensive Annual Financial Report 2019
SCHEDULE OF ADMINISTRATIVE EXPENSESFor the Years Ended December 31
2019 2018Personnel ServicesSalaries $35,113 $33,091Employee benefits 9,431 12,079
Total personnel services 44,544 45,170Professional ServicesActuarial contracts 786 416Audits 304 171Investment services 3,100 2,969Legal and legislative counsel 2,634 2,398Computer services and consulting 1,599 1,495Management consulting 1,305 1,492Health care consulting 387 385Other 1,454 1,572
Total professional services 11,569 10,898
MiscellaneousEquipment rental and services 2,055 1,851Memberships 366 329Publications and subscriptions 71 68Travel and local expense 787 758Auto expense 17 22Telephone 366 351Postage 1,481 1,940Insurance 577 535Printing 412 444Office supplies 740 805Building rent, supplies, and utilities 952 1,003
Total miscellaneous 7,824 8,106
Direct ExpenseHealth Care Trust Fund 6,812 17,913DPS Health Care Trust Fund 324 689Voluntary Investment Program 1,365 1,442Defined Contribution Retirement Plan 371 372Deferred Compensation Plan 589 605
Total direct expense 9,461 21,021Depreciation expense 307 358Tenant and other expense 684 804Internal investment manager expense (19,536) (18,688)
Total administrative expense $54,853 $67,669
Final D
raft
June
12,
202
0
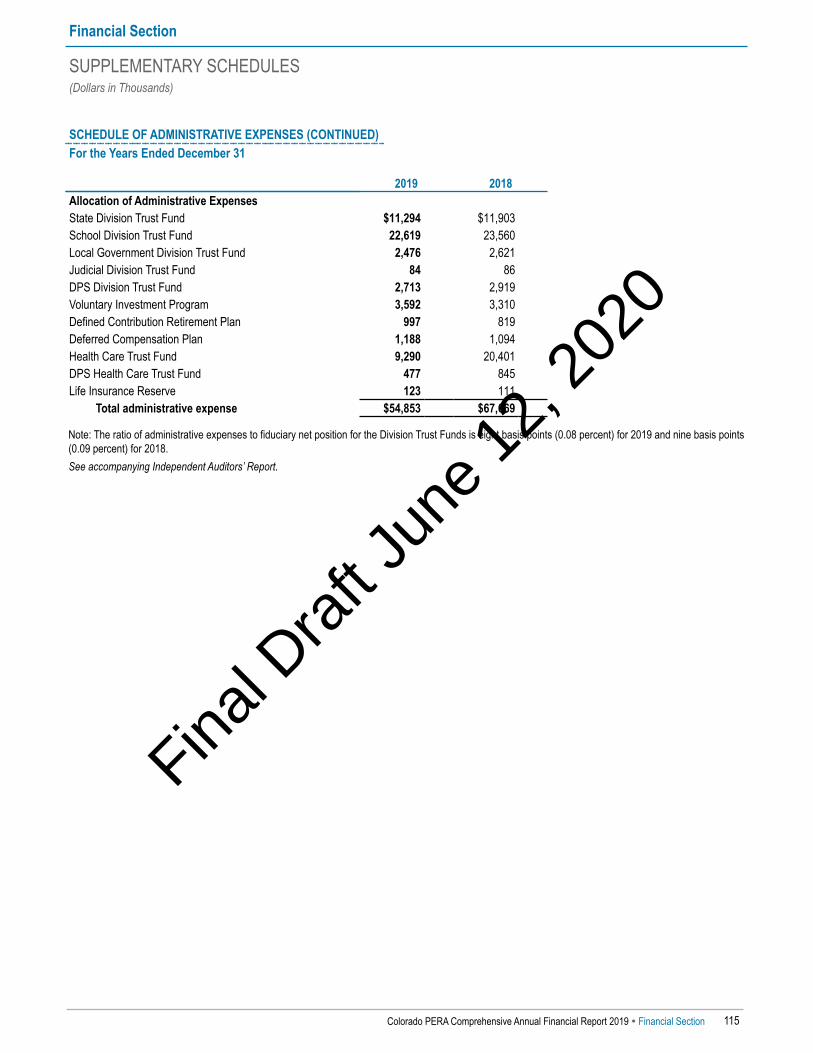
SCHEDULE OF ADMINISTRATIVE EXPENSES (CONTINUED)For the Years Ended December 31
2019 2018Allocation of Administrative ExpensesState Division Trust Fund $11,294 $11,903School Division Trust Fund 22,619 23,560Local Government Division Trust Fund 2,476 2,621Judicial Division Trust Fund 84 86DPS Division Trust Fund 2,713 2,919Voluntary Investment Program 3,592 3,310Defined Contribution Retirement Plan 997 819Deferred Compensation Plan 1,188 1,094Health Care Trust Fund 9,290 20,401DPS Health Care Trust Fund 477 845Life Insurance Reserve 123 111
Total administrative expense $54,853 $67,669
Note: The ratio of administrative expenses to fiduciary net position for the Division Trust Funds is eight basis points (0.08 percent) for 2019 and nine basis points (0.09 percent) for 2018. See accompanying Independent Auditors’ Report.
Financial Section
SUPPLEMENTARY SCHEDULES(Dollars in Thousands)
Colorado PERA Comprehensive Annual Financial Report 2019 � Financial Section 115
Final D
raft
June
12,
202
0

SCHEDULE OF OTHER ADDITIONSFor the Years Ended December 31
State Division
Trust Fund
SchoolDivision
Trust Fund
LocalGovt
Division Trust Fund
JudicialDivision
Trust Fund
DPS Division
Trust Fund
VoluntaryInvestment
Program
DefinedContributionRetirement
Plan
DeferredCompensation
Plan HCTFDPS
HCTF
Life InsuranceReserve
TOTAL
2019 2018Administrative fee income $— $— $— $— $— $— $— $— $2,478 $153 $— $2,631 $2,644Revenue sharing — — — — — 49 6 26 — — — 81 211Participant loan interest — — — — — 2,359 — 548 — — — 2,907 2,646Interfund transfers at
retirement — — — 6,695 2,993 — — — — — — 9,688 8,103Purchase service transfer
to health care — — — — — — — — 4,483 35 — 4,518 5,784Settlement income 47 79 13 1 11 — — — 15 — — 166 9,632Miscellaneous (25) 285 1 1 26 35 15 4 8 — — 350 149
Total other additions $22 $364 $14 $6,697 $3,030 $2,443 $21 $578 $6,984 $188 $— $20,341 $29,169
Financial Section
SUPPLEMENTARY SCHEDULES(Dollars in Thousands)
116 Financial Section � Colorado PERA Comprehensive Annual Financial Report 2019
SCHEDULE OF OTHER DEDUCTIONSFor the Years Ended December 31
State Division
Trust Fund
SchoolDivision
Trust Fund
LocalGovt
Division Trust Fund
JudicialDivision
Trust Fund
DPS Division
Trust Fund
VoluntaryInvestment
Program
DefinedContributionRetirement
Plan
DeferredCompensation
Plan HCTFDPS
HCTF
Life InsuranceReserve
TOTAL
2019 2018Interfund transfers at
retirement $302 $6,382 $3,004 $— $— $— $— $— $— $— $— $9,688 $8,103Purchase service transfer
to health care 1,849 1,798 809 27 35 — — — — — — 4,518 5,784Miscellaneous 556 113 162 — 20 1,656 135 759 33 1 — 3,435 3,556
Total other deductions $2,707 $8,293 $3,975 $27 $55 $1,656 $135 $759 $33 $1 $— $17,641 $17,443
See accompanying Independent Auditors’ Report.
Final D
raft
June
12,
202
0

SCHEDULE OF INVESTMENT EXPENSESFor the Years Ended December 31
2019 2018External Manager ExpensesGlobal equity $24,565 $27,885Fixed income 225 2,585Private equity 55,558 54,183Real estate 40,155 44,669Opportunity fund 21,597 17,875Cash and short-term investments 192 470
Total external manager expenses 142,292 147,667
Internal manager expenses 19,536 18,688Other investment expenses and custody fees 2,185 1,838Defined contribution and deferred compensationplan investment expenses 2,865 3,371
Total investment expenses $166,878 $171,564
Financial Section
SUPPLEMENTARY SCHEDULES(Dollars in Thousands)
Colorado PERA Comprehensive Annual Financial Report 2019 � Financial Section 117
SCHEDULE OF PAYMENTS TO CONSULTANTSFor the Years Ended December 31
2019 2018Professional ContractsActuarial $786 $416Audits 304 171Legal and legislative counsel 2,634 2,398Computer services and consulting 1,599 1,495Management consulting 1,305 1,492Health care consulting 387 385Other 1,454 1,572
Total payments to consultants1 $8,469 $7,929 1 Excludes investment advisers.
The Schedule of Commissions and other information related to investment expenses can be found in the Investment Section on pages 123-125.
See accompanying Independent Auditors’ Report.Final D
raft
June
12,
202
0

Final D
raft
June
12,
202
0

Final D
raft
June
12,
202
0

Final D
raft
June
12,
202
0
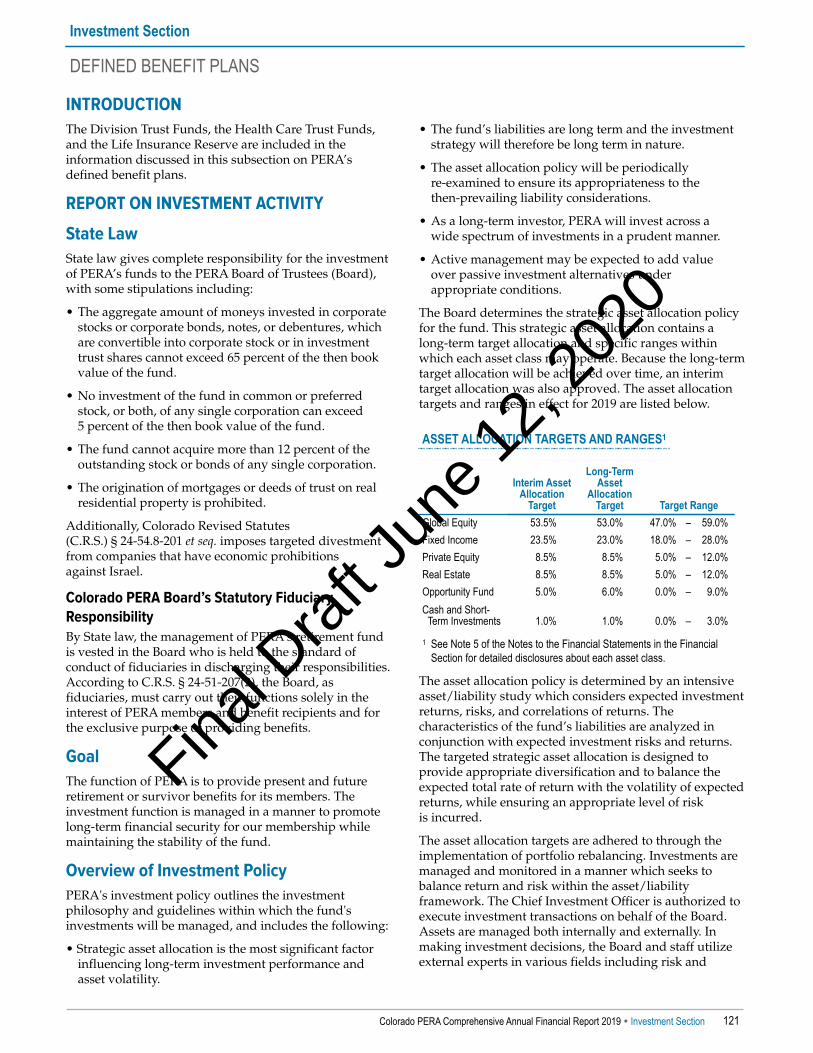
INTRODUCTIONThe Division Trust Funds, the Health Care Trust Funds,and the Life Insurance Reserve are included in theinformation discussed in this subsection on PERA’sdefined benefit plans.
REPORT ON INVESTMENT ACTIVITY
State LawState law gives complete responsibility for the investmentof PERA’s funds to the PERA Board of Trustees (Board),with some stipulations including:
• The aggregate amount of moneys invested in corporatestocks or corporate bonds, notes, or debentures, whichare convertible into corporate stock or in investmenttrust shares cannot exceed 65 percent of the then bookvalue of the fund.
• No investment of the fund in common or preferredstock, or both, of any single corporation can exceed5 percent of the then book value of the fund.
• The fund cannot acquire more than 12 percent of theoutstanding stock or bonds of any single corporation.
• The origination of mortgages or deeds of trust on realresidential property is prohibited.
Additionally, Colorado Revised Statutes(C.R.S.) § 24-54.8-201 et seq. imposes targeted divestmentfrom companies that have economic prohibitionsagainst Israel.
Colorado PERA Board’s Statutory FiduciaryResponsibilityBy State law, the management of PERA’s retirement fundis vested in the Board who is held to the standard ofconduct of fiduciaries in discharging their responsibilities.According to C.R.S. § 24-51-207(2), the Board, asfiduciaries, must carry out their functions solely in theinterest of PERA members and benefit recipients and forthe exclusive purpose of providing benefits.
GoalThe function of PERA is to provide present and futureretirement or survivor benefits for its members. Theinvestment function is managed in a manner to promotelong-term financial security for our membership whilemaintaining the stability of the fund.
Overview of Investment PolicyPERA's investment policy outlines the investmentphilosophy and guidelines within which the fund'sinvestments will be managed, and includes the following:
• Strategic asset allocation is the most significant factorinfluencing long-term investment performance andasset volatility.
• The fund’s liabilities are long term and the investmentstrategy will therefore be long term in nature.
• The asset allocation policy will be periodically re-examined to ensure its appropriateness to the then-prevailing liability considerations.
• As a long-term investor, PERA will invest across awide spectrum of investments in a prudent manner.
• Active management may be expected to add valueover passive investment alternatives underappropriate conditions.
The Board determines the strategic asset allocation policyfor the fund. This strategic asset allocation contains a long-term target allocation and specific ranges withinwhich each asset class may operate. Because the long-termtarget allocation will be achieved over time, an interimtarget allocation was also approved. The asset allocationtargets and ranges in effect for 2019 are listed below.
ASSET ALLOCATION TARGETS AND RANGES1
Interim AssetAllocation
Target
Long-TermAsset
AllocationTarget Target Range
Global Equity 53.5% 53.0% 47.0% – 59.0%Fixed Income 23.5% 23.0% 18.0% – 28.0%Private Equity 8.5% 8.5% 5.0% – 12.0%Real Estate 8.5% 8.5% 5.0% – 12.0%Opportunity Fund 5.0% 6.0% 0.0% – 9.0%Cash and Short-
Term Investments 1.0% 1.0% 0.0% – 3.0%
1 See Note 5 of the Notes to the Financial Statements in the FinancialSection for detailed disclosures about each asset class.
The asset allocation policy is determined by an intensiveasset/liability study which considers expected investmentreturns, risks, and correlations of returns. Thecharacteristics of the fund’s liabilities are analyzed inconjunction with expected investment risks and returns.The targeted strategic asset allocation is designed toprovide appropriate diversification and to balance theexpected total rate of return with the volatility of expectedreturns, while ensuring an appropriate level of riskis incurred.
The asset allocation targets are adhered to through theimplementation of portfolio rebalancing. Investments aremanaged and monitored in a manner which seeks tobalance return and risk within the asset/liabilityframework. The Chief Investment Officer is authorized toexecute investment transactions on behalf of the Board.Assets are managed both internally and externally. Inmaking investment decisions, the Board and staff utilizeexternal experts in various fields including risk and
Investment Section
DEFINED BENEFIT PLANS
Colorado PERA Comprehensive Annual Financial Report 2019 � Investment Section 121
Final D
raft
June
12,
202
0
performance analysis, and other important investmentfunctions and issues.
The Board commissioned an asset/liability study during2019, which was prepared by Aon Hewitt InvestmentConsulting, Inc. (Aon). The objective of the study was todetermine the optimal strategic asset allocation policy thatwill ultimately allow PERA to meet its financialobligations, while also ensuring that PERA incursappropriate levels of risk and liquidity. As a result of thisstudy, the Board slightly modified the asset allocationranges and targets effective January 1, 2020, whilereaffirming the investment return assumption of7.25 percent.
Basis of PresentationAon, the Board’s Investment Performance consultant,provides the investment returns for the fund based ondata made available by the fund’s custodian, TheNorthern Trust Company (Northern Trust). Performancecalculations were prepared using time-weighted rates ofreturn and are net-of-fees unless otherwise indicated.Returns for periods longer than one year are annualized.
Investment StewardshipIt is the fiduciary duty of the Board and Investment staff tomanage plan assets with prudence and care in pursuit oflong-term financial sustainability for the benefit ofmembers and plan participants. PERA staff demonstratestewardship of plan assets by: protecting members’interests through cost-conscious investments; integratingfinancially material factors into investment decisions;advocating for stronger markets that support long-termvalue; and evaluating portfolio exposures andperformance on an ongoing basis.
Investment staff initiatives and philosophy supporting thepursuit of financial sustainability through stewardship arediscussed in greater detail in PERA’s InvestmentStewardship Report. The report also highlightsenvironmental, social, and governance (ESG) relatedinvesting themes more broadly. The Investment StewardshipReport is updated annually, and can be found on PERA’swebsite at www.copera.org.
Proxy VotingAs part of investment stewardship, PERA continuespromoting strong corporate governance practices throughproxy voting. Although PERA is not subject to theEmployee Retirement Income Security Act of 1974(ERISA), the Board complies with the position taken bythe U.S. Department of Labor (DOL) in February 1988. TheDOL has stated that the right to vote shares of stockowned by a pension plan is, in itself, an asset of the plan,and therefore the fiduciary’s responsibility to manage theassets includes proxy voting.
To assist the Board in carrying out its fiduciaryresponsibilities in voting proxies, the Board established aShareholder Responsibility Committee. The Board and itsShareholder Responsibility Committee have delegated toInvestment Stewardship Division staff the authority toreview and vote on proxy proposals in compliance withPERA’s Proxy Voting Policy. Accordingly, InvestmentStewardship staff vote proxies for all domestic andinternational stocks held by PERA's portfolios.
PERA’s Proxy Voting Policy sets forth guidance on a broadrange of issues affecting the oversight and management ofpublic companies in which PERA invests. The Boardregularly updates its Proxy Voting Policy to maintainrelevance in seeking alignment of corporate managementinterests with the interests of shareholders. PERA’s ProxyVoting Policy can be viewed on PERA’s website atwww.copera.org.
(The Colorado PERA Report on Investment Activity wasprepared by internal staff.)
Investment Section
DEFINED BENEFIT PLANS
122 Investment Section � Colorado PERA Comprehensive Annual Financial Report 2019
Final D
raft
June
12,
202
0
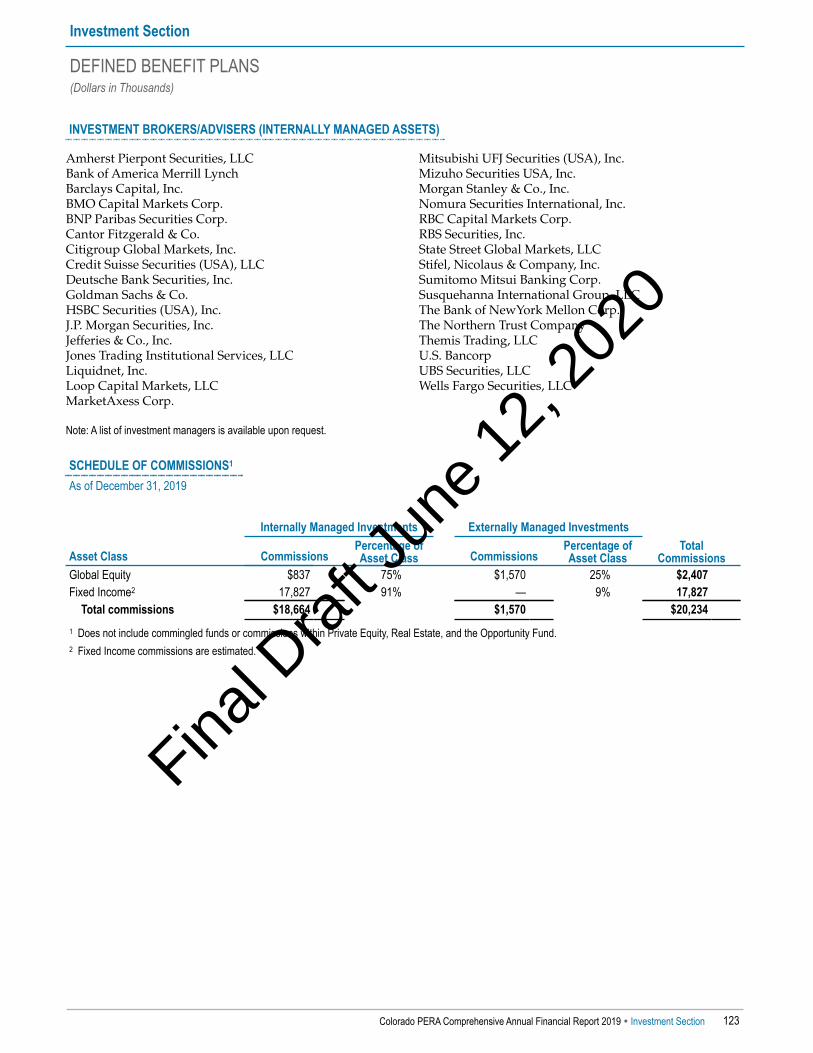
INVESTMENT BROKERS/ADVISERS (INTERNALLY MANAGED ASSETS)
Amherst Pierpont Securities, LLCBank of America Merrill LynchBarclays Capital, Inc.BMO Capital Markets Corp.BNP Paribas Securities Corp.Cantor Fitzgerald & Co.Citigroup Global Markets, Inc.Credit Suisse Securities (USA), LLCDeutsche Bank Securities, Inc.Goldman Sachs & Co.HSBC Securities (USA), Inc.J.P. Morgan Securities, Inc.Jefferies & Co., Inc.Jones Trading Institutional Services, LLCLiquidnet, Inc.Loop Capital Markets, LLCMarketAxess Corp.
Mitsubishi UFJ Securities (USA), Inc.Mizuho Securities USA, Inc.Morgan Stanley & Co., Inc.Nomura Securities International, Inc.RBC Capital Markets Corp.RBS Securities, Inc.State Street Global Markets, LLCStifel, Nicolaus & Company, Inc.Sumitomo Mitsui Banking Corp.Susquehanna International Group, LLCThe Bank of NewYork Mellon Corp.The Northern Trust CompanyThemis Trading, LLCU.S. BancorpUBS Securities, LLCWells Fargo Securities, LLC
Note: A list of investment managers is available upon request.
Investment Section
DEFINED BENEFIT PLANS(Dollars in Thousands)
Colorado PERA Comprehensive Annual Financial Report 2019 � Investment Section 123
SCHEDULE OF COMMISSIONS1
As of December 31, 2019
Internally Managed Investments Externally Managed Investments
Asset Class CommissionsPercentage of Asset Class Commissions
Percentage of Asset Class
TotalCommissions
Global Equity $837 75% $1,570 25% $2,407Fixed Income2 17,827 91% — 9% 17,827
Total commissions $18,664 $1,570 $20,234 1 Does not include commingled funds or commissions within Private Equity, Real Estate, and the Opportunity Fund. 2 Fixed Income commissions are estimated.
Final D
raft
June
12,
202
0

(In actual dollars for this paragraph only)Total investment expenses for internal and external asset management of PERA’s $52.1 billion investment portfoliowere $164.0 million representing about 31.5 basis points (bps), a decrease of 5.5 bps from 2018. PERA strives to managethe investment assets in a cost efficient manner. The driving factor in the low overall cost is PERA’s use of internalmanagement. PERA staff manages approximately 63 percent of total fund assets in-house at a calculated cost cost forinternal asset management of $12.1 million (3.7 bps); outsourcing such management would cost an estimated$85.0 million (26.0 bps).
SCHEDULE OF INVESTMENT EXPENSES1
As of December 31, 2019
Investment ExpenseGlobal Equity $24,565Fixed Income 225Private Equity 55,558Real Estate 40,155Opportunity Fund 21,597Cash and Short-Term Investments 192
Total External Manager Expenses 142,292
Internal Manager Expenses 19,536Other Investment Expenses and Custody Fees 2,185
Total Investment Expenses $164,013 1 See the Investment Summary on page 126 for information about fair value of investments.
The table below breaks out both the dollar amount and percentage of each asset class managed internally. It is importantto note that all accounts, both internal and external, are held to the same high performance standards.
SCHEDULE OF INTERNAL AND EXTERNAL ASSET MANAGEMENTAs of December 31, 2019
Internal External TotalAsset Class Amount Percent Amount Percent AmountGlobal Equity $22,180,736 74.9% $7,445,159 25.1% $29,625,895Fixed Income 10,505,373 91.3% 1,006,308 8.7% 11,511,681Private Equity — — 4,219,262 100.0% 4,219,262Real Estate — — 4,621,450 100.0% 4,621,450Opportunity Fund — — 1,829,580 100.0% 1,829,580Cash and Short-Term Investments — — 264,569 100.0% 264,569
Total $32,686,109 62.8% $19,386,328 37.2% $52,072,437
Investment Section
DEFINED BENEFIT PLANS(Dollars in Thousands)
124 Investment Section � Colorado PERA Comprehensive Annual Financial Report 2019
Final D
raft
June
12,
202
0

SCHEDULE OF INVESTMENT INCOME AND EXPENSE BY ASSET CLASSAs of December 31, 2019
Asset ClassNet Appreciation
in Fair Value1Interest andDividends
Net OperatingIncome2
InvestmentExpenses3
Net SecuritiesLending Income
Net InvestmentIncome
Global Equity $6,397,219 $545,559 $— ($35,060) $7,899 $6,915,617Fixed Income 676,344 306,093 — (4,601) 232 978,068Private Equity 576,157 4 17,226 (58,653) — 534,734Real Estate 215,189 — 187,869 (42,163) — 360,895Opportunity Fund 62,065 9 65,958 (23,313) — 104,719Cash and Short-TermInvestments 88,915 8,799 — (223) (931)⁴ 96,560
Total $8,015,889 $860,464 $271,053 ($164,013) $7,200 $8,990,593 1 Global Equity and Fixed Income include realized gain/(loss) recognized on securities sold during 2019, current year unrealized gain/(loss) and unrealized
translation gain/(loss), and class action revenue. Private Equity, Real Estate, and Opportunity Fund include current year realized and unrealized gain/(loss),paid carried interest, and adjustments to accrued carried interest as reported by the General Partner.
2 Private Equity, Real Estate, and Opportunity Fund include investment income and expenses as reported by the General Partner. 3 Includes external and internal investment management, custody, and other investment expenses. 4 Represents current year realized and unrealized loss on investments in the invested collateral pool.
Investment Section
DEFINED BENEFIT PLANS(Dollars in Thousands)
Colorado PERA Comprehensive Annual Financial Report 2019 � Investment Section 125
SCHEDULE OF PRIVATE MARKET INVESTMENT CONTRIBUTIONS, DISTRIBUTIONS, AND PAID CARRIED INTERESTAs of December 31, 2019
Asset Class Contributions1 Distributions2 Paid Carried Interest3
Private Equity $721,494 $997,763 $52,153Real Estate 446,071 520,778 9,221Opportunity Fund 313,542 206,142 4,273
Total $1,481,107 $1,724,683 $65,647 1 Represents money sent to external entities for the purpose of funding private market investments and/or fees during the current fiscal year. 2 Represents money or shares of companies received from external entities during the current fiscal year, generally due to PERA receiving its proportionate
share of an investment’s exited value. 3 Represents the share of profits paid to external entities due to investment returns surpassing agreed-upon thresholds. Amounts will vary, potentially
significantly, from year to year depending on the timing of sales of the underlying investments and the magnitude of the gains. Amounts are based on bestavailable information provided by external entities. Actual results could differ from those amounts.
Final D
raft
June
12,
202
0

INVESTMENT SUMMARY
Fair Value PerFinancial
StatementsDecember 31, 2019
Reallocationof Investment
Amounts1
Non-InvestmentAmounts2
Fair Value PerInvestment
PortfolioDecember 31, 2019
Interim AssetAllocation
TargetDuring 20193
Actual Asset Allocation (Percent of Fair Value)
12/31/19 12/31/18 12/31/17Global Equity $29,356,380 $269,515 $— $29,625,895 53.5% 56.9% 53.4% 57.7%Fixed Income 11,263,209 248,472 — 11,511,681 23.5% 22.1% 24.0% 21.9%Private Equity 4,219,261 1 — 4,219,262 8.5% 8.1% 8.8% 8.0%Real Estate 4,632,826 (11,376) — 4,621,450 8.5% 8.9% 9.6% 8.6%Opportunity Fund 1,829,571 9 — 1,829,580 5.0% 3.5% 3.6% 3.4%Cash and Short-Term
InvestmentsOperating Cash 10,497 — (10,497) —Cash and Short-Term
Investments 674,272 (409,703) — 264,569 1.0% 0.5% 0.6% 0.4%Net securities lending collateral
and obligations 500 (500) — —Net investment settlements and
income and other liabilities4 (14,093) (96,418) 110,511 —Benefit and interfund receivables
and capital assets5 223,746 — (223,746) —Total $52,196,169 $— ($123,732) $52,072,437 100.0% 100.0% 100.0% 100.0%
1 Investment receivables, payables, accruals, securities lending collateral, securities lending obligations, and cash and short-term investments are allocatedback to the investment portfolios that hold them.
2 Non-investment amounts are not included in the determination of actual investment asset allocation. 3 See page 121 for more information about the strategic asset allocation policy of the fund. 4 Includes non-investment payables of $110,511. 5 Includes benefit receivables of $208,702, interfund receivables of $729, and capital assets of $14,315.
Investment Section
DEFINED BENEFIT PLANS(Dollars in Thousands)
126 Investment Section � Colorado PERA Comprehensive Annual Financial Report 2019
Actual Asset Allocation as of December 31, 2019 Interim Asset Allocation Target During 2019
Asset Allocation versus Target
60%
50%
40%
30%
20%
10%
0%
Global Equity Fixed Income Private Equity Real Estate Opportunity Fund Cash and Short-TermInvestments
56.9%
22.1%
8.1% 8.9%
3.5%0.5%
53.5%
23.5%
8.5% 8.5%
5.0%
1.0%
Final D
raft
June
12,
202
0

Aon provides the investment returns for the fund based on data made available by Northern Trust. Listed below are theannualized one-, three-, five-, and ten-year net-of-fees time-weighted rates of return for each asset class and theirrespective benchmarks.
SCHEDULE OF INVESTMENT RESULTSAs of December 31, 2019
2019 3–Year 5–Year 10–YearPERA Total Portfolio 20.3% 11.1% 8.4% 9.1%Total Fund Policy Benchmark1 19.8% 10.2% 7.6% 8.8%Median Plan (BNY Mellon Performance and Risk Analytics’and Investment Metrics’ Median Public Fund Universe) 16.9% 9.0% 6.7% 7.9%
Global Equity 29.5% 14.1% 9.7% 10.5%Global Equity Custom Benchmark2 26.8% 12.3% 8.4% 9.7%
Fixed Income 9.2% 4.3% 3.4% 4.3%Fixed Income Custom Benchmark3 8.7% 4.3% 3.4% 4.1%
Private Equity 13.7% 13.0% 11.3% 12.2%Private Equity Custom Benchmark4 28.3% 18.4% 13.9% 16.2%
Real Estate 8.4% 9.7% 11.3% 12.7%Real Estate Custom Benchmark5 4.9% 6.7% 8.5% 11.0%
Opportunity Fund 6.4% 6.8% 5.4% 4.1%Opportunity Fund Custom Benchmark6 11.2% 7.3% 5.6% 5.3%
Cash and Short-Term Investments 2.4% 1.8% 1.2% 0.8%ICE BofAML U.S. 3-Month Treasury Bill Index 2.3% 1.7% 1.1% 0.6%
Note: Performance calculations were prepared using net-of-fees time-weighted rates of return. 1 The PERA Board adopted benchmarks beginning April 1, 2004, for each of the various asset classes. The adopted benchmarks have changed over time and,
accordingly, the benchmark returns presented represent a blend, as follows:• The Total Fund Policy Benchmark—A combination of 53.5 percent of the Global Equity Custom Benchmark; 23.5 percent of the Fixed Income Custom
Benchmark; 8.5 percent of the Private Equity Custom Benchmark; 8.5 percent of the Real Estate Custom Benchmark; 5.0 percent of the Opportunity FundCustom Benchmark; and 1.0 percent of the ICE BofAML U.S. 3-Month Treasury Bill Index. Prior to July 2016, a combination of 55.0 percent of the GlobalEquity Custom Benchmark; 24.0 percent of the Fixed Income Custom Benchmark; 7.5 percent of the Real Estate Custom Benchmark; 7.5 percent of thePrivate Equity Custom Benchmark; 5.0 percent of the Opportunity Fund Custom Benchmark; and 1.0 percent of the ICE BofAML U.S. 3-Month Treasury BillIndex. Prior to July 2015, a combination of 56.0 percent of the Global Equity Custom Benchmark; 25.0 percent of the Fixed Income Custom Benchmark;7.0 percent of the Real Estate Custom Benchmark; 7.0 percent of the Private Equity Custom Benchmark; and 5.0 percent of the Opportunity Fund CustomBenchmark. Prior to January 2011, a combination of 58.0 percent of the Global Equity Custom Benchmark; 25.0 percent of the Fixed Income CustomBenchmark; 7.0 percent of the Real Estate Custom Benchmark; 7.0 percent of the Private Equity Custom Benchmark; and 3.0 percent of the PublicMarkets Benchmark.
2 MSCI ACWI IMI (Net) with USA Gross. Prior to July 1, 2018, MSCI ACWI IMI. Prior to February 1, 2013, 52.0 percent DJ U.S. Total Stock Market Index and48.0 percent MSCI ACWI ex-U.S. Index. Prior to October 1, 2012, 58.0 percent DJ U.S. Total Stock Market Index and 42.0 percent MSCI ACWI ex-U.S. Index.Prior to April 1, 2012, 64.0 percent DJ U.S. Total Stock Market Index and 36.0 percent MSCI ACWI ex-U.S. Index. Prior to October 1, 2011, 69.0 percent DJU.S. Total Stock Market Index and 31.0 percent MSCI ACWI ex-U.S. Index. Prior to April 1, 2011, 74.1 percent DJ U.S. Total Stock Market Index and25.9 percent MSCI ACWI ex-U.S. Index.
3 Bloomberg Barclays U.S. Aggregate. Prior to August 1, 2018, Bloomberg Barclays U.S. Universal Bond Index. Prior to July 1, 2015, 98.0 percent of theBloomberg Barclays Capital U.S. Universal Bond Index and 2.0 percent of the Bloomberg Barclays Capital U.S. Long Government/Credit Index. Prior toJuly 1, 2010, Bloomberg Barclays Capital U.S. Universal Bond Index.
4 MSCI ACWI IMI (Net) with USA Gross plus 150 basis points. Prior to January 1, 2019, Burgiss Time Weighted Rate of Return Benchmark. Prior toJanuary 1, 2015, DJ U.S. Total Stock Market Index plus 250 basis points annually. Prior to January 1, 2012, DJ U.S. Total Stock Market Index plus 300 basispoints annually.
5 NCREIF Open End Diversified Core Equity Index (NFI-ODCE) plus 50 basis points annually. Prior to January 1, 2012, NFI-ODCE plus 100 basispoints annually.
6 Weighted average of beginning of year market values for each of the three objectives (Risk Mitigation: HFRI FOF Market Defensive Index, Real Assets: CPIplus 400 basis points, Opportunistic: PERA Public Markets plus 150 basis points). (Note, the term “market value” is used in this instance to be consistent withthe language approved by the Board. The term “market value” is synonymous with the term “fair value” as used elsewhere in this CAFR). Prior toJanuary 1, 2019, market value weighted aggregate of the benchmarks of the individual strategies included in the Opportunity Fund. Prior to January 1, 2012, acombination of 69.1 percent of the Global Equity Custom Benchmark and 30.9 percent of the Fixed Income Custom Benchmark. Prior to January 1, 2011, acombination of 51.8 percent DJ U.S. Total Stock Market Index; 18.1 percent MSCI ACWI ex-U.S. Index; and 30.1 percent Fixed Income Custom Benchmark.
Investment Section
DEFINED BENEFIT PLANS
Colorado PERA Comprehensive Annual Financial Report 2019 � Investment Section 127
Final D
raft
June
12,
202
0

Listed below are the three-, five-, and ten-year net-of-fees time-weighted rates of return for the total fund and each assetclass and their respective benchmarks.
Three-Year Net-of-Fees Time-Weighted Rates of Return
PERA Benchmarks Median Plan
20.0%
15.0%
10.0%
5.0%
0.0%Retu
rnin
Perc
enta
ge
TotalPortfolio
GlobalEquity
FixedIncome
PrivateEquity
RealEstate
OpportunityFund
Cash & Short-TermInvestments
11.1%14.1%
4.3%
13.0%
9.7%6.8%
1.8%
10.2%12.3%
4.3%
18.4%
6.7% 7.3%
1.7%
9.0%
Five-Year Net-of-Fees Time-Weighted Rates of Return
PERA Benchmarks Median Plan
20.0%
15.0%
10.0%
5.0%
0.0%Retu
rnin
Perc
enta
ge
TotalPortfolio
GlobalEquity
FixedIncome
PrivateEquity
RealEstate
OpportunityFund
Cash & Short-TermInvestments
8.4%9.7%
3.4%
11.3% 11.3%
5.4%
1.2%
7.6% 8.4%
3.4%
13.9%
8.5%5.6%
1.1%
6.7%
Ten-Year Net-of-Fees Time-Weighted Rates of Return
PERA Benchmarks Median Plan
20.0%
15.0%
10.0%
5.0%
0.0%Retu
rnin
Perc
enta
ge
TotalPortfolio
GlobalEquity
FixedIncome
PrivateEquity
RealEstate
OpportunityFund
Cash & Short-TermInvestments
9.1%10.5%
4.3%
12.2% 12.7%
4.1%
0.8%
8.8% 9.7%
4.1%
16.2%
11.0%
5.3%
0.6%
7.9%
Investment Section
DEFINED BENEFIT PLANS
128 Investment Section � Colorado PERA Comprehensive Annual Financial Report 2019
Final D
raft
June
12,
202
0
FUND PERFORMANCE EVALUATION(Performance returns are net-of-fees unless otherwise indicated)
Total Portfolio ResultsFor the year ended December 31, 2019, PERA’s total fundreturned 20.3 percent, outperforming the policybenchmark’s return of 19.8 percent. PERA's policybenchmark is a passive representation of the assetallocation policy adopted by the Board. The total fund hasoutperformed the policy benchmark over the one-, three-,five-, and ten-year periods.
The total fund return of 20.3 percent for the year endedDecember 31, 2019, also exceeded the BNY MellonPerformance and Risk Analytics’ and Investment Metrics’Median Public Fund Universe return of 16.9 percent. As ofDecember 31, 2019, this universe was comprised of165 public pension funds with assets of approximately$3.0 trillion. The total fund has performed better than thisuniverse over the one-, three-, five-, and ten-year periods.
For the year ended December 31, 2019, the total fundreturned 20.3 percent, compared to a hypotheticalportfolio consisting of 60 percent global equities, based onthe MSCI ACWI IMI Index, and 40 percent fixed income,based on the Bloomberg Barclay's U.S. Aggregate BondIndex, which collectively returned 19.5 percent. The totalfund has performed better than this hypothetical portfolioover the one-, three-, five- and ten-year periods(11.1 percent versus 9.2 percent, 8.4 percent versus6.6 percent, and 9.1 percent versus 7.6 percent, for thethree-, five-, and ten-year periods, respectively).
Global Equity2019 was a tremendous year for equity investors, as theglobal stock market surged over 26 percent (MSCI ACWIIMI). This gain defied most forecasts, which began theyear focusing on threats from the U.S.-China tradenegotiations and a slowdown in economic and corporateearnings growth.
Stocks rallied during the first several months of 2019, afterexperiencing a significant decline during the last fewmonths of 2018. Growing concerns regarding a potentialU.S. recession and global trade tensions flustered marketsin May and most of the summer. However, incrementallyupbeat economic data helped ease worries, driven by astrong U.S. jobs market, solid U.S. consumer spending,and better-than-expected corporate earnings. Robust stockmarket gains in the fourth quarter reflected reducedinvestor anxiety concerning the global economy and U.S.-China relations, as trade tensions eased with theannouncement of a “phase one” trade deal. The stockmarket rally was also supported by a shift in monetarypolicy at the Federal Reserve (Fed) which, in July, cutrates for the first time in a decade. This was followed byadditional rate cuts in September and October.
U.S. large cap tech stocks led the global equity rally in2019. The technology sector was up over 46 percent duringthe year. A large portion of the market rally resulted fromApple and Microsoft, which surged 89 percent and58 percent, respectively, during 2019. The gains wereparticularly notable given the companies’ sizes, as theyare the two largest publicly traded companies, with eachhaving a market value in excess of $1.2 trillion at the endof the year.
In 2019, PERA’s Global Equity portfolio returned29.5 percent, outperforming its custom benchmark’s returnof 26.8 percent. The Global Equity portfolio hasoutperformed its custom benchmark over the one-, three-,five-, and ten-year periods.
Fixed Income2019 was marked by lower interest rates and tighter creditspreads. The U.S. economy remained relatively strong in2019 with real gross domestic product (GDP) growing2.3 percent, mainly driven by solid consumerspending. Job creation was robust throughout the yearand unemployment declined to 3.5 percent by yearend. However, as the year progressed, global economicactivity decelerated due to heightened U.S.-China tradetensions. The U.S. yield curve inverted for a brief period(the yield on the 2-year Treasury note exceeded that of the10-year). The Fed responded by reducing the Fed Fundsrate by 75 basis points, which normalized the yield curve.
The yield on the 10-year Treasury note declined over theyear, beginning the year at 2.69 percent and closing at1.92 percent. Risk assets performed well, aided byearnings growth and robust investor inflows into allspread-related fixed income products such as corporatebonds, agency securities, and mortgage-backed securities.U.S. investment grade corporate bonds outperformed allmajor fixed income sectors with option-adjusted creditspreads tightening 60 basis points over the year.
In 2019, PERA’s Fixed Income portfolio returned9.2 percent, outperforming its custom benchmark's returnof 8.7 percent. The Fixed Income portfolio hasoutperformed its custom benchmark over the one- andten-year periods and has performed in line over the three-and five-year periods.
Private EquityPrivate equity investment activity remained strong in2019, posting the second most active year on record. Dealvaluations came down modestly from prior years as tradeconcerns and other economic indicators steered investorstoward downside protection. Although there was amore conservative stance among many sponsors, non-traditional investors, such as sovereign wealth funds,continued to drive competition. Moreover, software deals,which tend to command higher valuations, continued togrow in volume, further contributing to elevated pricing.
Investment Section
DEFINED BENEFIT PLANS
Colorado PERA Comprehensive Annual Financial Report 2019 � Investment Section 129
Final D
raft
June
12,
202
0

After a relatively modest decline in 2018, 2019 was arecord year for private equity fundraising in terms ofdollars raised. However, the number of individual fundsraised was the lowest annual number since 2012. A highproportion of mega funds (> $5 billion) drove these recordlevels. Furthermore, nearly all funds raised in 2019 werelarger than their predecessor funds. Strong private equityperformance, corresponding high levels of capitaldistributions, and an increasingly diverse set of investorsseeking exposure to the asset class, were furthercontributors to private equity’s robust fundraising levels.
2019 venture deal activity was a continuation of 2018’sstrong pace. Larger deals closed at every stage and innearly every sector, propelling record deal activity. 2019saw record-breaking venture capital exit value, most ofwhich came from venture-backed initial public offerings(IPOs). Favorable public market conditions gave investorsan enticing exit option; however, post-IPO performance ofventure-backed deals was uneven, tempering some of theIPO enthusiasm.
In 2019, PERA’s Private Equity portfolio returned13.7 percent, compared with its custom benchmark’sreturn of 28.3 percent. The Private Equity portfolio hasunderperformed its custom benchmark over the one-,three-, five-, and ten-year periods. The ultimate goal ofprivate equity is to outperform public equities over thelong term. Over the past ten years, the Private EquityPortfolio has outperformed the Global Equity CustomBenchmark by 2.5 percent. The portfolio’s since inceptionnet internal rate of return as of December 31, 2019, was10.5 percent compared to its custom benchmark’s sinceinception internal rate of return of 7.4 percent.
Real Estate Real estate transaction activity remained relatively flat in2019 in total value of institutional grade property sales.The aggregate number of trades declined slightly as largerportfolio transactions were more prevalent in themarketplace. Financial conditions and monetary policyeased considerably throughout the year, and whiletreasury yields decreased in 2019, overall capitalizationrates remained consistent across all property types anddebt financing was widely available. The real estate riskpremium remained intact in 2019 at approximately440 basis points over the rate on 10-year Treasury notes,and the spread widened as treasury yields declined. Latecycle dynamics pushed investors to be strategic in theirinvestment selection by identifying properties in marketswith strong income and appreciation potential to drivereturns.
The industrial sector continued one of the longestexpansions on record as it benefited from the impact of e-commerce. Development began to trend above its long-term average, but supply and demand were largelyin balance. The multifamily sector remained one of theprimary defensive investment strategies. Despite recordlevels of new supply, low vacancy and sustained rentgrowth helped drive continued growth in appreciationand income. The office sector appeared to plateau after aperiod of cyclical expansion, and fundamentals were morebalanced than prior cycles as the job market neared fullemployment. Retail remained maligned, not only becauseof the structural shift away from traditional brick andmortar formats, but also due to several decades ofoverbuilding in the mall subsector. It remains unclearwhat long-term impact e-commerce will have on physicalretail structures.
In 2019, PERA's Real Estate portfolio returned 8.4 percent,compared with its custom benchmark’s return of4.9 percent. The Real Estate portfolio has outperformed itscustom benchmark over the one-, three‑, five-, and ten-year periods.
Opportunity FundMost traditional asset classes achieved surprisingly strongreturns in 2019, resulting in muted diversification benefitsof alternative investments due to the defensive positioningand risk minimization approach of several investmentmanagers utilized by the Opportunity Fund.
Although an emphasis on risk-adjusted returns can resultin lagging performance during momentum-drivenmarkets such as 2019, the Opportunity Fund remainsfocused on adding long-term value by selectivelyinvesting in return-enhancing private investments andseeking non-correlated investments that reduce the risk ofcapital loss in declining markets. The Opportunity Fundallocates across three sub-asset classes includingopportunistic, real assets, and risk mitigation.Opportunistic focuses on funds that target returns inexcess of public markets, real assets generates consistentincome and a return on capital that exceeds inflation, andrisk mitigation uses multi-strategy and global macrohedge funds for diversification and capital preservation indown markets. All three sub-asset classes generatedmodestly positive returns in 2019.
In 2019, PERA’s Opportunity Fund portfolio returned6.4 percent, compared with its custom benchmark’s returnof 11.2 percent. The Opportunity Fund portfolio hasunderperformed its custom benchmark over the one-,three-, five-, and ten-year periods.
Investment Section
DEFINED BENEFIT PLANS
130 Investment Section � Colorado PERA Comprehensive Annual Financial Report 2019
Final D
raft
June
12,
202
0

PROFILE OF INVESTMENTS IN COLORADOAs of December 31, 2019
Fair ValuePublic Equity1 $142,298
BondsBonds and notes1 6,397Colorado Housing Finance Authority 2,341
Total Bonds 8,738
Real EstatePortfolio investments2 88,545Future commitments to Colorado-based generalpartnerships or funds 72,286
Total Real Estate Fund 160,831
Private EquityPortfolio investments2 172,962Future commitments to Colorado-based generalpartnerships or funds 53,571
Total Private Equity 226,533
Opportunity FundPortfolio investments2 119,462Future commitments to Colorado-based generalpartnerships or funds 84,943
Total Opportunity Fund 204,405
Total $742,805 1 Companies headquartered in Colorado. 2 Portfolio investments domiciled in Colorado.
Investment Section
DEFINED BENEFIT PLANS(Dollars in Thousands)
Colorado PERA Comprehensive Annual Financial Report 2019 � Investment Section 131
Final D
raft
June
12,
202
0
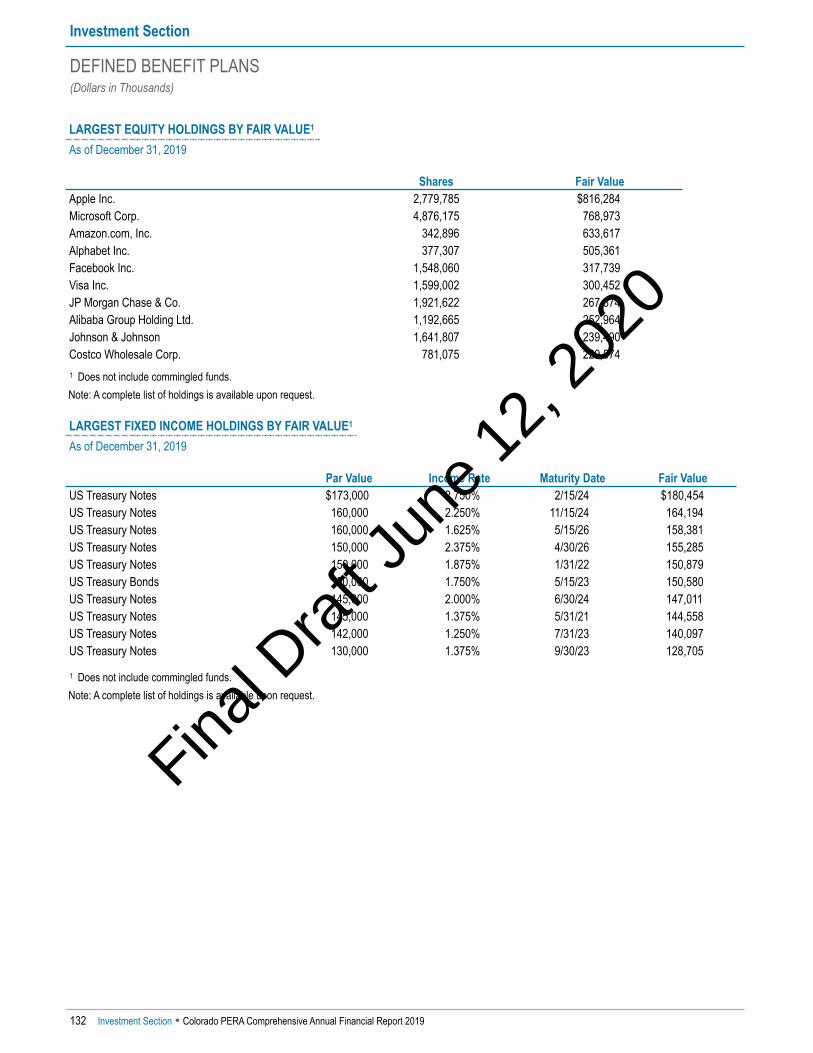
LARGEST EQUITY HOLDINGS BY FAIR VALUE1
As of December 31, 2019
Shares Fair ValueApple Inc. 2,779,785 $816,284Microsoft Corp. 4,876,175 768,973Amazon.com, Inc. 342,896 633,617Alphabet Inc. 377,307 505,361Facebook Inc. 1,548,060 317,739Visa Inc. 1,599,002 300,452JP Morgan Chase & Co. 1,921,622 267,874Alibaba Group Holding Ltd. 1,192,665 252,964Johnson & Johnson 1,641,807 239,490Costco Wholesale Corp. 781,075 229,574
1 Does not include commingled funds. Note: A complete list of holdings is available upon request.
Investment Section
DEFINED BENEFIT PLANS(Dollars in Thousands)
132 Investment Section � Colorado PERA Comprehensive Annual Financial Report 2019
LARGEST FIXED INCOME HOLDINGS BY FAIR VALUE1
As of December 31, 2019
Par Value Income Rate Maturity Date Fair ValueUS Treasury Notes $173,000 2.750% 2/15/24 $180,454US Treasury Notes 160,000 2.250% 11/15/24 164,194US Treasury Notes 160,000 1.625% 5/15/26 158,381US Treasury Notes 150,000 2.375% 4/30/26 155,285US Treasury Notes 150,000 1.875% 1/31/22 150,879US Treasury Bonds 150,000 1.750% 5/15/23 150,580US Treasury Notes 145,000 2.000% 6/30/24 147,011US Treasury Notes 145,000 1.375% 5/31/21 144,558US Treasury Notes 142,000 1.250% 7/31/23 140,097US Treasury Notes 130,000 1.375% 9/30/23 128,705
1 Does not include commingled funds. Note: A complete list of holdings is available upon request.
Final D
raft
June
12,
202
0

REPORT ON INVESTMENT ACTIVITY
OverviewPERA established the Voluntary Investment Program(PERAPlus 401(k) Plan) on January 1, 1985, underSection 401(k) of the Internal Revenue Code (IRC). ThePERAPlus 401(k) Plan includes voluntary contributionsmade by employees of PERA-affiliated employers in theState, School, Local Government, Judicial, and DenverPublic Schools Division Trust Funds. These contributionsare entirely separate from those that members make tothe defined benefit plan each month.
The Defined Contribution Retirement Plan (DC Plan) wasestablished on January 1, 2006, as an IRC § 401(a)governmental profit-sharing plan. The DC Plan offers adefined contribution alternative to the PERA definedbenefit plan for certain new employees of State agenciesand departments, most community colleges, and theDistrict Attorney within each Judicial District, and ifauthorized by the county and the District Attorney, theattorneys within each Judicial District. Pursuant toC.R.S. § 24-51-1501(4), DC Plan eligibility was extended tocertain new employees in the Local Government Division
and certain new classified employees at State Colleges andUniversities beginning on January 1, 2019 (see Note 1 ofthe Notes to the Financial Statements in the FinancialSection for additional details).
On July 1, 2009, PERA assumed the administrative andfiduciary responsibility for the State of ColoradoDeferred Compensation Plan, now known as thePERAPlus 457 Plan. The PERAPlus 457 Plan includesvoluntary contributions made by employees working for aPERA-affiliated employer that have also affiliated with thePERAPlus 457 Plan. The employees of some employersthat had affiliated with the State of Colorado DeferredCompensation Plan prior to July 1, 2009, and were notaffiliated with PERA, remain eligible to contribute.
These three Plans are known collectively as the CapitalAccumulation Plans (CAPs). PERA publishes anAnnual Report for the CAPs and distributes it to allplan participants.
YEAR END STATISTICS
Fiduciary Net Position Number of AccountsActively Contributing
Participants1
2019 2018 % Chg 2019 2018 % Chg 2019 2018 % ChgPERAPlus 401(k) Plan $3,672,807 $3,042,128 20.73% 68,920 68,700 0.32% 24,540 24,557 (0.07%)DC Plan 265,940 205,786 29.23% 6,939 6,363 9.05% 2,640 2,407 9.68%PERAPlus 457 Plan 989,599 818,223 20.94% 18,919 18,479 2.38% 9,355 9,189 1.81%
1 Defined as contributing within the last three months of the year.
Outline of Investment PoliciesObjectivesThe Board is responsible for approving an appropriaterange of investments that addresses the needs of theparticipants in the Plans. The objectives of selecting theinvestment options under each Plan are to:
• Provide a wide range of investment opportunities invarious asset classes so as to allow for diversificationand to cover a wide risk/return spectrum.
• Maximize returns within reasonable and prudent levelsof risk.
• Provide returns comparable to returns for similarinvestment options.
• Control administrative and management costs to theplan and participants.
Investment StewardshipThe Plans adhere to the same principles of investmentstewardship as the defined benefit plans. For moreinformation, please refer to the Investment Stewardshipsection on page 122.
PERAdvantage Investment OptionsThe PERAdvantage investments provide diversificationwithin each of the seven primary funds and nine targetretirement date funds. The white label structure of thePERAdvantage investments simplifies choices, increasesdiversification, and helps participants identify investmentsbased on how the fund invests the money rather thanname familiarity. In addition, the Plans also provide a self-directed brokerage account for participants to selecttheir own investments.
Investment Section
DEFINED CONTRIBUTION AND DEFERRED COMPENSATION PLANS(Dollars in Thousands)
133 Investment Section � Colorado PERA Comprehensive Annual Financial Report 2019
Final D
raft
June
12,
202
0
Participants invest assets in one or more of thefollowing investments:
Primary Investment Options
PERAdvantage Capital Preservation FundThe fund seeks to provide consistent investment incomewith a stable net asset value primarily by investing in aportfolio of high-quality, medium-term fixed incomesecurities. This fund invests in securities issued by theU.S. Government or one of its agencies, including agencymortgage bonds, as well as high-grade corporate bonds.Since the underlying investments fluctuate in marketvalue, the portfolio is paired with an insurance contract toprovide a more stable return. The fund is managed byGreat West Capital Management, LLC.
PERAdvantage Fixed Income FundThe fund seeks to generate income, preserve capital, andprovide long-term capital appreciation by investing in adiversified portfolio of fixed income instruments. Thisfund primarily invests in investment grade debt securities,but may invest a portion of its assets in high-yieldsecurities. The fund may invest in derivative instrumentsor in mortgage- or asset-backed securities. The fundcombines active and passive management. The fund ismanaged by BlackRock (targeted at 50 percent of theportfolio) and Wells Fargo Asset Management (targeted at50 percent of the portfolio).
PERAdvantage Real Return FundThe fund seeks to provide broad exposure to real assetsand Treasury Inflation Protected Securities (TIPS) and toproduce a return over a full market cycle that exceeds therate of inflation. This fund invests in U.S. TIPS, Real EstateInvestment Trusts (REITs), commodities, and globalnatural resources and infrastructure stocks. The fund ismanaged by State Street Global Advisors.
PERAdvantage Socially Responsible Investment (SRI)FundThe fund seeks to invest in a portfolio of developed andemerging market stocks screened on environmental, social,and governance (ESG) factors, and fixed income securitiesacross the investment grade spectrum that demonstrateESG leadership. The equity portion seeks to replicate thereturn of the MSCI ACWI ESG Focus Index. The fixedincome portion invests in U.S. dollar denominatedsecurities and may invest a significant portion of its assetsin corporate bonds or mortgage-backed securities. Thefund is managed by BlackRock (targeted at 60 percent ofthe portfolio) and TIAA-CREF (targeted at 40 percent ofthe portfolio).
PERAdvantage U.S. Large Cap Stock FundThe fund seeks to provide long-term capital appreciationand dividend income primarily by investing in thecommon stock of companies located in the United Stateswith large market capitalizations. This fund invests in awide array of U.S. stocks with market capitalizationssimilar to those found in the MSCI USA Large Cap Index.The fund combines active and passive management. Thefund is managed by PERA.
PERAdvantage U.S. Small and Mid Cap Stock FundThe fund seeks to provide long-term capital appreciationand dividend income primarily by investing in thecommon stock of companies located in the United Stateswith small and mid-market capitalizations. This fundinvests in a wide array of U.S. stocks with marketcapitalizations similar to those found in the MSCI USASMID Cap Index. The fund is managed by DimensionalFund Advisors (targeted at 50 percent of the portfolio) andPERA (targeted at 50 percent of the portfolio).
PERAdvantage International Stock FundThe fund seeks to provide long-term capital appreciationand dividend income primarily by investing in thecommon stock of companies located outside the UnitedStates. This fund invests in a wide array of internationalstocks similar to those found in the MSCI ACWI ex USAIndex. The fund is managed by Schroder InvestmentManagement (targeted at 60 percent of the portfolio) andPERA (targeted at 40 percent of the portfolio).
Additional Investment Options
PERAdvantage Target Retirement Date FundsThere are nine funds with varying asset mixes and risklevels based on expected retirement date. Each of thefunds is invested in the corresponding BlackRockLifePath® Index Target Retirement Date Fund. Thesefunds use passive management strategies and becomemore conservative as the retirement date approaches.BlackRock manages the funds.
TD Ameritrade Self-Directed Brokerage AccountThis account allows selection from numerous mutualfunds and other types of securities, such as stocks andbonds, for an additional fee. Investment in the self-directed brokerage account is offered through TDAmeritrade, a Division of TD Ameritrade, Inc.
Investment Section
DEFINED CONTRIBUTION AND DEFERRED COMPENSATION PLANS(Dollars in Thousands)
134 Investment Section � Colorado PERA Comprehensive Annual Financial Report 2019
Final D
raft
June
12,
202
0
2019 ChangesIn the PERAdvantage SRI Fund, BlackRock replaced theallocation to Northern Trust Investments and TIAA-CREFreplaced the allocation to J.P. Morgan Asset Management.BlackRock manages 60 percent of the portfolio and TIAA-CREF manages 40 percent of the portfolio.
In the PERAdvantage U.S. Small and Mid Cap Stock Fund,TimesSquare Capital Management and BlackRock wereremoved as managers. Dimensional Fund Advisors wasretained as a manager, but the investment style changedfrom value to core, and a PERA managed portfolio wasadded. Dimensional Fund Advisors manages 50 percent ofthe portfolio and PERA manages 50 percent of theportfolio, and the Fund began participating in securitieslending through Deutsche Bank AG.
The assets of the PERAdvantage 2020 Fund weretransferred into the PERAdvantage Income Fund.
LoansParticipants in the PERAPlus 401(k) and PERAPlus 457Plans may access their funds through loans as allowedunder plan policy and the Internal Revenue Service. TheDC Plan prohibits participant loans.
Administrative FeesPlan administrative fees pay for recordkeeping,custodial services, consulting, and internal PERAadministrative expenses.
The administrative fee consists of a flat $1.00 per monthper participant per plan and an asset-based fee of up to0.03 percent on each underlying PERAdvantage portfolio.Investments with revenue sharing reduce the asset-basedadministrative fee by the amount of such revenue sharing.
(The Colorado PERA Report on Investment Activity wasprepared by internal staff.)
Investment Section
DEFINED CONTRIBUTION AND DEFERRED COMPENSATION PLANS(Dollars in Thousands)
Colorado PERA Comprehensive Annual Financial Report 2019 � Investment Section 135
Final D
raft
June
12,
202
0

SCHEDULE OF INVESTMENT RESULTSAs of December 31, 2019
Fund/Benchmark 2019 3-Year 5-YearPERAdvantage Capital Preservation Fund 2.3% 2.1% 2.0%
Hueler Stable Value Index (Equal Wtd Avg) 2.5% 2.2% 2.1%
PERAdvantage Fixed Income Fund 9.0% 4.1% 3.0%Bloomberg Barclays U.S. Aggregate Bond Index 8.7% 4.0% 3.1%
PERAdvantage Real Return Fund 12.0% 4.2% 2.4%Real Return Custom Index1 12.2% 4.3% 2.5%
PERAdvantage SRI Fund 19.6% 9.2% 6.5%SRI Custom Index2 20.2% 9.3% 6.5%
PERAdvantage U.S. Large Cap Stock Fund 33.3% 16.1% 11.7%MSCI USA Large Cap Index 31.0% 14.9% 11.4%
PERAdvantage U.S. Small and Mid Cap Stock Fund 28.4% 9.2% 7.7%MSCI USA SMID Cap Index 28.5% 10.6% 9.1%
PERAdvantage International Stock Fund 24.5% 10.0% 5.9%MSCI ACWI ex USA Index 21.5% 9.9% 5.5%
PERAdvantage Income Fund 15.6% 7.0% 5.1%BlackRock LifePath® Retirement Index 15.6% 7.1% 5.2%
PERAdvantage 2025 Fund 18.6% 8.6% 6.2%BlackRock LifePath® 2025 Index 18.5% 8.6% 6.3%
PERAdvantage 2030 Fund 20.8% 9.6% 6.8%BlackRock LifePath® 2030 Index 20.7% 9.6% 6.9%
PERAdvantage 2035 Fund 22.8% 10.5% 7.4%BlackRock LifePath® 2035 Index 22.7% 10.4% 7.4%
PERAdvantage 2040 Fund 24.7% 11.3% 7.9%BlackRock LifePath® 2040 Index 24.6% 11.2% 7.9%
PERAdvantage 2045 Fund 26.0% 11.8% 8.2%BlackRock LifePath® 2045 Index 25.9% 11.7% 8.2%
PERAdvantage 2050 Fund 26.6% 12.0% 8.4%BlackRock LifePath® 2050 Index 26.5% 11.9% 8.3%
PERAdvantage 2055 Fund 26.6% 12.0% 8.4%BlackRock LifePath® 2055 Index 26.6% 11.9% 8.3%
PERAdvantage 2060 Fund 26.6% 11.9% 8.3%BlackRock LifePath® 2060 Index 26.6% 11.9% 8.3%
Note: Performance is net of management and administrative fees. Performance is calculated using time-weighted net asset values. All performance is calculatedby RVK, Inc.
1 Index consists of 70 percent State Street Real Asset Strategy DC Index (25 percent Bloomberg Roll Select Commodity Index, 25 percent S&P GlobalLargeMidCap Commodity and Resources Index, 10 percent S&P Global Infrastructure Index, 15 percent Dow Jones U.S. Select REIT Index, 25 percentBloomberg Barclays U.S. TIPS Index) / 30 percent Bloomberg Barclays U.S. TIPS Index
2 Prior to October, 2019, the SRI Custom Index consisted of 60 percent MSCI World ESG Leaders Index (Net) and 40 percent Bloomberg Barclays U.S.Government Bond Index. After 10/2019, the SRI Custom Index consists of 60 percent MSCI ACW ESG Focus Index (Net) and 40 percent Bloomberg BarclaysU.S. Government Bond Index.
Investment Section
DEFINED CONTRIBUTION AND DEFERRED COMPENSATION PLANS(Dollars in Thousands)
136 Investment Section � Colorado PERA Comprehensive Annual Financial Report 2019
Final D
raft
June
12,
202
0
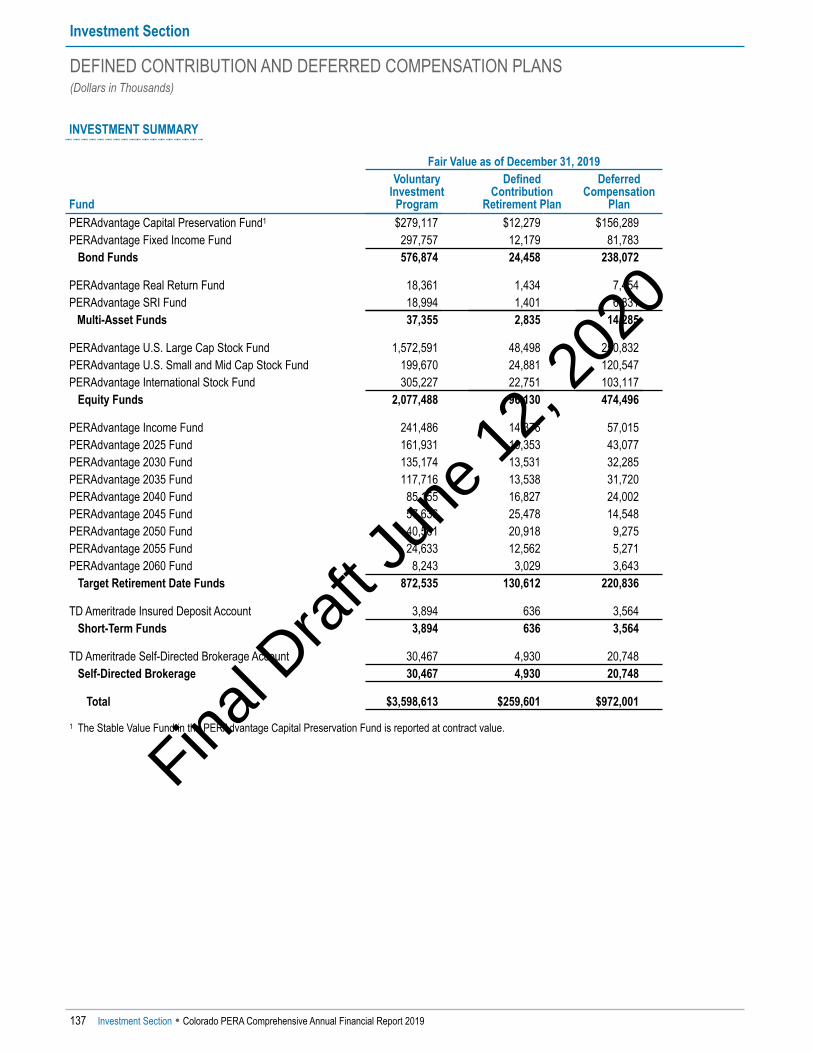
INVESTMENT SUMMARY
Fair Value as of December 31, 2019
Fund
Voluntary Investment
Program
Defined Contribution
Retirement Plan
DeferredCompensation
PlanPERAdvantage Capital Preservation Fund1 $279,117 $12,279 $156,289PERAdvantage Fixed Income Fund 297,757 12,179 81,783 Bond Funds 576,874 24,458 238,072
PERAdvantage Real Return Fund 18,361 1,434 7,454PERAdvantage SRI Fund 18,994 1,401 6,831
Multi-Asset Funds 37,355 2,835 14,285
PERAdvantage U.S. Large Cap Stock Fund 1,572,591 48,498 250,832PERAdvantage U.S. Small and Mid Cap Stock Fund 199,670 24,881 120,547PERAdvantage International Stock Fund 305,227 22,751 103,117 Equity Funds 2,077,488 96,130 474,496
PERAdvantage Income Fund 241,486 14,376 57,015PERAdvantage 2025 Fund 161,931 10,353 43,077PERAdvantage 2030 Fund 135,174 13,531 32,285PERAdvantage 2035 Fund 117,716 13,538 31,720PERAdvantage 2040 Fund 85,155 16,827 24,002PERAdvantage 2045 Fund 57,636 25,478 14,548PERAdvantage 2050 Fund 40,561 20,918 9,275PERAdvantage 2055 Fund 24,633 12,562 5,271PERAdvantage 2060 Fund 8,243 3,029 3,643 Target Retirement Date Funds 872,535 130,612 220,836
TD Ameritrade Insured Deposit Account 3,894 636 3,564 Short-Term Funds 3,894 636 3,564
TD Ameritrade Self-Directed Brokerage Account 30,467 4,930 20,748 Self-Directed Brokerage 30,467 4,930 20,748
Total $3,598,613 $259,601 $972,001
1 The Stable Value Fund in the PERAdvantage Capital Preservation Fund is reported at contract value.
Investment Section
DEFINED CONTRIBUTION AND DEFERRED COMPENSATION PLANS(Dollars in Thousands)
137 Investment Section � Colorado PERA Comprehensive Annual Financial Report 2019
Final D
raft
June
12,
202
0

Voluntary Investment Program Defined Contribution Plan Deferred Compensation Plan
Asset BreakdownAs of December 31, 2019
60%
50%
40%
30%
20%
10%
0%
BondFunds
Multi-AssetFunds
EquityFunds
Target RetirementDate Funds
Short-TermFunds
Self-DirectedBrokerage
16.1%
1.0%
57.7%
24.3%
0.1% 0.8%
9.4%
1.1%
37.1%
50.3%
0.2%1.9%
24.5%
1.5%
48.8%
22.7%
0.4%2.1%
Investment Section
DEFINED CONTRIBUTION AND DEFERRED COMPENSATION PLANS(Dollars in Thousands)
138 Investment Section � Colorado PERA Comprehensive Annual Financial Report 2019
Final D
raft
June
12,
202
0

Final D
raft
June
12,
202
0

Final D
raft
June
12,
202
0

Actuarial Section
ACTUARY'S CERTIFICATION LETTER
Colorado PERA Comprehensive Annual Financial Report 2019 � Actuarial Section 141
Final D
raft
June
12,
202
0
Actuarial Section
ACTUARY'S CERTIFICATION LETTER
142 Actuarial Section � Colorado PERA Comprehensive Annual Financial Report 2019
Final D
raft
June
12,
202
0

Actuarial Section
ACTUARY'S CERTIFICATION LETTER
Colorado PERA Comprehensive Annual Financial Report 2019 � Actuarial Section 143
Final D
raft
June
12,
202
0

Actuarial Section
ACTUARY'S CERTIFICATION LETTER
144 Actuarial Section � Colorado PERA Comprehensive Annual Financial Report 2019
Final D
raft
June
12,
202
0
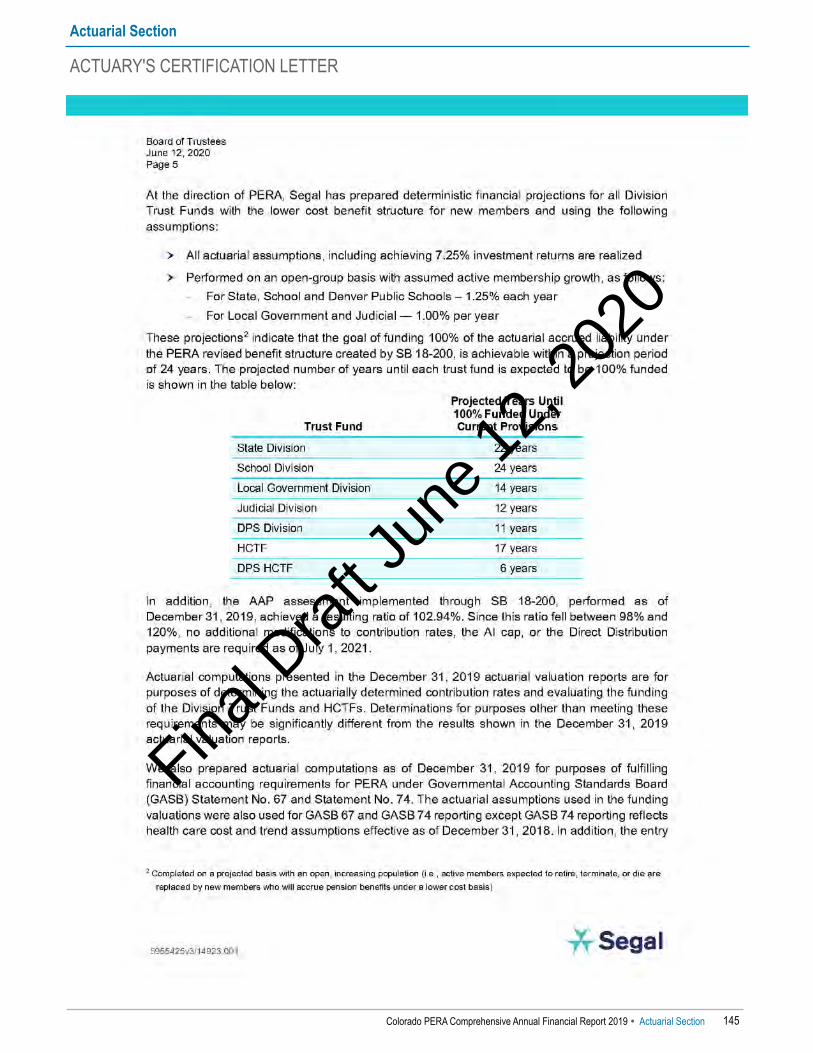
Actuarial Section
ACTUARY'S CERTIFICATION LETTER
Colorado PERA Comprehensive Annual Financial Report 2019 � Actuarial Section 145
Final D
raft
June
12,
202
0

Actuarial Section
ACTUARY'S CERTIFICATION LETTER
146 Actuarial Section � Colorado PERA Comprehensive Annual Financial Report 2019
Final D
raft
June
12,
202
0
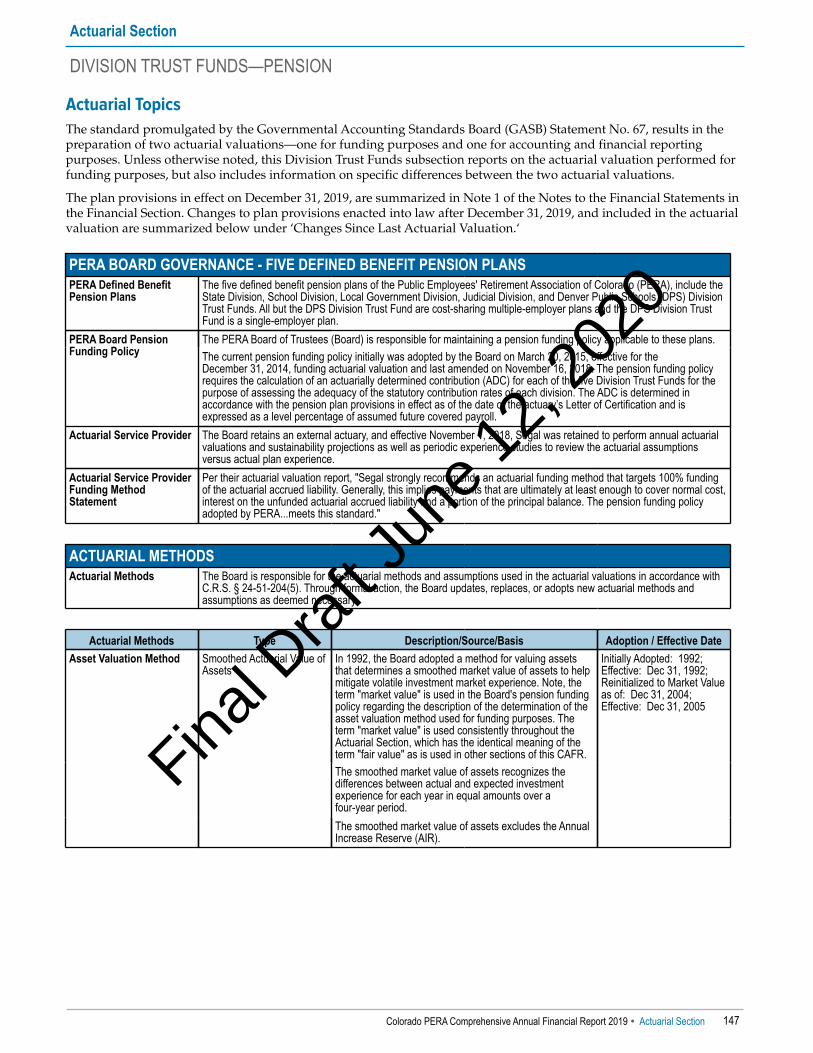
Actuarial TopicsThe standard promulgated by the Governmental Accounting Standards Board (GASB) Statement No. 67, results in thepreparation of two actuarial valuations—one for funding purposes and one for accounting and financial reportingpurposes. Unless otherwise noted, this Division Trust Funds subsection reports on the actuarial valuation performed forfunding purposes, but also includes information on specific differences between the two actuarial valuations.
The plan provisions in effect on December 31, 2019, are summarized in Note 1 of the Notes to the Financial Statements inthe Financial Section. Changes to plan provisions enacted into law after December 31, 2019, and included in the actuarialvaluation are summarized below under ‘Changes Since Last Actuarial Valuation.‘
Actuarial Section
DIVISION TRUST FUNDS—PENSION
Colorado PERA Comprehensive Annual Financial Report 2019 � Actuarial Section 147
PERA BOARD GOVERNANCE - FIVE DEFINED BENEFIT PENSION PLANSPERA Defined BenefitPension Plans
The five defined benefit pension plans of the Public Employees' Retirement Association of Colorado (PERA), include theState Division, School Division, Local Government Division, Judicial Division, and Denver Public Schools (DPS) DivisionTrust Funds. All but the DPS Division Trust Fund are cost-sharing multiple-employer plans and the DPS Division TrustFund is a single-employer plan.
PERA Board PensionFunding Policy
The PERA Board of Trustees (Board) is responsible for maintaining a pension funding policy applicable to these plans.The current pension funding policy initially was adopted by the Board on March 20, 2015, effective for theDecember 31, 2014, funding actuarial valuation and last amended on November 16, 2018. The pension funding policyrequires the calculation of an actuarially determined contribution (ADC) for each of the five Division Trust Funds for thepurpose of assessing the adequacy of the statutory contribution rates of each division. The ADC is determined inaccordance with the pension plan provisions in effect as of the date of the actuary’s Letter of Certification and isexpressed as a level percentage of assumed future covered payroll.
Actuarial Service Provider The Board retains an external actuary, and effective November 1, 2018, Segal was retained to perform annual actuarialvaluations and sustainability projections as well as periodic experience studies to review the actuarial assumptionsversus actual plan experience.
Actuarial Service ProviderFunding MethodStatement
Per their actuarial valuation report, "Segal strongly recommends an actuarial funding method that targets 100% fundingof the actuarial accrued liability. Generally, this implies payments that are ultimately at least enough to cover normal cost,interest on the unfunded actuarial accrued liability and a portion of the principal balance. The pension funding policyadopted by PERA...meets this standard."
ACTUARIAL METHODSActuarial Methods The Board is responsible for the actuarial methods and assumptions used in the actuarial valuations in accordance with
C.R.S. § 24-51-204(5). Through formal action, the Board updates, replaces, or adopts new actuarial methods andassumptions as deemed necessary.
Actuarial Methods Type Description/Source/Basis Adoption / Effective DateAsset Valuation Method Smoothed Actuarial Value of
AssetsIn 1992, the Board adopted a method for valuing assetsthat determines a smoothed market value of assets to helpmitigate volatile investment market experience. Note, theterm "market value" is used in the Board's pension fundingpolicy regarding the description of the determination of theasset valuation method used for funding purposes. Theterm "market value" is used consistently throughout theActuarial Section, which has the identical meaning of theterm "fair value" as is used in other sections of this CAFR.
Initially Adopted: 1992;Effective: Dec 31, 1992;Reinitialized to Market Valueas of: Dec 31, 2004;Effective: Dec 31, 2005
The smoothed market value of assets recognizes thedifferences between actual and expected investmentexperience for each year in equal amounts over a four-year period.The smoothed market value of assets excludes the AnnualIncrease Reserve (AIR).
Final D
raft
June
12,
202
0
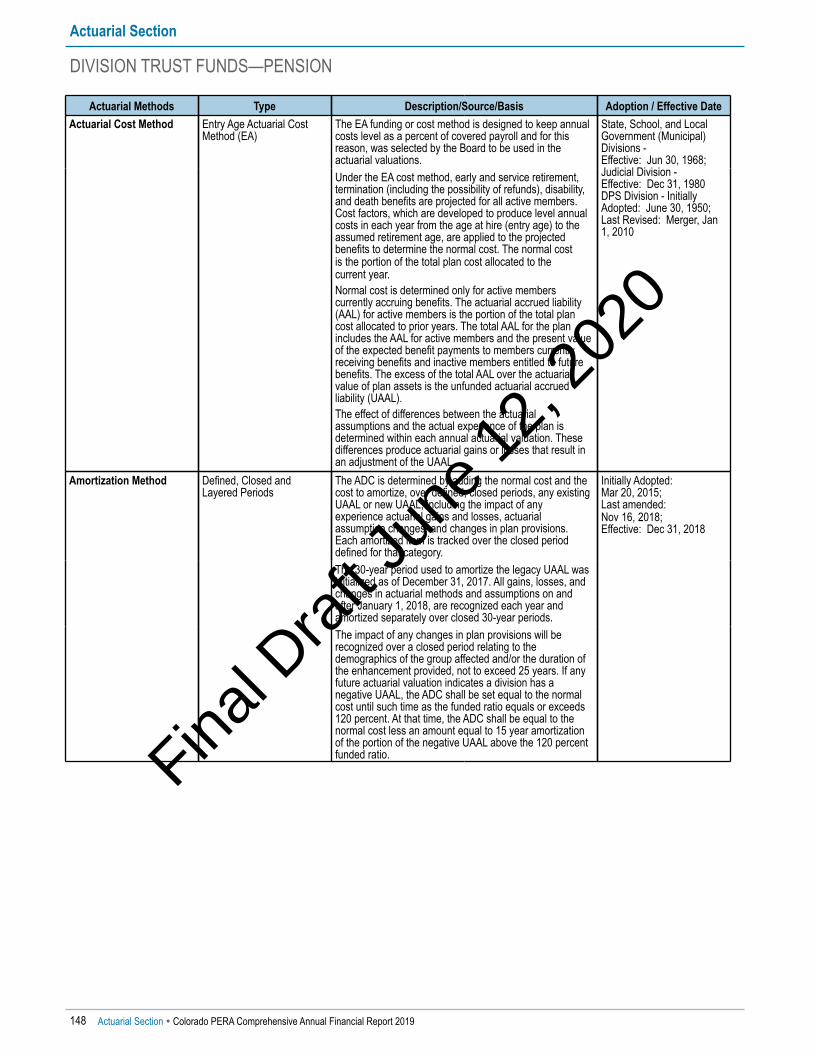
Actuarial Methods Type Description/Source/Basis Adoption / Effective DateActuarial Cost Method Entry Age Actuarial Cost
Method (EA)The EA funding or cost method is designed to keep annualcosts level as a percent of covered payroll and for thisreason, was selected by the Board to be used in theactuarial valuations.
State, School, and LocalGovernment (Municipal)Divisions - Effective: Jun 30, 1968;Judicial Division - Effective: Dec 31, 1980DPS Division - InitiallyAdopted: June 30, 1950;Last Revised: Merger, Jan1, 2010
Under the EA cost method, early and service retirement,termination (including the possibility of refunds), disability,and death benefits are projected for all active members.Cost factors, which are developed to produce level annualcosts in each year from the age at hire (entry age) to theassumed retirement age, are applied to the projectedbenefits to determine the normal cost. The normal costis the portion of the total plan cost allocated to thecurrent year. Normal cost is determined only for active memberscurrently accruing benefits. The actuarial accrued liability(AAL) for active members is the portion of the total plancost allocated to prior years. The total AAL for the planincludes the AAL for active members and the present valueof the expected benefit payments to members currentlyreceiving benefits and inactive members entitled to futurebenefits. The excess of the total AAL over the actuarialvalue of plan assets is the unfunded actuarial accruedliability (UAAL). The effect of differences between the actuarialassumptions and the actual experience of the plan isdetermined within each annual actuarial valuation. Thesedifferences produce actuarial gains or losses that result inan adjustment of the UAAL.
Amortization Method Defined, Closed andLayered Periods
The ADC is determined by adding the normal cost and thecost to amortize, over defined, closed periods, any existingUAAL or new UAAL, including the impact of anyexperience actuarial gains and losses, actuarialassumption changes, and changes in plan provisions.Each amortized item is tracked over the closed perioddefined for that category.
Initially Adopted: Mar 20, 2015;Last amended:Nov 16, 2018;Effective: Dec 31, 2018
The 30-year period used to amortize the legacy UAAL wasinitialized as of December 31, 2017. All gains, losses, andchanges in actuarial methods and assumptions on andafter January 1, 2018, are recognized each year andamortized separately over closed 30-year periods.The impact of any changes in plan provisions will berecognized over a closed period relating to thedemographics of the group affected and/or the duration ofthe enhancement provided, not to exceed 25 years. If anyfuture actuarial valuation indicates a division has anegative UAAL, the ADC shall be set equal to the normalcost until such time as the funded ratio equals or exceeds120 percent. At that time, the ADC shall be equal to thenormal cost less an amount equal to 15 year amortizationof the portion of the negative UAAL above the 120 percentfunded ratio.
Actuarial Section
DIVISION TRUST FUNDS—PENSION
148 Actuarial Section � Colorado PERA Comprehensive Annual Financial Report 2019
Final D
raft
June
12,
202
0

ACTUARIAL ASSUMPTIONSActuarial Assumptions1 Unless otherwise noted, it can be assumed that the economic and demographic actuarial assumptions applied to the
actuarial valuation for funding purposes also were applied to the actuarial valuation for accounting and financialreporting purposes.Periodically, the Board participates in an actuarial assumptions workshop to ensure understanding and to provide for theretention or adoption of all economic and non-economic assumptions under the guidance provided by ActuarialStandards of Practice (ASOP) No. 27, Selection of Economic Assumptions for Measuring Pension Obligations, andASOP No. 35, Selection of Demographic and Other Noneconomic Assumptions for Measuring Pension Obligations, asprescribed by the Actuarial Standards Board. The most recent workshop took place on October 28, 2016. Presentations were given to the Board by the retainedactuary, Cavanaugh Macdonald Consulting, LLC (CMC), which included a detailed description of the results of the 2016experience analysis, review of long-term historical data, the 2016 survey of capital market assumptions by HorizonActuarial Services, LLC, and a log-normal distribution analysis. The Board’s investment consultant, Aon HewittInvestment Consulting, Inc. (Aon), and other actuarial and investment experts also provided their market outlooks. Inaddition, the Board reviewed a variety of current and projected economic and financial information prior to the meeting.Basis for ActuarialAssumptions Used
Unless otherwise noted, the basis of all selected economic and non-economic actuarialassumptions resulted from the 2016 Experience Analysis and/or discussions that tookplace during the October 28, 2016, Assumptions Workshop. It also should be noted thatas a result of the 2019 Asset Liability Study, concluded at the November 15, 2019, Boardmeeting, the Board reaffirmed the 7.25 percent assumed long-term rate of investmentreturn effective as of January 1, 2020.
1 See Exhibits A through I for detailed assumption information.
Economic Assumptions Value(s) / Type Description/Source/Basis Adoption / Effective DateRate of Investment Return 7.25% Long-term assumed rate of investment return represented
as a percent per year, compounded annually, net ofinvestment expenses.
Last Revised: Nov 18, 2016;Effective: Dec 31, 2016
Real Rate of InvestmentReturn
4.85% Long-term assumed rate of real investment return (net ofprice inflation) represented as a percent per year,compounded annually, net of investment expenses.
Price Inflation 2.40% Long-term assumed rate of price inflation represented as apercent per year, compounded annually.
Wage Inflation 3.50% Long-term assumed rate of wage inflation composed ofthe plan’s assumed price inflation and the assumed realwage growth, represented as a percent per year,compounded annually.
Pay Increases Exhibits A, B, C, D, and E Sample pay increase assumptions for individual membersas developed and recommended by the Board’sretained actuary.
Board Crediting InterestRate
3.00% Annually, the Board reviews the rate at which interest iscredited to member accounts. On November 15, 2019, theBoard voted to continue the annual interest rate at 3.00percent for interest earned during 2020. Basis: Board Crediting Interest Rate Policy and Boarddiscussion at the November 15, 2019, Board Meeting.
Annual Review Policyinitiated in 2006, slightrevisions since.Last Adopted: Nov 15, 2019;Effective: Jan 1, 2020
Actuarial Section
DIVISION TRUST FUNDS—PENSION
Colorado PERA Comprehensive Annual Financial Report 2019 � Actuarial Section 149
Final D
raft
June
12,
202
0

Non-EconomicAssumptions Value(s) / Type Description/Source/Basis Adoption / Effective Date
Rates of Withdrawal Ultimate Withdrawal Rates -Exhibits A, B, C, D, and E;Select Rates - Exhibit F
Beginning in 1986, PERA uses a select and ultimateapproach, for all members except State Troopers andmembers of the Judicial Division, in applying rates ofwithdrawal or termination when estimating the number ofmembers who will leave service prior to retirement. As of2016, more than five years had passed since the merger ofthe Denver Public School Retirement System (DPSRS)into PERA, thus, the application of a select period wasdiscontinued for the members in the DPS benefit structure.As a result of the 2016 experience analysis, changes weremade to the withdrawal rates applicable to all members.
Last Revised: Nov 18, 2016;Effective: Dec 31, 2016
Rates of Retirement Reduced Early RetirementRates - Exhibit G
As a result of the 2016 experience analysis, minor changeswere made to the reduced early retirement rates applicableto all members.
Unreduced RetirementRates - Exhibit H
As a result of the 2016 experience analysis, minorincreases were made to all the rates of unreducedretirement and an extension of the certain retirement agefrom age 70 to age 75 was adopted for all members exceptState Troopers.
Rates of Disability Exhibits A, B, C, D, and E As a result of the 2016 experience analysis, the rates ofdisability from active service were decreased at most agesfor the State, School and DPS, and Judicial Divisions,State Troopers, and the DPS benefit structure and slightlyincreased for the Local Government Division.
Rates of Mortality Healthy Pre-RetirementMortality - Exhibits A, B, C, D, and E
RP-2014 White Collar Employee Mortality Table, a tablespecifically developed for pre-retirement mortality foractively working people. To allow for an appropriate marginof improved mortality prospectively, the mortality ratesincorporate a 70 percent factor applied to male rates and a55 percent factor applied to female rates.
Healthy Post-RetirementMortality - Exhibit I
State and Local Government Divisions: RP-2014 HealthyAnnuitant Mortality Table with adjustments for credibilityand gender adjustments of a 73 percent factor applied toages below 80 and a 108 percent factor applied to age 80and above, projected to 2018, for males, and a 78 percentfactor applied to ages below 80 and a 109 percentfactor applied to age 80 and above, projected to 2020,for females.School, DPS, and Judicial Divisions: RP-2014 White CollarHealthy Annuitant Mortality Table with adjustments forcredibility and gender adjustments of a 93 percent factorapplied to ages below 80 and a 113 percent factor appliedto age 80 and above, projected to 2018, for males, and a68 percent factor applied to ages below 80 and a 106percent factor applied to age 80 and above, projected to2020, for females.
Disabled Post-RetirementMortality
RP-2014 Disabled Retiree Mortality Table with a 90 percentfactor applied to both male and female mortality rates.
Rate of Vested TerminatedMembers to RefundMember Account
Non-Judicial - 35% The current assumption is that 35 percent of the vestedmembers who terminate will elect to withdraw theiraccounts while the remaining 65 percent will elect to leavetheir accounts in the plan to be eligible for a benefit atretirement date.
Last Revised: 2009;Effective: Dec 31, 2009
Judicial - 0% The current assumption is that none of the vestedmembers who terminate will elect to withdraw theiraccounts while 100 percent will elect to leave theiraccounts in the plan to be eligible for a benefit atretirement date.
Rate of Non-VestedTerminated Members toRefund Member Account
100% The current assumption is that 100 percent of the non-vested members who terminate will elect to withdrawtheir accounts.
Since inception oftermination benefits, butonly first mentioned inDec 31, 2011 actuarialvaluation report
Actuarial Section
DIVISION TRUST FUNDS—PENSION
150 Actuarial Section � Colorado PERA Comprehensive Annual Financial Report 2019
Final D
raft
June
12,
202
0
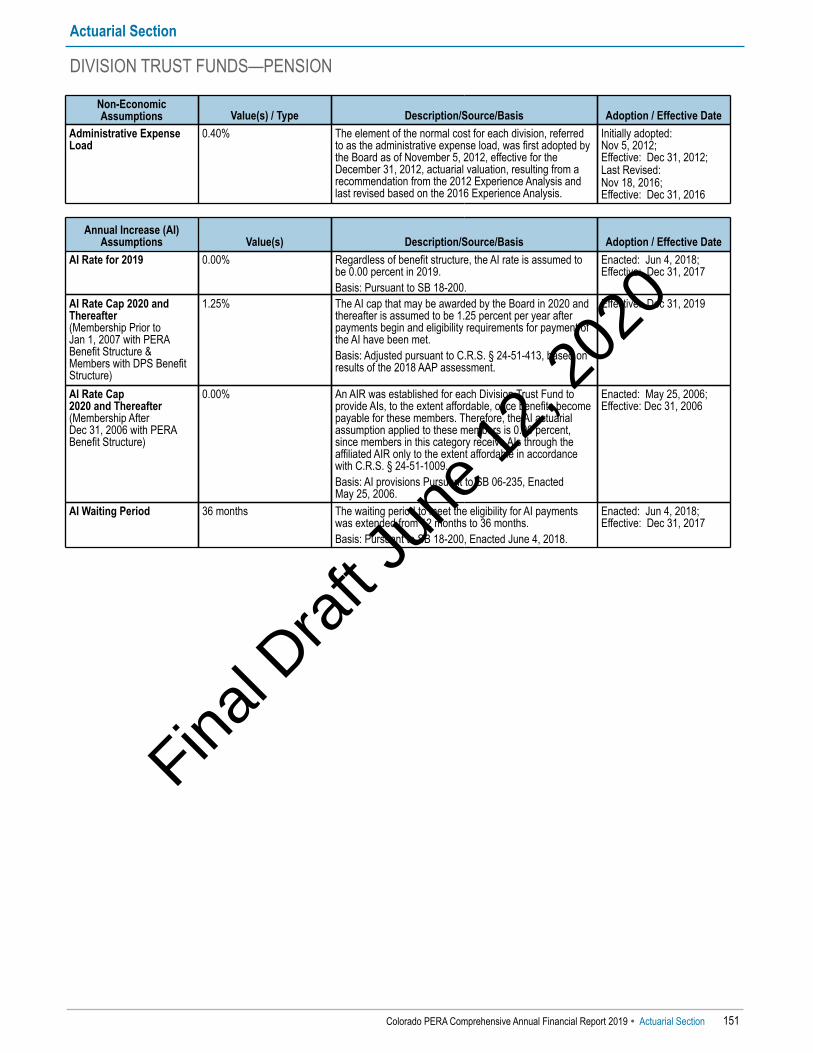
Annual Increase (AI)Assumptions Value(s) Description/Source/Basis Adoption / Effective Date
AI Rate for 2019 0.00% Regardless of benefit structure, the AI rate is assumed tobe 0.00 percent in 2019.Basis: Pursuant to SB 18-200.
Enacted: Jun 4, 2018; Effective: Dec 31, 2017
AI Rate Cap 2020 andThereafter(Membership Prior toJan 1, 2007 with PERABenefit Structure &Members with DPS BenefitStructure)
1.25% The AI cap that may be awarded by the Board in 2020 andthereafter is assumed to be 1.25 percent per year afterpayments begin and eligibility requirements for payment ofthe AI have been met. Basis: Adjusted pursuant to C.R.S. § 24-51-413, based onresults of the 2018 AAP assessment.
Effective: Dec 31, 2019
AI Rate Cap 2020 and Thereafter(Membership AfterDec 31, 2006 with PERABenefit Structure)
0.00% An AIR was established for each Division Trust Fund toprovide AIs, to the extent affordable, once benefits becomepayable for these members. Therefore, the AI actuarialassumption applied to these members is 0.00 percent,since members in this category receive AIs through theaffiliated AIR only to the extent affordable in accordancewith C.R.S. § 24-51-1009. Basis: AI provisions Pursuant to SB 06-235, EnactedMay 25, 2006.
Enacted: May 25, 2006; Effective: Dec 31, 2006
AI Waiting Period 36 months The waiting period to meet the eligibility for AI paymentswas extended from 12 months to 36 months.Basis: Pursuant to SB 18-200, Enacted June 4, 2018.
Enacted: Jun 4, 2018; Effective: Dec 31, 2017
Non-EconomicAssumptions Value(s) / Type Description/Source/Basis Adoption / Effective Date
Administrative ExpenseLoad
0.40% The element of the normal cost for each division, referredto as the administrative expense load, was first adopted bythe Board as of November 5, 2012, effective for theDecember 31, 2012, actuarial valuation, resulting from arecommendation from the 2012 Experience Analysis andlast revised based on the 2016 Experience Analysis.
Initially adopted: Nov 5, 2012; Effective: Dec 31, 2012; Last Revised: Nov 18, 2016;Effective: Dec 31, 2016
Actuarial Section
DIVISION TRUST FUNDS—PENSION
Colorado PERA Comprehensive Annual Financial Report 2019 � Actuarial Section 151
Final D
raft
June
12,
202
0
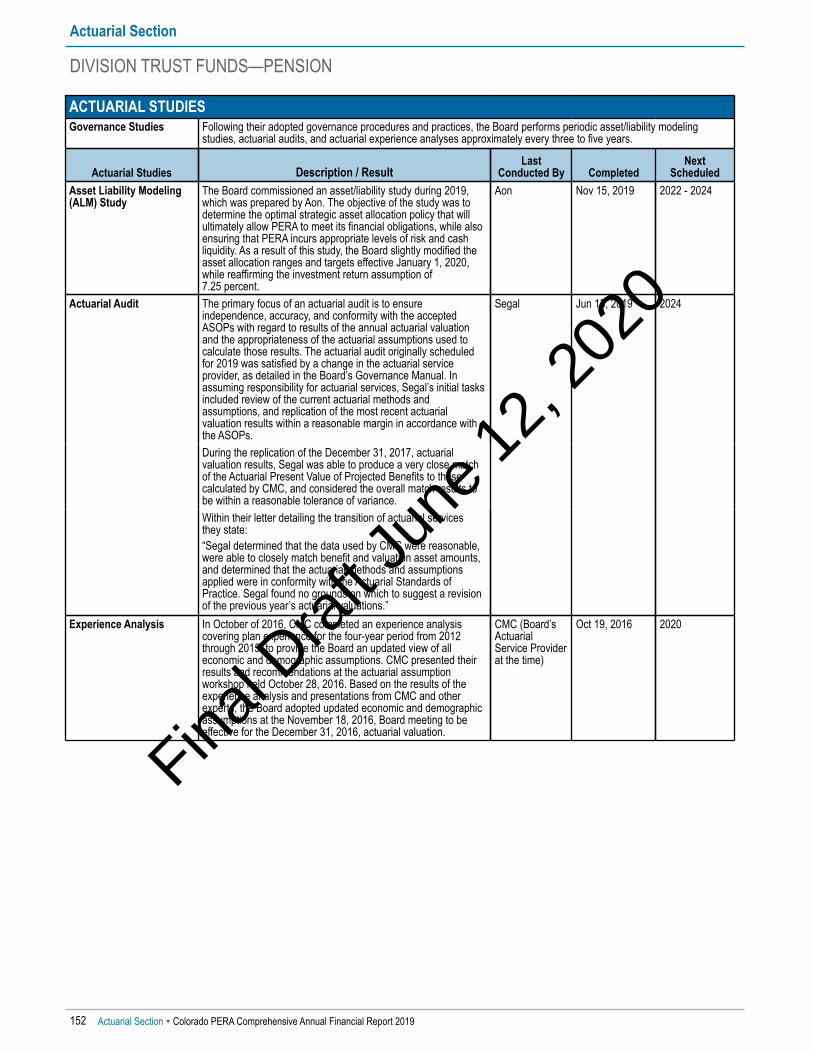
ACTUARIAL STUDIESGovernance Studies Following their adopted governance procedures and practices, the Board performs periodic asset/liability modeling
studies, actuarial audits, and actuarial experience analyses approximately every three to five years.
Actuarial Studies Description / ResultLast
Conducted By CompletedNext
ScheduledAsset Liability Modeling(ALM) Study
The Board commissioned an asset/liability study during 2019,which was prepared by Aon. The objective of the study was todetermine the optimal strategic asset allocation policy that willultimately allow PERA to meet its financial obligations, while alsoensuring that PERA incurs appropriate levels of risk and cashliquidity. As a result of this study, the Board slightly modified theasset allocation ranges and targets effective January 1, 2020,while reaffirming the investment return assumption of7.25 percent.
Aon Nov 15, 2019 2022 - 2024
Actuarial Audit The primary focus of an actuarial audit is to ensureindependence, accuracy, and conformity with the acceptedASOPs with regard to results of the annual actuarial valuationand the appropriateness of the actuarial assumptions used tocalculate those results. The actuarial audit originally scheduledfor 2019 was satisfied by a change in the actuarial serviceprovider, as detailed in the Board’s Governance Manual. Inassuming responsibility for actuarial services, Segal’s initial tasksincluded review of the current actuarial methods andassumptions, and replication of the most recent actuarialvaluation results within a reasonable margin in accordance withthe ASOPs.
Segal Jun 13, 2019 2024
During the replication of the December 31, 2017, actuarialvaluation results, Segal was able to produce a very close matchof the Actuarial Present Value of Projected Benefits to thosecalculated by CMC, and considered the overall match results tobe within a reasonable tolerance of variance.Within their letter detailing the transition of actuarial servicesthey state: “Segal determined that the data used by CMC were reasonable,were able to closely match benefit and valuation asset amounts,and determined that the actuarial methods and assumptionsapplied were in conformity with the Actuarial Standards ofPractice. Segal found no grounds on which to suggest a revisionof the previous year’s actuarial valuations.”
Experience Analysis In October of 2016, CMC completed an experience analysiscovering plan experience for the four-year period from 2012through 2015, to provide the Board an updated view of alleconomic and demographic assumptions. CMC presented theirresults and recommendations at the actuarial assumptionworkshop held October 28, 2016. Based on the results of theexperience analysis and presentations from CMC and otherexperts, the Board adopted updated economic and demographicassumptions at the November 18, 2016, Board meeting to beeffective for the December 31, 2016, actuarial valuation.
CMC (Board’sActuarialService Providerat the time)
Oct 19, 2016 2020
Actuarial Section
DIVISION TRUST FUNDS—PENSION
152 Actuarial Section � Colorado PERA Comprehensive Annual Financial Report 2019
Final D
raft
June
12,
202
0

CHANGES SINCE LAST ACTUARIAL VALUATIONChanges in ActuarialMethods
There are no changes in actuarial methods incorporated in the December 31, 2019, actuarial valuation, since the lastactuarial valuation as of December 31, 2018.
Changes in ActuarialAssumptions
Except for the AI assumption described below, there are no changes in economic and demographic actuarialassumptions incorporated in the December 31, 2019, actuarial valuation, since the last actuarial valuation as ofDecember 31, 2018.• Due to the results of the 2018 AAP assessment, the assumed AI cap was decreased from 1.50 percent to
1.25 percent, applicable to PERA benefit structure members with a membership date prior to January 1, 2007, andDPS benefit structure members. Since this assumption used to value the AI cap is driven by the change in AI capbenefit provisions, the impact of the change in assumption from 1.50 percent to 1.25 percent is fully recognized asa "Change in Plan Provisions," as noted below.
Changes in PlanProvisions
Due to the results of the 2018 AAP assessment, the following are changes to contribution and AI provisions applicable toall five Division Trust Funds incorporated in the December 31, 2019, actuarial valuation, since the last actuarial valuationas of December 31, 2018.• The member contribution rate for all members increases by 0.50 percent of pay effective July 1, 2020.• The employer contribution rate for all employers increases by 0.50 percent of pay effective July 1, 2020.• The AI cap decreases from 1.50 percent to 1.25 percent, effective as of July 1, 2020. For employees of employers of the State and Local Government Divisions, hired on or after January 1, 2019, who choseto participate in the PERAChoice Defined Contribution (DC) Plan in lieu of participating in PERA's Defined Benefit (DB)Plan, a DC Supplement is paid to the DB Plan to help fund the unfunded actuarial accrued liability. Although enacted in2018 pursuant to SB 18-200, the DC Supplement is first determined based on the results of the December 31, 2019,actuarial valuation, and is calculated separately for the State and Local Government Divisions as a rate of pay. Thisannually determined supplemental contribution will be payable beginning January 1, 2021, by all employers of thetwo divisions.Pursuant to HB 20-1379 and HB 20-1394, enacted in response to budgetary needs due to the COVID-19 pandemic,contribution rates of employers and members, as well as the direct distribution from the State are impacted as follows:• HB 20-1379 suspends the July 1, 2020, payment of the $225 million direct distribution allocated to the State, School,
Judicial, and DPS Divisions, as required under SB 18-200.• HB 20-1394 requires five percent of the Judicial Division base employer contribution rate to be paid by the members
of the Judicial Division for the State's 2020-21 and 2021-22 fiscal years. This contribution rate modification does notapply to judges employed by the Denver County Court within the Judicial Division.
SIGNIFICANT EVENTSIn response to budgetary concerns of the State of Colorado due to the COVID-19 pandemic, legislation was enacted during June 2020. The keyelements of this legislation are listed below. Note that HB 20-1394 directly affects contribution provisions which are reflected within the actuarialvaluation results presented in this Actuarial Section and both HB 20-1379 and HB 20-1394 have an immediate and continuing impact on theamortization periods of the Division Trust Funds as discussed in the Letter of Transmittal, the MD&A and this Actuarial Section:• HB 20-1379 suspends the July 1, 2020, payment of the $225 million Direct Distribution allocated to the State, School, Judicial, and DPS Divisions,
as required under SB 18-200. • HB 20-1394 modifies the source of the dollars otherwise anticipated to be contributed to the pension plan over the next three-year period (plan
years 2020-2022) by requiring five percent of the Judicial Division base employer contribution rate to be paid by the members of the JudicialDivision for the State's 2020-21 and 2021-22 fiscal years. For the State's 2020-21 fiscal year, the employer contribution rate is decreased from13.91 percent to 8.91 percent of salary and the member contribution rate is increased from 9.5 percent to 14.5 percent of salary. For the State's2021-22 fiscal year, the employer contribution rate is decreased from 13.91 percent to 8.91 percent of salary and the member contribution rate isincreased from 10.0 percent to 15.0 percent of salary. This contribution rate modification does not apply to judges employed by the DenverCounty Court within the Judicial Division.
Actuarial Section
DIVISION TRUST FUNDS—PENSION
Colorado PERA Comprehensive Annual Financial Report 2019 � Actuarial Section 153
Final D
raft
June
12,
202
0

DIFFERENCES IN ACTUARIAL VALUATION METHODS AND ASSUMPTIONS• The actuarial valuation for funding purposes was performed as of December 31, 2019. The actuarial valuation for accounting and financial
reporting purposes was performed as of December 31, 2018, and the total pension liability (TPL) was rolled forward to the measurement date asof December 31, 2019.
• Census data used for the actuarial valuation for funding purposes reflects membership data as of December 31, 2019, and the census data usedfor the actuarial valuation for accounting and financial reporting purposes reflects membership data as of December 31, 2018. Therefore, allsummaries and schedules, regarding actuarial valuation results for funding purposes, shown in the Actuarial Section, reflect census data as ofDecember 31, 2019.
• The actuarial valuation for funding purposes applies an asset valuation method that recognizes a four-year smoothed market value of assets forpurposes of determining the UAAL. The actuarial valuation for accounting and financial reporting purposes applies the fair value of assets todetermine the net pension liability.
• The actuarial valuation for funding purposes does not apply an AI assumption for members of the PERA benefit structure hired on or afterJanuary 1, 2007, in the determination of the AAL. Therefore, the ADC established by the funding valuation does not consider future increases forthis member group and the assets attributable to the AIR are not included in the actuarial value of assets. A separate annual actuarial valuation isperformed on the AIR to determine the applicable AI payable to eligible members after benefit commencement. AIR plan provisions are deemedsubstantively automatic, ad hoc cost-of-living adjustments. Liabilities associated with the AIR statutorily can never exceed available assets. As aresult, the actuarial valuation for accounting and financial reporting purposes includes the balance of the AIR both in the plan assets, at fair value,and in the TPL of the applicable division.
• The actuarial valuation for funding purposes as of December 31, 2019, reflects, to the extent applicable, the revised plan provisions for the State,School, Judicial, and DPS Divisions pursuant to HB 20-1379 and HB 20-1394 as described above. The actuarial valuation for accounting andfinancial reporting purposes does not reflect these changes to plan provisions as this legislation was passed into law after the December 31, 2019,measurement date.
Actuarial Section
DIVISION TRUST FUNDS—PENSION
154 Actuarial Section � Colorado PERA Comprehensive Annual Financial Report 2019
Final D
raft
June
12,
202
0

Actuarial Assumptions: Exhibits A–I
Actuarial Section
DIVISION TRUST FUNDS—PENSION
Colorado PERA Comprehensive Annual Financial Report 2019 � Actuarial Section 155
Exhibit A: Separations from Employment Before Retirement and Individual Pay IncreaseAssumptions—State Division
Percent of MembersSeparating Within the Next Year
Pay Increase Assumptionsfor an Individual Member
Ultimate Withdrawal1 Death2 Disability Meritand
Seniority
Inflationand
Productivity
TotalIncrease
(Next Year)Sample Ages Male Female Male Female Male FemaleState Members (Other Than State Troopers)20 30.00% 20.00% 0.020% 0.008% 0.01% 0.01% 5.67% 3.50% 9.17%25 10.00% 14.50% 0.024% 0.008% 0.01% 0.01% 3.75% 3.50% 7.25%30 7.00% 10.00% 0.022% 0.010% 0.01% 0.01% 2.80% 3.50% 6.30%35 6.00% 7.50% 0.026% 0.013% 0.03% 0.03% 2.05% 3.50% 5.55%40 5.00% 6.75% 0.031% 0.018% 0.05% 0.05% 1.50% 3.50% 5.00%
45 4.25% 5.50% 0.048% 0.031% 0.09% 0.09% 0.85% 3.50% 4.35%50 4.25% 5.25% 0.083% 0.051% 0.20% 0.20% 0.50% 3.50% 4.00%55 4.25% 5.25% 0.137% 0.078% 0.27% 0.27% 0.10% 3.50% 3.60%60 4.25% 5.25% 0.230% 0.113% 0.30% 0.30% 0.00% 3.50% 3.50%65 4.25% 5.25% 0.406% 0.172% 0.30% 0.30% 0.00% 3.50% 3.50%70 4.25% 5.25% 0.720% 0.299% 0.30% 0.30% 0.00% 3.50% 3.50%
State Troopers20 8.00% 8.00% 0.020% 0.008% 0.01% 0.01% 5.50% 3.50% 9.00%25 6.00% 6.00% 0.024% 0.008% 0.02% 0.02% 3.75% 3.50% 7.25%30 4.00% 4.00% 0.022% 0.010% 0.04% 0.04% 2.80% 3.50% 6.30%35 3.75% 3.75% 0.026% 0.013% 0.06% 0.06% 2.05% 3.50% 5.55%40 3.00% 3.00% 0.031% 0.018% 0.10% 0.10% 1.50% 3.50% 5.00%
45 3.00% 3.00% 0.048% 0.031% 0.25% 0.25% 1.20% 3.50% 4.70%50 3.00% 3.00% 0.083% 0.051% 0.30% 0.30% 0.80% 3.50% 4.30%55 3.00% 3.00% 0.137% 0.078% 0.30% 0.30% 0.40% 3.50% 3.90%60 3.00% 3.00% 0.230% 0.113% 0.30% 0.30% 0.00% 3.50% 3.50%65 3.00% 3.00% 0.406% 0.172% 0.30% 0.30% 0.00% 3.50% 3.50%70 3.00% 3.00% 0.720% 0.299% 0.30% 0.30% 0.00% 3.50% 3.50%
1 There are no select withdrawal assumptions for State Troopers. 2 Rates are shown for active members. Separate post-retirement and disability mortality tables are used for retirees.
Final D
raft
June
12,
202
0
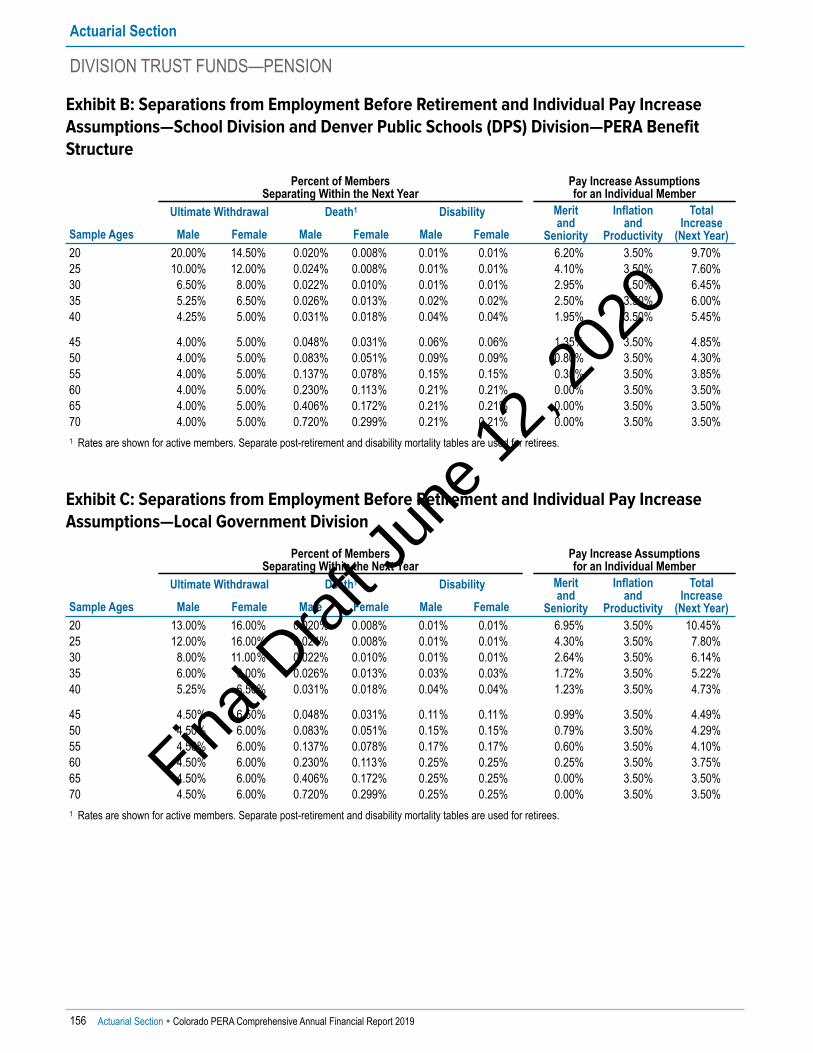
Exhibit B: Separations from Employment Before Retirement and Individual Pay IncreaseAssumptions—School Division and Denver Public Schools (DPS) Division—PERA BenefitStructure
Percent of Members Separating Within the Next Year
Pay Increase Assumptions for an Individual Member
Ultimate Withdrawal Death1 Disability Merit and
Seniority
Inflation and
Productivity
Total Increase
(Next Year)Sample Ages Male Female Male Female Male Female20 20.00% 14.50% 0.020% 0.008% 0.01% 0.01% 6.20% 3.50% 9.70%25 10.00% 12.00% 0.024% 0.008% 0.01% 0.01% 4.10% 3.50% 7.60%30 6.50% 8.00% 0.022% 0.010% 0.01% 0.01% 2.95% 3.50% 6.45%35 5.25% 6.50% 0.026% 0.013% 0.02% 0.02% 2.50% 3.50% 6.00%40 4.25% 5.00% 0.031% 0.018% 0.04% 0.04% 1.95% 3.50% 5.45%
45 4.00% 5.00% 0.048% 0.031% 0.06% 0.06% 1.35% 3.50% 4.85%50 4.00% 5.00% 0.083% 0.051% 0.09% 0.09% 0.80% 3.50% 4.30%55 4.00% 5.00% 0.137% 0.078% 0.15% 0.15% 0.35% 3.50% 3.85%60 4.00% 5.00% 0.230% 0.113% 0.21% 0.21% 0.00% 3.50% 3.50%65 4.00% 5.00% 0.406% 0.172% 0.21% 0.21% 0.00% 3.50% 3.50%70 4.00% 5.00% 0.720% 0.299% 0.21% 0.21% 0.00% 3.50% 3.50%
1 Rates are shown for active members. Separate post-retirement and disability mortality tables are used for retirees.
Actuarial Section
DIVISION TRUST FUNDS—PENSION
156 Actuarial Section � Colorado PERA Comprehensive Annual Financial Report 2019
Exhibit C: Separations from Employment Before Retirement and Individual Pay IncreaseAssumptions—Local Government Division
Percent of Members Separating Within the Next Year
Pay Increase Assumptions for an Individual Member
Ultimate Withdrawal Death1 Disability Merit and
Seniority
Inflation and
Productivity
Total Increase
(Next Year)Sample Ages Male Female Male Female Male Female20 13.00% 16.00% 0.020% 0.008% 0.01% 0.01% 6.95% 3.50% 10.45%25 12.00% 16.00% 0.024% 0.008% 0.01% 0.01% 4.30% 3.50% 7.80%30 8.00% 11.00% 0.022% 0.010% 0.01% 0.01% 2.64% 3.50% 6.14%35 6.00% 9.00% 0.026% 0.013% 0.03% 0.03% 1.72% 3.50% 5.22%40 5.25% 6.50% 0.031% 0.018% 0.04% 0.04% 1.23% 3.50% 4.73%
45 4.50% 6.50% 0.048% 0.031% 0.11% 0.11% 0.99% 3.50% 4.49%50 4.50% 6.00% 0.083% 0.051% 0.15% 0.15% 0.79% 3.50% 4.29%55 4.50% 6.00% 0.137% 0.078% 0.17% 0.17% 0.60% 3.50% 4.10%60 4.50% 6.00% 0.230% 0.113% 0.25% 0.25% 0.25% 3.50% 3.75%65 4.50% 6.00% 0.406% 0.172% 0.25% 0.25% 0.00% 3.50% 3.50%70 4.50% 6.00% 0.720% 0.299% 0.25% 0.25% 0.00% 3.50% 3.50%
1 Rates are shown for active members. Separate post-retirement and disability mortality tables are used for retirees.
Final D
raft
June
12,
202
0
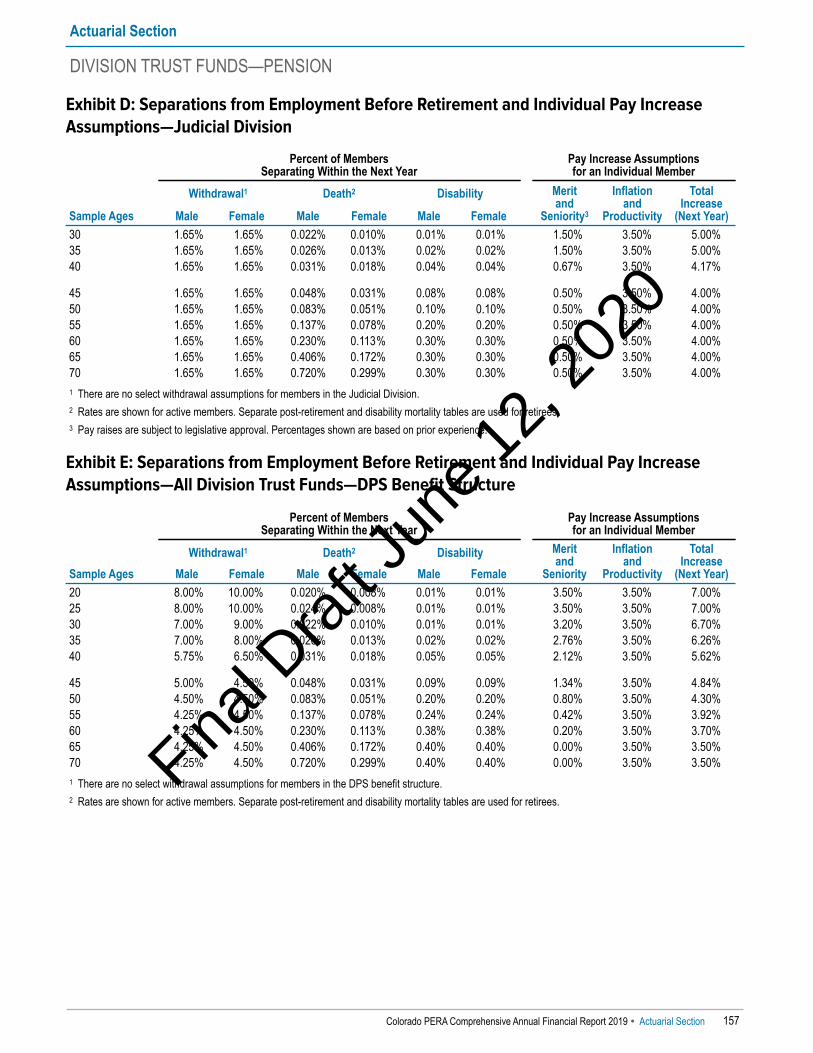
Exhibit D: Separations from Employment Before Retirement and Individual Pay IncreaseAssumptions—Judicial Division
Percent of Members Separating Within the Next Year
Pay Increase Assumptions for an Individual Member
Withdrawal1 Death2 Disability Merit and
Seniority3
Inflation and
Productivity
Total Increase
(Next Year)Sample Ages Male Female Male Female Male Female30 1.65% 1.65% 0.022% 0.010% 0.01% 0.01% 1.50% 3.50% 5.00%35 1.65% 1.65% 0.026% 0.013% 0.02% 0.02% 1.50% 3.50% 5.00%40 1.65% 1.65% 0.031% 0.018% 0.04% 0.04% 0.67% 3.50% 4.17%
45 1.65% 1.65% 0.048% 0.031% 0.08% 0.08% 0.50% 3.50% 4.00%50 1.65% 1.65% 0.083% 0.051% 0.10% 0.10% 0.50% 3.50% 4.00%55 1.65% 1.65% 0.137% 0.078% 0.20% 0.20% 0.50% 3.50% 4.00%60 1.65% 1.65% 0.230% 0.113% 0.30% 0.30% 0.50% 3.50% 4.00%65 1.65% 1.65% 0.406% 0.172% 0.30% 0.30% 0.50% 3.50% 4.00%70 1.65% 1.65% 0.720% 0.299% 0.30% 0.30% 0.50% 3.50% 4.00%
1 There are no select withdrawal assumptions for members in the Judicial Division. 2 Rates are shown for active members. Separate post-retirement and disability mortality tables are used for retirees. 3 Pay raises are subject to legislative approval. Percentages shown are based on prior experience.
Actuarial Section
DIVISION TRUST FUNDS—PENSION
Colorado PERA Comprehensive Annual Financial Report 2019 � Actuarial Section 157
Exhibit E: Separations from Employment Before Retirement and Individual Pay IncreaseAssumptions—All Division Trust Funds—DPS Benefit Structure
Percent of Members Separating Within the Next Year
Pay Increase Assumptions for an Individual Member
Withdrawal1 Death2 Disability Merit and
Seniority
Inflation and
Productivity
Total Increase
(Next Year)Sample Ages Male Female Male Female Male Female20 8.00% 10.00% 0.020% 0.008% 0.01% 0.01% 3.50% 3.50% 7.00%25 8.00% 10.00% 0.024% 0.008% 0.01% 0.01% 3.50% 3.50% 7.00%30 7.00% 9.00% 0.022% 0.010% 0.01% 0.01% 3.20% 3.50% 6.70%35 7.00% 8.00% 0.026% 0.013% 0.02% 0.02% 2.76% 3.50% 6.26%40 5.75% 6.50% 0.031% 0.018% 0.05% 0.05% 2.12% 3.50% 5.62%
45 5.00% 4.50% 0.048% 0.031% 0.09% 0.09% 1.34% 3.50% 4.84%50 4.50% 4.50% 0.083% 0.051% 0.20% 0.20% 0.80% 3.50% 4.30%55 4.25% 4.50% 0.137% 0.078% 0.24% 0.24% 0.42% 3.50% 3.92%60 4.25% 4.50% 0.230% 0.113% 0.38% 0.38% 0.20% 3.50% 3.70%65 4.25% 4.50% 0.406% 0.172% 0.40% 0.40% 0.00% 3.50% 3.50%70 4.25% 4.50% 0.720% 0.299% 0.40% 0.40% 0.00% 3.50% 3.50%
1 There are no select withdrawal assumptions for members in the DPS benefit structure. 2 Rates are shown for active members. Separate post-retirement and disability mortality tables are used for retirees.
Final D
raft
June
12,
202
0

Exhibit F: Select Rates of Separation Assumptions—State Division, School and DPS Divisions,and Local Government Division
Percent of Members With Less Than Five Years of Service Withdrawing from Employment Next Year1
Completed Years of Service
State Division School and DPS Divisions2 Local Government DivisionMale Female Male Female Male Female
0 41.5% 41.5% 37.0% 34.0% 41.0% 39.0%1 20.5% 21.5% 21.0% 20.0% 24.0% 23.0%2 14.5% 16.0% 16.0% 15.0% 17.0% 18.0%3 11.5% 13.0% 12.0% 12.0% 12.0% 14.0%4 9.5% 11.5% 11.0% 11.0% 10.0% 11.0%
1 There are no select withdrawal assumptions for State Troopers or Judicial Division members. 2 Rates shown are for PERA benefit structure members in the School or DPS Divisions. Effective December 31, 2016, a select withdrawal period is no longer
applied to members in the DPS benefit structure.
Actuarial Section
DIVISION TRUST FUNDS—PENSION
158 Actuarial Section � Colorado PERA Comprehensive Annual Financial Report 2019
Exhibit G: Percent of Members Eligible for Reduced Retirement Benefits Retiring Next Year
Retirement Ages
State Division State Troopers
School and DPSDivisions1
Local GovernmentDivision Judicial
Division
DPS BenefitStructure2
Male Female Male Female Male Female Male Female50 9.5% 10.0% 10.0% 8.0% 8.0% 8.0% 9.0% 6.0% 8.0% 5.0%51 9.5% 10.0% 10.0% 8.0% 8.0% 8.0% 9.0% 6.0% 8.0% 5.0%52 9.5% 10.0% 10.0% 8.0% 8.0% 8.0% 9.0% 6.0% 8.0% 5.0%53 9.5% 10.0% 10.0% 8.0% 8.0% 8.0% 9.0% 6.0% 8.0% 10.0%54 9.5% 10.0% 10.0% 10.0% 10.0% 8.0% 9.0% 6.0% 11.0% 10.0%
55 9.5% 10.0% 5.0% 10.0% 10.0% 8.0% 12.0% 6.0% 11.0% 10.0%56 9.5% 10.0% 5.0% 10.0% 11.0% 8.0% 12.0% 6.0% 11.0% 10.0%57 9.5% 10.0% 5.0% 10.0% 11.0% 8.0% 12.0% 6.0% 11.0% 10.0%58 9.5% 10.0% 5.0% 10.0% 11.0% 8.0% 12.0% 6.0% 11.0% 10.0%59 9.5% 10.0% 5.0% 10.0% 11.0% 10.0% 11.5% 6.0% 15.0% 12.0%
60 9.5% 10.0% 10.0% 10.0% 11.0% 11.0% 11.5% 8.0% 15.0% 15.0%61 9.5% 10.0% 10.0% 12.0% 11.0% 11.0% 11.5% 8.0% 17.0% 15.0%62 9.5% 10.0% 10.0% 12.0% 11.0% 11.0% 11.5% 8.0% 17.0% 15.0%63 9.5% 10.0% 10.0% 12.0% 11.0% 11.0% 11.5% 8.0% 17.0% 15.0%64 9.5% 10.0% 10.0% 12.0% 11.0% 11.0% 11.5% 8.0% 17.0% 15.0%65 and over 0.0% 0.0% 0.0% 0.0% 0.0% 0.0% 0.0% 0.0% 0.0% 0.0%
1 Rates shown are for PERA benefit structure members in the School or DPS Divisions. 2 Rates shown are for DPS benefit structure members in any division.Fina
l Dra
ft Ju
ne 1
2, 2
020

Exhibit H: Percent of Members Eligible for Unreduced Retirement Benefits Retiring Next Year
Retirement Ages
State Division State Troopers1
School and DPSDivisions2
Local GovernmentDivision Judicial
Division
DPS BenefitStructure3
Male Female Male Female Male Female Male Female50 60% 55% 40% 55% 60% 60% 60% 6% 40% 40%51 50% 40% 32% 48% 54% 46% 52% 6% 40% 40%52 42% 36% 32% 46% 48% 30% 40% 6% 35% 30%53 38% 34% 32% 42% 42% 25% 40% 6% 35% 30%54 32% 26% 32% 40% 40% 22% 40% 6% 30% 30%
55 25% 25% 32% 28% 29% 22% 28% 6% 30% 30%56 20% 24% 32% 25% 25% 25% 30% 6% 20% 25%57 20% 20% 32% 25% 25% 22% 21% 6% 24% 25%58 18% 18% 32% 22% 22% 20% 21% 6% 22% 20%59 20% 18% 32% 22% 22% 20% 21% 6% 25% 24%
60 20% 21% 32% 25% 25% 22% 21% 8% 22% 30%61 18% 18% 32% 25% 24% 22% 20% 8% 20% 28%62 22% 19% 32% 24% 27% 24% 27% 8% 25% 30%63 20% 19% 32% 24% 24% 25% 22% 8% 40% 30%64 20% 19% 32% 24% 24% 25% 22% 8% 20% 30%
65 24% 22% 100% 27% 26% 25% 25% 15% 30% 35%66 26% 26% 100% 28% 28% 30% 25% 15% 30% 35%67 25% 24% 100% 25% 25% 20% 30% 15% 30% 32%68 22% 25% 100% 24% 22% 25% 20% 15% 30% 30%69 22% 24% 100% 24% 22% 25% 20% 15% 30% 30%
70 25% 25% 100% 22% 25% 25% 24% 40% 30% 30%71 25% 25% 100% 22% 23% 25% 24% 40% 30% 30%72 25% 25% 100% 22% 23% 25% 24% 40% 30% 30%73 25% 25% 100% 22% 23% 25% 24% 40% 30% 30%74 25% 25% 100% 22% 23% 25% 24% 40% 30% 30%75 and over 100% 100% 100% 100% 100% 100% 100% 100% 100% 100%
1 For State Troopers prior to age 50, it is assumed that 40 percent of the eligible members will retire at each age from age 45 through age 49. 2 Rates shown are for PERA benefit structure members in the School or DPS Divisions. 3 Rates shown are for DPS benefit structure members in any division.
Actuarial Section
DIVISION TRUST FUNDS—PENSION
Colorado PERA Comprehensive Annual Financial Report 2019 � Actuarial Section 159
Final D
raft
June
12,
202
0

Exhibit I: Rates of Post-Retirement Mortality and Single Life Retirement Values1 (In Actual Dollars)
MORTALITY ASSUMPTIONS–STATE AND LOCAL GOVERNMENT DIVISIONS
Sample Attained Ages
Percent of Retirees Deceasing Within the Next Year
Present Value of $1 Monthly for Life
Present Value of $1 MonthlyIncreasing 1.25% Annually
Future Life Expectancy in Years
Male Female Male Female Male Female Male Female40 0.031% 0.018% $159.33 $161.37 $186.55 $189.59 43.92 46.2945 0.048% 0.031% 154.77 157.53 179.82 183.74 39.00 41.3450 0.297% 0.198% 148.50 152.23 171.07 176.09 34.11 36.4155 0.458% 0.277% 142.13 146.36 162.18 167.71 29.67 31.8060 0.635% 0.393% 134.41 138.72 151.74 157.27 25.40 27.26
65 0.831% 0.595% 124.54 128.88 138.93 144.41 21.22 22.8470 1.185% 0.965% 111.83 116.53 123.14 128.94 17.14 18.5975 1.830% 1.627% 95.82 101.49 104.11 110.84 13.21 14.5880 3.824% 3.123% 76.84 84.09 82.49 90.71 9.59 10.9285 7.940% 6.061% 59.12 66.51 62.88 70.99 6.77 7.89
MORTALITY ASSUMPTIONS–SCHOOL, DPS, AND JUDICIAL DIVISIONS
Sample Attained Ages
Percent of Retirees Deceasing Within the Next Year
Present Value of $1 Monthly for Life
Present Value of $1 MonthlyIncreasing 1.25% Annually
Future Life Expectancy in Years
Male Female Male Female Male Female Male Female40 0.031% 0.018% $159.92 $162.72 $187.41 $191.69 44.51 48.0545 0.048% 0.031% 155.60 159.46 180.97 186.54 39.58 43.1050 0.257% 0.130% 149.69 154.97 172.62 179.83 34.70 38.1855 0.397% 0.181% 143.43 149.57 163.82 171.96 30.19 33.4460 0.544% 0.257% 135.67 142.39 153.29 161.97 25.83 28.76
65 0.728% 0.422% 125.61 132.99 140.23 149.50 21.55 24.1870 1.117% 0.690% 112.71 120.96 124.21 134.24 17.38 19.7475 1.849% 1.191% 96.88 105.82 105.36 115.86 13.44 15.5080 3.630% 2.537% 78.48 87.79 84.29 94.88 9.84 11.5985 7.332% 5.320% 60.30 69.46 64.13 74.23 6.91 8.34
1 Rates are shown for healthy members. Separate disability mortality tables are used for disabled retirees.
Actuarial Section
DIVISION TRUST FUNDS—PENSION
160 Actuarial Section � Colorado PERA Comprehensive Annual Financial Report 2019
Final D
raft
June
12,
202
0

Summary of Funding ProgressThe PERA funding objective is to pay long-term benefitpromises through contributions that remainapproximately level from year to year as a percent ofcovered payroll earned by PERA members. The followingschedules presented in this section provide an overview offunding progress:
• The solvency test shows the degree to which existingliabilities are funded, including prior history.
• A schedule of funding progress shows the UAAL asa percentage of annual covered payroll, includingprior history.
• Schedules detailing actuarial gains and losses, by source,including prior history and a reconciliation of UAALconsidering the total of all five Division Trust Funds,over the past five years.
• The scheduled contribution requirements based on theDecember 31, 2019, actuarial valuation for the periodending December 31, 2021.
Actuarial Section
DIVISION TRUST FUNDS—PENSION
Colorado PERA Comprehensive Annual Financial Report 2019 � Actuarial Section 161
Solvency TestThe solvency test compares the plan’s actuarial value ofassets with: (A) member contributions (with interest) ondeposit, (B) the liabilities for future benefits to personswho have retired, died or become disabled, and to thosewho have terminated service with the right to a futurebenefit, and (C) the liabilities for service already renderedby active members.
The actuarial valuation of December 31, 2019, shows thatplan assets fully cover liability A. In addition, theremainder of plan assets covers a portion of the liabilitiesfor future benefits to persons who have retired orterminated service with the right to a future benefit(liability B). Generally, if the system follows the disciplineof level contribution rate financing, the funded portion ofliability B and C is expected to increase over time.
Final D
raft
June
12,
202
0
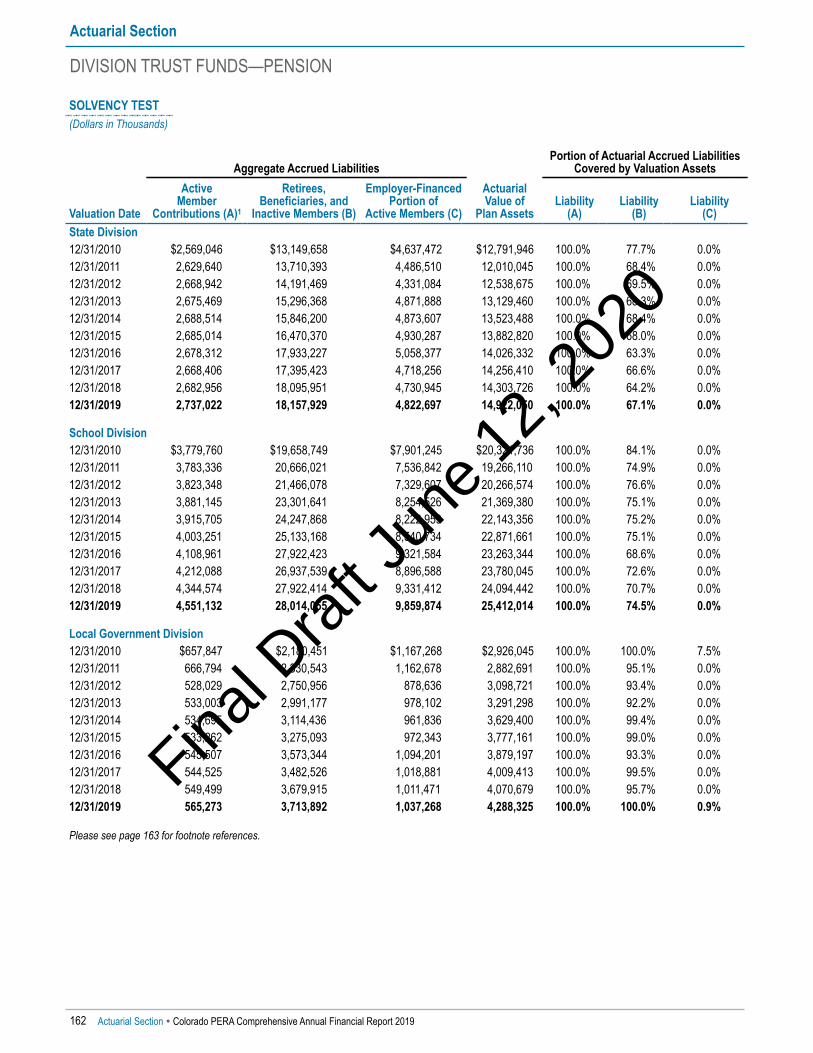
SOLVENCY TEST(Dollars in Thousands)
Valuation Date
Aggregate Accrued LiabilitiesPortion of Actuarial Accrued Liabilities
Covered by Valuation AssetsActive
Member Contributions (A)1
Retirees, Beneficiaries, and
Inactive Members (B)
Employer-Financed Portion of
Active Members (C)
ActuarialValue of
Plan AssetsLiability
(A)Liability
(B)Liability
(C)State Division12/31/2010 $2,569,046 $13,149,658 $4,637,472 $12,791,946 100.0% 77.7% 0.0%12/31/2011 2,629,640 13,710,393 4,486,510 12,010,045 100.0% 68.4% 0.0%12/31/2012 2,668,942 14,191,469 4,331,084 12,538,675 100.0% 69.5% 0.0%12/31/2013 2,675,469 15,296,368 4,871,888 13,129,460 100.0% 68.3% 0.0%12/31/2014 2,688,514 15,846,200 4,873,607 13,523,488 100.0% 68.4% 0.0%12/31/2015 2,685,014 16,470,370 4,930,287 13,882,820 100.0% 68.0% 0.0%12/31/2016 2,678,312 17,933,227 5,058,377 14,026,332 100.0% 63.3% 0.0%12/31/2017 2,668,406 17,395,423 4,718,256 14,256,410 100.0% 66.6% 0.0%12/31/2018 2,682,956 18,095,951 4,730,945 14,303,726 100.0% 64.2% 0.0%12/31/2019 2,737,022 18,157,929 4,822,697 14,922,050 100.0% 67.1% 0.0%
School Division12/31/2010 $3,779,760 $19,658,749 $7,901,245 $20,321,736 100.0% 84.1% 0.0%12/31/2011 3,783,336 20,666,021 7,536,842 19,266,110 100.0% 74.9% 0.0%12/31/2012 3,823,348 21,466,078 7,329,607 20,266,574 100.0% 76.6% 0.0%12/31/2013 3,881,145 23,301,641 8,254,526 21,369,380 100.0% 75.1% 0.0%12/31/2014 3,915,705 24,247,868 8,222,959 22,143,356 100.0% 75.2% 0.0%12/31/2015 4,003,251 25,133,168 8,540,734 22,871,661 100.0% 75.1% 0.0%12/31/2016 4,108,961 27,922,423 9,321,584 23,263,344 100.0% 68.6% 0.0%12/31/2017 4,212,088 26,937,539 8,896,588 23,780,045 100.0% 72.6% 0.0%12/31/2018 4,344,574 27,922,414 9,331,412 24,094,442 100.0% 70.7% 0.0%12/31/2019 4,551,132 28,014,055 9,859,874 25,412,014 100.0% 74.5% 0.0%
Local Government Division12/31/2010 $657,847 $2,180,451 $1,167,268 $2,926,045 100.0% 100.0% 7.5%12/31/2011 666,794 2,330,543 1,162,678 2,882,691 100.0% 95.1% 0.0%12/31/2012 528,029 2,750,956 878,636 3,098,721 100.0% 93.4% 0.0%12/31/2013 533,003 2,991,177 978,102 3,291,298 100.0% 92.2% 0.0%12/31/2014 534,695 3,114,436 961,836 3,629,400 100.0% 99.4% 0.0%12/31/2015 533,262 3,275,093 972,343 3,777,161 100.0% 99.0% 0.0%12/31/2016 545,507 3,573,344 1,094,201 3,879,197 100.0% 93.3% 0.0%12/31/2017 544,525 3,482,526 1,018,881 4,009,413 100.0% 99.5% 0.0%12/31/2018 549,499 3,679,915 1,011,471 4,070,679 100.0% 95.7% 0.0%12/31/2019 565,273 3,713,892 1,037,268 4,288,325 100.0% 100.0% 0.9%
Please see page 163 for footnote references.
Actuarial Section
DIVISION TRUST FUNDS—PENSION
162 Actuarial Section � Colorado PERA Comprehensive Annual Financial Report 2019
Final D
raft
June
12,
202
0
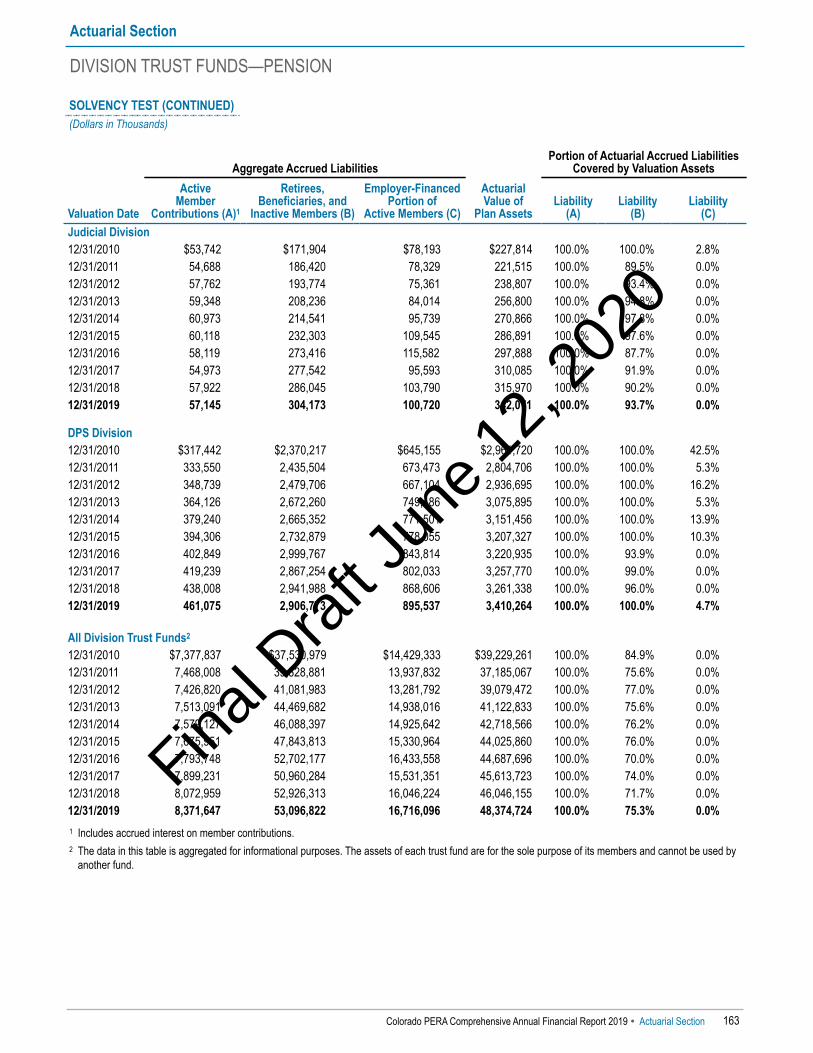
SOLVENCY TEST (CONTINUED)(Dollars in Thousands)
Valuation Date
Aggregate Accrued LiabilitiesPortion of Actuarial Accrued Liabilities
Covered by Valuation AssetsActive
Member Contributions (A)1
Retirees, Beneficiaries, and
Inactive Members (B)
Employer-Financed Portion of
Active Members (C)
ActuarialValue of
Plan AssetsLiability
(A)Liability
(B)Liability
(C)Judicial Division12/31/2010 $53,742 $171,904 $78,193 $227,814 100.0% 100.0% 2.8%12/31/2011 54,688 186,420 78,329 221,515 100.0% 89.5% 0.0%12/31/2012 57,762 193,774 75,361 238,807 100.0% 93.4% 0.0%12/31/2013 59,348 208,236 84,014 256,800 100.0% 94.8% 0.0%12/31/2014 60,973 214,541 95,739 270,866 100.0% 97.8% 0.0%12/31/2015 60,118 232,303 109,545 286,891 100.0% 97.6% 0.0%12/31/2016 58,119 273,416 115,582 297,888 100.0% 87.7% 0.0%12/31/2017 54,973 277,542 95,593 310,085 100.0% 91.9% 0.0%12/31/2018 57,922 286,045 103,790 315,970 100.0% 90.2% 0.0%12/31/2019 57,145 304,173 100,720 342,071 100.0% 93.7% 0.0%
DPS Division12/31/2010 $317,442 $2,370,217 $645,155 $2,961,720 100.0% 100.0% 42.5%12/31/2011 333,550 2,435,504 673,473 2,804,706 100.0% 100.0% 5.3%12/31/2012 348,739 2,479,706 667,104 2,936,695 100.0% 100.0% 16.2%12/31/2013 364,126 2,672,260 749,486 3,075,895 100.0% 100.0% 5.3%12/31/2014 379,240 2,665,352 771,501 3,151,456 100.0% 100.0% 13.9%12/31/2015 394,306 2,732,879 778,055 3,207,327 100.0% 100.0% 10.3%12/31/2016 402,849 2,999,767 843,814 3,220,935 100.0% 93.9% 0.0%12/31/2017 419,239 2,867,254 802,033 3,257,770 100.0% 99.0% 0.0%12/31/2018 438,008 2,941,988 868,606 3,261,338 100.0% 96.0% 0.0%12/31/2019 461,075 2,906,773 895,537 3,410,264 100.0% 100.0% 4.7%
All Division Trust Funds2
12/31/2010 $7,377,837 $37,530,979 $14,429,333 $39,229,261 100.0% 84.9% 0.0%12/31/2011 7,468,008 39,328,881 13,937,832 37,185,067 100.0% 75.6% 0.0%12/31/2012 7,426,820 41,081,983 13,281,792 39,079,472 100.0% 77.0% 0.0%12/31/2013 7,513,091 44,469,682 14,938,016 41,122,833 100.0% 75.6% 0.0%12/31/2014 7,579,127 46,088,397 14,925,642 42,718,566 100.0% 76.2% 0.0%12/31/2015 7,675,951 47,843,813 15,330,964 44,025,860 100.0% 76.0% 0.0%12/31/2016 7,793,748 52,702,177 16,433,558 44,687,696 100.0% 70.0% 0.0%12/31/2017 7,899,231 50,960,284 15,531,351 45,613,723 100.0% 74.0% 0.0%12/31/2018 8,072,959 52,926,313 16,046,224 46,046,155 100.0% 71.7% 0.0%12/31/2019 8,371,647 53,096,822 16,716,096 48,374,724 100.0% 75.3% 0.0%
1 Includes accrued interest on member contributions. 2 The data in this table is aggregated for informational purposes. The assets of each trust fund are for the sole purpose of its members and cannot be used by
another fund.
Actuarial Section
DIVISION TRUST FUNDS—PENSION
Colorado PERA Comprehensive Annual Financial Report 2019 � Actuarial Section 163
Final D
raft
June
12,
202
0

Unfunded Actuarial Accrued LiabilityUAAL is the difference between actuarially calculatedliability for service already rendered and the valuationassets of the retirement fund.
In 2018, the ratio of PERA’s valuation assets to accruedliabilities was 59.8 percent and increased to 61.9 percentby the end of 2019.
The following factors resulted in higher liabilities (orlosses) to PERA during 2019:
• Lower investment returns than assumed in 2016and 2018.
• More members retired at earlier ages than expected.
• More service and disability retirements wereexperienced than expected.
• Member pay increases were greater than expected
• New PERA members had some service resulting inaccrued liabilities.
• Actual payroll contributions were less than thedetermined ADC.
• Retirees experienced longer lifespans than expected.
• Fewer members terminated PERA-covered employmentand withdrew their accounts than expected.
• Higher than expected administrative expenses
The following factor resulted in lower liabilities (or gains)during 2019:
• Higher investment return than assumed in 2017and 2019.
Between 2010 and 2016, PERA’s funded status wasnegatively affected primarily by the recognition of adverseeconomic experience and by the adoption of moreconservative economic and demographic assumptions tobetter reflect anticipated future behaviors, longevity, andeconomic conditions. In 2017, PERA's funded statusimproved due to a decrease in plan liabilities reflecting theadoption of SB 18-200 pension reforms along with betterthan expected investment performance. PERA’s fundedstatus was, again, negatively impacted in 2018, reflectingunfavorable demographic experience and lower thanassumed investment performance. In 2019, PERA's fundedstatus was positively impacted by better than expectedinvestment performance and the reduced AI cap from1.50 percent to 1.25 percent, and negatively impacted bydemographic losses and, to a lesser extent, the enactmentof HB 20-1394 modifying the Judicial Division's employerand member contribution rates for the State's 2020-21 and2021-22 fiscal years.
Since inflation decreases the dollar’s value, it is importantto examine more than basic actuarial metrics and datawhen assessing the plan’s financial status. The ratio ofUAAL dollars divided by member covered payroll, asshown in the table on the next page, can provide ameaningful index. Opposite of the funded status ratio, thelower the ratio, the greater is the strength of the system.
Actuarial Section
DIVISION TRUST FUNDS—PENSION
164 Actuarial Section � Colorado PERA Comprehensive Annual Financial Report 2019
Final D
raft
June
12,
202
0
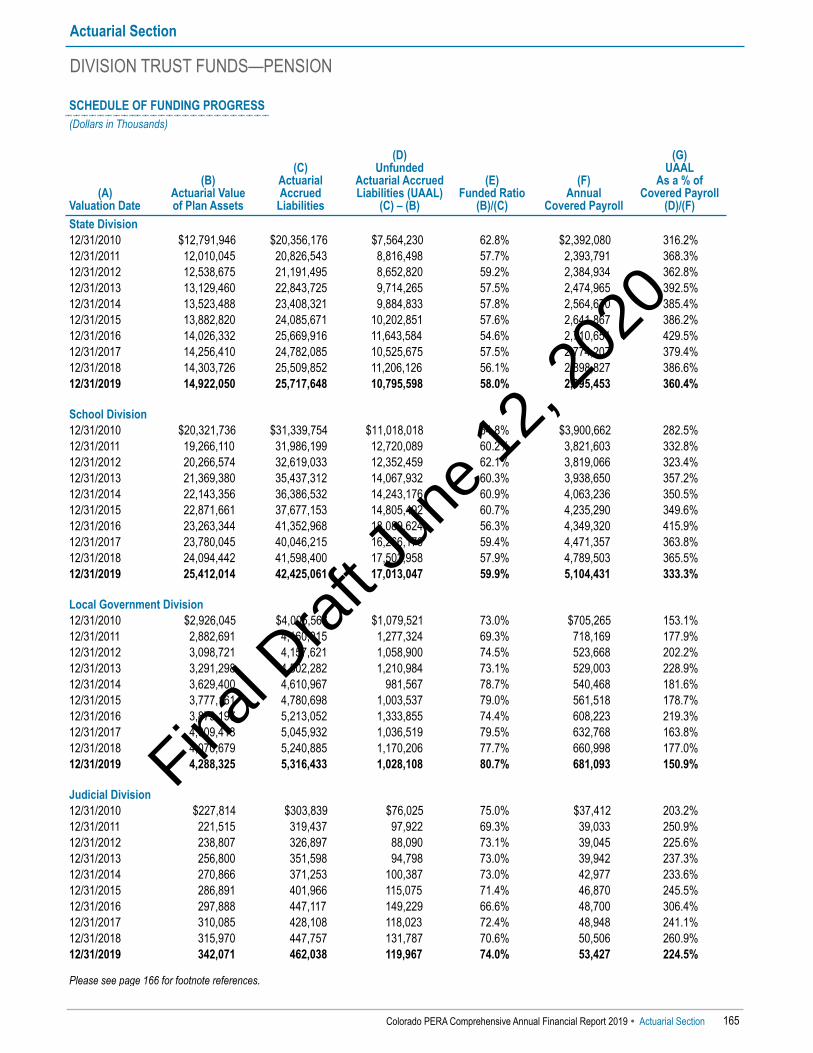
SCHEDULE OF FUNDING PROGRESS(Dollars in Thousands)
(A)Valuation Date
(B) Actuarial Value of Plan Assets
(C) Actuarial Accrued
Liabilities
(D) Unfunded
Actuarial AccruedLiabilities (UAAL)
(C) – (B)
(E) Funded Ratio
(B)/(C)
(F) Annual
Covered Payroll
(G) UAAL
As a % of Covered Payroll
(D)/(F)State Division12/31/2010 $12,791,946 $20,356,176 $7,564,230 62.8% $2,392,080 316.2%12/31/2011 12,010,045 20,826,543 8,816,498 57.7% 2,393,791 368.3%12/31/2012 12,538,675 21,191,495 8,652,820 59.2% 2,384,934 362.8%12/31/2013 13,129,460 22,843,725 9,714,265 57.5% 2,474,965 392.5%12/31/2014 13,523,488 23,408,321 9,884,833 57.8% 2,564,670 385.4%12/31/2015 13,882,820 24,085,671 10,202,851 57.6% 2,641,867 386.2%12/31/2016 14,026,332 25,669,916 11,643,584 54.6% 2,710,651 429.5%12/31/2017 14,256,410 24,782,085 10,525,675 57.5% 2,774,207 379.4%12/31/2018 14,303,726 25,509,852 11,206,126 56.1% 2,898,827 386.6%12/31/2019 14,922,050 25,717,648 10,795,598 58.0% 2,995,453 360.4%
School Division12/31/2010 $20,321,736 $31,339,754 $11,018,018 64.8% $3,900,662 282.5%12/31/2011 19,266,110 31,986,199 12,720,089 60.2% 3,821,603 332.8%12/31/2012 20,266,574 32,619,033 12,352,459 62.1% 3,819,066 323.4%12/31/2013 21,369,380 35,437,312 14,067,932 60.3% 3,938,650 357.2%12/31/2014 22,143,356 36,386,532 14,243,176 60.9% 4,063,236 350.5%12/31/2015 22,871,661 37,677,153 14,805,492 60.7% 4,235,290 349.6%12/31/2016 23,263,344 41,352,968 18,089,624 56.3% 4,349,320 415.9%12/31/2017 23,780,045 40,046,215 16,266,170 59.4% 4,471,357 363.8%12/31/2018 24,094,442 41,598,400 17,503,958 57.9% 4,789,503 365.5%12/31/2019 25,412,014 42,425,061 17,013,047 59.9% 5,104,431 333.3%
Local Government Division12/31/2010 $2,926,045 $4,005,566 $1,079,521 73.0% $705,265 153.1%12/31/2011 2,882,691 4,160,015 1,277,324 69.3% 718,169 177.9%12/31/2012 3,098,721 4,157,621 1,058,900 74.5% 523,668 202.2%12/31/2013 3,291,298 4,502,282 1,210,984 73.1% 529,003 228.9%12/31/2014 3,629,400 4,610,967 981,567 78.7% 540,468 181.6%12/31/2015 3,777,161 4,780,698 1,003,537 79.0% 561,518 178.7%12/31/2016 3,879,197 5,213,052 1,333,855 74.4% 608,223 219.3%12/31/2017 4,009,413 5,045,932 1,036,519 79.5% 632,768 163.8%12/31/2018 4,070,679 5,240,885 1,170,206 77.7% 660,998 177.0%12/31/2019 4,288,325 5,316,433 1,028,108 80.7% 681,093 150.9%
Judicial Division12/31/2010 $227,814 $303,839 $76,025 75.0% $37,412 203.2%12/31/2011 221,515 319,437 97,922 69.3% 39,033 250.9%12/31/2012 238,807 326,897 88,090 73.1% 39,045 225.6%12/31/2013 256,800 351,598 94,798 73.0% 39,942 237.3%12/31/2014 270,866 371,253 100,387 73.0% 42,977 233.6%12/31/2015 286,891 401,966 115,075 71.4% 46,870 245.5%12/31/2016 297,888 447,117 149,229 66.6% 48,700 306.4%12/31/2017 310,085 428,108 118,023 72.4% 48,948 241.1%12/31/2018 315,970 447,757 131,787 70.6% 50,506 260.9%12/31/2019 342,071 462,038 119,967 74.0% 53,427 224.5%
Please see page 166 for footnote references.
Actuarial Section
DIVISION TRUST FUNDS—PENSION
Colorado PERA Comprehensive Annual Financial Report 2019 � Actuarial Section 165
Final D
raft
June
12,
202
0

SCHEDULE OF FUNDING PROGRESS (CONTINUED)(Dollars in Thousands)
(A) Valuation Date
(B) Actuarial Value of Plan Assets
(C) Actuarial Accrued
Liabilities
(D) Unfunded
Actuarial AccruedLiabilities (UAAL)
(C) – (B)
(E) Funded Ratio
(B)/(C)
(F) Annual
Covered Payroll
(G) UAAL
As a % of Covered Payroll
(D)/(F)DPS Division12/31/2010 $2,961,720 $3,332,814 $371,094 88.9% $470,774 78.8%12/31/2011 2,804,706 3,442,527 637,821 81.5% 491,646 129.7%12/31/2012 2,936,695 3,495,549 558,854 84.0% 510,872 109.4%12/31/2013 3,075,895 3,785,872 709,977 81.2% 547,660 129.6%12/31/2014 3,151,456 3,816,093 664,637 82.6% 584,319 113.7%12/31/2015 3,207,327 3,905,240 697,913 82.1% 621,115 112.4%12/31/2016 3,220,935 4,246,430 1,025,495 75.9% 642,177 159.7%12/31/2017 3,257,770 4,088,526 830,756 79.7% 658,198 126.2%12/31/2018 3,261,338 4,248,602 987,264 76.8% 722,040 136.7%12/31/2019 3,410,264 4,263,385 853,121 80.0% 736,264 115.9%
All Division Trust Funds1
12/31/2010 $39,229,261 $59,338,149 $20,108,888 66.1% $7,506,193 267.9%12/31/2011 37,185,067 60,734,721 23,549,654 61.2% 7,464,242 315.5%12/31/2012 39,079,472 61,790,595 22,711,123 63.2% 7,277,585 312.1%12/31/2013 41,122,833 66,920,789 25,797,956 61.5% 7,530,220 342.6%12/31/2014 42,718,566 68,593,166 25,874,600 62.3% 7,795,670 331.9%12/31/2015 44,025,860 70,850,728 26,824,868 62.1% 8,106,660 330.9%12/31/2016 44,687,696 76,929,483 32,241,787 58.1% 8,359,071 385.7%12/31/2017 45,613,723 74,390,866 28,777,143 61.3% 8,585,478 335.2%12/31/2018 46,046,155 77,045,496 30,999,341 59.8% 9,121,874 339.8%12/31/2019 48,374,724 78,184,565 29,809,841 61.9% 9,570,668 311.5%
1 The data in this table is aggregated for informational purposes. The assets of each trust fund are for the sole purpose of its members and cannot be used byanother fund.
Note: A history of contributions by Division Trust Fund, the ADC compared to the actual contributions paid, including the deficiency (or excess), for each of the last 10 years, is shown in the Schedule of Employer and Nonemployer Contributions, found on pages 96-98 in the Required Supplementary Information (RSI) in the Financial Section.
Actuarial Section
DIVISION TRUST FUNDS—PENSION
166 Actuarial Section � Colorado PERA Comprehensive Annual Financial Report 2019
Final D
raft
June
12,
202
0

Actuarial Gains and Losses
ANALYSIS OF FINANCIAL EXPERIENCE(Dollars in Millions)
State Division
School Division
Local Government
DivisionJudicial Division
DPS Division
AmountsFrom differences between assumed and actualexperience on liabilities
Age and service retirements1 $42.6 $49.4 $3.8 $3.9 ($4.3)Disability retirements2 1.5 6.3 0.8 0.1 0.8Deaths3 12.8 6.5 (10.5) 1.5 (5.6)Withdrawals4 13.0 143.3 12.9 (0.8) (18.3)New members5 65.6 99.3 12.8 5.6 30.1Pay increases6 68.7 300.6 14.5 (0.7) 8.5Administrative expenses and other7 31.4 29.6 9.2 0.2 (22.9)
Subtotal 235.6 635.0 43.5 9.8 (11.7)From differences between assumed and actualexperience on assets (364.7) (616.2) (103.7) (7.9) (84.2)
From changes in plan assumptions and methods — — — — —From changes in plan provisions (480.6) (829.6) (100.0) (8.1) (76.0)
Total actuarial (gains)/losses on 2019 activities ($609.7) ($810.8) ($160.2) ($6.2) ($171.9)Total actuarial (gains)/losses on 2018 activities $543.4 $977.6 $129.8 $11.1 $120.9
1 Age and service retirements: If members retire at older ages than assumed, there is a gain. If members retire at younger ages than assumed, there is a loss. 2 Disability retirements: If disability claims are lower than assumed, there is a gain. If disability claims are higher than assumed, there is a loss. 3 Deaths: If survivor claims are lower than assumed, there is a gain. If survivor claims are higher than assumed, there is a loss. If retirees die sooner than
assumed, there is a gain. If retirees live longer than assumed, there is a loss. 4 Withdrawal from employment: If more members terminate and more liabilities are released by withdrawals than assumed, there is a gain. If fewer liabilities are
released by terminations than assumed, there is a loss. 5 New members: If new members entering the plan have prior service, there is a loss. 6 Pay increases: If there are smaller salary increases than assumed, there is a gain. If greater salary increases occur than assumed, there is a loss. 7 Administrative expenses and other: Includes miscellaneous gains and losses resulting from valuation software updates and refinements, data adjustments,
timing of financial transactions, etc.
Actuarial Section
DIVISION TRUST FUNDS—PENSION
Colorado PERA Comprehensive Annual Financial Report 2019 � Actuarial Section 167
Final D
raft
June
12,
202
0

The table below identifies the components that contributed to the change in the underfunded status of the Division TrustFunds for the period 2015 to 2019.
SCHEDULE OF GAINS AND LOSSES IN ACCRUED LIABILITIES AND RECONCILIATION OFUNFUNDED ACTUARIAL ACCRUED LIABILITIES(Dollars in Millions)
(Gain) or Loss for Years Ended December 31Type of Activity 2015 2016 2017 2018 2019 2015 - 2019UAAL beginning of year $25,874.6 $26,824.9 $32,241.8 $28,777.1 $30,999.3 $25,874.6Experience (gains) and losses
Age and service retirements 132.1 139.0 211.4 177.5 95.4 755.4Disability retirements 22.7 22.3 22.9 13.3 9.5 90.7Deaths 68.5 79.9 (21.0) 118.0 4.7 250.1Withdrawal from employment 172.7 205.9 251.2 (5.2) 150.1 774.7New members 149.9 213.0 238.3 231.4 213.4 1,046.0Pay increases (64.4) (275.0) (214.3) 162.0 391.6 (0.1)Investment (income) loss (418.0) 236.3 (175.5) 580.4 (1,176.7) (953.5)Other (35.7) 68.2 61.2 511.0¹ 47.5 652.2
Experience (gain) loss during year 27.8 689.6 374.2 1,788.4 (264.5) 2,615.5Non-recurring items
Change in plan assumptions and methods — 3,947.3² — — — 3,947.3Change in plan provisions — — (4,832.3)³ (5.6) (1,494.3)⁴ (6,332.2)
Non-recurring items — 3,947.3 (4,832.3) (5.6) (1,494.3) (2,384.9)Contribution deficiency 380.9 249.6 195.2 450.0 132.9 1,408.6⁵Expected change in UAAL 541.6 530.4 798.2 (10.6) 436.4 2,296.0⁶
Total (gain)/loss for year 950.3 5,416.9 (3,464.7) 2,222.2 (1,189.5) 3,935.2UAAL end of year $26,824.9 $32,241.8 $28,777.1 $30,999.3 $29,809.8 $29,809.8
The previous schedule shows where gains and losses occurred over the five-year period compared to what was expectedor assumed. These include the following significant gains and losses:1 $0.5 billion loss in 2018, primarily due to the change in actuarial service provider and actuarial valuation software. Although the total present value of benefits
matched closely as determined by the prior and current actuarial service provider, the loss shown represents the different methods of attribution applied toallocate costs between future normal costs and AAL for earned service.
2 $3.9 billion loss, in 2016, primarily due to the reduction of the long-term expected investment rate of return assumption from 7.50 percent to 7.25 percent andthe adoption of revised mortality tables to recognize extended member longevity.
3 $4.8 billion gain, in 2017, primarily due to the changes in pension plan provisions enacted pursuant to SB 18-200.4 $1.5 billion gain, in 2019, due to the reduction in the AI cap from 1.50% to 1.25%, effective July 1, 2020, as required by the 2018 AAP assessment.5 $1.4 billion cumulative loss resulting from contribution deficiencies; occurring when actual contributions flowing into the plans are less than the
determined ADC.6 $2.3 billion cumulative loss indicating the five-year difference between each prior year’s UAAL and the expected current year UAAL considering the normal
cost earned, less the required employer contributions all of which is adjusted for interest.
Actuarial Section
DIVISION TRUST FUNDS—PENSION
168 Actuarial Section � Colorado PERA Comprehensive Annual Financial Report 2019
Final D
raft
June
12,
202
0
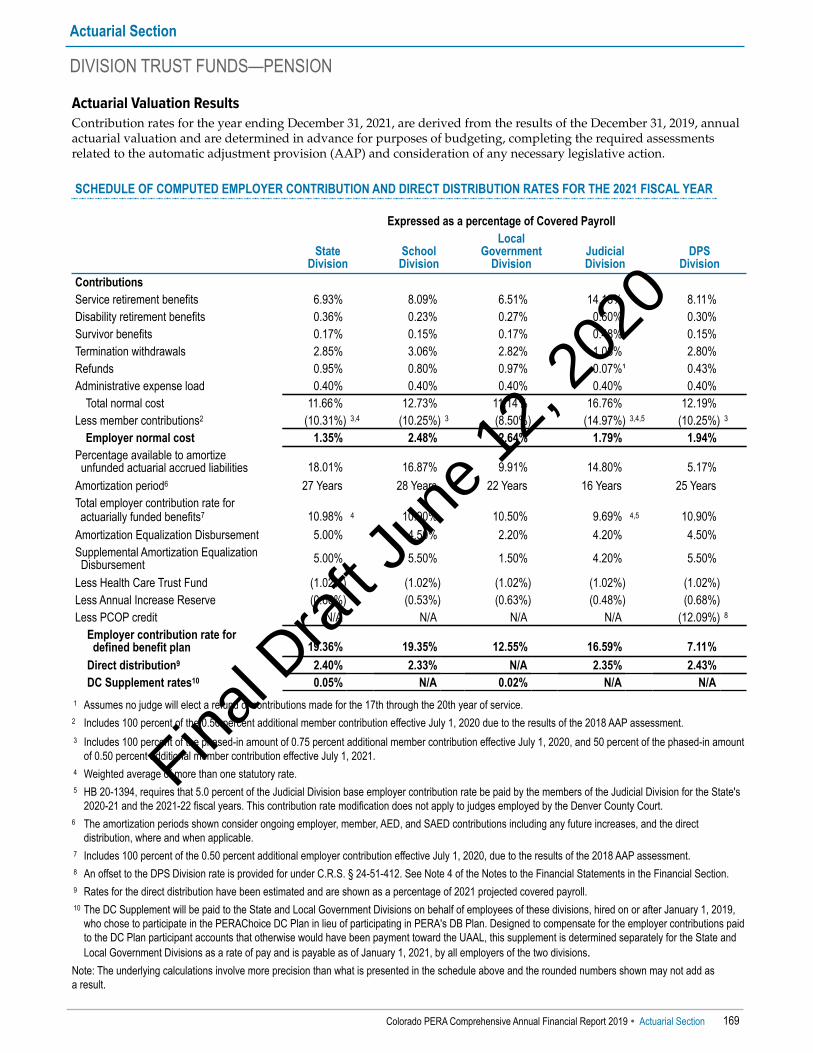
Actuarial Valuation ResultsContribution rates for the year ending December 31, 2021, are derived from the results of the December 31, 2019, annualactuarial valuation and are determined in advance for purposes of budgeting, completing the required assessmentsrelated to the automatic adjustment provision (AAP) and consideration of any necessary legislative action.
SCHEDULE OF COMPUTED EMPLOYER CONTRIBUTION AND DIRECT DISTRIBUTION RATES FOR THE 2021 FISCAL YEAR
Expressed as a percentage of Covered Payroll
State Division
School Division
LocalGovernment
DivisionJudicial Division
DPS Division
ContributionsService retirement benefits 6.93% 8.09% 6.51% 14.13% 8.11%Disability retirement benefits 0.36% 0.23% 0.27% 0.60% 0.30%Survivor benefits 0.17% 0.15% 0.17% 0.48% 0.15%Termination withdrawals 2.85% 3.06% 2.82% 1.08% 2.80%Refunds 0.95% 0.80% 0.97% 0.07%¹ 0.43%Administrative expense load 0.40% 0.40% 0.40% 0.40% 0.40%
Total normal cost 11.66% 12.73% 11.14% 16.76% 12.19%Less member contributions2 (10.31%) 3,4 (10.25%) 3 (8.50%) (14.97%) 3,4,5 (10.25%) 3
Employer normal cost 1.35% 2.48% 2.64% 1.79% 1.94%Percentage available to amortize unfunded actuarial accrued liabilities 18.01% 16.87% 9.91% 14.80% 5.17%Amortization period6 27 Years 28 Years 22 Years 16 Years 25 YearsTotal employer contribution rate foractuarially funded benefits7 10.98% 4 10.90% 10.50% 9.69% 4,5 10.90%
Amortization Equalization Disbursement 5.00% 4.50% 2.20% 4.20% 4.50%Supplemental Amortization Equalization Disbursement 5.00% 5.50% 1.50% 4.20% 5.50%
Less Health Care Trust Fund (1.02%) (1.02%) (1.02%) (1.02%) (1.02%)Less Annual Increase Reserve (0.60%) (0.53%) (0.63%) (0.48%) (0.68%)Less PCOP credit N/A N/A N/A N/A (12.09%) 8
Employer contribution rate for defined benefit plan 19.36% 19.35% 12.55% 16.59% 7.11%Direct distribution9 2.40% 2.33% N/A 2.35% 2.43%DC Supplement rates10 0.05% N/A 0.02% N/A N/A
1 Assumes no judge will elect a refund of contributions made for the 17th through the 20th year of service.2 Includes 100 percent of the 0.50 percent additional member contribution effective July 1, 2020 due to the results of the 2018 AAP assessment. 3 Includes 100 percent of the phased-in amount of 0.75 percent additional member contribution effective July 1, 2020, and 50 percent of the phased-in amount
of 0.50 percent additional member contribution effective July 1, 2021. 4 Weighted average of more than one statutory rate. 5 HB 20-1394, requires that 5.0 percent of the Judicial Division base employer contribution rate be paid by the members of the Judicial Division for the State's
2020-21 and the 2021-22 fiscal years. This contribution rate modification does not apply to judges employed by the Denver County Court.6 The amortization periods shown consider ongoing employer, member, AED, and SAED contributions including any future increases, and the direct
distribution, where and when applicable. 7 Includes 100 percent of the 0.50 percent additional employer contribution effective July 1, 2020, due to the results of the 2018 AAP assessment. 8 An offset to the DPS Division rate is provided for under C.R.S. § 24-51-412. See Note 4 of the Notes to the Financial Statements in the Financial Section. 9 Rates for the direct distribution have been estimated and are shown as a percentage of 2021 projected covered payroll. 10 The DC Supplement will be paid to the State and Local Government Divisions on behalf of employees of these divisions, hired on or after January 1, 2019,
who chose to participate in the PERAChoice DC Plan in lieu of participating in PERA's DB Plan. Designed to compensate for the employer contributions paidto the DC Plan participant accounts that otherwise would have been payment toward the UAAL, this supplement is determined separately for the State andLocal Government Divisions as a rate of pay and is payable as of January 1, 2021, by all employers of the two divisions.
Note: The underlying calculations involve more precision than what is presented in the schedule above and the rounded numbers shown may not add asa result.
Actuarial Section
DIVISION TRUST FUNDS—PENSION
Colorado PERA Comprehensive Annual Financial Report 2019 � Actuarial Section 169
Final D
raft
June
12,
202
0
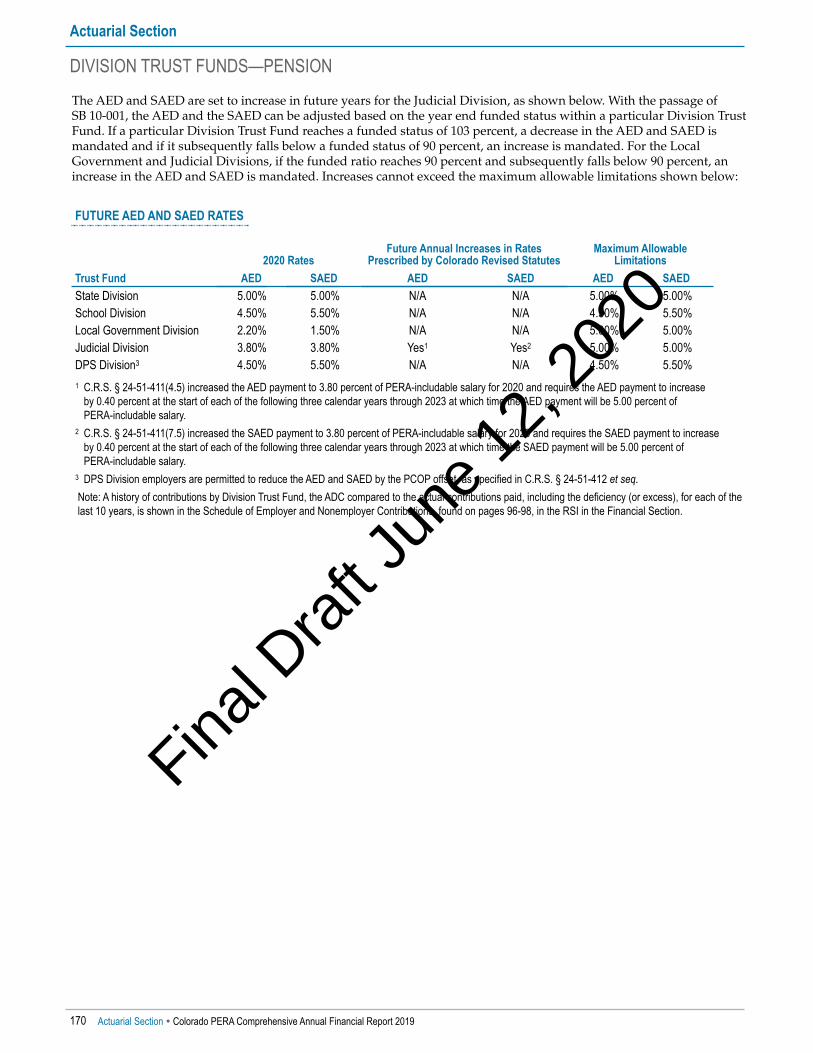
The AED and SAED are set to increase in future years for the Judicial Division, as shown below. With the passage ofSB 10-001, the AED and the SAED can be adjusted based on the year end funded status within a particular Division TrustFund. If a particular Division Trust Fund reaches a funded status of 103 percent, a decrease in the AED and SAED ismandated and if it subsequently falls below a funded status of 90 percent, an increase is mandated. For the LocalGovernment and Judicial Divisions, if the funded ratio reaches 90 percent and subsequently falls below 90 percent, anincrease in the AED and SAED is mandated. Increases cannot exceed the maximum allowable limitations shown below:
FUTURE AED AND SAED RATES
2020 RatesFuture Annual Increases in Rates
Prescribed by Colorado Revised StatutesMaximum Allowable
LimitationsTrust Fund AED SAED AED SAED AED SAEDState Division 5.00% 5.00% N/A N/A 5.00% 5.00%School Division 4.50% 5.50% N/A N/A 4.50% 5.50%Local Government Division 2.20% 1.50% N/A N/A 5.00% 5.00%Judicial Division 3.80% 3.80% Yes1 Yes2 5.00% 5.00%DPS Division3 4.50% 5.50% N/A N/A 4.50% 5.50%
1 C.R.S. § 24-51-411(4.5) increased the AED payment to 3.80 percent of PERA-includable salary for 2020 and requires the AED payment to increaseby 0.40 percent at the start of each of the following three calendar years through 2023 at which time the AED payment will be 5.00 percent of PERA-includable salary.
2 C.R.S. § 24-51-411(7.5) increased the SAED payment to 3.80 percent of PERA-includable salary for 2020 and requires the SAED payment to increaseby 0.40 percent at the start of each of the following three calendar years through 2023 at which time the SAED payment will be 5.00 percent of PERA-includable salary.
3 DPS Division employers are permitted to reduce the AED and SAED by the PCOP offset, as specified in C.R.S. § 24-51-412 et seq.Note: A history of contributions by Division Trust Fund, the ADC compared to the actual contributions paid, including the deficiency (or excess), for each of thelast 10 years, is shown in the Schedule of Employer and Nonemployer Contributions, found on pages 96-98, in the RSI in the Financial Section.
Actuarial Section
DIVISION TRUST FUNDS—PENSION
170 Actuarial Section � Colorado PERA Comprehensive Annual Financial Report 2019
Final D
raft
June
12,
202
0

Annual Actuarial Valuation StatisticsAs of December 31, 2019, the Funded Ratio, the UAAL, the ADC for 2021 as a percentage of covered payroll, and theamortization period considering current funding and future increases prescribed by Colorado statute, for each DivisionTrust Fund, are shown in the following table. The results in this table are based on the actuarial valuation for fundingpurposes, which does not consider the impact of reduced benefits for those hired in the future as provided for inColorado law.
ACTUARIAL STATISTICS(Dollars in Thousands)
Trust Fund Funded Ratio UAAL ADC1 Amortization Period2
State Division 58.0% $10,795,598 21.05% 27 YearsSchool Division 59.9% 17,013,047 20.61% 28 YearsLocal Government Division 80.7% 1,028,108 10.84% 22 YearsJudicial Division 74.0% 119,967 14.13% 16 YearsDPS Division 80.0% 853,121 8.22% 25 Years
All Division Trust Funds3 $29,809,841 1 Determined considering the 30-year target amortization period defined in the pension funding policy for purposes of funding benchmarks and RSI reporting
as shown in the Financial Section. 2 The determination of each amortization period considers future statutory increases in base employer and member contribution rates, increases in AED and
SAED, and inclusion of the direct distribution, as applicable. Pursuant to HB 20-1379, the July 1, 2020, payment of the direct distribution is not considered. 3 The data in this table is aggregated for informational purposes. The assets of each trust fund are for the sole purpose of its members and cannot be used by
another fund.
Pursuant to the pension funding policy, for reporting purposes, alternative ADCs also are determined by applying thelayered amortization methodology as previously described. Under the target and alternative calculations, the legacyUAAL as of December 31, 2017, was amortized using a 30-year period, but the alternative ADCs use a 25-year closedperiod, a 20-year closed period, and a 15-year closed period, in lieu of the 30-year period, for amortization of any ”new”UAAL recognized on and after January 1, 2018. The 2021 target and alternative ADCs, by division, are displayed below:
Target ADC Alternative ADCsTrust Fund 30-Year1 25-Year2 20-Year2 15-Year2
State Division 21.05% 21.12% 21.22% 21.40%School Division 20.61% 20.70% 20.84% 21.10%Local Government Division 10.84% 10.90% 10.99% 11.14%Judicial Division 14.13% 14.16% 14.21% 14.30%DPS Division 8.22% 8.23% 8.24% 8.27%
1 Refers to the amortization period used to amortize the legacy UAAL as of December 31, 2017, and any “new” UAAL recognized on and afterJanuary 1, 2018.
2 Refers to the amortization period used to amortize any “new” UAAL recognized on and after January 1, 2018.
Actuarial Section
DIVISION TRUST FUNDS—PENSION
Colorado PERA Comprehensive Annual Financial Report 2019 � Actuarial Section 171
Final D
raft
June
12,
202
0

Automatic Adjustment ProvisionThe primary intent of the AAP is to gauge the adequacy of the contributions coming into the pension trust fund againstthe amount required, and if determined necessary, to initiate automatic changes to member and employer contributionrates, the AI cap, and, under certain circumstances, the direct distribution from the State of Colorado, to better insureachievement of the targeted 30-year funding goal, as delineated in SB 18-200. Pursuant to C.R.S. § 24-51-413, thisassessment commenced with the December 31, 2018, actuarial valuation and is performed annually, thereafter.
The AAP assessment compares two blended rates, weighted across all five Division Trust Funds, defined as: the”Blended Total Contribution Amount” (employer contribution rate + member contribution rate + direct distribution as arate of pay) divided by the “Blended Total Required Contribution” (ADC Rate + member contribution rate), determininga resulting ratio. If the resulting ratio falls within an acceptable corridor (98 percent to 119 percent), no adjustments aremade. If the resulting ratio does not achieve a minimum benchmark (is less than 98 percent) or exceeds a maximumbenchmark (is 120 percent or greater), adjustments are applied in an equitable manner of impact. The following tableshows the results of the AAP assessment which was conducted to determine if adjustments are necessary as ofJuly 1, 2021.
Elements of Test Ratio (Shown as a percentage of pay)
2021 InputPercentages
ResultingRatio
Adjustments, if Necessary, Determined by the Board’s Actuary
(Effective July 1, 2021)
RevisedResulting
Ratio
2021 Blended Total Contribution Amount1,2
(Divided by):2021 Blended Total Required Contribution1,2
31.17%(Divided by):
30.28%
(Equals) 102.94%3 N/A N/A
1 The blended rate is weighted based on the UAAL of each Division Trust Fund and is not appropriate for any other use. 2 Determined from rates shown on pages 169-171. 3 Calculation considers HB 20-1394, which had negligible impact.
Below is a summary of the AAP guidelines. An automatic adjustment will occur under the following conditions:
• If the resulting ratio is less than 98 percent, there will be adjustments of equitable impact, increasing the employercontribution rate, increasing the member contribution rate, decreasing the AI cap, and increasing the directdistribution (if permitted).
• If the resulting ratio is greater than or equal to 120 percent, there will be adjustments of equitable impact, decreasingthe employer contribution rate, decreasing the member contribution rate, increasing the AI cap, and decreasing thedirect distribution.
The AAP defines the limited amounts of total adjustment available in each category, and also the increments ofadjustments that can occur in any one year. Multiple steps over multiple years are allowed for a required adjustment asnecessary, but cannot exceed the ultimate limits as set forth in statute, as detailed below:
• First adjustment cannot occur prior to July 1, 2020.
• Adjustment (increase or decrease) to each of the employer contribution rates and the member contribution rates cannotexceed 0.50 percent in any one year, and
▪ Cannot exceed 2.00 percent above the contribution rates reflecting SB 18-200 statutory reforms.
▪ Cannot fall below the contribution rates in effect immediately prior to the passage of SB 18-200.
• Adjustment (increase or decrease) to the AI rate cannot exceed 0.25 percent in any one year, and
▪ Cannot exceed a 2.00 percent AI cap maximum.
▪ Cannot fall below a 0.50 percent AI cap minimum.
• Adjustment to the direct distribution cannot exceed $20 million in any one year, and
▪ Cannot exceed the initial $225 million amount.
▪ Can be reduced to $0.
Actuarial Section
DIVISION TRUST FUNDS—PENSION
172 Actuarial Section � Colorado PERA Comprehensive Annual Financial Report 2019
Final D
raft
June
12,
202
0
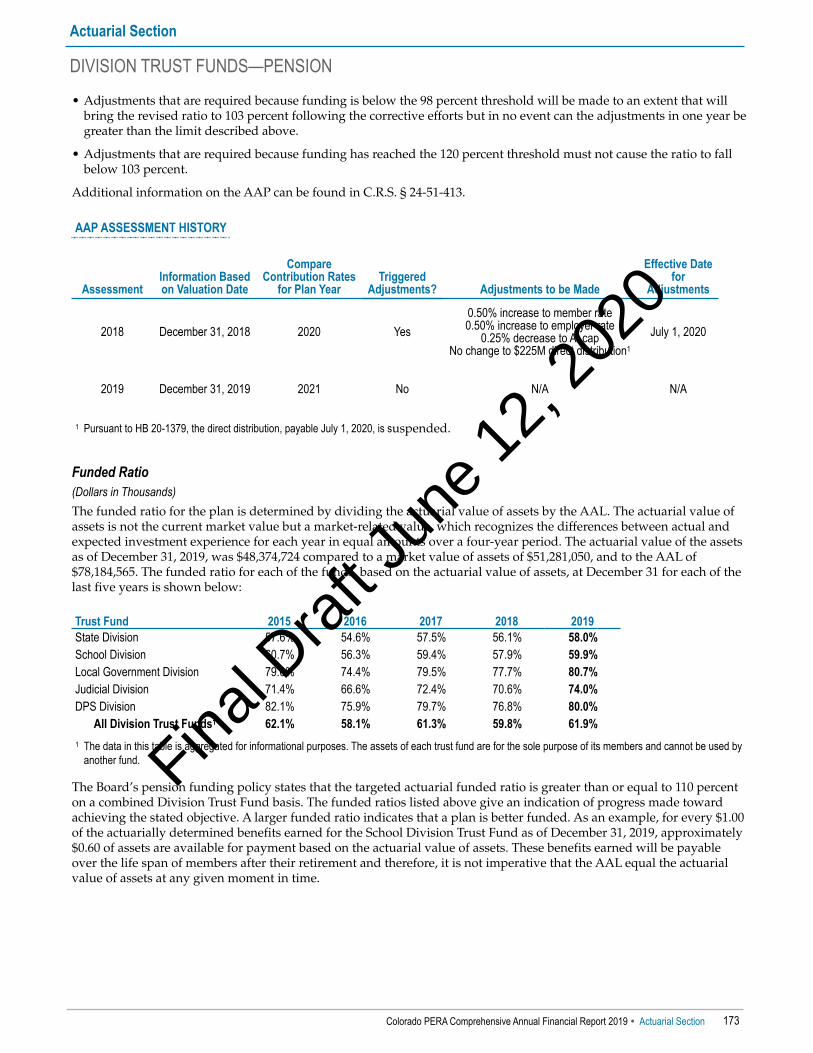
• Adjustments that are required because funding is below the 98 percent threshold will be made to an extent that willbring the revised ratio to 103 percent following the corrective efforts but in no event can the adjustments in one year begreater than the limit described above.
• Adjustments that are required because funding has reached the 120 percent threshold must not cause the ratio to fallbelow 103 percent.
Additional information on the AAP can be found in C.R.S. § 24-51-413.
AAP ASSESSMENT HISTORY
AssessmentInformation Basedon Valuation Date
CompareContribution Rates
for Plan YearTriggered
Adjustments? Adjustments to be Made
Effective Datefor
Adjustments
2018 December 31, 2018 2020 Yes0.50% increase to member rate0.50% increase to employer rate
0.25% decrease to AI capNo change to $225M direct distribution1
July 1, 2020
2019 December 31, 2019 2021 No N/A N/A
1 Pursuant to HB 20-1379, the direct distribution, payable July 1, 2020, is suspended.
Funded Ratio(Dollars in Thousands)The funded ratio for the plan is determined by dividing the actuarial value of assets by the AAL. The actuarial value ofassets is not the current market value but a market-related value, which recognizes the differences between actual andexpected investment experience for each year in equal amounts over a four-year period. The actuarial value of the assetsas of December 31, 2019, was $48,374,724 compared to a market value of assets of $51,281,050, and to the AAL of$78,184,565. The funded ratio for each of the funds, based on the actuarial value of assets, at December 31 for each of thelast five years is shown below:
Trust Fund 2015 2016 2017 2018 2019State Division 57.6% 54.6% 57.5% 56.1% 58.0%School Division 60.7% 56.3% 59.4% 57.9% 59.9%Local Government Division 79.0% 74.4% 79.5% 77.7% 80.7%Judicial Division 71.4% 66.6% 72.4% 70.6% 74.0%DPS Division 82.1% 75.9% 79.7% 76.8% 80.0%
All Division Trust Funds1 62.1% 58.1% 61.3% 59.8% 61.9% 1 The data in this table is aggregated for informational purposes. The assets of each trust fund are for the sole purpose of its members and cannot be used by
another fund.
The Board’s pension funding policy states that the targeted actuarial funded ratio is greater than or equal to 110 percenton a combined Division Trust Fund basis. The funded ratios listed above give an indication of progress made towardachieving the stated objective. A larger funded ratio indicates that a plan is better funded. As an example, for every $1.00of the actuarially determined benefits earned for the School Division Trust Fund as of December 31, 2019, approximately$0.60 of assets are available for payment based on the actuarial value of assets. These benefits earned will be payableover the life span of members after their retirement and therefore, it is not imperative that the AAL equal the actuarialvalue of assets at any given moment in time.
Actuarial Section
DIVISION TRUST FUNDS—PENSION
Colorado PERA Comprehensive Annual Financial Report 2019 � Actuarial Section 173
Final D
raft
June
12,
202
0

At December 31, 2018, and December 31, 2019, PERA had the following funded status for the Division Trust Funds:
FUNDED STATUS FOR THE DIVISION TRUST FUNDS(Dollars in Thousands)
Market Value of Assets1 Actuarial Value of Assets2
12/31/2018 12/31/2019 12/31/2018 12/31/2019State Division Trust FundActuarial accrued liability3 $25,509,852 $25,717,648 $25,509,852 $25,717,648Assets held to pay those liabilities 13,837,863 15,819,843 14,303,726 14,922,050Unfunded actuarial accrued liability $11,671,989 $9,897,805 $11,206,126 $10,795,598Funded ratio 54.2% 61.5% 56.1% 58.0%
School Division Trust FundActuarial accrued liability3 $41,598,400 $42,425,061 $41,598,400 $42,425,061Assets held to pay those liabilities 23,304,911 26,936,490 24,094,442 25,412,014Unfunded actuarial accrued liability $18,293,489 $15,488,571 $17,503,958 $17,013,047Funded ratio 56.0% 63.5% 57.9% 59.9%
Local Government Division Trust FundActuarial accrued liability3 $5,240,885 $5,316,433 $5,240,885 $5,316,433Assets held to pay those liabilities 3,935,921 4,545,960 4,070,679 4,288,325Unfunded actuarial accrued liability $1,304,964 $770,473 $1,170,206 $1,028,108Funded ratio 75.1% 85.5% 77.7% 80.7%
Judicial Division Trust FundActuarial accrued liability3 $447,757 $462,038 $447,757 $462,038Assets held to pay those liabilities 305,304 362,108 315,970 342,071Unfunded actuarial accrued liability $142,453 $99,930 $131,787 $119,967Funded ratio 68.2% 78.4% 70.6% 74.0%
DPS Division Trust FundActuarial accrued liability3 $4,248,602 $4,263,385 $4,248,602 $4,263,385Assets held to pay those liabilities 3,155,738 3,616,649 3,261,338 3,410,264Unfunded actuarial accrued liability $1,092,864 $646,736 $987,264 $853,121Funded ratio 74.3% 84.8% 76.8% 80.0%
All Division Trust Funds4
Actuarial accrued liability3 $77,045,496 $78,184,565 $77,045,496 $78,184,565Assets held to pay those liabilities5 44,539,737 51,281,050 46,046,155 48,374,724Unfunded actuarial accrued liability $32,505,759 $26,903,515 $30,999,341 $29,809,841Funded ratio 57.8% 65.6% 59.8% 61.9%
1 The market value of assets is the fair value of the investments. 2 The actuarial value of assets is calculated by spreading any market gains or losses above or below the assumed rate of return over four years. 3 Based upon an assumed rate of return on investments of 7.25 percent and an assumed rate of 7.25 percent to discount the liabilities to be paid in the future
to a value as of December 31, 2018, and December 31, 2019. 4 The data in this table is aggregated for informational purposes. The assets of each trust fund are for the sole purpose of its members and cannot be used by
another fund. 5 In aggregate, the market value of the assets as of December 31, 2019, is $2,906,326 greater than the actuarial value of assets calculated by the actuaries,
as they are recognizing the gains and losses in value over four years, rather than only in the year they occurred. The remaining gains and (losses) to besmoothed for 2017 are $1,138,428, for 2018 are ($2,506,076), and for 2019 are $4,273,974.
Actuarial Section
DIVISION TRUST FUNDS—PENSION
174 Actuarial Section � Colorado PERA Comprehensive Annual Financial Report 2019
Final D
raft
June
12,
202
0

Sensitivity of Actuarial Valuation to Changes in Assumed Investment Rate of Return and Discount RateThe most important long-term driver of a pension plan is investment income. The investment return assumption andthe discount rate for liabilities should be based on an estimated long-term investment yield for the plan, considering thenature and mix of current and expected plan investments and the basis used to determine the actuarial value of assets.
To understand the importance of the investment rate of return assumption, which is used to discount the actuarialliabilities of PERA, a one percent fluctuation in the assumed investment rate of return and discount rate would changethe funded ratio, UAAL, and ADC (for contributions for the fiscal year ended December 31, 2021) as shown on thetables below:
INVESTMENT RETURN ASSUMPTION (DISCOUNT RATE) EQUAL TO 6.25 PERCENT(Dollars in Thousands)
Actuarial Value of Assets Market Value of AssetsTrust Fund Funded Ratio UAAL ADC UAALState Division 52.4% $13,559,474 26.80% $12,661,681School Division 53.7% 21,905,974 27.14% 20,381,498Local Government Division 72.4% 1,635,176 17.51% 1,377,542Judicial Division 67.2% 167,266 21.22% 147,229DPS Division 71.7% 1,346,887 14.31% 1,140,502
All Division Trust Funds1 $38,614,777 $35,708,452 1 The data in this table is aggregated for informational purposes. The assets of each trust fund are for the sole purpose of its members and cannot be used by
another fund.
CURRENT INVESTMENT RETURN ASSUMPTION (DISCOUNT RATE) EQUAL TO 7.25 PERCENT(Dollars in Thousands)
Actuarial Value of Assets Market Value of AssetsTrust Fund Funded Ratio UAAL ADC UAALState Division 58.0% $10,795,598 21.05% $9,897,805School Division 59.9% 17,013,047 20.61% 15,488,571Local Government Division 80.7% 1,028,108 10.84% 770,473Judicial Division 74.0% 119,967 14.13% 99,930DPS Division 80.0% 853,121 8.22% 646,736
All Division Trust Funds1 $29,809,841 $26,903,515 1 The data in this table is aggregated for informational purposes. The assets of each trust fund are for the sole purpose of its members and cannot be used by
another fund.
INVESTMENT RETURN ASSUMPTION (DISCOUNT RATE) EQUAL TO 8.25 PERCENT(Dollars in Thousands)
Actuarial Value of Assets Market Value of AssetsTrust Fund Funded Ratio UAAL ADC UAALState Division 63.8% $8,452,145 15.95% $7,554,352School Division 66.3% 12,896,520 14.88% 11,372,043Local Government Division 89.3% 516,513 4.77% 258,879Judicial Division 81.2% 79,265 7.62% 59,227DPS Division 88.6% 440,645 2.89% 234,260
All Division Trust Funds1 $22,385,088 $19,478,761 1 The data in this table is aggregated for informational purposes. The assets of each trust fund are for the sole purpose of its members and cannot be used by
another fund. Note: The time-weighted, net-of-fees annualized rate of return for the pooled investment assets was 8.4 percent for the past five years and 9.1 percent for the
past 10 years. The 30-year annualized gross-of-fees rate of return for the pooled investment assets was 8.6 percent.
Actuarial Section
DIVISION TRUST FUNDS—PENSION
Colorado PERA Comprehensive Annual Financial Report 2019 � Actuarial Section 175
Final D
raft
June
12,
202
0

Plan Data
SCHEDULE OF RETIREES, BENEFICIARIES, AND SURVIVORS ADDED TO AND REMOVED FROM THE BENEFIT PAYROLL(In Actual Dollars)
Valuation Date
Added to Payroll Removed from Payroll Payroll—End of YearAverage Annual
Benefits
Increase(Decrease)in AverageBenefitsNo.1
Annual Benefits No.1
Annual Benefits No.1
Annual Benefits
State Division2
12/31/2010 32,367 $1,142,735,232 $35,306 —12/31/2011 1,477 $52,575,840 767 $18,206,208 33,077 1,198,047,252 36,220 2.6%12/31/2012 1,753 60,313,800 835 17,053,956 33,995 1,259,715,132 37,056 2.3%12/31/2013 1,472 49,314,648 621 15,343,872 34,846 1,316,530,332 37,781 2.0%12/31/2014 1,688 70,625,718 728 17,912,280 35,806 1,369,243,770 38,241 1.2%12/31/2015 1,862 92,808,306 803 20,891,508 36,865 1,441,160,568 39,093 2.2%12/31/2016 1,953 90,963,480 805 22,828,296 38,013 1,509,295,752 39,705 1.6%12/31/2017 2,029 96,524,376 810 23,794,584 39,232 1,582,025,544 40,325 1.6%12/31/2018 1,948 64,439,160 865 29,030,196 40,315 1,617,434,508 40,120 (0.5%)12/31/2019 1,805 60,004,122 939 33,418,682 41,181 1,644,019,948 39,922 (0.5%)
School Division2
12/31/2010 49,744 $1,677,950,928 $33,732 —12/31/2011 2,783 $83,582,412 809 $17,059,212 51,718 1,776,539,052 34,350 1.8%12/31/2012 3,044 87,700,656 985 18,719,640 53,777 1,876,340,508 34,891 1.6%12/31/2013 2,744 79,704,816 713 17,081,472 55,808 1,974,615,348 35,382 1.4%12/31/2014 3,016 111,392,724 843 19,419,540 57,981 2,066,588,532 35,643 0.7%12/31/2015 2,990 130,162,524 1,027 23,409,984 59,944 2,173,341,072 36,256 1.7%12/31/2016 3,023 123,292,224 1,027 25,461,636 61,940 2,271,171,660 36,667 1.1%12/31/2017 3,249 130,564,260 1,026 26,635,332 64,163 2,375,100,588 37,017 1.0%12/31/2018 3,319 90,191,556 1,106 32,160,792 66,376 2,433,131,352 36,657 (1.0%)12/31/2019 3,149 84,865,404 1,163 39,402,271 68,362 2,478,594,485 36,257 (1.1%)
Local Government Division2
12/31/2010 5,052 $171,596,184 $33,966 —12/31/2011 332 $11,254,980 88 $1,645,992 5,296 184,500,768 34,838 2.6%12/31/2012 687 23,576,376 105 1,892,688 5,878 209,260,764 35,601 2.2%12/31/2013 345 10,330,380 76 1,456,248 6,147 221,838,300 36,089 1.4%12/31/2014 392 13,412,585 93 2,018,928 6,446 233,231,957 36,182 0.3%12/31/2015 408 18,760,927 97 2,215,488 6,757 249,777,396 36,966 2.2%12/31/2016 388 15,843,636 100 2,491,764 7,045 263,129,268 37,350 1.0%12/31/2017 420 18,329,400 114 2,916,156 7,351 278,542,512 37,892 1.5%12/31/2018 421 14,336,628 128 3,227,280 7,644 289,651,860 37,893 0.0%12/31/2019 426 13,283,210 137 4,898,210 7,933 298,036,860 37,569 (0.9%)
Please see page 177 for footnote references.
Actuarial Section
DIVISION TRUST FUNDS—PENSION
176 Actuarial Section � Colorado PERA Comprehensive Annual Financial Report 2019
Final D
raft
June
12,
202
0
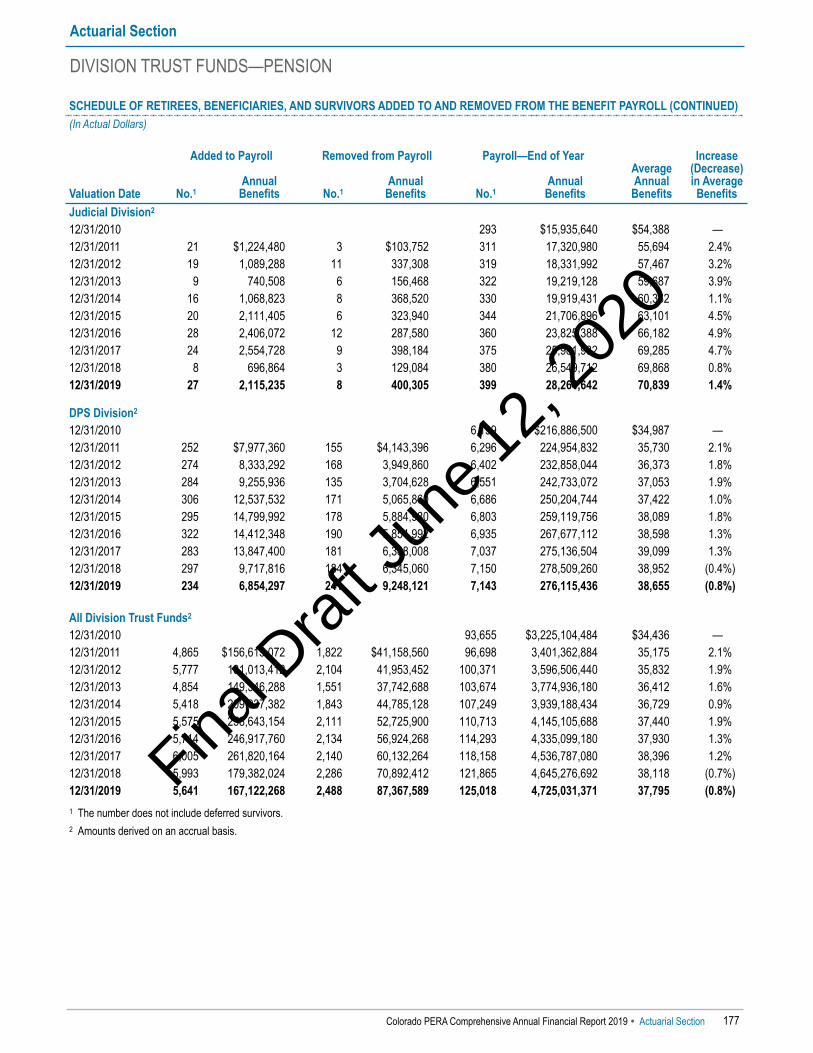
SCHEDULE OF RETIREES, BENEFICIARIES, AND SURVIVORS ADDED TO AND REMOVED FROM THE BENEFIT PAYROLL (CONTINUED)(In Actual Dollars)
Valuation Date
Added to Payroll Removed from Payroll Payroll—End of YearAverage Annual
Benefits
Increase(Decrease)in AverageBenefitsNo.1
Annual Benefits No.1
Annual Benefits No.1
Annual Benefits
Judicial Division2
12/31/2010 293 $15,935,640 $54,388 —12/31/2011 21 $1,224,480 3 $103,752 311 17,320,980 55,694 2.4%12/31/2012 19 1,089,288 11 337,308 319 18,331,992 57,467 3.2%12/31/2013 9 740,508 6 156,468 322 19,219,128 59,687 3.9%12/31/2014 16 1,068,823 8 368,520 330 19,919,431 60,362 1.1%12/31/2015 20 2,111,405 6 323,940 344 21,706,896 63,101 4.5%12/31/2016 28 2,406,072 12 287,580 360 23,825,388 66,182 4.9%12/31/2017 24 2,554,728 9 398,184 375 25,981,932 69,285 4.7%12/31/2018 8 696,864 3 129,084 380 26,549,712 69,868 0.8%12/31/2019 27 2,115,235 8 400,305 399 28,264,642 70,839 1.4%
DPS Division2
12/31/2010 6,199 $216,886,500 $34,987 —12/31/2011 252 $7,977,360 155 $4,143,396 6,296 224,954,832 35,730 2.1%12/31/2012 274 8,333,292 168 3,949,860 6,402 232,858,044 36,373 1.8%12/31/2013 284 9,255,936 135 3,704,628 6,551 242,733,072 37,053 1.9%12/31/2014 306 12,537,532 171 5,065,860 6,686 250,204,744 37,422 1.0%12/31/2015 295 14,799,992 178 5,884,980 6,803 259,119,756 38,089 1.8%12/31/2016 322 14,412,348 190 5,854,992 6,935 267,677,112 38,598 1.3%12/31/2017 283 13,847,400 181 6,388,008 7,037 275,136,504 39,099 1.3%12/31/2018 297 9,717,816 184 6,345,060 7,150 278,509,260 38,952 (0.4%)12/31/2019 234 6,854,297 241 9,248,121 7,143 276,115,436 38,655 (0.8%)
All Division Trust Funds2
12/31/2010 93,655 $3,225,104,484 $34,436 —12/31/2011 4,865 $156,615,072 1,822 $41,158,560 96,698 3,401,362,884 35,175 2.1%12/31/2012 5,777 181,013,412 2,104 41,953,452 100,371 3,596,506,440 35,832 1.9%12/31/2013 4,854 149,346,288 1,551 37,742,688 103,674 3,774,936,180 36,412 1.6%12/31/2014 5,418 209,037,382 1,843 44,785,128 107,249 3,939,188,434 36,729 0.9%12/31/2015 5,575 258,643,154 2,111 52,725,900 110,713 4,145,105,688 37,440 1.9%12/31/2016 5,714 246,917,760 2,134 56,924,268 114,293 4,335,099,180 37,930 1.3%12/31/2017 6,005 261,820,164 2,140 60,132,264 118,158 4,536,787,080 38,396 1.2%12/31/2018 5,993 179,382,024 2,286 70,892,412 121,865 4,645,276,692 38,118 (0.7%)12/31/2019 5,641 167,122,268 2,488 87,367,589 125,018 4,725,031,371 37,795 (0.8%)
1 The number does not include deferred survivors. 2 Amounts derived on an accrual basis.
Actuarial Section
DIVISION TRUST FUNDS—PENSION
Colorado PERA Comprehensive Annual Financial Report 2019 � Actuarial Section 177
Final D
raft
June
12,
202
0

The number of persons receiving monthly retirement benefits has grown steadily in relation to membership. As shown inthe table below, this trend has substantially stabilized over the last few years as PERA has reached a mature plan status.The retirement benefit disbursements shown in the right-hand column include cost-of-living increases paid in years since1970. Prior to 1981, figures are for years ended June 30.
MEMBER-RETIREE COMPARISON–ALL DIVISION TRUST FUNDS1
(In Actual Dollars)
YearNumber of Retiree Accounts on 12/31
Number of Member Accounts on 12/312
Retiree Accounts as % of Members on 12/31
Total Benefits Paid– Year Ended 12/31
1940 93 3,715 2.5% $72,5881945 171 5,585 3.1% 137,4421950 280 11,853 2.4% 237,8661955 747 21,185 3.5% 745,6791960 1,775 33,068 5.4% 2,055,1391965 3,631 49,701 7.3% 5,486,2251970 6,308 65,586 9.6% 13,115,2341975 11,650 84,781 13.7% 32,820,4331980 17,301 96,473 17.9% 71,289,4561985 24,842 101,409 24.5% 192,456,0291990 32,955 115,350 28.6% 350,398,0941995 41,909 203,102 20.6% 639,501,7962000 53,015 248,104 21.4% 1,093,779,0682005 69,416 306,139 22.7% 1,973,240,4912010 91,412 378,264 24.2% 3,161,773,7812015 108,426 436,465 24.8% 4,073,789,8972016 111,975 451,760 24.8% 4,260,156,4372017 115,801 465,590 24.9% 4,458,990,8012018 119,435 481,991 24.8% 4,611,125,0712019 122,568 496,725 24.7% 4,708,541,219
1 Amounts derived on a cash basis. Data prior to 2010 does not include the DPS Division. 2 Includes inactive member accounts.
Actuarial Section
DIVISION TRUST FUNDS—PENSION
178 Actuarial Section � Colorado PERA Comprehensive Annual Financial Report 2019
Final D
raft
June
12,
202
0

SCHEDULE OF MEMBERS IN ACTUARIAL VALUATIONBy Attained Age and Years of Service as of December 31, 2019(In Actual Dollars)
State DivisionFor State Division members (excluding State Troopers) the average age was 45.4 years, the average service was 8.7 years,and the average expected remaining service life was 9.0 years. For State Troopers the average age was 42.1 years, theaverage service was 12.7 years, and the average expected remaining service life was 10.8 years.
Attained Age
Years of Service to Valuation Date Total
0–4 5–9 10–14 15–19 20–24 25–29 30+ No.Annual
Valuation PayrollUp to 20 232 — — — — — — 232 $2,271,12320 - 24 1,879 14 — — — — — 1,893 53,843,91625 - 29 4,319 497 9 — — — — 4,825 196,347,09430 - 34 4,133 1,788 333 6 — — — 6,260 301,359,83435 - 39 3,242 1,908 1,212 286 17 — — 6,665 359,095,26340 - 44 2,382 1,549 1,267 942 291 10 — 6,441 377,120,95145 - 49 3,375 1,595 1,281 1,032 902 337 22 8,544 501,959,95650 - 54 1,776 1,223 1,104 940 887 636 168 6,734 421,656,08055 - 59 1,483 1,009 1,140 966 758 496 303 6,155 369,950,92960 234 156 210 183 131 80 64 1,058 61,559,07761 234 175 208 183 106 77 68 1,051 61,864,87862 198 168 191 163 103 80 55 958 55,921,90263 181 168 152 123 93 64 61 842 49,194,00764 133 123 170 139 72 72 49 758 44,430,13665 119 133 111 103 68 41 36 611 32,889,14866 95 93 98 83 59 33 31 492 26,759,58567 95 66 70 56 33 23 20 363 18,030,79368 74 46 51 49 27 21 19 287 14,721,87969 80 45 45 37 24 19 21 271 12,383,93370 + 251 135 131 114 66 48 67 812 34,092,337
Total 24,515 10,891 7,783 5,405 3,637 2,037 984 55,252 $2,995,452,821
Actuarial Section
DIVISION TRUST FUNDS—PENSION
Colorado PERA Comprehensive Annual Financial Report 2019 � Actuarial Section 179
Final D
raft
June
12,
202
0

SCHEDULE OF MEMBERS IN ACTUARIAL VALUATIONBy Attained Age and Years of Service as of December 31, 2019(In Actual Dollars)
School DivisionFor School Division members the average age was 44.6 years, the average service was 8.4 years, and the average expectedremaining service life was 9.3 years.
Attained Age
Years of Service to Valuation Date Total
0–4 5–9 10–14 15–19 20–24 25–29 30+ No.Annual
Valuation PayrollUp to 20 1,261 — — — — — — 1,261 $11,141,94120 - 24 5,487 96 — — — — — 5,583 122,233,34725 - 29 9,864 1,791 50 — — — — 11,705 390,366,81530 - 34 7,432 4,601 1,073 35 — — — 13,141 496,891,65835 - 39 7,263 3,631 3,676 1,014 30 — — 15,614 631,431,30340 - 44 9,645 3,296 3,036 3,279 676 25 — 19,957 803,513,72145 - 49 5,965 3,104 2,870 2,710 2,404 568 25 17,646 822,923,73450 - 54 4,263 2,499 2,720 2,482 1,950 1,600 226 15,740 746,953,24655 - 59 3,509 1,978 2,290 2,555 1,678 1,057 505 13,572 584,327,25160 565 339 382 489 281 156 75 2,287 90,119,16661 550 286 351 376 253 148 67 2,031 81,006,75762 544 246 303 345 226 115 68 1,847 69,374,13263 491 224 256 271 186 101 65 1,594 58,822,54864 393 220 207 232 162 111 48 1,373 50,585,55065 367 163 139 168 110 73 38 1,058 35,302,79266 297 162 124 117 69 58 23 850 27,502,15967 251 101 84 70 46 38 24 614 17,381,00568 272 98 75 54 40 29 18 586 15,291,36569 261 74 45 56 28 19 15 498 11,938,71370 + 1,004 369 279 145 86 49 49 1,981 37,323,685
Total 59,684 23,278 17,960 14,398 8,225 4,147 1,246 128,938 $5,104,430,888
Actuarial Section
DIVISION TRUST FUNDS—PENSION
180 Actuarial Section � Colorado PERA Comprehensive Annual Financial Report 2019
Final D
raft
June
12,
202
0

SCHEDULE OF MEMBERS IN ACTUARIAL VALUATIONBy Attained Age and Years of Service as of December 31, 2019(In Actual Dollars)
Local Government DivisionFor Local Government Division members the average age was 44.0 years, the average service was 7.5 years, and theaverage expected remaining service life was 8.3 years.
Attained Age
Years of Service to Valuation Date Total
0–4 5–9 10–14 15–19 20–24 25–29 30+ No.Annual
Valuation PayrollUp to 20 643 — — — — — — 643 $4,046,40120 - 24 658 12 — — — — — 670 14,392,46225 - 29 1,025 120 8 — — — — 1,153 44,793,85630 - 34 985 307 79 10 — — — 1,381 69,968,08835 - 39 740 355 193 80 12 — — 1,380 79,378,11840 - 44 801 330 248 172 64 3 — 1,618 93,884,39145 - 49 544 266 249 287 139 57 8 1,550 103,784,94150 - 54 458 254 226 240 138 87 19 1,422 93,113,64055 - 59 412 224 235 265 158 86 69 1,449 90,708,70960 74 49 42 40 20 18 13 256 14,471,38361 73 28 45 33 22 21 8 230 14,635,89062 56 31 39 39 22 7 15 209 12,810,01963 55 38 25 25 21 16 6 186 10,463,60664 53 20 27 32 20 11 7 170 8,726,87565 41 17 20 23 8 9 4 122 6,466,02166 46 23 16 11 7 1 4 108 4,125,05567 42 20 10 12 6 3 4 97 4,199,39068 31 13 14 5 4 5 5 77 3,490,04369 27 10 7 7 1 1 1 54 1,740,24070 + 198 43 33 24 6 5 2 311 5,894,392
Total 6,962 2,160 1,516 1,305 648 330 165 13,086 $681,093,520
Actuarial Section
DIVISION TRUST FUNDS—PENSION
Colorado PERA Comprehensive Annual Financial Report 2019 � Actuarial Section 181
Final D
raft
June
12,
202
0
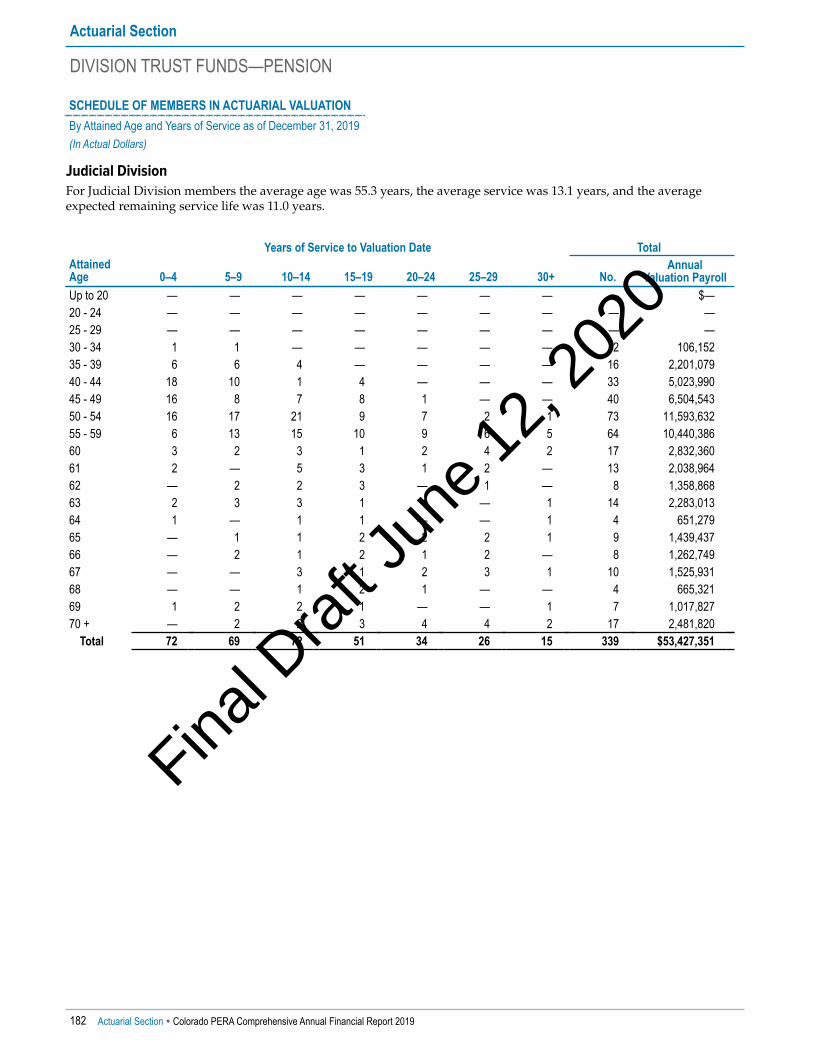
SCHEDULE OF MEMBERS IN ACTUARIAL VALUATIONBy Attained Age and Years of Service as of December 31, 2019(In Actual Dollars)
Judicial DivisionFor Judicial Division members the average age was 55.3 years, the average service was 13.1 years, and the averageexpected remaining service life was 11.0 years.
Attained Age
Years of Service to Valuation Date Total
0–4 5–9 10–14 15–19 20–24 25–29 30+ No.Annual
Valuation PayrollUp to 20 — — — — — — — — $—20 - 24 — — — — — — — — —25 - 29 — — — — — — — — —30 - 34 1 1 — — — — — 2 106,15235 - 39 6 6 4 — — — — 16 2,201,07940 - 44 18 10 1 4 — — — 33 5,023,99045 - 49 16 8 7 8 1 — — 40 6,504,54350 - 54 16 17 21 9 7 2 1 73 11,593,63255 - 59 6 13 15 10 9 6 5 64 10,440,38660 3 2 3 1 2 4 2 17 2,832,36061 2 — 5 3 1 2 — 13 2,038,96462 — 2 2 3 — 1 — 8 1,358,86863 2 3 3 1 4 — 1 14 2,283,01364 1 — 1 1 — — 1 4 651,27965 — 1 1 2 2 2 1 9 1,439,43766 — 2 1 2 1 2 — 8 1,262,74967 — — 3 1 2 3 1 10 1,525,93168 — — 1 2 1 — — 4 665,32169 1 2 2 1 — — 1 7 1,017,82770 + — 2 2 3 4 4 2 17 2,481,820
Total 72 69 72 51 34 26 15 339 $53,427,351
Actuarial Section
DIVISION TRUST FUNDS—PENSION
182 Actuarial Section � Colorado PERA Comprehensive Annual Financial Report 2019
Final D
raft
June
12,
202
0

SCHEDULE OF MEMBERS IN ACTUARIAL VALUATIONBy Attained Age and Years of Service as of December 31, 2019(In Actual Dollars)
DPS DivisionFor DPS Division members the average age was 40.8 years, the average service was 6.6 years, and the average expectedremaining service life was 10.3 years.
Attained Age
Years of Service to Valuation Date Total
0–4 5–9 10–14 15–19 20–24 25–29 30+ No.Annual
Valuation PayrollUp to 20 109 — — — — — — 109 $1,420,41920 - 24 795 8 — — — — — 803 20,889,81425 - 29 1,903 307 6 — — — — 2,216 89,555,01730 - 34 1,493 972 163 3 — — — 2,631 126,807,32135 - 39 950 766 435 42 1 — — 2,194 115,291,52740 - 44 1,429 529 380 182 41 1 — 2,562 120,803,42545 - 49 506 397 281 239 115 21 3 1,562 84,979,30950 - 54 348 303 225 173 139 74 9 1,271 69,529,22055 - 59 263 262 208 128 103 63 26 1,053 54,042,36760 49 38 28 23 16 4 4 162 7,715,28561 48 53 30 19 18 6 4 178 7,935,54162 26 55 27 13 13 7 6 147 6,589,57363 37 38 29 17 11 6 5 143 6,358,02864 27 36 16 23 11 4 4 121 5,618,94965 26 32 22 18 6 2 2 108 4,883,55866 25 17 7 9 8 6 4 76 3,182,05267 28 15 8 3 5 1 2 62 2,263,96368 20 14 8 5 5 — 1 53 1,895,36269 19 12 4 3 2 1 — 41 1,258,42270 + 70 66 26 7 7 7 4 187 5,244,646
Total 8,171 3,920 1,903 907 501 203 74 15,679 $736,263,798
Actuarial Section
DIVISION TRUST FUNDS—PENSION
Colorado PERA Comprehensive Annual Financial Report 2019 � Actuarial Section 183
Final D
raft
June
12,
202
0

SCHEDULE OF ACTIVE MEMBER ACTUARIAL VALUATION DATAAs of December 31(In Actual Dollars)
Year
Number of Participating Employers1
Number of Active Members
Annual Payroll for Active Members
Average Annual Pay for Active Members
% Increase (Decrease) in Average Annual Pay
State Division2010 70 54,977 $2,392,080,128 $43,511 —2011 70 54,956 2,393,791,402 43,558 0.11%2012 70 54,804 2,384,933,961 43,518 (0.09%)2013 70 55,354 2,474,965,482 44,712 2.74%2014 32 55,300 2,564,669,718 46,377 3.72%2015 32 55,291 2,641,866,650 47,781 3.03%2016 32 55,725 2,710,650,565 48,643 1.80%2017 32 55,686 2,774,207,203 49,819 2.42%2018 32 55,511 2,898,827,271 52,221 4.82%2019 32 55,252 2,995,452,821 54,214 3.82%
School Division2010 271² 116,486 $3,900,661,576 $33,486 —2011 275² 114,820 3,821,603,410 33,283 (0.61%)2012 281² 115,294 3,819,065,598 33,125 (0.47%)2013 294² 117,727 3,938,649,818 33,456 1.00%2014 224 119,618 4,063,235,757 33,968 1.53%2015 227 120,239 4,235,290,282 35,224 3.70%2016 229 121,945 4,349,319,783 35,666 1.25%2017 234 122,990 4,471,356,847 36,355 1.93%2018 234 126,333 4,789,503,451 37,912 4.28%2019 235 128,938 5,104,430,888 39,588 4.42%
Local Government Division2010 142 16,144 $705,265,331 $43,686 —2011 145 16,065 718,169,015 44,704 2.33%2012 143 12,097 523,668,446 43,289 (3.17%)2013 146 11,954 529,003,436 44,253 2.23%2014 141 12,084 540,468,037 44,726 1.07%2015 140 12,176 561,518,205 46,117 3.11%2016 141 12,736 608,222,609 47,756 3.55%2017 140 12,770 632,768,337 49,551 3.76%2018 141 13,260 660,998,127 49,849 0.60%2019 141 13,086 681,093,520 52,047 4.41%
Judicial Division2010 6 317 $37,412,139 $118,019 —2011 6 329 39,033,369 118,642 0.53%2012 6 329 39,045,008 118,678 0.03%2013 6 332 39,941,730 120,306 1.37%2014 2 334 42,976,979 128,674 6.96%2015 2 334 46,869,730 140,329 9.06%2016 2 335 48,699,531 145,372 3.59%2017 2 332 48,947,607 147,433 1.42%2018 2 332 50,505,856 152,126 3.18%2019 2 339 53,427,351 157,603 3.60%
Please see page 185 for footnote references.
Actuarial Section
DIVISION TRUST FUNDS—PENSION
184 Actuarial Section � Colorado PERA Comprehensive Annual Financial Report 2019
Final D
raft
June
12,
202
0
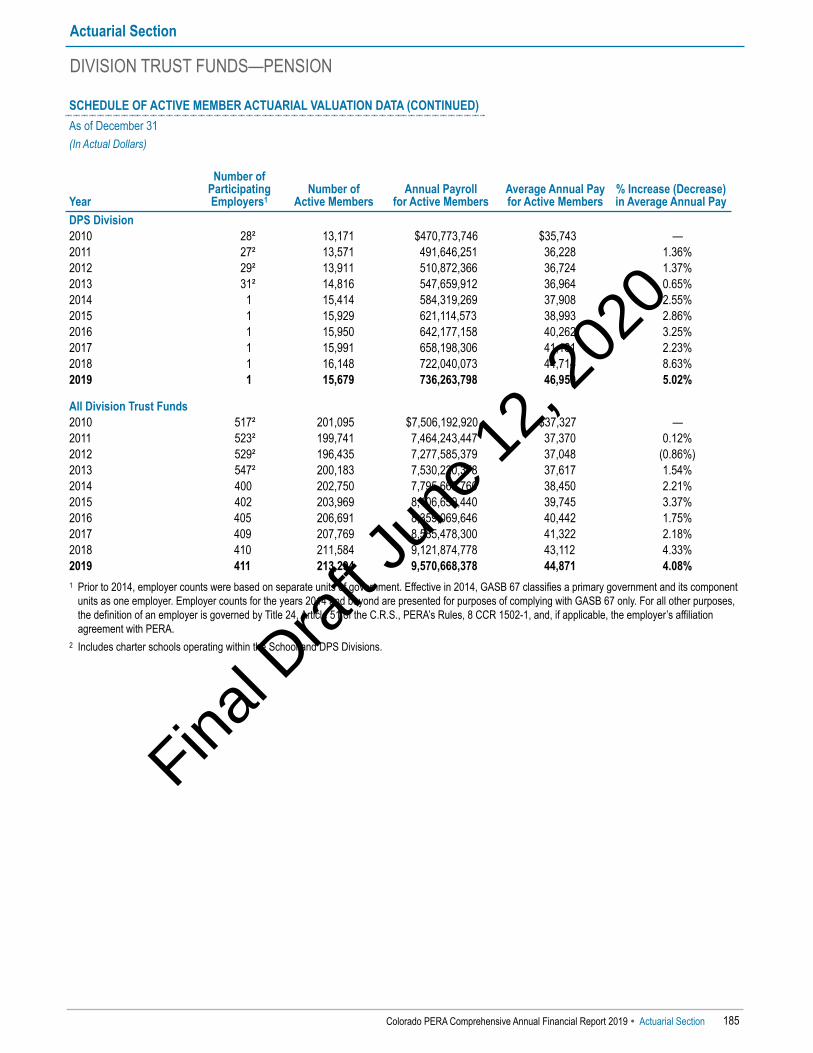
SCHEDULE OF ACTIVE MEMBER ACTUARIAL VALUATION DATA (CONTINUED)As of December 31(In Actual Dollars)
Year
Number of Participating Employers1
Number of Active Members
Annual Payroll for Active Members
Average Annual Pay for Active Members
% Increase (Decrease) in Average Annual Pay
DPS Division2010 28² 13,171 $470,773,746 $35,743 —2011 27² 13,571 491,646,251 36,228 1.36%2012 29² 13,911 510,872,366 36,724 1.37%2013 31² 14,816 547,659,912 36,964 0.65%2014 1 15,414 584,319,269 37,908 2.55%2015 1 15,929 621,114,573 38,993 2.86%2016 1 15,950 642,177,158 40,262 3.25%2017 1 15,991 658,198,306 41,161 2.23%2018 1 16,148 722,040,073 44,714 8.63%2019 1 15,679 736,263,798 46,959 5.02%
All Division Trust Funds2010 517² 201,095 $7,506,192,920 $37,327 —2011 523² 199,741 7,464,243,447 37,370 0.12%2012 529² 196,435 7,277,585,379 37,048 (0.86%)2013 547² 200,183 7,530,220,378 37,617 1.54%2014 400 202,750 7,795,669,760 38,450 2.21%2015 402 203,969 8,106,659,440 39,745 3.37%2016 405 206,691 8,359,069,646 40,442 1.75%2017 409 207,769 8,585,478,300 41,322 2.18%2018 410 211,584 9,121,874,778 43,112 4.33%2019 411 213,294 9,570,668,378 44,871 4.08%
1 Prior to 2014, employer counts were based on separate units of government. Effective in 2014, GASB 67 classifies a primary government and its componentunits as one employer. Employer counts for the years 2014 and beyond are presented for purposes of complying with GASB 67 only. For all other purposes,the definition of an employer is governed by Title 24, Article 51 of the C.R.S., PERA’s Rules, 8 CCR 1502-1, and, if applicable, the employer’s affiliationagreement with PERA.
2 Includes charter schools operating within the School and DPS Divisions.
Actuarial Section
DIVISION TRUST FUNDS—PENSION
Colorado PERA Comprehensive Annual Financial Report 2019 � Actuarial Section 185
Final D
raft
June
12,
202
0

Actuarial TopicsThe standard promulgated by the GASB Statement No. 74 results in the preparation of two actuarial valuations—one forfunding purposes and one for accounting and financial reporting purposes. Unless otherwise noted, this Health CareTrust Funds subsection reports on the actuarial valuation performed for funding purposes, but also includes informationon specific differences between the two actuarial valuations.
The Other Postemployment Benefit (OPEB) plan provisions in effect on December 31, 2019, are summarized in Note 9 ofthe Notes to the Financial Statements in the Financial Section.
Actuarial Section
HEALTH CARE TRUST FUNDS—OPEB
186 Actuarial Section � Colorado PERA Comprehensive Annual Financial Report 2019
PERA BOARD GOVERNANCE - TWO DEFINED BENEFIT OPEB PLANSPERA Defined BenefitOPEB Plans
PERA's two defined benefit OPEB plans include the Health Care Trust Fund (HCTF), a cost-sharing multiple-employerplan, and the Denver Public Schools Health Care Trust Fund (DPS HCTF), a single-employer plan.The HCTF and the DPS HCTF provide a subsidy for PERACare, PERA’s health benefits program. Participation in theHCTF and the DPS HCTF is voluntary pursuant to C.R.S. § 24-51-1201. Employer contributions and investmentearnings on the assets of the plans pay for the costs. The HCTF was established as of July 1, 1985, and the DPS HCTF was established January 1, 2010, with the assettransfer from the Denver Public Schools Retiree Health Benefit Trust held by the DPS Board of Education. The HCTFand the DPS HCTF provide a health care premium subsidy based upon the benefit structure under which a memberretires and the member’s years of service credit. There is an allocation of the premium subsidy between the trust fundsfor members who retire with service credit in the DPS Division and one or more of the other divisions, as set forth inC.R.S. § 24-51-1206.5. The basis for the allocation of the premium subsidy is the percentage of the member contributionbalance from each division as it relates to the total member contribution account balance.
PERA Board OPEBFunding Policy
The PERA Board is responsible for maintaining an OPEB funding policy applicable to these plans.The current OPEB funding policy initially was adopted by the Board on January 19, 2018, effective for theDecember 31, 2017, funding actuarial valuation. The OPEB funding policy requires the calculation of an ADC for each ofthe two Health Care Trust Funds for the purpose of assessing the adequacy of the statutory contribution rate of eachfund. The ADC is determined in accordance with the OPEB plan provisions in effect as of the date of the actuary's Letterof Certification and is expressed as a level percentage of assumed future covered payroll.
Actuarial Service Provider& Other Responsibilities
The Board retains an external actuary, and effective November 1, 2018, Segal was retained to perform annual actuarialvaluations and sustainability projections as well as periodic experience studies to review the actuarial assumptionsversus actual plan experience. In addition, the Board has the authority to contract, self-insure, and authorize disbursements necessary in order to carryout the purposes of the PERACare program including the administration of the health care subsidies.
Actuarial Service ProviderFunding MethodStatement
Per their actuarial valuation report, "Segal strongly recommends an actuarial funding method that targets 100% fundingof the actuarial accrued liability. Generally, this implies payments that are ultimately at least enough to cover normal cost,interest on the unfunded actuarial accrued liability and a portion of the principal balance. The OPEB funding policyadopted by PERA meets this standard."
ACTUARIAL METHODSActuarial Methods The Board is responsible for the actuarial methods and assumptions used in the actuarial valuations in accordance with
C.R.S. § 24-51-204(5). Through formal action, the Board updates, replaces, or adopts new actuarial methods andassumptions as deemed necessary.Initial valuations were performed on an "open group" basis approximately once every two years. Annual valuationscommenced with the December 31, 1998, actuarial valuation.Fina
l Dra
ft Ju
ne 1
2, 2
020

Actuarial Methods Type Description/Source/Basis Adoption / Effective DateAsset Valuation Method Smoothed Actuarial Value of
AssetsIn 1992, the Board adopted a method for valuing assetsthat determines a smoothed market value (or “fair value,”as used in other sections of this CAFR) of assets to helpmitigate volatile investment market experience.
Initially Adopted: 1992;Effective: Jan 1, 1993;Reinitialized to Market Valueas of: Dec 31, 2004;Effective: Dec 31, 2005The smoothed market value of assets recognizes the
differences between actual and expected investmentexperience for each year in equal amounts over a four-year period.
Actuarial Cost Method Entry Age Actuarial CostMethod (EA)
The EA funding or cost method is designed to keep annualcosts level as a percent of covered payroll and for thisreason, was selected by the Board to be used in theactuarial valuations.
EA Effective: Jan 1, 1991;Normal Cost basis changedfrom service tocompensation - Effective: Dec 31, 2016The method to determine normal cost, original based on
credited service, is determined based on compensation asof the December 31, 2016, actuarial valuation. The effect of differences between the actuarialassumptions and the actual experience of the plan isdetermined within each annual actuarial valuation. Thesedifferences produce actuarial gains or losses that result inan adjustment of the UAAL.
Amortization Method Defined, Closed andLayered Periods
The ADC is determined by adding the normal cost and thecost to amortize, over defined, closed periods, any existingUAAL or new UAAL, including the impact of anyexperience actuarial gains and losses, actuarialassumption changes, and changes in plan provisions.Each amortized item is tracked over the closed perioddefined for that category.
Initially Adopted: Jan 19, 2018;Effective: Dec 31, 2017
The 30-year period used to amortize the legacy UAAL wasinitialized as of December 31, 2017. All gains, losses, andchanges in actuarial methods and assumptions on andafter January 1, 2018, are recognized each year andamortized separately over closed 30-year periods.The impact of any changes in plan provisions will berecognized over a closed period relating to thedemographics of the group affected and/or the duration ofthe enhancement provided, not to exceed 25 years. If anyfuture actuarial valuation indicates a division has anegative UAAL, the ADC shall be set equal to the normalcost until such time as the funded ratio equals or exceeds120 percent. At that time, the ADC shall be equal to thenormal cost less an amount equal to 15 year amortizationof the portion of the negative UAAL above the 120 percentfunded ratio.
Actuarial Section
HEALTH CARE TRUST FUNDS—OPEB
Colorado PERA Comprehensive Annual Financial Report 2019 � Actuarial Section 187
Final D
raft
June
12,
202
0

ACTUARIAL ASSUMPTIONSActuarial Assumptions1 Unless otherwise noted, it can be assumed that the economic and demographic actuarial assumptions applied to the
actuarial valuation for funding purposes also were applied to the actuarial valuation for accounting and financialreporting purposes.All actuarial methods and assumptions necessary to assess OPEB liabilities, in addition to those already provided onprevious pages, are described below. The actuary followed ASOP No. 6, Measuring Retiree Group Benefit Obligations,for purposes of recommending appropriate OPEB-specific assumptions.Basis of ActuarialAssumptions Used
Unless otherwise noted, the basis of all selected economic and non-economic actuarialassumptions resulted from the 2016 Experience Analysis and/or discussions that tookplace during the October 28, 2016, Assumptions Workshop. It also should be noted thatas a result of the 2019 Asset Liability Study, concluded at the November 15, 2019, Boardmeeting, the Board reaffirmed the 7.25 percent assumed long-term rate of investmentreturn effective as of January 1, 2020.
1 See Exhibits J through N for detailed assumption information.
Economic Assumptions Value(s) / Type Description/Source/Basis Adoption / Effective DateInitial Per Capita HealthCare Costs - PERA BenefitStructure
Exhibit J Exhibit J contains the assumptions used in determining theadditional liability for PERACare enrollees under the PERAbenefit structure who are age 65 or older and who are noteligible for premium-free Medicare Part A. Shown are themonthly costs/premiums assumed for 2020, which aresubject to the morbidity rates and health care costtrend rates. Basis: Reviewed and updated annually
Updated Effective:Dec 31, 2019
Age-Related MorbidityRates - PERA BenefitStructure
Exhibit J See above Initially Effective:Dec 31, 2015; Last Updated Effective: Dec 31, 2018
Health Care Cost TrendRates - PERA BenefitStructure
Exhibit J See above Updated Effective: Dec 31, 2019
Additional PremiumSubsidy Assumptions -DPS Benefit Structure
Exhibit K Dollar subsidy amounts used in determining the additionalliability for PERACare enrollees under the DPS benefitstructure who are age 65 or older and who are not eligiblefor premium-free Medicare Part A. Basis: Additional subsidy for DPS Benefit Structure in effectas of January 1, 2010
Subsidy amounts in effectas of Merger of theDPS Retirement Systeminto PERA, Effective: Jan 1, 2010
Actuarial Section
HEALTH CARE TRUST FUNDS—OPEB
188 Actuarial Section � Colorado PERA Comprehensive Annual Financial Report 2019
Final D
raft
June
12,
202
0

Non-EconomicAssumptions Value(s) / Type Description/Source/Basis
Adoption / Effective Date
Health Care ParticipationRate Assumptions
Exhibit L Current PERACare participants are assumed to maintaintheir current health care benefit elections in perpetuity. Foractive members retiring directly from covered employment,Exhibit L provides the assumed participation rates. Theparticipation of current PERACare enrollees and membersretiring directly from active service is adjusted to reflect theincreasing rate of participation with age, as described inExhibit L.
Updated and Effective:Dec 31, 2016; reviewed andupdated annually, asnecessary
Survivors of RetireesChoosing Joint & SurvivorPayment Options
70% Survivors of retirees under the PERA benefit structureelecting health care coverage are eligible to receive thesubsidy. To anticipate future liabilities driven by thesesurvivors, it is assumed that 70 percent of the currentmembers assumed to elect PERACare coverage willchoose a joint and survivor optional payment and thus,their survivors will qualify for the subsidy.
Last Confirmed Effective:Dec 31, 2016
Age Differences Male Retiree: Three YearsOlder; Female Retiree: OneYear Older
The assumed average number of years a covered malespouse is older than a covered female spouse is threeyears for a male retiree and one year for a femaleretiree. These assumptions initially were determinedfrom actual census data and were revised from theprevious non-gender specific assumptions used in prioractuarial valuations.
Last Revised: Nov 18, 2016;Effective: Dec 31, 2016
Health Care ParticipationElection Assumption forInactive Members
Inactive Members: 25% The current assumption for eligible inactive members isthat 25 percent are assumed to elect health care coverageupon commencement of their monthly benefit.
Last Revised: Sept 2009;Effective: Dec 31, 2009
Health Care ParticipationSpousal ElectionAssumption for InactiveMembers and FutureRetirees
Spouses: 20% (DPSDivision, 15%)
The assumed percentage of eligible inactive members andfuture retirees electing coverage for their spouses is20 percent for all divisions except the DPS Division, whichis 15 percent.
Last Revised: Nov 18, 2016; Effective: Dec 31, 2016
Commencement AgeAssumed for InactiveMembers
Ranging From Age 50 to 65 For eligible inactive members, an average age at whichhealth benefits are to begin must be assumed. Here, theassumed age of initial benefit receipt is determined usingthe same approach used for terminating active memberswho are assumed to leave their contributions in the plan inorder to be eligible for a pension benefit at their retirementdate. This assumption varies from age 50 to age 65depending on benefit structure and years of service.
Effective: Dec 31, 2015
Medicare Health Care PlanElection RateAssumptions
Exhibit M Exhibit M shows the assumed plan elections for currentand future Medicare-eligible retirees who are not eligiblefor premium-free Medicare Part A.
Effective: Dec 31, 2015;Last Revised: Dec 31, 2018;Reviewed and updatedannually, as necessary
Percent Qualifying for “NoPart A” SubsidyAssumptions
Exhibit N For those current PERACare enrollees who are age 65 andolder, the premium-free Medicare Part A eligibility status isprovided by PERA and is assumed to be maintained inperpetuity. For current PERACare enrollees not yet age 65,estimated to have been hired prior to April 1, 1986, and notassumed eligible for premium-free Medicare Part Acoverage through their spouse, and for those activeemployees hired prior to April 1, 1986, Exhibit N lists thepercentage, by estimated age at hire, of PERACareenrollees assumed to not qualify for premium-freeMedicare Part A benefits, thus qualifying for the applicable”No Part A” subsidy. The percentage of disability retirees enrolled in PERACareassumed to qualify for the “No Part A” subsidy is10 percent. Regarding spousal coverage, of the PERACare enrolleesassumed to receive the ”No Part A” subsidy from the PERAbenefit structure, 10 percent are assumed to covera spouse.
Effective: Dec 31, 2015;Last Revised: Dec 31, 2016;Reviewed and updatedannually, as necessary
Actuarial Section
HEALTH CARE TRUST FUNDS—OPEB
Colorado PERA Comprehensive Annual Financial Report 2019 � Actuarial Section 189
Final D
raft
June
12,
202
0
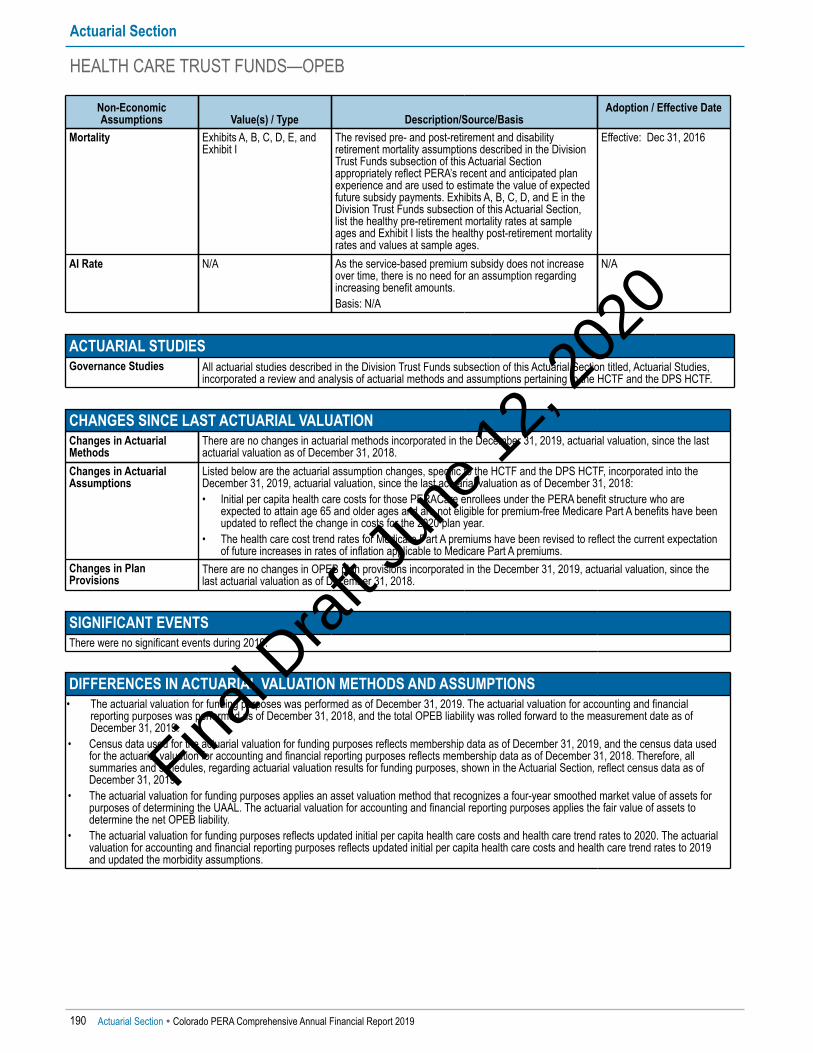
ACTUARIAL STUDIESGovernance Studies All actuarial studies described in the Division Trust Funds subsection of this Actuarial Section titled, Actuarial Studies,
incorporated a review and analysis of actuarial methods and assumptions pertaining to the HCTF and the DPS HCTF.
CHANGES SINCE LAST ACTUARIAL VALUATIONChanges in ActuarialMethods
There are no changes in actuarial methods incorporated in the December 31, 2019, actuarial valuation, since the lastactuarial valuation as of December 31, 2018.
Changes in ActuarialAssumptions
Listed below are the actuarial assumption changes, specific to the HCTF and the DPS HCTF, incorporated into theDecember 31, 2019, actuarial valuation, since the last actuarial valuation as of December 31, 2018: • Initial per capita health care costs for those PERACare enrollees under the PERA benefit structure who are
expected to attain age 65 and older ages and are not eligible for premium-free Medicare Part A benefits have beenupdated to reflect the change in costs for the 2020 plan year.
• The health care cost trend rates for Medicare Part A premiums have been revised to reflect the current expectationof future increases in rates of inflation applicable to Medicare Part A premiums.
Changes in PlanProvisions
There are no changes in OPEB plan provisions incorporated in the December 31, 2019, actuarial valuation, since thelast actuarial valuation as of December 31, 2018.
SIGNIFICANT EVENTSThere were no significant events during 2019.
DIFFERENCES IN ACTUARIAL VALUATION METHODS AND ASSUMPTIONS• The actuarial valuation for funding purposes was performed as of December 31, 2019. The actuarial valuation for accounting and financial
reporting purposes was performed as of December 31, 2018, and the total OPEB liability was rolled forward to the measurement date as ofDecember 31, 2019.
• Census data used for the actuarial valuation for funding purposes reflects membership data as of December 31, 2019, and the census data usedfor the actuarial valuation for accounting and financial reporting purposes reflects membership data as of December 31, 2018. Therefore, allsummaries and schedules, regarding actuarial valuation results for funding purposes, shown in the Actuarial Section, reflect census data as ofDecember 31, 2019.
• The actuarial valuation for funding purposes applies an asset valuation method that recognizes a four-year smoothed market value of assets forpurposes of determining the UAAL. The actuarial valuation for accounting and financial reporting purposes applies the fair value of assets todetermine the net OPEB liability.
• The actuarial valuation for funding purposes reflects updated initial per capita health care costs and health care trend rates to 2020. The actuarialvaluation for accounting and financial reporting purposes reflects updated initial per capita health care costs and health care trend rates to 2019and updated the morbidity assumptions.
Non-EconomicAssumptions Value(s) / Type Description/Source/Basis
Adoption / Effective Date
Mortality Exhibits A, B, C, D, E, andExhibit I
The revised pre- and post-retirement and disabilityretirement mortality assumptions described in the DivisionTrust Funds subsection of this Actuarial Sectionappropriately reflect PERA’s recent and anticipated planexperience and are used to estimate the value of expectedfuture subsidy payments. Exhibits A, B, C, D, and E in theDivision Trust Funds subsection of this Actuarial Section,list the healthy pre-retirement mortality rates at sampleages and Exhibit I lists the healthy post-retirement mortalityrates and values at sample ages.
Effective: Dec 31, 2016
AI Rate N/A As the service-based premium subsidy does not increaseover time, there is no need for an assumption regardingincreasing benefit amounts.Basis: N/A
N/A
Actuarial Section
HEALTH CARE TRUST FUNDS—OPEB
190 Actuarial Section � Colorado PERA Comprehensive Annual Financial Report 2019
Final D
raft
June
12,
202
0
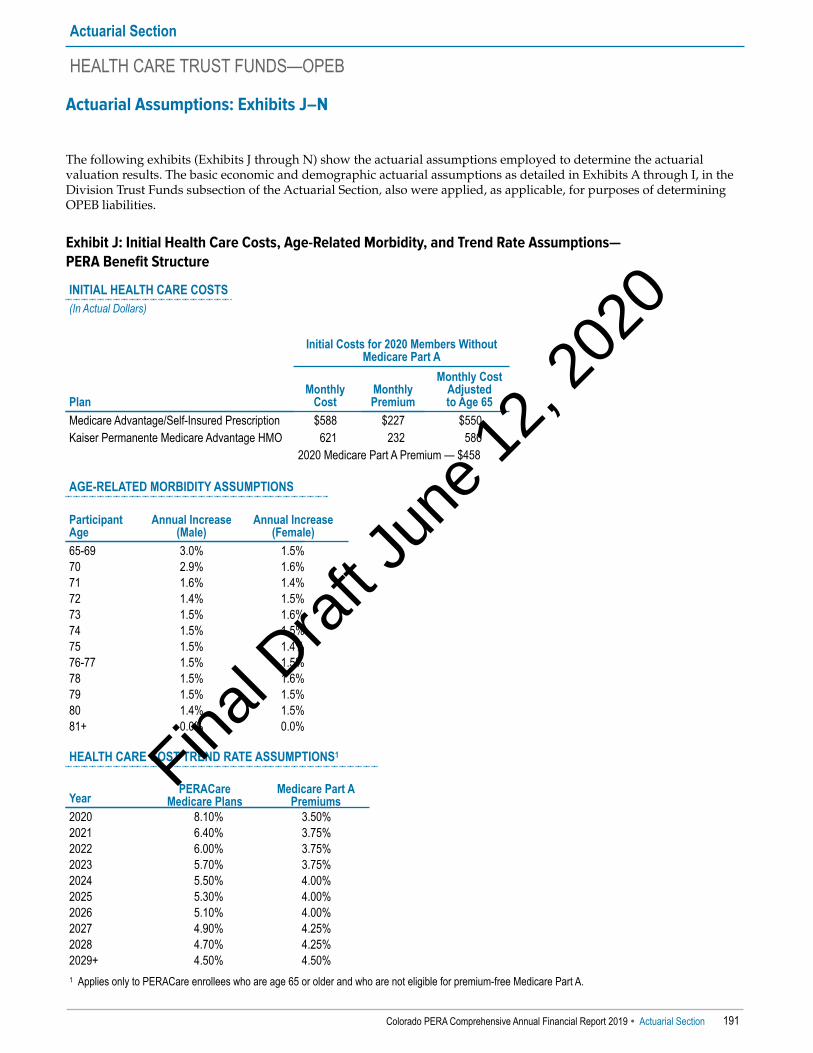
Actuarial Assumptions: Exhibits J–N
The following exhibits (Exhibits J through N) show the actuarial assumptions employed to determine the actuarialvaluation results. The basic economic and demographic actuarial assumptions as detailed in Exhibits A through I, in theDivision Trust Funds subsection of the Actuarial Section, also were applied, as applicable, for purposes of determiningOPEB liabilities.
Exhibit J: Initial Health Care Costs, Age-Related Morbidity, and Trend Rate Assumptions—PERA Benefit Structure
INITIAL HEALTH CARE COSTS(In Actual Dollars)
Initial Costs for 2020 Members WithoutMedicare Part A
PlanMonthly
CostMonthly Premium
Monthly CostAdjusted to Age 65
Medicare Advantage/Self-Insured Prescription $588 $227 $550Kaiser Permanente Medicare Advantage HMO 621 232 586
2020 Medicare Part A Premium — $458
AGE-RELATED MORBIDITY ASSUMPTIONS
ParticipantAge
Annual Increase(Male)
Annual Increase(Female)
65-69 3.0% 1.5%70 2.9% 1.6%71 1.6% 1.4%72 1.4% 1.5%73 1.5% 1.6%74 1.5% 1.5%75 1.5% 1.4%76-77 1.5% 1.5%78 1.5% 1.6%79 1.5% 1.5%80 1.4% 1.5%81+ 0.0% 0.0%
HEALTH CARE COST TREND RATE ASSUMPTIONS1
YearPERACare
Medicare PlansMedicare Part A
Premiums2020 8.10% 3.50%2021 6.40% 3.75%2022 6.00% 3.75%2023 5.70% 3.75%2024 5.50% 4.00%2025 5.30% 4.00%2026 5.10% 4.00%2027 4.90% 4.25%2028 4.70% 4.25%2029+ 4.50% 4.50%
1 Applies only to PERACare enrollees who are age 65 or older and who are not eligible for premium-free Medicare Part A.
Actuarial Section
HEALTH CARE TRUST FUNDS—OPEB
Colorado PERA Comprehensive Annual Financial Report 2019 � Actuarial Section 191
Final D
raft
June
12,
202
0

Exhibit K: Additional Premium Subsidy Assumptions—DPS Benefit Structure1
Years of Service
Monthly Subsidy forMembers
Without Medicare Part AYears
of Service
Monthly Subsidy forMembers
Without Medicare Part A20+ $115.00 10 $57.5019 109.25 9 51.7518 103.50 8 46.0017 97.75 7 40.2516 92.00 6 34.5015 86.25 5 28.7514 80.50 4 23.0013 74.75 3 17.2512 69.00 2 11.5011 63.25 1 5.75
1 Health care assumptions for future PERACare enrollees who are age 65 or older and who are assumed to not be eligible for premium-free Medicare Part A.
Exhibit L: Health Care Participation Rate Assumptions
Percent Electing Health Care Coverage Percent Electing Health Care CoverageAttained Age(s) Other Divisions DPS Division Attained Age(s) Other Divisions DPS Division
15 – 48 20% 20% 61 50% 60%49 25% 25% 62 55% 60%50 25% 25% 63 55% 60%51 35% 35% 64 55% 60%52 35% 35% 65 55% 60%53 40% 40% 66 55% 60%54 40% 50% 67 55% 60%55 40% 50% 68 55% 60%56 45% 50% 69 55% 60%57 45% 50% 70 55% 60%58 50% 55% 71 55% 60%59 50% 55% 72+ 60% 65%60 50% 55%
Actuarial Section
HEALTH CARE TRUST FUNDS—OPEB
192 Actuarial Section � Colorado PERA Comprehensive Annual Financial Report 2019
Final D
raft
June
12,
202
0

Exhibit M: Medicare Health Care Plan Election Rate Assumptions
Percent Electing Medicare PlanMedicare Plan Other Divisions DPS DivisionMedicare Advantage/Self-Insured Prescription1 60% 40%Kaiser Permanente Medicare Advantage HMO 40% 60%
1 Eighty (80) percent of those PERACare enrollees participating in the self-insured plans are assumed to elect MS #1, 17 percent MS #2, and 3 percent MS #3.
Percent Electing Medicare Plan
Medicare PlanPre-Medicare Anthem Plans
Pre-Medicare Kaiser Plans
Medicare Advantage/Self-Insured Prescription1 88% 2%Kaiser Permanente Medicare Advantage HMO 12% 98%
1 Eighty (80) percent of those PERACare enrollees participating in the self-insured plans are assumed to elect MS #1, 17 percent MS #2, and 3 percent MS #3.
Exhibit N: Percent Qualifying for “No Part A” Subsidy Assumptions
Percent Qualifying for “No Part A” SubsidyHire Age HCTF1,2 DPS HCTF2
15 – 24 17% 17%25 – 29 11% 11%
30+ 4% 4% 1 Ten (10) percent of the PERACare enrollees assumed to qualify for the “No Part A” subsidy from the PERA benefit
structure are assumed to cover a spouse. 2 Ten (10) percent of the PERACare enrollees receiving health care benefits as a result of disability retirement are
assumed to qualify for the “No Part A” subsidy. One-hundred (100) percent of eligible inactive (or deferred vested) members enrolled in PERACare are assumed to obtain the 40 or more quarters of Medicare-covered employment required for premium-free Medicare Part A coverage as a result of their subsequent employment.
Actuarial Section
HEALTH CARE TRUST FUNDS—OPEB
Colorado PERA Comprehensive Annual Financial Report 2019 � Actuarial Section 193
Final D
raft
June
12,
202
0

Summary of Funding ProgressThe PERA funding objective is to pay long-term benefitpromises through contributions that remainapproximately level from year to year as a percent ofcovered payroll earned by PERA members. The followingschedules presented in this section provide an overview offunding progress:
• The solvency test shows the degree to which existingliabilities are funded, including prior history.
• A schedule of funding progress shows the UAAL asa percentage of annual covered payroll, includingprior history.
• A schedule detailing actuarial gains and losses, bysource, for the current year.
• The scheduled contribution requirements based on theDecember 31, 2019, actuarial valuation for the periodending December 31, 2021.
Actuarial Section
HEALTH CARE TRUST FUNDS—OPEB
194 Actuarial Section � Colorado PERA Comprehensive Annual Financial Report 2019
Solvency TestThe solvency test compares the plan’s actuarial value ofassets with: (A) member contributions (with interest) ondeposit, (B) the liabilities for future benefits to personswho have retired, died or become disabled, and to thosewho have terminated service with the right to a futurebenefit, and (C) the liabilities for service already renderedby active members. Since the HCTF and the DPS HCTF arefunded only through employer contributions, there are nomember contribution accounts (liability A). Each tablebelow and on the next page shows the funded level of theliabilities for future benefits to current retirees (liability B)and the unfunded liabilities associated with servicealready rendered by active members (liability C).
SOLVENCY TEST(Dollars in Thousands)
Aggregate Accrued LiabilitiesPortion of Actuarial Accrued Liabilities
Covered by Valuation Assets
Valuation Date
Active Member
Contributions (A)
Retirees, Beneficiaries, and
Inactive Members (B)
Employer-FinancedPortion of
Active Members (C)
ActuarialValue
of Plan AssetsLiability
(A)Liability
(B)Liability
(C)HCTF12/31/2010 N/A $1,179,809 $463,184 $288,193 N/A 24.4% 0.0%12/31/2011 N/A 1,251,579 459,211 282,228 N/A 22.5% 0.0%12/31/2012 N/A 1,259,557 463,938 285,097 N/A 22.6% 0.0%12/31/2013 N/A 1,092,438 464,968 293,556 N/A 26.9% 0.0%12/31/2014 N/A 1,085,995 448,466 297,377 N/A 27.4% 0.0%12/31/2015 N/A 1,099,045 457,224 285,588 N/A 26.0% 0.0%12/31/2016 N/A 1,153,015 403,747 270,150 N/A 23.4% 0.0%12/31/2017 N/A 1,178,160 403,062 260,282 N/A 22.1% 0.0%12/31/2018 N/A 1,084,313 393,801 288,323 N/A 26.6% 0.0%12/31/2019 N/A 1,048,219 398,950 348,433 N/A 33.2% 0.0%
DPS HCTF12/31/2010 N/A $58,432 $20,081 $14,086 N/A 24.1% 0.0%12/31/2011 N/A 57,093 20,382 14,448 N/A 25.3% 0.0%12/31/2012 N/A 54,727 22,942 14,443 N/A 26.4% 0.0%12/31/2013 N/A 52,106 24,530 15,482 N/A 29.7% 0.0%12/31/2014 N/A 50,998 25,028 16,502 N/A 32.4% 0.0%12/31/2015 N/A 49,891 25,006 17,557 N/A 35.2% 0.0%12/31/2016 N/A 51,357 21,488 18,945 N/A 36.9% 0.0%12/31/2017 N/A 50,796 19,496 21,117 N/A 41.6% 0.0%12/31/2018 N/A 48,268 21,184 25,018 N/A 51.8% 0.0%12/31/2019 N/A 46,398 21,539 31,189 N/A 67.2% 0.0%
Please see page 195 for footnote references.
Final D
raft
June
12,
202
0

SOLVENCY TEST (CONTINUED)(Dollars in Thousands)
Aggregate Accrued LiabilitiesPortion of Actuarial Accrued Liabilities
Covered by Valuation Assets
Valuation Date
Active Member
Contributions (A)
Retirees, Beneficiaries, and
Inactive Members (B)
Employer-FinancedPortion of
Active Members (C)
ActuarialValue
of Plan AssetsLiability
(A)Liability
(B)Liability
(C)Total of Health Care Trust Funds1
12/31/2010 N/A $1,238,241 $483,265 $302,279 N/A 24.4% 0.0%12/31/2011 N/A 1,308,672 479,593 296,676 N/A 22.7% 0.0%12/31/2012 N/A 1,314,284 486,880 299,540 N/A 22.8% 0.0%12/31/2013 N/A 1,144,544 489,498 309,038 N/A 27.0% 0.0%12/31/2014 N/A 1,136,993 473,494 313,879 N/A 27.6% 0.0%12/31/2015 N/A 1,148,936 482,230 303,145 N/A 26.4% 0.0%12/31/2016 N/A 1,204,372 425,235 289,095 N/A 24.0% 0.0%12/31/2017 N/A 1,228,956 422,558 281,399 N/A 22.9% 0.0%12/31/2018 N/A 1,132,581 414,985 313,341 N/A 27.7% 0.0%12/31/2019 N/A 1,094,617 420,489 379,622 N/A 34.7% 0.0%
1 The data in this table is aggregated for informational purposes. The assets of each trust fund are for the sole purpose of its members and cannot be used byanother fund.
Actuarial Section
HEALTH CARE TRUST FUNDS—OPEB
Colorado PERA Comprehensive Annual Financial Report 2019 � Actuarial Section 195
Unfunded Actuarial Accrued LiabilityUAAL is the difference between actuarially calculatedliability for service already rendered and the valuationassets of the fund.
The following factors resulted in lower liabilities (or gains)during 2019:
• Fewer members retired at earlier ages than expected.
• Fewer service and disability retirements wereexperienced than expected.
• Higher investment return than assumed in 2017 and2019.
• Retirees experienced shorter lifespans than expected.
• Favorable benefit utilization and claims experience afterreflecting administrative expenses.
• Actual payroll contributions were greater than thedetermined ADC for the HCTF and the DPS HCTF.
The following factors resulted in higher liabilities (orlosses) during 2019:
• Lower investment returns than assumed in 2016 and2018.
• Fewer members terminated PERA-covered employmentand withdrew their accounts than expected.
• New PERA members had some service resulting inaccrued liabilities.
Final D
raft
June
12,
202
0

SCHEDULE OF FUNDING PROGRESS(Dollars in Thousands)
(A)Valuation Date
(B) Actuarial Value of Plan Assets
(C)ActuarialAccrued
Liabilities
(D)Unfunded
Actuarial AccruedLiabilities (UAAL)
(C)–(B)
(E)Funded Ratio
(B)/(C)
(F) Annual
Covered Payroll
(G)UAAL
As a % ofCovered Payroll
(D)/(F)HCTF12/31/2010 $288,193 $1,642,993 $1,354,800 17.5% $7,035,419 19.3%12/31/2011 282,228 1,710,790 1,428,562 16.5% 6,972,596 20.5%12/31/2012 285,097 1,723,495 1,438,398 16.5% 6,766,713 21.3%12/31/2013 293,556 1,557,406 1,263,850 18.8% 6,982,560 18.1%12/31/2014 297,377 1,534,461 1,237,084 19.4% 7,211,351 17.2%12/31/2015 285,588 1,556,269 1,270,681 18.4% 7,485,545 17.0%12/31/2016 270,150 1,556,762 1,286,612 17.4% 7,716,894 16.7%12/31/2017 260,282 1,581,222 1,320,940 16.5% 7,927,280 16.7%12/31/2018 288,323 1,478,114 1,189,791 19.5% 8,399,835 14.2%12/31/2019 348,433 1,447,169 1,098,736 24.1% 8,834,404 12.4%DPS HCTF12/31/2010 $14,086 $78,513 $64,427 17.9% $470,774 13.7%12/31/2011 14,448 77,475 63,027 18.6% 491,646 12.8%12/31/2012 14,443 77,669 63,226 18.6% 510,872 12.4%12/31/2013 15,482 76,636 61,154 20.2% 547,660 11.2%12/31/2014 16,502 76,026 59,524 21.7% 584,319 10.2%12/31/2015 17,557 74,897 57,340 23.4% 621,115 9.2%12/31/2016 18,945 72,845 53,900 26.0% 642,177 8.4%12/31/2017 21,117 70,292 49,175 30.0% 658,198 7.5%12/31/2018 25,018 69,452 44,434 36.0% 722,040 6.2%12/31/2019 31,189 67,937 36,748 45.9% 736,264 5.0%Total of Health Care Trust Funds1
12/31/2010 $302,279 $1,721,506 $1,419,227 17.6% $7,506,193 18.9%12/31/2011 296,676 1,788,265 1,491,589 16.6% 7,464,242 20.0%12/31/2012 299,540 1,801,164 1,501,624 16.6% 7,277,585 20.6%12/31/2013 309,038 1,634,042 1,325,004 18.9% 7,530,220 17.6%12/31/2014 313,879 1,610,487 1,296,608 19.5% 7,795,670 16.6%12/31/2015 303,145 1,631,166 1,328,021 18.6% 8,106,660 16.4%12/31/2016 289,095 1,629,607 1,340,512 17.7% 8,359,071 16.0%12/31/2017 281,399 1,651,514 1,370,115 17.0% 8,585,478 16.0%12/31/2018 313,341 1,547,566 1,234,225 20.2% 9,121,875 13.5%12/31/2019 379,622 1,515,106 1,135,484 25.1% 9,570,668 11.9%
1 The data in this table is aggregated for informational purposes. The assets of each trust fund are for the sole purpose of its members and cannot be used byanother fund.
Note: A history of contributions by Health Care Trust Fund, the ADC compared to the actual contributions paid, including the deficiency (or excess), for eachof the last 10 years, is shown in the Schedule of Contributions from Employers and Other Contributing Entities, found on pages 107-108 in the RSI in theFinancial Section.
Actuarial Section
HEALTH CARE TRUST FUNDS—OPEB
196 Actuarial Section � Colorado PERA Comprehensive Annual Financial Report 2019
Final D
raft
June
12,
202
0
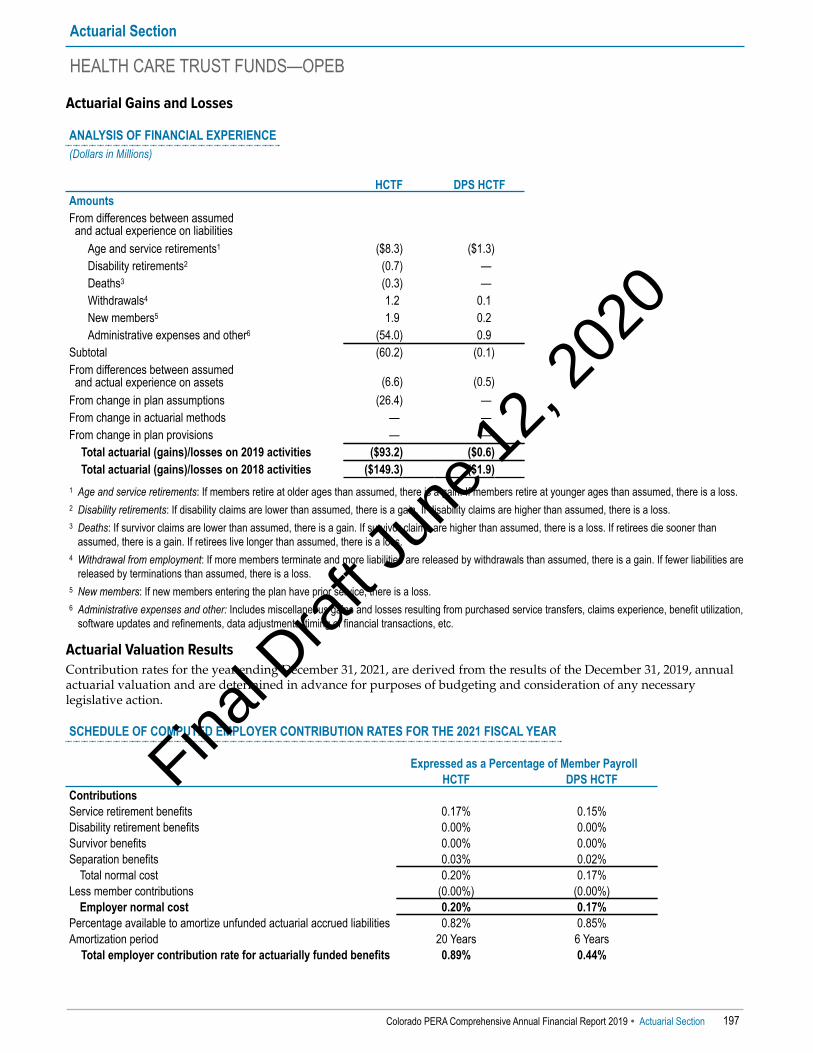
Actuarial Gains and Losses
ANALYSIS OF FINANCIAL EXPERIENCE(Dollars in Millions)
HCTF DPS HCTFAmountsFrom differences between assumed and actual experience on liabilities
Age and service retirements1 ($8.3) ($1.3)Disability retirements2 (0.7) —Deaths3 (0.3) —Withdrawals4 1.2 0.1New members5 1.9 0.2Administrative expenses and other6 (54.0) 0.9
Subtotal (60.2) (0.1)From differences between assumed and actual experience on assets (6.6) (0.5)From change in plan assumptions (26.4) —From change in actuarial methods — —From change in plan provisions — —
Total actuarial (gains)/losses on 2019 activities ($93.2) ($0.6)Total actuarial (gains)/losses on 2018 activities ($149.3) ($1.9)
1 Age and service retirements: If members retire at older ages than assumed, there is a gain. If members retire at younger ages than assumed, there is a loss. 2 Disability retirements: If disability claims are lower than assumed, there is a gain. If disability claims are higher than assumed, there is a loss. 3 Deaths: If survivor claims are lower than assumed, there is a gain. If survivor claims are higher than assumed, there is a loss. If retirees die sooner than
assumed, there is a gain. If retirees live longer than assumed, there is a loss. 4 Withdrawal from employment: If more members terminate and more liabilities are released by withdrawals than assumed, there is a gain. If fewer liabilities are
released by terminations than assumed, there is a loss. 5 New members: If new members entering the plan have prior service, there is a loss. 6 Administrative expenses and other: Includes miscellaneous gains and losses resulting from purchased service transfers, claims experience, benefit utilization,
software updates and refinements, data adjustments, timing of financial transactions, etc.
Actuarial Section
HEALTH CARE TRUST FUNDS—OPEB
Colorado PERA Comprehensive Annual Financial Report 2019 � Actuarial Section 197
Actuarial Valuation ResultsContribution rates for the year ending December 31, 2021, are derived from the results of the December 31, 2019, annualactuarial valuation and are determined in advance for purposes of budgeting and consideration of any necessarylegislative action.
SCHEDULE OF COMPUTED EMPLOYER CONTRIBUTION RATES FOR THE 2021 FISCAL YEAR
Expressed as a Percentage of Member PayrollHCTF DPS HCTF
ContributionsService retirement benefits 0.17% 0.15%Disability retirement benefits 0.00% 0.00%Survivor benefits 0.00% 0.00%Separation benefits 0.03% 0.02%
Total normal cost 0.20% 0.17%Less member contributions (0.00%) (0.00%)
Employer normal cost 0.20% 0.17%Percentage available to amortize unfunded actuarial accrued liabilities 0.82% 0.85%Amortization period 20 Years 6 Years
Total employer contribution rate for actuarially funded benefits 0.89% 0.44%
Final D
raft
June
12,
202
0

Annual Actuarial Valuation StatisticsAs of December 31, 2019, the Funded Ratio, the UAAL, the ADC for 2021 as a percentage of covered payroll, and theamortization period are shown in the following table. The results in this table are based on the actuarial valuation forfunding purposes.
ACTUARIAL STATISTICS(Dollars in Thousands)
Trust Fund Funded Ratio UAAL ADC1 Amortization PeriodHCTF 24.1% $1,098,736 0.89% 20 YearsDPS HCTF 45.9% 36,748 0.44% 6 Years
Total of Health Care Trust Funds2 $1,135,484 1 Determined considering the 30-year target amortization period defined in the OPEB funding policy for purposes of funding benchmarks and RSI reporting as
shown in the Financial Section. 2 The data in this table is aggregated for informational purposes. The assets of each trust fund are for the sole purpose of its members and cannot be used by
another fund.
Pursuant to the OPEB funding policy, for reporting purposes, alternative ADCs also are determined by applying thelayered amortization methodology as previously described. Under the target and alternative calculations, the legacyUAAL as of December 31, 2017, was amortized using a 30-year period, but the alternative ADCs use a 25-year closedperiod, a 20-year closed period, and a 15-year closed period, in lieu of the 30-year period, for amortization of any ”new”UAAL recognized on and after January 1, 2018. The 2021 target and alternative ADCs, by division, are displayed below:
Target ADC Alternative ADCsTrust Fund 30-Year1 25-Year2 20-Year2 15-Year2
HCTF 0.89% 0.87% 0.84% 0.79%DPS HCTF 0.44% 0.44% 0.43% 0.41%
1 Refers to the amortization period used to amortize the legacy UAAL as of December 31, 2017, and any “new” UAAL recognized on and after January 1, 2018. 2 Refers to the amortization period used to amortize any “new” UAAL recognized on and after January 1, 2018.
Funded Ratio(Dollars in Thousands)The funded ratio for the plan is determined by dividing the actuarial value of assets by the AAL. The actuarial value ofassets is not the current market value but a market-related value, which recognizes the differences between actual andexpected investment experience for each year in equal amounts over a four-year period. The actuarial value of the assetsas of December 31, 2019, was $379,622 compared to a market value of assets of $397,146, and to the AAL of $1,515,106. Thefunded ratio for each of the funds, based on the actuarial value of assets, at December 31 for each of the last five years isshown below:
Trust Fund 2015 2016 2017 2018 2019HCTF 18.4% 17.4% 16.5% 19.5% 24.1%DPS HCTF 23.4% 26.0% 30.0% 36.0% 45.9%
Total of Health Care Trust Funds1 18.6% 17.7% 17.0% 20.2% 25.1% 1 The data in this table is aggregated for informational purposes. The assets of each trust fund are for the sole purpose of its members and cannot be used by
another fund.
The Board’s OPEB funding policy states that the targeted actuarial funded ratio is greater than or equal to 110 percent on acombined trust fund basis. The funded ratios listed above give an indication of progress made toward achieving thestated objective. A larger funded ratio indicates that a plan is better funded. As an example, for every $1.00 of theactuarially determined benefits earned for the HCTF as of December 31, 2019, approximately $0.24 of assets are availablefor payment based on the actuarial value of assets. These benefits earned will be payable over a period dependent uponfactors, such as, the life span of members after their retirement and participation in PERACare. Therefore, it is notimperative that the AAL equal the actuarial value of assets at any given moment in time.
Actuarial Section
HEALTH CARE TRUST FUNDS—OPEB
198 Actuarial Section � Colorado PERA Comprehensive Annual Financial Report 2019
Final D
raft
June
12,
202
0

At December 31, 2018, and December 31, 2019, PERA had the following funded status for the Health Care Trust Funds:
FUNDED STATUS FOR THE HEALTH CARE TRUST FUNDS(Dollars in Thousands)
Market Value of Assets1 Actuarial Value of Assets2
12/31/2018 12/31/2019 12/31/2018 12/31/2019Health Care Trust FundActuarial accrued liability3 $1,478,114 $1,447,169 $1,478,114 $1,447,169Assets held to pay those liabilities 279,192 364,510 288,323 348,433Unfunded actuarial accrued liability $1,198,922 $1,082,659 $1,189,791 $1,098,736Funded ratio 18.9% 25.2% 19.5% 24.1%
DPS Health Care Trust FundActuarial accrued liability3 $69,452 $67,937 $69,452 $67,937Assets held to pay those liabilities 24,029 32,636 25,018 31,189Unfunded actuarial accrued liability $45,423 $35,301 $44,434 $36,748Funded ratio 34.6% 48.0% 36.0% 45.9%
Total of Health Care Trust Funds4
Actuarial accrued liability3 $1,547,566 $1,515,106 $1,547,566 $1,515,106Assets held to pay those liabilities5 303,221 397,146 313,341 379,622Unfunded actuarial accrued liability $1,244,345 $1,117,960 $1,234,225 $1,135,484Funded ratio 19.6% 26.2% 20.2% 25.1%
1 The market value of assets is the fair value of the investments. 2 The actuarial value of assets is calculated by spreading any market gains or losses above or below the assumed rate of return over four years. 3 Based upon an assumed rate of return on investments of 7.25 percent and an assumed rate of 7.25 percent to discount the liabilities to be paid in the future to
a value as of December 31, 2018, and December 31, 2019. 4 The data in this table is aggregated for informational purposes. The assets of each trust fund are for the sole purpose of its members and cannot be used by
another fund. 5 In aggregate, the market value of the assets as of December 31, 2019, is $17,524 greater than the actuarial value of assets calculated by the actuaries, as
they are recognizing the gains and losses in value over four years, rather than only in the year they occurred. The remaining gains and (losses) to besmoothed for 2017 are $7,283, for 2018 are ($16,385), and for 2019 are $26,626.
Actuarial Section
HEALTH CARE TRUST FUNDS—OPEB
Colorado PERA Comprehensive Annual Financial Report 2019 � Actuarial Section 199
Final D
raft
June
12,
202
0

Sensitivity of Actuarial Valuation to Changes in Assumed Investment Rate of Return and Discount RateThe most important long-term driver of an OPEB plan is investment income. The investment return assumption and thediscount rate for liabilities should be based on an estimated long-term investment yield for the plan, considering thenature and mix of current and expected plan investments and the basis used to determine the actuarial value of assets.
To understand the importance of the investment rate of return, which is used to discount the actuarial liabilities, aone percent fluctuation in the investment rate of return and discount rate would change the funded ratio, UAAL, andADC (for contributions for the fiscal year ended December 31, 2021) as shown on the tables below:
INVESTMENT RETURN ASSUMPTION (DISCOUNT RATE) EQUAL TO 6.25 PERCENT(Dollars in Thousands)
Actuarial Value of Assets Market Value of AssetsTrust Fund Funded Ratio UAAL ADC UAALHCTF 21.9% $1,243,595 0.93% $1,227,517DPS HCTF 41.9% 43,293 0.50% 41,846
Total of Health Care Trust Funds1 $1,286,888 $1,269,363 1 The data in this table is aggregated for informational purposes. The assets of each trust fund are for the sole purpose of its members and cannot be used by
another fund.
CURRENT INVESTMENT RETURN ASSUMPTION (DISCOUNT RATE) EQUAL TO 7.25 PERCENT(Dollars in Thousands)
Actuarial Value of Assets Market Value of AssetsTrust Fund Funded Ratio UAAL ADC UAALHCTF 24.1% $1,098,736 0.89% $1,082,659DPS HCTF 45.9% 36,748 0.44% 35,301
Total of Health Care Trust Funds1 $1,135,484 $1,117,960 1 The data in this table is aggregated for informational purposes. The assets of each trust fund are for the sole purpose of its members and cannot be used by
another fund.
INVESTMENT RETURN ASSUMPTION (DISCOUNT RATE) EQUAL TO 8.25 PERCENT(Dollars in Thousands)
Actuarial Value of Assets Market Value of AssetsTrust Fund Funded Ratio UAAL ADC UAALHCTF 26.3% $975,066 0.84% $958,989DPS HCTF 50.0% 31,162 0.39% 29,715
Total of Health Care Trust Funds1 $1,006,228 $988,704 1 The data in this table is aggregated for informational purposes. The assets of each trust fund are for the sole purpose of its members and cannot be used by
another fund. Note: The time-weighted, net-of-fees annualized rate of return for the pooled investment assets was 8.4 percent for the past five years and 9.1 percent for the
past 10 years. The 30-year annualized gross-of-fees rate of return for the pooled investment assets was 8.6 percent.
Actuarial Section
HEALTH CARE TRUST FUNDS—OPEB
200 Actuarial Section � Colorado PERA Comprehensive Annual Financial Report 2019
Final D
raft
June
12,
202
0

Plan DataExcept for the “Inactive members not eligible for benefits,” the PERA membership is potentially eligible for participationin OPEB benefits through receipt of a PERA-provided benefit and enrollment in PERACare. The table below represents allindividuals included in the assessment of the AAL associated with the Health Care Trust Funds as of December 31, 2019:
MEMBERSHIP—HEALTH CARE TRUST FUNDS
HCTF DPS HCTF 2019Retirees and beneficiaries1 118,180 7,148 125,328Inactive members eligible but not yet receiving benefits2 27,796 1,988 29,784Inactive members not eligible for benefits N/A N/A N/AActive members2 197,615 15,679 213,294
Total 343,591 24,815 368,406 1 Currently receiving or eligible for OPEB benefits. 2 May be eligible for future OPEB benefits.
PARTICIPATION IN PERACARE FOR ELIGIBLE RETIREES AND BENEFICIARIESAs of December 31, 2019
HCTF DPS HCTF TotalEnrolled in PERACare
Under age 65 10,853 475 11,328Age 65 and older 45,599 3,145 48,744
56,452 3,620 60,072Not enrolled in PERACare
Under age 65 14,561 588 15,149Age 65 and older 47,167 2,940 50,107
61,728 3,528 65,256Total eligible retirees and beneficiaries 118,180 7,148 125,328
Actuarial Section
HEALTH CARE TRUST FUNDS—OPEB
Colorado PERA Comprehensive Annual Financial Report 2019 � Actuarial Section 201
Final D
raft
June
12,
202
0
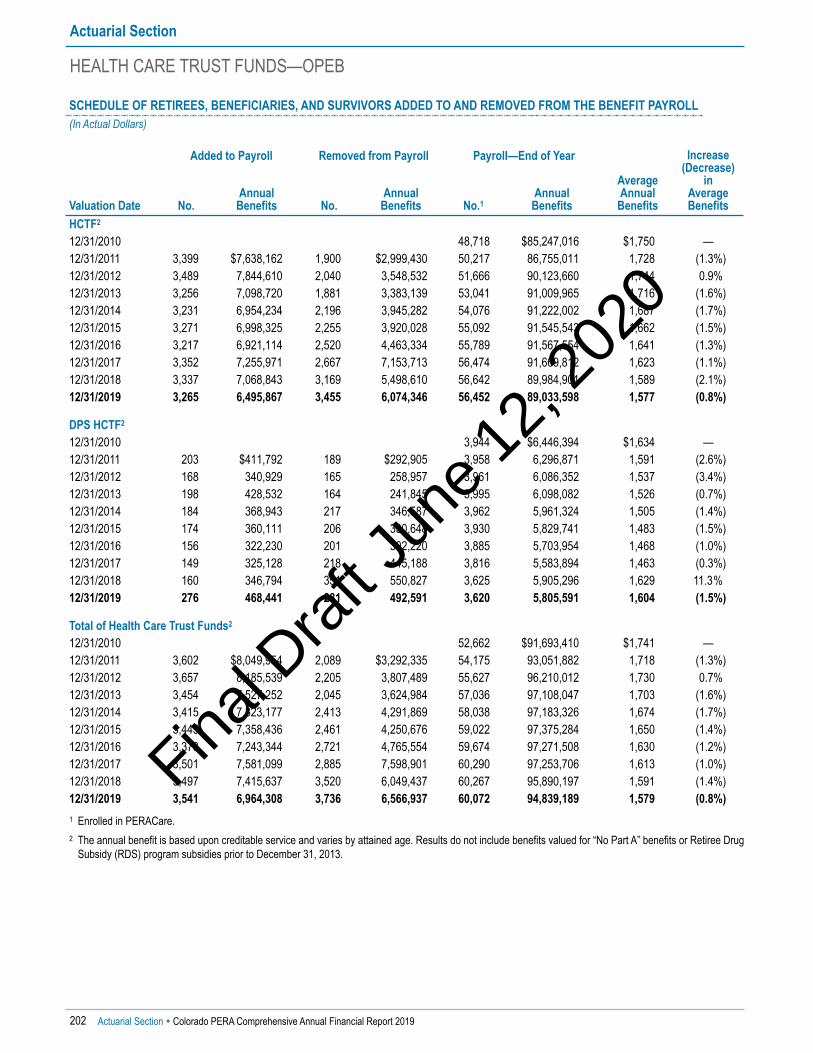
SCHEDULE OF RETIREES, BENEFICIARIES, AND SURVIVORS ADDED TO AND REMOVED FROM THE BENEFIT PAYROLL(In Actual Dollars)
Valuation Date
Added to Payroll Removed from Payroll Payroll—End of Year
Average Annual
Benefits
Increase(Decrease)
in Average BenefitsNo.
Annual Benefits No.
Annual Benefits No.1
Annual Benefits
HCTF2
12/31/2010 48,718 $85,247,016 $1,750 —12/31/2011 3,399 $7,638,162 1,900 $2,999,430 50,217 86,755,011 1,728 (1.3%)12/31/2012 3,489 7,844,610 2,040 3,548,532 51,666 90,123,660 1,744 0.9%12/31/2013 3,256 7,098,720 1,881 3,383,139 53,041 91,009,965 1,716 (1.6%)12/31/2014 3,231 6,954,234 2,196 3,945,282 54,076 91,222,002 1,687 (1.7%)12/31/2015 3,271 6,998,325 2,255 3,920,028 55,092 91,545,543 1,662 (1.5%)12/31/2016 3,217 6,921,114 2,520 4,463,334 55,789 91,567,554 1,641 (1.3%)12/31/2017 3,352 7,255,971 2,667 7,153,713 56,474 91,669,812 1,623 (1.1%)12/31/2018 3,337 7,068,843 3,169 5,498,610 56,642 89,984,901 1,589 (2.1%)12/31/2019 3,265 6,495,867 3,455 6,074,346 56,452 89,033,598 1,577 (0.8%)
DPS HCTF2
12/31/2010 3,944 $6,446,394 $1,634 —12/31/2011 203 $411,792 189 $292,905 3,958 6,296,871 1,591 (2.6%)12/31/2012 168 340,929 165 258,957 3,961 6,086,352 1,537 (3.4%)12/31/2013 198 428,532 164 241,845 3,995 6,098,082 1,526 (0.7%)12/31/2014 184 368,943 217 346,587 3,962 5,961,324 1,505 (1.4%)12/31/2015 174 360,111 206 330,648 3,930 5,829,741 1,483 (1.5%)12/31/2016 156 322,230 201 302,220 3,885 5,703,954 1,468 (1.0%)12/31/2017 149 325,128 218 445,188 3,816 5,583,894 1,463 (0.3%)12/31/2018 160 346,794 351 550,827 3,625 5,905,296 1,629 11.3%12/31/2019 276 468,441 281 492,591 3,620 5,805,591 1,604 (1.5%)
Total of Health Care Trust Funds2
12/31/2010 52,662 $91,693,410 $1,741 —12/31/2011 3,602 $8,049,954 2,089 $3,292,335 54,175 93,051,882 1,718 (1.3%)12/31/2012 3,657 8,185,539 2,205 3,807,489 55,627 96,210,012 1,730 0.7%12/31/2013 3,454 7,527,252 2,045 3,624,984 57,036 97,108,047 1,703 (1.6%)12/31/2014 3,415 7,323,177 2,413 4,291,869 58,038 97,183,326 1,674 (1.7%)12/31/2015 3,445 7,358,436 2,461 4,250,676 59,022 97,375,284 1,650 (1.4%)12/31/2016 3,373 7,243,344 2,721 4,765,554 59,674 97,271,508 1,630 (1.2%)12/31/2017 3,501 7,581,099 2,885 7,598,901 60,290 97,253,706 1,613 (1.0%)12/31/2018 3,497 7,415,637 3,520 6,049,437 60,267 95,890,197 1,591 (1.4%)12/31/2019 3,541 6,964,308 3,736 6,566,937 60,072 94,839,189 1,579 (0.8%)
1 Enrolled in PERACare. 2 The annual benefit is based upon creditable service and varies by attained age. Results do not include benefits valued for “No Part A” benefits or Retiree Drug
Subsidy (RDS) program subsidies prior to December 31, 2013.
Actuarial Section
HEALTH CARE TRUST FUNDS—OPEB
202 Actuarial Section � Colorado PERA Comprehensive Annual Financial Report 2019
Final D
raft
June
12,
202
0

SCHEDULE OF ACTIVE MEMBER ACTUARIAL VALUATION DATAAs of December 31(In Actual Dollars)
Year
Number of ParticipatingEmployers1,2
Total Numberof ActiveMembers
MedicareEligible Active
Members3Annual Payroll forActive Members
Average AnnualPay for Active
Members
% Increase(Decrease) in AverageAnnual Pay
HCTF2010 489 187,924 $7,035,419,174 $37,438 —2011 496 186,170 6,972,597,196 37,453 0.04%2012 500 182,524 6,766,713,013 37,073 (1.01%)2013 516 185,367 6,982,560,466 37,669 1.61%2014 531 187,336 7,211,350,491 38,494 2.19%2015 534 188,040 7,485,544,867 39,808 3.41%2016 542 190,741 7,716,892,488 40,457 1.63%2017 408 191,778 8,284 7,927,279,994 41,336 2.17%2018 409 195,436 8,826 8,399,834,705 42,980 3.98%2019 410 197,615 9,035 8,834,404,580 44,705 4.01%
DPS HCTF2010 28 13,171 $470,773,746 $35,743 —2011 27 13,571 491,646,251 36,228 1.36%2012 29 13,911 510,872,366 36,724 1.37%2013 31 14,816 547,659,912 36,964 0.65%2014 34 15,414 584,319,269 37,908 2.55%2015 38 15,929 621,114,573 38,993 2.86%2016 42 15,950 642,177,158 40,262 3.25%2017 1 15,991 498 658,198,306 41,161 2.23%2018 1 16,148 510 722,040,073 44,714 8.63%2019 1 15,679 518 736,263,798 46,959 5.02%
Total of Health Care Trust Funds2010 517 201,095 $7,506,192,920 $37,327 —2011 523 199,741 7,464,243,447 37,370 0.12%2012 529 196,435 7,277,585,379 37,048 (0.86%)2013 547 200,183 7,530,220,378 37,617 1.54%2014 565 202,750 7,795,669,760 38,450 2.21%2015 572 203,969 8,106,659,440 39,745 3.37%2016 584 206,691 8,359,069,646 40,442 1.75%2017 409 207,769 8,782 8,585,478,300 41,322 2.18%2018 410 211,584 9,336 9,121,874,778 43,112 4.33%2019 411 213,294 9,553 9,570,668,378 44,871 4.08%
1 Prior to 2017, employer counts were based on separate units of government. Beginning in 2017, new guidance under GASB 74 classifies a primarygovernment and its component units as one employer. The 2017 employer count is presented for purposes of complying with GASB 74 only. For all otherpurposes, the definition of an employer is governed by Title 24, Article 51 of the C.R.S., PERA’s Rules, 8 CCR 1502-1, and, if applicable, the employer’saffiliation agreement with PERA.
2 Participating employer counts prior to 2017 include charter schools operating within the School and DPS Divisions. 3 Information prior to 2017 was not required.
Actuarial Section
HEALTH CARE TRUST FUNDS—OPEB
Colorado PERA Comprehensive Annual Financial Report 2019 � Actuarial Section 203
Final D
raft
June
12,
202
0

Final D
raft
June
12,
202
0
Final D
raft
June
12,
202
0

Final D
raft
June
12,
202
0

The Statistical Section presents detailed information that assists users in utilizing the basic financial statements, notes tobasic financial statements, and required supplementary information to assess the economic condition of PERA.
OverviewFinancial TrendsThe following schedules show trend information about the changes and growth in PERA’s fiduciary net position over thepast 10 years:
• Changes in Fiduciary Net Position
• Benefits and Refund Deductions From Fiduciary Net Position by Type
Operating InformationThe following schedules contain information related to the services that PERA provides and the activities it performs:
• Member and Benefit Recipient Statistics1
• Breakdown of Membership by Percentage1
• Schedule of Average Retirement Benefits Payable—All Division Trust Funds1
• Schedule of Average Retirement Benefits Payable1
• Colorado PERA Benefit Payments—All Division Trust Funds1
• Schedule of Retirees and Survivors by Types of Benefits1
• Schedule of Average Benefit Payments1
• Schedule of Contribution Rate History
• Principal Participating Employers
• Schedule of Affiliated Employers
1 Data for schedules are provided by the consulting actuary, Segal Note: Schedules and information are derived from PERA internal sources unless otherwise noted.
Statistical Section
Colorado PERA Comprehensive Annual Financial Report 2019 � Statistical Section 207
Final D
raft
June
12,
202
0

State Division Trust Fund
2019 2018 2017 2016 2015AdditionsEmployer contributions1 $612,282 $583,164 $563,977 $521,804 $484,005Nonemployer contributions1 77,088 78,489 — — —Member contributions1 257,803 236,313 228,978 223,005 217,980Purchased service 29,494 25,227 27,442 24,528 26,946Investment income (loss) 2,764,719 (497,562) 2,391,683 947,981 210,337Other 22 7,888 15,860 8,708 5,023
Total additions 3,741,408 433,519 3,227,940 1,726,026 944,291
DeductionsBenefit payments 1,637,168 1,608,534 1,554,290 1,483,828 1,417,862Refunds 61,832 65,253 58,696 60,137 63,567Disability insurance premiums 1,965 2,093 2,035 2,106 2,088Administrative expenses 11,294 11,903 11,745 11,271 10,779Other 2,707 3,017 3,652 3,040 3,406
Total deductions 1,714,966 1,690,800 1,630,418 1,560,382 1,497,702Change in fiduciary net position 2,026,442 (1,257,281) 1,597,522 165,644 (553,411)Fiduciary net position held at beginning of year 13,966,421 15,223,702 13,626,180 13,460,536 14,013,947
Fiduciary net position held at end of year $15,992,863 $13,966,421 $15,223,702 $13,626,180 $13,460,536
2014 2013 2012 2011 2010AdditionsEmployer contributions1 $444,372 $401,658 $335,073 $283,222 $287,624Member contributions1 211,610 202,799 227,058 258,678 223,240Purchased service 22,446 22,241 16,358 11,277 12,496Investment income 780,762 1,931,658 1,511,244 232,669 1,553,142Other 3,289 4,869 150 331 1
Total additions 1,462,479 2,563,225 2,089,883 786,177 2,076,503
DeductionsBenefit payments 1,352,293 1,295,780 1,231,922 1,174,707 1,122,435Refunds 61,152 68,735 69,221 70,090 68,844Disability insurance premiums 2,309 2,229 1,570 1,685 1,661Administrative expenses 10,067 9,780 8,568 8,685 8,942Other 3,171 3,593 3,911 (4,546) (726)
Total deductions 1,428,992 1,380,117 1,315,192 1,250,621 1,201,156Change in fiduciary net position 33,487 1,183,108 774,691 (464,444) 875,347Fiduciary net position held at beginning of year 13,980,460 12,797,352 12,022,661 12,487,105 11,611,758
Fiduciary net position held at end of year $14,013,947 $13,980,460 $12,797,352 $12,022,661 $12,487,105
1 Employer, nonemployer, and member contribution rate history is shown on pages 243-248.
Statistical Section
CHANGES IN FIDUCIARY NET POSITIONFor the Years Ended December 31(Dollars in Thousands)
208 Statistical Section � Colorado PERA Comprehensive Annual Financial Report 2019
Final D
raft
June
12,
202
0

School Division Trust Fund
2019 2018 2017 2016 2015AdditionsEmployer contributions1 $1,002,760 $923,910 $857,740 $812,740 $754,182Nonemployer contributions1 127,367 126,505 — — —Member contributions1 436,899 386,811 368,740 359,059 348,537Purchased service 25,992 27,525 30,313 27,422 23,841Investment income (loss) 4,676,607 (838,899) 3,982,275 1,569,026 344,000Other 364 7,957 106 109 96
Total additions 6,269,989 633,809 5,239,174 2,768,356 1,470,656
DeductionsBenefit payments 2,468,021 2,413,387 2,334,003 2,231,475 2,134,754Refunds 73,871 76,035 74,637 65,715 70,298Disability insurance premiums 3,338 3,506 3,347 3,454 3,400Administrative expenses 22,619 23,560 23,019 21,991 20,865Other 8,293 2,501 22,484 17,443 9,178
Total deductions 2,576,142 2,518,989 2,457,490 2,340,078 2,238,495Change in fiduciary net position 3,693,847 (1,885,180) 2,781,684 428,278 (767,839)Fiduciary net position held at beginning of year 23,477,550 25,362,730 22,581,046 22,152,768 22,920,607
Fiduciary net position held at end of year $27,171,397 $23,477,550 $25,362,730 $22,581,046 $22,152,768
2014 2013 2012 2011 2010AdditionsEmployer contributions1 $686,323 $624,784 $573,586 $541,962 $519,044Member contributions1 334,585 322,217 313,923 315,958 316,446Purchased service 21,935 19,285 17,406 14,465 13,096Investment income 1,274,862 3,136,269 2,434,176 370,045 2,469,517Other 112 139 246 544 25
Total additions 2,317,817 4,102,694 3,339,337 1,242,974 3,318,128
DeductionsBenefit payments 2,032,628 1,932,756 1,832,643 1,731,348 1,642,350Refunds 77,171 76,980 77,154 78,543 79,012Disability insurance premiums 3,748 3,655 2,522 2,619 2,802Administrative expenses 19,290 18,523 16,086 16,322 17,104Other 4,376 7,132 9,157 9,839 9,396
Total deductions 2,137,213 2,039,046 1,937,562 1,838,671 1,750,664Change in fiduciary net position 180,604 2,063,648 1,401,775 (595,697) 1,567,464Fiduciary net position held at beginning of year 22,740,003 20,676,355 19,274,580 19,870,277 18,302,813
Fiduciary net position held at end of year $22,920,607 $22,740,003 $20,676,355 $19,274,580 $19,870,277
1 Employer, nonemployer, and member contribution rate history is shown on pages 243-248.
Statistical Section
CHANGES IN FIDUCIARY NET POSITIONFor the Years Ended December 31(Dollars in Thousands)
Colorado PERA Comprehensive Annual Financial Report 2019 � Statistical Section 209
Final D
raft
June
12,
202
0
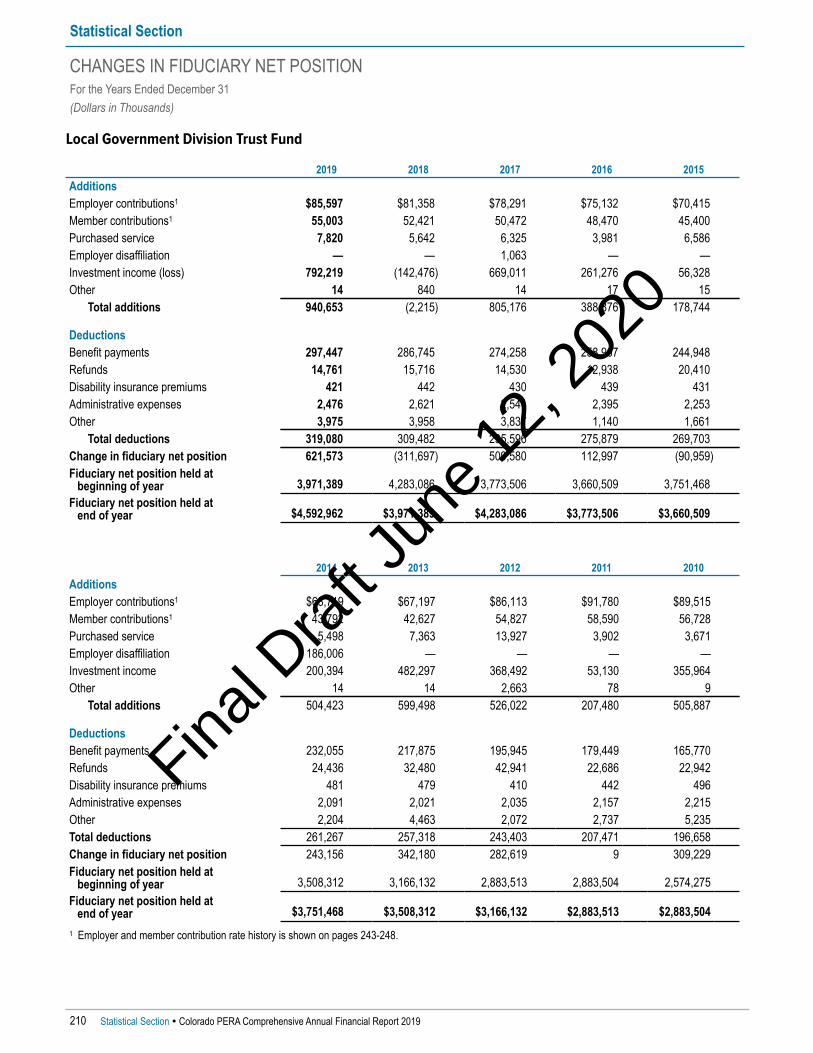
Local Government Division Trust Fund
2019 2018 2017 2016 2015AdditionsEmployer contributions1 $85,597 $81,358 $78,291 $75,132 $70,415Member contributions1 55,003 52,421 50,472 48,470 45,400Purchased service 7,820 5,642 6,325 3,981 6,586Employer disaffiliation — — 1,063 — —Investment income (loss) 792,219 (142,476) 669,011 261,276 56,328Other 14 840 14 17 15
Total additions 940,653 (2,215) 805,176 388,876 178,744
DeductionsBenefit payments 297,447 286,745 274,258 258,967 244,948Refunds 14,761 15,716 14,530 12,938 20,410Disability insurance premiums 421 442 430 439 431Administrative expenses 2,476 2,621 2,541 2,395 2,253Other 3,975 3,958 3,837 1,140 1,661
Total deductions 319,080 309,482 295,596 275,879 269,703Change in fiduciary net position 621,573 (311,697) 509,580 112,997 (90,959)Fiduciary net position held at beginning of year 3,971,389 4,283,086 3,773,506 3,660,509 3,751,468
Fiduciary net position held at end of year $4,592,962 $3,971,389 $4,283,086 $3,773,506 $3,660,509
2014 2013 2012 2011 2010AdditionsEmployer contributions1 $68,719 $67,197 $86,113 $91,780 $89,515Member contributions1 43,792 42,627 54,827 58,590 56,728Purchased service 5,498 7,363 13,927 3,902 3,671Employer disaffiliation 186,006 — — — —Investment income 200,394 482,297 368,492 53,130 355,964Other 14 14 2,663 78 9
Total additions 504,423 599,498 526,022 207,480 505,887
DeductionsBenefit payments 232,055 217,875 195,945 179,449 165,770Refunds 24,436 32,480 42,941 22,686 22,942Disability insurance premiums 481 479 410 442 496Administrative expenses 2,091 2,021 2,035 2,157 2,215Other 2,204 4,463 2,072 2,737 5,235Total deductions 261,267 257,318 243,403 207,471 196,658Change in fiduciary net position 243,156 342,180 282,619 9 309,229Fiduciary net position held at beginning of year 3,508,312 3,166,132 2,883,513 2,883,504 2,574,275
Fiduciary net position held at end of year $3,751,468 $3,508,312 $3,166,132 $2,883,513 $2,883,504
1 Employer and member contribution rate history is shown on pages 243-248.
Statistical Section
CHANGES IN FIDUCIARY NET POSITIONFor the Years Ended December 31(Dollars in Thousands)
210 Statistical Section � Colorado PERA Comprehensive Annual Financial Report 2019
Final D
raft
June
12,
202
0
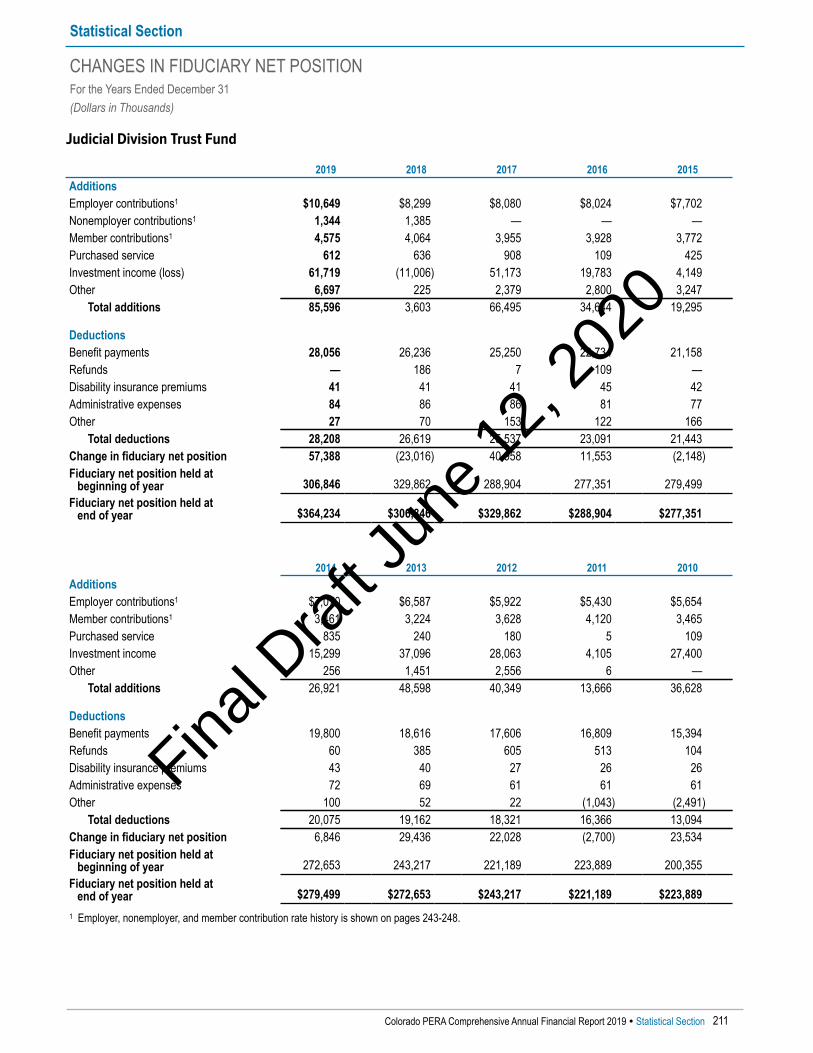
Judicial Division Trust Fund
2019 2018 2017 2016 2015AdditionsEmployer contributions1 $10,649 $8,299 $8,080 $8,024 $7,702Nonemployer contributions1 1,344 1,385 — — —Member contributions1 4,575 4,064 3,955 3,928 3,772Purchased service 612 636 908 109 425Investment income (loss) 61,719 (11,006) 51,173 19,783 4,149Other 6,697 225 2,379 2,800 3,247
Total additions 85,596 3,603 66,495 34,644 19,295
DeductionsBenefit payments 28,056 26,236 25,250 22,734 21,158Refunds — 186 7 109 —Disability insurance premiums 41 41 41 45 42Administrative expenses 84 86 86 81 77Other 27 70 153 122 166
Total deductions 28,208 26,619 25,537 23,091 21,443Change in fiduciary net position 57,388 (23,016) 40,958 11,553 (2,148)Fiduciary net position held at beginning of year 306,846 329,862 288,904 277,351 279,499
Fiduciary net position held at end of year $364,234 $306,846 $329,862 $288,904 $277,351
2014 2013 2012 2011 2010AdditionsEmployer contributions1 $7,070 $6,587 $5,922 $5,430 $5,654Member contributions1 3,461 3,224 3,628 4,120 3,465Purchased service 835 240 180 5 109Investment income 15,299 37,096 28,063 4,105 27,400Other 256 1,451 2,556 6 —
Total additions 26,921 48,598 40,349 13,666 36,628
DeductionsBenefit payments 19,800 18,616 17,606 16,809 15,394Refunds 60 385 605 513 104Disability insurance premiums 43 40 27 26 26Administrative expenses 72 69 61 61 61Other 100 52 22 (1,043) (2,491)
Total deductions 20,075 19,162 18,321 16,366 13,094Change in fiduciary net position 6,846 29,436 22,028 (2,700) 23,534Fiduciary net position held at beginning of year 272,653 243,217 221,189 223,889 200,355
Fiduciary net position held at end of year $279,499 $272,653 $243,217 $221,189 $223,889
1 Employer, nonemployer, and member contribution rate history is shown on pages 243-248.
Statistical Section
CHANGES IN FIDUCIARY NET POSITIONFor the Years Ended December 31(Dollars in Thousands)
Colorado PERA Comprehensive Annual Financial Report 2019 � Statistical Section 211
Final D
raft
June
12,
202
0

DPS Division Trust Fund1
2019 2018 2017 2016 2015AdditionsEmployer contributions2 $43,340 $35,994 $27,578 $17,071 $8,494Nonemployer contributions2 19,201 18,621 — — —Member contributions2 62,961 58,172 54,354 52,740 49,973Purchased service 2,535 2,926 2,466 2,112 3,585Investment income (loss) 632,669 (114,070) 548,585 218,415 49,172Other 3,030 770 3,870 3,264 11
Total additions 763,736 2,413 636,853 293,602 111,235
DeductionsBenefit payments 277,849 276,223 271,189 263,152 255,068Refunds 10,738 11,197 10,277 8,521 7,897Disability insurance premiums 397 405 378 398 358Administrative expenses 2,713 2,919 2,857 2,754 2,599Other 55 5,267 89 129 1,775
Total deductions 291,752 296,011 284,790 274,954 267,697Change in fiduciary net position 471,984 (293,598) 352,063 18,648 (156,462)Fiduciary net position held at beginning of year 3,184,442 3,478,040 3,125,977 3,107,329 3,263,791
Fiduciary net position held at end of year $3,656,426 $3,184,442 $3,478,040 $3,125,977 $3,107,329
2014 2013 2012 2011 2010AdditionsEmployer contributions2 $18,478 $25,157 $14,703 $12,859 $6,493Member contributions2 47,083 43,564 41,124 39,422 36,824Plan transfer — — — — 2,750,566Purchased service 2,326 1,834 1,924 1,792 2,056Investment income 182,823 452,919 354,867 55,081 367,145Other 13 269 146 77 5
Total additions 250,723 523,743 412,764 109,231 3,163,089
DeductionsBenefit payments 247,005 237,921 228,742 221,113 215,825Refunds 8,063 6,733 5,821 4,412 3,029Disability insurance premiums 366 338 220 238 311Administrative expenses 2,377 2,240 1,919 1,914 2,944Other 1,560 150 55 2,409 54
Total deductions 259,371 247,382 236,757 230,086 222,163Change in fiduciary net position (8,648) 276,361 176,007 (120,855) 2,940,926Fiduciary net position held at beginning of year 3,272,439 2,996,078 2,820,071 2,940,926 —
Fiduciary net position held at end of year $3,263,791 $3,272,439 $2,996,078 $2,820,071 $2,940,926
1 The Denver Public Schools (DPS) Division Trust Fund was established on January 1, 2010, and received the net assets of the Denver Public SchoolsRetirement System (DPSRS).
2 Employer, nonemployer, and member contribution rate history is shown on pages 243-248.
Statistical Section
CHANGES IN FIDUCIARY NET POSITIONFor the Years Ended December 31(Dollars in Thousands)
212 Statistical Section � Colorado PERA Comprehensive Annual Financial Report 2019
Final D
raft
June
12,
202
0
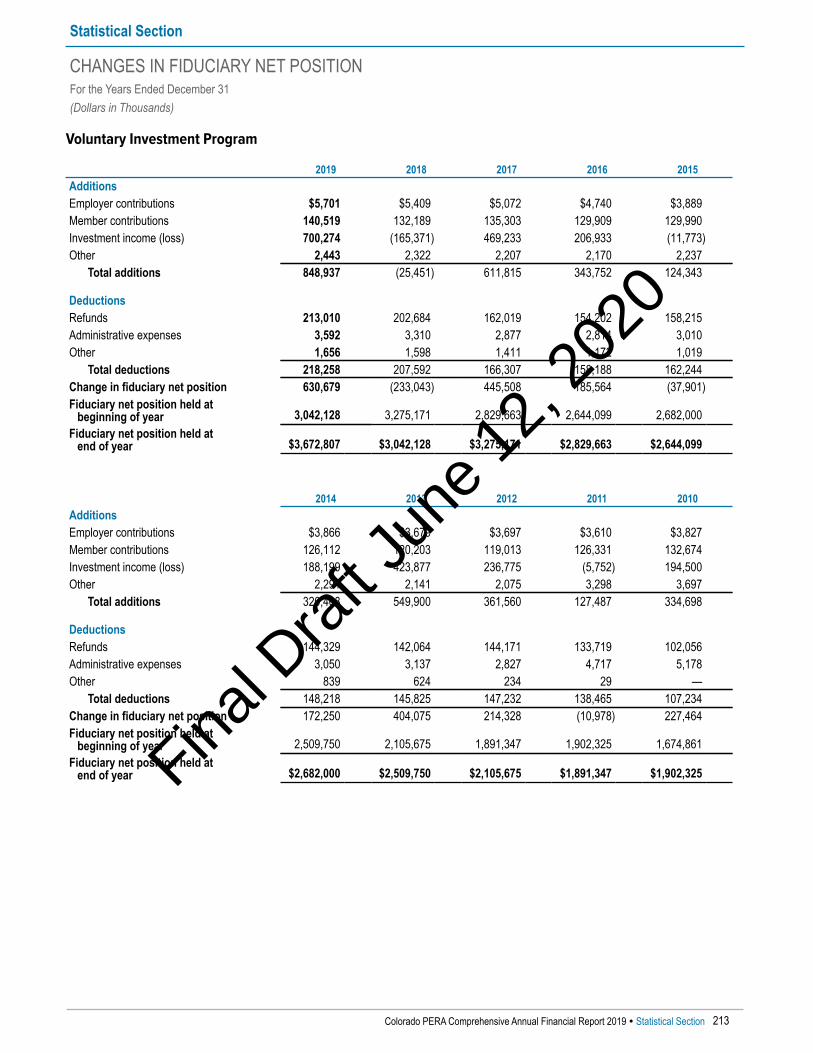
Voluntary Investment Program
2019 2018 2017 2016 2015AdditionsEmployer contributions $5,701 $5,409 $5,072 $4,740 $3,889Member contributions 140,519 132,189 135,303 129,909 129,990Investment income (loss) 700,274 (165,371) 469,233 206,933 (11,773)Other 2,443 2,322 2,207 2,170 2,237
Total additions 848,937 (25,451) 611,815 343,752 124,343
DeductionsRefunds 213,010 202,684 162,019 154,202 158,215Administrative expenses 3,592 3,310 2,877 2,814 3,010Other 1,656 1,598 1,411 1,172 1,019
Total deductions 218,258 207,592 166,307 158,188 162,244Change in fiduciary net position 630,679 (233,043) 445,508 185,564 (37,901)Fiduciary net position held at beginning of year 3,042,128 3,275,171 2,829,663 2,644,099 2,682,000
Fiduciary net position held at end of year $3,672,807 $3,042,128 $3,275,171 $2,829,663 $2,644,099
2014 2013 2012 2011 2010AdditionsEmployer contributions $3,866 $3,679 $3,697 $3,610 $3,827Member contributions 126,112 120,203 119,013 126,331 132,674Investment income (loss) 188,199 423,877 236,775 (5,752) 194,500Other 2,291 2,141 2,075 3,298 3,697
Total additions 320,468 549,900 361,560 127,487 334,698
DeductionsRefunds 144,329 142,064 144,171 133,719 102,056Administrative expenses 3,050 3,137 2,827 4,717 5,178Other 839 624 234 29 —
Total deductions 148,218 145,825 147,232 138,465 107,234Change in fiduciary net position 172,250 404,075 214,328 (10,978) 227,464Fiduciary net position held at beginning of year 2,509,750 2,105,675 1,891,347 1,902,325 1,674,861
Fiduciary net position held at end of year $2,682,000 $2,509,750 $2,105,675 $1,891,347 $1,902,325
Statistical Section
CHANGES IN FIDUCIARY NET POSITIONFor the Years Ended December 31(Dollars in Thousands)
Colorado PERA Comprehensive Annual Financial Report 2019 � Statistical Section 213
Final D
raft
June
12,
202
0
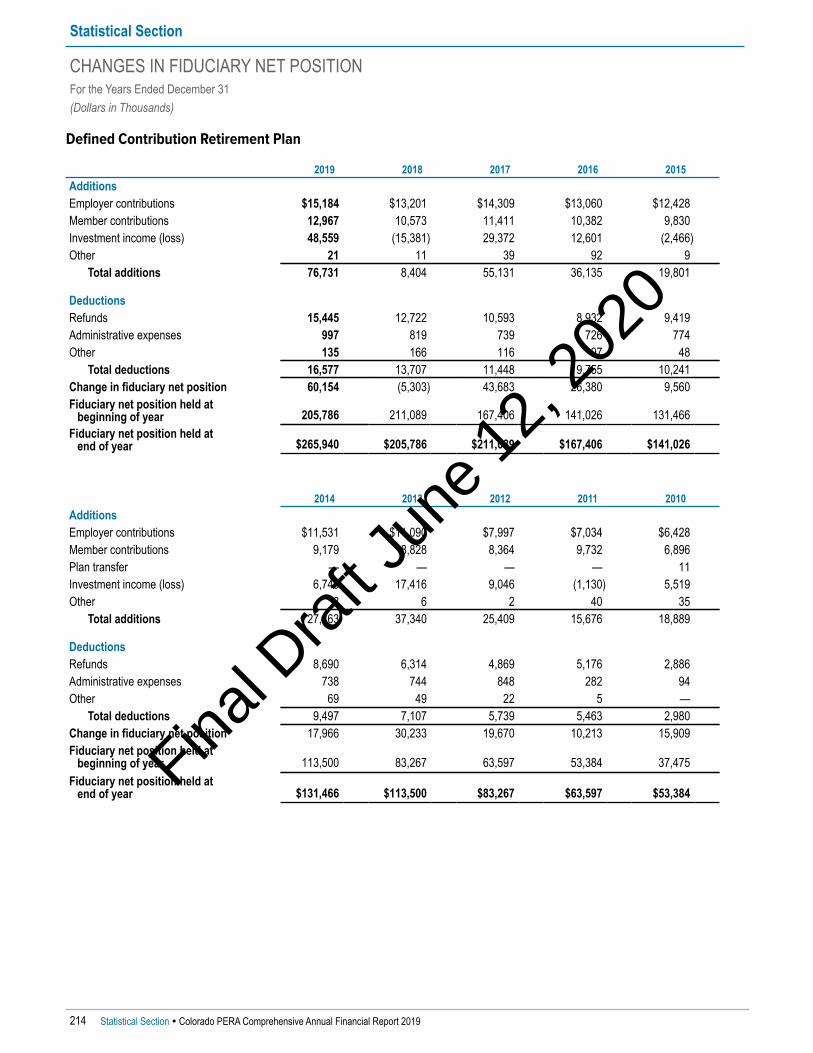
Defined Contribution Retirement Plan
2019 2018 2017 2016 2015AdditionsEmployer contributions $15,184 $13,201 $14,309 $13,060 $12,428Member contributions 12,967 10,573 11,411 10,382 9,830Investment income (loss) 48,559 (15,381) 29,372 12,601 (2,466)Other 21 11 39 92 9
Total additions 76,731 8,404 55,131 36,135 19,801
DeductionsRefunds 15,445 12,722 10,593 8,932 9,419Administrative expenses 997 819 739 726 774Other 135 166 116 97 48
Total deductions 16,577 13,707 11,448 9,755 10,241Change in fiduciary net position 60,154 (5,303) 43,683 26,380 9,560Fiduciary net position held at beginning of year 205,786 211,089 167,406 141,026 131,466
Fiduciary net position held at end of year $265,940 $205,786 $211,089 $167,406 $141,026
2014 2013 2012 2011 2010AdditionsEmployer contributions $11,531 $11,090 $7,997 $7,034 $6,428Member contributions 9,179 8,828 8,364 9,732 6,896Plan transfer — — — — 11Investment income (loss) 6,745 17,416 9,046 (1,130) 5,519Other 8 6 2 40 35
Total additions 27,463 37,340 25,409 15,676 18,889
DeductionsRefunds 8,690 6,314 4,869 5,176 2,886Administrative expenses 738 744 848 282 94Other 69 49 22 5 —
Total deductions 9,497 7,107 5,739 5,463 2,980Change in fiduciary net position 17,966 30,233 19,670 10,213 15,909Fiduciary net position held at beginning of year 113,500 83,267 63,597 53,384 37,475
Fiduciary net position held at end of year $131,466 $113,500 $83,267 $63,597 $53,384
Statistical Section
CHANGES IN FIDUCIARY NET POSITIONFor the Years Ended December 31(Dollars in Thousands)
214 Statistical Section � Colorado PERA Comprehensive Annual Financial Report 2019
Final D
raft
June
12,
202
0

Deferred Compensation Plan
2019 2018 2017 2016 2015AdditionsEmployer contributions $32 $29 $50 $26 $27Member contributions 64,151 57,981 57,088 51,601 49,719Investment income (loss) 163,879 (47,542) 105,027 51,372 (6,427)Other 578 574 510 496 484
Total additions 228,640 11,042 162,675 103,495 43,803
DeductionsRefunds 55,317 56,568 47,067 41,922 39,945Administrative expenses 1,188 1,094 993 963 1,071Other 759 756 698 604 562
Total deductions 57,264 58,418 48,758 43,489 41,578Change in fiduciary net position 171,376 (47,376) 113,917 60,006 2,225Fiduciary net position held at beginning of year 818,223 865,599 751,682 691,676 689,451
Fiduciary net position held at end of year $989,599 $818,223 $865,599 $751,682 $691,676
2014 2013 2012 2011 2010AdditionsEmployer contributions $43 $20 $14 $51 $12Member contributions 50,370 44,449 39,851 42,253 44,203Plan transfer — — — 4 24Investment income 32,133 88,565 49,344 10,335 42,232Other 478 428 354 984 917
Total additions 83,024 133,462 89,563 53,627 87,388
DeductionsRefunds 35,584 32,854 27,627 27,524 20,869Administrative expenses 1,074 1,094 1,105 834 822Other 517 430 278 185 168
Total deductions 37,175 34,378 29,010 28,543 21,859Change in fiduciary net position 45,849 99,084 60,553 25,084 65,529Fiduciary net position held at beginning of year 643,602 544,518 483,965 458,881 393,352
Fiduciary net position held at end of year $689,451 $643,602 $544,518 $483,965 $458,881
Statistical Section
CHANGES IN FIDUCIARY NET POSITIONFor the Years Ended December 31(Dollars in Thousands)
Colorado PERA Comprehensive Annual Financial Report 2019 � Statistical Section 215
Final D
raft
June
12,
202
0

Health Care Trust Fund
2019 2018 2017 2016 2015AdditionsEmployer contributions1 $92,011 $86,559 $83,077 $80,825 $78,463Retiree health care premiums — — — 138,021 127,873Employer disaffiliation — — 96 — —Investment income (loss) 53,867 (9,678) 44,990 19,021 4,807Other 6,984 8,373 9,760 9,175 9,993
Total additions 152,862 85,254 137,923 247,042 221,136
DeductionsBenefit payments 58,221 61,777 102,665 243,662 234,414Administrative expenses 9,290 20,401 19,162 19,166 19,261Other 33 106 102 491 594
Total deductions 67,544 82,284 121,929 263,319 254,269Change in fiduciary net position 85,318 2,970 15,994 (16,277) (33,133)Fiduciary net position held at beginning of year 279,192 276,222 260,228 276,505 309,638
Fiduciary net position held at end of year $364,510 $279,192 $276,222 $260,228 $276,505
2014 2013 2012 2011 2010AdditionsEmployer contributions1 $75,631 $72,784 $72,553 $73,449 $74,047Retiree health care premiums 105,459 114,364 107,104 108,689 110,158Federal health care subsidies — 15,731 14,198 14,151 25,751Employer disaffiliation 3,994 — — — —Investment income 18,203 46,097 36,710 5,153 34,676Other 9,813 10,522 11,668 10,574 16,035
Total additions 213,100 259,498 242,233 212,016 260,667
DeductionsBenefit payments 200,627 222,860 218,768 203,419 192,044Administrative expenses 16,612 13,766 13,514 12,481 11,131Other 832 — — — —
Total deductions 218,071 236,626 232,282 215,900 203,175Change in fiduciary net position (4,971) 22,872 9,951 (3,884) 57,492Fiduciary net position held at beginning of year 314,609 291,737 281,786 285,670 228,178
Fiduciary net position held at end of year $309,638 $314,609 $291,737 $281,786 $285,670
1 Employer contribution rate history is shown on page 249.
Statistical Section
CHANGES IN FIDUCIARY NET POSITIONFor the Years Ended December 31(Dollars in Thousands)
216 Statistical Section � Colorado PERA Comprehensive Annual Financial Report 2019
Final D
raft
June
12,
202
0

DPS Health Care Trust Fund1
2019 2018 2017 2016 2015AdditionsEmployer contributions2 $7,649 $7,417 $6,930 $6,723 $6,371Retiree health care premiums — — — 6,738 6,275Investment income (loss) 4,892 (894) 3,305 1,235 254Other 188 205 242 289 301
Total additions 12,729 6,728 10,477 14,985 13,201
DeductionsBenefit payments 3,644 4,158 5,694 12,748 12,442Administrative expenses 477 845 808 818 822Other 1 4 4 18 22
Total deductions 4,122 5,007 6,506 13,584 13,286Change in fiduciary net position 8,607 1,721 3,971 1,401 (85)Fiduciary net position held at beginning of year 24,029 22,308 18,337 16,936 17,021
Fiduciary net position held at end of year $32,636 $24,029 $22,308 $18,337 $16,936
2014 2013 2012 2011 2010AdditionsEmployer contributions2 $6,003 $5,558 $5,243 $5,029 $4,762Plan transfer — — — — 13,510Retiree health care premiums 4,442 4,719 4,295 4,529 4,747Federal health care subsidies — 563 488 499 1,252Investment income 938 2,277 1,800 424 1,992Other 281 312 216 374 109
Total additions 11,664 13,429 12,042 10,855 26,372
DeductionsBenefit payments 10,432 11,222 11,027 10,770 11,012Administrative expenses 668 561 547 501 569Other 32 — — — —
Total deductions 11,132 11,783 11,574 11,271 11,581Change in fiduciary net position 532 1,646 468 (416) 14,791Fiduciary net position held at beginning of year 16,489 14,843 14,375 14,791 —
Fiduciary net position held at end of year $17,021 $16,489 $14,843 $14,375 $14,791
1 The Denver Public Schools Health Care Trust Fund (DPS HCTF) was established on January 1, 2010, and received the balance of the Denver Public SchoolsRetiree Health Benefit Trust.
2 Employer contribution rate history is shown on page 249.
Statistical Section
CHANGES IN FIDUCIARY NET POSITIONFor the Years Ended December 31(Dollars in Thousands)
Colorado PERA Comprehensive Annual Financial Report 2019 � Statistical Section 217
Final D
raft
June
12,
202
0

Life Insurance Reserve
2019 2018 2017 2016 2015AdditionsInvestment income (loss) $3,901 ($684) $3,241 $1,289 $302Other — 4 — — —
Total additions 3,901 (680) 3,241 1,289 302
DeductionsLife insurance premiums 479 433 373 306 250Administrative expenses 123 111 493 1,032 805
Total deductions 602 544 866 1,338 1,055Change in fiduciary net position 3,299 (1,224) 2,375 (49) (753)Fiduciary net position held at beginning of year 17,842 19,066 16,691 16,740 17,493
Fiduciary net position held at end of year $21,141 $17,842 $19,066 $16,691 $16,740
2014 2013 2012 2011 2010AdditionsInvestment income $1,068 $2,630 $2,020 $503 $2,280
Total additions 1,068 2,630 2,020 503 2,280
DeductionsLife insurance premiums 196 131 62 547 545Administrative expenses 871 871 510 573 575
Total deductions 1,067 1,002 572 1,120 1,120Change in fiduciary net position 1 1,628 1,448 (617) 1,160Fiduciary net position held at beginning of year 17,492 15,864 14,416 15,033 13,873
Fiduciary net position held at end of year $17,493 $17,492 $15,864 $14,416 $15,033
Statistical Section
CHANGES IN FIDUCIARY NET POSITIONFor the Years Ended December 31(Dollars in Thousands)
218 Statistical Section � Colorado PERA Comprehensive Annual Financial Report 2019
Final D
raft
June
12,
202
0
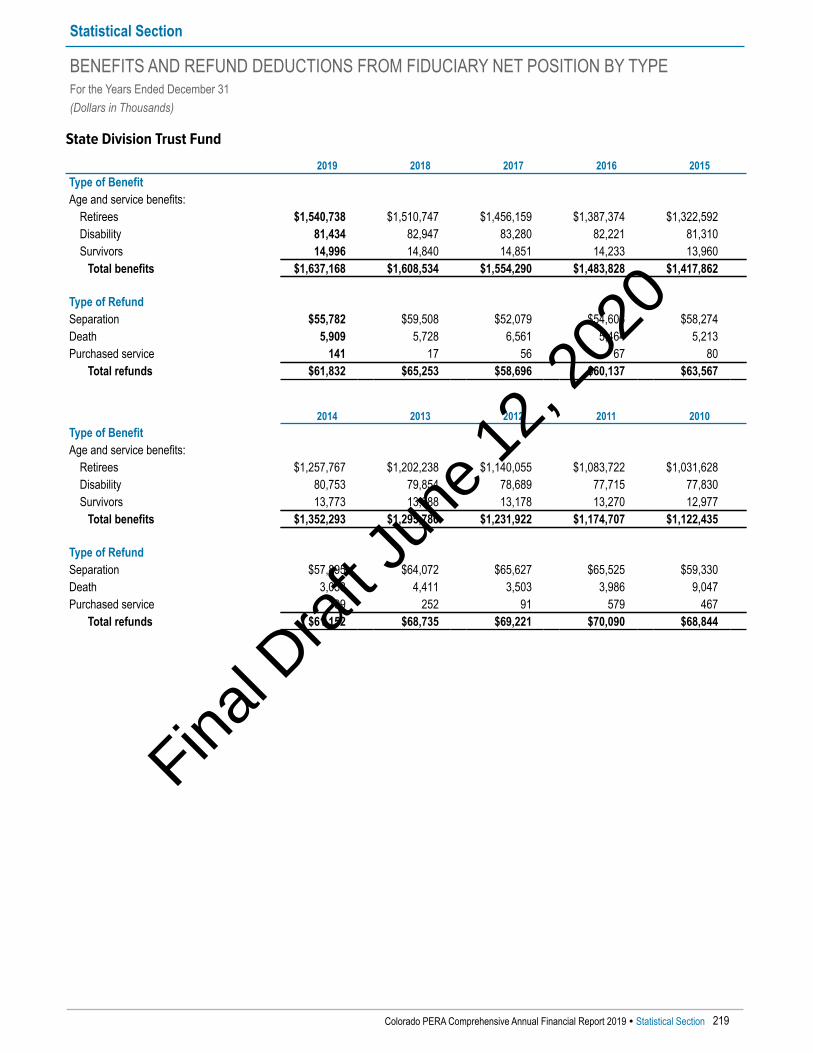
State Division Trust Fund
2019 2018 2017 2016 2015Type of BenefitAge and service benefits:
Retirees $1,540,738 $1,510,747 $1,456,159 $1,387,374 $1,322,592Disability 81,434 82,947 83,280 82,221 81,310Survivors 14,996 14,840 14,851 14,233 13,960
Total benefits $1,637,168 $1,608,534 $1,554,290 $1,483,828 $1,417,862
Type of RefundSeparation $55,782 $59,508 $52,079 $54,606 $58,274Death 5,909 5,728 6,561 5,464 5,213Purchased service 141 17 56 67 80
Total refunds $61,832 $65,253 $58,696 $60,137 $63,567
2014 2013 2012 2011 2010Type of BenefitAge and service benefits:
Retirees $1,257,767 $1,202,238 $1,140,055 $1,083,722 $1,031,628Disability 80,753 79,854 78,689 77,715 77,830Survivors 13,773 13,688 13,178 13,270 12,977
Total benefits $1,352,293 $1,295,780 $1,231,922 $1,174,707 $1,122,435
Type of RefundSeparation $57,895 $64,072 $65,627 $65,525 $59,330Death 3,058 4,411 3,503 3,986 9,047Purchased service 199 252 91 579 467
Total refunds $61,152 $68,735 $69,221 $70,090 $68,844
Statistical Section
BENEFITS AND REFUND DEDUCTIONS FROM FIDUCIARY NET POSITION BY TYPEFor the Years Ended December 31(Dollars in Thousands)
Colorado PERA Comprehensive Annual Financial Report 2019 � Statistical Section 219
Final D
raft
June
12,
202
0
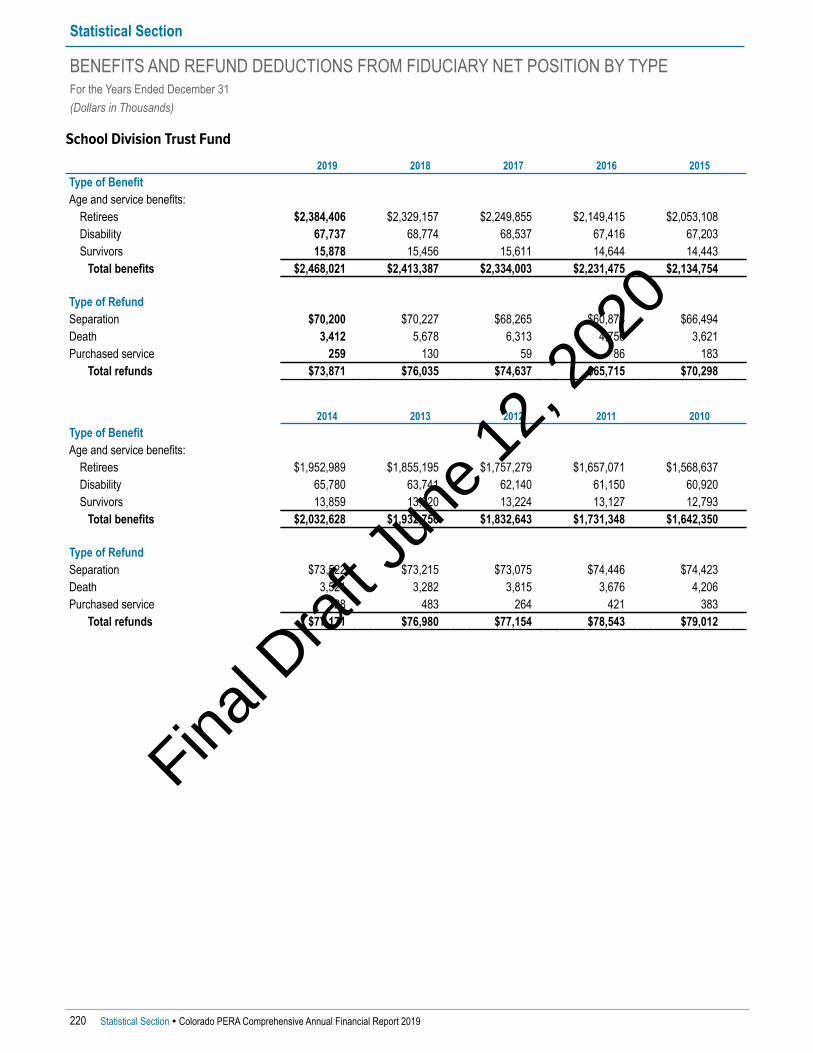
School Division Trust Fund
2019 2018 2017 2016 2015Type of BenefitAge and service benefits:
Retirees $2,384,406 $2,329,157 $2,249,855 $2,149,415 $2,053,108Disability 67,737 68,774 68,537 67,416 67,203Survivors 15,878 15,456 15,611 14,644 14,443
Total benefits $2,468,021 $2,413,387 $2,334,003 $2,231,475 $2,134,754
Type of RefundSeparation $70,200 $70,227 $68,265 $60,873 $66,494Death 3,412 5,678 6,313 4,756 3,621Purchased service 259 130 59 86 183
Total refunds $73,871 $76,035 $74,637 $65,715 $70,298
2014 2013 2012 2011 2010Type of BenefitAge and service benefits:
Retirees $1,952,989 $1,855,195 $1,757,279 $1,657,071 $1,568,637Disability 65,780 63,741 62,140 61,150 60,920Survivors 13,859 13,820 13,224 13,127 12,793
Total benefits $2,032,628 $1,932,756 $1,832,643 $1,731,348 $1,642,350
Type of RefundSeparation $73,522 $73,215 $73,075 $74,446 $74,423Death 3,521 3,282 3,815 3,676 4,206Purchased service 128 483 264 421 383
Total refunds $77,171 $76,980 $77,154 $78,543 $79,012
Statistical Section
BENEFITS AND REFUND DEDUCTIONS FROM FIDUCIARY NET POSITION BY TYPEFor the Years Ended December 31(Dollars in Thousands)
220 Statistical Section � Colorado PERA Comprehensive Annual Financial Report 2019
Final D
raft
June
12,
202
0

Local Government Division Trust Fund
2019 2018 2017 2016 2015Type of BenefitAge and service benefits:
Retirees $278,543 $267,669 $255,105 $240,432 $226,400Disability 16,315 16,582 16,775 16,274 16,327Survivors 2,589 2,494 2,378 2,261 2,221
Total benefits $297,447 $286,745 $274,258 $258,967 $244,948
Type of RefundSeparation $13,070 $14,587 $13,095 $12,017 $18,062Death 1,691 1,128 1,434 921 2,317Purchased service — 1 1 — 31
Total refunds $14,761 $15,716 $14,530 $12,938 $20,410
2014 2013 2012 2011 2010Type of BenefitAge and service benefits:
Retirees $213,962 $199,821 $178,845 $162,681 $149,260Disability 16,045 16,022 15,096 14,727 14,572Survivors 2,048 2,032 2,004 2,041 1,938
Total benefits $232,055 $217,875 $195,945 $179,449 $165,770
Type of RefundSeparation $23,034 $31,268 $41,696 $21,316 $21,999Death 1,401 1,201 1,154 1,283 750Purchased service 1 11 91 87 193
Total refunds $24,436 $32,480 $42,941 $22,686 $22,942
Statistical Section
BENEFITS AND REFUND DEDUCTIONS FROM FIDUCIARY NET POSITION BY TYPEFor the Years Ended December 31(Dollars in Thousands)
Colorado PERA Comprehensive Annual Financial Report 2019 � Statistical Section 221
Final D
raft
June
12,
202
0

Judicial Division Trust Fund
2019 2018 2017 2016 2015Type of BenefitAge and service benefits:
Retirees $26,812 $24,982 $23,993 $21,485 $19,901Disability 893 926 933 939 938Survivors 351 328 324 310 319
Total benefits $28,056 $26,236 $25,250 $22,734 $21,158
Type of RefundSeparation $— $50 $7 $109 $—Death — 136 — — —
Total refunds $— $186 $7 $109 $—
2014 2013 2012 2011 2010Type of BenefitAge and service benefits:
Retirees $18,573 $17,362 $16,333 $15,563 $14,126Disability 917 908 897 889 917Survivors 310 346 376 357 351
Total benefits $19,800 $18,616 $17,606 $16,809 $15,394
Type of RefundSeparation $60 $385 $250 $513 $104Death — — 355 — —
Total refunds $60 $385 $605 $513 $104
Statistical Section
BENEFITS AND REFUND DEDUCTIONS FROM FIDUCIARY NET POSITION BY TYPEFor the Years Ended December 31(Dollars in Thousands)
222 Statistical Section � Colorado PERA Comprehensive Annual Financial Report 2019
Final D
raft
June
12,
202
0

DPS Division Trust Fund
2019 2018 2017 2016 2015Type of BenefitAge and service benefits:
Retirees $267,956 $266,260 $261,361 $253,641 $245,683Disability 8,358 8,278 8,221 7,929 7,804Survivors 1,535 1,685 1,607 1,582 1,581
Total benefits $277,849 $276,223 $271,189 $263,152 $255,068
Type of RefundSeparation $10,486 $10,652 $9,873 $7,894 $7,685Death 250 545 349 616 207Purchased service 2 — 55 11 5
Total refunds $10,738 $11,197 $10,277 $8,521 $7,897
2014 2013 2012 2011 2010Type of BenefitAge and service benefits:
Retirees $237,955 $228,692 $220,106 $212,524 $207,398Disability 7,482 7,592 7,070 7,078 6,886Survivors 1,568 1,637 1,566 1,511 1,541
Total benefits $247,005 $237,921 $228,742 $221,113 $215,825
Type of RefundSeparation $7,424 $6,558 $5,602 $4,322 $2,947Death 631 160 217 82 82Purchased service 8 15 2 8 —
Total refunds $8,063 $6,733 $5,821 $4,412 $3,029
Statistical Section
BENEFITS AND REFUND DEDUCTIONS FROM FIDUCIARY NET POSITION BY TYPEFor the Years Ended December 31(Dollars in Thousands)
Colorado PERA Comprehensive Annual Financial Report 2019 � Statistical Section 223
Final D
raft
June
12,
202
0

State Division
SchoolDivision
Local Government
DivisionJudicial Division
DPS Division Total
Active MembersActive members as of 12/31/2019 55,252 128,938 13,086 339 15,679 213,294
Retirements During 2019Disability retirements 44 95 10 1 8 158Service retirements 1,701 2,980 405 26 223 5,335
Total 1,745 3,075 415 27 231 5,493
Retirement BenefitsTotal receiving disability and serviceretirement benefits on 12/31/2018 39,368 65,206 7,476 368 7,017 119,435
Total retiring during 2019 1,745 3,075 415 27 231 5,493Cobeneficiaries continuing afterretiree’s death 280 315 50 3 54 702
Returning to retirement rolls fromsuspension 6 13 — — — 19
Total 41,399 68,609 7,941 398 7,302 125,649Retirees and cobeneficiariesdeceased during year 1,176 1,402 180 10 258 3,026
Retirees suspending benefits toreturn to work 4 15 4 — 32 55
Total receiving retirement benefits on 12/31/2019 40,219 67,192 7,757 388 7,012 122,568²
Annual retirement benefits forretirees as of 12/31/2019 $1,621,595,042 $2,459,173,565 $294,131,268 $27,860,234 $273,624,402 $4,676,384,511
Average monthly benefit on12/31/2019 $3,360 $3,050 $3,160 $5,984 $3,252 $3,179
Average monthly benefit for allmembers who retired during 2019 $2,767 $2,267 $2,622 $6,529 $2,464 $2,482
Survivor BenefitsSurvivor benefit accounts
Total survivors being paid on12/31/2019 962 1,170 176 11 131 2,450²
Annual benefits payable to survivorsas of 12/31/2019 $22,424,906 $19,420,920 $3,905,592 $404,408 $2,491,034 $48,646,860
Future BenefitsFuture retirements to age 62 or 65 7,412 17,693 2,677 14 1,988 29,784
Total annual future benefits $82,216,408 $143,746,179 $35,184,773 $509,706 $21,741,265 $283,398,331
Future survivor beneficiaries ofinactive members 124 161 18 2 5 310²Total annual future benefits $2,264,538 $2,058,097 $224,380 $47,984 $32,180 $4,627,179
1 In addition, as of December 31, 2019, there was a total of 253,647 non-vested inactive members due a refund of their contributions as follows: State Division—81,012; School Division—132,833; Local Government Division—26,274; Judicial Division—6; DPS Division—13,522.
2 These line items make up the total for retirees and beneficiaries reported on page 49 in Note 1 of the Notes to the Financial Statements in theFinancial Section.
Statistical Section
MEMBER AND BENEFIT RECIPIENT STATISTICS1
(In Actual Dollars)
224 Statistical Section � Colorado PERA Comprehensive Annual Financial Report 2019
Final D
raft
June
12,
202
0
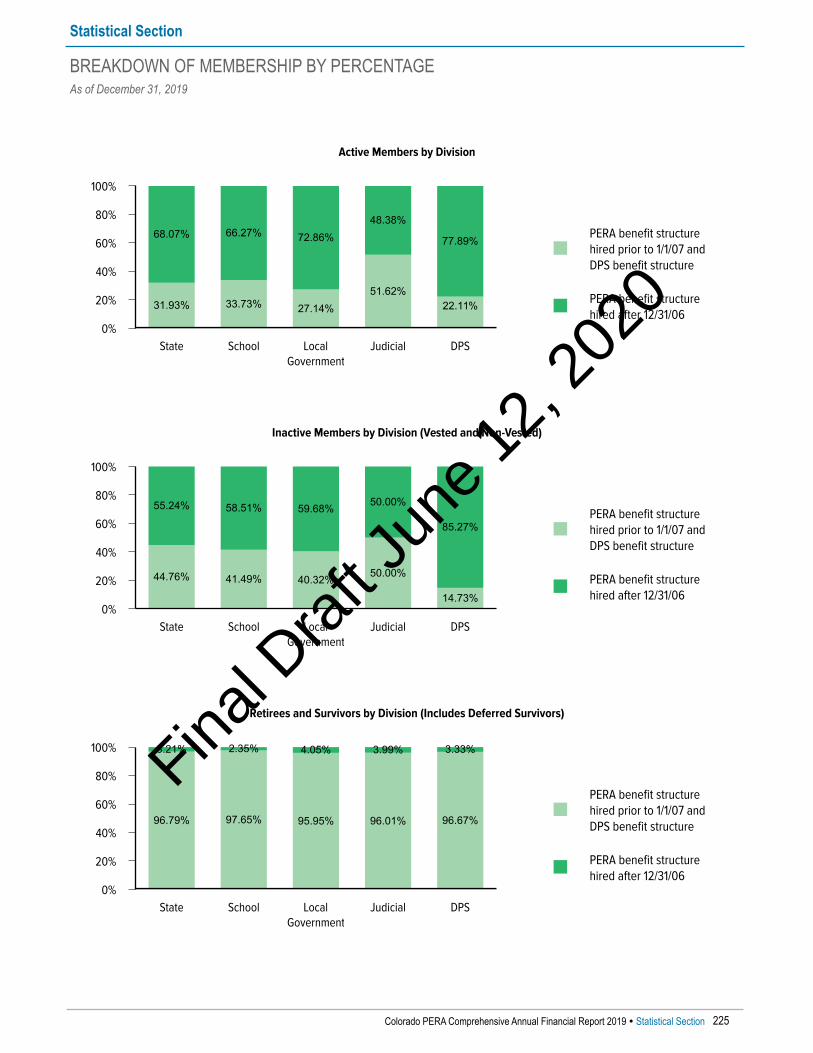
PERA benefit structurehired prior to 1/1/07 andDPS benefit structure
PERA benefit structurehired after 12/31/06
Active Members by Division
100%
80%
60%
40%
20%
0%State School Local
GovernmentJudicial DPS
31.93% 33.73% 27.14%51.62%
22.11%
68.07% 66.27% 72.86%48.38%
77.89%
PERA benefit structurehired prior to 1/1/07 andDPS benefit structure
PERA benefit structurehired after 12/31/06
Inactive Members by Division (Vested and Non-Vested)
100%
80%
60%
40%
20%
0%State School Local
GovernmentJudicial DPS
44.76% 41.49% 40.32% 50.00%
14.73%
55.24% 58.51% 59.68% 50.00%
85.27%
PERA benefit structurehired prior to 1/1/07 andDPS benefit structure
PERA benefit structurehired after 12/31/06
Retirees and Survivors by Division (Includes Deferred Survivors)
100%
80%
60%
40%
20%
0%State School Local
GovernmentJudicial DPS
96.79% 97.65% 95.95% 96.01% 96.67%
3.21% 2.35% 4.05% 3.99% 3.33%
Statistical Section
BREAKDOWN OF MEMBERSHIP BY PERCENTAGEAs of December 31, 2019
Colorado PERA Comprehensive Annual Financial Report 2019 � Statistical Section 225
Final D
raft
June
12,
202
0
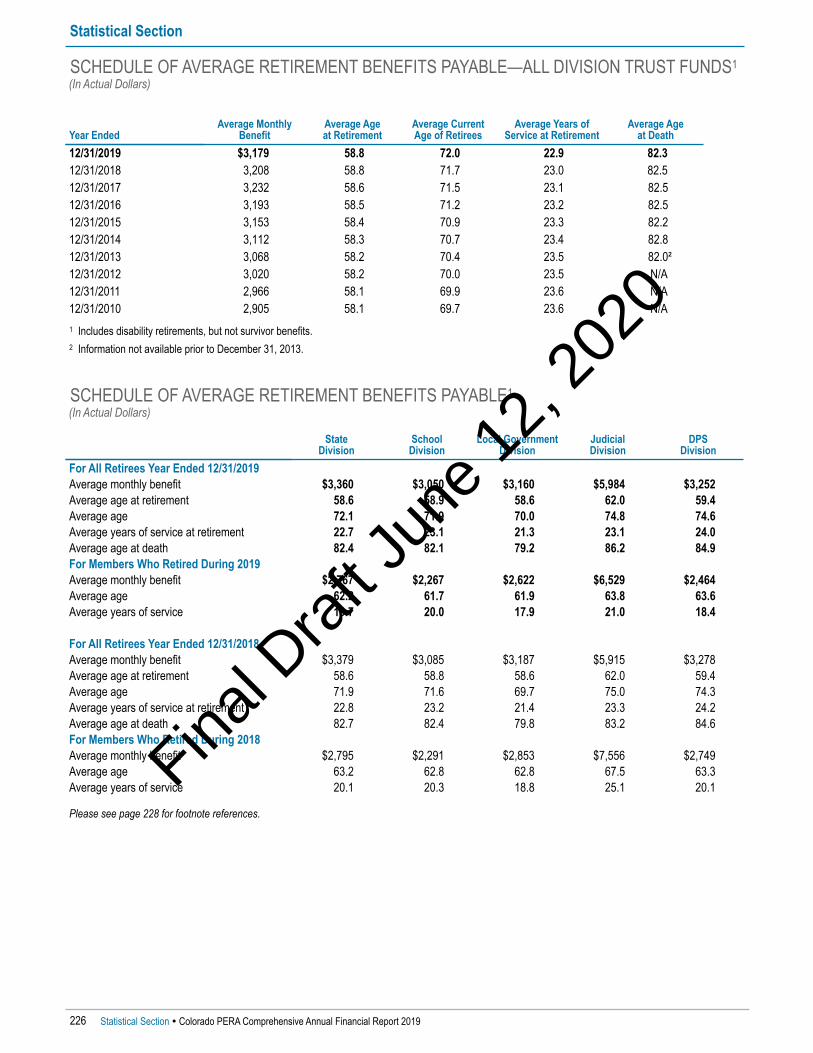
SCHEDULE OF AVERAGE RETIREMENT BENEFITS PAYABLE—ALL DIVISION TRUST FUNDS1 (In Actual Dollars)
Year EndedAverage Monthly
BenefitAverage Age at Retirement
Average CurrentAge of Retirees
Average Years ofService at Retirement
Average Age at Death
12/31/2019 $3,179 58.8 72.0 22.9 82.312/31/2018 3,208 58.8 71.7 23.0 82.512/31/2017 3,232 58.6 71.5 23.1 82.512/31/2016 3,193 58.5 71.2 23.2 82.512/31/2015 3,153 58.4 70.9 23.3 82.212/31/2014 3,112 58.3 70.7 23.4 82.812/31/2013 3,068 58.2 70.4 23.5 82.0²12/31/2012 3,020 58.2 70.0 23.5 N/A12/31/2011 2,966 58.1 69.9 23.6 N/A12/31/2010 2,905 58.1 69.7 23.6 N/A
1 Includes disability retirements, but not survivor benefits. 2 Information not available prior to December 31, 2013.
Statistical Section
226 Statistical Section � Colorado PERA Comprehensive Annual Financial Report 2019
SCHEDULE OF AVERAGE RETIREMENT BENEFITS PAYABLE1 (In Actual Dollars)
State Division
School Division
Local GovernmentDivision
Judicial Division
DPS Division
For All Retirees Year Ended 12/31/2019Average monthly benefit $3,360 $3,050 $3,160 $5,984 $3,252Average age at retirement 58.6 58.9 58.6 62.0 59.4Average age 72.1 71.9 70.0 74.8 74.6Average years of service at retirement 22.7 23.1 21.3 23.1 24.0Average age at death 82.4 82.1 79.2 86.2 84.9For Members Who Retired During 2019Average monthly benefit $2,767 $2,267 $2,622 $6,529 $2,464Average age 62.2 61.7 61.9 63.8 63.6Average years of service 19.7 20.0 17.9 21.0 18.4
For All Retirees Year Ended 12/31/2018Average monthly benefit $3,379 $3,085 $3,187 $5,915 $3,278Average age at retirement 58.6 58.8 58.6 62.0 59.4Average age 71.9 71.6 69.7 75.0 74.3Average years of service at retirement 22.8 23.2 21.4 23.3 24.2Average age at death 82.7 82.4 79.8 83.2 84.6For Members Who Retired During 2018Average monthly benefit $2,795 $2,291 $2,853 $7,556 $2,749Average age 63.2 62.8 62.8 67.5 63.3Average years of service 20.1 20.3 18.8 25.1 20.1
Please see page 228 for footnote references.
Final D
raft
June
12,
202
0

State Division
School Division
Local GovernmentDivision
Judicial Division
DPS Division
For All Retirees Year Ended 12/31/2017Average monthly benefit $3,397 $3,115 $3,188 $5,864 $3,290Average age at retirement 58.4 58.7 58.4 61.8 59.3Average age 71.7 71.3 69.3 74.3 74.2Average years of service at retirement 22.9 23.3 21.5 23.2 24.4Average age at death 82.1 82.8 78.2 82.9 85.2For Members Who Retired During 2017Average monthly benefit $2,866 $2,304 $2,669 $7,747 $2,608Average age 61.7 61.7 61.9 66.1 62.0Average years of service 20.6 20.4 18.7 25.6 19.3
For All Retirees Year Ended 12/31/2016Average monthly benefit $3,345 $3,086 $3,145 $5,624 $3,248Average age at retirement 58.3 58.6 58.2 61.6 59.2Average age 71.4 71.0 69.0 74.2 74.0Average years of service at retirement 22.9 23.4 21.7 23.0 24.7Average age at death 82.4 82.7 80.1 84.2 83.3For Members Who Retired During 2016Average monthly benefit $2,812 $2,303 $2,467 $6,192 $2,520Average age 61.6 61.4 61.2 65.6 62.6Average years of service 20.7 20.7 18.1 21.4 19.2
For All Retirees Year Ended 12/31/2015Average monthly benefit $3,294 $3,052 $3,114 $5,379 $3,206Average age at retirement 58.2 58.5 58.1 61.4 59.1Average age 71.2 70.7 68.6 74.5 73.9Average years of service at retirement 23.0 23.5 21.8 22.9 25.0Average age at death 81.7 82.2 79.6 78.9 85.3For Members Who Retired During 2015Average monthly benefit $2,828 $2,293 $2,750 $7,030 $2,493Average age 61.4 61.3 61.1 65.1 62.9Average years of service 21.0 20.7 19.7 25.7 18.7
For All Retirees Year Ended 12/31/2014Average monthly benefit $3,241 $3,019 $3,067 $5,158 $3,169Average age at retirement 58.1 58.4 58.0 61.4 59.0Average age 71.0 70.4 68.3 74.5 73.7Average years of service at retirement 23.0 23.6 21.9 22.7 25.3Average age at death 82.2 83.1 78.8 81.1 85.2For Members Who Retired During 2014Average monthly benefit $2,760 $2,405 $2,352 $4,969 $2,593Average age 61.3 60.9 61.3 66.2 63.2Average years of service 20.8 21.0 18.4 20.0 19.6
Please see page 228 for footnote references.
Statistical Section
SCHEDULE OF AVERAGE RETIREMENT BENEFITS PAYABLE1 (CONTINUED)(In Actual Dollars)
Colorado PERA Comprehensive Annual Financial Report 2019 � Statistical Section 227
Final D
raft
June
12,
202
0

1 Includes disability retirements, but not survivor benefits. 2 Information not available prior to December 31, 2013.
State Division
School Division
Local GovernmentDivision
Judicial Division
DPS Division
For All Retirees Year Ended 12/31/2013Average monthly benefit $3,185 $2,980 $3,044 $5,077 $3,121Average age at retirement 58.0 58.3 57.8 61.3 58.8Average age 70.8 70.0 67.9 74.2 73.5Average years of service at retirement 23.0 23.6 22.1 22.8 25.5Average age at death2 82.5 81.4 78.6 88.2 84.8For Members Who Retired During 2013Average monthly benefit $2,837 $2,455 $2,509 $6,857 $2,776Average age 60.7 60.8 60.1 64.9 61.7Average years of service 21.2 21.3 18.9 26.2 19.6
For All Retirees Year Ended 12/31/2012Average monthly benefit $3,124 $2,939 $3,007 $4,889 $3,064Average age at retirement 58.0 58.2 57.7 61.2 58.8Average age 70.4 69.7 67.5 73.7 73.3Average years of service at retirement 23.0 23.7 22.2 22.6 25.8For Members Who Retired During 2012Average monthly benefit $2,890 $2,425 $2,876 $4,841 $2,540Average age 60.2 60.3 59.8 63.9 62.5Average years of service 21.8 21.3 20.9 22.7 19.7
For All Retirees Year Ended 12/31/2011Average monthly benefit $3,056 $2,895 $2,948 $4,739 $3,009Average age at retirement 58.0 58.2 57.5 61.0 58.7Average age 70.3 69.5 67.8 73.7 73.2Average years of service at retirement 23.0 23.8 22.3 22.4 26.0For Members Who Retired During 2011Average monthly benefit $3,010 $2,527 $2,896 $5,130 $2,665Average age 60.2 60.3 59.3 63.4 62.0Average years of service 22.3 22.1 21.2 23.4 20.5
Statistical Section
SCHEDULE OF AVERAGE RETIREMENT BENEFITS PAYABLE1 (CONTINUED)(In Actual Dollars)
228 Statistical Section � Colorado PERA Comprehensive Annual Financial Report 2019
Final D
raft
June
12,
202
0

PERA Benefit Payments1,2
At the end of 2019, PERA was paying benefits to more than 125,000 retired public employees and their beneficiaries whoreceived an average benefit of $3,153 per month. For benefit recipients, this may be the primary source of retirementincome as most PERA benefit recipients do not qualify for Social Security payments.
The PERA service retirement formula for calculating benefits, specified in State law as of December 31, 2019, is 2.5 percentmultiplied by years of service multiplied by Highest Average Salary (HAS). As of December 31, 2019, HAS3 is defined inState law as one-twelfth of the average of the highest annual salaries on which contributions were paid that are associatedwith three periods of 12 consecutive months of service credit. The three 12-month periods do not have to be consecutive,nor do they have to be the last three years of employment. These three periods are tied to a fourth 12-month period whichbecomes the base year for the year-to-year salary increase limitation for HAS calculation purposes. The year-to-year limitfor members who were eligible to retire on January 1, 2011, and hired before January 1, 2007, is 15 percent. All othermembers are subject to an 8 percent year-to-year limit in their HAS calculation. This annual limit applied to salaries in theHAS years is designed to moderate salary “spiking.”
Approximately 69.3 percent (86,589) of recipients receive less than $50,000 a year in PERA benefits, as the graph belowdemonstrates. Slightly less than 1.7 percent (2,120) of PERA benefit recipients receive an annual benefit payment of$100,000 or more. Generally, these benefit recipients had high salaries and a significant number of years of service credit. 1 Includes amounts paid under replacement benefit arrangements. 2 Does not include deferred survivors and benefits that ended or were suspended in 2019. 3 Some members of the DPS benefit structure, members in the Judicial Division, and members who do not have five years of service credit on
December 31, 2019, have different HAS calculations.
PERA BENEFIT PAYMENTS BY DOLLAR AMOUNT OF ANNUAL BENEFIT AND NUMBER OF BENEFIT RECIPIENTS
Benefit Range1Number of
Benefit Recipients2
$0 - $4,999 9,110
$5,000 - $9,999 10,294
$10,000 - $24,999 26,752
$25,000 - $49,999 40,433
$50,000 - $99,999 36,309
$100,000 - $149,999 1,915
$150,000 - $199,999 149
$200,000+ 56
Total Benefit Recipients 125,018
7.29%8.24%
21.40%
32.34%
29.04%
1.53%
0.12%0.04%
1 Includes amounts paid under replacement benefit arrangements. 2 Does not include 310 survivors.
Statistical Section
COLORADO PERA BENEFIT PAYMENTS—ALL DIVISION TRUST FUNDSAs of December 31, 2019(In Actual Dollars)
Colorado PERA Comprehensive Annual Financial Report 2019 � Statistical Section 229
Final D
raft
June
12,
202
0

Benefit Payments by DecileAnother way to examine the data is to group benefit recipients and the benefits they receive into benefit payment rangesas a percentage of the total. The table below shows that, for the one-third of PERA benefit recipients (42,244) in the lowestdecile, the average benefit is $11,196 a year. This group retired at an average age of 61 with just under 14 years of servicecredit. For the top decile, on the other end of the scale, the average benefit is $106,368 a year. However, this group, onaverage, had just over 33 years of service credit, which is more than twice the length of the average service credit of thosein the lowest decile. For the 5,493 new retirees in 2019, the average monthly benefit is $2,486. These members retired at anaverage age of 62 with 19.67 years of service credit.
Decile
Number of Benefit
Recipients1
Percent of Benefit
Recipients
Average Monthly Benefit2
Average Age at
Retirement
Average Service Credit
1%–10% 42,244 33.79% $933 61 13.6711%–20% 17,083 13.66% 2,308 58 21.4721%–30% 12,923 10.34% 3,051 58 24.6531%–40% 10,755 8.60% 3,666 58 26.9141%–50% 9,316 7.45% 4,232 57 28.5551%–60% 8,263 6.61% 4,771 57 29.7461%–70% 7,421 5.94% 5,312 57 30.6371%–80% 6,693 5.35% 5,890 57 31.3581%–90% 5,872 4.70% 6,713 57 32.20
91%–100% 4,448 3.56% 8,864 58 33.23Total 125,018 100.00% 3,153 59 22.70
1 Does not include 310 survivors. 2 Includes amounts paid under replacement benefit arrangements.
Average Monthly Benefit Payment by Years of Service Credit
$9,000
$8,000
$7,000
$6,000
$5,000
$4,000
$3,000
$2,000
$1,000
$0
Amou
ntof
Mon
thly
Bene
fit
10 14 18 22 26 30 34 38
Years of Service Credit
Statistical Section
COLORADO PERA BENEFIT PAYMENTS—ALL DIVISION TRUST FUNDSAs of December 31, 2019(In Actual Dollars)
230 Statistical Section � Colorado PERA Comprehensive Annual Financial Report 2019
Final D
raft
June
12,
202
0

Types of Benefits Option Selected1—Age and service retirement. Retirees select one of the following options at retirement:2—Disability retirement. 1—Single-life benefit.3—Survivor payment—Option 3. 2—Joint benefit with 1/2 to surviving cobeneficiary.4—Survivor payment—children, spouse, or dependent parent. 3—Joint and survivor benefit.5—Surviving spouse with future benefit. 4—Joint benefit with 1/2 to either survivor. (No longer offered
to members retiring.)6—Former member with future benefit.
Surviving CobeneficiaryRetiree has predeceased the cobeneficiary.
Surviving RetireeCobeneficiary has predeceased the retiree.
State Division
Types of BenefitsAmount of Monthly Benefit Total
(Columns 1–5) 1 2 3 4 5 6(In Actual Dollars)
$1-$1,000 5,972 5,350 257 25 273 67 5,039$1,001-$2,000 7,216 5,488 1,339 48 299 42 1,739$2,001-$3,000 7,767 6,402 1,210 27 120 8 444$3,001-$4,000 6,750 6,359 299 30 60 2 127$4,001-$5,000 5,004 4,885 86 14 18 1 41$5,001+ 8,596 8,515 29 31 17 4 22
Total 41,305 36,999 3,220 175 787 124 7,412
Option SelectedAmount of Monthly Benefit1
1 2 3 4Surviving
CobeneficiarySurviving
Retiree(In Actual Dollars)
$1-$1,000 3,745 357 926 2 559 18$1,001-$2,000 3,909 768 1,124 2 976 48$2,001-$3,000 4,263 1,035 1,410 3 838 63$3,001-$4,000 3,566 1,152 1,382 — 524 34$4,001-$5,000 2,529 971 1,155 2 294 20$5,001+ 4,080 1,859 2,205 3 376 21
Total 22,092 6,142 8,202 12 3,567 204 1 For Types of Benefits 1 and 2 above.
Statistical Section
SCHEDULE OF RETIREES AND SURVIVORS BY TYPES OF BENEFITSAs of December 31, 2019
Colorado PERA Comprehensive Annual Financial Report 2019 � Statistical Section 231
Final D
raft
June
12,
202
0
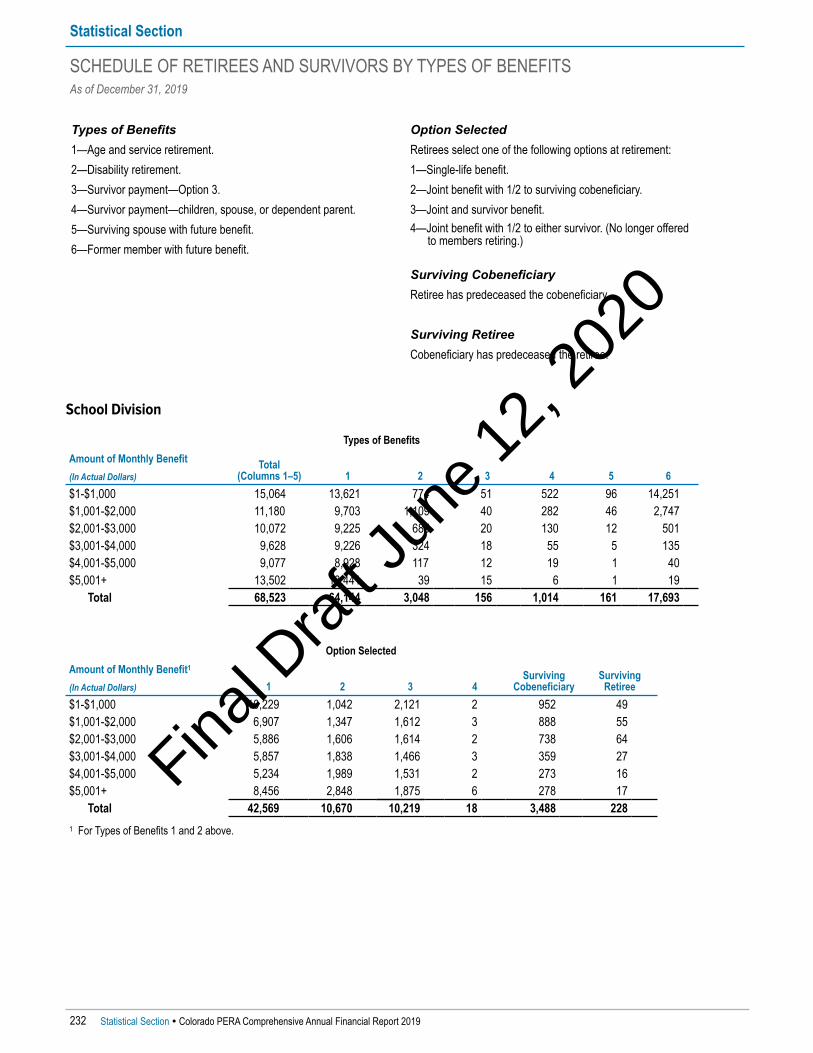
Types of Benefits Option Selected1—Age and service retirement. Retirees select one of the following options at retirement:2—Disability retirement. 1—Single-life benefit.3—Survivor payment—Option 3. 2—Joint benefit with 1/2 to surviving cobeneficiary.4—Survivor payment—children, spouse, or dependent parent. 3—Joint and survivor benefit.5—Surviving spouse with future benefit. 4—Joint benefit with 1/2 to either survivor. (No longer offered
to members retiring.)6—Former member with future benefit.
Surviving CobeneficiaryRetiree has predeceased the cobeneficiary.
Surviving RetireeCobeneficiary has predeceased the retiree.
School Division
Types of BenefitsAmount of Monthly Benefit Total
(Columns 1–5) 1 2 3 4 5 6(In Actual Dollars)
$1-$1,000 15,064 13,621 774 51 522 96 14,251$1,001-$2,000 11,180 9,703 1,109 40 282 46 2,747$2,001-$3,000 10,072 9,225 685 20 130 12 501$3,001-$4,000 9,628 9,226 324 18 55 5 135$4,001-$5,000 9,077 8,928 117 12 19 1 40$5,001+ 13,502 13,441 39 15 6 1 19
Total 68,523 64,144 3,048 156 1,014 161 17,693
Option SelectedAmount of Monthly Benefit1
1 2 3 4Surviving
CobeneficiarySurviving
Retiree(In Actual Dollars)
$1-$1,000 10,229 1,042 2,121 2 952 49$1,001-$2,000 6,907 1,347 1,612 3 888 55$2,001-$3,000 5,886 1,606 1,614 2 738 64$3,001-$4,000 5,857 1,838 1,466 3 359 27$4,001-$5,000 5,234 1,989 1,531 2 273 16$5,001+ 8,456 2,848 1,875 6 278 17
Total 42,569 10,670 10,219 18 3,488 228 1 For Types of Benefits 1 and 2 above.
Statistical Section
SCHEDULE OF RETIREES AND SURVIVORS BY TYPES OF BENEFITSAs of December 31, 2019
232 Statistical Section � Colorado PERA Comprehensive Annual Financial Report 2019
Final D
raft
June
12,
202
0

Types of Benefits Option Selected1—Age and service retirement. Retirees select one of the following options at retirement:2—Disability retirement. 1—Single-life benefit.3—Survivor payment—Option 3. 2—Joint benefit with 1/2 to surviving cobeneficiary.4—Survivor payment—children, spouse, or dependent parent. 3—Joint and survivor benefit.5—Surviving spouse with future benefit. 4—Joint benefit with 1/2 to either survivor. (No longer offered
to members retiring.)6—Former member with future benefit.
Surviving CobeneficiaryRetiree has predeceased the cobeneficiary.
Surviving RetireeCobeneficiary has predeceased the retiree.
Local Government Division
Types of BenefitsAmount of Monthly Benefit Total
(Columns 1–5) 1 2 3 4 5 6(In Actual Dollars)
$1-$1,000 1,451 1,338 54 6 45 8 1,629$1,001-$2,000 1,554 1,204 279 8 54 9 680$2,001-$3,000 1,406 1,138 231 10 27 — 249$3,001-$4,000 1,145 1,062 68 5 9 1 75$4,001-$5,000 863 844 13 5 1 — 32$5,001+ 1,532 1,519 7 5 1 — 12
Total 7,951 7,105 652 39 137 18 2,677
Option SelectedAmount of Monthly Benefit1
1 2 3 4Surviving
CobeneficiarySurviving
Retiree(In Actual Dollars)
$1-$1,000 938 102 229 — 120 3$1,001-$2,000 859 166 285 1 163 9$2,001-$3,000 718 227 303 — 113 8$3,001-$4,000 596 234 230 — 65 5$4,001-$5,000 426 177 218 — 36 —$5,001+ 650 375 450 — 51 —
Total 4,187 1,281 1,715 1 548 25 1 For Types of Benefits 1 and 2 above.
Statistical Section
SCHEDULE OF RETIREES AND SURVIVORS BY TYPES OF BENEFITSAs of December 31, 2019
Colorado PERA Comprehensive Annual Financial Report 2019 � Statistical Section 233
Final D
raft
June
12,
202
0
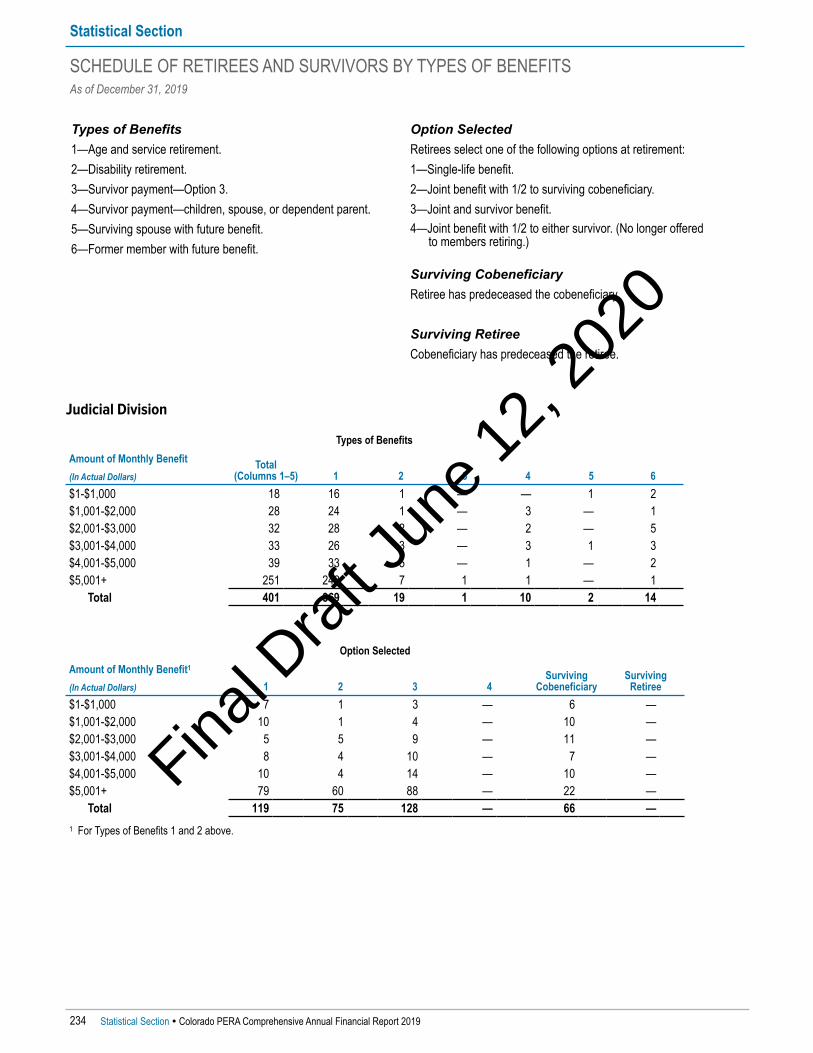
Types of Benefits Option Selected1—Age and service retirement. Retirees select one of the following options at retirement:2—Disability retirement. 1—Single-life benefit.3—Survivor payment—Option 3. 2—Joint benefit with 1/2 to surviving cobeneficiary.4—Survivor payment—children, spouse, or dependent parent. 3—Joint and survivor benefit.5—Surviving spouse with future benefit. 4—Joint benefit with 1/2 to either survivor. (No longer offered
to members retiring.)6—Former member with future benefit.
Surviving CobeneficiaryRetiree has predeceased the cobeneficiary.
Surviving RetireeCobeneficiary has predeceased the retiree.
Judicial Division
Types of BenefitsAmount of Monthly Benefit Total
(Columns 1–5) 1 2 3 4 5 6(In Actual Dollars)
$1-$1,000 18 16 1 — — 1 2$1,001-$2,000 28 24 1 — 3 — 1$2,001-$3,000 32 28 2 — 2 — 5$3,001-$4,000 33 26 3 — 3 1 3$4,001-$5,000 39 33 5 — 1 — 2$5,001+ 251 242 7 1 1 — 1
Total 401 369 19 1 10 2 14
Option SelectedAmount of Monthly Benefit1
1 2 3 4Surviving
CobeneficiarySurviving
Retiree(In Actual Dollars)
$1-$1,000 7 1 3 — 6 —$1,001-$2,000 10 1 4 — 10 —$2,001-$3,000 5 5 9 — 11 —$3,001-$4,000 8 4 10 — 7 —$4,001-$5,000 10 4 14 — 10 —$5,001+ 79 60 88 — 22 —
Total 119 75 128 — 66 — 1 For Types of Benefits 1 and 2 above.
Statistical Section
SCHEDULE OF RETIREES AND SURVIVORS BY TYPES OF BENEFITSAs of December 31, 2019
234 Statistical Section � Colorado PERA Comprehensive Annual Financial Report 2019
Final D
raft
June
12,
202
0
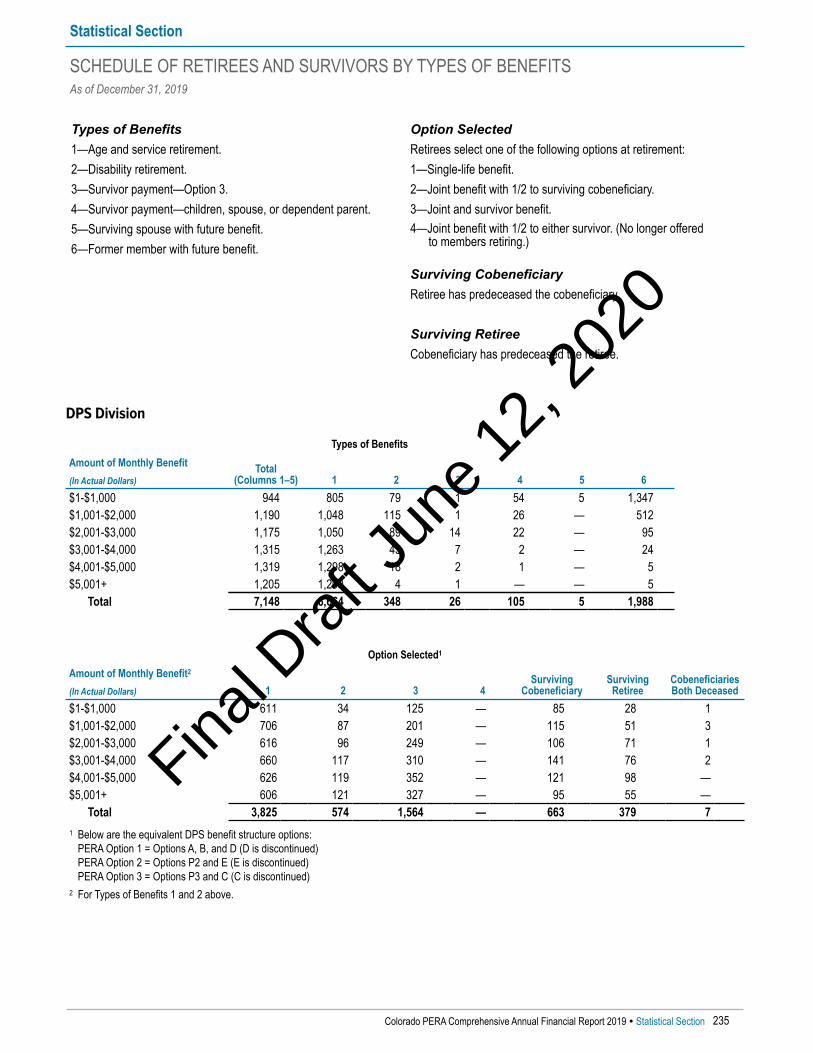
Types of Benefits Option Selected1—Age and service retirement. Retirees select one of the following options at retirement:2—Disability retirement. 1—Single-life benefit.3—Survivor payment—Option 3. 2—Joint benefit with 1/2 to surviving cobeneficiary.4—Survivor payment—children, spouse, or dependent parent. 3—Joint and survivor benefit.5—Surviving spouse with future benefit. 4—Joint benefit with 1/2 to either survivor. (No longer offered
to members retiring.)6—Former member with future benefit.
Surviving CobeneficiaryRetiree has predeceased the cobeneficiary.
Surviving RetireeCobeneficiary has predeceased the retiree.
DPS Division
Types of BenefitsAmount of Monthly Benefit Total
(Columns 1–5) 1 2 3 4 5 6(In Actual Dollars)
$1-$1,000 944 805 79 1 54 5 1,347$1,001-$2,000 1,190 1,048 115 1 26 — 512$2,001-$3,000 1,175 1,050 89 14 22 — 95$3,001-$4,000 1,315 1,263 43 7 2 — 24$4,001-$5,000 1,319 1,298 18 2 1 — 5$5,001+ 1,205 1,200 4 1 — — 5
Total 7,148 6,664 348 26 105 5 1,988
Option Selected1
Amount of Monthly Benefit2
1 2 3 4Surviving
CobeneficiarySurviving
RetireeCobeneficiariesBoth Deceased(In Actual Dollars)
$1-$1,000 611 34 125 — 85 28 1$1,001-$2,000 706 87 201 — 115 51 3$2,001-$3,000 616 96 249 — 106 71 1$3,001-$4,000 660 117 310 — 141 76 2$4,001-$5,000 626 119 352 — 121 98 —$5,001+ 606 121 327 — 95 55 —
Total 3,825 574 1,564 — 663 379 7 1 Below are the equivalent DPS benefit structure options:
PERA Option 1 = Options A, B, and D (D is discontinued) PERA Option 2 = Options P2 and E (E is discontinued) PERA Option 3 = Options P3 and C (C is discontinued)
2 For Types of Benefits 1 and 2 above.
Statistical Section
SCHEDULE OF RETIREES AND SURVIVORS BY TYPES OF BENEFITSAs of December 31, 2019
Colorado PERA Comprehensive Annual Financial Report 2019 � Statistical Section 235
Final D
raft
June
12,
202
0
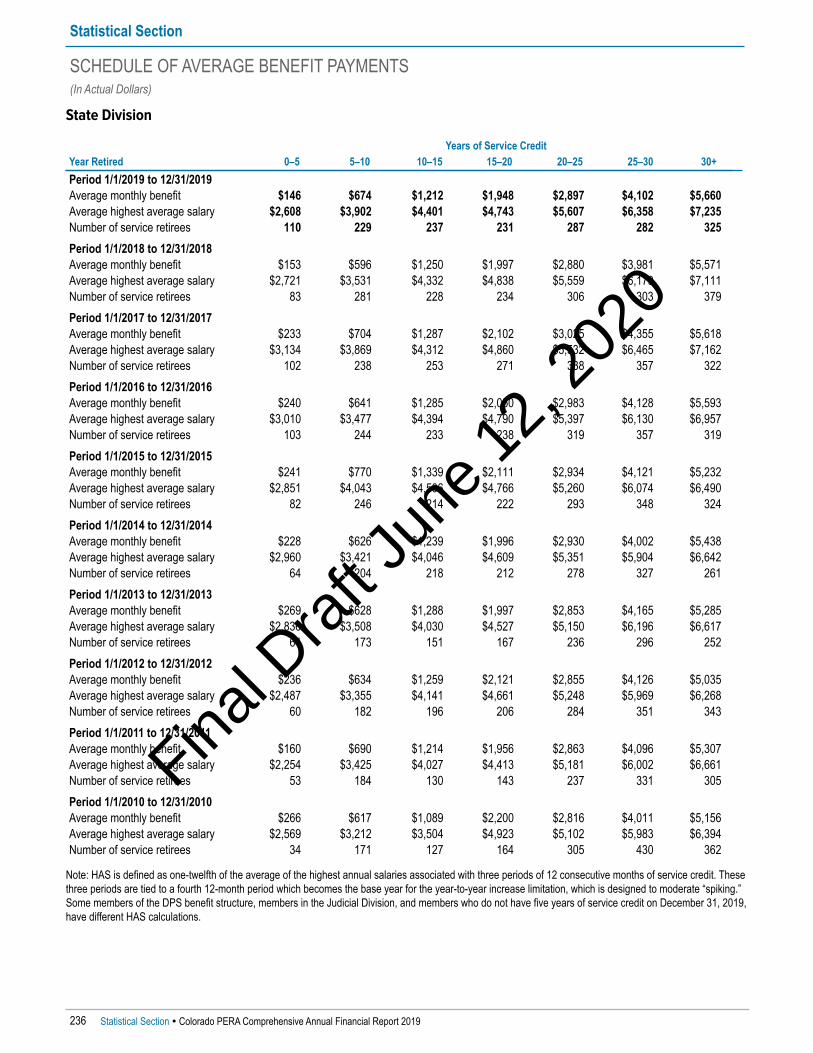
State Division
Years of Service CreditYear Retired 0–5 5–10 10–15 15–20 20–25 25–30 30+Period 1/1/2019 to 12/31/2019Average monthly benefit $146 $674 $1,212 $1,948 $2,897 $4,102 $5,660Average highest average salary $2,608 $3,902 $4,401 $4,743 $5,607 $6,358 $7,235Number of service retirees 110 229 237 231 287 282 325Period 1/1/2018 to 12/31/2018Average monthly benefit $153 $596 $1,250 $1,997 $2,880 $3,981 $5,571Average highest average salary $2,721 $3,531 $4,332 $4,838 $5,559 $6,179 $7,111Number of service retirees 83 281 228 234 306 303 379Period 1/1/2017 to 12/31/2017Average monthly benefit $233 $704 $1,287 $2,102 $3,025 $4,355 $5,618Average highest average salary $3,134 $3,869 $4,312 $4,860 $5,532 $6,465 $7,162Number of service retirees 102 238 253 271 338 357 322Period 1/1/2016 to 12/31/2016Average monthly benefit $240 $641 $1,285 $2,050 $2,983 $4,128 $5,593Average highest average salary $3,010 $3,477 $4,394 $4,790 $5,397 $6,130 $6,957Number of service retirees 103 244 233 238 319 357 319Period 1/1/2015 to 12/31/2015Average monthly benefit $241 $770 $1,339 $2,111 $2,934 $4,121 $5,232Average highest average salary $2,851 $4,043 $4,506 $4,766 $5,260 $6,074 $6,490Number of service retirees 82 246 214 222 293 348 324Period 1/1/2014 to 12/31/2014Average monthly benefit $228 $626 $1,239 $1,996 $2,930 $4,002 $5,438Average highest average salary $2,960 $3,421 $4,046 $4,609 $5,351 $5,904 $6,642Number of service retirees 64 204 218 212 278 327 261Period 1/1/2013 to 12/31/2013Average monthly benefit $269 $628 $1,288 $1,997 $2,853 $4,165 $5,285Average highest average salary $2,836 $3,508 $4,030 $4,527 $5,150 $6,196 $6,617Number of service retirees 64 173 151 167 236 296 252Period 1/1/2012 to 12/31/2012Average monthly benefit $236 $634 $1,259 $2,121 $2,855 $4,126 $5,035Average highest average salary $2,487 $3,355 $4,141 $4,661 $5,248 $5,969 $6,268Number of service retirees 60 182 196 206 284 351 343Period 1/1/2011 to 12/31/2011Average monthly benefit $160 $690 $1,214 $1,956 $2,863 $4,096 $5,307Average highest average salary $2,254 $3,425 $4,027 $4,413 $5,181 $6,002 $6,661Number of service retirees 53 184 130 143 237 331 305Period 1/1/2010 to 12/31/2010Average monthly benefit $266 $617 $1,089 $2,200 $2,816 $4,011 $5,156Average highest average salary $2,569 $3,212 $3,504 $4,923 $5,102 $5,983 $6,394Number of service retirees 34 171 127 164 305 430 362
Note: HAS is defined as one-twelfth of the average of the highest annual salaries associated with three periods of 12 consecutive months of service credit. Thesethree periods are tied to a fourth 12-month period which becomes the base year for the year-to-year increase limitation, which is designed to moderate “spiking.”Some members of the DPS benefit structure, members in the Judicial Division, and members who do not have five years of service credit on December 31, 2019,have different HAS calculations.
Statistical Section
SCHEDULE OF AVERAGE BENEFIT PAYMENTS(In Actual Dollars)
236 Statistical Section � Colorado PERA Comprehensive Annual Financial Report 2019
Final D
raft
June
12,
202
0

School Division
Years of Service CreditYear Retired 0–5 5–10 10–15 15–20 20–25 25–30 30+Period 1/1/2019 to 12/31/2019Average monthly benefit $138 $396 $786 $1,440 $2,321 $3,503 $4,911Average highest average salary $1,981 $2,339 $2,854 $3,519 $4,428 $5,374 $6,356Number of service retirees 141 366 440 377 635 509 512Period 1/1/2018 to 12/31/2018Average monthly benefit $124 $436 $805 $1,440 $2,254 $3,580 $4,833Average highest average salary $1,951 $2,574 $2,917 $3,535 $4,296 $5,435 $6,175Number of service retirees 122 365 451 474 640 551 541Period 1/1/2017 to 12/31/2017Average monthly benefit $185 $433 $925 $1,582 $2,418 $3,794 $4,891Average highest average salary $1,980 $2,351 $3,118 $3,615 $4,393 $5,547 $6,067Number of service retirees 159 370 463 485 611 590 428Period 1/1/2016 to 12/31/2016Average monthly benefit $127 $430 $879 $1,684 $2,304 $3,727 $4,695Average highest average salary $1,796 $2,325 $2,924 $3,799 $4,156 $5,388 $5,851Number of service retirees 118 384 388 408 565 589 422Period 1/1/2015 to 12/31/2015Average monthly benefit $221 $436 $899 $1,565 $2,400 $3,682 $4,621Average highest average salary $2,015 $2,317 $3,058 $3,538 $4,322 $5,347 $5,741Number of service retirees 110 372 398 397 544 618 395Period 1/1/2014 to 12/31/2014Average monthly benefit $194 $467 $939 $1,661 $2,407 $3,726 $4,778Average highest average salary $2,108 $2,580 $3,189 $3,706 $4,372 $5,422 $5,908Number of service retirees 106 362 401 392 531 597 465Period 1/1/2013 to 12/31/2013Average monthly benefit $201 $474 $976 $1,687 $2,448 $3,685 $4,739Average highest average salary $1,791 $2,726 $3,197 $3,721 $4,357 $5,318 $5,886Number of service retirees 79 350 339 311 492 571 441Period 1/1/2012 to 12/31/2012Average monthly benefit $216 $473 $815 $1,632 $2,411 $3,682 $4,592Average highest average salary $1,696 $2,575 $2,800 $3,546 $4,368 $5,370 $5,791Number of service retirees 96 365 349 380 534 634 509Period 1/1/2011 to 12/31/2011Average monthly benefit $214 $462 $806 $1,625 $2,430 $3,617 $4,632Average highest average salary $1,980 $2,563 $2,683 $3,526 $4,344 $5,235 $5,804Number of service retirees 71 336 273 334 506 651 497Period 1/1/2010 to 12/31/2010Average monthly benefit $212 $464 $780 $1,543 $2,393 $3,603 $4,602Average highest average salary $2,193 $2,572 $2,500 $3,336 $4,243 $5,207 $5,722Number of service retirees 56 297 252 305 585 755 601
Note: HAS is defined as one-twelfth of the average of the highest annual salaries associated with three periods of 12 consecutive months of service credit. Thesethree periods are tied to a fourth 12-month period which becomes the base year for the year-to-year increase limitation, which is designed to moderate “spiking.”Some members of the DPS benefit structure, members in the Judicial Division, and members who do not have five years of service credit on December 31, 2019,have different HAS calculations.
Statistical Section
SCHEDULE OF AVERAGE BENEFIT PAYMENTS(In Actual Dollars)
Colorado PERA Comprehensive Annual Financial Report 2019 � Statistical Section 237
Final D
raft
June
12,
202
0
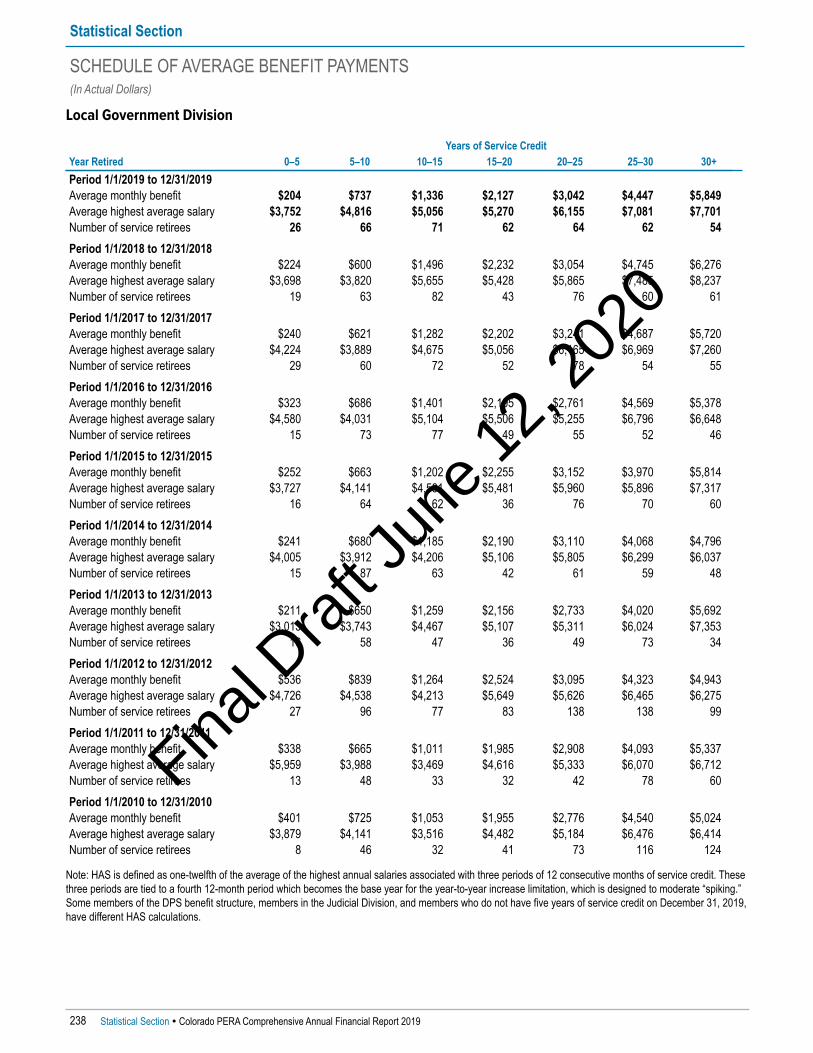
Local Government Division
Years of Service CreditYear Retired 0–5 5–10 10–15 15–20 20–25 25–30 30+Period 1/1/2019 to 12/31/2019Average monthly benefit $204 $737 $1,336 $2,127 $3,042 $4,447 $5,849Average highest average salary $3,752 $4,816 $5,056 $5,270 $6,155 $7,081 $7,701Number of service retirees 26 66 71 62 64 62 54Period 1/1/2018 to 12/31/2018Average monthly benefit $224 $600 $1,496 $2,232 $3,054 $4,745 $6,276Average highest average salary $3,698 $3,820 $5,655 $5,428 $5,865 $7,485 $8,237Number of service retirees 19 63 82 43 76 60 61Period 1/1/2017 to 12/31/2017Average monthly benefit $240 $621 $1,282 $2,202 $3,241 $4,687 $5,720Average highest average salary $4,224 $3,889 $4,675 $5,056 $6,165 $6,969 $7,260Number of service retirees 29 60 72 52 78 54 55Period 1/1/2016 to 12/31/2016Average monthly benefit $323 $686 $1,401 $2,195 $2,761 $4,569 $5,378Average highest average salary $4,580 $4,031 $5,104 $5,506 $5,255 $6,796 $6,648Number of service retirees 15 73 77 49 55 52 46Period 1/1/2015 to 12/31/2015Average monthly benefit $252 $663 $1,202 $2,255 $3,152 $3,970 $5,814Average highest average salary $3,727 $4,141 $4,581 $5,481 $5,960 $5,896 $7,317Number of service retirees 16 64 62 36 76 70 60Period 1/1/2014 to 12/31/2014Average monthly benefit $241 $680 $1,185 $2,190 $3,110 $4,068 $4,796Average highest average salary $4,005 $3,912 $4,206 $5,106 $5,805 $6,299 $6,037Number of service retirees 15 87 63 42 61 59 48Period 1/1/2013 to 12/31/2013Average monthly benefit $211 $650 $1,259 $2,156 $2,733 $4,020 $5,692Average highest average salary $3,013 $3,743 $4,467 $5,107 $5,311 $6,024 $7,353Number of service retirees 16 58 47 36 49 73 34Period 1/1/2012 to 12/31/2012Average monthly benefit $536 $839 $1,264 $2,524 $3,095 $4,323 $4,943Average highest average salary $4,726 $4,538 $4,213 $5,649 $5,626 $6,465 $6,275Number of service retirees 27 96 77 83 138 138 99Period 1/1/2011 to 12/31/2011Average monthly benefit $338 $665 $1,011 $1,985 $2,908 $4,093 $5,337Average highest average salary $5,959 $3,988 $3,469 $4,616 $5,333 $6,070 $6,712Number of service retirees 13 48 33 32 42 78 60Period 1/1/2010 to 12/31/2010Average monthly benefit $401 $725 $1,053 $1,955 $2,776 $4,540 $5,024Average highest average salary $3,879 $4,141 $3,516 $4,482 $5,184 $6,476 $6,414Number of service retirees 8 46 32 41 73 116 124
Note: HAS is defined as one-twelfth of the average of the highest annual salaries associated with three periods of 12 consecutive months of service credit. Thesethree periods are tied to a fourth 12-month period which becomes the base year for the year-to-year increase limitation, which is designed to moderate “spiking.”Some members of the DPS benefit structure, members in the Judicial Division, and members who do not have five years of service credit on December 31, 2019,have different HAS calculations.
Statistical Section
SCHEDULE OF AVERAGE BENEFIT PAYMENTS(In Actual Dollars)
238 Statistical Section � Colorado PERA Comprehensive Annual Financial Report 2019
Final D
raft
June
12,
202
0
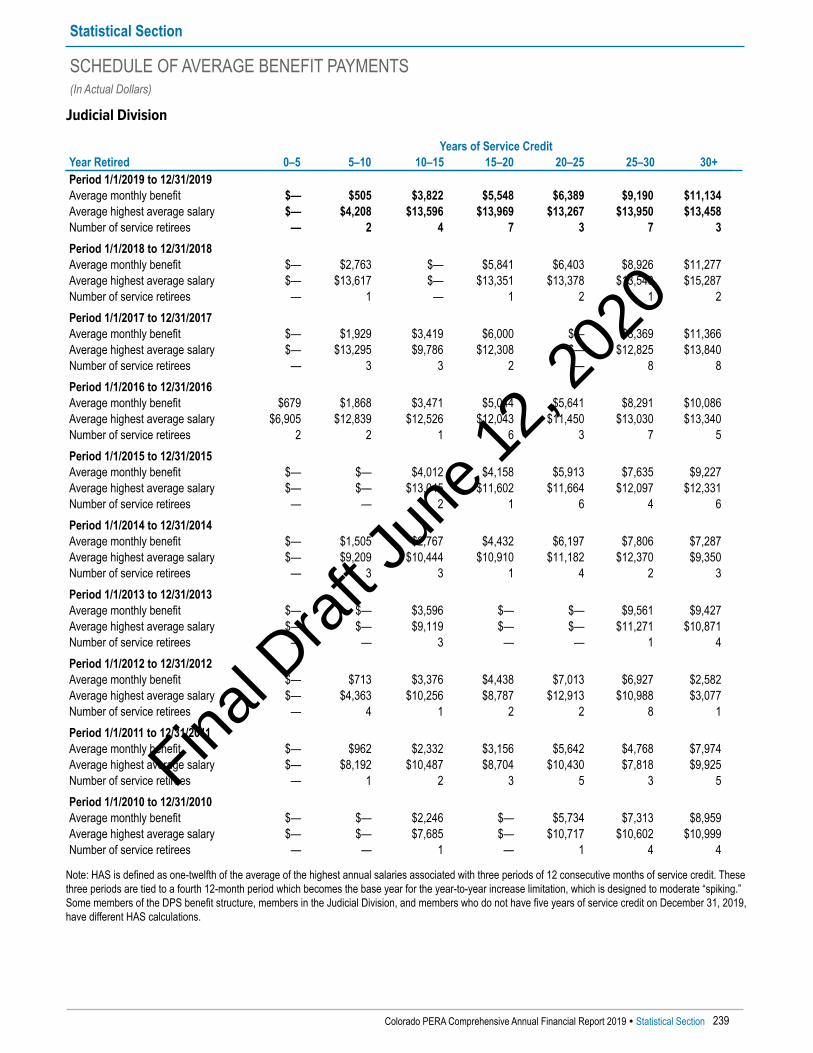
Judicial Division
Years of Service CreditYear Retired 0–5 5–10 10–15 15–20 20–25 25–30 30+Period 1/1/2019 to 12/31/2019Average monthly benefit $— $505 $3,822 $5,548 $6,389 $9,190 $11,134Average highest average salary $— $4,208 $13,596 $13,969 $13,267 $13,950 $13,458Number of service retirees — 2 4 7 3 7 3Period 1/1/2018 to 12/31/2018Average monthly benefit $— $2,763 $— $5,841 $6,403 $8,926 $11,277Average highest average salary $— $13,617 $— $13,351 $13,378 $13,548 $15,287Number of service retirees — 1 — 1 2 1 2Period 1/1/2017 to 12/31/2017Average monthly benefit $— $1,929 $3,419 $6,000 $— $8,369 $11,366Average highest average salary $— $13,295 $9,786 $12,308 $— $12,825 $13,840Number of service retirees — 3 3 2 — 8 8Period 1/1/2016 to 12/31/2016Average monthly benefit $679 $1,868 $3,471 $5,044 $5,641 $8,291 $10,086Average highest average salary $6,905 $12,839 $12,526 $12,043 $11,450 $13,030 $13,340Number of service retirees 2 2 1 6 3 7 5Period 1/1/2015 to 12/31/2015Average monthly benefit $— $— $4,012 $4,158 $5,913 $7,635 $9,227Average highest average salary $— $— $13,045 $11,602 $11,664 $12,097 $12,331Number of service retirees — — 2 1 6 4 6Period 1/1/2014 to 12/31/2014Average monthly benefit $— $1,505 $2,767 $4,432 $6,197 $7,806 $7,287Average highest average salary $— $9,209 $10,444 $10,910 $11,182 $12,370 $9,350Number of service retirees — 3 3 1 4 2 3Period 1/1/2013 to 12/31/2013Average monthly benefit $— $— $3,596 $— $— $9,561 $9,427Average highest average salary $— $— $9,119 $— $— $11,271 $10,871Number of service retirees — — 3 — — 1 4Period 1/1/2012 to 12/31/2012Average monthly benefit $— $713 $3,376 $4,438 $7,013 $6,927 $2,582Average highest average salary $— $4,363 $10,256 $8,787 $12,913 $10,988 $3,077Number of service retirees — 4 1 2 2 8 1Period 1/1/2011 to 12/31/2011Average monthly benefit $— $962 $2,332 $3,156 $5,642 $4,768 $7,974Average highest average salary $— $8,192 $10,487 $8,704 $10,430 $7,818 $9,925Number of service retirees — 1 2 3 5 3 5Period 1/1/2010 to 12/31/2010Average monthly benefit $— $— $2,246 $— $5,734 $7,313 $8,959Average highest average salary $— $— $7,685 $— $10,717 $10,602 $10,999Number of service retirees — — 1 — 1 4 4
Note: HAS is defined as one-twelfth of the average of the highest annual salaries associated with three periods of 12 consecutive months of service credit. Thesethree periods are tied to a fourth 12-month period which becomes the base year for the year-to-year increase limitation, which is designed to moderate “spiking.”Some members of the DPS benefit structure, members in the Judicial Division, and members who do not have five years of service credit on December 31, 2019,have different HAS calculations.
Statistical Section
SCHEDULE OF AVERAGE BENEFIT PAYMENTS(In Actual Dollars)
Colorado PERA Comprehensive Annual Financial Report 2019 � Statistical Section 239
Final D
raft
June
12,
202
0

DPS Division
Years of Service CreditYear Retired 0–5 5–10 10–15 15–20 20–25 25–30 30+Period 1/1/2019 to 12/31/2019Average monthly benefit $119 $519 $1,361 $2,205 $2,644 $4,237 $5,801Average highest average salary $2,828 $3,093 $5,082 $5,691 $5,223 $6,601 $7,292Number of service retirees 8 56 34 28 28 37 32Period 1/1/2018 to 12/31/2018Average monthly benefit $77 $475 $1,369 $1,748 $2,727 $4,334 $5,337Average highest average salary $1,890 $2,972 $4,821 $4,714 $5,464 $6,788 $6,831Number of service retirees 5 65 23 34 35 51 61Period 1/1/2017 to 12/31/2017Average monthly benefit $176 $555 $1,305 $2,089 $3,242 $4,544 $5,416Average highest average salary $2,466 $2,926 $4,325 $5,263 $5,682 $6,625 $6,835Number of service retirees 8 59 21 38 52 58 20Period 1/1/2016 to 12/31/2016Average monthly benefit $163 $611 $1,462 $1,989 $3,415 $4,133 $5,342Average highest average salary $1,938 $3,536 $4,816 $4,955 $6,055 $5,876 $6,785Number of service retirees 4 59 40 60 59 56 24Period 1/1/2015 to 12/31/2015Average monthly benefit $230 $702 $1,588 $1,994 $3,147 $4,159 $5,254Average highest average salary $1,908 $4,275 $5,022 $4,808 $5,523 $7,318 $6,391Number of service retirees 12 55 36 37 60 56 19Period 1/1/2014 to 12/31/2014Average monthly benefit $472 $810 $1,379 $2,233 $3,091 $4,243 $4,862Average highest average salary $3,399 $4,593 $4,489 $5,569 $5,607 $6,250 $5,891Number of service retirees 15 39 44 49 72 44 32Period 1/1/2013 to 12/31/2013Average monthly benefit $276 $890 $1,365 $1,847 $3,214 $4,350 $5,049Average highest average salary $2,532 $5,835 $4,861 $4,618 $5,754 $6,611 $6,097Number of service retirees 15 30 31 32 69 57 27Period 1/1/2012 to 12/31/2012Average monthly benefit $274 $840 $1,507 $2,099 $3,032 $3,589 $4,568Average highest average salary $2,645 $4,483 $4,919 $5,238 $5,454 $5,478 $5,682Number of service retirees 8 38 31 42 70 38 33Period 1/1/2011 to 12/31/2011Average monthly benefit $1,297 $996 $1,479 $2,060 $3,373 $4,188 $4,290Average highest average salary $2,751 $4,789 $4,956 $4,948 $5,910 $6,046 $5,198Number of service retirees 8 30 35 38 57 38 26Period 1/1/2010 to 12/31/2010Average monthly benefit $1,203 $867 $1,386 $1,943 $2,870 $3,971 $4,710Average highest average salary $3,568 $4,608 $4,335 $5,151 $5,312 $5,893 $5,944Number of service retirees 5 17 20 25 42 33 30
Note: HAS is defined as one-twelfth of the average of the highest annual salaries associated with three periods of 12 consecutive months of service credit. Thesethree periods are tied to a fourth 12-month period which becomes the base year for the year-to-year increase limitation, which is designed to moderate “spiking.”Some members of the DPS benefit structure, members in the Judicial Division, and members who do not have five years of service credit on December 31, 2019,have different HAS calculations.
Statistical Section
SCHEDULE OF AVERAGE BENEFIT PAYMENTS(In Actual Dollars)
240 Statistical Section � Colorado PERA Comprehensive Annual Financial Report 2019
Final D
raft
June
12,
202
0

All Division Trust Funds
Years of Service CreditYear Retired 0–5 5–10 10–15 15–20 20–25 25–30 30+Period 1/1/2019 to 12/31/2019Average monthly benefit $147 $526 $1,005 $1,738 $2,549 $3,831 $5,280Average highest average salary $2,408 $3,128 $3,670 $4,264 $4,919 $5,919 $6,798Number of service retirees 285 719 786 705 1,017 897 926Period 1/1/2018 to 12/31/2018Average monthly benefit $142 $514 $1,023 $1,668 $2,516 $3,824 $5,227Average highest average salary $2,373 $3,070 $3,671 $4,090 $4,829 $5,876 $6,691Number of service retirees 229 775 784 786 1,059 966 1,044Period 1/1/2017 to 12/31/2017Average monthly benefit $207 $553 $1,088 $1,819 $2,707 $4,102 $5,302Average highest average salary $2,606 $3,064 $3,684 $4,196 $4,940 $6,039 $6,662Number of service retirees 298 730 812 848 1,079 1,067 833Period 1/1/2016 to 12/31/2016Average monthly benefit $192 $540 $1,096 $1,882 $2,621 $3,955 $5,137Average highest average salary $2,530 $2,979 $3,730 $4,375 $4,746 $5,783 $6,402Number of service retirees 242 762 739 761 1,001 1,061 816Period 1/1/2015 to 12/31/2015Average monthly benefit $231 $587 $1,101 $1,802 $2,686 $3,879 $5,006Average highest average salary $2,445 $3,198 $3,753 $4,112 $4,848 $5,738 $6,225Number of service retirees 220 737 712 693 979 1,096 804Period 1/1/2014 to 12/31/2014Average monthly benefit $229 $564 $1,084 $1,839 $2,674 $3,863 $5,005Average highest average salary $2,620 $3,135 $3,641 $4,207 $4,875 $5,674 $6,165Number of service retirees 200 695 729 696 946 1,029 809Period 1/1/2013 to 12/31/2013Average monthly benefit $233 $555 $1,117 $1,822 $2,640 $3,896 $4,999Average highest average salary $2,352 $3,196 $3,644 $4,111 $4,747 $5,710 $6,229Number of service retirees 174 611 571 546 846 998 758Period 1/1/2012 to 12/31/2012Average monthly benefit $270 $589 $1,038 $1,913 $2,677 $3,910 $4,779Average highest average salary $2,413 $3,174 $3,480 $4,227 $4,870 $5,721 $5,999Number of service retirees 191 685 654 713 1,028 1,169 985Period 1/1/2011 to 12/31/2011Average monthly benefit $265 $576 $989 $1,770 $2,657 $3,817 $4,919Average highest average salary $2,480 $3,063 $2,941 $3,605 $4,371 $5,351 $6,012Number of service retirees 145 599 473 550 847 1,101 893Period 1/1/2010 to 12/31/2010Average monthly benefit $292 $549 $922 $1,795 $2,572 $3,836 $4,846Average highest average salary $2,515 $2,979 $2,767 $3,754 $4,401 $5,454 $5,881Number of service retirees 103 531 432 535 1,006 1,338 1,121
Note: HAS is defined as one-twelfth of the average of the highest annual salaries associated with three periods of 12 consecutive months of service credit. Thesethree periods are tied to a fourth 12-month period which becomes the base year for the year-to-year increase limitation, which is designed to moderate “spiking.”Some members of the DPS benefit structure, members in the Judicial Division, and members who do not have five years of service credit on December 31, 2019,have different HAS calculations.
Statistical Section
SCHEDULE OF AVERAGE BENEFIT PAYMENTS(In Actual Dollars)
Colorado PERA Comprehensive Annual Financial Report 2019 � Statistical Section 241
Final D
raft
June
12,
202
0

Health Care Trust Fund1
Years of Service CreditYear Retired 0–5 5–10 10–15 15–20 20–25 25–30 30+Period 1/1/2019 to 12/31/2019Average monthly benefit $15 $57 $102 $147 $195 $203 $205Number of service retirees2 19 57 120 184 316 319 416Period 1/1/2018 to 12/31/2018Average monthly benefit $20 $62 $110 $154 $201 $201 $209Number of service retirees2 7 56 131 177 394 365 482
1 In future reports, additional years will be added until 10 years of historical data are presented. 2 Only includes those service retirees participating in PERACare.
DPS Health Care Trust Fund1
Years of Service CreditYear Retired 0–5 5–10 10–15 15–20 20–25 25–30 30+Period 1/1/2019 to 12/31/2019Average monthly benefit $6 $68 $99 $131 $201 $208 $203Number of service retirees2 1 4 9 7 13 16 17Period 1/1/2018 to 12/31/2018Average monthly benefit $— $65 $67 $170 $203 $208 $208Number of service retirees2 — 8 3 6 13 21 36
1 In future reports, additional years will be added until 10 years of historical data are presented. 2 Only includes those service retirees participating in PERACare.
All Health Care Trust Funds1
Years of Service CreditYear Retired 0–5 5–10 10–15 15–20 20–25 25–30 30+Period 1/1/2019 to 12/31/2019Average monthly benefit $14 $58 $102 $147 $195 $203 $205Number of service retirees2 20 61 129 191 329 335 433Period 1/1/2018 to 12/31/2018Average monthly benefit $20 $62 $109 $154 $201 $201 $209Number of service retirees2 7 64 134 183 407 386 518
1 In future reports, additional years will be added until 10 years of historical data are presented. 2 Only includes those service retirees participating in PERACare.
Statistical Section
SCHEDULE OF AVERAGE BENEFIT PAYMENTS(In Actual Dollars)
242 Statistical Section � Colorado PERA Comprehensive Annual Financial Report 2019
Final D
raft
June
12,
202
0

State Division (Members Other Than State Troopers)1
Percent of Covered Payroll
Years
Member Contribution
Rate
Employer Contribution
Rate2
AmortizationEqualization
Disbursement
SupplementalAmortizationEqualization
Disbursement
NonemployerContribution
Rate
Total Contribution
Rate8/1/1931 to 6/30/1938 3.50% — — — — 3.50%7/1/1938 to 6/30/1949 3.50% 3.50% — — — 7.00%7/1/1949 to 6/30/1958 5.00% 5.00% — — — 10.00%7/1/1958 to 6/30/1969 6.00% 6.00% — — — 12.00%7/1/1969 to 6/30/1970 7.00% 7.00% — — — 14.00%7/1/1970 to 6/30/1971 7.00% 8.00% — — — 15.00%7/1/1971 to 6/30/1973 7.00% 8.50% — — — 15.50%7/1/1973 to 6/30/1974 7.75% 9.50% — — — 17.25%7/1/1974 to 6/30/1975 7.75% 10.50% — — — 18.25%7/1/1975 to 8/31/1980 7.75% 10.64% — — — 18.39%9/1/1980 to 12/31/1981 7.75% 12.20% — — — 19.95%1/1/1982 to 6/30/1987 8.00% 12.20% — — — 20.20%7/1/1987 to 6/30/1988 8.00% 10.20% — — — 18.20%7/1/1988 to 6/30/1991 8.00% 12.20% — — — 20.20%7/1/1991 to 4/30/1992 8.00% 11.60% — — — 19.60%5/1/1992 to 6/30/1992 8.00% 5.60%³ — — — 13.60%7/1/1992 to 6/30/1993 8.00% 10.60% — — — 18.60%7/1/1993 to 6/30/1997 8.00% 11.60% — — — 19.60%1/1/2006 to 12/31/2006 8.00% 10.15% 0.50% — — 18.65%1/1/2007 to 12/31/2007 8.00% 10.15% 1.00% — — 19.15%1/1/2008 to 12/31/2008 8.00% 10.15% 1.40% 0.50% — 20.05%1/1/2009 to 12/31/2009 8.00% 10.15% 1.80% 1.00% — 20.95%1/1/2010 to 6/30/2010 8.00% 10.15% 2.20% 1.50% — 21.85%7/1/2010 to 12/31/2010 10.50%⁴ 7.65%⁴ 2.20% 1.50% — 21.85%1/1/2011 to 12/31/2011 10.50%⁴ 7.65%⁴ 2.60% 2.00% — 22.75%1/1/2012 to 6/30/2012 10.50%⁴ 7.65%⁴ 3.00% 2.50% — 23.65%7/1/2012 to 12/31/2012 8.00% 10.15% 3.00% 2.50% — 23.65%1/1/2013 to 12/31/2013 8.00% 10.15% 3.40% 3.00% — 24.55%1/1/2014 to 12/31/2014 8.00% 10.15% 3.80% 3.50% — 25.45%1/1/2015 to 12/31/2015 8.00% 10.15% 4.20% 4.00% — 26.35%1/1/2016 to 12/31/2016 8.00% 10.15% 4.60% 4.50% — 27.25%1/1/2017 to 12/31/2017 8.00% 10.15% 5.00% 5.00% — 28.15%1/1/2018 to 12/31/2018 8.00% 10.15% 5.00% 5.00% 2.71%⁵ 30.86%1/1/2019 to 6/30/2019 8.00% 10.15% 5.00% 5.00% 2.57%⁵ ,6 30.72%7/1/2019 to 12/31/2019 8.75% 10.40% 5.00% 5.00% 2.57%⁵ ,6 31.72%
1 State and School Divisions merged July 1, 1997, and separated on January 1, 2006. 2 All employer contribution rates shown since July 1, 1985, include the Health Care Trust Fund (HCTF) allocation. 3 Legislation created an annual reduction equal to 1.0 percent of salary retroactive to July 1, 1991, to be taken during May and June of 1992. 4 Senate Bills 10-146 and 11-076 required member contributions to increase by 2.50 percent and employer contributions to decrease by 2.50 percent. 5 Contributions from a nonemployer contributing entity are required by C.R.S. § 24-51-414 et seq. and are remitted to PERA as a single sum in July of each
year. For purposes of this schedule, the amount allocated to the State Division is expressed as a percentage of annual covered payroll. 6 The amount allocated to the State Division is shown in both six-month segment contribution summaries. The rate presented in each segment is based on
annual covered payroll for improved comparative analysis to the prior year.
Statistical Section
SCHEDULE OF CONTRIBUTION RATE HISTORY
Colorado PERA Comprehensive Annual Financial Report 2019 � Statistical Section 243
Final D
raft
June
12,
202
0

State Troopers1
Percent of Covered Payroll
Years
Member Contribution
Rate
Employer Contribution
Rate2
AmortizationEqualization
Disbursement
SupplementalAmortizationEqualization
Disbursement
NonemployerContribution
Rate
Total Contribution
Rate7/1/1945 to 6/30/1969 7.00% 7.00% — — — 14.00%7/1/1969 to 6/30/1970 8.00% 8.00% — — — 16.00%7/1/1970 to 6/30/1971 8.00% 9.00% — — — 17.00%7/1/1971 to 6/30/1973 8.00% 9.50% — — — 17.50%7/1/1973 to 6/30/1974 8.75% 10.50% — — — 19.25%7/1/1974 to 6/30/1975 8.75% 11.50% — — — 20.25%7/1/1975 to 8/31/1980 8.75% 11.64% — — — 20.39%9/1/1980 to 12/31/1981 8.75% 13.20% — — — 21.95%1/1/1982 to 6/30/1987 9.00% 13.20% — — — 22.20%7/1/1987 to 6/30/1988 9.00% 11.20% — — — 20.20%7/1/1988 to 6/30/1989 9.00% 13.20% — — — 22.20%7/1/1989 to 4/30/1992 12.30% 13.20% — — — 25.50%5/1/1992 to 6/30/1992 12.30% 7.20%³ — — — 19.50%7/1/1992 to 6/30/1993 11.50% 12.20% — — — 23.70%7/1/1993 to 6/30/1997 11.50% 13.20% — — — 24.70%7/1/1997 to 6/30/1999 11.50% 13.10% — — — 24.60%7/1/1999 to 6/30/2001 10.00% 13.10% — — — 23.10%7/1/2001 to 6/30/2002 10.00% 12.60% — — — 22.60%7/1/2002 to 6/30/2003 10.00% 12.74% — — — 22.74%7/1/2003 to 12/31/2005 10.00% 12.85% — — — 22.85%1/1/2006 to 12/31/2006 10.00% 12.85% 0.50% — — 23.35%1/1/2007 to 12/31/2007 10.00% 12.85% 1.00% — — 23.85%1/1/2008 to 12/31/2008 10.00% 12.85% 1.40% 0.50% — 24.75%1/1/2009 to 12/31/2009 10.00% 12.85% 1.80% 1.00% — 25.65%1/1/2010 to 6/30/2010 10.00% 12.85% 2.20% 1.50% — 26.55%7/1/2010 to 12/31/2010 12.50%⁴ 10.35%⁴ 2.20% 1.50% — 26.55%1/1/2011 to 12/31/2011 12.50%⁴ 10.35%⁴ 2.60% 2.00% — 27.45%1/1/2012 to 6/30/2012 12.50%⁴ 10.35%⁴ 3.00% 2.50% — 28.35%7/1/2012 to 12/31/2012 10.00% 12.85% 3.00% 2.50% — 28.35%1/1/2013 to 12/31/2013 10.00% 12.85% 3.40% 3.00% — 29.25%1/1/2014 to 12/31/2014 10.00% 12.85% 3.80% 3.50% — 30.15%1/1/2015 to 12/31/2015 10.00% 12.85% 4.20% 4.00% — 31.05%1/1/2016 to 12/31/2016 10.00% 12.85% 4.60% 4.50% — 31.95%1/1/2017 to 12/31/2017 10.00% 12.85% 5.00% 5.00% — 32.85%1/1/2018 to 12/31/2018 10.00% 12.85% 5.00% 5.00% 2.71%⁵ 35.56%1/1/2019 to 6/30/2019 10.00% 12.85% 5.00% 5.00% 2.57%⁵ ,6 35.42%7/1/2019 to 12/31/2019 10.75% 13.10% 5.00% 5.00% 2.57%⁵ ,6 36.42%
1 State and School Divisions merged July 1, 1997, and separated on January 1, 2006. 2 All employer contribution rates shown since July 1, 1985, include the HCTF allocation. 3 Legislation created an annual reduction equal to 1.0 percent of salary retroactive to July 1, 1991, to be taken during May and June of 1992. 4 Senate Bills 10-146 and 11-076 required member contributions to increase by 2.50 percent and employer contributions to decrease by 2.50 percent. 5 Contributions from a nonemployer contributing entity are required by C.R.S. § 24-51-414 et seq. and are remitted to PERA as a single sum in July of each
year. For purposes of this schedule, the amount allocated to the State Division is expressed as a percentage of annual covered payroll. 6 The amount allocated to the State Division is shown in both six-month segment contribution summaries. The rate presented in each segment is based on
annual covered payroll for improved comparative analysis to the prior year.
Statistical Section
SCHEDULE OF CONTRIBUTION RATE HISTORY
244 Statistical Section � Colorado PERA Comprehensive Annual Financial Report 2019
Final D
raft
June
12,
202
0
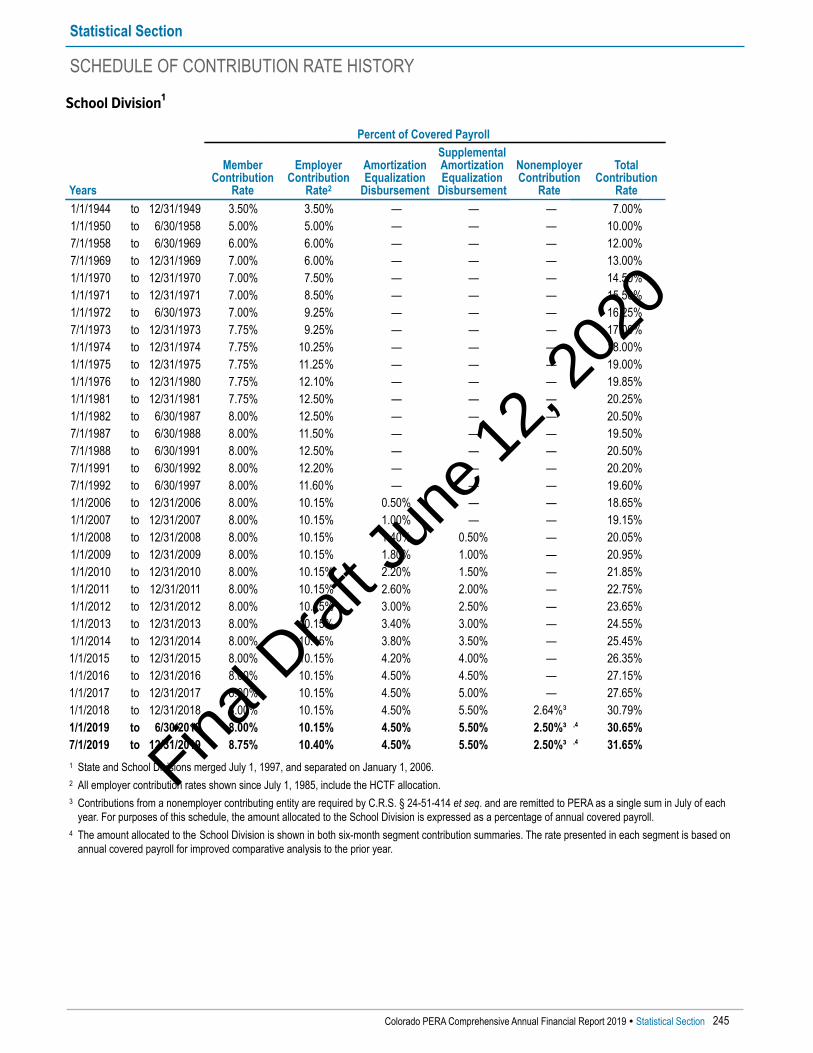
School Division1
Percent of Covered Payroll
Years
Member Contribution
Rate
Employer Contribution
Rate2
AmortizationEqualization
Disbursement
SupplementalAmortizationEqualization
Disbursement
NonemployerContribution
Rate
Total Contribution
Rate1/1/1944 to 12/31/1949 3.50% 3.50% — — — 7.00%1/1/1950 to 6/30/1958 5.00% 5.00% — — — 10.00%7/1/1958 to 6/30/1969 6.00% 6.00% — — — 12.00%7/1/1969 to 12/31/1969 7.00% 6.00% — — — 13.00%1/1/1970 to 12/31/1970 7.00% 7.50% — — — 14.50%1/1/1971 to 12/31/1971 7.00% 8.50% — — — 15.50%1/1/1972 to 6/30/1973 7.00% 9.25% — — — 16.25%7/1/1973 to 12/31/1973 7.75% 9.25% — — — 17.00%1/1/1974 to 12/31/1974 7.75% 10.25% — — — 18.00%1/1/1975 to 12/31/1975 7.75% 11.25% — — — 19.00%1/1/1976 to 12/31/1980 7.75% 12.10% — — — 19.85%1/1/1981 to 12/31/1981 7.75% 12.50% — — — 20.25%1/1/1982 to 6/30/1987 8.00% 12.50% — — — 20.50%7/1/1987 to 6/30/1988 8.00% 11.50% — — — 19.50%7/1/1988 to 6/30/1991 8.00% 12.50% — — — 20.50%7/1/1991 to 6/30/1992 8.00% 12.20% — — — 20.20%7/1/1992 to 6/30/1997 8.00% 11.60% — — — 19.60%1/1/2006 to 12/31/2006 8.00% 10.15% 0.50% — — 18.65%1/1/2007 to 12/31/2007 8.00% 10.15% 1.00% — — 19.15%1/1/2008 to 12/31/2008 8.00% 10.15% 1.40% 0.50% — 20.05%1/1/2009 to 12/31/2009 8.00% 10.15% 1.80% 1.00% — 20.95%1/1/2010 to 12/31/2010 8.00% 10.15% 2.20% 1.50% — 21.85%1/1/2011 to 12/31/2011 8.00% 10.15% 2.60% 2.00% — 22.75%1/1/2012 to 12/31/2012 8.00% 10.15% 3.00% 2.50% — 23.65%1/1/2013 to 12/31/2013 8.00% 10.15% 3.40% 3.00% — 24.55%1/1/2014 to 12/31/2014 8.00% 10.15% 3.80% 3.50% — 25.45%1/1/2015 to 12/31/2015 8.00% 10.15% 4.20% 4.00% — 26.35%1/1/2016 to 12/31/2016 8.00% 10.15% 4.50% 4.50% — 27.15%1/1/2017 to 12/31/2017 8.00% 10.15% 4.50% 5.00% — 27.65%1/1/2018 to 12/31/2018 8.00% 10.15% 4.50% 5.50% 2.64%³ 30.79%1/1/2019 to 6/30/2019 8.00% 10.15% 4.50% 5.50% 2.50%³ ,4 30.65%7/1/2019 to 12/31/2019 8.75% 10.40% 4.50% 5.50% 2.50%³ ,4 31.65%
1 State and School Divisions merged July 1, 1997, and separated on January 1, 2006. 2 All employer contribution rates shown since July 1, 1985, include the HCTF allocation. 3 Contributions from a nonemployer contributing entity are required by C.R.S. § 24-51-414 et seq. and are remitted to PERA as a single sum in July of each
year. For purposes of this schedule, the amount allocated to the School Division is expressed as a percentage of annual covered payroll. 4 The amount allocated to the School Division is shown in both six-month segment contribution summaries. The rate presented in each segment is based on
annual covered payroll for improved comparative analysis to the prior year.
Statistical Section
SCHEDULE OF CONTRIBUTION RATE HISTORY
Colorado PERA Comprehensive Annual Financial Report 2019 � Statistical Section 245
Final D
raft
June
12,
202
0

State and School Division1
Percent of Covered Payroll
Years
Member Contribution
Rate
Employer Contribution
Rate2
7/1/1997 to 6/30/1998 8.00 % 11.50 %7/1/1998 to 6/30/2000 8.00 % 11.40 %7/1/2000 to 6/30/2001 8.00 % 10.40 %7/1/2001 to 6/30/2002 8.00 % 9.90 %7/1/2002 to 6/30/2003 8.00 % 10.04 %7/1/2003 to 12/31/2005 8.00 % 10.15 %
1 State and School Divisions merged July 1, 1997, and separated on January 1, 2006. 2 The employer contribution rates shown include the HCTF allocation.
Local Government Division1
Percent of Covered Payroll
Years
Member Contribution
Rate
Employer Contribution
Rate2
AmortizationEqualization
Disbursement
SupplementalAmortizationEqualization
Disbursement
Total Contribution
Rate1/1/1944 to 12/31/1949 3.50% 3.50% — — 7.00%1/1/1950 to 6/30/1958 5.00% 5.00% — — 10.00%7/1/1958 to 6/30/1969 6.00% 6.00% — — 12.00%7/1/1969 to 12/31/1969 7.00% 6.00% — — 13.00%1/1/1970 to 12/31/1970 7.00% 7.00% — — 14.00%1/1/1971 to 6/30/1973 7.00% 7.50% — — 14.50%7/1/1973 to 12/31/1973 7.75% 7.50% — — 15.25%1/1/1974 to 12/31/1974 7.75% 8.50% — — 16.25%1/1/1975 to 12/31/1975 7.75% 9.50% — — 17.25%1/1/1976 to 12/31/1980 7.75% 9.86% — — 17.61%1/1/1981 to 12/31/1981 7.75% 10.20% — — 17.95%1/1/1982 to 6/30/1991 8.00% 10.20% — — 18.20%7/1/1991 to 12/31/2000 8.00% 10.00% — — 18.00%1/1/2001 to 12/31/2001 8.00% 9.43% — — 17.43%1/1/2002 to 12/31/2002 8.00% 9.19% — — 17.19%1/1/2003 to 12/31/2003 8.00% 9.60% — — 17.60%1/1/2004 to 12/31/2005 8.00% 10.00% — — 18.00%1/1/2006 to 12/31/2006 8.00% 10.00% 0.50% — 18.50%1/1/2007 to 12/31/2007 8.00% 10.00% 1.00% — 19.00%1/1/2008 to 12/31/2008 8.00% 10.00% 1.40% 0.50% 19.90%1/1/2009 to 12/31/2009 8.00% 10.00% 1.80% 1.00% 20.80%1/1/2010 to 12/31/2019 8.00% 10.00% 2.20% 1.50% 21.70%
1 The Local Government Division Trust Fund was the Municipal Division Trust Fund prior to January 1, 2006. 2 All employer contribution rates shown since July 1, 1985, include the HCTF allocation.
Statistical Section
SCHEDULE OF CONTRIBUTION RATE HISTORY
246 Statistical Section � Colorado PERA Comprehensive Annual Financial Report 2019
Final D
raft
June
12,
202
0

Judicial Division
Percent of Covered Payroll
Years
Member Contribution
Rate
Employer Contribution
Rate1
AmortizationEqualization
Disbursement
SupplementalAmortizationEqualization
Disbursement
NonemployerContribution
Rate
Total Contribution
Rate7/1/1949 to 6/30/1957 5.00% 5.00% — — — 10.00%7/1/1957 to 6/30/1973 6.00% 12.00% — — — 18.00%7/1/1973 to 6/30/1980 7.00% 12.00% — — — 19.00%7/1/1980 to 8/30/1980 7.00% 13.00% — — — 20.00%9/1/1980 to 12/31/1981 7.00% 15.00% — — — 22.00%1/1/1982 to 6/30/1987 8.00% 15.00% — — — 23.00%7/1/1987 to 6/30/1988 8.00% 13.00% — — — 21.00%7/1/1988 to 6/30/2000 8.00% 15.00% — — — 23.00%7/1/2000 to 6/30/2001 8.00% 14.00% — — — 22.00%7/1/2001 to 6/30/2003 8.00% 11.82% — — — 19.82%7/1/2003 to 6/30/2004 8.00% 12.66% — — — 20.66%7/1/2004 to 12/31/2005 8.00% 13.66% — — — 21.66%1/1/2006 to 12/31/2006 8.00% 13.66% 0.50% — — 22.16%1/1/2007 to 12/31/2007 8.00% 13.66% 1.00% — — 22.66%1/1/2008 to 12/31/2008 8.00% 13.66% 1.40% 0.50% — 23.56%1/1/2009 to 12/31/2009 8.00% 13.66% 1.80% 1.00% — 24.46%1/1/2010 to 6/30/2010 8.00% 13.66% 2.20% 1.50% — 25.36%7/1/2010 to 6/30/2012 10.50%² 11.16%² 2.20% 1.50% — 25.36%7/1/2012 to 12/31/2017 8.00% 13.66% 2.20% 1.50% — 25.36%1/1/2018 to 12/31/2018 8.00% 13.66% 2.20% 1.50% 2.74%³ 28.10%1/1/2019 to 6/30/2019 8.00% 13.66% 3.40% 3.40% 2.51%³ ,4 30.97%7/1/2019 to 12/31/2019 8.75% 13.91% 3.40% 3.40% 2.51%³ ,4 31.97%
1 All employer contribution rates shown since July 1, 1985, include the HCTF allocation. 2 Senate Bills 10-146 and 11-076 required member contributions to increase by 2.50 percent and employer contributions to decrease by 2.50 percent. 3 Contributions from a nonemployer contributing entity are required by C.R.S. § 24-51-414 et seq. and are remitted to PERA as a single sum in July of each
year. For purposes of this schedule, the amount allocated to the Judicial Division is expressed as a percentage of annual covered payroll. 4 The amount allocated to the Judicial Division is shown in both six-month segment contribution summaries. The rate presented in each segment is based on
annual covered payroll for improved comparative analysis to the prior year.
Statistical Section
SCHEDULE OF CONTRIBUTION RATE HISTORY
Colorado PERA Comprehensive Annual Financial Report 2019 � Statistical Section 247
Final D
raft
June
12,
202
0

DPS Division1
Percent of Covered Payroll
Years
Member Contribution
Rate
Employer Contribution
Rate2
AmortizationEqualization
Disbursement
SupplementalAmortizationEqualization
Disbursement
EmployerContribution
PCOPOffset3
NonemployerContribution
Rate
Total Contribution
Rate1/1/2010 to 12/31/2010 8.00% 13.75% 2.20% 1.50% (15.04%) — 10.41%1/1/2011 to 12/31/2011 8.00% 13.75% 2.60% 2.00% (14.72%) — 11.63%1/1/2012 to 12/31/2012 8.00% 13.75% 3.00% 2.50% (15.37%) — 11.88%1/1/2013 to 12/31/2013 8.00% 13.75% 3.40% 3.00% (14.51%) — 13.64%1/1/2014 to 12/31/2014 8.00% 13.75% 3.80% 3.50% (16.89%) — 12.16%1/1/2015 to 12/31/2015 8.00% 10.15%⁴ 4.20% 4.00% (15.97%) — 10.38%1/1/2016 to 12/31/2016 8.00% 10.15% 4.50% 4.50% (15.54%) — 11.61%1/1/2017 to 12/31/2017 8.00% 10.15% 4.50% 5.00% (14.56%) — 13.09%1/1/2018 to 12/31/2018 8.00% 10.15% 4.50% 5.50% (14.18%) 2.58%⁵ 16.55%1/1/2019 to 6/30/2019 8.00% 10.15% 4.50% 5.50% (13.35%) ⁶ 2.61%⁵ ,7 17.41%7/1/2019 to 12/31/2019 8.75% 10.40% 4.50% 5.50% (13.60%) ⁶ 2.61%⁵ ,7 18.16%
1 The DPS Division Trust Fund was established on January 1, 2010, and received the net assets of the DPSRS. 2 All employer contribution rates shown include the DPS HCTF allocation. 3 An offset to the DPS Division rate is provided for under C.R.S. § 24-51-412. See Note 4 of the Notes to the Financial Statements in the Financial Section. 4 On June 3, 2015, House Bill 15-1391 reduced the employer contribution rate with a retroactive effective date of January 1, 2015. 5 Contributions from a nonemployer contributing entity are required by C.R.S. § 24-51-414 et seq. and are remitted to PERA as a single sum in July of each
year. For purposes of this schedule, the amount allocated to the DPS Division is expressed as a percentage of annual covered payroll. 6 To conform with this presentation of contribution rates, the annual PCOP offset of 13.48 percent for 2019 has been adjusted based on the portion of the PCOP
offset used to satisfy employer contribution requirements. 7 The amount allocated to the DPS Division is shown in both six-month segment contribution summaries. The rate presented in each segment is based on
annual covered payroll for improved comparative analysis to the prior year.
Statistical Section
SCHEDULE OF CONTRIBUTION RATE HISTORY
248 Statistical Section � Colorado PERA Comprehensive Annual Financial Report 2019
Final D
raft
June
12,
202
0
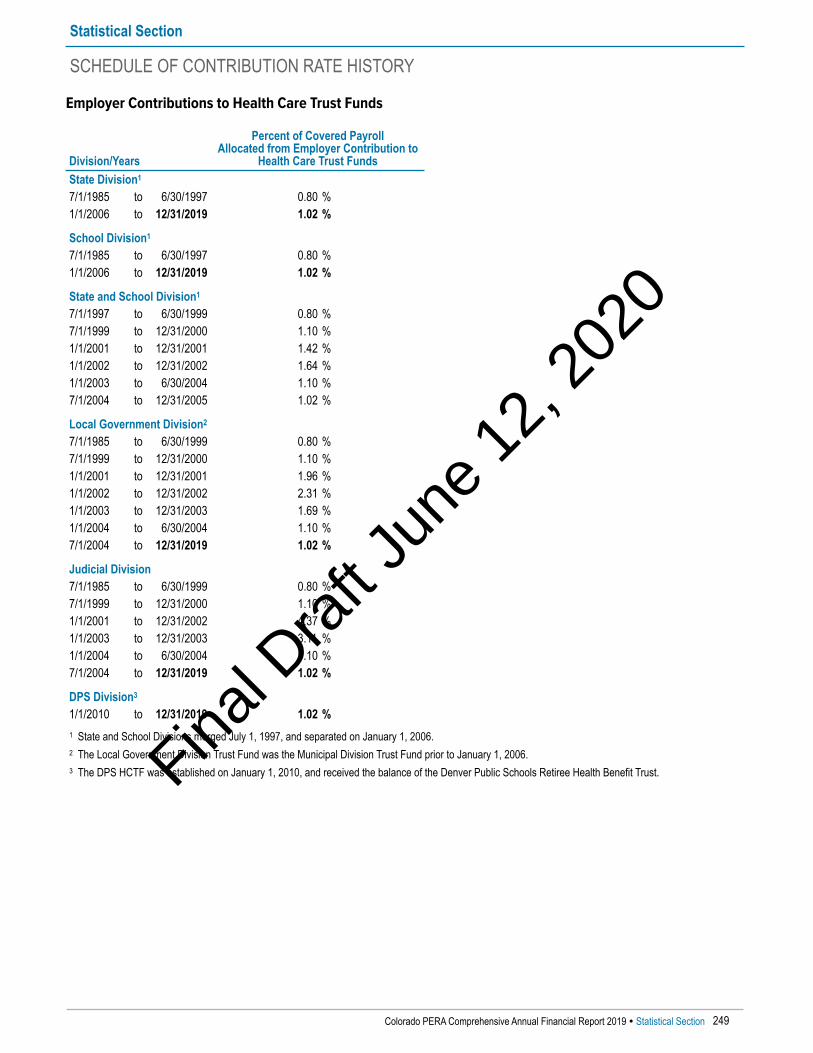
Employer Contributions to Health Care Trust Funds
Division/Years
Percent of Covered Payroll Allocated from Employer Contribution to
Health Care Trust FundsState Division1
7/1/1985 to 6/30/1997 0.80 %1/1/2006 to 12/31/2019 1.02 %
School Division1
7/1/1985 to 6/30/1997 0.80 %1/1/2006 to 12/31/2019 1.02 %
State and School Division1
7/1/1997 to 6/30/1999 0.80 %7/1/1999 to 12/31/2000 1.10 %1/1/2001 to 12/31/2001 1.42 %1/1/2002 to 12/31/2002 1.64 %1/1/2003 to 6/30/2004 1.10 %7/1/2004 to 12/31/2005 1.02 %
Local Government Division2
7/1/1985 to 6/30/1999 0.80 %7/1/1999 to 12/31/2000 1.10 %1/1/2001 to 12/31/2001 1.96 %1/1/2002 to 12/31/2002 2.31 %1/1/2003 to 12/31/2003 1.69 %1/1/2004 to 6/30/2004 1.10 %7/1/2004 to 12/31/2019 1.02 %
Judicial Division7/1/1985 to 6/30/1999 0.80 %7/1/1999 to 12/31/2000 1.10 %1/1/2001 to 12/31/2002 4.37 %1/1/2003 to 12/31/2003 3.11 %1/1/2004 to 6/30/2004 1.10 %7/1/2004 to 12/31/2019 1.02 %
DPS Division3
1/1/2010 to 12/31/2019 1.02 % 1 State and School Divisions merged July 1, 1997, and separated on January 1, 2006. 2 The Local Government Division Trust Fund was the Municipal Division Trust Fund prior to January 1, 2006. 3 The DPS HCTF was established on January 1, 2010, and received the balance of the Denver Public Schools Retiree Health Benefit Trust.
Statistical Section
SCHEDULE OF CONTRIBUTION RATE HISTORY
Colorado PERA Comprehensive Annual Financial Report 2019 � Statistical Section 249
Final D
raft
June
12,
202
0

Employer Contributions to MatchMaker1
Division/Years
Percent of Covered Payroll Available from Employer Contribution for
MatchMaker (Maximum Match)State and School Division2
1/1/2001 to 12/31/2002 3.00 %1/1/2003 to 12/31/2003 2.00 %1/1/2004 to 5/31/2004 1.00 %
Local Government Division3
1/1/2001 to 12/31/2001 2.00 %1/1/2002 to 12/31/2002 3.00 %1/1/2003 to 12/31/2003 2.00 %1/1/2004 to 5/31/2004 1.00 %
Judicial Division1/1/2001 to 12/31/2002 7.00 %1/1/2003 to 12/31/2003 6.00 %1/1/2004 to 5/31/2004 5.00 %
1 Legislation enacted in 2004 ended MatchMaker contributions by June 1, 2004. 2 State and School Divisions merged July 1, 1997, and separated on January 1, 2006. 3 The Local Government Division Trust Fund was the Municipal Division Trust Fund prior to January 1, 2006.
Statistical Section
SCHEDULE OF CONTRIBUTION RATE HISTORY
250 Statistical Section � Colorado PERA Comprehensive Annual Financial Report 2019
Final D
raft
June
12,
202
0

PRINCIPAL PARTICIPATING EMPLOYERS
State Division Trust Fund1,2
2019 2014
Employer
Covered Active Members
December 31 RankPercentage of Total System
Covered Active Members
December 31 RankPercentage of Total System
State of Colorado 51,203 1 92.67% 50,508 1 91.33% 1 Guidance under GASB 67 classifies a primary government and its component units as one employer. Due to this change, data for the number of members by
employer for years prior to 2014 is not available. 2 This employer count is presented for purposes of complying with GASB 67 only. For all other purposes, the definition of an employer is governed by Title 24,
Article 51 of the C.R.S., PERA’s Rules, 8 CCR 1502-1, and, if applicable, the employer’s affiliation agreement with PERA.
School Division Trust Fund1,2
2019 2014
Employer
Covered Active Members
December 31 RankPercentage of Total System
Covered Active Members
December 31 RankPercentage of Total System
Jefferson County School District R-1 12,450 1 9.66% 12,184 1 10.19%Douglas County School District Re 1 9,363 2 7.26% 8,345 2 6.98%Cherry Creek School District 5 8,344 3 6.47% 7,670 3 6.41%Adams-Arapahoe School District 28J 5,749 4 4.46% 5,453 4 4.56%Adams 12 Five Star Schools 5,517 5 4.28% 5,261 5 4.40%Boulder Valley School District RE2 4,803 6 3.73% 4,678 6 3.91%Poudre School District R-1 4,797 7 3.72% 4,425 7 3.70%St. Vrain Valley School District RE1J 4,635 8 3.59% 4,189 9 3.50%Colorado Springs School District 11 4,424 9 3.43% 4,292 8 3.59%Academy School District #20 4,110 10 3.19% 3,660 10 3.06%
1 Guidance under GASB 67 classifies a primary government and its component units as one employer. Due to this change, data for the number of members byemployer for years prior to 2014 is not available.
2 This employer count is presented for purposes of complying with GASB 67 only. For all other purposes, the definition of an employer is governed by Title 24,Article 51 of the C.R.S., PERA’s Rules, 8 CCR 1502-1, and, if applicable, the employer’s affiliation agreement with PERA.
Local Government Division Trust Fund1,2
2019 2014
Employer
Covered Active Members
December 31 RankPercentage of Total System
Covered Active Members
December 31 RankPercentage of Total System
City of Colorado Springs 3,369 1 25.75% 3,054 1 25.27%Boulder County 2,122 2 16.22% 2,067 2 17.11%City of Boulder 1,576 3 12.04% 1,413 3 11.69%
1 Guidance under GASB 67 classifies a primary government and its component units as one employer. Due to this change, data for the number of members byemployer for years prior to 2014 is not available.
2 This employer count is presented for purposes of complying with GASB 67 only. For all other purposes, the definition of an employer is governed by Title 24,Article 51 of the C.R.S., PERA’s Rules, 8 CCR 1502-1, and, if applicable, the employer’s affiliation agreement with PERA.
Statistical Section
Colorado PERA Comprehensive Annual Financial Report 2019 � Statistical Section 251
Final D
raft
June
12,
202
0
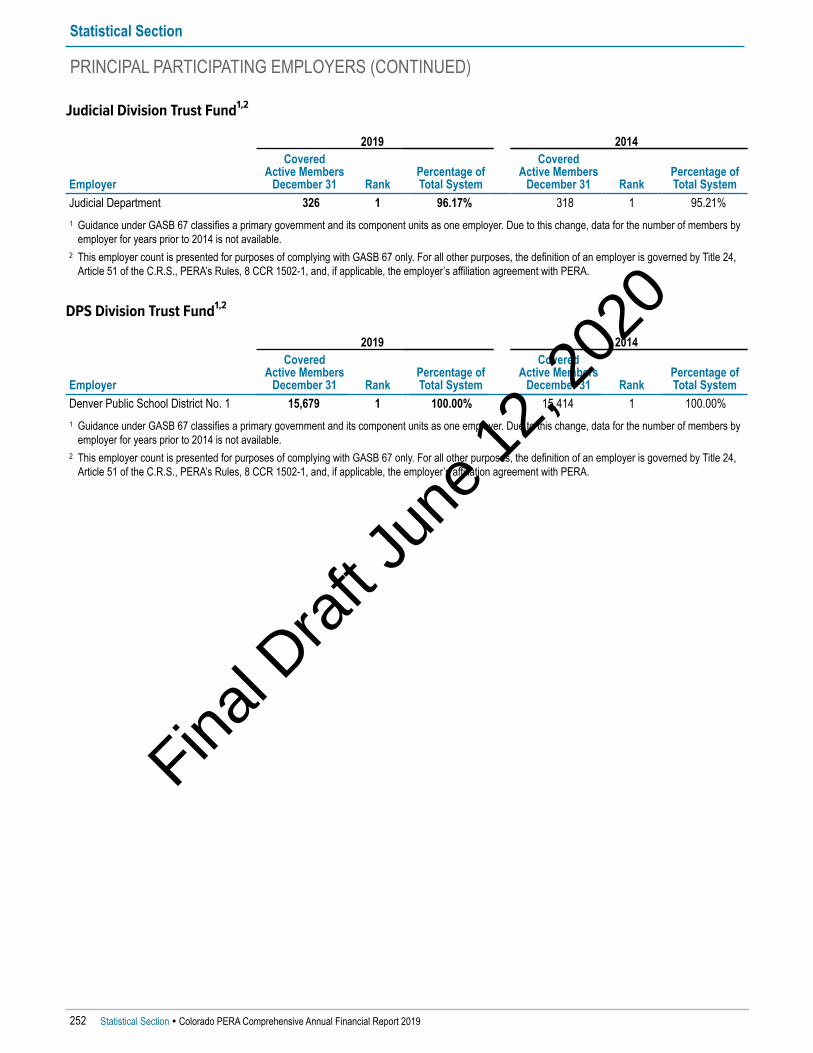
PRINCIPAL PARTICIPATING EMPLOYERS (CONTINUED)
Judicial Division Trust Fund1,2
2019 2014
Employer
Covered Active Members
December 31 RankPercentage of Total System
Covered Active Members
December 31 RankPercentage of Total System
Judicial Department 326 1 96.17% 318 1 95.21% 1 Guidance under GASB 67 classifies a primary government and its component units as one employer. Due to this change, data for the number of members by
employer for years prior to 2014 is not available. 2 This employer count is presented for purposes of complying with GASB 67 only. For all other purposes, the definition of an employer is governed by Title 24,
Article 51 of the C.R.S., PERA’s Rules, 8 CCR 1502-1, and, if applicable, the employer’s affiliation agreement with PERA.
DPS Division Trust Fund1,2
2019 2014
Employer
Covered Active Members
December 31 RankPercentage of Total System
Covered Active Members
December 31 RankPercentage of Total System
Denver Public School District No. 1 15,679 1 100.00% 15,414 1 100.00% 1 Guidance under GASB 67 classifies a primary government and its component units as one employer. Due to this change, data for the number of members by
employer for years prior to 2014 is not available. 2 This employer count is presented for purposes of complying with GASB 67 only. For all other purposes, the definition of an employer is governed by Title 24,
Article 51 of the C.R.S., PERA’s Rules, 8 CCR 1502-1, and, if applicable, the employer’s affiliation agreement with PERA.
Statistical Section
252 Statistical Section � Colorado PERA Comprehensive Annual Financial Report 2019
Final D
raft
June
12,
202
0
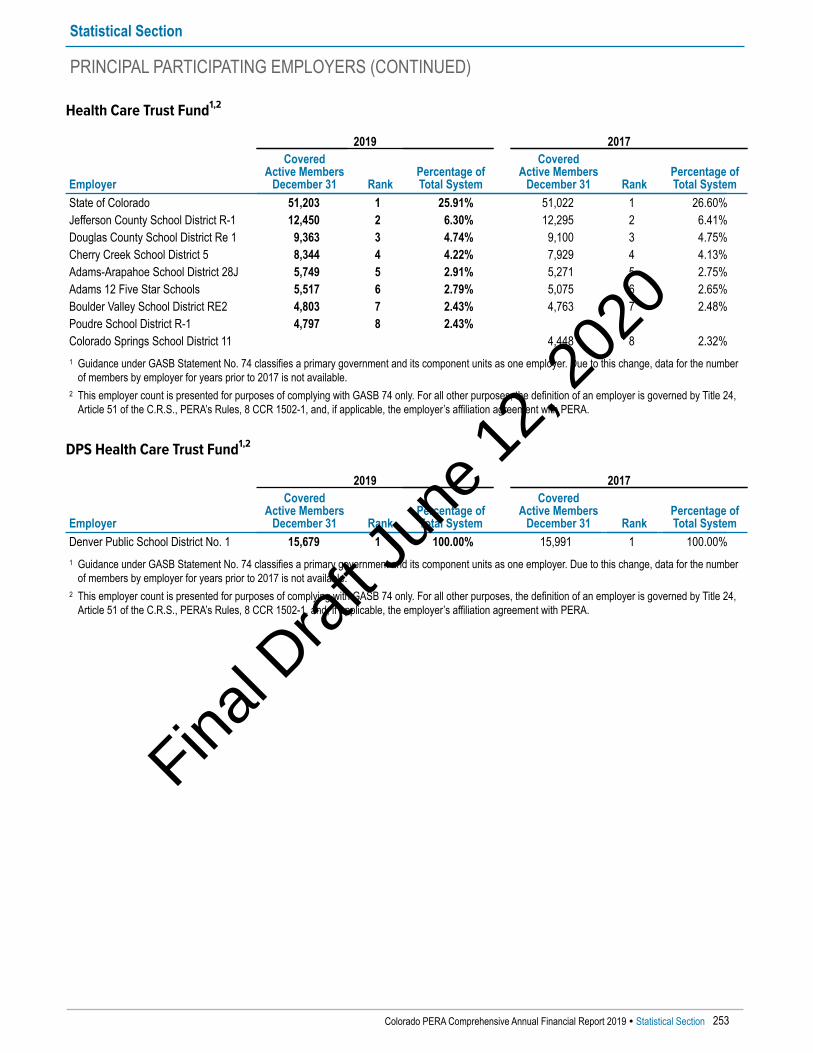
PRINCIPAL PARTICIPATING EMPLOYERS (CONTINUED)
Health Care Trust Fund1,2
2019 2017
Employer
Covered Active Members
December 31 RankPercentage of Total System
Covered Active Members
December 31 RankPercentage of Total System
State of Colorado 51,203 1 25.91% 51,022 1 26.60%Jefferson County School District R-1 12,450 2 6.30% 12,295 2 6.41%Douglas County School District Re 1 9,363 3 4.74% 9,100 3 4.75%Cherry Creek School District 5 8,344 4 4.22% 7,929 4 4.13%Adams-Arapahoe School District 28J 5,749 5 2.91% 5,271 5 2.75%Adams 12 Five Star Schools 5,517 6 2.79% 5,075 6 2.65%Boulder Valley School District RE2 4,803 7 2.43% 4,763 7 2.48%Poudre School District R-1 4,797 8 2.43%Colorado Springs School District 11 4,448 8 2.32%
1 Guidance under GASB Statement No. 74 classifies a primary government and its component units as one employer. Due to this change, data for the numberof members by employer for years prior to 2017 is not available.
2 This employer count is presented for purposes of complying with GASB 74 only. For all other purposes, the definition of an employer is governed by Title 24,Article 51 of the C.R.S., PERA’s Rules, 8 CCR 1502-1, and, if applicable, the employer’s affiliation agreement with PERA.
DPS Health Care Trust Fund1,2
2019 2017
Employer
Covered Active Members
December 31 RankPercentage of Total System
Covered Active Members
December 31 RankPercentage of Total System
Denver Public School District No. 1 15,679 1 100.00% 15,991 1 100.00% 1 Guidance under GASB Statement No. 74 classifies a primary government and its component units as one employer. Due to this change, data for the number
of members by employer for years prior to 2017 is not available. 2 This employer count is presented for purposes of complying with GASB 74 only. For all other purposes, the definition of an employer is governed by Title 24,
Article 51 of the C.R.S., PERA’s Rules, 8 CCR 1502-1, and, if applicable, the employer’s affiliation agreement with PERA.
Statistical Section
Colorado PERA Comprehensive Annual Financial Report 2019 � Statistical Section 253
Final D
raft
June
12,
202
0
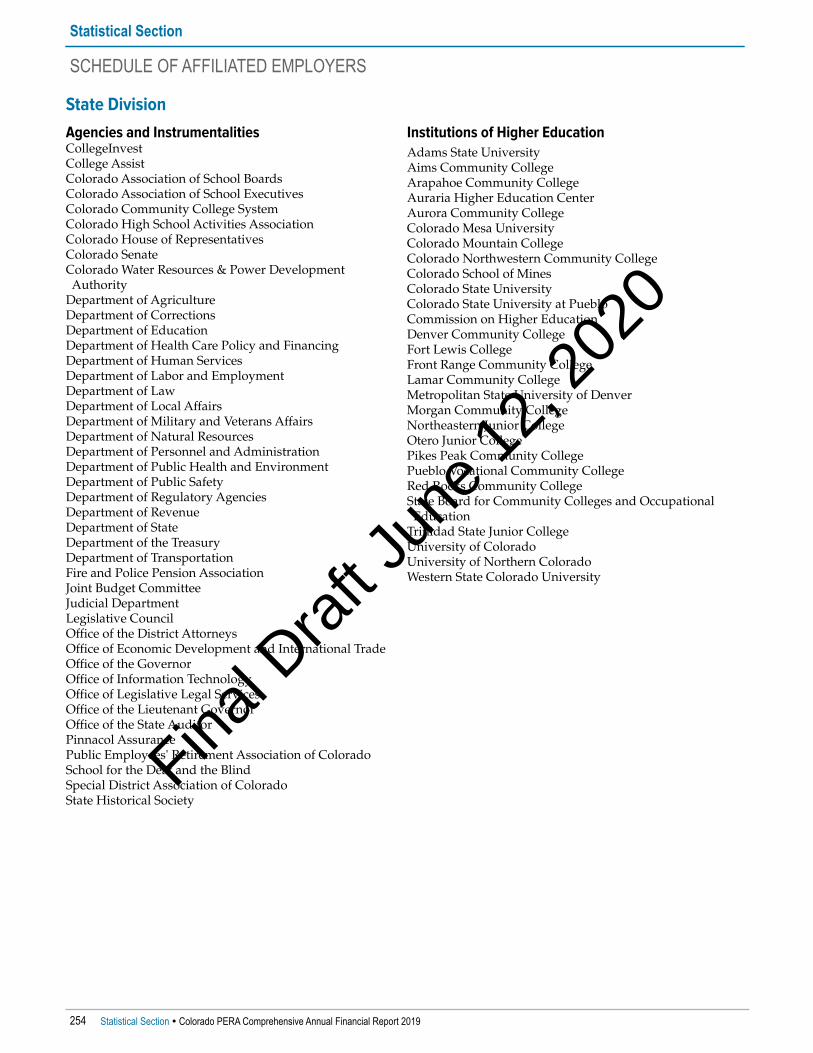
State DivisionAgencies and InstrumentalitiesCollegeInvestCollege AssistColorado Association of School BoardsColorado Association of School ExecutivesColorado Community College SystemColorado High School Activities AssociationColorado House of RepresentativesColorado SenateColorado Water Resources & Power Development Authority Department of AgricultureDepartment of CorrectionsDepartment of EducationDepartment of Health Care Policy and FinancingDepartment of Human ServicesDepartment of Labor and EmploymentDepartment of LawDepartment of Local AffairsDepartment of Military and Veterans AffairsDepartment of Natural ResourcesDepartment of Personnel and AdministrationDepartment of Public Health and EnvironmentDepartment of Public SafetyDepartment of Regulatory AgenciesDepartment of RevenueDepartment of StateDepartment of the TreasuryDepartment of TransportationFire and Police Pension AssociationJoint Budget CommitteeJudicial DepartmentLegislative CouncilOffice of the District AttorneysOffice of Economic Development and International TradeOffice of the GovernorOffice of Information TechnologyOffice of Legislative Legal ServicesOffice of the Lieutenant GovernorOffice of the State AuditorPinnacol AssurancePublic Employees' Retirement Association of Colorado School for the Deaf and the BlindSpecial District Association of ColoradoState Historical Society
Institutions of Higher EducationAdams State UniversityAims Community CollegeArapahoe Community CollegeAuraria Higher Education CenterAurora Community CollegeColorado Mesa UniversityColorado Mountain CollegeColorado Northwestern Community CollegeColorado School of MinesColorado State UniversityColorado State University at PuebloCommission on Higher EducationDenver Community CollegeFort Lewis CollegeFront Range Community CollegeLamar Community CollegeMetropolitan State University of DenverMorgan Community CollegeNortheastern Junior CollegeOtero Junior CollegePikes Peak Community CollegePueblo Vocational Community CollegeRed Rocks Community CollegeState Board for Community Colleges and Occupational EducationTrinidad State Junior CollegeUniversity of ColoradoUniversity of Northern ColoradoWestern State Colorado University
Statistical Section
SCHEDULE OF AFFILIATED EMPLOYERS
254 Statistical Section � Colorado PERA Comprehensive Annual Financial Report 2019
Final D
raft
June
12,
202
0

School Division1
Adams CountyAdams 12 Five Star SchoolsAdams County School District 14Bennett School District 29JBrighton School District 27JMapleton School District 1Strasburg School District 31JWestminster Public Schools
Alamosa CountyAlamosa County School District Re-11JSangre de Cristo School District Re-22J
Arapahoe CountyAdams-Arapahoe School District 28JByers School District 32JCherry Creek School District 5Deer Trail School District 26JEnglewood School District 1Littleton School District 6Sheridan School District 2
Archuleta CountyArchuleta County School District 50 Jt
Baca CountyCampo School District RE-6Pritchett School District RE-3Springfield School District RE-4Vilas School District RE-5Walsh School District RE-1
Bent CountyLas Animas School District RE-1McClave School District RE-2
Boulder CountyBoulder Valley School District RE2St. Vrain Valley School District RE1J
Chaffee CountyBuena Vista School District R-31Salida School District R-32(J)
Cheyenne CountyCheyenne County School District Re-5Kit Carson School District R-1
Clear Creek CountyClear Creek School District RE-1
Conejos CountyNorth Conejos School District RE1JSanford School District 6JSouth Conejos School District RE 10
Costilla CountyCentennial School District R-1Sierra Grande School District R-30
Crowley CountyCrowley County School District RE-1
Custer CountyCuster County Consolidated School District C-1
Delta CountyDelta County School District 50(J)
Dolores CountyDolores County School District Re No. 2
Douglas CountyDouglas County School District Re 1
Eagle CountyEagle County School District Re 50
Elbert CountyAgate School District 300Big Sandy School District 100JElbert School District 200Elizabeth School District C-1Kiowa School District C-2
El Paso CountyAcademy School District #20Calhan School District RJ1Cheyenne Mountain School District 12Colorado Springs School District 11Edison School District 54 JtEllicott School District 22Falcon School District 49Fountain School District 8Hanover School District 28Harrison School District 2Lewis-Palmer School District 38Manitou Springs School District 14Miami/Yoder School District 60 JtPeyton School District 23 JtWidefield School District 3
1 The list of employers in the School Division does not include charter schools operating within the respective public school districts and under the ColoradoCharter School Institute.
Statistical Section
SCHEDULE OF AFFILIATED EMPLOYERS
Colorado PERA Comprehensive Annual Financial Report 2019 � Statistical Section 255
Final D
raft
June
12,
202
0

School Division1 (continued)
Fremont CountyCanon City School District Re-1Cotopaxi School District Re-3Florence School District Re-2
Garfield CountyGarfield School District 16Garfield School District Re-2Roaring Fork School District Re-1
Gilpin CountyGilpin County School District Re-1
Grand CountyEast Grand School District 2West Grand School District 1
Gunnison CountyGunnison Watershed School District Re1J
Hinsdale CountyHinsdale County School District Re-1
Huerfano CountyHuerfano School District Re-1La Veta School District Re-2
Jackson CountyNorth Park School District R-1
Jefferson CountyJefferson County School District R-1
Kiowa CountyKiowa County School District RE-1Plainview School District Re-2
Kit Carson CountyArriba-Flagler Consolidated School District No. 20Bethune School District R-5Burlington School District Re-6JHi-Plains School District R-23Stratton School District R-4
Lake CountyLake County School District R-1
La Plata CountyBayfield School District 10Jt-RDurango School District 9-RIgnacio School District 11 Jt
Larimer CountyEstes Park School DistrictPoudre School District R-1Thompson School District R-2J
Las Animas CountyAguilar Reorganized School District 6Branson Reorganized School District 82Hoehne Reorganized School District 3Kim Reorganized School District 88Primero Reorganized School District 2Trinidad School District 1
Lincoln CountyGenoa/Hugo School District C-113Karval School District Re 23Limon School District Re 4J
Logan CountyBuffalo School District Re-4Frenchman School District Re-3Plateau School District Re-5Valley School District Re-1
Mesa CountyDe Beque School District 49 JtMesa County Valley School District 51Plateau Valley School District 50
Mineral CountyCreede Consolidated School District 1
Moffat CountyHayden School District Re 1Moffat County School District Re No. 1
Montezuma CountyDolores School District RE 4AMancos School District Re-6Montezuma-Cortez School District Re 1
Montrose CountyMontrose County School District Re-1JWest End School District Re-2
1 The list of employers in the School Division does not include charter schools operating within the respective public school districts and under the ColoradoCharter School Institute.
Statistical Section
SCHEDULE OF AFFILIATED EMPLOYERS
256 Statistical Section � Colorado PERA Comprehensive Annual Financial Report 2019
Final D
raft
June
12,
202
0
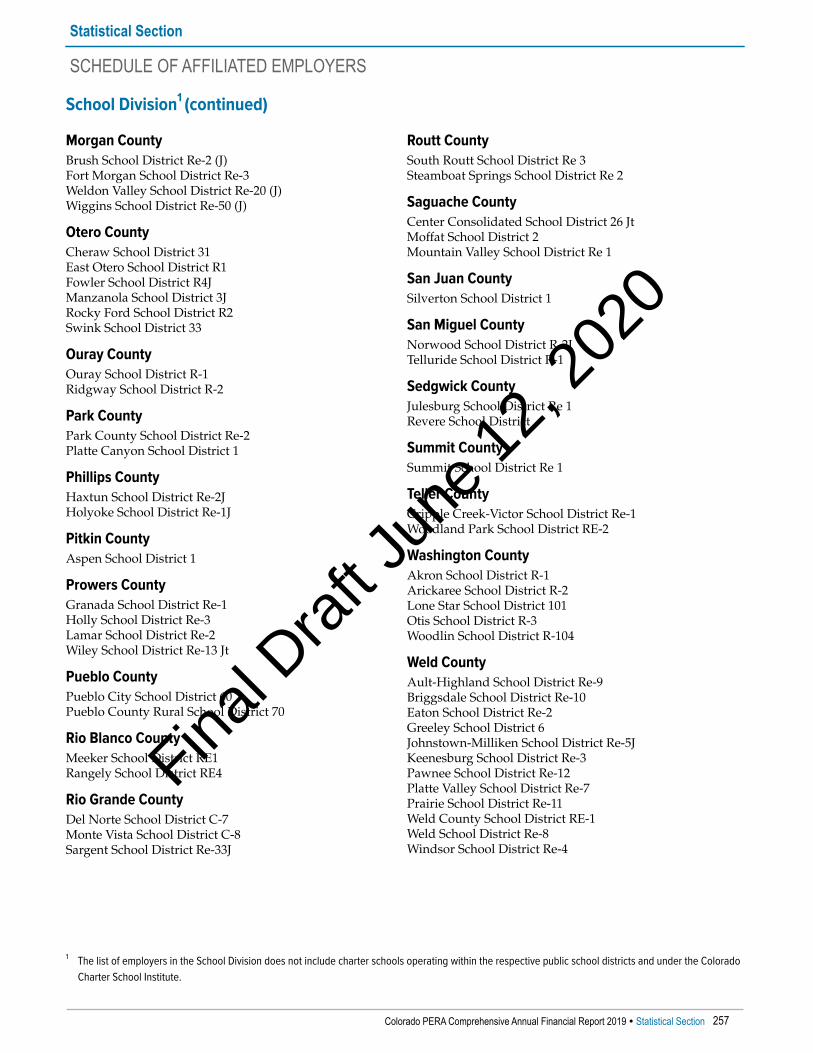
School Division1 (continued)
Morgan CountyBrush School District Re-2 (J)Fort Morgan School District Re-3Weldon Valley School District Re-20 (J)Wiggins School District Re-50 (J)
Otero CountyCheraw School District 31East Otero School District R1Fowler School District R4JManzanola School District 3JRocky Ford School District R2Swink School District 33
Ouray CountyOuray School District R-1Ridgway School District R-2
Park CountyPark County School District Re-2Platte Canyon School District 1
Phillips CountyHaxtun School District Re-2JHolyoke School District Re-1J
Pitkin CountyAspen School District 1
Prowers CountyGranada School District Re-1Holly School District Re-3Lamar School District Re-2Wiley School District Re-13 Jt
Pueblo CountyPueblo City School District 60Pueblo County Rural School District 70
Rio Blanco CountyMeeker School District RE1Rangely School District RE4
Rio Grande CountyDel Norte School District C-7Monte Vista School District C-8Sargent School District Re-33J
Routt CountySouth Routt School District Re 3Steamboat Springs School District Re 2
Saguache CountyCenter Consolidated School District 26 JtMoffat School District 2Mountain Valley School District Re 1
San Juan CountySilverton School District 1
San Miguel CountyNorwood School District R-2JTelluride School District R-1
Sedgwick CountyJulesburg School District Re 1Revere School District
Summit CountySummit School District Re 1
Teller CountyCripple Creek-Victor School District Re-1Woodland Park School District RE-2
Washington CountyAkron School District R-1Arickaree School District R-2Lone Star School District 101Otis School District R-3Woodlin School District R-104
Weld CountyAult-Highland School District Re-9Briggsdale School District Re-10Eaton School District Re-2Greeley School District 6Johnstown-Milliken School District Re-5JKeenesburg School District Re-3Pawnee School District Re-12Platte Valley School District Re-7Prairie School District Re-11Weld County School District RE-1Weld School District Re-8Windsor School District Re-4
1 The list of employers in the School Division does not include charter schools operating within the respective public school districts and under the ColoradoCharter School Institute.
Statistical Section
SCHEDULE OF AFFILIATED EMPLOYERS
Colorado PERA Comprehensive Annual Financial Report 2019 � Statistical Section 257
Final D
raft
June
12,
202
0

School Division1 (continued)
Yuma CountyIdalia School District RJ-3Liberty School District J-4Wray School District RD-2Yuma School District 1
Boards of Cooperative Educational Services (BOCES)Adams County BOCESCentennial BOCESColorado River BOCESEast Central BOCESEducation reEnvisioned BOCESExpeditionary Learning School BOCESGrand Valley BOCES Mt. Evans BOCESMountain BOCESNortheast BOCESNorthwest Colorado BOCESPikes Peak BOCESRio Blanco BOCESSan Juan BOCESSan Luis Valley BOCESSanta Fe Trail BOCESSouth Central BOCESSoutheastern BOCESUncompahgre BOCESUte Pass BOCES
Vocational SchoolsTechnical College of the Rockies
OtherColorado Consortium for Earth and Space Science Education
1 The list of employers in the School Division does not include charter schools operating within the respective public school districts and under the ColoradoCharter School Institute.
Statistical Section
SCHEDULE OF AFFILIATED EMPLOYERS
258 Statistical Section � Colorado PERA Comprehensive Annual Financial Report 2019
Final D
raft
June
12,
202
0

Local Government DivisionAdams and Jefferson County Hazardous Response AuthorityAlamosa Housing AuthorityArapahoe Park and Recreation DistrictAurora Housing AuthorityBaca Grande Water & Sanitation District Beulah Water Works DistrictBlack Hawk-Central City Sanitation DistrictBlanca-Fort Garland Metropolitan DistrictBoulder CountyBoulder County Public Trustee’s OfficeBoxelder Sanitation DistrictBrush Housing AuthorityCarbon Valley Park & Recreation DistrictCastle Pines Metropolitan DistrictCastle Pines North Metropolitan District Center Housing AuthorityCentral Colorado Water Conservancy DistrictCheyenne Wells Housing AuthorityCity of AlamosaCity of BoulderCity of Castle PinesCity of Colorado SpringsCity of Fort MorganCity of Las AnimasCity of Lone TreeCity of Manitou SpringsCity of PuebloCity of WrayCity of YumaClearview Library DistrictCollbran Conservancy District Colorado District Attorneys’ CouncilColorado First Conservation DistrictColorado Health Facilities AuthorityColorado Housing and Finance AuthorityColorado Library ConsortiumColorado River Fire Protection DistrictColorado School District Self Insurance Pool Colorado Springs UtilitiesColumbine Knolls-Grove Metropolitan Recreation DistrictCostilla Housing AuthorityCounty Technical Services, Inc.Cucharas Sanitation & Water DistrictDouglas County Housing PartnershipDouglas County LibrariesDurango Fire Protection DistrictEast Cheyenne Groundwater Management DistrictEast Larimer County Water DistrictEastern Rio Blanco Metropolitan Recreation & Park DistrictEaton Housing AuthorityElbert County Library District Elizabeth Park and Recreation DistrictEl Paso-Teller County Emergency Telephone Service AuthorityEstes Park Housing AuthorityEstes Park Local Marketing District
Estes Valley Fire Protection DistrictEstes Valley Public Library DistrictForest Lakes Metropolitan DistrictFremont Conservation DistrictFremont Sanitation DistrictGarfield County Housing AuthorityGrand Junction Regional Airport AuthorityGrand Valley Fire Protection DistrictGreen Mountain Water and Sanitation DistrictGVR Metropolitan DistrictHousing Authority of ArribaHousing Authority of the City of BoulderHousing Authority of the City of Colorado SpringsHousing Authority of the County of AdamsHousing Authority of the Town of LimonLamar Housing AuthorityLamar Utilities BoardLeft Hand Water DistrictLongmont Housing AuthorityLongs Peak Water District Louisville Fire Protection DistrictMeeker Cemetery DistrictMeeker Regional Library DistrictMeeker Sanitation DistrictMontrose Fire Protection DistrictMontrose Recreation DistrictMonument Sanitation District Morgan Conservation DistrictMorgan County Quality Water DistrictMountain View Fire Protection DistrictMountain Water and Sanitation DistrictNiwot Sanitation DistrictNorth Carter Lake Water DistrictNorth Chaffee County Regional LibraryNorth Front Range Water Quality Planning AssociationNortheast Colorado Health DepartmentNortheastern Colorado Association of Local GovernmentsPark Center Water District Pikes Peak Regional Building DepartmentPine Drive Water DistrictPlum Creek Water Reclamation AuthorityPueblo City-County Health DepartmentPueblo Library DistrictPueblo Transit AuthorityPueblo Urban Renewal AuthorityRampart Regional Library DistrictRangely Regional Library District Red Feather Mountain Library District Red, White & Blue Fire Protection DistrictRepublican River Water Conservation DistrictRio Blanco Fire Protection District Rio Blanco Water Conservancy DistrictRoutt County Conservation DistrictSable-Altura Fire Protection DistrictSan Luis Valley Development Resources Group San Luis Valley Water Conservancy DistrictSan Miguel County Public Library
Statistical Section
SCHEDULE OF AFFILIATED EMPLOYERS
Colorado PERA Comprehensive Annual Financial Report 2019 � Statistical Section 259
Final D
raft
June
12,
202
0

Local Government Division (continued)San Miguel Regional and Telluride Housing AuthorityScientific and Cultural Facilities DistrictSheridan Sanitation District #1Soldier Canyon Water Treatment AuthorityStatewide Internet Portal Authority Steamboat II Water and Sanitation DistrictStrasburg Metropolitan Parks & Recreation DistrictSt. Vrain Sanitation DistrictTabernash Meadows Water and Sanitation DistrictTown of AlmaTown of BayfieldTown of CrawfordTown of DinosaurTown of EckleyTown of Estes ParkTown of FirestoneTown of Lake CityTown of LochbuieTown of Mountain Village Town of Platteville
Town of Rico Town of Rye Town of SeibertTown of Silver PlumeTown of TimnathTri-County Health DepartmentTri-Lakes Wastewater Treatment FacilityUnison Housing PartnersUpper Colorado Environmental Plant Center Upper Thompson Sanitation DistrictWashington-Yuma Counties Combined Communications CenterWeld County Department of Public Health and EnvironmentWest Greeley Conservation DistrictWestern Rio Blanco Metropolitan Recreation and ParkDistrictWhite River Conservation DistrictWray Housing AuthorityYuma Housing Authority
Statistical Section
SCHEDULE OF AFFILIATED EMPLOYERS
260 Statistical Section � Colorado PERA Comprehensive Annual Financial Report 2019
Final D
raft
June
12,
202
0
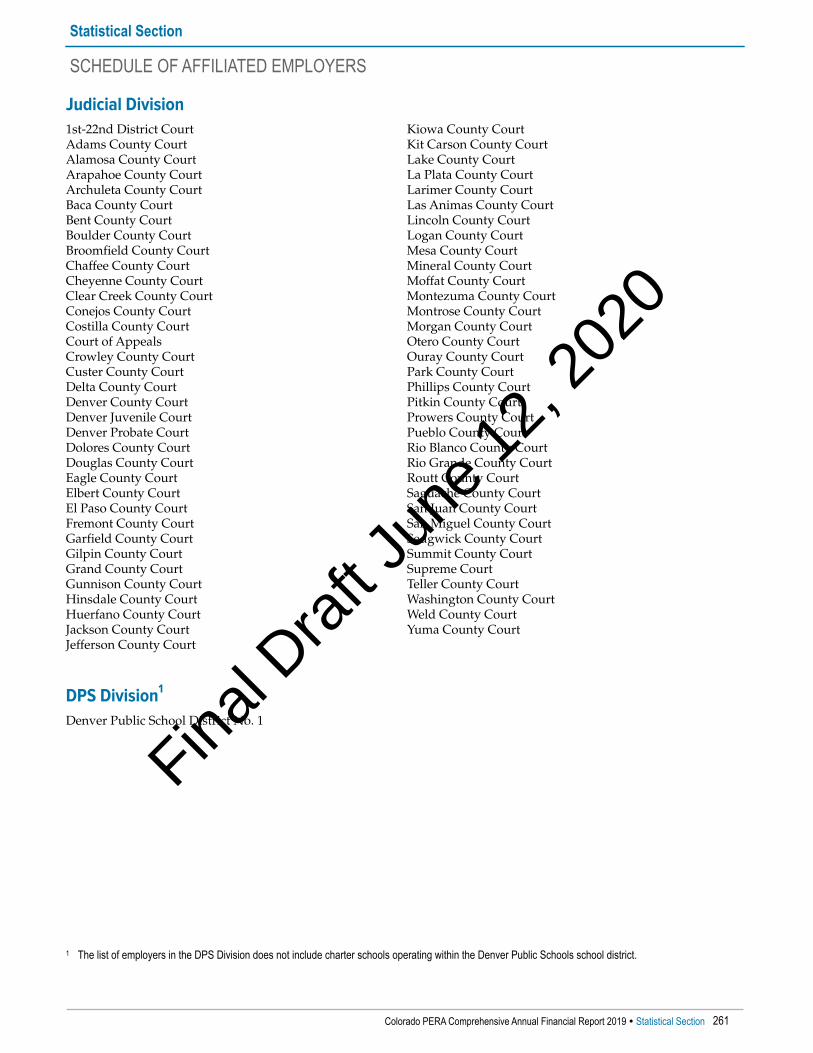
Judicial Division1st-22nd District CourtAdams County CourtAlamosa County CourtArapahoe County CourtArchuleta County CourtBaca County CourtBent County CourtBoulder County CourtBroomfield County CourtChaffee County CourtCheyenne County CourtClear Creek County CourtConejos County CourtCostilla County CourtCourt of AppealsCrowley County CourtCuster County CourtDelta County CourtDenver County CourtDenver Juvenile CourtDenver Probate CourtDolores County CourtDouglas County CourtEagle County CourtElbert County CourtEl Paso County CourtFremont County CourtGarfield County CourtGilpin County CourtGrand County CourtGunnison County CourtHinsdale County CourtHuerfano County CourtJackson County CourtJefferson County Court
Kiowa County CourtKit Carson County CourtLake County CourtLa Plata County CourtLarimer County CourtLas Animas County CourtLincoln County CourtLogan County CourtMesa County CourtMineral County CourtMoffat County CourtMontezuma County CourtMontrose County CourtMorgan County CourtOtero County CourtOuray County CourtPark County CourtPhillips County CourtPitkin County CourtProwers County CourtPueblo County CourtRio Blanco County CourtRio Grande County CourtRoutt County CourtSaguache County CourtSan Juan County CourtSan Miguel County CourtSedgwick County CourtSummit County CourtSupreme CourtTeller County CourtWashington County CourtWeld County CourtYuma County Court
DPS Division1
Denver Public School District No. 1
1 The list of employers in the DPS Division does not include charter schools operating within the Denver Public Schools school district.
Statistical Section
SCHEDULE OF AFFILIATED EMPLOYERS
Colorado PERA Comprehensive Annual Financial Report 2019 � Statistical Section 261
Final D
raft
June
12,
202
0

Final D
raft
June
12,
202
0

Final D
raft
June
12,
202
0

Final D
raft
June
12,
202
0

AAL . . . . . . . . . . Actuarial Accrued Liability MD&A . . . . . . . .Management’s Discussion andAnalysis
AAP . . . . . . . . . . Automatic Adjustment Provision NAV . . . . . . . . . . Net Asset Value
ADC. . . . . . . . . . Actuarially Determined Contribution NOL . . . . . . . . . . Net OPEB Liability
AED . . . . . . . . . .Amortization EqualizationDisbursement NPL . . . . . . . . . . Net Pension Liability
AI . . . . . . . . . . . . Annual Increase OPEB . . . . . . . . . Other Postemployment Benefit
AIR. . . . . . . . . . . Annual Increase Reserve PCOP . . . . . . . . . Pension Certificates of Participation
ARC . . . . . . . . . . Annual Required Contribution RDS . . . . . . . . . . Retiree Drug Subsidy
ASOPs . . . . . . . . Actuarial Standards of Practice REITs . . . . . . . . . Real Estate Investment Trusts
CBI . . . . . . . . . . . Colorado Bureau of Investigation RSI . . . . . . . . . . . Required Supplementary Information
CMBS. . . . . . . . .Commercial Mortgage-BackedSecurities SAED . . . . . . . . .
Supplemental AmortizationEqualization Disbursement
CMC . . . . . . . . .Cavanaugh Macdonald Consulting,LLC SB . . . . . . . . . . . . Senate Bill
CMS. . . . . . . . . .Centers for Medicare & MedicaidServices SEIR . . . . . . . . . . Single Equivalent Interest Rate
CPI-W . . . . . . . .Consumer Price Index for Urban WageEarners and Clerical Workers SRI . . . . . . . . . . . Socially Responsible Investment
C.R.S. . . . . . . . . . Colorado Revised Statutes TIPS . . . . . . . . . . Treasury Inflation Protected Securities
DB . . . . . . . . . . . Defined Benefit TOL . . . . . . . . . . Total OPEB Liability
DC . . . . . . . . . . . Defined Contribution TPL. . . . . . . . . . . Total Pension Liability
DC Plan. . . . . . . Defined Contribution Retirement Plan UAAL . . . . . . . . Unfunded Actuarial Accrued Liability
DPS . . . . . . . . . . Denver Public Schools
DPS HCTF . . . .Denver Public Schools Health CareTrust Fund
DPSRS . . . . . . . .Denver Public Schools RetirementSystem
EA . . . . . . . . . . . Entry Age Actuarial Cost Method
EGWP . . . . . . . . Employer Group Waiver Plan
FNP . . . . . . . . . . Fiduciary Net Position
GASB . . . . . . . . .Governmental Accounting StandardsBoard
GDP . . . . . . . . . . Gross Domestic Product
HAS . . . . . . . . . . Highest Average Salary
HB . . . . . . . . . . . House Bill
HCTF. . . . . . . . . Health Care Trust Fund
IRC. . . . . . . . . . . Internal Revenue Code
MBS . . . . . . . . . . Mortgage-Backed Securities
Commonly Used Acronyms
Colorado PERA Comprehensive Annual Financial Report 2019 265
Final D
raft
June
12,
202
0

Final D
raft
June
12,
202
0

Final D
raft
June
12,
202
0

Final D
raft
June
12,
202
0


