71
Report on the First Round of
Quarterly Employment Survey
SINCE 1920
Government of India Ministry of Labour & Employment
Labour Bureau
(Under the All-India Quarterly Establishment-based
Employment Survey)


FOREWORD
Employment is crucial for poverty reduction and in achieving growth with
equity in India. Employment is also recognized as a human right. Better and more
productive jobs can be a path for reduction in poverty.
In order to generate high quality accessible data on labour market for
effective implementation of policies and welfare of labour, Government has decided
to conduct Quarterly Employment Survey (QES) to assess employment situation in
respect of selected nine sectors of Non-farm economy of India over successive
quarters. Selected nine sectors are Manufacturing, Construction, Trade,
Transport, Education, Health, Accommodation & Restaurants, Information
Technology (IT)/ Business Process Outsourcing (BPO) and Financial Services. The
present Quarterly Employment Survey (QES) is the 1st in the series with large
sample covering 9 major sectors.
Report of this survey contains detailed information on employment situation
as on 1st April, 2021 in respect of 1st Round at all India level in nine selected
sectors. It provides information on important characteristics of employment such
as gender-wise employment, regular or contract and casual basis and part-time or
full-time workers, number of vacancies, skill development programme conducted
and on the job training provided by the establishment.
I am confident that this report will help policy-makers and Central
Government/ State Governments, research scholars and other stakeholders for
making effective policies in the Labour market.
This Report is the outcome of efforts made by Expert Group under the
chairmanship of Professor S.P. Mukherjee. In particular, I express my gratitude to
Professor S.P. Mukherjee for extending necessary guidance and valuable
suggestions all through the survey. I am also grateful to Ministry of Labour and
Employment for giving the onerous responsibility of conducting the ‘Quarterly
Employment Survey’ in a revamped manner.
I appreciate the efforts of the officers of Labour Bureau associated with
Quarterly Employment Survey (QES) in reaching towards its objective of the
survey. I am thankful to all the selected units/ establishments for providing useful
information on employment and extending cooperation to our field officers during
the survey.
I look forward to your valuable suggestions/comments to enrich the report
further.
Place: Chandigarh (I.S. Negi)
Date: 27.09.2021 Director General

CONTENTS
Subject Page Nos.
Chapter 1 Introduction 01 – 08
Chapter 2 Key Findings of the survey. 09 – 33
Annexure
Annexure-I Tables based on Sample Results 34 – 42
Annexure-II Concepts & Definitions 43 – 46
Annexure-III Sampling Design and Estimation Procedure
47 – 50
Annexure-IV
Description of Activity as per NIC-2008 code at 2-Digit Level
51 – 52
Annexure-V Schedules of Enquiry 53 – 59
Annexure –VI Composition of the Expert Group 60 – 61
Quarterly Employment Survey Report, 1st Quarter, 2021 Page 1
CHAPTER 1
INTRODUCTION
1.1 EMPLOYMENT STATISTICS – NEED AND AVAILABILITY
Employment generation is the key channel through which economic
growth translates into prosperity for the population. Gainful employment
generation is the bedrock of attaining growth with equity and to alleviate
poverty. Cross country analysis finds that structural transformation of
employment towards manufacturing and other non-farm sectors, education
and lowering of the dependency burden (i.e., increase in labour force
participation) make a positive contribution to poverty reduction. In the short
run, sectoral productivity and employment pattern of growth may have
important implications for poverty alleviation. The Government of India’s
‘Make in India Campaign’ aimed at making India a manufacturing hub, is a
significant step towards achieving employment intensive growth.
Rapid employment generation assumes even greater importance for India
which is projected to be the youngest nation in the world in terms of size by
the year 2020. As the Economic Survey 2015-161puts it “To exploit its
demographic dividend, India must create millions of “good”- safe,
productive, well-paying-jobs.” Thus, ‘gainful employment’ matters much to
achieve growth with equity and to successfully meet the challenge of the
impending demographic dividend.
Availability of statistics on economically active population at (frequent)
regular intervals is of utmost importance to monitor the economic/labour
market situation, and to devise, execute and evaluate policies for human
resource development including skill development, employment creation
and poverty reduction. The frequency of employment data becomes even
more crucial in the wake of the growing exposure of India to the global
1The Economic Survey, 2015-16, Ministry of Finance.
Quarterly Employment Survey Report, 1st Quarter, 2021 Page 2
economic upheavals and its consequent impact on the employment scenario
within the country.
Labour and Employment Statistics are collected, compiled and disseminated
by several agencies in India. Ministry of Labour and Employment through
the office of Labour Bureau is an important agency involved in this task.
Ministry of Statistics and Programme Implementation is another major
source which collects and publishes data on this subject through its various
divisions. Besides these two, State governments also collect labour
statistics, mostly through the Department of Labour & Directorate of
Economics & Statistics.
The household based employment surveys (like PLFS by MOSPI) being
conducted in the country are providing employment scenario for the supply-
side of labour market. A consolidated picture of employment from demand-
side at regular intervals is also required for policy planning. For the later
purpose, we need establishment based census and sample surveys. All India
Quarterly establishment based Employment survey (AQEES) has been
started to fulfill the above mentioned gap. AQEES will provide estimates of
employment, vacancies, training and other related parameters for major
nine sectors of the economy. This report is a component of AQEES covering
establishments with at least 10 workers. The other component, AFES, will
capture information about establishments with less than 10 workers.
1.2 ECONOMIC CENSUSES
Economic Censuses are establishment-based, have been conducted at
irregular intervals and do not cover all types of establishments. Economic
Censuses have been conducted in the years 1977,1980, 1990, 1998, 2005,
2013-14 and 2020. Results of the seventh census are yet to appear in the
public domain. The sixth Economic Census (6thEC)is the latest available
frame of all Non-Agricultural establishments excluding those belonging to
crop production, plantation, Public Administration, Defense and
Quarterly Employment Survey Report, 1st Quarter, 2021 Page 3
Compulsory Social Security. As per the Sixth Economic Census (2013-14),
58.5 million establishments were found to be in operation employing 131.29
million persons. Out of 58.5 million establishments, 1.4% establishments
were in the organised segment (establishments employing 10 or more
persons). Again, for the purpose of sampling, we need to have names and
addresses of all the 58.5 million establishments (including household
establishments operating within households or outside in fixed structures
or otherwise covered in 6th EC)however the same is not available. However, a
Directory of Establishments with 10 or more workers (sometimes referred to
as establishments in the ‘organised’ segment) with names, addresses and
numbers of workers as also types of economic activities carried out (and
corresponding codes in National Industrial Classification or NIC) is available
and that is all that can be used as a sampling frame.
It is obvious that employment figures from establishment-based surveys
like the present QES (as the initial first component of the All-India Quarterly
Establishment-based Employment Survey AQEES) can provide an idea-
though incomplete- about ‘gainful’ employment in different sectors of the
economy. In the household based surveys, a person is taken as ‘employed’
on the basis of usual principal activity statuses even if the person is
engaged in production of goods and services entirely for own consumption,
without any pay or profit.
1.3 ALL-INDIA QUARTERLY ESTABLISHMENT BASED EMPLOYMENT
SURVEY (AQEES)
Labour Bureau has been entrusted with the task of conducting the All
India Quarterly Establishment based Employment Survey (AQEES).
AQEES has two components namely Quarterly Employment Survey (QES) in
respect of establishments employing 10 or more workers (mostly
constituting ‘organised’ segment) and Area Frame Establishment Survey
(AFES) to build up a frame in respect of establishments (mostly the
Quarterly Employment Survey Report, 1st Quarter, 2021 Page 4
‘unorganised’ segment) employing 9 or less workers. After, a period of one
year or initial round of AFES, the results from the 4th QES round will be
merged with the findings of AFES so as to get a consolidated picture of
employment scenario in respect of establishments employing 9 or less
workers as also establishments with 10 or more workers. AQEES will cover
all non-farm activities except division 01, 02, & 03 of NIC-2008.
The scope of the present QES is limited only to establishments having
10 or more persons (Organized Segment) as identified by the Sixth
Economic Census (2013-14). The scope & coverage of AQEES and, hence, of
QES is further limited to employment in non-farm economy covering nine
sectors viz. Manufacturing, Construction, Trade, Transport, Education,
Health, Accommodation & Restaurants, IT/BPO and Financial Service
Activities.
The list of all these establishments, as appearing in the Directory of
Establishments, in the above mentioned nine major sectors in Sixth
Economic Census (EC), was used as the sampling frame for the present QES
survey. The aforesaid nine sectors account for around 85% of the total
employment in units with 10 or more workers in the 6thEC.
1.4 THE PRESENT SURVEY (QES)
The QES component of AQEES started with the reference date as April
1, 2021 to achieve the following two objectives viz.
i) Providing short-term (on quarterly basis) employment estimates for nine
selected sectors of the Indian economy viz. Manufacturing, Construction,
Trade, Transport, Education, Health, Accommodation & Restaurants,
IT/BPOs and Financial Services.
ii) Providing relative change in employment situation over successive
quarters in the above segment of Indian Economy.
Quarterly Employment Survey Report, 1st Quarter, 2021 Page 5
For selecting a fixed Panel of around 12000 units, Stratified Simple
Random Sampling (Without Replacement) was adopted. The guiding
principle for selecting these sectors was the proportion of workers in all the
establishments employing ten or more workers engaged in a particular
sector. In each of these nine sectors, establishments have been further
divided into six classes based on the size of employment viz. 10-39 workers,
40-99 workers, 100-499 workers, 500-999 workers, 1000-4999 workers and
more than 5000 workers. Different size-classes in respect of each of the
different sectors within each state/Union Territory were recognised as strata
and allocation for a given stratum was proportional to the number of
establishments contained in it.
These nine sectors account for around 85% of the total employment in
the establishments with ten or more workers in the 6th Economic Census
and hence, the sample is quite representative of establishments with ten or
more workers in the nine selected sectors. The sampling frame used for the
present survey was the Directory of Establishments (based on the 6th EC).
The sampling design and estimation procedure used in the survey are given
in Annexure-III.
The schedule for QES contains questions on identification particulars,
establishment particulars, employment with breakup of characteristics such
as gender, type and nature, vacancy details, skill development programme,
on the job training provided by establishment and social security benefits.
QES schedule has been attached at Annexure-V of the report.
1.5 SUMMARY RESULTS FOR THE FIRST ROUND OF QES
It is heartening to note that the estimated total employment in the
nine selected sectors from the first round of QES works out as 3 crores and
8 lakhs approximately against a total of 2 crores and 37 lakhs in these
sectors taken collectively, as reported in the Sixth Economic Census (2013-
Quarterly Employment Survey Report, 1st Quarter, 2021 Page 6
14), implying a growth of 29%. Of the total employment estimated in the
selected nine sectors, Manufacturing accounts for nearly 41%, followed by
Education with 22%, and Health 8%. Trade and IT/ BPO engaged 7% of the
total estimated number of workers.
The most impressive growth of 152% has been recorded in the
IT/BPO sector, while growth rates in Health 77%, Financial Services 48%,
Education 39%, Manufacturing 22%, Transport 68% and Construction 42%
were also quite significant. However, employment in Trade came down by
25% and in Accommodation & Restaurant the decline was by 13%. Nearly
90 % of the establishments have been estimated to work with less than 100
workers, though 34.8% of the IT/BPO establishments worked with at least
100 workers, including about 13.8% engaging 500 workers or more. In the
Health sector, 18% of the establishments had 100 or more workers. It may
be mentioned that 95% of the establishments were reported to working with
less than 100 workers in the Sixth Economic Census. And in the IT/BPO
sector the figures during 2013-14 for the size classes 100 or more and 500
or more stood at 19 and 6 respectively.
The over-all percentage of female workers stood at 29, slightly lower
than 31 reported during 6thEC.
Regular workers constitute 88% of the estimated workforce in the nine
selected sectors, with only 2% being casual workers. However, 18% of
workers in the Construction sector are contractual employees and 13% are
casual workers.
About 97% of the establishments were located outside households in
fixed structures, though 4% of units in IT/ BPO sector were found to
operate from within households.
Only 9% of the establishments (with at least 10 workers) were not
registered with any authority or under any act. While 26% of all the
Quarterly Employment Survey Report, 1st Quarter, 2021 Page 7
establishments were registered under the Companies Act, this percentage
was as high as 71 in IT / BPO, 58 in Construction, 46 in Manufacturing, 42
in Transport, 35 in Trade and 28 in Financial services. One-fourth of the
establishments were operating as registered societies, 41% were registered
under Excise and 30 % under Shops and Establishments Act.
Looking at the educational qualifications of employees, it came out
that 31% of those working in seven of the nine sectors (excluding Education
and Health) were matriculates/secondary or less educated, while another
31% were graduates or had higher qualifications. In fact, the latter
percentage is as high as 70 in the IT/BPO sector and 59 in Financial
Services. In the Health sector, as few as 22% of the non-Clinical workers
were matriculates/secondary or less educated, the figure being 15% in the
non-Teaching staff in the Education sector. More than one-third of the
employees in these two sectors were at least graduates.
It is somewhat encouraging to note that 18% of the establishments
provide formal skill development programmes, mostly for their own
employees, though. It transpired that an estimated 3.6% of the
establishments were having vacancies in positions and the estimated
number of vacancies was a little over one lakh 87 thousand. And about 39%
of such vacancies were not due to retirement or resignation of employees.
Coming to assess the impact of COVID 19 pandemic on employment
in the organized non-farm segment of the Indian economy, employment
decreased due to the pandemic in 27% of the establishments. On the bright
side of the employment scenario, it may be noted that 81% of the workers
received full wages during the lock-down period (March 25-June 30, 2020),
16% received reduced wages and only 3 % were denied of any wages. In the
Health and Financial Services sector, however, more than 90% workers
received full wages. However, in the Construction sector, 27% had to accept
reduced wages and 7 % were left with none.
Quarterly Employment Survey Report, 1st Quarter, 2021 Page 8
1.6. POINTS TO REMEMBER
The sector-wise estimates of employment captured under QES along
with information on key parameters bearing on employment like, number of
vacancies and reasons thereof, skill development, persons recruited, jobs
withdrawn, number of persons retrenched, etc. are highly useful from policy
perspective. Therefore, QES data will be found useful by policy-makers,
Central/State Governments officials, research scholars and other
stakeholders.
While using the QES estimates the following points have to be kept in
mind.
A) QES does not capture employment data from units which emerged
after the 6thEconomic Census in 2013-14.
B) The survey work for the first quarter of QES corresponds to the
period of second wave of COVID-19 pandemic and in view of the
surge in covid-19 cases across the country several lockdown
restrictions were imposed by respective State/ UT authorities.
Therefore, data collection was mainly carried out telephonically and
through visits by investigators wherever possible.
C) The survey is based on either records or responses of the
establishment. However, verification of records has not been
resorted to for collection of data.
D) If an individual who is working in more than one establishment on a
given reference date the worker is counted separately for each
establishment giving rise to possible duplication.
Quarterly Employment Survey Report, 1st Quarter, 2021 Page 9
CHAPTER 2
KEY FINDINGS OF THE SURVEY 2.1 INTRODUCTION
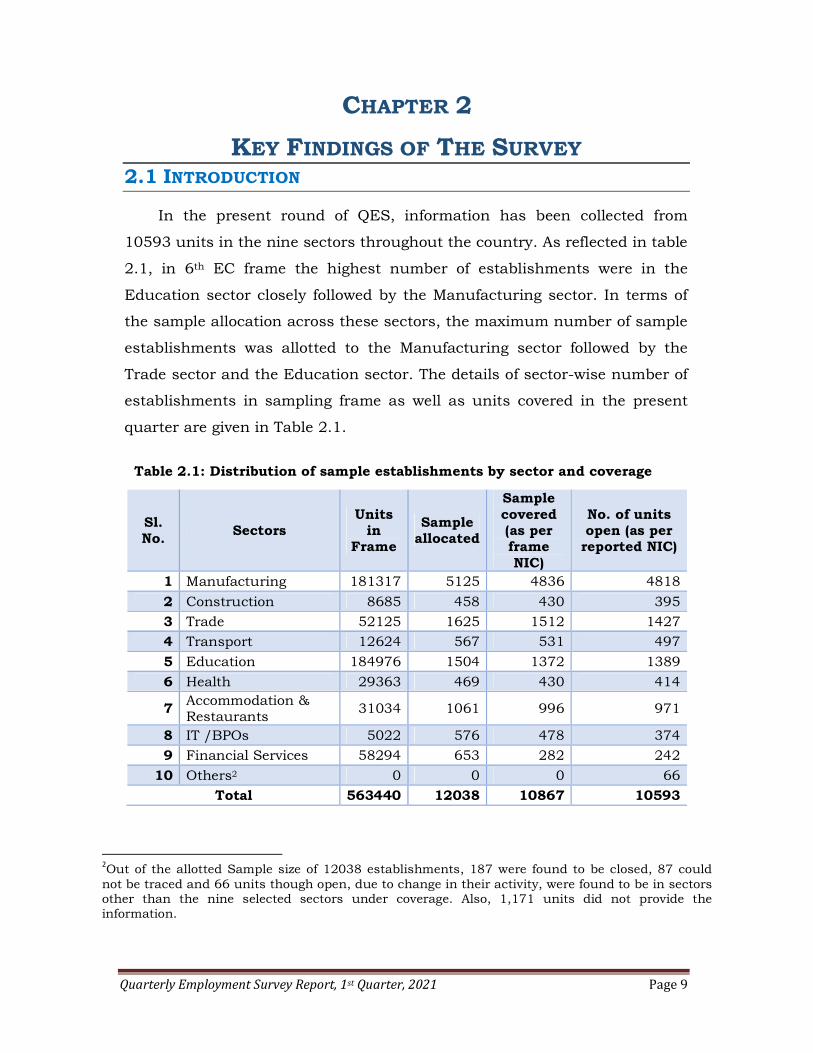
In the present round of QES, information has been collected from
10593 units in the nine sectors throughout the country. As reflected in table
2.1, in 6th EC frame the highest number of establishments were in the
Education sector closely followed by the Manufacturing sector. In terms of
the sample allocation across these sectors, the maximum number of sample
establishments was allotted to the Manufacturing sector followed by the
Trade sector and the Education sector. The details of sector-wise number of
establishments in sampling frame as well as units covered in the present
quarter are given in Table 2.1.
Table 2.1: Distribution of sample establishments by sector and coverage
Sl. No. Sectors
Units in
Frame
Sample allocated
Sample covered (as per frame NIC)
No. of units open (as per reported NIC)
1 Manufacturing 181317 5125 4836 4818
2 Construction 8685 458 430 395
3 Trade 52125 1625 1512 1427
4 Transport 12624 567 531 497
5 Education 184976 1504 1372 1389
6 Health 29363 469 430 414
7 Accommodation & Restaurants
31034 1061 996 971
8 IT /BPOs 5022 576 478 374
9 Financial Services 58294 653 282 242
10 Others2 0 0 0 66
Total 563440 12038 10867 10593
2Out of the allotted Sample size of 12038 establishments, 187 were found to be closed, 87 could not be traced and 66 units though open, due to change in their activity, were found to be in sectors other than the nine selected sectors under coverage. Also, 1,171 units did not provide the information.
Quarterly Employment Survey Report, 1st Quarter, 2021 Page 10
2.2 CHARACTERISTICS OF ESTABLISHMENTS IN THE SELECTED SECTORS
This section presents sector-wise employment characteristics for the
establishments employing ten or more workers.
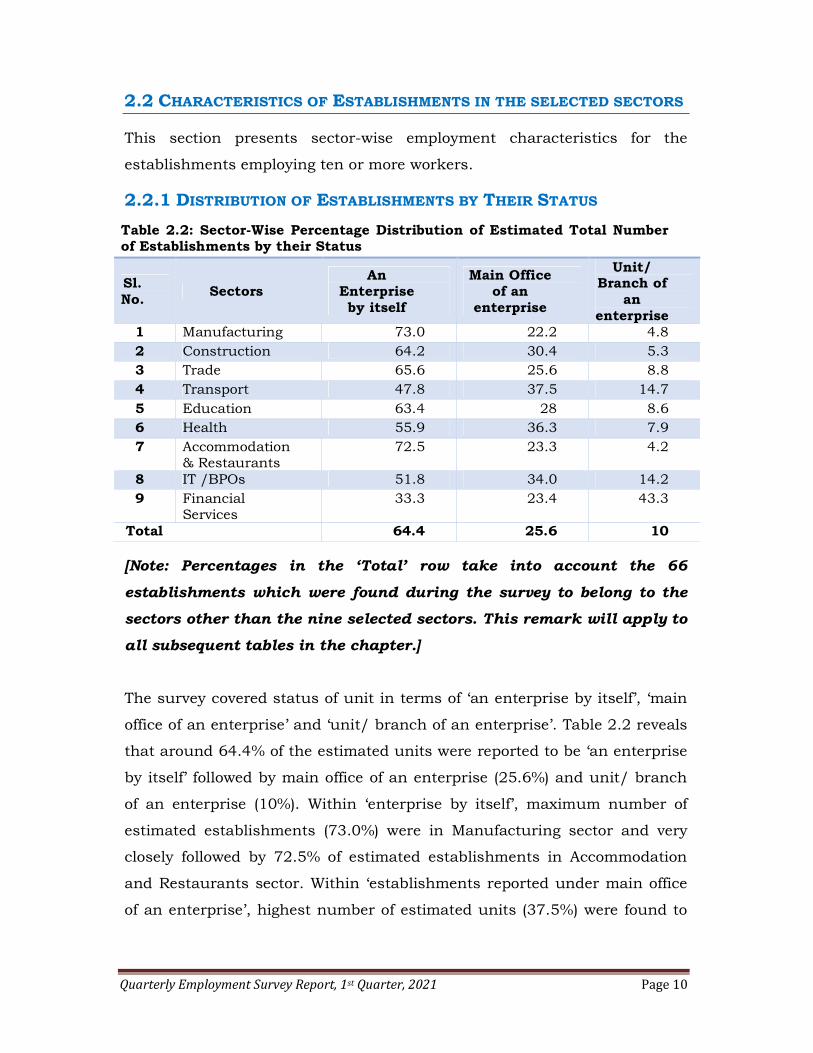
2.2.1 DISTRIBUTION OF ESTABLISHMENTS BY THEIR STATUS
Table 2.2: Sector-Wise Percentage Distribution of Estimated Total Number of Establishments by their Status
Sl. No.
Sectors An
Enterprise by itself
Main Office of an
enterprise
Unit/ Branch of
an enterprise
1 Manufacturing 73.0 22.2 4.8 2 Construction 64.2 30.4 5.3 3 Trade 65.6 25.6 8.8 4 Transport 47.8 37.5 14.7 5 Education 63.4 28 8.6 6 Health 55.9 36.3 7.9 7 Accommodation
& Restaurants 72.5 23.3 4.2
8 IT /BPOs 51.8 34.0 14.2 9 Financial
Services 33.3 23.4 43.3
Total 64.4 25.6 10
[Note: Percentages in the ‘Total’ row take into account the 66
establishments which were found during the survey to belong to the
sectors other than the nine selected sectors. This remark will apply to
all subsequent tables in the chapter.]
The survey covered status of unit in terms of ‘an enterprise by itself’, ‘main
office of an enterprise’ and ‘unit/ branch of an enterprise’. Table 2.2 reveals
that around 64.4% of the estimated units were reported to be ‘an enterprise
by itself’ followed by main office of an enterprise (25.6%) and unit/ branch
of an enterprise (10%). Within ‘enterprise by itself’, maximum number of
estimated establishments (73.0%) were in Manufacturing sector and very
closely followed by 72.5% of estimated establishments in Accommodation
and Restaurants sector. Within ‘establishments reported under main office
of an enterprise’, highest number of estimated units (37.5%) were found to
Quarterly Employment Survey Report, 1st Quarter, 2021 Page 11
be in Transport sector followed by Health sector (36.3%) and IT/BPOs
(34.0%). Further, in terms of ‘unit/branch of an enterprise’, highest
numbers of estimated units (43.3%) were found to be in Financial Services
sector followed by Transport (14.7%) and IT/BPOs (14.2%). The sector-wise
details of estimated percentage of total establishments by their status are
given in Table 2.2.
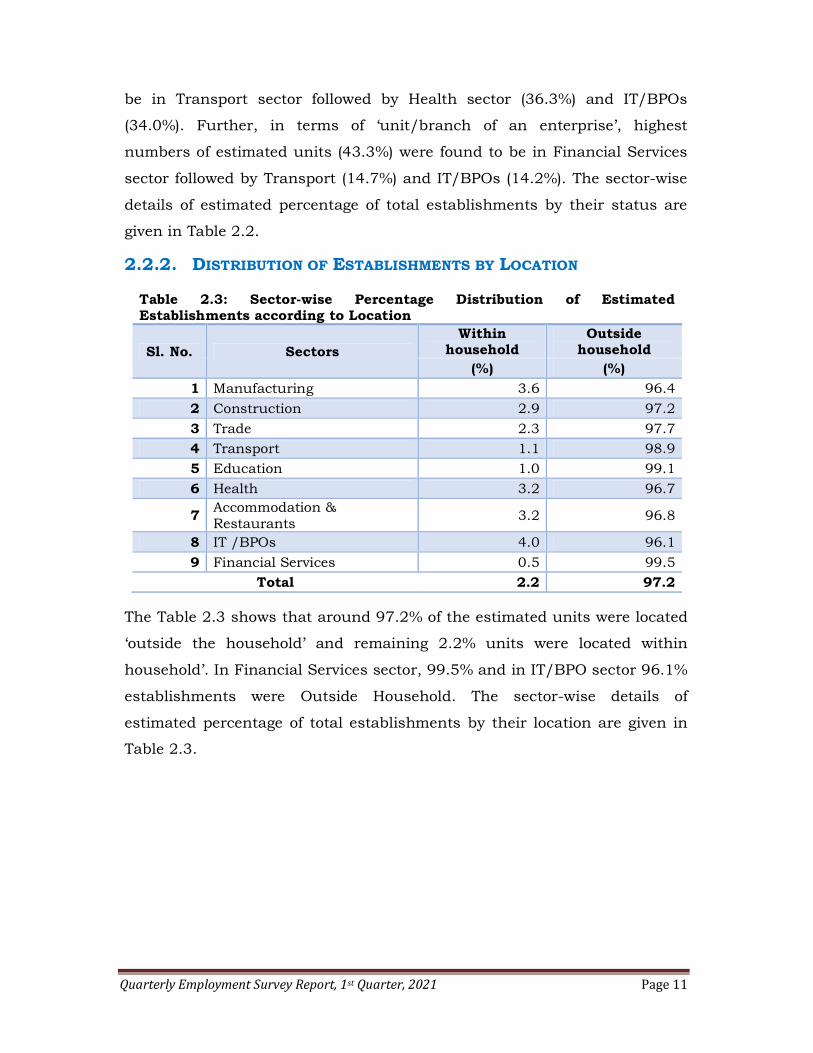
2.2.2. DISTRIBUTION OF ESTABLISHMENTS BY LOCATION
Table 2.3: Sector-wise Percentage Distribution of Estimated Establishments according to Location
Sl. No. Sectors Within
household Outside
household (%) (%)
1 Manufacturing 3.6 96.4
2 Construction 2.9 97.2
3 Trade 2.3 97.7
4 Transport 1.1 98.9
5 Education 1.0 99.1
6 Health 3.2 96.7
7 Accommodation & Restaurants
3.2 96.8
8 IT /BPOs 4.0 96.1
9 Financial Services 0.5 99.5
Total 2.2 97.2
The Table 2.3 shows that around 97.2% of the estimated units were located
‘outside the household’ and remaining 2.2% units were located within
household’. In Financial Services sector, 99.5% and in IT/BPO sector 96.1%
establishments were Outside Household. The sector-wise details of
estimated percentage of total establishments by their location are given in
Table 2.3.
Quarterly Employment Survey Report, 1st Quarter, 2021 Page 12
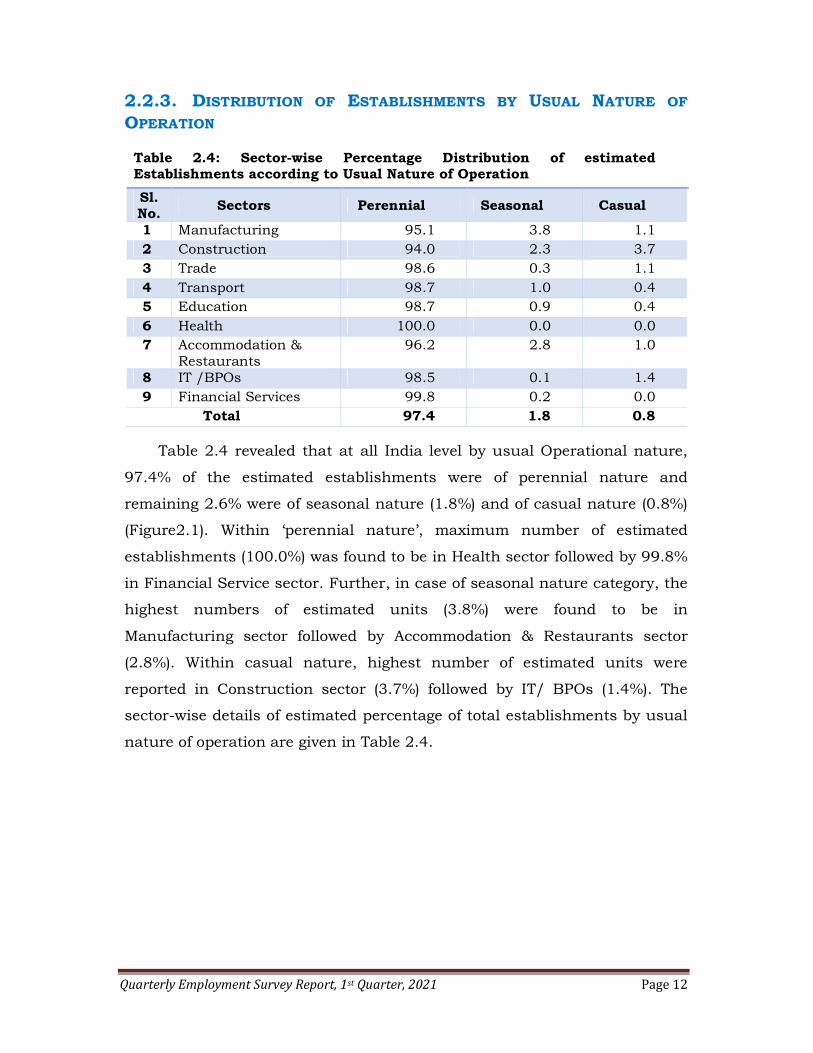
2.2.3. DISTRIBUTION OF ESTABLISHMENTS BY USUAL NATURE OF
OPERATION
Table 2.4: Sector-wise Percentage Distribution of estimated Establishments according to Usual Nature of Operation
Sl. No.
Sectors Perennial Seasonal Casual
1 Manufacturing 95.1 3.8 1.1 2 Construction 94.0 2.3 3.7 3 Trade 98.6 0.3 1.1 4 Transport 98.7 1.0 0.4 5 Education 98.7 0.9 0.4 6 Health 100.0 0.0 0.0 7 Accommodation &
Restaurants 96.2 2.8 1.0
8 IT /BPOs 98.5 0.1 1.4 9 Financial Services 99.8 0.2 0.0
Total 97.4 1.8 0.8
Table 2.4 revealed that at all India level by usual Operational nature,
97.4% of the estimated establishments were of perennial nature and
remaining 2.6% were of seasonal nature (1.8%) and of casual nature (0.8%)
(Figure2.1). Within ‘perennial nature’, maximum number of estimated
establishments (100.0%) was found to be in Health sector followed by 99.8%
in Financial Service sector. Further, in case of seasonal nature category, the
highest numbers of estimated units (3.8%) were found to be in
Manufacturing sector followed by Accommodation & Restaurants sector
(2.8%). Within casual nature, highest number of estimated units were
reported in Construction sector (3.7%) followed by IT/ BPOs (1.4%). The
sector-wise details of estimated percentage of total establishments by usual
nature of operation are given in Table 2.4.

Quarterly Employment Survey Report, 1
Figure 2.1: Percentage Distribution of
Table 2.4a: SectorEstablishments with ten or more WEC, 2013-14) according to Usual Nature
Sl. No.
Sectors
1 Manufacturing 2 Construction 3 Trade 4 Transport 5 Education 6 Health 7 Accommodation and
Restaurants 8 IT BPO 9 Financial Services
Total
Further, the category wise distribution of the establishments with ten
and more workers in the selected nine sectors listed under the 6
given in the table 2.4a.
The table 2.4a, shows that there were around 96.5% establishments in
the selected nine sectors with perennial nature under 6
Quarterly Employment Survey Report, 1st Quarter, 2021
Percentage Distribution of Estimated Establishments Nature of Operation
Sector-wise Percentage Distribution of s with ten or more Workers (as listed under 6
according to Usual Nature of Operation
Perennial Seasonal Casual
93.0 6.5 94.0 4.9 96.7 2.9 96.4 3.2 99.0 0.8 98.9 0.7
Accommodation and 97.7 1.8
99.2 0.5 98.5 0.8 96.5 3.1
Further, the category wise distribution of the establishments with ten
in the selected nine sectors listed under the 6
a, shows that there were around 96.5% establishments in
the selected nine sectors with perennial nature under 6th EC data
Page 13
by Usual
wise Percentage Distribution of as listed under 6th
Casual
0.5 1.1 0.4 0.4 0.2 0.4
0.5
0.3 0.7 0.4
Further, the category wise distribution of the establishments with ten
in the selected nine sectors listed under the 6th EC is
a, shows that there were around 96.5% establishments in
EC data. As per
Quarterly Employment Survey Report, 1
the estimates of first quarter
establishments with Perennial nature was around 97.4%. Similarly, the
percentage share of establishments in nine selected sectors with ten or more
workers with Seasonal nature was around 3.1% under 6
per the estimates of the Q1 of QES the
seasonal establishments was around 1.8%. Also, as per results of Q1 of QES
estimated percentage share of establishments with casual nature was
around 0.8% whereas the correspon
0.4%.
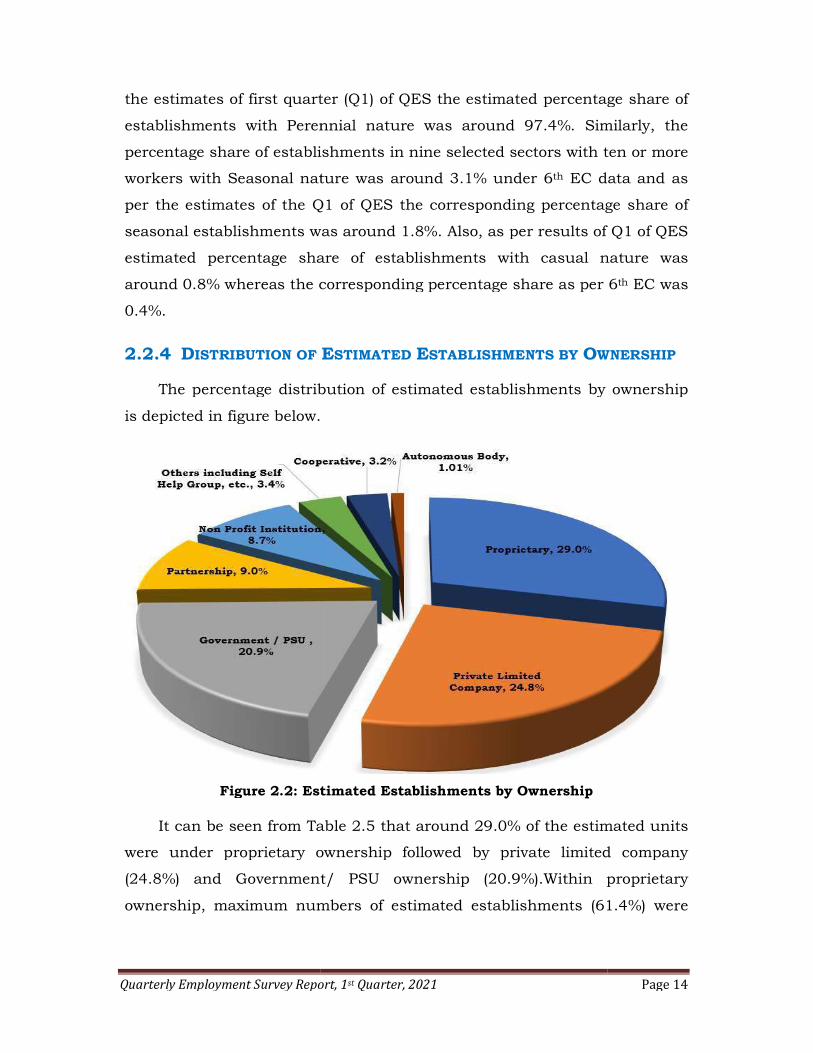
2.2.4 DISTRIBUTION OF
The percentage distribution of estimated establishments by ownership
is depicted in figure below.
Figure 2.2: Estimated Establishments
It can be seen from Tabl
were under proprietary ownership followed by private limited company
(24.8%) and Government/ PSU ownership (2
ownership, maximum numbers of estimated establishments
Quarterly Employment Survey Report, 1st Quarter, 2021
the estimates of first quarter (Q1) of QES the estimated percentage share of
establishments with Perennial nature was around 97.4%. Similarly, the
percentage share of establishments in nine selected sectors with ten or more
workers with Seasonal nature was around 3.1% under 6th EC data
per the estimates of the Q1 of QES the corresponding percentage share of
seasonal establishments was around 1.8%. Also, as per results of Q1 of QES
estimated percentage share of establishments with casual nature was
around 0.8% whereas the corresponding percentage share as per 6
ISTRIBUTION OF ESTIMATED ESTABLISHMENTS BY OWNERSHIP
The percentage distribution of estimated establishments by ownership
is depicted in figure below.
Figure 2.2: Estimated Establishments by Ownership
can be seen from Table 2.5 that around 29.0% of the estimated units
were under proprietary ownership followed by private limited company
%) and Government/ PSU ownership (20.9%).Within proprietary
numbers of estimated establishments (61.4%) were
Page 14
(Q1) of QES the estimated percentage share of
establishments with Perennial nature was around 97.4%. Similarly, the
percentage share of establishments in nine selected sectors with ten or more
EC data and as
percentage share of
seasonal establishments was around 1.8%. Also, as per results of Q1 of QES
estimated percentage share of establishments with casual nature was
ding percentage share as per 6th EC was
WNERSHIP
The percentage distribution of estimated establishments by ownership
% of the estimated units
were under proprietary ownership followed by private limited company
%).Within proprietary
(61.4%) were

Quarterly Employment Survey Report, 1st Quarter, 2021 Page 15
found to be in Accommodation & Restaurants sector followed by 47.0% in
Trade sector. Further, in case of private limited company ownership, the
highest numbers of estimated units (83.7%) were found to be in IT/ BPOs
sector followed by Construction sector (56.3%). Within Government/ PSU
ownership, highest number of estimated units were reported in Financial
service sector (54.2%) followed by Education (42.7%). The sector-wise details
of estimated percentage of distribution of establishments by Ownership are
given in Table 2.5.
Quarterly Employment Survey Report, 1st Quarter, 2021 Page 16
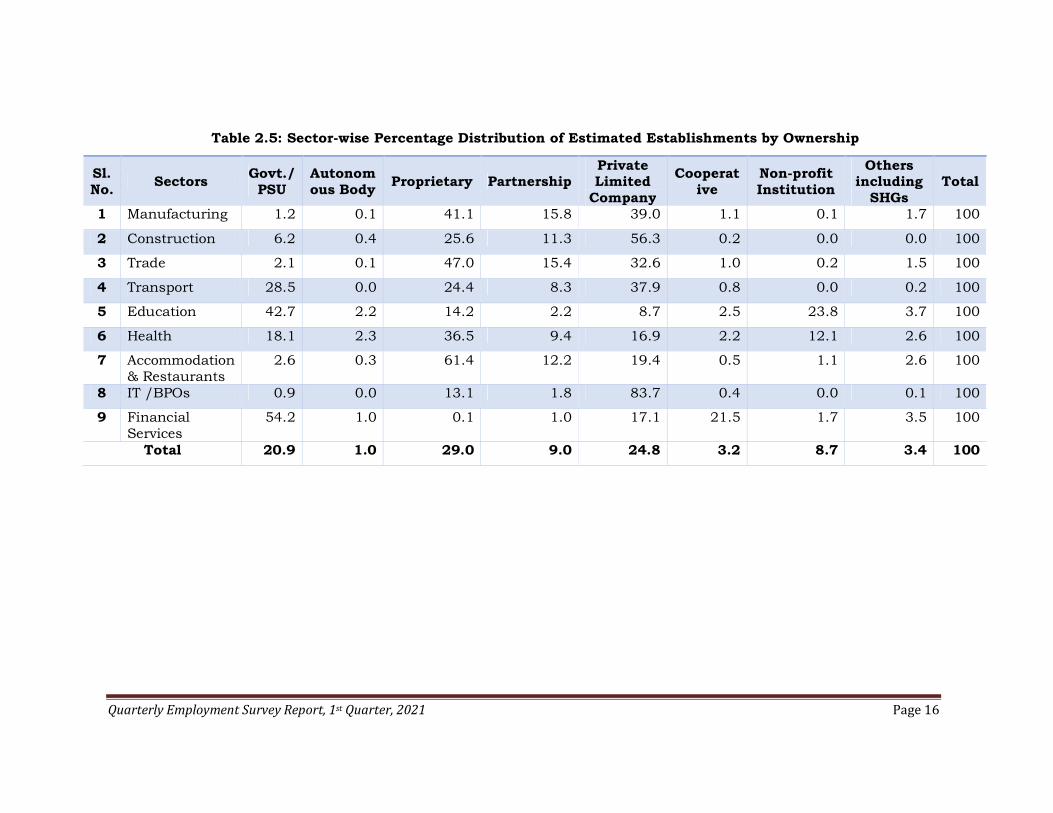
Table 2.5: Sector-wise Percentage Distribution of Estimated Establishments by Ownership
Sl. No.
Sectors Govt./ PSU
Autonomous Body
Proprietary Partnership Private Limited
Company
Cooperative
Non-profit Institution
Others including
SHGs Total
1 Manufacturing 1.2 0.1 41.1 15.8 39.0 1.1 0.1 1.7 100
2 Construction 6.2 0.4 25.6 11.3 56.3 0.2 0.0 0.0 100
3 Trade 2.1 0.1 47.0 15.4 32.6 1.0 0.2 1.5 100
4 Transport 28.5 0.0 24.4 8.3 37.9 0.8 0.0 0.2 100
5 Education 42.7 2.2 14.2 2.2 8.7 2.5 23.8 3.7 100
6 Health 18.1 2.3 36.5 9.4 16.9 2.2 12.1 2.6 100
7 Accommodation & Restaurants
2.6 0.3 61.4 12.2 19.4 0.5 1.1 2.6 100
8 IT /BPOs 0.9 0.0 13.1 1.8 83.7 0.4 0.0 0.1 100
9 Financial Services
54.2 1.0 0.1 1.0 17.1 21.5 1.7 3.5 100
Total 20.9 1.0 29.0 9.0 24.8 3.2 8.7 3.4 100
Quarterly Employment Survey Report, 1st Quarter, 2021 Page 17
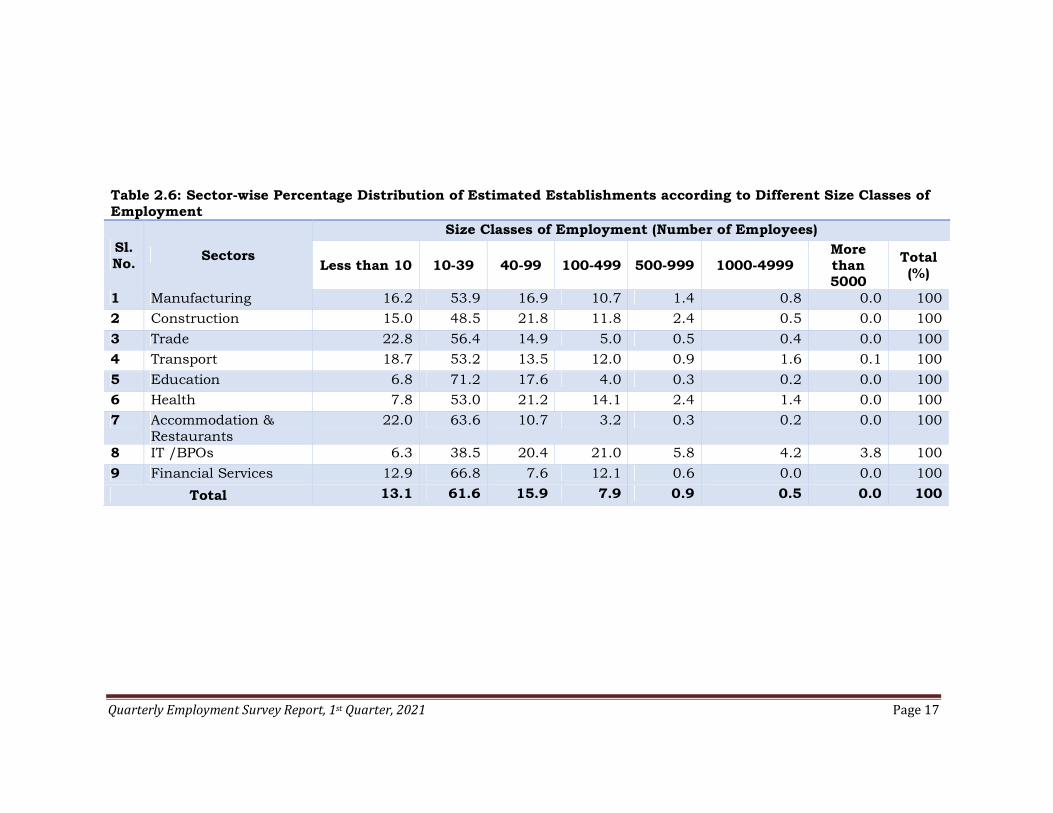
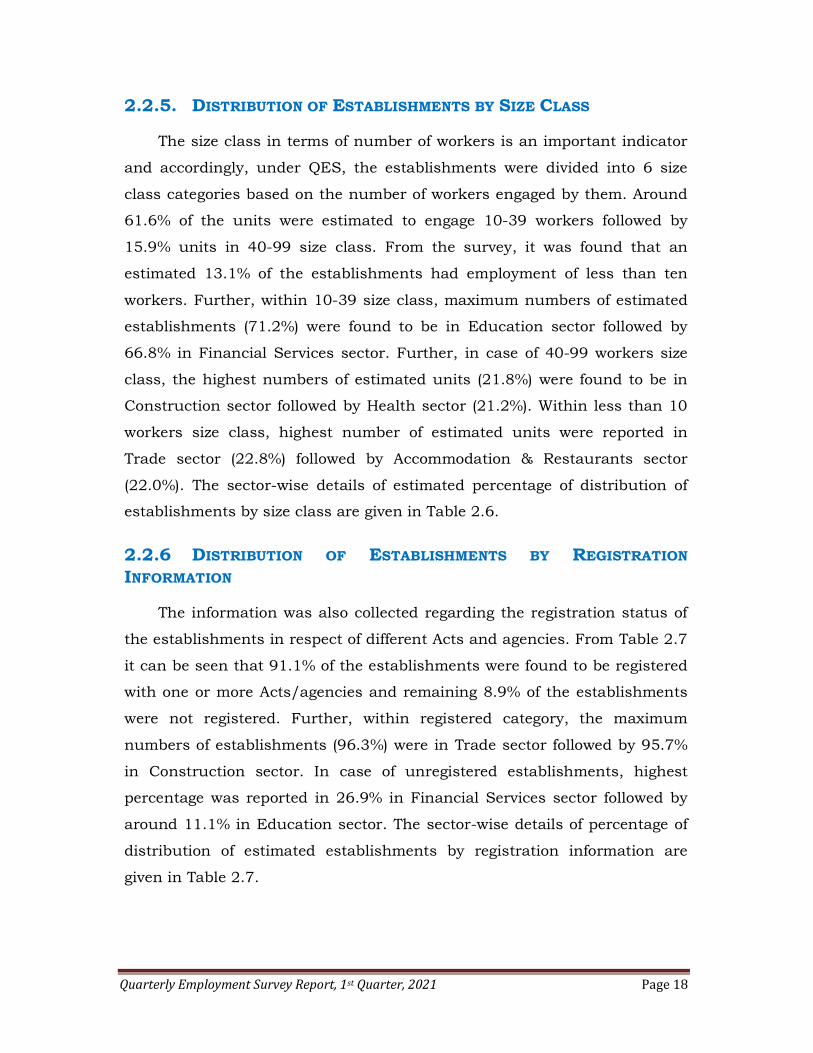
Table 2.6: Sector-wise Percentage Distribution of Estimated Establishments according to Different Size Classes of Employment
Sl. No.
Sectors
Size Classes of Employment (Number of Employees)
Less than 10 10-39 40-99 100-499 500-999 1000-4999 More than 5000
Total (%)
1 Manufacturing 16.2 53.9 16.9 10.7 1.4 0.8 0.0 100
2 Construction 15.0 48.5 21.8 11.8 2.4 0.5 0.0 100
3 Trade 22.8 56.4 14.9 5.0 0.5 0.4 0.0 100
4 Transport 18.7 53.2 13.5 12.0 0.9 1.6 0.1 100
5 Education 6.8 71.2 17.6 4.0 0.3 0.2 0.0 100
6 Health 7.8 53.0 21.2 14.1 2.4 1.4 0.0 100
7 Accommodation & Restaurants
22.0 63.6 10.7 3.2 0.3 0.2 0.0 100
8 IT /BPOs 6.3 38.5 20.4 21.0 5.8 4.2 3.8 100
9 Financial Services 12.9 66.8 7.6 12.1 0.6 0.0 0.0 100
Total 13.1 61.6 15.9 7.9 0.9 0.5 0.0 100
Quarterly Employment Survey Report, 1st Quarter, 2021 Page 18
2.2.5. DISTRIBUTION OF ESTABLISHMENTS BY SIZE CLASS
The size class in terms of number of workers is an important indicator
and accordingly, under QES, the establishments were divided into 6 size
class categories based on the number of workers engaged by them. Around
61.6% of the units were estimated to engage 10-39 workers followed by
15.9% units in 40-99 size class. From the survey, it was found that an
estimated 13.1% of the establishments had employment of less than ten
workers. Further, within 10-39 size class, maximum numbers of estimated
establishments (71.2%) were found to be in Education sector followed by
66.8% in Financial Services sector. Further, in case of 40-99 workers size
class, the highest numbers of estimated units (21.8%) were found to be in
Construction sector followed by Health sector (21.2%). Within less than 10
workers size class, highest number of estimated units were reported in
Trade sector (22.8%) followed by Accommodation & Restaurants sector
(22.0%). The sector-wise details of estimated percentage of distribution of
establishments by size class are given in Table 2.6.
2.2.6 DISTRIBUTION OF ESTABLISHMENTS BY REGISTRATION
INFORMATION
The information was also collected regarding the registration status of
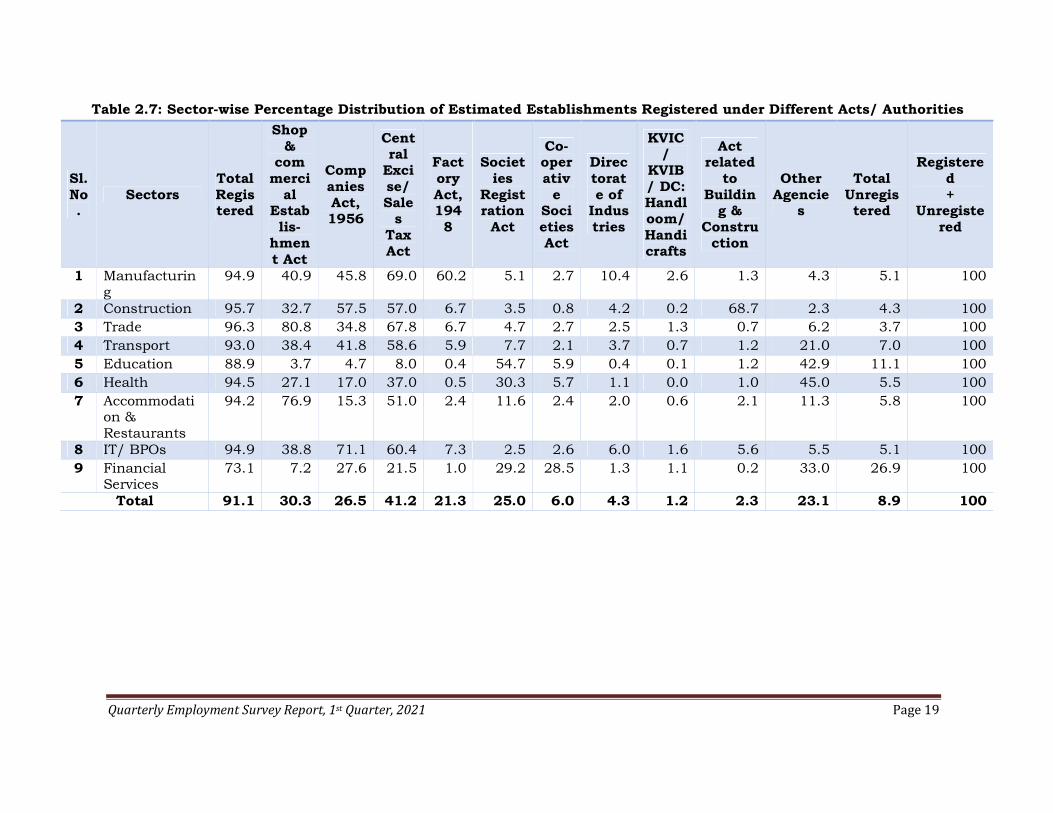
the establishments in respect of different Acts and agencies. From Table 2.7
it can be seen that 91.1% of the establishments were found to be registered
with one or more Acts/agencies and remaining 8.9% of the establishments
were not registered. Further, within registered category, the maximum
numbers of establishments (96.3%) were in Trade sector followed by 95.7%
in Construction sector. In case of unregistered establishments, highest
percentage was reported in 26.9% in Financial Services sector followed by
around 11.1% in Education sector. The sector-wise details of percentage of
distribution of estimated establishments by registration information are
given in Table 2.7.
Quarterly Employment Survey Report, 1st Quarter, 2021 Page 19
Table 2.7: Sector-wise Percentage Distribution of Estimated Establishments Registered under Different Acts/ Authorities
Sl. No.
Sectors Total Registered
Shop &
commerci
al Establis-
hment Act
Companies Act, 1956
Central
Excise/ Sale
s Tax Act
Factory Act, 1948
Societies
Registration
Act
Co-operativ
e Societies Act
Directorate of
Industries
KVIC/
KVIB/ DC: Handloom/ Handicrafts
Act related
to Buildin
g & Constru
ction
Other Agencie
s
Total Unregistered
Registered +
Unregistered
1 Manufacturing
94.9 40.9 45.8 69.0 60.2 5.1 2.7 10.4 2.6 1.3 4.3 5.1 100
2 Construction 95.7 32.7 57.5 57.0 6.7 3.5 0.8 4.2 0.2 68.7 2.3 4.3 100 3 Trade 96.3 80.8 34.8 67.8 6.7 4.7 2.7 2.5 1.3 0.7 6.2 3.7 100 4 Transport 93.0 38.4 41.8 58.6 5.9 7.7 2.1 3.7 0.7 1.2 21.0 7.0 100 5 Education 88.9 3.7 4.7 8.0 0.4 54.7 5.9 0.4 0.1 1.2 42.9 11.1 100 6 Health 94.5 27.1 17.0 37.0 0.5 30.3 5.7 1.1 0.0 1.0 45.0 5.5 100 7 Accommodati
on & Restaurants
94.2 76.9 15.3 51.0 2.4 11.6 2.4 2.0 0.6 2.1 11.3 5.8 100
8 IT/ BPOs 94.9 38.8 71.1 60.4 7.3 2.5 2.6 6.0 1.6 5.6 5.5 5.1 100 9 Financial
Services 73.1 7.2 27.6 21.5 1.0 29.2 28.5 1.3 1.1 0.2 33.0 26.9 100
Total 91.1 30.3 26.5 41.2 21.3 25.0 6.0 4.3 1.2 2.3 23.1 8.9 100
Quarterly Employment Survey Report, 1st Quarter, 2021 Page 20
Table 2.8: Sector-wise Percentage Distribution of Estimated Establishments Registered under MSME Act/Udyam portal.
Sl. No. Sectors Registered
under MSME Act (%)
Registered Under
MSME Act throughUdyam portal
(%)
Number of MSMEs (Nos.)
Total Number of
Establishments (Nos.)
1 Manufacturing 43.9 86.0 80210 182595 2 Construction 19.8 86.0 1821 9193 3 Trade 3.6 84.2 1793 50034 4 Transport 17.0 85.2 2066 12131 5 Education 2.3 81.4 4102 180557 6 Health 7.5 97.0 1999 26584 7 Accommodation &
Restaurants 7.9 84.8 2436 31028
8 IT /BPOs 24.8 85.7 1126 4546 9 Financial Services 2.7 93.8 1201 45289
Total 17.7 86.1 97031 549172
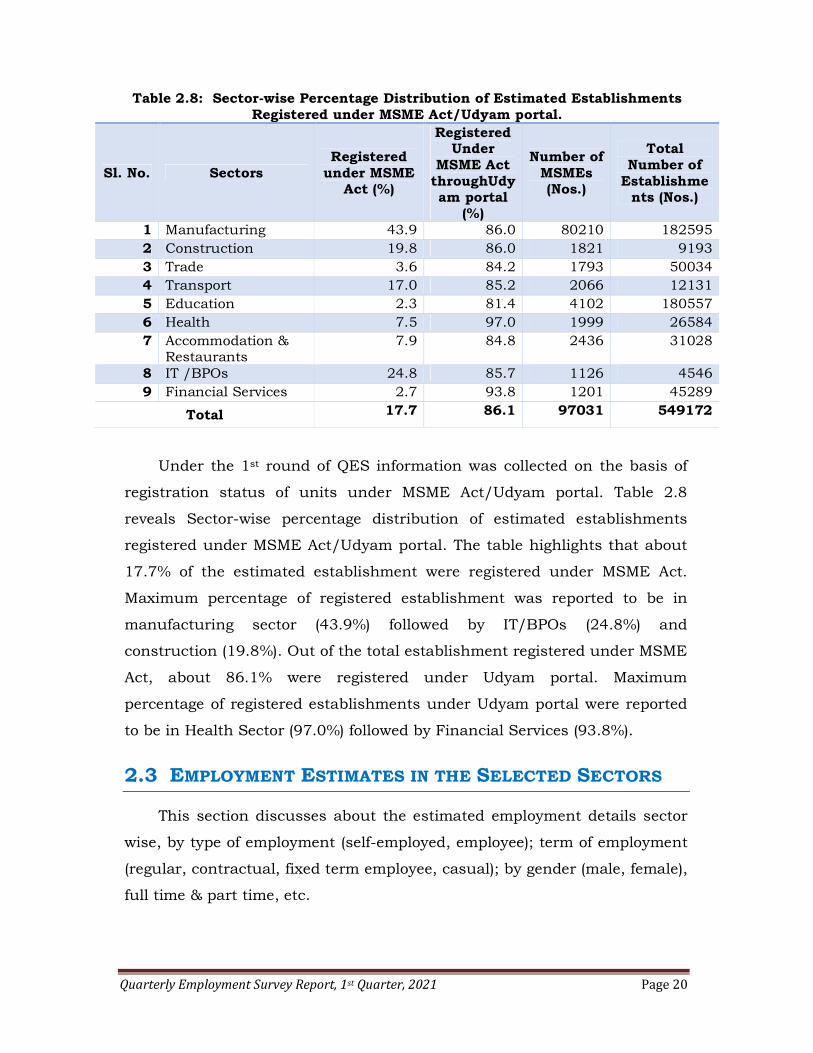
Under the 1st round of QES information was collected on the basis of
registration status of units under MSME Act/Udyam portal. Table 2.8
reveals Sector-wise percentage distribution of estimated establishments
registered under MSME Act/Udyam portal. The table highlights that about
17.7% of the estimated establishment were registered under MSME Act.
Maximum percentage of registered establishment was reported to be in
manufacturing sector (43.9%) followed by IT/BPOs (24.8%) and
construction (19.8%). Out of the total establishment registered under MSME
Act, about 86.1% were registered under Udyam portal. Maximum
percentage of registered establishments under Udyam portal were reported
to be in Health Sector (97.0%) followed by Financial Services (93.8%).
2.3 EMPLOYMENT ESTIMATES IN THE SELECTED SECTORS
This section discusses about the estimated employment details sector
wise, by type of employment (self-employed, employee); term of employment
(regular, contractual, fixed term employee, casual); by gender (male, female),
full time & part time, etc.
Quarterly Employment Survey Report, 1
2.3.1. SECTOR-WISE DISTRIBUTION OF
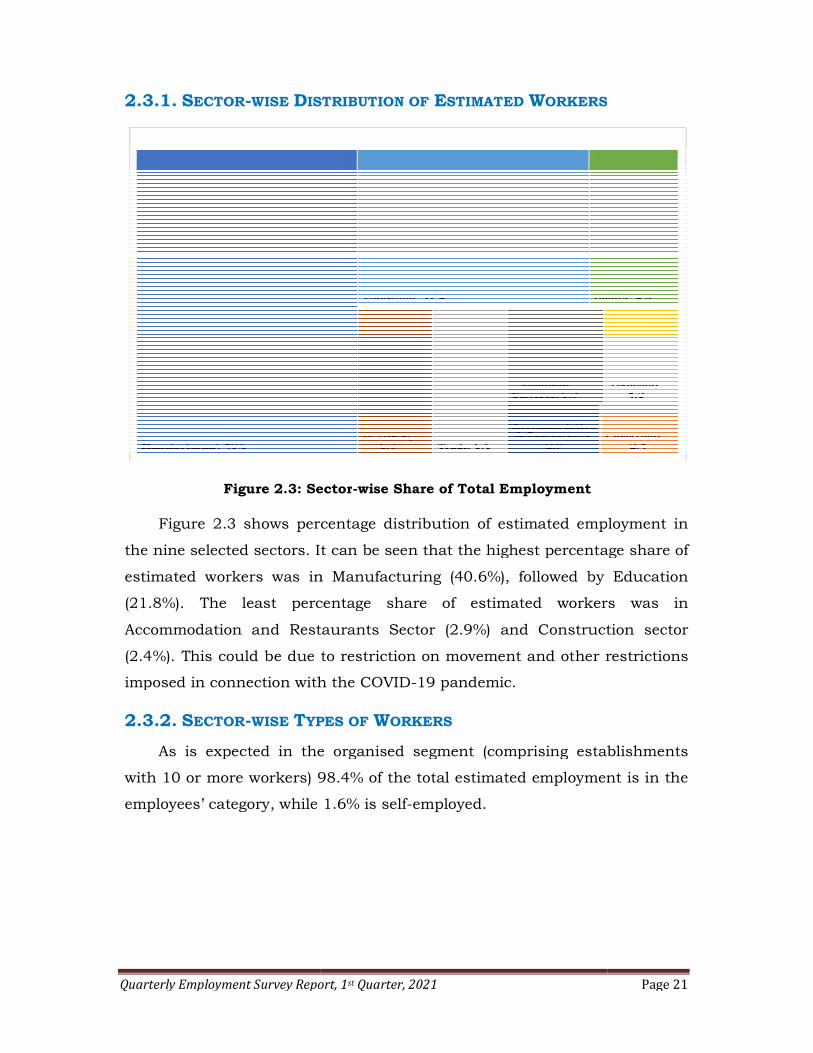
Figure 2.3: Sector
Figure 2.3 shows percentage distribution of estimated employment in
the nine selected sectors. It can be seen that the highe
estimated workers was in M
(21.8%). The least percentage share of estimated workers was in
Accommodation and Restaurants Sector (2.9%) and Construction sector
(2.4%). This could be due to re
imposed in connection with the COVID
2.3.2. SECTOR-WISE TYPES OF
As is expected in the organised segment (comprising establishments
with 10 or more workers) 98.4% of the total estimated empl
employees’ category, while
Quarterly Employment Survey Report, 1st Quarter, 2021
ISTRIBUTION OF ESTIMATED WORKERS
Sector-wise Share of Total Employment
shows percentage distribution of estimated employment in
selected sectors. It can be seen that the highest percentage share of
estimated workers was in Manufacturing (40.6%), followed by E
The least percentage share of estimated workers was in
Accommodation and Restaurants Sector (2.9%) and Construction sector
(2.4%). This could be due to restriction on movement and other restrictions
imposed in connection with the COVID-19 pandemic.
YPES OF WORKERS
As is expected in the organised segment (comprising establishments
98.4% of the total estimated employment
category, while 1.6% is self-employed.
Page 21
ORKERS
shows percentage distribution of estimated employment in
st percentage share of
followed by Education
The least percentage share of estimated workers was in
Accommodation and Restaurants Sector (2.9%) and Construction sector
striction on movement and other restrictions
As is expected in the organised segment (comprising establishments
oyment is in the
Quarterly Employment Survey Report, 1
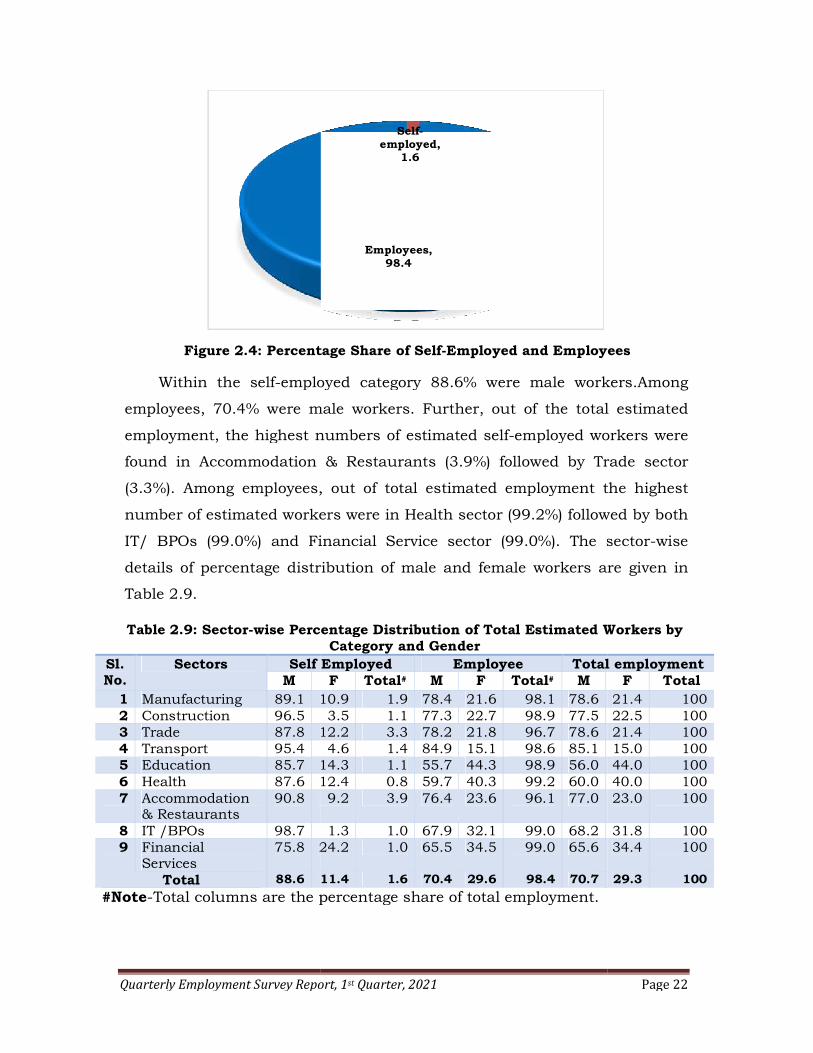
Figure 2.4: Percentage Share of Self
Within the self-employed category
employees, 70.4% were male workers
employment, the highest numbers of estimated self
found in Accommodation &
(3.3%). Among employees, out of total estimated employment
number of estimated workers were
IT/ BPOs (99.0%) and Financial Service sector (99.0%). The sector
details of percentage distribution of
Table 2.9.
Table 2.9: Sector-wise Percentage Distribution of Total E
Sl. No.
Sectors Self EmployedM
1 Manufacturing 89.1 10.92 Construction 96.5 3 Trade 87.8 12.24 Transport 95.4 5 Education 85.7 14.36 Health 87.6 12.47 Accommodation
& Restaurants 90.8
8 IT /BPOs 98.7 9 Financial
Services 75.8 24.2
Total 88.6 11.4
#Note-Total columns are the percentage share of total emplo
Quarterly Employment Survey Report, 1st Quarter, 2021
Percentage Share of Self-Employed and Employees
employed category 88.6% were male workers
% were male workers. Further, out of the total
the highest numbers of estimated self-employed workers were
in Accommodation & Restaurants (3.9%) followed by Trade
, out of total estimated employment the
number of estimated workers were in Health sector (99.2%) followed by
and Financial Service sector (99.0%). The sector
details of percentage distribution of male and female workers are
wise Percentage Distribution of Total Estimated Workers by Category and Gender
Self Employed Employee Total employmentF Total# M F Total# M
10.9 1.9 78.4 21.6 98.1 78.6 3.5 1.1 77.3 22.7 98.9 77.5
12.2 3.3 78.2 21.8 96.7 78.6 4.6 1.4 84.9 15.1 98.6 85.1
14.3 1.1 55.7 44.3 98.9 56.0 12.4 0.8 59.7 40.3 99.2 60.0 9.2 3.9 76.4 23.6 96.1 77.0
1.3 1.0 67.9 32.1 99.0 68.2 24.2 1.0 65.5 34.5 99.0 65.6
11.4 1.6 70.4 29.6 98.4 70.7
Total columns are the percentage share of total employment.
Self-employed,
1.6
Employees, 98.4
Page 22
nd Employees
% were male workers.Among
total estimated
employed workers were
followed by Trade sector
the highest
followed by both
and Financial Service sector (99.0%). The sector-wise
male and female workers are given in
stimated Workers by
Total employment F Total
21.4 100 22.5 100 21.4 100 15.0 100 44.0 100 40.0 100 23.0 100
31.8 100 34.4 100
29.3 100
yment.
Quarterly Employment Survey Report, 1
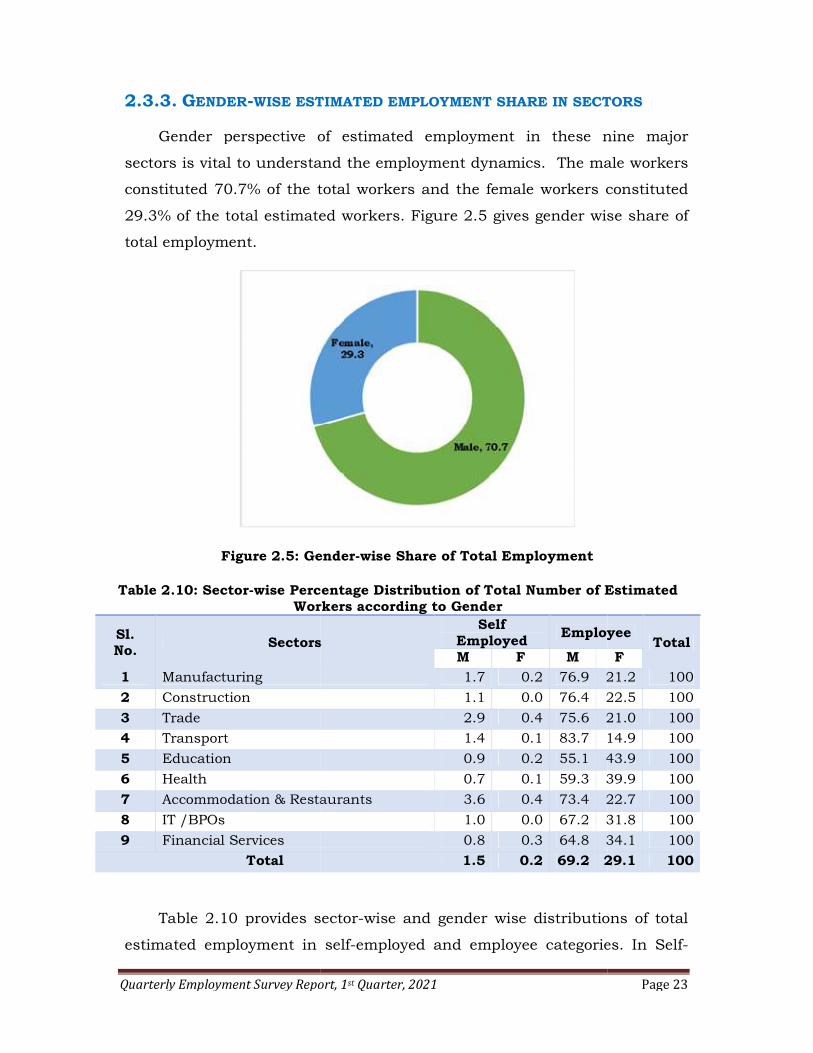
2.3.3. GENDER-WISE ESTIMATED EMPLO
Gender perspective of estimated employment in these
sectors is vital to understand the employment dynamics.
constituted 70.7% of the total workers and the femal
29.3% of the total estimated workers.
total employment.
Figure 2.5: Gender
Table 2.10: Sector-wise Percentage Distribution of Total Number of Estimated Workers ac
Sl. No. Sectors
1 Manufacturing
2 Construction
3 Trade
4 Transport
5 Education
6 Health
7 Accommodation & Restaurants
8 IT /BPOs
9 Financial Services
Total
Table 2.10 provides sector
estimated employment in
Quarterly Employment Survey Report, 1st Quarter, 2021
WISE ESTIMATED EMPLOYMENT SHARE IN SECTO
Gender perspective of estimated employment in these nine
sectors is vital to understand the employment dynamics. The male workers
constituted 70.7% of the total workers and the female workers constituted
29.3% of the total estimated workers. Figure 2.5 gives gender wise share of
: Gender-wise Share of Total Employment
wise Percentage Distribution of Total Number of Estimated Workers according to Gender
Sectors Self
Employed Employee
M F M 1.7 0.2 76.9 21.2
1.1 0.0 76.4 22.5
2.9 0.4 75.6 21.0
1.4 0.1 83.7 14.9
0.9 0.2 55.1 43.9
0.7 0.1 59.3 39.9
Accommodation & Restaurants 3.6 0.4 73.4 22.7
1.0 0.0 67.2 31.8
0.8 0.3 64.8 34.1
1.5 0.2 69.2 29.1
provides sector-wise and gender wise distribution
self-employed and employee categories
Page 23
YMENT SHARE IN SECTORS
nine major
The male workers
e workers constituted
gender wise share of
wise Percentage Distribution of Total Number of Estimated
Employee Total
F 21.2 100
22.5 100
21.0 100
14.9 100
43.9 100
39.9 100
22.7 100
31.8 100
34.1 100
29.1 100
wise distributions of total
employed and employee categories. In Self-
Quarterly Employment Survey Report, 1st Quarter, 2021 Page 24
employed male, Accommodation & Restaurants sector and Trade sector
were having highest percentage share of 3.6% and 2.9% of the total
employment respectively. The estimated self-employed female workers
(0.2%) were mainly reported (0.4%) in both Trade and Accommodation &
Restaurants sector followed by Financial Services sector (0.3%). Under
employee category, there were more than 75% of the male workers in
Transport (83.7%), Manufacturing (76.9%), Construction (76.4%) and Trade
(75.6%) sector. Female employees were largely reported in Education
(43.9%) followed by Health sector (39.9%).
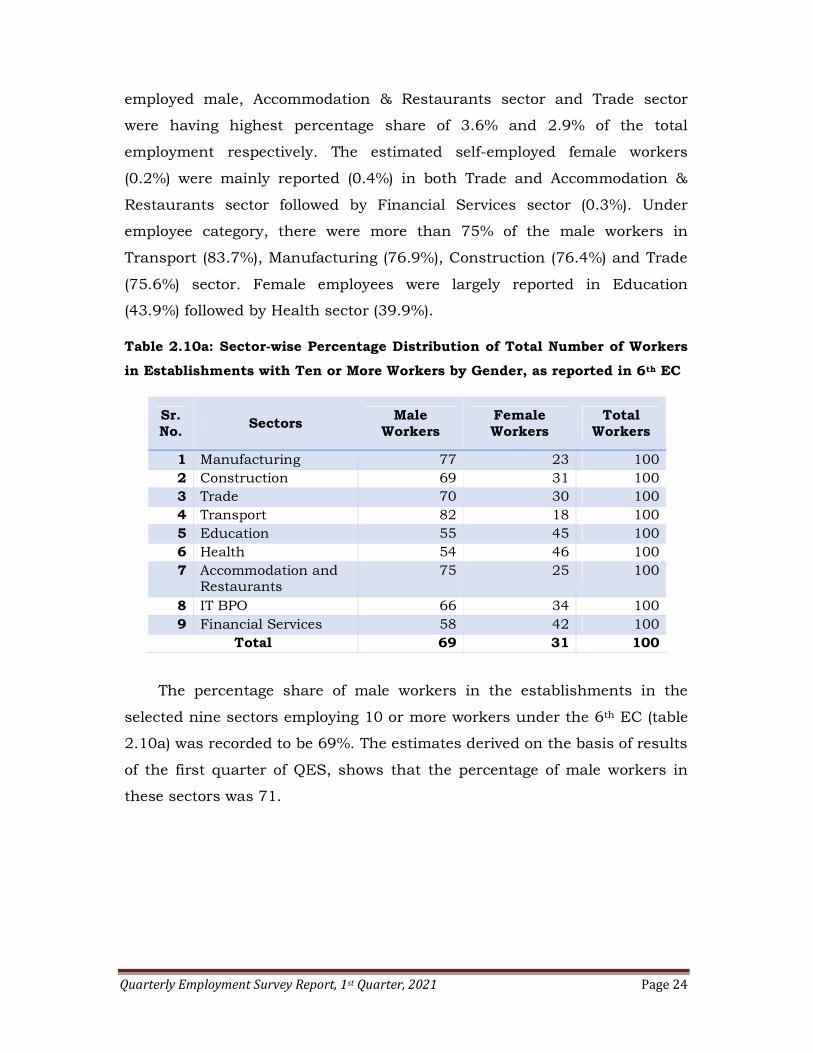
Table 2.10a: Sector-wise Percentage Distribution of Total Number of Workers
in Establishments with Ten or More Workers by Gender, as reported in 6th EC
Sr. No.
Sectors Male
Workers Female Workers
Total Workers
1 Manufacturing 77 23 100 2 Construction 69 31 100 3 Trade 70 30 100 4 Transport 82 18 100 5 Education 55 45 100 6 Health 54 46 100 7 Accommodation and
Restaurants 75 25 100
8 IT BPO 66 34 100 9 Financial Services 58 42 100
Total 69 31 100
The percentage share of male workers in the establishments in the
selected nine sectors employing 10 or more workers under the 6th EC (table
2.10a) was recorded to be 69%. The estimates derived on the basis of results
of the first quarter of QES, shows that the percentage of male workers in
these sectors was 71.
Quarterly Employment Survey Report, 1
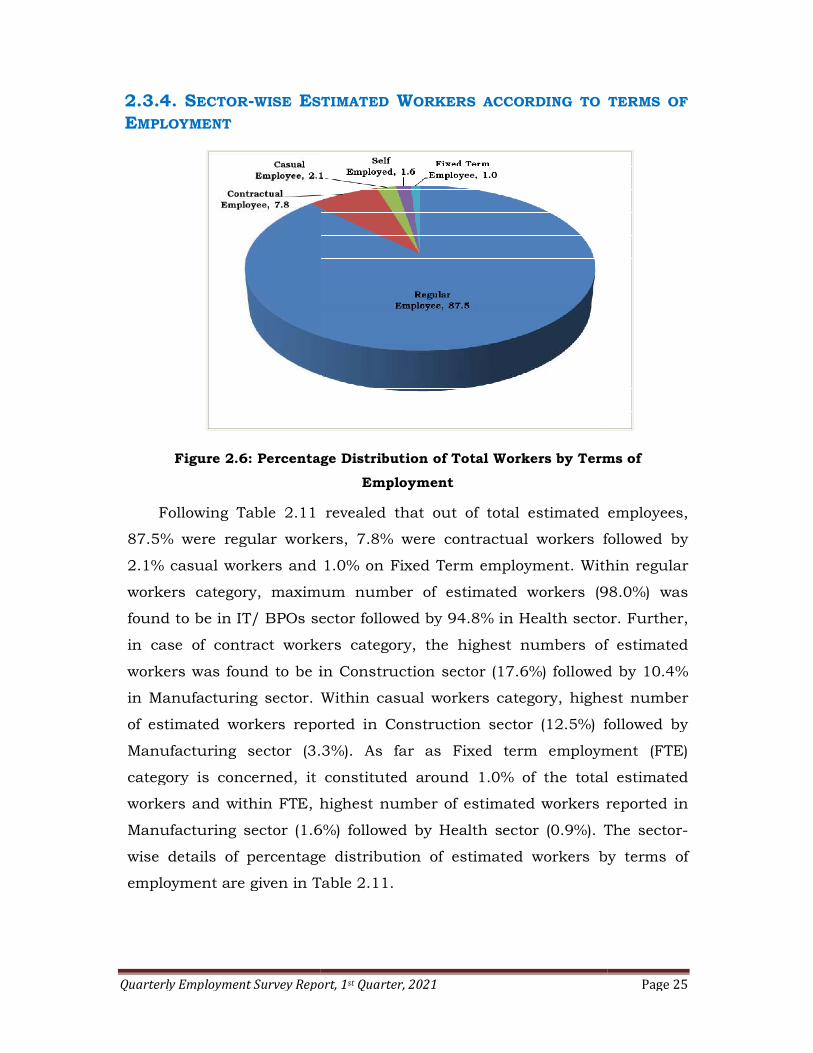
2.3.4. SECTOR-WISE ESTIMATED
EMPLOYMENT
Figure 2.6: Percentage
Following Table 2.11
87.5% were regular workers, 7.
2.1% casual workers and 1.0% on Fixed Term employmen
workers category, maximum number of est
found to be in IT/ BPOs sector followed by 94.8%
in case of contract workers category,
workers was found to be in
in Manufacturing sector. Within
of estimated workers reported in Construction sector (12.
Manufacturing sector (3.3%). As far as Fixed term employment (FT
category is concerned, it constituted around 1.
workers and within FTE, highest number of estimated workers reported in
Manufacturing sector (1.6
wise details of percentage distribu
employment are given in Table 2.1
Quarterly Employment Survey Report, 1st Quarter, 2021
STIMATED WORKERS ACCORDING TO
Percentage Distribution of Total Workers by Terms of
Employment
revealed that out of total estimated
% were regular workers, 7.8% were contractual workers followed by
and 1.0% on Fixed Term employment. Within regular
maximum number of estimated workers (98.0%) was
found to be in IT/ BPOs sector followed by 94.8% in Health sector.
in case of contract workers category, the highest numbers of estimated
found to be in Construction sector (17.6%) followed
Within casual workers category, highest number
of estimated workers reported in Construction sector (12.5%) followed by
Manufacturing sector (3.3%). As far as Fixed term employment (FT
category is concerned, it constituted around 1.0% of the total estimated
highest number of estimated workers reported in
6%) followed by Health sector (0.9%). The sector
wise details of percentage distribution of estimated workers by term
employment are given in Table 2.11.
Page 25
ORKERS ACCORDING TO TERMS OF
Terms of
revealed that out of total estimated employees,
% were contractual workers followed by
. Within regular
imated workers (98.0%) was
in Health sector. Further,
the highest numbers of estimated
followed by 10.4%
highest number
followed by
Manufacturing sector (3.3%). As far as Fixed term employment (FTE)
% of the total estimated
highest number of estimated workers reported in
The sector-
tion of estimated workers by terms of
Quarterly Employment Survey Report, 1st Quarter, 2021 Page 26
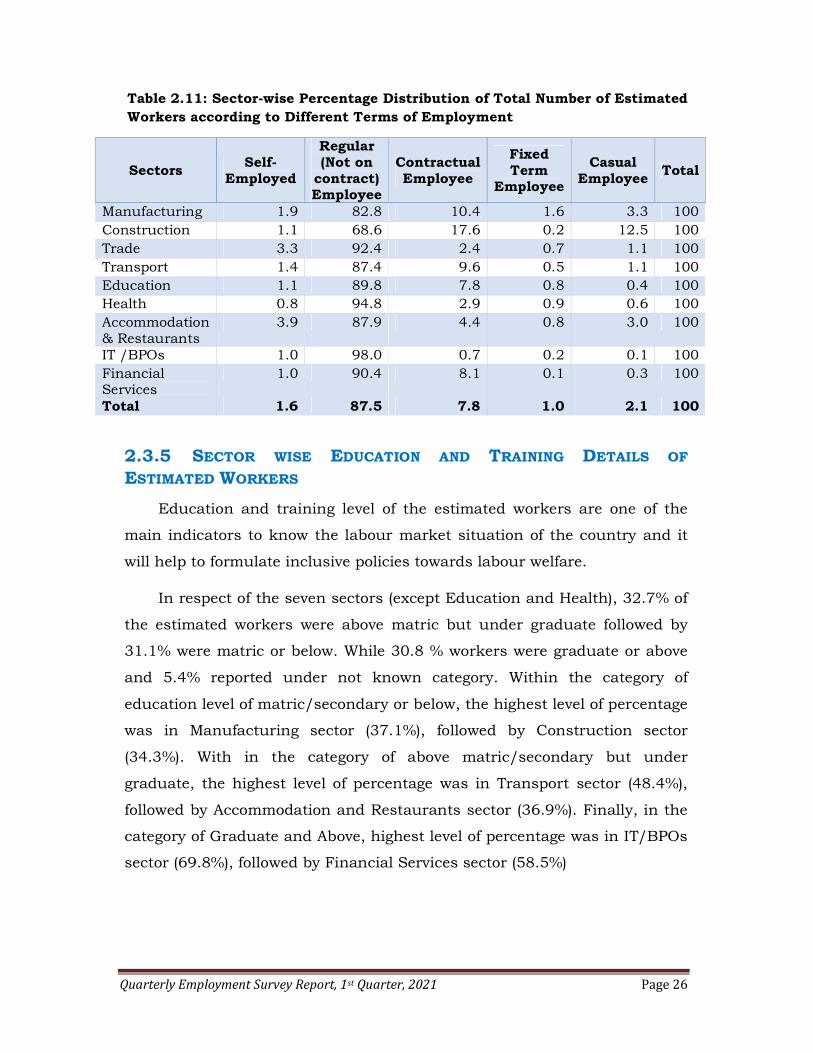
Table 2.11: Sector-wise Percentage Distribution of Total Number of Estimated Workers according to Different Terms of Employment
Sectors Self-
Employed
Regular (Not on
contract) Employee
Contractual Employee
Fixed Term
Employee
Casual Employee
Total
Manufacturing 1.9 82.8 10.4 1.6 3.3 100 Construction 1.1 68.6 17.6 0.2 12.5 100 Trade 3.3 92.4 2.4 0.7 1.1 100 Transport 1.4 87.4 9.6 0.5 1.1 100 Education 1.1 89.8 7.8 0.8 0.4 100 Health 0.8 94.8 2.9 0.9 0.6 100 Accommodation & Restaurants
3.9 87.9 4.4 0.8 3.0 100
IT /BPOs 1.0 98.0 0.7 0.2 0.1 100 Financial Services
1.0 90.4 8.1 0.1 0.3 100
Total 1.6 87.5 7.8 1.0 2.1 100
2.3.5 SECTOR WISE EDUCATION AND TRAINING DETAILS OF
ESTIMATED WORKERS
Education and training level of the estimated workers are one of the
main indicators to know the labour market situation of the country and it
will help to formulate inclusive policies towards labour welfare.
In respect of the seven sectors (except Education and Health), 32.7% of
the estimated workers were above matric but under graduate followed by
31.1% were matric or below. While 30.8 % workers were graduate or above
and 5.4% reported under not known category. Within the category of
education level of matric/secondary or below, the highest level of percentage
was in Manufacturing sector (37.1%), followed by Construction sector
(34.3%). With in the category of above matric/secondary but under
graduate, the highest level of percentage was in Transport sector (48.4%),
followed by Accommodation and Restaurants sector (36.9%). Finally, in the
category of Graduate and Above, highest level of percentage was in IT/BPOs
sector (69.8%), followed by Financial Services sector (58.5%)

Quarterly Employment Survey Report, 1st Quarter, 2021 Page 27
Table 2.12: Sector-wise estimated Number of Employed Persons according to Education Levels except Health & Education (in Lakhs)
Sl. No. Sectors
Matric/ Secondary or below
Above matric/
Secondary but Under Graduate
Graduate or above
Not known Total
1 Manufacturing 46.4 (37.1)
41.3 (33)
27.6 (22)
9.8 (7.9)
125.2 (100)
2 Construction 2.5 (34.3)
2.6 (34.8)
2.2 (29)
0.1 (1.9)
7.4 (100)
3 Trade 6.5 (32)
7.5 (36.9)
5.6 (27.6)
0.7 (3.6)
20.4 (100)
4 Transport 3.2 (23.6)
6.5 (48.4)
3.5 (25.9)
0.3 (2.1)
13.4 (100)
5 Accommodation & Restaurants
2.9 (32.6)
3.3 (36.9)
2.3 (26.1)
0.4 (4.4)
8.9 (100)
6 IT /BPOs 1.6 (7.5)
4.5 (21.9)
14.5 (69.8)
0.2 (0.8)
20.7 (100)
7 Financial Services 2.9 (16.7)
4.2 (24.3)
10.2 (58.5)
0.1 (0.6)
17.4 (100)
Total 66.9 (31.1)
70.3 (32.7)
66.1 (30.8)
11.7 (5.4)
215.0 (100)
Note-Figures in parentheses are the sector-wise percentage share in terms of education levels
Table 2.13: Distribution of Estimated Employed Persons according to Education Level for Health & Education Sector (in Lakhs) Sl. No.
Sectors Matric/ Secondary or below
Above matric/
Secondary but Under Graduate
Graduate or above
Not known
Total
1 Education 2.1 (15)
6.8 (48.1)
4.8 (33.7)
0.4 (3.2)
14.1 (100)
2 Health 0.9 (21.9)
1.4 (34.7)
1.4 (34.7)
0.3 (8.7)
3.8 (100)
Note-Figures in parentheses are the sector-wise percentage share in terms of education levels.
In Education sector (for non-teaching only) 48.1% of the estimated
workers were above matric/secondary but undergraduate, 33.7% were
graduate or above and around 15% were matric/secondary or below.
Similarly, in case of health sector (for non-clinical only), around 34.7% were
graduate or above, 34.7% were above matric/secondary but undergraduate
and 21.9% were matric/secondary or below.

Quarterly Employment Survey Report, 1st Quarter, 2021 Page 28
2.3.6. SKILL DEVELOPMENT OF THE WORKERS
Table 2.14 reveals the Sector-wise percentage distribution of estimated
establishments imparting formal skill development programs. It can be seen
from the table that about 17.9 % of the estimated establishments were
providing formal skill training. Maximum number of estimated
establishments who imparted training were reported to be in the IT/BPO
sector (29.8%) followed by Financial services (22.6%) and Education sector
(21.1%). Out of the total estimated establishments providing skill training,
about 13.6% were reported to have imparted training within the
establishments and rest 4.3% in some other establishments. Further,
establishments imparted training within the establishments, about 95.3% of
establishments imparted training to their staff only, 2.1 % to other staff and
2.7% to both categories.
Table 2.14: Sector-wise Percentage Distribution of Estimated Establishments imparting Formal Skill Development Programs
Sl. No
Sectors
Percentage share of Establishments providing
Skill Training
Skill Development Program
Conducted for (in %)
Within Establishm
ent
In some other
Establishment
Total Staff only
Others
Both
1 Manufacturing 15.5 1.9 17.4 96.1 1.6 2.2
2 Construction 10.2 5.3 15.5 96.9 3.1 0
3 Trade 8.6 2.6 11.2 97.7 0.9 1.4
4 Transport 9.1 3.9 13 87.7 0 12.
3 5 Education 16.1 5 21.1 96.1 1.2 2.7
6 Health 12.6 7.6 20.2 97.1 0 2.9
7 Accommodation & Restaurants
5.5 1.6 7.1 85.8 4.7 9.4
8 IT /BPOs 22.5 7.3 29.8 79.9 9.9 10.
2 9 Financial Services 9.9 12.7 22.6 89.6 10.1 0.3
Total 13.6 4.3 17.9 95.3 2.1 2.7
Quarterly Employment Survey Report, 1st Quarter, 2021 Page 29
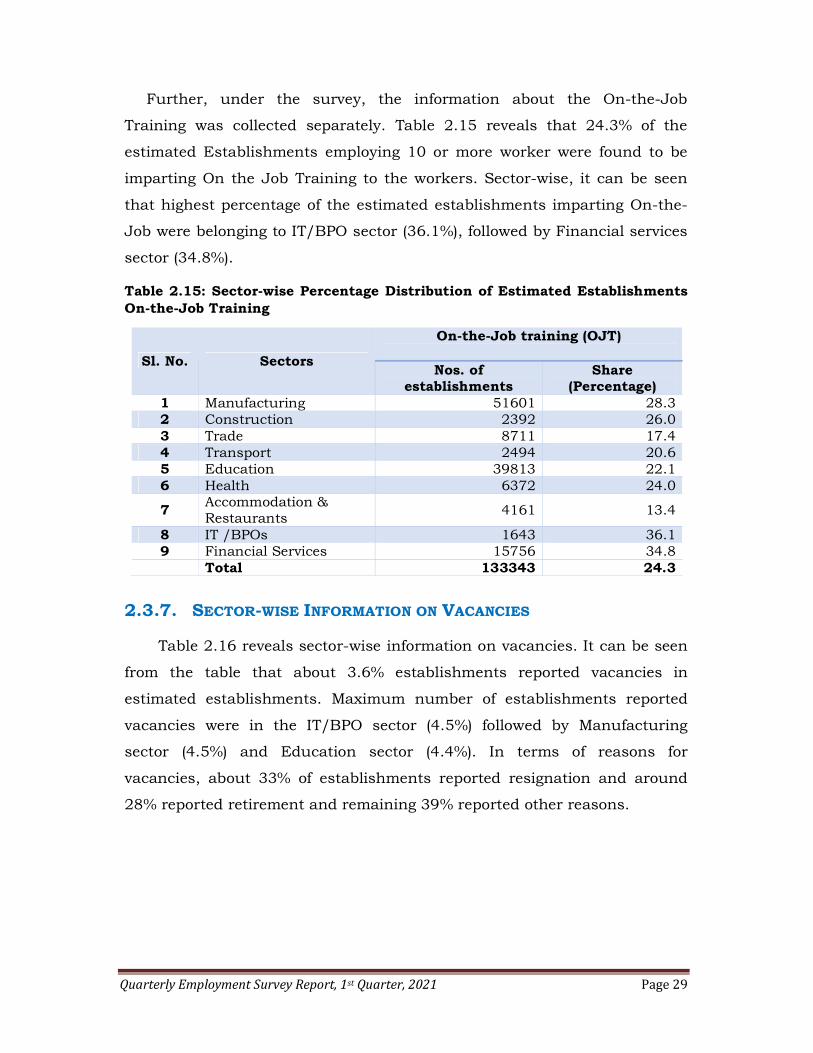
Further, under the survey, the information about the On-the-Job
Training was collected separately. Table 2.15 reveals that 24.3% of the
estimated Establishments employing 10 or more worker were found to be
imparting On the Job Training to the workers. Sector-wise, it can be seen
that highest percentage of the estimated establishments imparting On-the-
Job were belonging to IT/BPO sector (36.1%), followed by Financial services
sector (34.8%).
Table 2.15: Sector-wise Percentage Distribution of Estimated Establishments On-the-Job Training
Sl. No. Sectors
On-the-Job training (OJT)
Nos. of establishments
Share (Percentage)
1 Manufacturing 51601 28.3 2 Construction 2392 26.0 3 Trade 8711 17.4 4 Transport 2494 20.6 5 Education 39813 22.1 6 Health 6372 24.0
7 Accommodation & Restaurants
4161 13.4
8 IT /BPOs 1643 36.1 9 Financial Services 15756 34.8
Total 133343 24.3
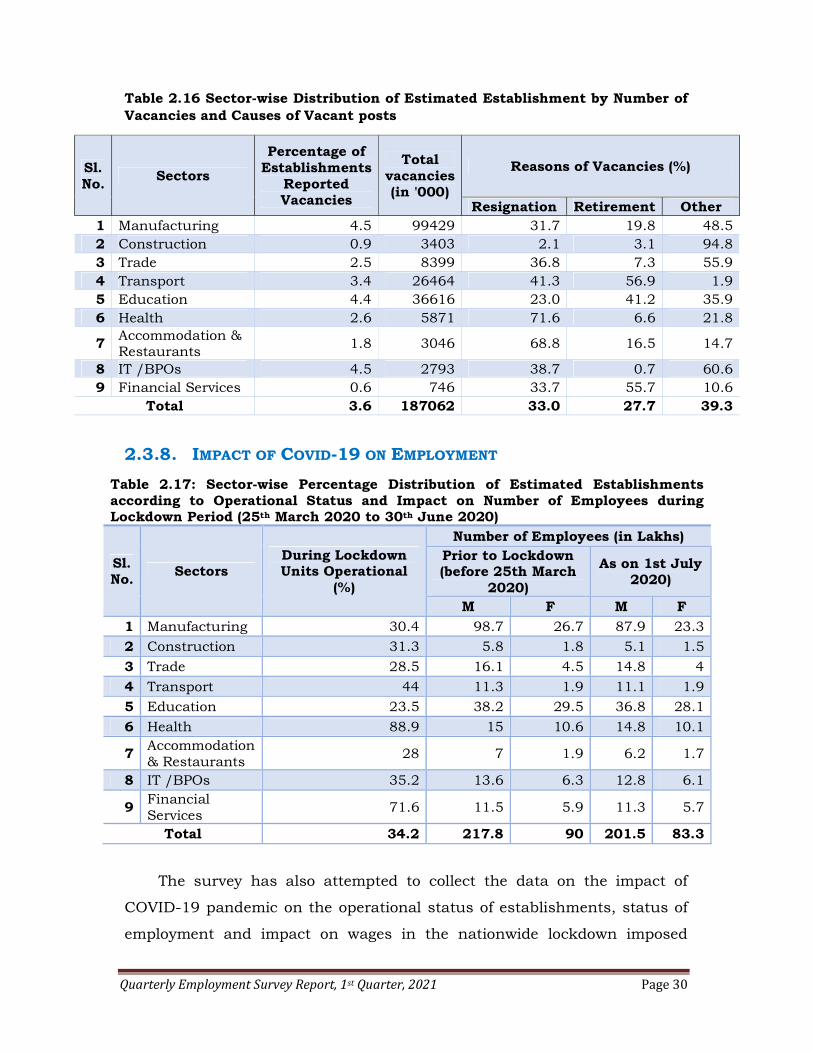
2.3.7. SECTOR-WISE INFORMATION ON VACANCIES
Table 2.16 reveals sector-wise information on vacancies. It can be seen
from the table that about 3.6% establishments reported vacancies in
estimated establishments. Maximum number of establishments reported
vacancies were in the IT/BPO sector (4.5%) followed by Manufacturing
sector (4.5%) and Education sector (4.4%). In terms of reasons for
vacancies, about 33% of establishments reported resignation and around
28% reported retirement and remaining 39% reported other reasons.
Quarterly Employment Survey Report, 1st Quarter, 2021 Page 30
Table 2.16 Sector-wise Distribution of Estimated Establishment by Number of Vacancies and Causes of Vacant posts
Sl. No.
Sectors
Percentage of Establishments
Reported Vacancies
Total vacancies (in '000)
Reasons of Vacancies (%)
Resignation Retirement Other 1 Manufacturing 4.5 99429 31.7 19.8 48.5 2 Construction 0.9 3403 2.1 3.1 94.8 3 Trade 2.5 8399 36.8 7.3 55.9 4 Transport 3.4 26464 41.3 56.9 1.9 5 Education 4.4 36616 23.0 41.2 35.9 6 Health 2.6 5871 71.6 6.6 21.8
7 Accommodation & Restaurants
1.8 3046 68.8 16.5 14.7
8 IT /BPOs 4.5 2793 38.7 0.7 60.6 9 Financial Services 0.6 746 33.7 55.7 10.6
Total 3.6 187062 33.0 27.7 39.3
2.3.8. IMPACT OF COVID-19 ON EMPLOYMENT
Table 2.17: Sector-wise Percentage Distribution of Estimated Establishments according to Operational Status and Impact on Number of Employees during Lockdown Period (25th March 2020 to 30th June 2020)
Sl. No.
Sectors During Lockdown Units Operational
(%)
Number of Employees (in Lakhs) Prior to Lockdown (before 25th March
2020)
As on 1st July 2020)
M F M F 1 Manufacturing 30.4 98.7 26.7 87.9 23.3
2 Construction 31.3 5.8 1.8 5.1 1.5
3 Trade 28.5 16.1 4.5 14.8 4
4 Transport 44 11.3 1.9 11.1 1.9
5 Education 23.5 38.2 29.5 36.8 28.1
6 Health 88.9 15 10.6 14.8 10.1
7 Accommodation & Restaurants
28 7 1.9 6.2 1.7
8 IT /BPOs 35.2 13.6 6.3 12.8 6.1
9 Financial Services
71.6 11.5 5.9 11.3 5.7
Total 34.2 217.8 90 201.5 83.3
The survey has also attempted to collect the data on the impact of
COVID-19 pandemic on the operational status of establishments, status of
employment and impact on wages in the nationwide lockdown imposed
Quarterly Employment Survey Report, 1st Quarter, 2021 Page 31
during the period from 25th March, 2020 to 30th June, 2020. The sector wise
percentage distribution of estimated establishments in terms of their
operational status during this period is summarized in table 2.17. It can be
seen that highest number of establishments were operational during
nationwide lockdown in the Health Sector (88.9%) followed by Financial
Services sector (71.6%). It can be seen that highest number of
establishments were non-operational during nationwide lockdown in
education sector (76.5%), Accommodation and Restaurants sector (72%)
and Trade sector (71.5%).
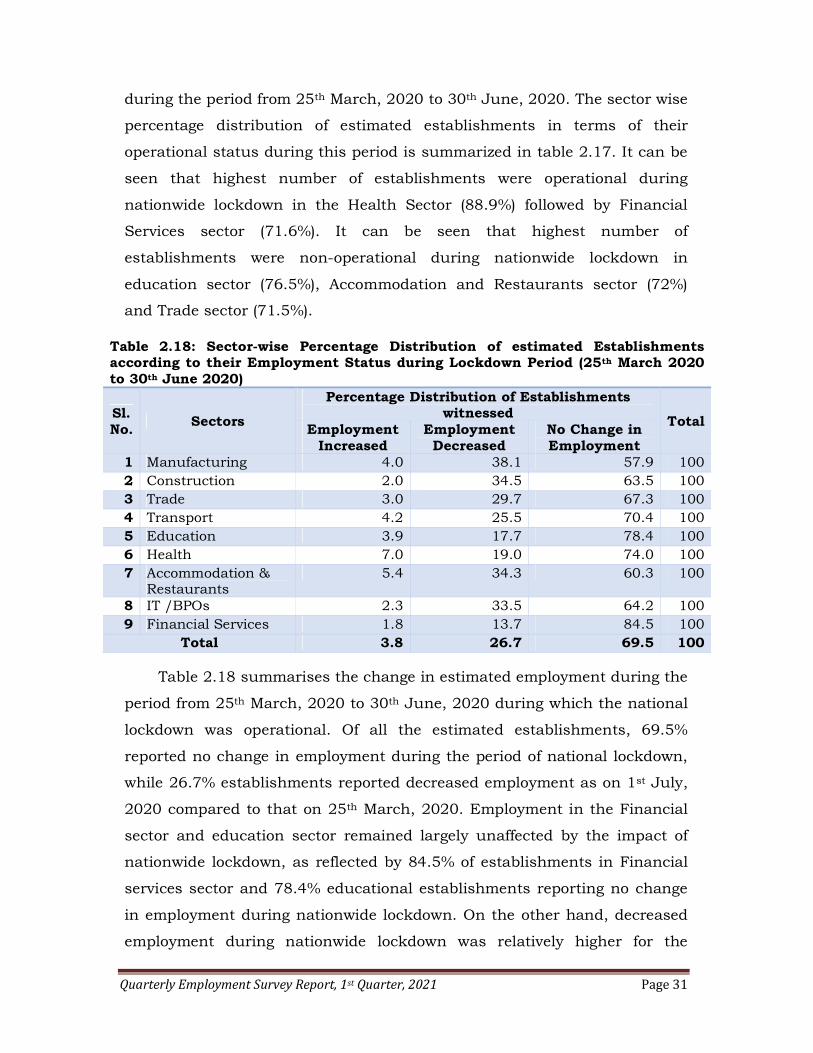
Table 2.18: Sector-wise Percentage Distribution of estimated Establishments according to their Employment Status during Lockdown Period (25th March 2020 to 30th June 2020)
Sl. No.
Sectors
Percentage Distribution of Establishments witnessed
Total Employment
Increased Employment Decreased
No Change in Employment
1 Manufacturing 4.0 38.1 57.9 100 2 Construction 2.0 34.5 63.5 100 3 Trade 3.0 29.7 67.3 100 4 Transport 4.2 25.5 70.4 100 5 Education 3.9 17.7 78.4 100 6 Health 7.0 19.0 74.0 100 7 Accommodation &
Restaurants 5.4 34.3 60.3 100
8 IT /BPOs 2.3 33.5 64.2 100 9 Financial Services 1.8 13.7 84.5 100
Total 3.8 26.7 69.5 100
Table 2.18 summarises the change in estimated employment during the
period from 25th March, 2020 to 30th June, 2020 during which the national
lockdown was operational. Of all the estimated establishments, 69.5%
reported no change in employment during the period of national lockdown,
while 26.7% establishments reported decreased employment as on 1st July,
2020 compared to that on 25th March, 2020. Employment in the Financial
sector and education sector remained largely unaffected by the impact of
nationwide lockdown, as reflected by 84.5% of establishments in Financial
services sector and 78.4% educational establishments reporting no change
in employment during nationwide lockdown. On the other hand, decreased
employment during nationwide lockdown was relatively higher for the
Quarterly Employment Survey Report, 1st Quarter, 2021 Page 32
Manufacturing sector, Construction sector and Accommodation and
Restaurants sector. Of all the estimated establishments in the respective
sectors, 38.1% establishments in Manufacturing sector, 34.5%
establishments in the Construction sector and 34.3% establishments in the
Accommodation and Restaurants sector reported decreased employment
during the nationwide lockdown. Health sector registered highest
percentage share (7.0%) of estimated establishments reporting increase in
employment during the nationwide lockdown. Table 2.18 gives detailed
information about change in employment during nationwide lockdown
among the estimated establishments.
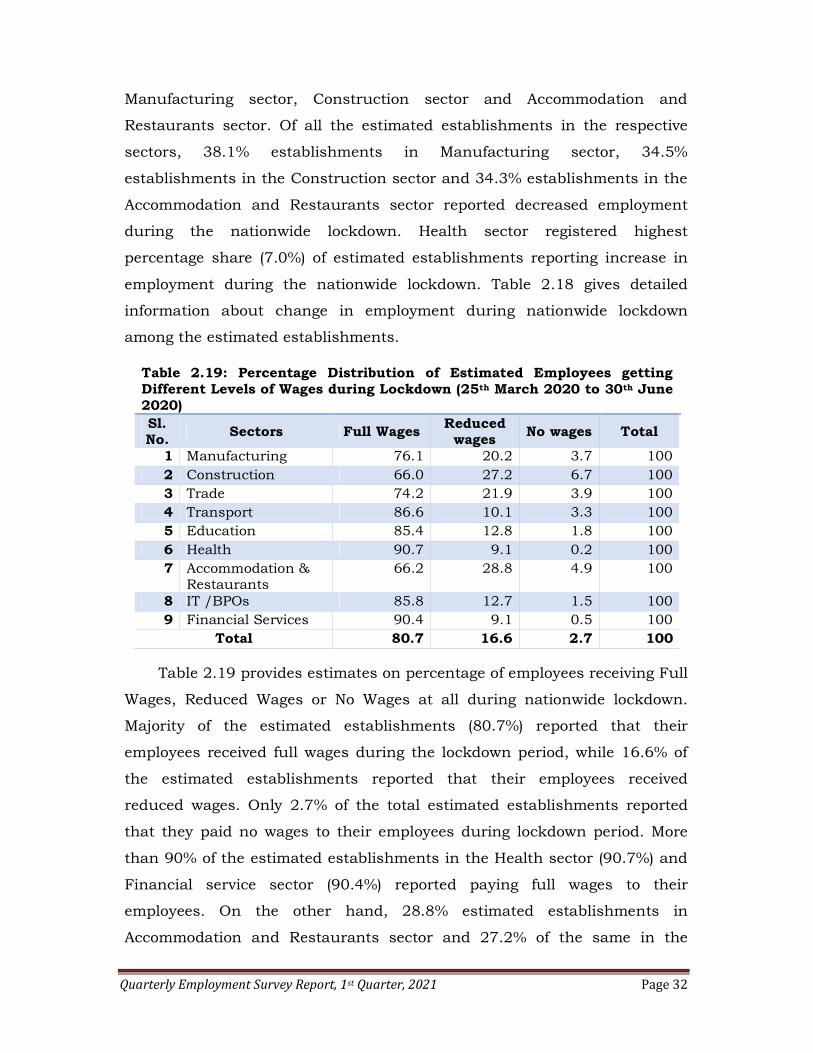
Table 2.19: Percentage Distribution of Estimated Employees getting Different Levels of Wages during Lockdown (25th March 2020 to 30th June 2020) Sl. No. Sectors Full Wages
Reduced wages No wages Total
1 Manufacturing 76.1 20.2 3.7 100 2 Construction 66.0 27.2 6.7 100 3 Trade 74.2 21.9 3.9 100 4 Transport 86.6 10.1 3.3 100 5 Education 85.4 12.8 1.8 100 6 Health 90.7 9.1 0.2 100 7 Accommodation &
Restaurants 66.2 28.8 4.9 100
8 IT /BPOs 85.8 12.7 1.5 100 9 Financial Services 90.4 9.1 0.5 100
Total 80.7 16.6 2.7 100
Table 2.19 provides estimates on percentage of employees receiving Full
Wages, Reduced Wages or No Wages at all during nationwide lockdown.
Majority of the estimated establishments (80.7%) reported that their
employees received full wages during the lockdown period, while 16.6% of
the estimated establishments reported that their employees received
reduced wages. Only 2.7% of the total estimated establishments reported
that they paid no wages to their employees during lockdown period. More
than 90% of the estimated establishments in the Health sector (90.7%) and
Financial service sector (90.4%) reported paying full wages to their
employees. On the other hand, 28.8% estimated establishments in
Accommodation and Restaurants sector and 27.2% of the same in the
Quarterly Employment Survey Report, 1st Quarter, 2021 Page 33
Construction reported that their employees received reduced wages. Highest
percentage share of the estimated establishments reporting that their
employees received no wages during nationwide lockdown was in the
Construction (6.7%) and Accommodation and Restaurants (4.9%) sectors.
Quarterly Employment Survey Report, 1st Quarter, 2021 Page 34
ANNEXURE-I
TABLES BASED ON SAMPLE RESULTS
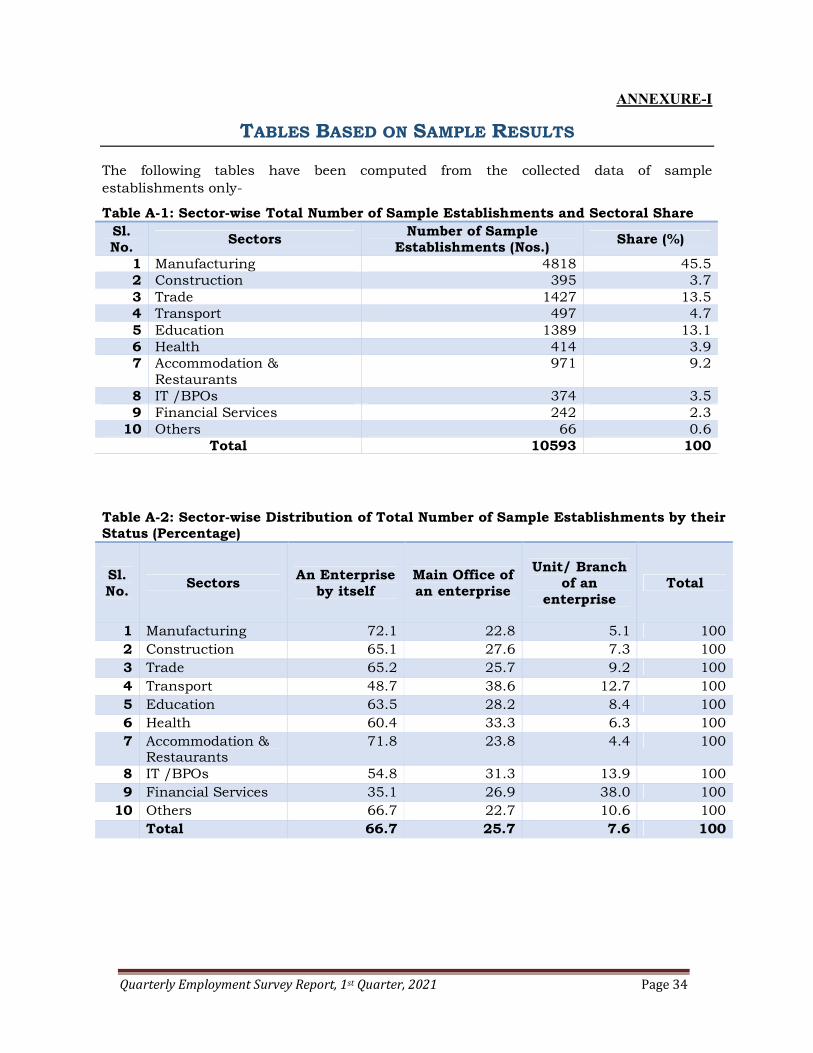
The following tables have been computed from the collected data of sample establishments only-
Table A-1: Sector-wise Total Number of Sample Establishments and Sectoral Share Sl. No.
Sectors Number of Sample Establishments (Nos.)
Share (%)
1 Manufacturing 4818 45.5 2 Construction 395 3.7 3 Trade 1427 13.5 4 Transport 497 4.7 5 Education 1389 13.1 6 Health 414 3.9 7 Accommodation &
Restaurants 971 9.2
8 IT /BPOs 374 3.5 9 Financial Services 242 2.3
10 Others 66 0.6 Total 10593 100
Table A-2: Sector-wise Distribution of Total Number of Sample Establishments by their Status (Percentage)
Sl. No.
Sectors An Enterprise
by itself Main Office of an enterprise
Unit/ Branch of an
enterprise Total
1 Manufacturing 72.1 22.8 5.1 100 2 Construction 65.1 27.6 7.3 100 3 Trade 65.2 25.7 9.2 100 4 Transport 48.7 38.6 12.7 100 5 Education 63.5 28.2 8.4 100 6 Health 60.4 33.3 6.3 100 7 Accommodation &
Restaurants 71.8 23.8 4.4 100
8 IT /BPOs 54.8 31.3 13.9 100 9 Financial Services 35.1 26.9 38.0 100
10 Others 66.7 22.7 10.6 100 Total 66.7 25.7 7.6 100

Quarterly Employment Survey Report, 1st Quarter, 2021 Page 35
Table A-3: Sector-wise Percentage Distribution of Sample Establishments according to Current Operational Status
Sl. No.
Sectors Fully
operational Partly
operational Total
1 Manufacturing 77.5 22.5 100 2 Construction 77.0 23.0 100 3 Trade 78.4 21.7 100 4 Transport 84.3 15.7 100 5 Education 64.4 35.6 100 6 Health 91.8 8.2 100 7 Accommodation &
Restaurants 69.0 31.0 100
8 IT /BPOs 79.4 20.6 100 9 Financial Services 93.0 7.0 100
10 Others 75.8 24.2 100 Total 76.4 23.6 100
Table A-4: Sector-wise Percentage Distribution of Sample Establishments Registered under MSME Act/Udyam portal registration.
Sl. No.
Sectors Registered
under MSME Act (%)
Registered Under MSME Act through
Udyam portal (%)
Number of MSMEs (Nos.)
Total Number of Establishments
(Nos.)
1 Manufacturing 44.5 85.9 2145 4818 2 Construction 17.0 88.1 67 395 3 Trade 3.9 85.5 55 1427 4 Transport 14.9 86.5 74 497 5 Education 2.2 80.7 31 1389 6 Health 5.8 91.7 24 414 7 Accommodation
& Restaurants 8.1 81.0 79 971
8 IT /BPOs 24.3 90.1 91 374 9 Financial
Services 3.7 88.9 9 242
10 Others 15.2 100.0 10 66 Total 24.4 86.0 2585 10593
Quarterly Employment Survey Report, 1st Quarter, 2021 Page 36
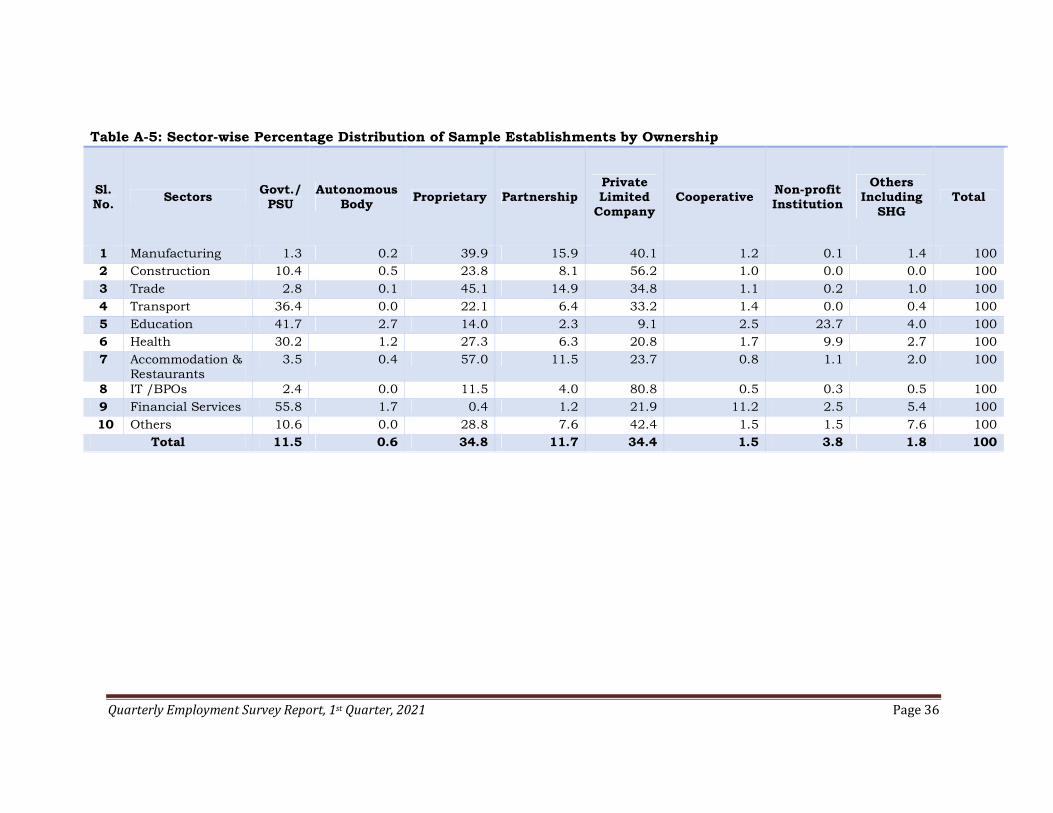
Table A-5: Sector-wise Percentage Distribution of Sample Establishments by Ownership
Sl. No.
Sectors Govt./ PSU
Autonomous Body
Proprietary Partnership Private Limited
Company Cooperative
Non-profit Institution
Others Including
SHG Total
1 Manufacturing 1.3 0.2 39.9 15.9 40.1 1.2 0.1 1.4 100 2 Construction 10.4 0.5 23.8 8.1 56.2 1.0 0.0 0.0 100
3 Trade 2.8 0.1 45.1 14.9 34.8 1.1 0.2 1.0 100
4 Transport 36.4 0.0 22.1 6.4 33.2 1.4 0.0 0.4 100
5 Education 41.7 2.7 14.0 2.3 9.1 2.5 23.7 4.0 100 6 Health 30.2 1.2 27.3 6.3 20.8 1.7 9.9 2.7 100
7 Accommodation & Restaurants
3.5 0.4 57.0 11.5 23.7 0.8 1.1 2.0 100
8 IT /BPOs 2.4 0.0 11.5 4.0 80.8 0.5 0.3 0.5 100
9 Financial Services 55.8 1.7 0.4 1.2 21.9 11.2 2.5 5.4 100
10 Others 10.6 0.0 28.8 7.6 42.4 1.5 1.5 7.6 100 Total 11.5 0.6 34.8 11.7 34.4 1.5 3.8 1.8 100
Quarterly Employment Survey Report, 1st Quarter, 2021 Page 37
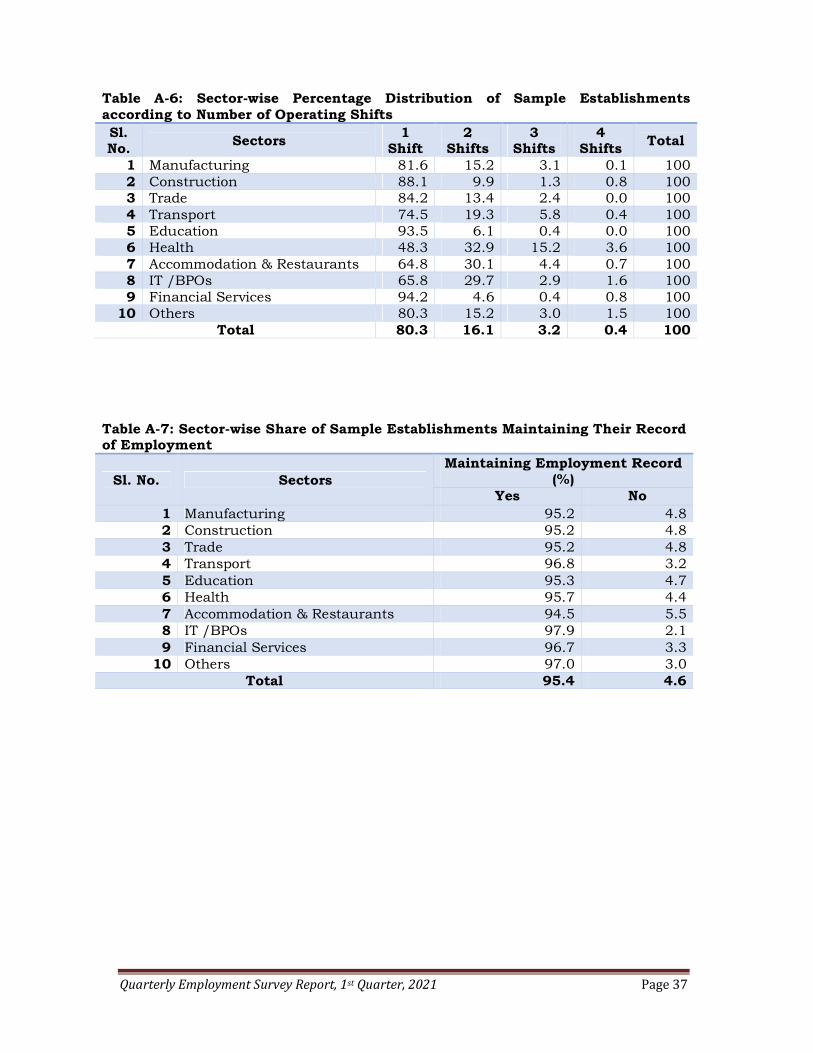
Table A-6: Sector-wise Percentage Distribution of Sample Establishments according to Number of Operating Shifts Sl. No. Sectors
1 Shift
2 Shifts
3 Shifts
4 Shifts Total
1 Manufacturing 81.6 15.2 3.1 0.1 100 2 Construction 88.1 9.9 1.3 0.8 100 3 Trade 84.2 13.4 2.4 0.0 100 4 Transport 74.5 19.3 5.8 0.4 100 5 Education 93.5 6.1 0.4 0.0 100 6 Health 48.3 32.9 15.2 3.6 100 7 Accommodation & Restaurants 64.8 30.1 4.4 0.7 100 8 IT /BPOs 65.8 29.7 2.9 1.6 100 9 Financial Services 94.2 4.6 0.4 0.8 100
10 Others 80.3 15.2 3.0 1.5 100 Total 80.3 16.1 3.2 0.4 100
Table A-7: Sector-wise Share of Sample Establishments Maintaining Their Record of Employment
Sl. No. Sectors Maintaining Employment Record
(%) Yes No
1 Manufacturing 95.2 4.8 2 Construction 95.2 4.8 3 Trade 95.2 4.8 4 Transport 96.8 3.2 5 Education 95.3 4.7 6 Health 95.7 4.4 7 Accommodation & Restaurants 94.5 5.5 8 IT /BPOs 97.9 2.1 9 Financial Services 96.7 3.3
10 Others 97.0 3.0 Total 95.4 4.6
Quarterly Employment Survey Report, 1st Quarter, 2021 Page 38
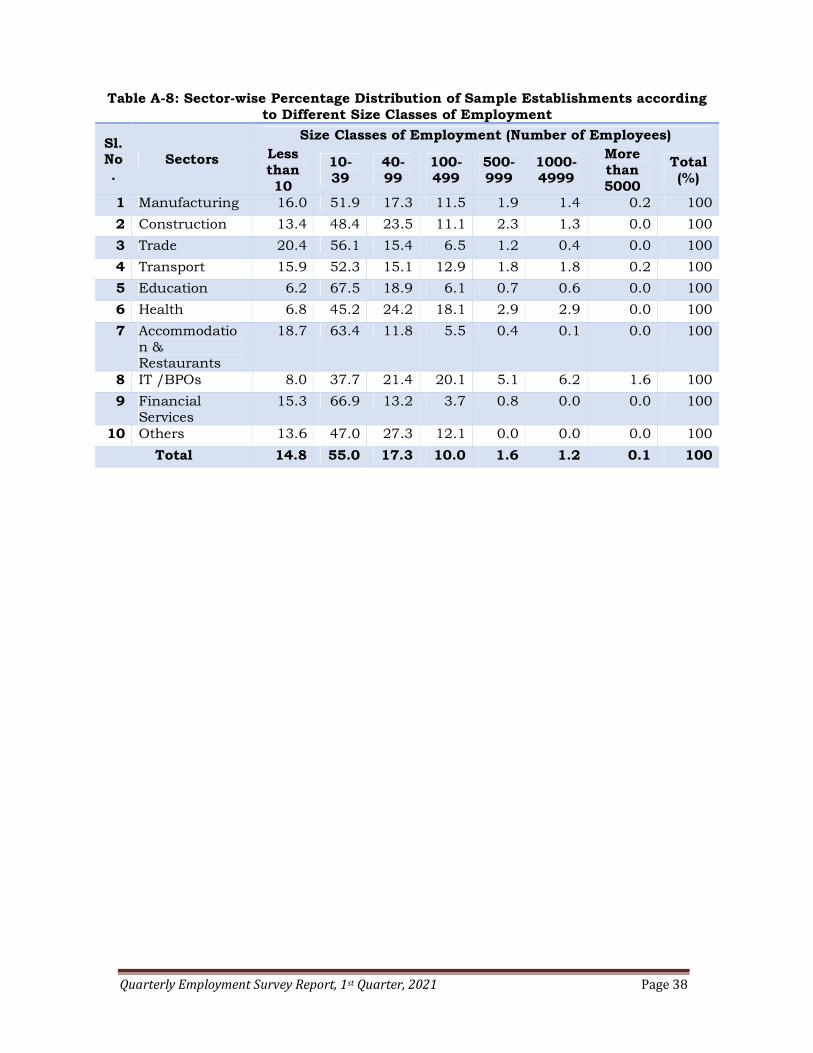
Table A-8: Sector-wise Percentage Distribution of Sample Establishments according to Different Size Classes of Employment
Sl. No.
Sectors
Size Classes of Employment (Number of Employees) Less than 10
10-39
40-99
100-499
500-999
1000-4999
More than 5000
Total (%)
1 Manufacturing 16.0 51.9 17.3 11.5 1.9 1.4 0.2 100
2 Construction 13.4 48.4 23.5 11.1 2.3 1.3 0.0 100
3 Trade 20.4 56.1 15.4 6.5 1.2 0.4 0.0 100
4 Transport 15.9 52.3 15.1 12.9 1.8 1.8 0.2 100
5 Education 6.2 67.5 18.9 6.1 0.7 0.6 0.0 100
6 Health 6.8 45.2 24.2 18.1 2.9 2.9 0.0 100
7 Accommodation & Restaurants
18.7 63.4 11.8 5.5 0.4 0.1 0.0 100
8 IT /BPOs 8.0 37.7 21.4 20.1 5.1 6.2 1.6 100
9 Financial Services
15.3 66.9 13.2 3.7 0.8 0.0 0.0 100
10 Others 13.6 47.0 27.3 12.1 0.0 0.0 0.0 100
Total 14.8 55.0 17.3 10.0 1.6 1.2 0.1 100
Quarterly Employment Survey Report, 1st Quarter, 2021 Page 39
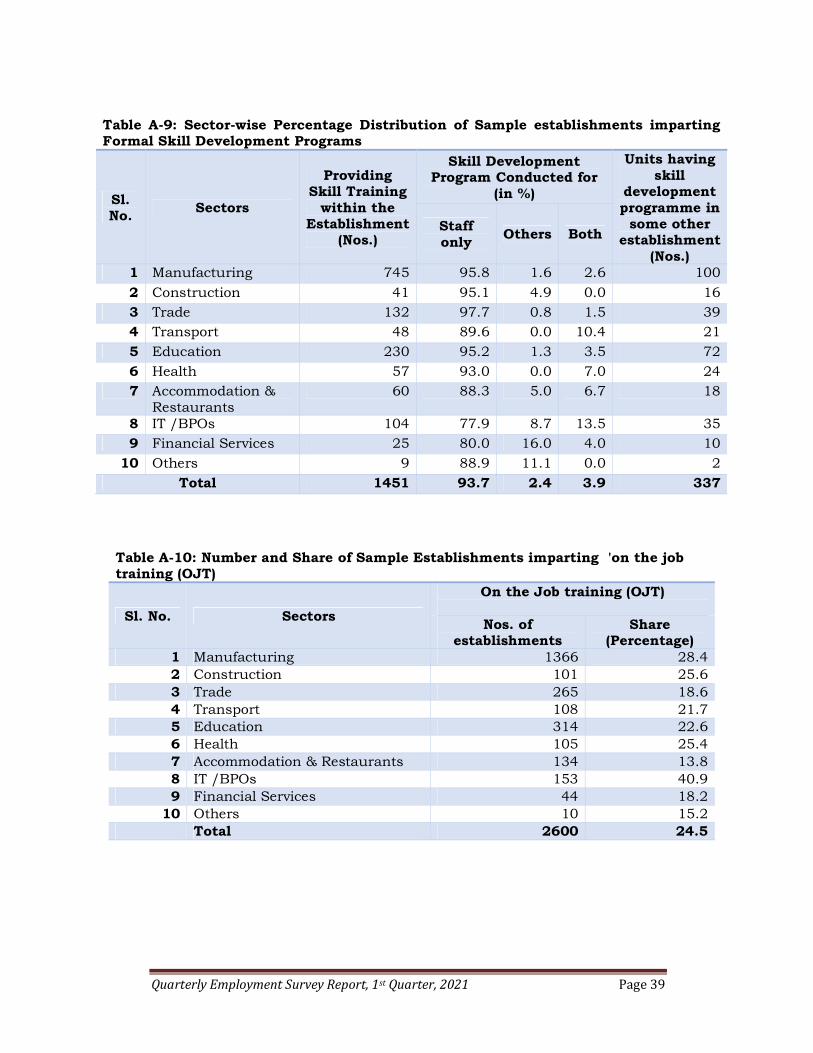
Table A-9: Sector-wise Percentage Distribution of Sample establishments imparting Formal Skill Development Programs
Sl. No. Sectors
Providing Skill Training
within the Establishment
(Nos.)
Skill Development Program Conducted for
(in %)
Units having skill
development programme in
some other establishment
(Nos.)
Staff only
Others Both
1 Manufacturing 745 95.8 1.6 2.6 100
2 Construction 41 95.1 4.9 0.0 16
3 Trade 132 97.7 0.8 1.5 39
4 Transport 48 89.6 0.0 10.4 21
5 Education 230 95.2 1.3 3.5 72
6 Health 57 93.0 0.0 7.0 24
7 Accommodation & Restaurants
60 88.3 5.0 6.7 18
8 IT /BPOs 104 77.9 8.7 13.5 35
9 Financial Services 25 80.0 16.0 4.0 10
10 Others 9 88.9 11.1 0.0 2
Total 1451 93.7 2.4 3.9 337
Table A-10: Number and Share of Sample Establishments imparting 'on the job training (OJT)
Sl. No. Sectors
On the Job training (OJT)
Nos. of establishments
Share (Percentage)
1 Manufacturing 1366 28.4 2 Construction 101 25.6 3 Trade 265 18.6 4 Transport 108 21.7 5 Education 314 22.6 6 Health 105 25.4 7 Accommodation & Restaurants 134 13.8 8 IT /BPOs 153 40.9 9 Financial Services 44 18.2
10 Others 10 15.2 Total 2600 24.5
Quarterly Employment Survey Report, 1st Quarter, 2021 Page 40
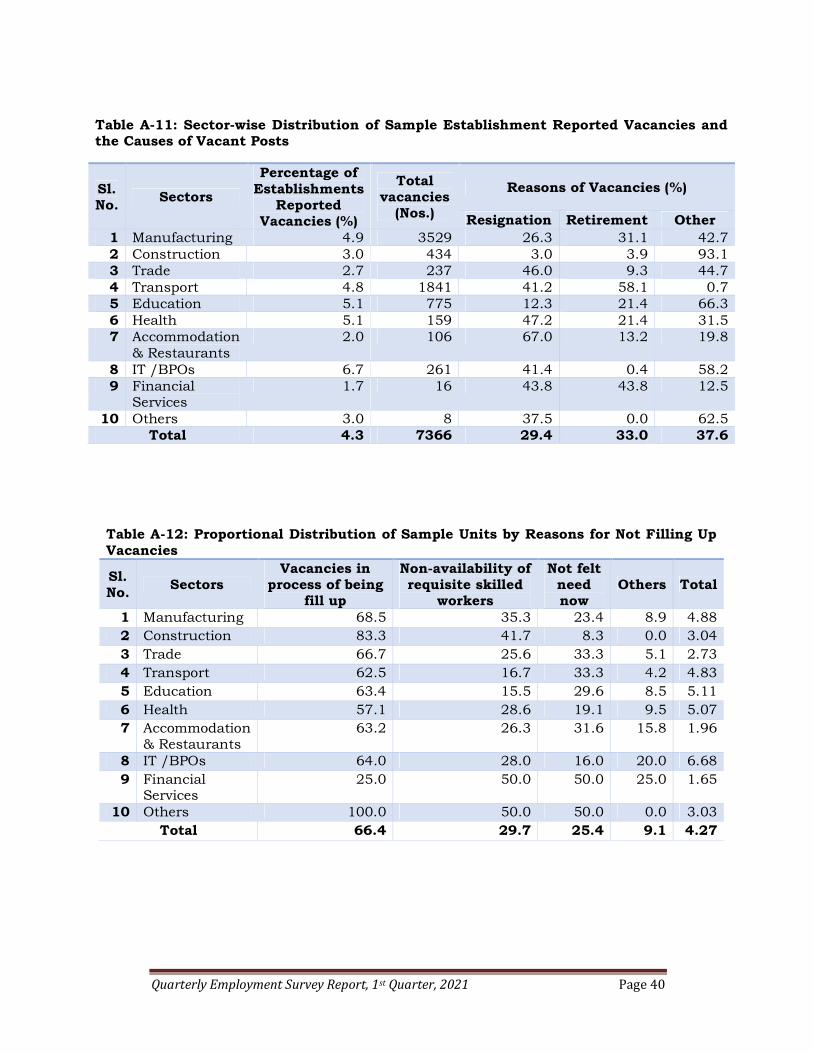
Table A-11: Sector-wise Distribution of Sample Establishment Reported Vacancies and the Causes of Vacant Posts
Sl. No.
Sectors
Percentage of Establishments
Reported Vacancies (%)
Total vacancies
(Nos.)
Reasons of Vacancies (%)
Resignation Retirement Other 1 Manufacturing 4.9 3529 26.3 31.1 42.7 2 Construction 3.0 434 3.0 3.9 93.1 3 Trade 2.7 237 46.0 9.3 44.7 4 Transport 4.8 1841 41.2 58.1 0.7 5 Education 5.1 775 12.3 21.4 66.3 6 Health 5.1 159 47.2 21.4 31.5 7 Accommodation
& Restaurants 2.0 106 67.0 13.2 19.8
8 IT /BPOs 6.7 261 41.4 0.4 58.2 9 Financial
Services 1.7 16 43.8 43.8 12.5
10 Others 3.0 8 37.5 0.0 62.5 Total 4.3 7366 29.4 33.0 37.6
Table A-12: Proportional Distribution of Sample Units by Reasons for Not Filling Up Vacancies
Sl. No. Sectors
Vacancies in process of being
fill up
Non-availability of requisite skilled
workers
Not felt need now
Others Total
1 Manufacturing 68.5 35.3 23.4 8.9 4.88 2 Construction 83.3 41.7 8.3 0.0 3.04 3 Trade 66.7 25.6 33.3 5.1 2.73 4 Transport 62.5 16.7 33.3 4.2 4.83 5 Education 63.4 15.5 29.6 8.5 5.11 6 Health 57.1 28.6 19.1 9.5 5.07 7 Accommodation
& Restaurants 63.2 26.3 31.6 15.8 1.96
8 IT /BPOs 64.0 28.0 16.0 20.0 6.68 9 Financial
Services 25.0 50.0 50.0 25.0 1.65
10 Others 100.0 50.0 50.0 0.0 3.03 Total 66.4 29.7 25.4 9.1 4.27
Quarterly Employment Survey Report, 1st Quarter, 2021 Page 41
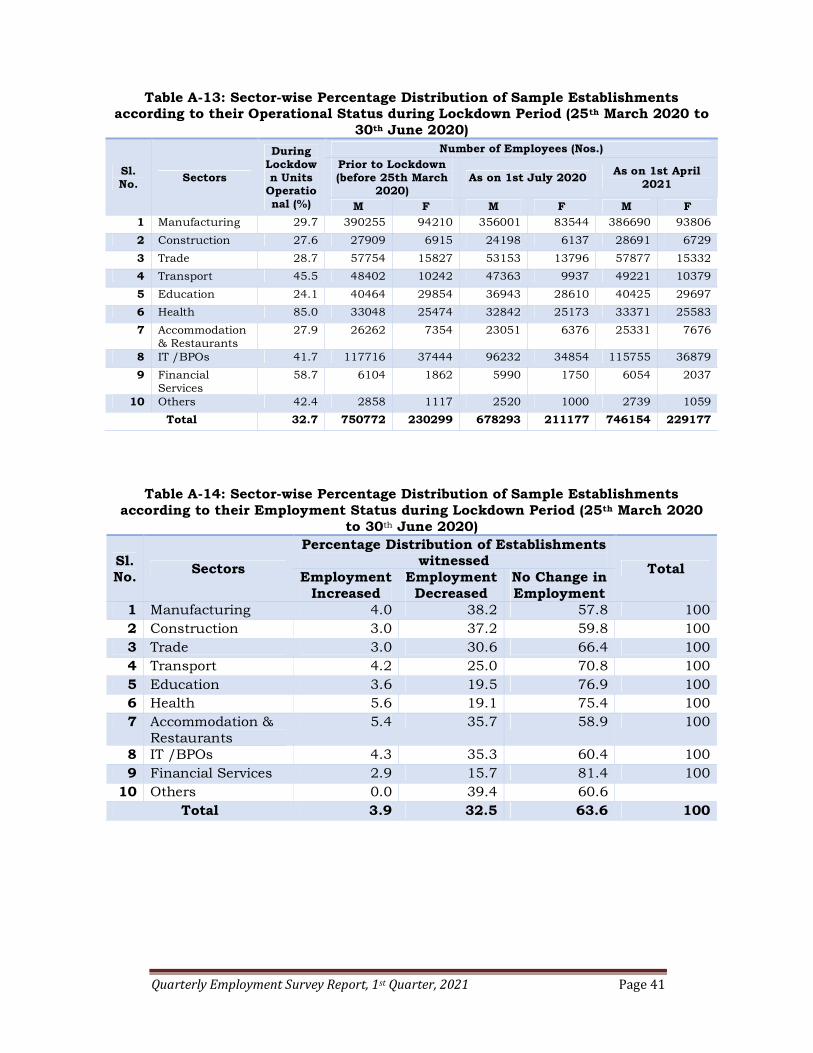
Table A-13: Sector-wise Percentage Distribution of Sample Establishments according to their Operational Status during Lockdown Period (25th March 2020 to
30th June 2020)
Sl. No. Sectors
During Lockdown Units
Operational (%)
Number of Employees (Nos.) Prior to Lockdown (before 25th March
2020) As on 1st July 2020
As on 1st April 2021
M F M F M F 1 Manufacturing 29.7 390255 94210 356001 83544 386690 93806
2 Construction 27.6 27909 6915 24198 6137 28691 6729
3 Trade 28.7 57754 15827 53153 13796 57877 15332
4 Transport 45.5 48402 10242 47363 9937 49221 10379
5 Education 24.1 40464 29854 36943 28610 40425 29697
6 Health 85.0 33048 25474 32842 25173 33371 25583
7 Accommodation & Restaurants
27.9 26262 7354 23051 6376 25331 7676
8 IT /BPOs 41.7 117716 37444 96232 34854 115755 36879
9 Financial Services
58.7 6104 1862 5990 1750 6054 2037
10 Others 42.4 2858 1117 2520 1000 2739 1059
Total 32.7 750772 230299 678293 211177 746154 229177
Table A-14: Sector-wise Percentage Distribution of Sample Establishments according to their Employment Status during Lockdown Period (25th March 2020
to 30th June 2020)
Sl. No.
Sectors
Percentage Distribution of Establishments witnessed
Total Employment
Increased Employment Decreased
No Change in Employment
1 Manufacturing 4.0 38.2 57.8 100 2 Construction 3.0 37.2 59.8 100 3 Trade 3.0 30.6 66.4 100 4 Transport 4.2 25.0 70.8 100 5 Education 3.6 19.5 76.9 100 6 Health 5.6 19.1 75.4 100 7 Accommodation &
Restaurants 5.4 35.7 58.9 100
8 IT /BPOs 4.3 35.3 60.4 100 9 Financial Services 2.9 15.7 81.4 100
10 Others 0.0 39.4 60.6 Total 3.9 32.5 63.6 100
Quarterly Employment Survey Report, 1st Quarter, 2021 Page 42
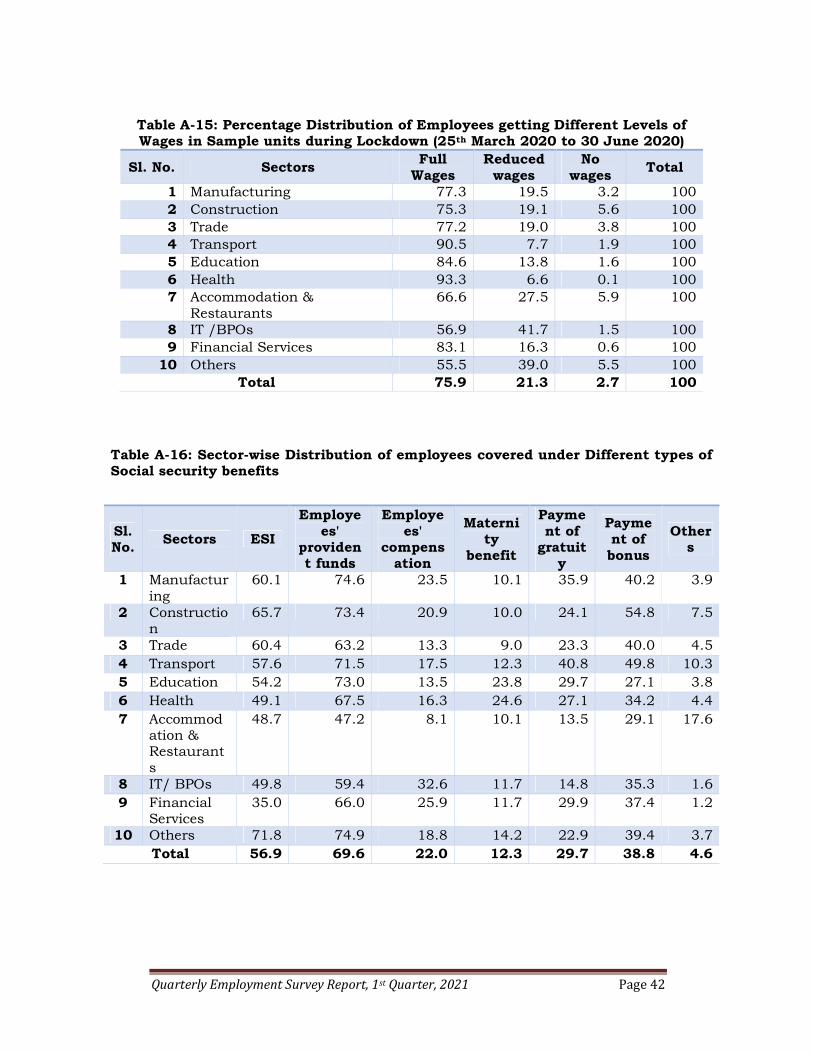
Table A-15: Percentage Distribution of Employees getting Different Levels of Wages in Sample units during Lockdown (25th March 2020 to 30 June 2020)
Sl. No. Sectors Full
Wages Reduced
wages No
wages Total
1 Manufacturing 77.3 19.5 3.2 100 2 Construction 75.3 19.1 5.6 100 3 Trade 77.2 19.0 3.8 100 4 Transport 90.5 7.7 1.9 100 5 Education 84.6 13.8 1.6 100 6 Health 93.3 6.6 0.1 100 7 Accommodation &
Restaurants 66.6 27.5 5.9 100
8 IT /BPOs 56.9 41.7 1.5 100 9 Financial Services 83.1 16.3 0.6 100
10 Others 55.5 39.0 5.5 100 Total 75.9 21.3 2.7 100
Table A-16: Sector-wise Distribution of employees covered under Different types of Social security benefits
Sl. No.
Sectors ESI
Employees'
provident funds
Employees'
compensation
Maternity
benefit
Payment of
gratuity
Payment of bonus
Others
1 Manufacturing
60.1 74.6 23.5 10.1 35.9 40.2 3.9
2 Construction
65.7 73.4 20.9 10.0 24.1 54.8 7.5
3 Trade 60.4 63.2 13.3 9.0 23.3 40.0 4.5 4 Transport 57.6 71.5 17.5 12.3 40.8 49.8 10.3 5 Education 54.2 73.0 13.5 23.8 29.7 27.1 3.8 6 Health 49.1 67.5 16.3 24.6 27.1 34.2 4.4 7 Accommod
ation & Restaurants
48.7 47.2 8.1 10.1 13.5 29.1 17.6
8 IT/ BPOs 49.8 59.4 32.6 11.7 14.8 35.3 1.6 9 Financial
Services 35.0 66.0 25.9 11.7 29.9 37.4 1.2
10 Others 71.8 74.9 18.8 14.2 22.9 39.4 3.7 Total 56.9 69.6 22.0 12.3 29.7 38.8 4.6
Quarterly Employment Survey Report, 1st Quarter, 2021 Page 43
ANNEXURE-II
CONCEPTS AND DEFINITIONS
The important concepts and definitions adopted for the Quarterly
Employment Survey (QES) are explained below:
2.1 Enterprise
Enterprise is an undertaking engaged in production and/or
distribution of goods and/or services other than for the sole purpose
of own consumption, which has autonomy in respect of financial and
investment decision making, as well as the authority for allocating
resources for production of goods and services. It may be engaged in
one or more economic activities at one or more locations. It is a sole
legal unit. Thus, an enterprise having a few branches located in
different places, each branch including headquarter (main office) is
to be listed separately as an establishment.
2.2 Establishment/ Unit
The establishment is a unit situated in a single location in which
predominantly one kind of economic activity is carried out such that
at least a part of the goods and/or services produced by the unit
goes for sale. The establishment is a physical entity where mainly
one entrepreneurial activity (or sometimes more than one, with no
separate accounts) is carried out.
2.3 Non-Agricultural/ Non- Farm establishment
Establishments engaged in activities other than agricultural
activities (like crop production & plantation, growing of tea, coffee,
rubber, tobacco etc.) are termed as Non-farm establishments.
2.4 Non-farm Sector
Goods or services producing segment of the economy other than
farm activities is non-farm Sector. For this survey, non-farm sector
includes Manufacturing, Construction, Trade, Transport, Education,
Quarterly Employment Survey Report, 1st Quarter, 2021 Page 44
Health, Accommodation &Restaurants, IT/BPOs and Financial
Service sector.
2.5 Employment/Worker
Employment in this survey is the number of persons Self-
employed, employed either directly by the establishment on
regular/casual basis/contract basis or fixed term employment.
All persons engaged in an economic activity/establishment
either as owner, members of the household working as co-owner or
partner or helping the owner in running the establishment, whether
hired or not, besides regular and salaried employees, casual/daily
wage labour would be considered as workers for that establishment.
For the present survey all paid and unpaid apprentices will also be
regarded as workers. Persons, who despite their attachment to
economic activity, abstained themselves from work for reason of
illness, injury or other physical disability, bad weather, festivals,
social or religious functions or other contingencies necessitating
temporary absence from work, constitute workers.
2.6 Employee
Employee relates to the person engaged by the unit whether for
wages or not, in work connected directly or indirectly with the
process and includes all administrative, technical and clerical staff,
supervision or management, as also labour in production/ services.
2.7 Self employed
Persons who operated their own establishment or were engaged
independently in a profession or trade on own-account or with one
or a few partners were deemed to be self-employed. The essential
feature of the self- employed is that they have autonomy (decide how,
where and when to produce) and economic independence (in respect
of choice of market, scale of operation and finance) for carrying out
their operation.
Quarterly Employment Survey Report, 1st Quarter, 2021 Page 45
2.8 Full Time worker
Full-time worker is a Self Employed or an Employee who works
for a minimum number of hours as defined/agreed for a particular
occupation in the establishment.
2.9 Part Time Worker
Part-time worker is a Self Employed or an employed person
whose normal hours of work are less than those of comparable full-
time workers”.
2.10 Regular Worker
The person who has worked in non-farm enterprises and, in
return, received salary or wages on a regular basis (i.e. not on the
basis of daily or periodic renewal of work contract). This category
includes not only persons getting time wage but also persons
receiving piece wage or salary and paid apprentices, both full time
and part-time. Regular Worker are employees appointed on an open-
ended contract with no stipulated termination date, and who are
entitled to benefits such as paid leave and medical aid contributions
paid by employers. This excludes self- employed.
2.11Contract Worker
As per the definition of contract worker, a worker is deemed to
be employed as contract worker when he/she is hired in connection
with the work of an establishment by or through a contractor.
Contract workmen are indirect employees; persons who are hired,
supervised and remunerated by a contractor who, in turn is
compensated by the establishment.
2.12 Casual Worker
A person, who is casually engaged in non-farm enterprises and,
in return, received wages according to the terms of the daily or
periodic work contract, is a casual worker. This Category of Workers
excludes Regular and Contract Worker.

Quarterly Employment Survey Report, 1st Quarter, 2021 Page 46
2.13 Fixed Term employment
For the purpose of present survey, the term Fixed Term Workers
includes workers whose work are governed by a contract agreement
either in writing or oral directly by the establishment, without
involvement of the third party.
2.13 Formal Skill Development and On the Job Training
Under the present survey, the information on formal skill
development programme conducted by the establishments and On
the Job Training has been collected separately, in view of the fact
that former involves an element of certification of skill development
training imparted to its workers.
2.15 Impact of COVID-19
A part of the survey has been designed to collect the information
of the impact of COVID-19 pandemic on the operational status of
establishment and employment status during the nationwide
lockdown from 25th March 2020 to 30th June 2020.
2.16 MSME
For the purpose of present survey, the definition of Micro, Small and
Medium Enterprises has been used as per the latest notification of
M/o of MSME dated 1st June, 2020.Under the current round of QES
information has collected on the current investment and turnover of
the units and their registration status with udyam portal of MSME.

Quarterly Employment Survey Report, 1st Quarter, 2021 Page 47
ANNEXURE-III
SAMPLING DESIGN AND ESTIMATION
PROCEDURE
3.1 Introduction
An Expert Group was constituted under the Chairmanship of
Professor S.P. Mukherjee for examining, finalizing the coverage as
well as sample size, assessing the resources required in terms of
man-power and financial and finalization of Report for Quarterly
Employment Survey (QES). Expert Group in a series of meetings
discussed the various issues in threadbare and finalized the sample
size, sample design and survey methodology.
3.2 Unit of Enumeration
The unit of enumeration for the present round of QES is the
establishments with 10 or more workers in the nine selected sectors
viz. Manufacturing, Construction, Trade, Transport, Education,
Health, Accommodation & Restaurants, (IT)/ (BPO) and Financial
Service activities, as finalized by Expert Group.
3.3 Classification of Industry
All nine sectors viz. Manufacturing (NIC-08 ; 10 to 33),
Construction (NIC-08 ; 41, 42 & 43), Trade (NIC-08 ; 45,46 & 47),
Transport (NIC-08 ; 49 to 53), Education (NIC-08 ; 85), Health (NIC-
08 ; 86,87 & 88), Accommodation &Restaurants (NIC-08 ; 55 & 56 ),
IT/BPO (NIC-08 ; 62 & 63) and Financial Service activities (NIC- 64,
65 & 66)are classified as per the National Industrial Classification
(NIC)-2008 at two digit level.
3.4 Sampling Frame
The sample needs to be a representative of establishment with
10 or more workers in nine sectors in India. The sampling frame
used for present survey is all establishments with 10 or more
workers in Sixth Economic Census (2012-13) in nine major sector
viz. Manufacturing, Construction, Trade, Transport, Education,
Quarterly Employment Survey Report, 1st Quarter, 2021 Page 48
Health, Accommodation &Restaurants, IT/BPOs and financial
service activities.
3.5 Reference Date
The first round QES covered whole of the Indian Union. Each
quarterly employment survey covers a period of 3 months which is
termed a round. The reference date in the most of the information
items is the first day of the respective quarter during which the
survey is conducted. For the present survey, the reference date is 1st
April, 2021.
3.6 Sampling Design
For selecting a fixed Panel of 12000 units a Stratified Simple
Random Sampling (Without Replacement) has been adopted for the
new series of QES following the recommendation of the Expert Group
under the chairmanship of Prof. S.P. Mukherjee. The new series of
QES provides employment estimates for nine sectors viz.
Manufacturing, Construction, Trade, Transport, Education, Health,
Accommodation &Restaurants, IT/BPOs and Financial Service sector
selected on the basis of data of Sixth Economic Census (2012-13).
The nine sectors account for around 85% of the total employment of
units with 10 or more workers in the 6th Economic Census.
3.7 Sample Size
The sample size for the survey was around 12000 units. Each of
the nine sectors, within a state, is further divided into six size
classes based on the size of employment. Accordingly, number of
units are being selected proportionately (Proportional allocation) to
the number of units in the population (frame) in the respective strata
viz. State by Sector by Size Class by using Simple Random Sampling
(Without Replacement). Allotment of minimum of 10 sample units, at
a sector level in each state (i.e. State X Sector), was ensured, further
ensuring the proportional representation in each size class.
3.8 Stratification and selection of unit

Quarterly Employment Survey Report, 1st Quarter, 2021 Page 49
Since the characteristics under study is mainly related to
employment, which in turn is related to number of establishments,
the stratification is done on the basis of size class (employment size
of the establishment) and number of establishments. The sampling
frame is divided within each state into nine strata viz.
Manufacturing, Construction, Trade, Transport, Education, Health,
Accommodation &Restaurants, IT/BPOs and Financial Service
activities. Further 9 of each stratum (sector) is divided into six sub-
strata based on the size of employment (size classes 1 to 6) of an
establishment viz. 10-39 workers, 40-99 workers, 100-499 workers,
500-999 workers, 1000-4999 workers and more than 4999 workers.
Thus the stratum/segment for the present sample design is State X
Sector X Size Class. Accordingly, units were selected based on
proportional allocation using simple random sampling (without
replacement).
3.9 Estimation procedure:
3.9.1 Notations:
i = subscript for ith State/UT [i= 1 to 36]
j= subscript for jth Sector [j= 1 to 9]
k= subscript for kth Size Class [k= 1 to 6]
t= subscript for th unit
n= number of sample units surveyed in a particular stratum
N= Total number of units in a particular stratum
y= observed value of characteristic y under estimation.
Ŷ = estimates of population total Y for characteristics y.
nijk units are selected from Nijk units in ijkth stratum with equal
probability without replacement.
The inflation factor for generating Level Estimates used in this
design=
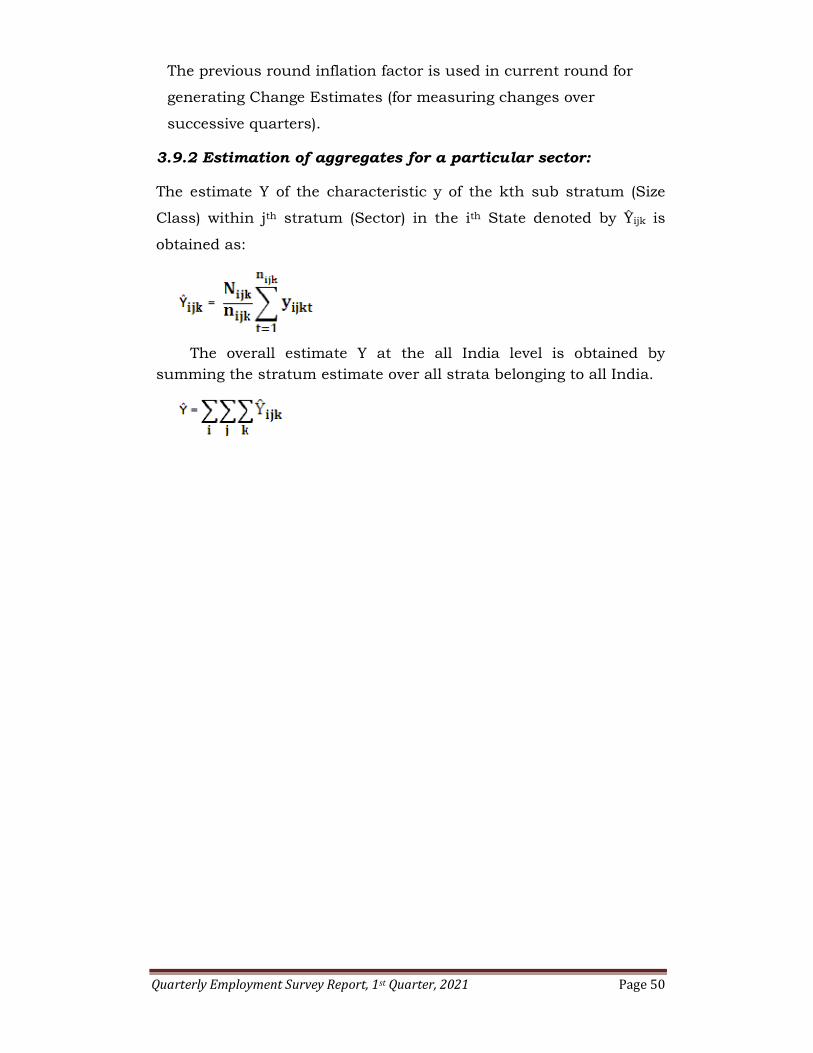
Quarterly Employment Survey Report, 1st Quarter, 2021 Page 50
The previous round inflation factor is used in current round for
generating Change Estimates (for measuring changes over
successive quarters).
3.9.2 Estimation of aggregates for a particular sector:
The estimate Y of the characteristic y of the kth sub stratum (Size
Class) within jth stratum (Sector) in the ith State denoted by Ŷijk is
obtained as:
The overall estimate Y at the all India level is obtained by summing the stratum estimate over all strata belonging to all India.
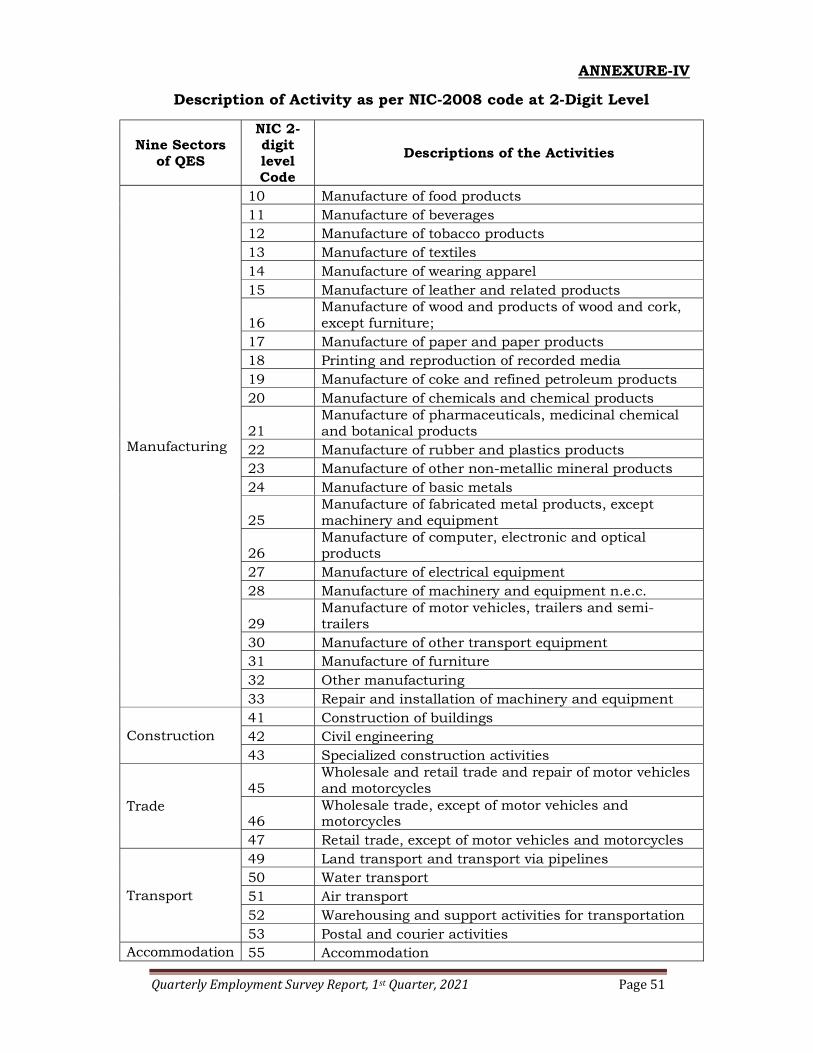
Quarterly Employment Survey Report, 1st Quarter, 2021 Page 51
ANNEXURE-IV
Description of Activity as per NIC-2008 code at 2-Digit Level
Nine Sectors of QES
NIC 2-digit level Code
Descriptions of the Activities
Manufacturing
10 Manufacture of food products 11 Manufacture of beverages 12 Manufacture of tobacco products 13 Manufacture of textiles 14 Manufacture of wearing apparel 15 Manufacture of leather and related products
16 Manufacture of wood and products of wood and cork, except furniture;
17 Manufacture of paper and paper products 18 Printing and reproduction of recorded media 19 Manufacture of coke and refined petroleum products 20 Manufacture of chemicals and chemical products
21 Manufacture of pharmaceuticals, medicinal chemical and botanical products
22 Manufacture of rubber and plastics products 23 Manufacture of other non-metallic mineral products 24 Manufacture of basic metals
25 Manufacture of fabricated metal products, except machinery and equipment
26 Manufacture of computer, electronic and optical products
27 Manufacture of electrical equipment 28 Manufacture of machinery and equipment n.e.c.
29 Manufacture of motor vehicles, trailers and semi-trailers
30 Manufacture of other transport equipment 31 Manufacture of furniture 32 Other manufacturing 33 Repair and installation of machinery and equipment
Construction 41 Construction of buildings 42 Civil engineering 43 Specialized construction activities
Trade 45
Wholesale and retail trade and repair of motor vehicles and motorcycles
46 Wholesale trade, except of motor vehicles and motorcycles
47 Retail trade, except of motor vehicles and motorcycles
Transport
49 Land transport and transport via pipelines 50 Water transport 51 Air transport 52 Warehousing and support activities for transportation 53 Postal and courier activities
Accommodation 55 Accommodation
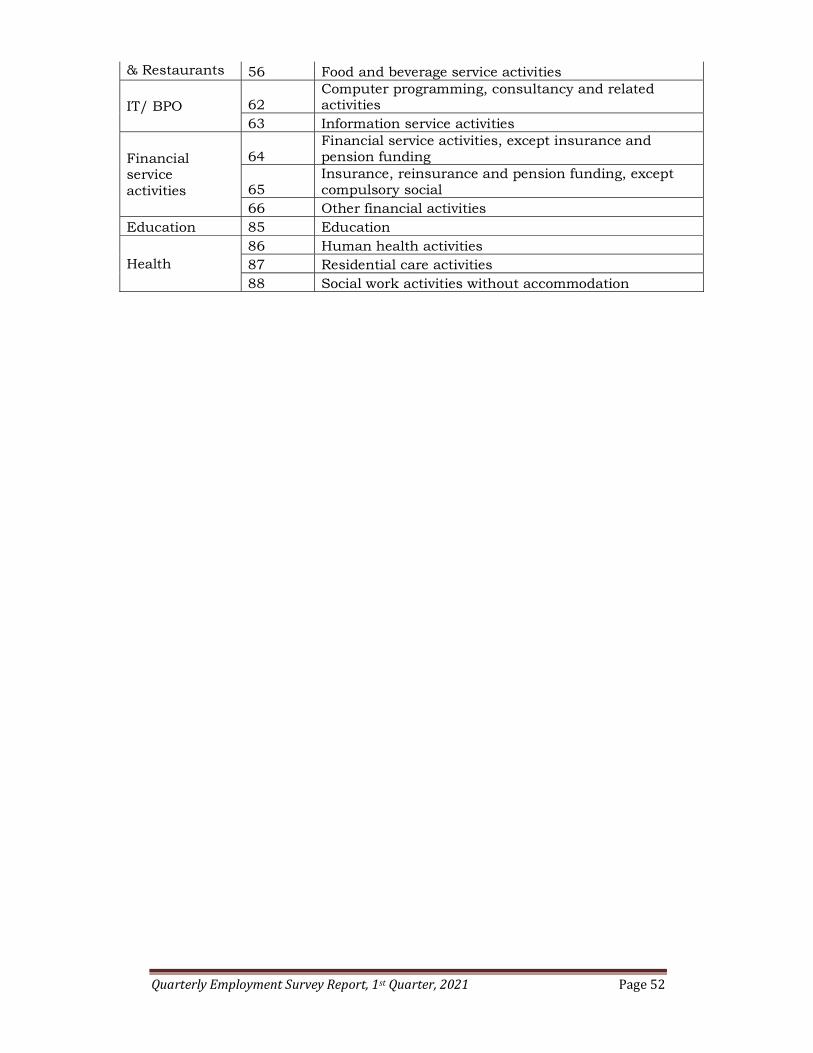
Quarterly Employment Survey Report, 1st Quarter, 2021 Page 52
& Restaurants 56 Food and beverage service activities
IT/ BPO 62 Computer programming, consultancy and related activities
63 Information service activities
Financial service activities
64 Financial service activities, except insurance and pension funding
65 Insurance, reinsurance and pension funding, except compulsory social
66 Other financial activities Education 85 Education
Health 86 Human health activities 87 Residential care activities 88 Social work activities without accommodation

Quarterly Employment Survey Report, 1st Quarter, 2021 Page 53
ANNEXURE-V
Round Original Substituted
Government of India Ministry of Labour& Employment
Labour Bureau Quarterly Employment Survey (QES)
BLOCK I. Identification Particulars 1. Establishment
1.1. Name of the establishment
1.2. Address of the establishment
1.3. Name of the Owner ( Department name, in case of Government/Public Sector Undertaking (PSU))
1.4. Location (Within HH-1, Outside HH with fixed structure- 2, Outside HH without fixed structure-3 )
1.5. Whether the name and address is same as in the frame (Yes-1, No-2)
1.5.1 If No in item 1.5, the new Name of Establishment (if any)
1.5.2 If No in item 1.5, the new Address of Establishment (if any)
2. Sample Serial No. (copy from sample list)
3. NIC code 2008 as per Frame (3 digit level)
(copy from sample list)
4. Description of the Economic Activity
5. Description of goods produced/traded or services provided
6. NIC code 2008 at the time of visit (3 digit level)
7. Person contacted
7.1. Name & Designation
7.2. E-mail
7.3. Mobile number
7.4. Landline Phone number
8. Survey Type: ( Original – 1, Substituted – 2)
8.1 In case of Substitution, the reasons thereof: (Code: Unit not in existence-1, Unit locked out for some time /temporary shutdown-2, Access denied -3, Adequate co-operation not extended-4, Unit closed-5, Others -9 ) Specify_____________________________
9. Whether the establishment is: (Code: An Enterprise by itself-1, Main Office of an enterprise-2, Unit/ Branch of an enterprise-3)
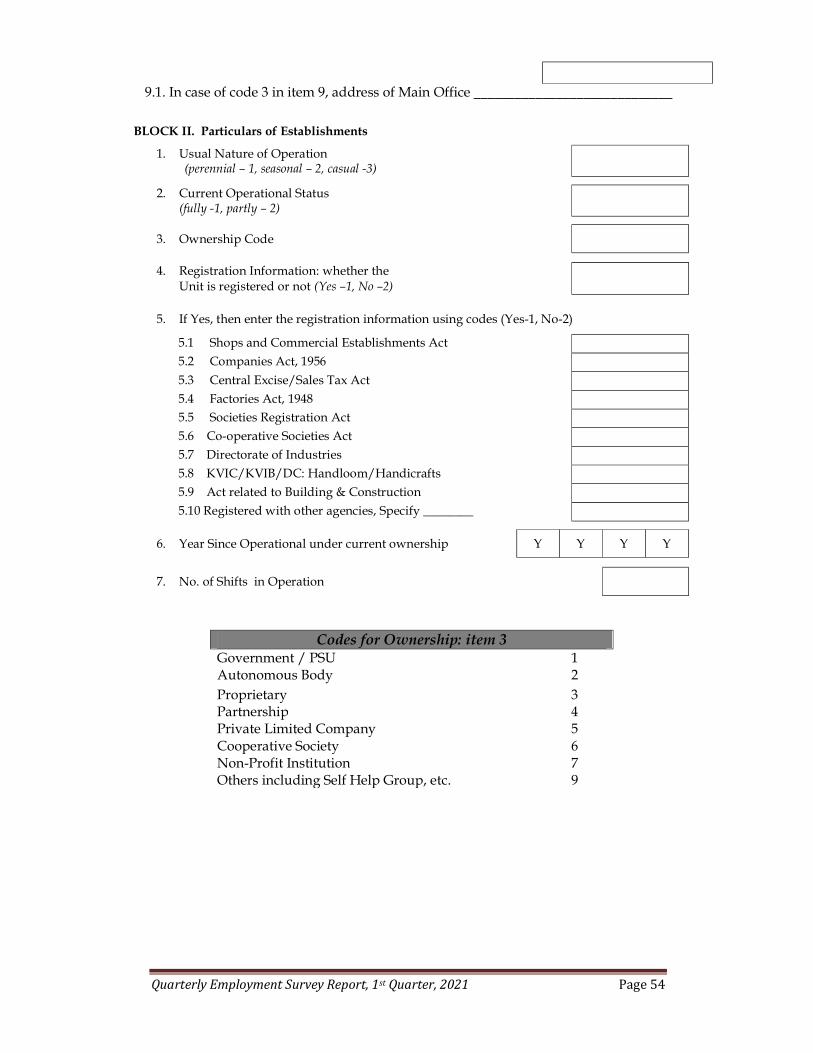
Quarterly Employment Survey Report, 1st Quarter, 2021 Page 54
9.1. In case of code 3 in item 9, address of Main Office _____________________________
BLOCK II. Particulars of Establishments
1. Usual Nature of Operation (perennial – 1, seasonal – 2, casual -3)
2. Current Operational Status (fully -1, partly – 2)
3. Ownership Code
4. Registration Information: whether the Unit is registered or not (Yes –1, No –2)
5. If Yes, then enter the registration information using codes (Yes-1, No-2)
5.1 Shops and Commercial Establishments Act 5.2 Companies Act, 1956 5.3 Central Excise/Sales Tax Act 5.4 Factories Act, 1948 5.5 Societies Registration Act 5.6 Co-operative Societies Act 5.7 Directorate of Industries 5.8 KVIC/KVIB/DC: Handloom/Handicrafts 5.9 Act related to Building & Construction 5.10 Registered with other agencies, Specify ________
6. Year Since Operational under current ownership Y Y Y Y
7. No. of Shifts in Operation
Codes for Ownership: item 3 Government / PSU Autonomous Body
1 2
Proprietary 3 Partnership 4 Private Limited Company 5 Cooperative Society 6 Non-Profit Institution 7 Others including Self Help Group, etc. 9
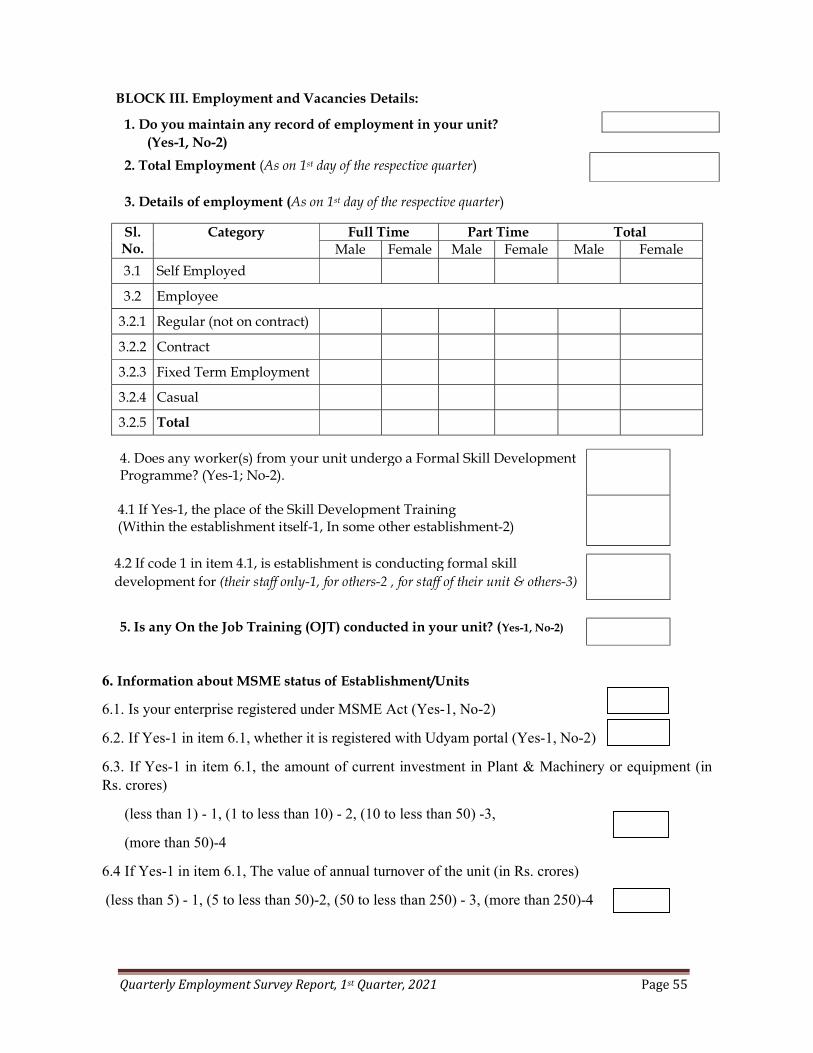
Quarterly Employment Survey Report, 1st Quarter, 2021 Page 55
BLOCK III. Employment and Vacancies Details:
1. Do you maintain any record of employment in your unit? (Yes-1, No-2)
2. Total Employment (As on 1st day of the respective quarter) 3. Details of employment (As on 1st day of the respective quarter)
Sl. No.
Category Full Time Part Time Total Male Female Male Female Male Female
3.1 Self Employed
3.2 Employee
3.2.1 Regular (not on contract)
3.2.2 Contract
3.2.3 Fixed Term Employment
3.2.4 Casual
3.2.5 Total
4. Does any worker(s) from your unit undergo a Formal Skill Development Programme? (Yes-1; No-2). 4.1 If Yes-1, the place of the Skill Development Training (Within the establishment itself-1, In some other establishment-2)
4.2 If code 1 in item 4.1, is establishment is conducting formal skill development for (their staff only-1, for others-2 , for staff of their unit & others-3)
5. Is any On the Job Training (OJT) conducted in your unit? (Yes-1, No-2)
6. Information about MSME status of Establishment/Units
6.1. Is your enterprise registered under MSME Act (Yes-1, No-2)
6.2. If Yes-1 in item 6.1, whether it is registered with Udyam portal (Yes-1, No-2)
6.3. If Yes-1 in item 6.1, the amount of current investment in Plant & Machinery or equipment (in Rs. crores)
(less than 1) - 1, (1 to less than 10) - 2, (10 to less than 50) -3,
(more than 50)-4
6.4 If Yes-1 in item 6.1, The value of annual turnover of the unit (in Rs. crores)
(less than 5) - 1, (5 to less than 50)-2, (50 to less than 250) - 3, (more than 250)-4
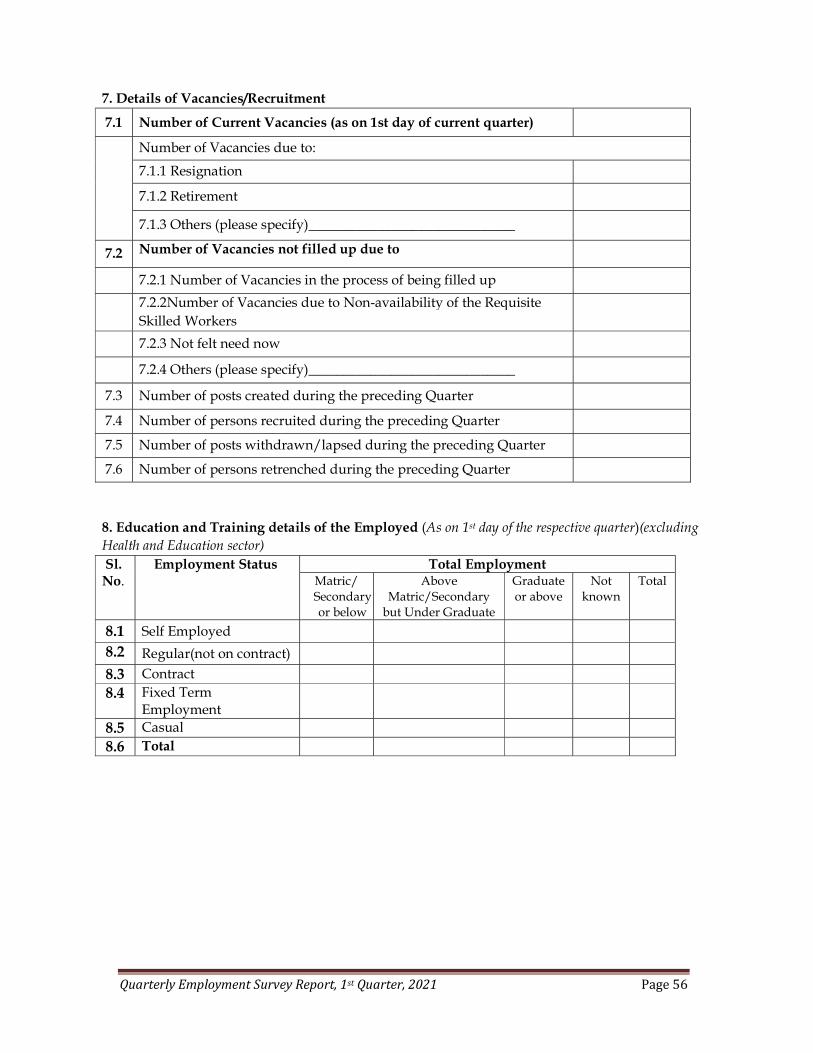
Quarterly Employment Survey Report, 1st Quarter, 2021 Page 56
7. Details of Vacancies/Recruitment
7.1 Number of Current Vacancies (as on 1st day of current quarter)
Number of Vacancies due to:
7.1.1 Resignation
7.1.2 Retirement
7.1.3 Others (please specify)______________________________
7.2 Number of Vacancies not filled up due to
7.2.1 Number of Vacancies in the process of being filled up
7.2.2Number of Vacancies due to Non-availability of the Requisite Skilled Workers
7.2.3 Not felt need now
7.2.4 Others (please specify)______________________________
7.3 Number of posts created during the preceding Quarter
7.4 Number of persons recruited during the preceding Quarter
7.5 Number of posts withdrawn/lapsed during the preceding Quarter
7.6 Number of persons retrenched during the preceding Quarter
8. Education and Training details of the Employed (As on 1st day of the respective quarter)(excluding Health and Education sector) Sl. No.
Employment Status Total Employment Matric/ Secondary or below
Above Matric/Secondary
but Under Graduate
Graduate or above
Not known
Total
8.1 Self Employed 8.2 Regular(not on contract) 8.3 Contract 8.4 Fixed Term
Employment
8.5 Casual 8.6 Total
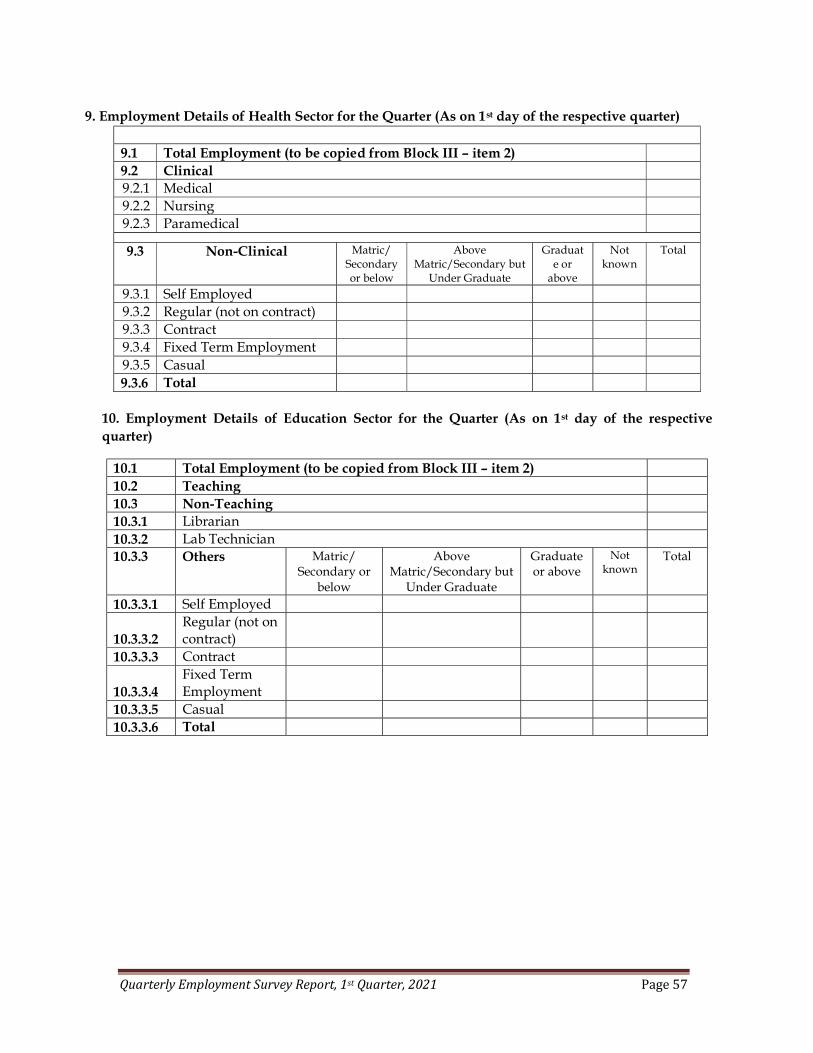
Quarterly Employment Survey Report, 1st Quarter, 2021 Page 57
9. Employment Details of Health Sector for the Quarter (As on 1st day of the respective quarter)
9.1 Total Employment (to be copied from Block III – item 2) 9.2 Clinical 9.2.1 Medical 9.2.2 Nursing 9.2.3 Paramedical
9.3 Non-Clinical Matric/ Secondary or below
Above Matric/Secondary but
Under Graduate
Graduate or
above
Not known
Total
9.3.1 Self Employed 9.3.2 Regular (not on contract) 9.3.3 Contract 9.3.4 Fixed Term Employment 9.3.5 Casual 9.3.6 Total
10. Employment Details of Education Sector for the Quarter (As on 1st day of the respective quarter)
10.1 Total Employment (to be copied from Block III – item 2) 10.2 Teaching 10.3 Non-Teaching 10.3.1 Librarian 10.3.2 Lab Technician 10.3.3 Others Matric/
Secondary or below
Above Matric/Secondary but
Under Graduate
Graduate or above
Not known
Total
10.3.3.1 Self Employed
10.3.3.2 Regular (not on contract)
10.3.3.3 Contract
10.3.3.4 Fixed Term Employment
10.3.3.5 Casual 10.3.3.6 Total
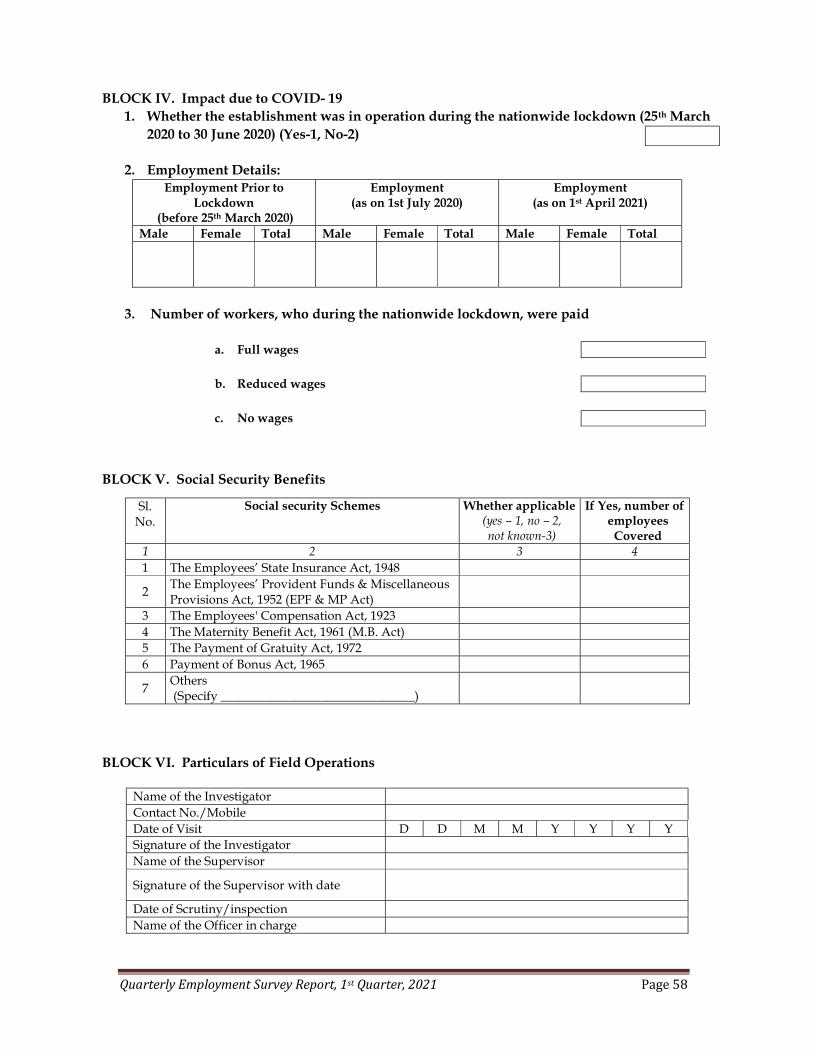
Quarterly Employment Survey Report, 1st Quarter, 2021 Page 58
BLOCK IV. Impact due to COVID- 19 1. Whether the establishment was in operation during the nationwide lockdown (25th March
2020 to 30 June 2020) (Yes-1, No-2) 2. Employment Details:
Employment Prior to Lockdown
(before 25th March 2020)
Employment (as on 1st July 2020)
Employment (as on 1st April 2021)
Male Female Total Male Female Total Male Female Total
3. Number of workers, who during the nationwide lockdown, were paid
a. Full wages
b. Reduced wages
c. No wages
BLOCK V. Social Security Benefits
Sl. No.
Social security Schemes Whether applicable (yes – 1, no – 2, not known-3)
If Yes, number of employees
Covered 1 2 3 4 1 The Employees’ State Insurance Act, 1948
2 The Employees’ Provident Funds & Miscellaneous Provisions Act, 1952 (EPF & MP Act)
3 The Employees' Compensation Act, 1923 4 The Maternity Benefit Act, 1961 (M.B. Act) 5 The Payment of Gratuity Act, 1972 6 Payment of Bonus Act, 1965
7 Others (Specify _______________________________)
BLOCK VI. Particulars of Field Operations
Name of the Investigator Contact No./Mobile Date of Visit D D M M Y Y Y Y Signature of the Investigator Name of the Supervisor
Signature of the Supervisor with date
Date of Scrutiny/inspection Name of the Officer in charge

Quarterly Employment Survey Report, 1st Quarter, 2021 Page 59
BLOCK VII. Comments by Investigator
Block VIII.Comments by Supervisor
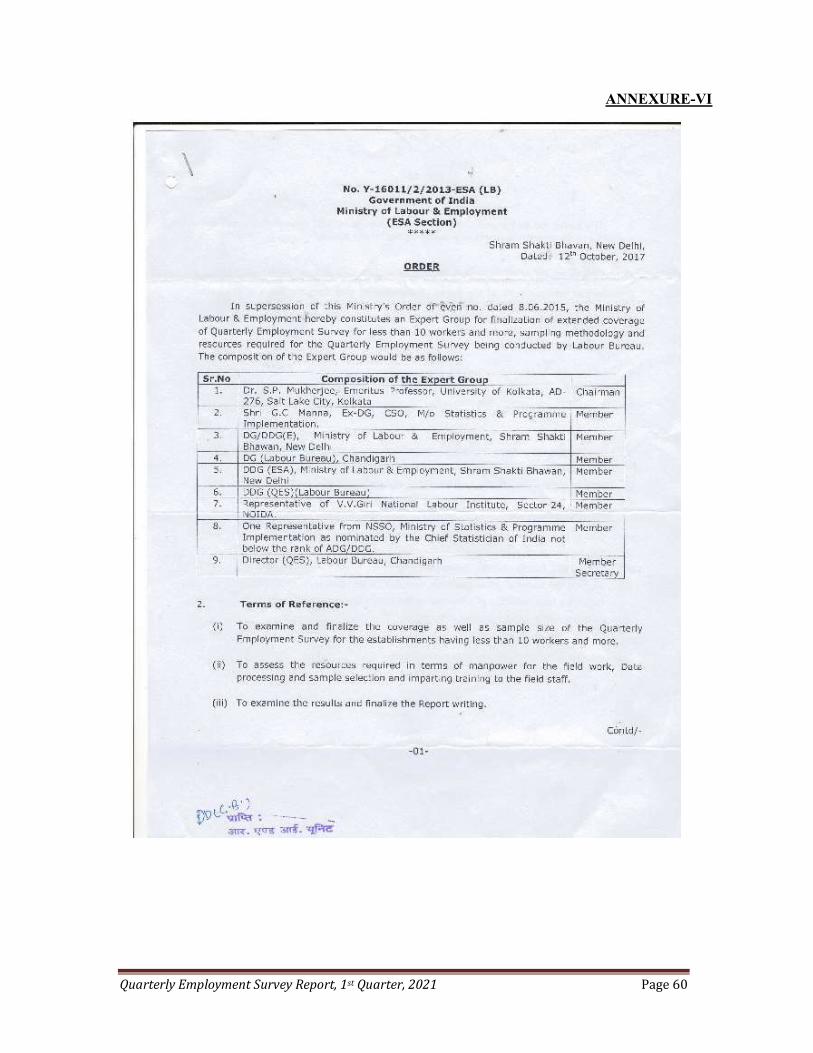
Quarterly Employment Survey Report, 1st Quarter, 2021 Page 60
ANNEXURE-VI
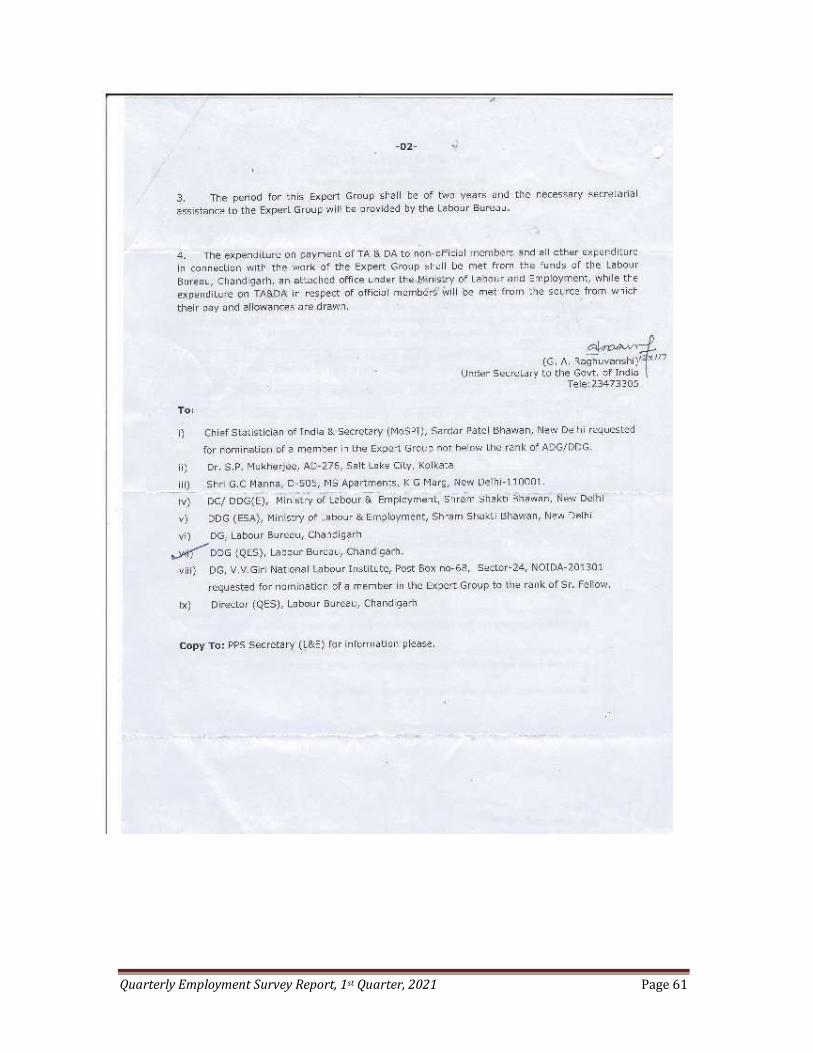
Quarterly Employment Survey Report, 1st Quarter, 2021 Page 61