1.0 Introduction of The Project 1‐1 1.1 Product Profile 1‐3 1.2 Technology 1‐4 1.3 Plant Location & Layout 1‐4 1.4 Scope of EIA Studies 1‐7 2 Process Description and Pollution control Facilities 2‐1
2.1 Process Description 2‐1 2.1.1 Process Description of Sulfanilamide 2‐2 2.1.2 Process Description of Sulfa Pyridine 2‐4 2.1.3 Process Description of Sulfa Salazine 2‐7 2.2 Utilities 2‐8 2.3 Water Requirement 2‐9 2.4 Pollution Control Facilities 2‐9
2.4.1 Water Pollution 2‐9 2.4.1.1 Process Description and Technical Specification of Effluent Treatment System 2‐11 2.4.2 Air Pollution 2‐16
2.4.2.1 Emissions from Utilities 2‐16 2.4.2.2 Emissions from Process 2‐172.4.2.3 Diffuse Emissions 2‐17 2.4.2.4 Fugitive Emissions 2‐17 2.4.3 Solvent Use and Recycle 2‐17 2.4.4 Solid Waste 2‐18 2.4.5 Noise Pollution 2‐19 3.0 Baseline Environmental Status 3‐1 3.1 Introduction 3‐1 3.2 Land Environment 3‐1
3.3.1 Surface water resources 3‐113.3.1.1 Surface water Quality 3‐11 3.3.2 Ground water resources 3‐11
3.3.2.1 Quality Of Ground Water 3‐12 3.4 Air environment 3‐18
3.4.1 Meteorology 3‐18 3.4.2 Meteorological station at Industry Site 3‐21 3.4.3 Ambient air quality 3‐24 3.4.4 Scope of field study 3‐24 3.4.5 Description of sampling locations 3‐26 3.4.6 Ambient Air Quality Status 3‐28
3.4.6.1 Analysis of Poly‐Aromatic Hydrocarbons (PAH) in RSPM 3‐29 3.5 Noise environment 3‐30 3.6 Socio economic environment 3‐33
3.6.1 Demography 3‐33
Virchow Drugs Limited Contents
3.6.1.1 Population Distribution 3‐33 3.6.1.2 Literacy 3‐34 3.6.1.3 Employment/Occupation 3‐35 3.6.2 Living standards and Infrastructure 3‐36 3.6.3 Land Utilization 3‐38 3.6.3 Project Economy 3‐39 3.7 Flora and Fauna 3‐39
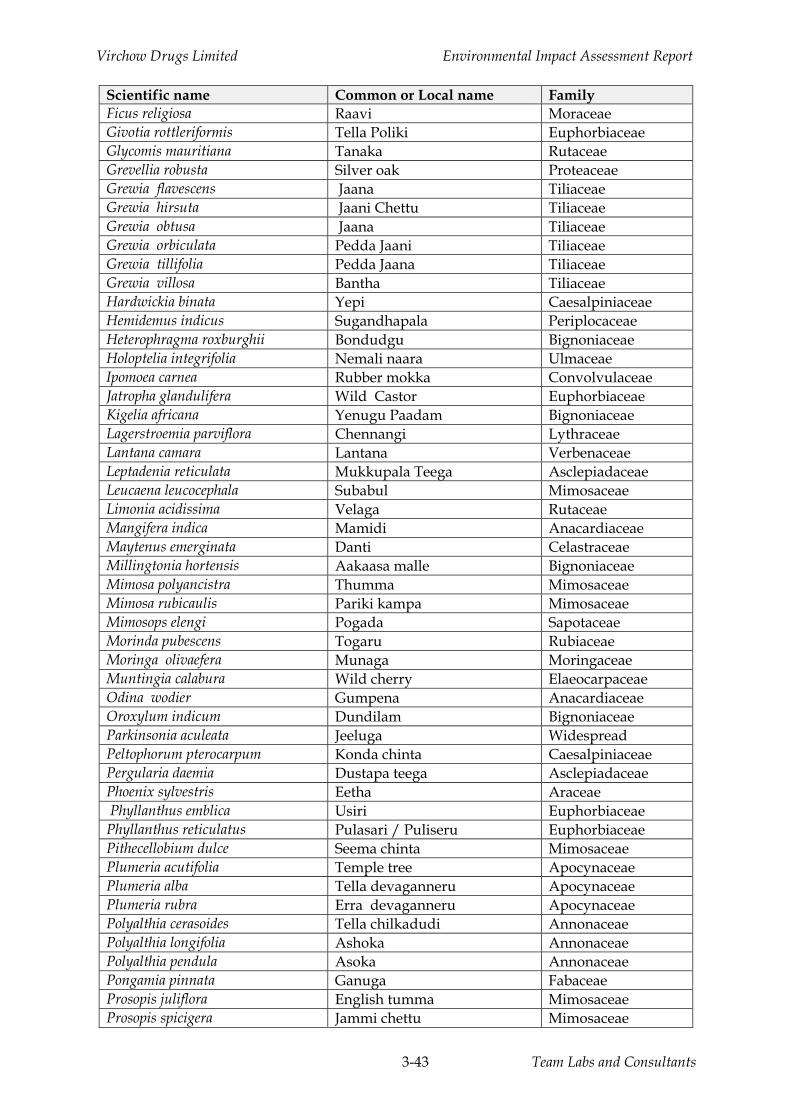
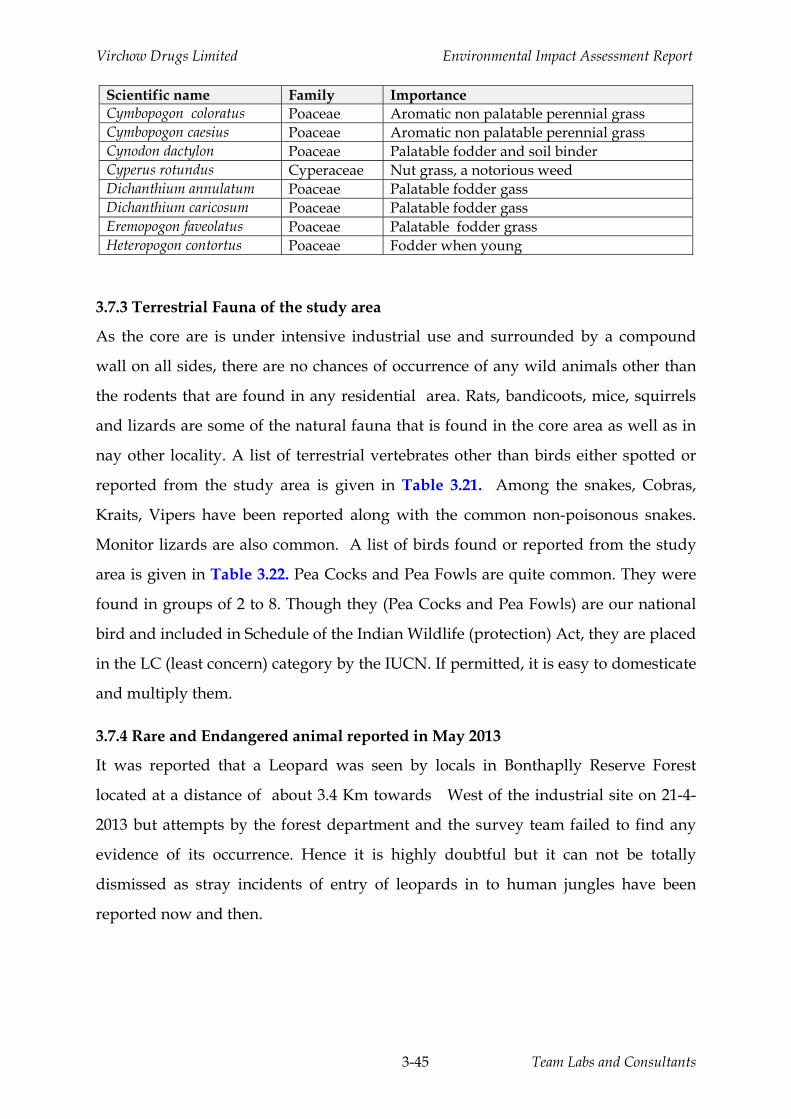
3.7.1 Flora of the Core area 3‐39 3.7.2 Vegetation and flora of the Buffer zone 3‐41 3.7.3 Terrestrial Fauna of the study area 3‐45 3.7.4 Rare and Endangered animal reported in May 2013 3‐45
4 Identification of Impacts 4‐1 4.1 Identification of Impacts 4‐1 4.2 Impact Networks 4‐1
4.2.1 Air Environment 4‐2 4.2.2 Water environment 4‐2 4.2.3 Noise environment 4‐2 4.2.4 Land Environment 4‐34.2.5 Biological Environment 4‐3 4.2.6 Socio‐economic environment 4‐3 4.3 Prediction of impact on air Quality 4‐10
4.3.1 Details of Mathematical Modeling 4‐10 4.3.1.1 Model Formulation 4‐114.3.1.2 Meteorological Data 4‐12 4.3.2 Plant Emissions 4‐13
4.3.2.1 Diffuse Emissions 4‐15 4.3.2.2 Fugitive Emissions 4‐15 4.3.2.3 Air Quality Impact Predictions 4‐16 4.3.2.4 Prediction of Concentration of Solvents in the Indoor Environment Due to Solvent Loss
and Fugitive Emissions 4‐24
4.4 Prediction of Impact on Noise quality 4‐25 4.5 Prediction of Impact on water quality 4‐26 4.6 Prediction of Impact on soil 4‐26 4.7 Prediction of Impact on Socio Economics 4‐26 4.8 Prediction of Impact on local Flora and Fauna 4‐27 4.9 Prediction of Impact on Vehicular Traffic 4‐28 5 Environmental Monitoring 5‐1
5.1.1 Introduction 5‐1 5.1.2 Objectives 5‐1 5.1.3 Methodology 5‐1 5.1.4 Ambient Air Quality (AAQ) Monitoring 5‐2 5.1.5 Water Quality Monitoring 5‐3 5.1.6 Noise Level Monitoring 5‐7 5.1.7 Responsibility of Monitoring and Reporting System 5‐9 5.2 Environmental Monitoring Budget 5‐9 6 Risk Assessment and Damage Control 6‐1
6.0 Introduction 6‐1 6.1 Objectives and Scope 6‐1 6.2 Production Details 6‐2 6.3 Process Description 6‐4 6.4 Plant Facilities 6‐4
Virchow Drugs Limited Contents
6.4.1 Production Blocks 6‐4 6.4.2 Utilities 6‐4 6.4.3 Quality Control, R&D Lab 6‐5 6.4.4 ETP and Solid waste storage 6‐5 6.4.5 Ware Houses 6‐5 6.4.6 Tank Farm Area 6‐6 6.4.7 Administrative Office 6‐6 6.4.8 Water Sump 6‐6 6.4.9 House Keeping 6‐6
6.4.10 Facility layout and design 6‐6 6.5 Hazard Analysis and Risk Assessment 6‐8
6.5.1 Introduction 6‐8 6.5.2 Hazard Identification 6‐8 6.5.3 Fire & Explosion Index (F & EI) 6‐10
6.5.3.1 Methodology 6‐10 6.5.4 Hazard and Operability Study (HAZOP) 6‐12 6.5.5 Hazard Factors 6‐14 6.5.6 Common Causes of Accidents 6‐166.6 Maximum Credible Accident and Consequence Analysis (MCACA) 6‐18
6.6.1 Methodology 6‐19 6.6.2 Identification of Vulnerable Areas 6‐20 6.6.3 Representative Accident Scenarios 6‐20 6.7 Consequence Analysis 6‐21
6.7.1 Release Models and Source strength 6‐22 6.7.2 Results of Consequence Analysis 6‐24
6.8.1 Introduction 6‐29 6.8.2 Objectives Of Emergency Management Plan (On‐Site) 6‐30 6.8.3 Scope Of ONSEP 6‐31 6.8.4 Methodology Of Developing ONSEP 6‐31 6.8.5 Element Of ONSITE Emergency Plane 6‐32
S.No Description Page. No. 1.1 List of products and Manufacturing Capacity – After Expansion 1‐3 1.2 List of By–Products‐ After Expansion 1‐4 2.1 List of products and Manufacturing Capacity – After Expansion 2‐1 2.2 List of By–Products‐ After Expansion 2‐1 2.3 Material Balance for Sulfanilaamide 2‐4 2.4 Material Balance forSulfa pyridine 2‐6 2.5 Material Balance for Sulfa Salazine 2‐7 2.6 List of Utilities 2‐8 2.7 Total Water balance 2‐9 2.8 Total Effluents generated and Mode of Treatment 2‐10 2.9 Effluents generated and Characteristics from process – (Product Wise) 2‐10 2.10 Effluents generated and Characteristics from process – (Stage Wise) 2‐112.11 Technical specifications of Effluent treatment System 2‐14 2.12 Technical specifications of Biological Treatment Plant 2‐15 2.13 Emission details of Pollutants from Stack 2‐16 2.14 Total Solvent Balance‐Product wise 2‐18 2.15 Total Solid Waste Generated and Disposal 2‐19 3.1 Soil Analysis Data 3‐8 3.2 Soil Test Results – Reference Tables 3‐10 3.3 Locations of Ground Water Samples 3‐13 3.4 Water analysis data ( Ground Water) 3‐16 3.5 Normal Climatrological Data 3‐19 3.6 Frequency Distributions of Wind Speeds and Wind Directions 3‐22 3.7 National Ambient Air Quality standards 3‐25 3.8 Location of Ambient Air Quality monitoring stations 3‐26 3.9 Ambient air quality statuses 3‐283.10 Chemical composition of RSPM 3‐29 3.11 Affects on Human Beings at Different Noise Levels 3‐32 3.12 Equivalent Noise levels in the Study Area 3‐32 3.13 Population Distribution – Study Area 3‐34 3.14 Literacy ‐ Study Area 3‐343.15 Employment ‐ Study Area 3‐35 3.16 Main workers study area 3‐36 3.17 Land utilization Pattern 3‐38 3.18 List of trees, shrubs and grasses found in the premises of bulk drug unit 3‐39 3.19 List of trees and shrubs found in the buffer zone of the industry 3‐41 3.20 List of grasses and sedges found in the buffer zone during the summer season 3‐44 3.21 List of vertebrates other than birds found in and around the project site 3‐46 3.22 List of Birds either spotted or reported from the areas in and around the project site. 3‐47 4.1 Salient Features of the ISCST3 Model 4‐11 4.2 Atmospheric Stability Classification 4‐13 4.3 Mixing Heights considered for Computations 4‐13 4.4 Emission Details of Pollutants from Stack 4‐14 4.5 Maximum Predicted 24 hourly GLC’s 4‐17 4.6 Predicted GLC’s at Monitoring Locations 4‐17 4.7 Cumulative Concentrations at Various Villages 4‐18 4.8 Solvent Loss and the Predicted Airborne Concentrations 4‐25 5.1 National Ambient Air Quality Standards 5‐2
Virchow Drugs Limited Contents
5.2 Indian Standard Drinking Water Specification‐IS:10500:1991 5‐4 5.3 Noise Level Standards (CPCB) 5‐8 5.4 Environmental Monitoring Plan 5‐8 5.5 Environmental Monitoring Budget 5‐10 6.1 Proposed Manufacturing Capacity – After Expansion 6‐3 6.2 List of By‐Products 6‐3 6.3 List of Raw Materials and inventory 6‐3 6.4 List of Utilities 6‐5 6.5 Applicability of GOI Rules to Storage/Pipeline 6‐10 6.6 Degree of Hazard for F&EI 6‐12 6.7 Fire & Explosion Index for Tank farm 6‐12 6.8 Failure Rate Data 6‐17 6.9 Ignition Sources of Major Fires 6‐18 6.10 General Failure Frequencies 6‐21 6.11 Damage Due to Incident Radiation Intensities 6‐23 6.12 Radiation exposure and lethality 6‐23 6.13 Damage Due to Peak Over Pressure 6‐24 6.14 Heat Radiation Damage Distances – Tank Farm 6‐266.15 Truck Incidents – Initiating and Contributing Causes 6‐28 6.16 Transportation specific concerns 6‐29 6.17 List of Fire Extinguishers 6‐35
Virchow Drugs Limited Contents
List of Figures S.No Description Page. No. 1.1 Location of M/s. Virchow Drugs Limited 1‐5 1.2 Plant Layout of M/s. Virchow Drugs Limited 1‐6 2.1 Process diagram of Sulfanilaminde 2‐3 2.2 Process diagram of Sulfa pyridine 2‐52.3 Process diagram of Sulfa salazine 2‐7 2.4 Schematic Diagram of Effluent Treatment System 2‐13 3.1 Site Photographs of M/s. Virchow Drugs Limited 3‐2 3.2 Base map of the study area 3‐5 3.3 Land use and land cover map of the study area 3‐6 3.4 Soil Sampling Locations 3‐7 3.5 Drainage pattern of the study area 3‐14 3.6 Water Sampling Locations 3‐15 3.7 Piper Trilinear Diagram for Ground water 3‐18 3.8 Wind Rose Diagram at Site 3‐23 3.9 Ambient air quality Locations 3‐27
3.10 Noise Sampling Locations 3‐31 4.1 Impacts Network For Air Environment 4‐4 4.2 Impacts Network For Noise Environment 4‐5 4.3 Identification of Likely Impacts For Waste Water 4‐6 4.4 Impacts Network For Land Environment 4‐7 4.5 Impacts Network For Soil Micro Flora Fauna 4‐8 4.6 Impact Network For Socio‐Economic And Cultural Environment 4‐9 4.7 Isopleths Showing 24 Hourly GLC’s of SPM 4‐194.8 Isopleths Showing 24 Hourly GLC’s of PM10 4‐20 4.9 Isopleths Showing 24 Hourly GLC’s of PM2.5 4‐21
4.10 Isopleths Showing 24 Hourly GLC’s of SO2 4‐22 4.11 Isopleths Showing 24 Hourly GLC’s of NOX 4‐23 6.1 Plant Layout of M/s. Virchow Drugs Limited 6‐76.2 Steps in Consequence Calculations 6‐22
Virchow Drugs Limited Executive Summary
Team Labs and consultants E-1
EXECUTIVE SUMMARY
Introduction
Pharmaceutical Chemicals are used for the benefit of human and animal health. The
scale of manufacturing of Active Pharma Ingredients is less compared to other
synthetic organic chemicals, which are used for the manufacture of consumer products.
India is a major producer of active pharma ingredients contributing to wellbeing of
both human and animal population of the world.
M/s. Virchow Drugs Limited obtained consent for operation for Bulk Drugs &
intermediates at Sy. No. 639 (Part), IDA Bonthapally, Jinnaram Mandal, Medak District,
Telangana. It is proposed to expand the API manufacturing capacity from 40 TPM to
130 TPM in existing area of 3 acres to meet the increasing market demands. The
expansion entails a capital cost of Rs. 2 crores towards modernization of zero liquid
discharge facility, debottlenecking by way of incorporating the advanced technology
and state of the art equipment. The proposed expansion does not involve any
additional civil construction for manufacturing blocks except utility and pollution
control related works. Prior environmental clearance is mandated by Ministry of
Environment and Forests, vide SO 1533, dated September 14, 2006 for synthetic organic
chemicals manufacturing activity. State Expert Appraisal Committee (SEAC) of
Telangana issued terms of reference to prepare EIA as mentioned in the manual of
MoEF&CC, GOI for “Synthetic Organic Chemicals Industry (dyes and dye
intermediates; bulk drugs and intermediates excluding drug formation; synthetic
rubber; basic organic chemicals, other synthetic organic chemicals and chemical
intermediates” during SEAC meeting held on 29.09.2016 as part of the environmental
clearance process. The project was exempted from public hearing process as the
industry site is located in the notified industrial area of IDA Bonthapally, Medak
district. The compliance letter from the regional office of MoEFCC, Chennai is
obtained vide letter no.Lr. No. J-11011/132/2004-IA. II
Virchow Drugs Limited Executive Summary
Team Labs and consultants E-2
Location of the Project:
The project site is located at Sy. No. 639 (Part), IDA Bonthapally, Jinnaram Mandal,
Medak District, Telangana. The site is situated at intersection of 78021’15.06” (E) and
latitude 17039’24.70” (N). The site is surrounded by road connecting Jinnaram and
Bonthappay in north direction, SSI Company in south direction, M/s. Samkrg Pistons
and Rings Ltd., in east direction and open land in west direction. The nearest habitation
from the site is bonthapally at a distance of 1.2 Km in northeast direction. The main
approach road is Hyderabad – Narsapur passing at a distance of 2 km in east direction.
The nearest railway station is Medchal at a distance of 12.87 km in southeast direction
and the nearest airport is located at a distance of 48 km in southeast direction. Medchal
town is located at a distance of 12.8 km in southeast direction. There are no major water
bodies within the study area. Bonthapalle RF at a distance of 0.4 Km in northwest,
Jinnawaram RF at a distance of 6.5 Km in southwest, Mangapet RF at a distance of 5 Km
in east, Royyapalli RF at a distance of 7 Km in east, Wailal RF at a distance of 8 Km in
south, Dundigal RF at a distance of 8.5 Km in southeast, Nagawaram RF at a distance
of 8 Km in northwest, Mambapur RF at a distance of 6.5 Km in northwest, Nallavalli RF
at a distance of 8 Km in northwest, Pottaguda RF at a distance of 9 Km in southwest
directions respectively. There are no ecologically sensitive areas like national parks,
and sanctuaries within 10 km radius of the site. The site is located at a distance of 11.5
Km from the critically polluted area of Patancheru and Bollaram Industrial estates.
Product Profile
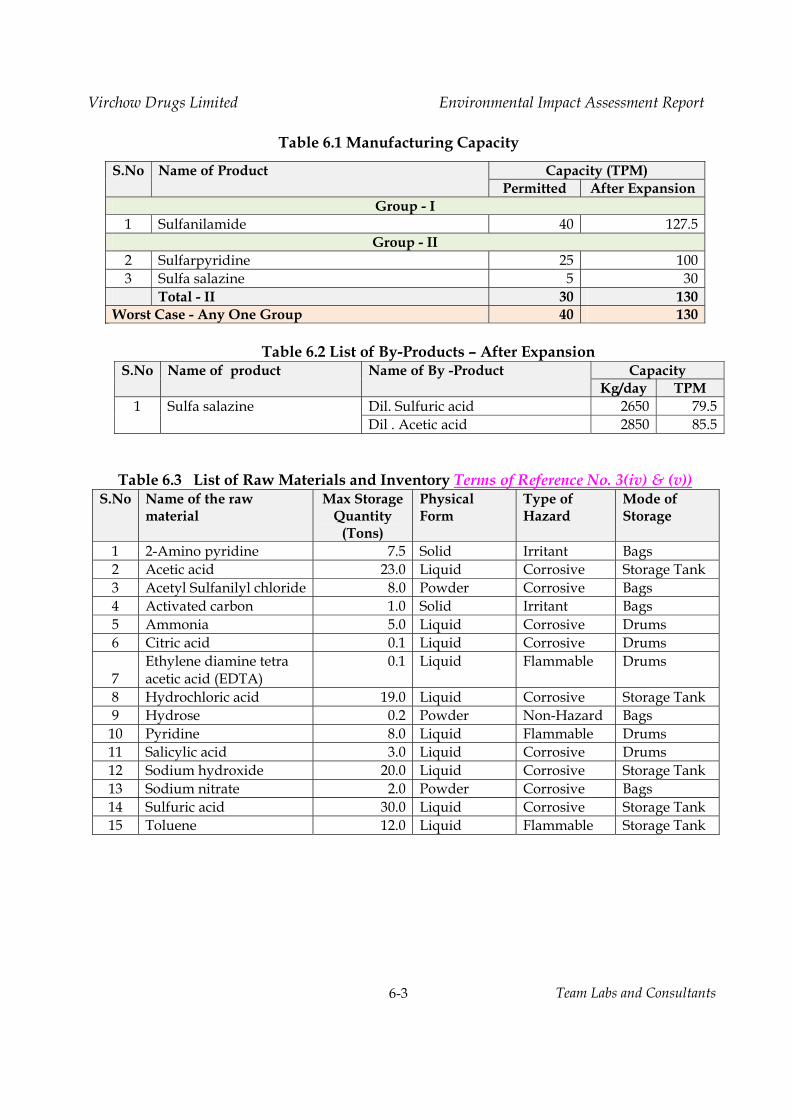
The manufacturing capacity of permitted and after expansion is presented in following.
Manufacturing Capacity S.No Name of Product Capacity (TPM)
Permitted After Expansion
Group - I 1 Sulfanilamide 40 127.5
Group - II 2 Sulfarpyridine 25 100 3 Sulfa salazine 5 30 Total - II 30 130
Worst Case - Any One Group 40 130
List of By-Products – After Expansion
Virchow Drugs Limited Executive Summary
Team Labs and consultants E-3
S.No Name of product Name of By -Product Capacity Kg/day TPM
Chemical synthesis produces majority of API’s currently in the market. Chemical
synthesis consists of four steps - reaction, separation, purification, and drying. Large
volumes of solvents are used during chemical syntheses, extractions, and solvent
interchanges. The manufacturing process of the above mentioned molecules involve
various types of reactions like acetylyzation, protection, deprotection etc. The
manufacturing process of all the compounds, reactions involved, material balance are
presented in chapter 2 of EIA report.
Utilities
The proposed expansion requires additional steam. It is proposed to install 4 TPH coal
fired boiler and change the fuel of existing 3 TPH oil fired boiler to 3 TPH coal fired
boiler. The required steam is drawn from proposed 4 TPH coal fired boiler and existing
3 TPH boiler, while the existing 1TPH coal fired boiler will be dismantled after
expansion. No additional DG sets are proposed, existing DG sets of capacity 500 and
200 KVA shall be kept as standby during load shut down.The list of utilities is
presented in the following Table.
List of Utilities S.No Description Capacity
Existing Proposed Total after Expansion 1 Coal Fired Boilers 1 x 1 TPH* 1 x 4 TPH 1 x 4 TPH
1 x 3 TPH 2 Oil Fired Boiler 1 x 3 TPH** --- --- 3 DG Set# 1 x 200 KVA
1 x 500 KVA 1 x 200 KVA
1 x 500 KVA * Shall be dismantled after expansion ** Fuel changed from oil to coal. # DG sets will be used during load shut down by TSTRANSCO
Water Requirement
Water is required for process, scrubbers, washing, cooling tower makeup, steam
generation and domestic purposes. The total water requirement shall be increased from
Virchow Drugs Limited Executive Summary
Team Labs and consultants E-4
97.33 KLD to 249.5 KLD after expansion out of which 159.5 KLD will be fresh water and
balance shall be recycled water. The required water shall be drawn from TSIIC
(Industrial supply) in addition to reuse of treated wastewater. The water balance for
daily consumption is presented in the following table;
Total Water Balance – After Expansion Purpose INPUT (KLD) OUTPUT (KLD)
Fresh Water Recycled Water Loss Effluent Process 42 51.97* Washings 5 5 Scrubber 3 3 Boiler Feed 19 16 3 Cooling Tower 75 90 135 30 RO/DM Plant 4.5 4.5 Domestic 5 0.5 4.5 Gardening 6 6 Gross Total 159.5 90 157.5 101.97 Total 249.5 259.47 * Process effluents contain soluble raw materials, byproducts, solvents etc.
Baseline Environmental Data
The baseline data was collected in the study area during the months of February 2016
to May 2016 parallel for M/s. Granules India Limited (formerly known as Auctus
Pharma Unit III) and Sri Gayatri Drugs Pvt. Ltd., which obtained TOR simultaneously.
The baseline data involves collection of Samples of ground water, surface water and
soil, monitoring of ambient air quality, noise levels, ecological status and
meteorological parameters. The analytical results show that the values are within the
prescribed limits for air quality. The ground water quality is observed to be above the
limits for potable purpose when compared to the prescribed standards of IS: 10500 –
2012 at few locations.
Identification and Quantification of Impacts
The impact assessment report has identified various sources of pollution and quantified
the pollution loads due to the expansion. It has also identified the technologies to be
adopted for the mitigation and control of the same. The sources of pollution are air
emissions from utilities and process; liquid effluents from process, utilities and
domestic sources; solid wastes from process, treatment systems and utilities; and noise
pollution from utilities, and process equipment.
Virchow Drugs Limited Executive Summary
Team Labs and consultants E-5
Impacts on Air quality: The impacts on air quality shall be due to the emissions from,
Coal Fired Boilers and DG sets. The incremental concentrations are quantified using
ISC-AERMOD model based on ISCST3 Algorithm for all the four co-located units. The
results indicate marginal increase in ambient air quality concentration. The predicted
values for SPM, PM10, PM2.5, SO2 and NOx are 5.19, 2.10, 0.94, 6.89 and 4.10 μg/m3
respectively at a distance of 0.5 Km in northeast direction, and the cumulative values of
baseline air quality combined with predicted values are found to be within the
prescribed limits of National Ambient Air Quality Standards.
Impacts on Water: Water is essentially used for process, utilities and domestic
purposes. The total fresh water required of quantity 159.5 KLD after expansion will be
drawn from TSIIC supply in addition to recycled water of 90 KLD. No impact on water
quality is expected due to the discharge of effluents as zero liquid discharge in
envisaged, which ensures reuse of treated effluents for cooling tower makeup. There is
no usage of treated water for on land irrigation.
Impacts on Noise quality: The noise levels may increase due to motors, compressors,
DG set and other activities. The predicted cumulative noise levels (as calculated by the
logarithmic model without noise attenuation) ranged between 55 and 75 dB(A) at
distances of 10 to 15m. The impact is found to be insignificant beyond the premises.
Impacts on Soil: The solid wastes generated from process, utilities and effluent
treatment plant may have significant negative impacts if disposed indiscriminately.
Hence appropriate measures for storage and disposal of solid wastes need to be
implemented.
Impacts on Ecology: There are no endangered species of flora and fauna in the impact
area. Hence there is no significant impact on ecology.
Impacts on Socio Economy: There is a potential for direct/indirect employment for the
locals. The impact area with low industrial density will have positive benefits due to
the project.
Environment Management Plan
Virchow Drugs Limited Executive Summary
Team Labs and consultants E-6
The management plan is drawn in consultation with project proponents and technical
consultants after evaluating a number of technologies available for mitigation and
control of pollution. The EMP is drawn to address the impacts monitored, identified
and predicted. The EMP addresses the impacts identified during construction and
operation stages. The impacts during construction stage are temporary and less
significant, the management plan for impacts identified during operation stage is
detailed below.
Liquid Effluents
Liquid effluents generated from manufacturing processes causes soil contamination if
untreated effluents are disposed on land. The effluents generated in the process,
separation techniques and purification contain organic residues and inorganic
materials, solvents, and traces or products. These effluents contain both organic and
inorganic salts in various quantities leading to high COD and TDS levels respectively.
The details of process effluent segregation are presented in the Environment
Management Plan. Typical effluent characteristics and mode of treatment are presented
as follows:
Total Effluent Generated and Mode of Treatment Description Quantity (KLD) Mode of Treatment
Permitted After Expansion
HTDS Effluents (TDS & COD> 15000 mg/l) Process 9.045 51.97 Sent to Stripper followed by forced
evaporator and ATFD. Stripper Condensate is reused in process. Evaporator and ATFD Condensate sent to Biological treatment plant followed by RO. RO rejects sent to Forced evaporator and permeate are reused in cooling towers make-up.
Scrubber Effluent 3 Sent to Forced evaporator followed by ATFD, Biological treatment plant and RO. RO/DM rejects 4.5
Total - I 9.045 59.47 LTDS Effluents (TDS & COD< 15000 mg/l)
Washings 1 5 Sent to Biological Treatment System followed by RO. RO permeate reused for cooling towers makeup. RO rejects sent to Forced evaporator.
Boiler Blow downs 0.5 3 CT Blow downs 1 30 Domestic 1 4.5 Total - II 3.5 42.5 Grand Total (I+II) 12.545 101.97
Virchow Drugs Limited Executive Summary
Team Labs and consultants E-7
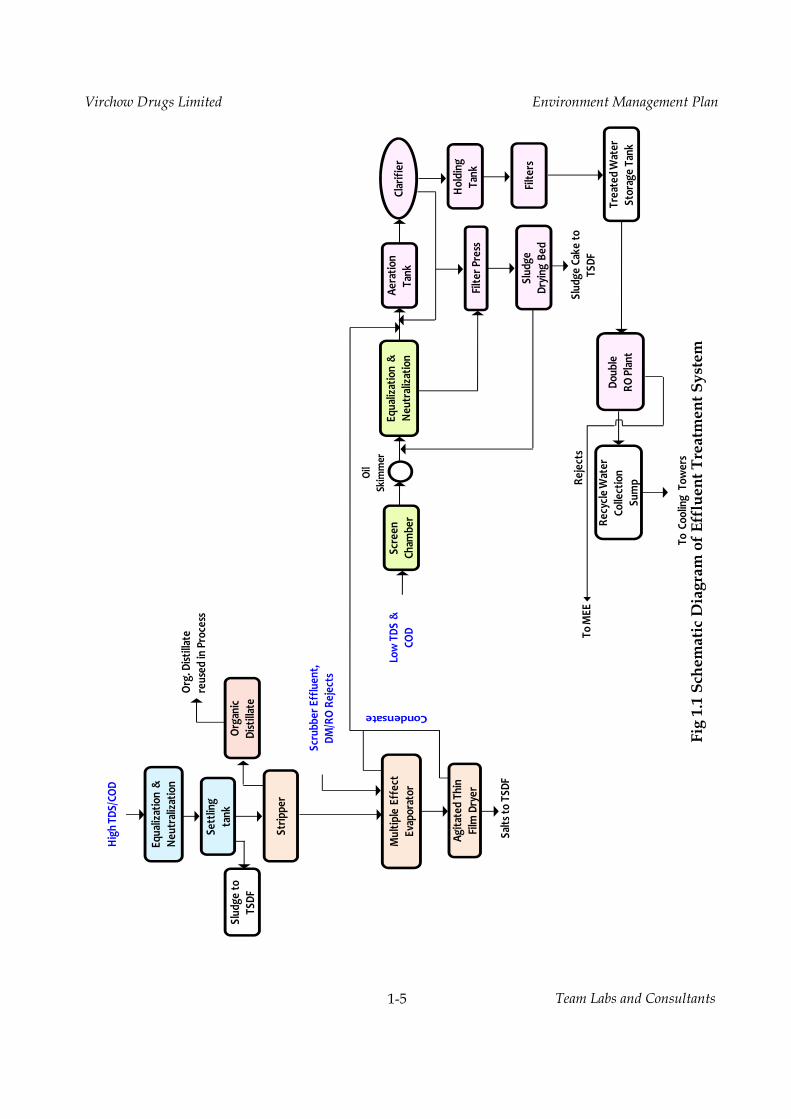
Effluent Treatment System
The Effluent management system is developed to ensure `Zero Liquid Discharge’. The
effluents are segregated into two streams High COD/TDS and Low COD/TDS streams.
The effluents are segregated stream wise based on the characteristics of effluents, i.e.,
less than 15000 mg/l of TDS and COD are considered as low TDS effluents, while the
others are considered as high COD/TDS effluents.
The High TDS/ COD Effluents
The treatment system for treating High TDS/ COD effluents consists of Equalization,
Neutralization, Settling tank, Stripper, forced Evaporator followed by Agitated Thin
Film Dryer (ATFD). The organic distillate from the stripper is reused in process and
aqueous bottom from stripper is sent to forced evaporator followed by ATFD for
evaporation. The condensate from the forced evaporator and ATFD are sent to ETP
(Biological). Salts from ATFD are disposed to TSDF.
The Low TDS/ COD Effluents:
These effluents along with the condensate from forced evaporator and ATFD are
treated in primary treatment consisting of equalization, neutralization, and primary
sedimentation followed by secondary biological treatment consisting of aeration tank
and clarifier. The treated effluents after biological treatment are subjected to tertiary
treatment in a reverse osmosis system. Permeate from RO is reused for cooling tower
and rejects are sent to forced evaporator followed by ATFD. Sludge from various units
of Biological treatment are thickened in sludge handling system and sent to TSDF
Air Pollution
The sources of air pollution are from proposed 4 TPH Coal fired boilers and existing 3
TPH coal fired boiler (fuel change from oil fired to coal fired). It is proposed to
dismantle existing 1 TPH coal fired boiler after expansion. The proposed air pollution
control equipment for 4 TPH and 3 TPH Coal fired boilers is Multi cone cyclone
separators. DG sets shall be provided with stack heights based on the CPCB formula for
effective stack height.
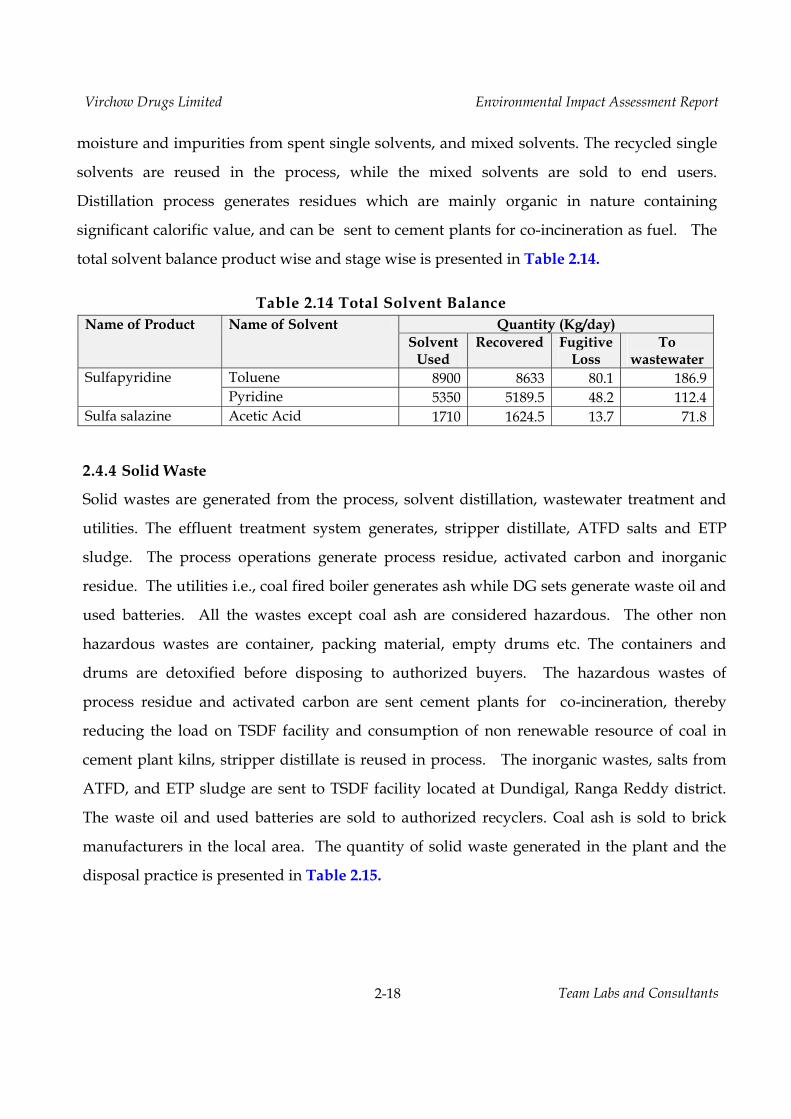
Solvent Use and Recycle
Virchow Drugs Limited Executive Summary
Team Labs and consultants E-8
Solvents are used for extraction of products and as reaction medium. Used solvents
recovered by distillation for reuse. The recovered solvents are reused.
Virchow Drugs Limited Executive Summary
Team Labs and consultants E-9
Solid Waste
Solid wastes are generated from process, solvent distillation, effluent treatment system,
DG sets and boilers. Stripper distillate reuse in process. The evaporation salts are sent
to TSDF. Filter media like activated carbon and catalyst are sent to TSDF. Waste oil
and used batteries from the DG sets are sent to authorized recyclers. Sludge from
effluent treatment plant is considered hazardous and the same is sent to TSDF. Other
solid wastes expected from the unit are containers, empty drums which are returned to
the product seller or sold to authorized buyers after detoxification. Coal ash from boiler
is sold to brick manufacturers.
Noise Pollution
Noise is anticipated from motors, compressors, centrifuges and DG sets. DG set shall be
provided with acoustic enclosure. Motors and compressors shall be mounted properly
to ensure reduction of noise and vibration. Employees working in noise generating
areas shall be provided with appropriate personnel protective equipment.
Occupational Safety and Health
Direct exposure to pharmaceuticals or its raw materials may affect health of employees.
Direct exposure to hazardous materials is eliminated by providing closed handling
facilities. Personal Protective Equipment (PPE) i.e., hand gloves, safety goggles, safety
shoes, safety helmets, respiratory masks etc. are provided to all the employees working
in the plant. Company has a policy of providing PPEs to all personnel including
contract workers.
Prevention, maintenance and operation of Environment Control Systems
The pollution control equipment and effluent treatment systems will be periodically
monitored and checked for their performance and preventive maintenance will be
adopted. The environmental monitoring results will be evaluated to identify the
problems/ under performance of the equipment. Necessary steps will be taken to
rectify the problems/defects, if any. The management agrees that the evaluation of the
performance of pollution control measures and occupational safety measures are
adopted to ensure their effectiveness
Virchow Drugs Limited Executive Summary
Team Labs and consultants E-10
Transport systems
Raw materials and finished products are transported by road. Sufficient parking
facilities are provided for vehicles loading and unloading of goods. As plant is located
away from habitation there will not be any unauthorized shop or settlements along the
road connecting the plant site. There will be 2 truck trips per day to the factory. The
vehicles are provided with parking space near the gate, and road safety signage is
placed in the battery limit. Drivers of the vehicles will be provided with TREM cards
and will be explained the measures to be adopted during various emergencies.
Reduce, Recycle and Reuse
A number of measures are proposed to achieve high yields and reduce generation of
wastes. It shall be endeavor of the R&D team to improve yields through constant
research and development activities. The solvents shall be recycled for reuse in the
process after distillation. Mother liquors from the first crop shall be reused for process.
Treated effluent shall be reused for cooling tower makeup.
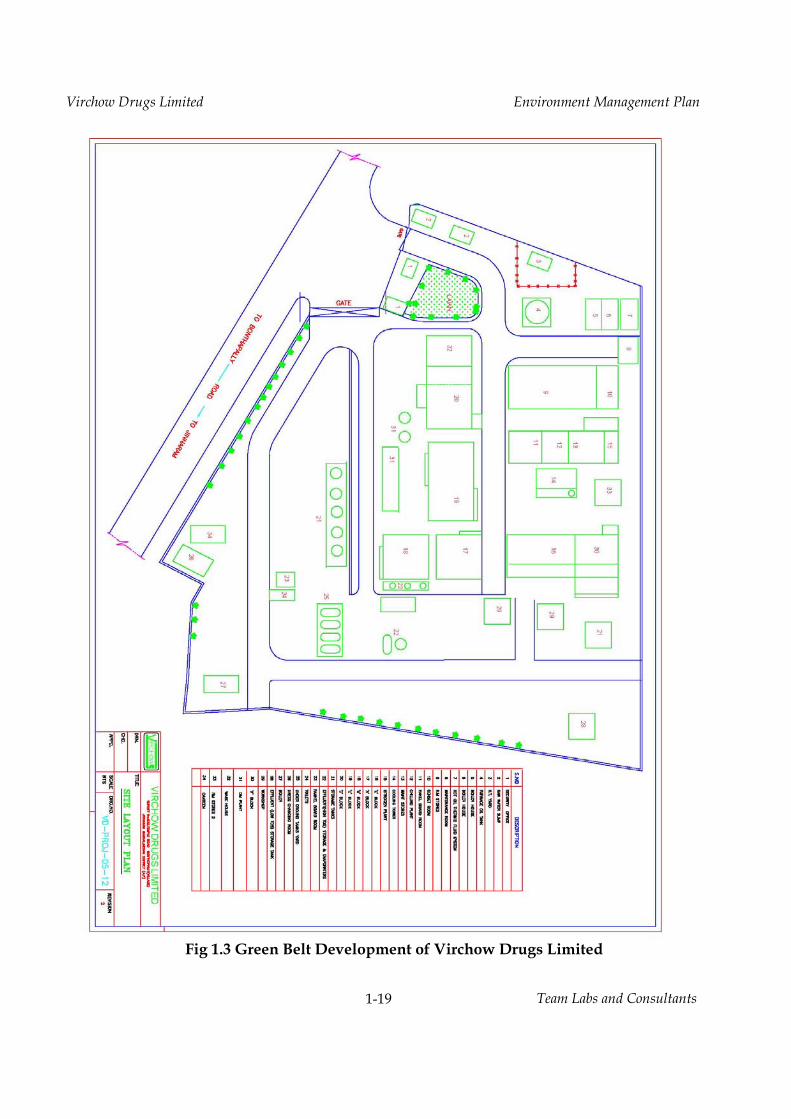
Green Belt Development
Green belt is recommended as one of the major components of EMP. The management
emphasizes the development of further greening of the site in an area of 0.99 acres to
enhance environmental quality through mitigation of fugitive emissions, attenuation of
noise levels, balancing eco-environment, consumption of treated effluent, prevention of
soil erosion, and creation of aesthetic environment.
Post Project Monitoring
Environmental monitoring for water, air, noise and solid waste quality shall be
conducted periodically either by proponent or third party. The frequency of
monitoring and the quality parameters shall be as suggested by the Ministry of
Environment and Forests, Government of India.
Environment Management Department
The Environment Management Cell of the project shall be headed by the Production
Manager, and shall be assisted by 4 no.s operators, 3 no.s of chemist and 3 nos. of
Table 2.3 Material Balance for Sulfanilamide Stage I Input Quantity
(Kg/day) Output Quantity
(Kg/day) Remarks
Acetyl Sulfanyl chloride 6435.8 Stage I Product 5868.8 to stage II Ammonia 937.1 Ammonium chloride 1467.2 To waste water Water 8000 Acetyl Sulfanyl chloride 32.2 To waste water Ammonia 4.7 To waste water Water 8000 To waste water Total Input 15372.9 Total Output 15372.9 Stage II Input Quantity
(Kg/day) Output Quantity
(Kg/day) Remarks
Stage I Product 5868.8 Sulfanilamide 4250.0 Final product Sodium hydroxide 3621.1 Sodium acetate 2026.2 To Waste water Sulfuric acid 3225.1 Sodium Sulfate 4673.4 To Waste water Activated carbon 125 Stage I Product 581 To waste water Water 34000 Activated carbon 125.0 Organic Residue Water 35184.5 To Waste water Total Input 46840.0 Total Output 46840.3
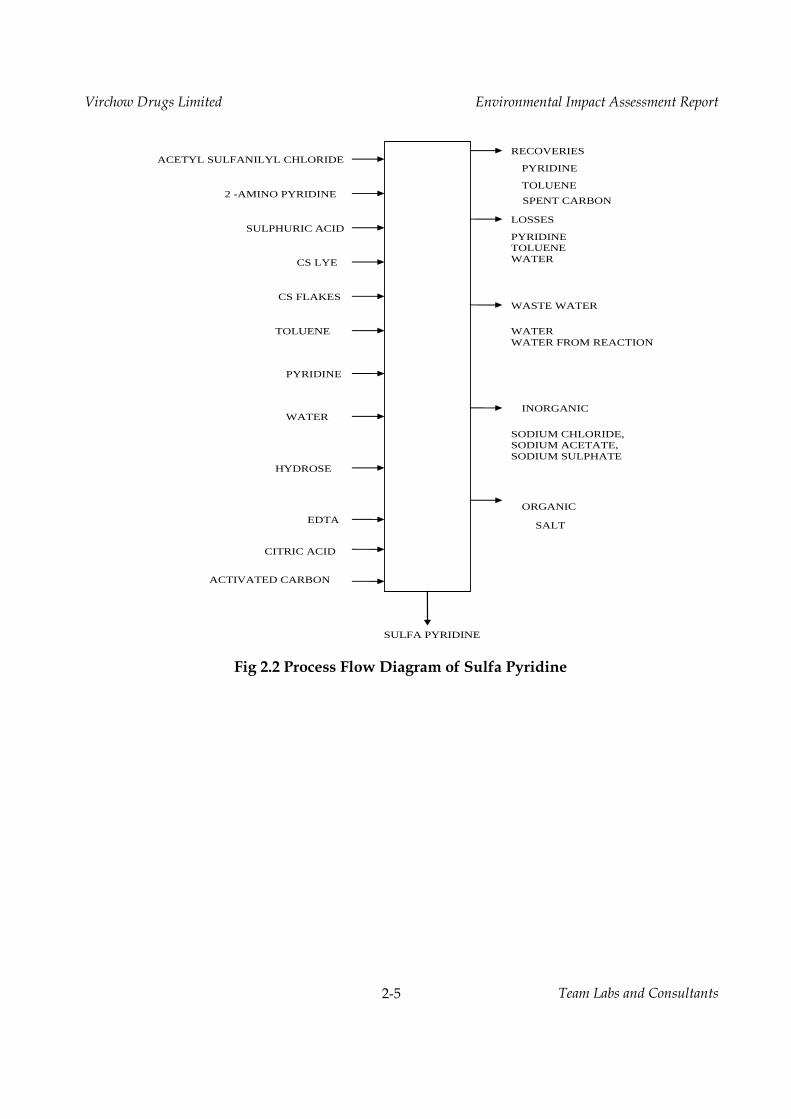
2.1.2 Process Description of Sulfa Pyridine Reaction of Sulfa Pyridine
Process Description for Sulfa Pyridine
2-Aminopyridine is condensed with Acetyl sulfanilyl chloride in presence of Toluene-
Pyridine medium to give Acetyl sulfa pyridine. This on hydrolysis with caustic soda and
subsequent recovery of Toluene-pyridine mixture gives Sodium salt of sulfa pyridine. This
on Activated carbon treatment followed by neutralization with Sulphuric Acid gives Sulfa
pyridine pharma. The process flow diagram is presented in Fig 2.2 and material balance is
Table 2.4 Material Balance for Sulfa Pyridine Input Quantity
(Kg/day) Output Quantity
(Kg/day) Remarks
Acetyl Sulfanilyl chloride
4007.1 Sulfapyridine 3333 Final product
2-Amino pyridine 1480.4 Sodium acetate 1097.6 To waste water Sodium hydroxide 2443.7 Sodium sulfate 2437 To waste water Sulfuric acid 1682 Sodium chloride 783.1 To waste water Toluene 8900 Water formed in reaction 722.8 To waste water Pyridine 5350 Toluene Recovered 8633 Recovered & reused Water 22000 Toluene Loss 80.1 Fugitive Loss Hydrose 33 Toluene to Wastewater 186.9 To waste water Ethylene diamine tetra acetic acid (EDTA)
6 Pyridine Recovered 5189.5 Recovered & reused
Citric acid 6 Pyridine Loss 48.2 Fugitive Loss Activated Carbon 100 Pyridine to Wastewater 112.4 To waste water Acetyl Sulfanilyl chloride 881.6 To waste water 2-Amino pyridine 222.0 To waste water Activated carbon 100 Organic residue Hydrose 33.3 To waste water Citric acid 6 To waste water EDTA 6 To waste water Water 22136 To waste water Total Input 46007.9 Total Output 46008.3
Table 2.5 Material Balance for Sulfa Salazine Input Quantity
(Kg/day) Output Quantity
(Kg/day) Remarks
Sulfapyridine 949.9 Sulfa salazine 1000 Final product Salicylic acid 526.5 Sodium chloride 669.5 To waste water Sodium nitrite 263.2 Water formed in reaction 251.2 To waste water Sodium hydroxide 1100 Acetic acid Recovered 1624.5 Recovered &
reused Hydrochloric acid 418 Acetic acid Loss 13.7 Fugitive Loss Activated Carbon 40 Acetic acid to waste water 71.8 To waste water Ethylene diamine tetra acetic acid (EDTA)
10 Sulfapyridine 324.8 To waste water
Acetic acid 2850 Salicylic acid 180 To waste water Sulfuric acid 2500 Activated Carbon 40 To spent carbon Water 20000 EDTA 10 To waste water Dil.Acetic acid(40%) 2850 By product Dil. Sulfuric acid(60%) 2650 By product Sodium nitrite 90 To waste water Sodium sulfate 1318.9 To waste water Water 17563.2 To waste water Total Input 28657.6 Total Output 28657.7
2.2 Utilities
The proposed expansion requires additional steam. It is proposed to install 4 TPH coal
fired boiler and change the fuel of existing 3 TPH oil fired boiler to 3 TPH coal fired
boiler. The required steam is drawn from proposed 4 TPH coal fired boiler and existing 3
TPH boiler, while the existing 1TPH coal fired boiler will be dismantled after expansion.
No additional DG sets are proposed, existing DG sets of capacity 500 and 200 KVA shall
be kept as standby during load shut down. The list of utilities is presented in Table 2.6.
Table 2.6 List of Utilities S.No Description Capacity
Existing Proposed Total after Expansion 1 Coal Fired Boilers 1 x 1 TPH* 1 x 4 TPH 1 x 4 TPH
1 x 3 TPH 2 Oil Fired Boiler 1 x 3 TPH** --- --- 3 DG Set# 1 x 200 KVA
1 x 500 KVA 1 x 200 KVA
1 x 500 KVA * Shall be dismantled after expansion ** Fuel changed from oil to coal. # DG sets will be used during load shut down by TSTRANSCO
2.3 Water Requirement (Terms of Reference No. 3(vii))
Water is required for process, scrubbers, washing, cooling tower makeup, steam generation
and domestic purposes. The total water requirement shall be increased from 97.33 KLD to
249.5 KLD after expansion out of which 159.5 KLD will be fresh water and balance shall be
recycled water. The required water shall be drawn from TSIIC (Industrial supply) in
addition to reuse of treated wastewater. The water balance for daily consumption is
presented in Table 2.7
Table 2.7 Total Water Balance – After Expansion Purpose INPUT (KLD) OUTPUT (KLD)
Fresh Water Recycled Water Loss Effluent Process 42 51.97* Washings 5 5 Scrubber 3 3 Boiler Feed 19 16 3 Cooling Tower 75 90 135 30 RO/DM Plant 4.5 4.5 Domestic 5 0.5 4.5 Gardening 6 6 Gross Total 159.5 90 157.5 101.97 Total 249.5 259.47
* Process effluents contain soluble raw materials, byproducts, solvents etc. 2.4 Pollution Control Facilities: Liquid Effluents, air emissions and solid wastes generated are the major pollutants from the
process operations of bulk drug manufacturing. The pollution control measures proposed to
treat/mitigate the emissions and effluents are described as follows.
2.4.1 Water Pollution:
The effluents generated in the process, separation techniques and during purification
contain organic residues and inorganic raw materials, solvents, and products. Hence the
effluents contain both organic and inorganic salts in various quantities leading to high COD
and TDS levels respectively. Effluents from process, washings, Scrubbing media, and utility
blow downs will be sent to the effluent treatment system. The treated effluent will be
reused for cooling towers. The domestic waste water will be sent to biological treatment
plant along with LTDS effluents. The total effluent generated and mode of treatment is
presented in Table 2.8. Quantity and quality of effluents generated from process product
wise and stage wise is presented in Table 2.9 and 2.10.
Table 2.8 Total Effluent Generated and Mode of Treatment – After Expansion Description Quantity (KLD) Mode of Treatment
Permitted After Expansion
HTDS Effluents (TDS & COD> 15000 mg/l) Process 9.045 51.97 Sent to Stripper followed by forced
evaporator and ATFD. Stripper Condensate is reused in process. Evaporator and ATFD Condensate sent to Biological treatment plant followed by RO. RO rejects sent to Forced evaporator and permeate are reused in cooling towers make-up.
Scrubber Effluent 3 Sent to Forced evaporator followed by ATFD, Biological treatment plant and RO. RO/DM rejects 4.5
Total - I 9.045 59.47 LTDS Effluents (TDS & COD< 15000 mg/l)
Washings 1 5 Sent to Biological Treatment System followed by RO. RO permeate reused for cooling towers makeup. RO rejects sent to Forced evaporator.
Boiler Blow downs 0.5 3 CT Blow downs 1 30 Domestic 1 4.5 Total - II 3.5 42.5 Grand Total (I+II) 12.545 101.97
Table 2.9 Effluent Generated and Characteristics from Process – Product Wise
S.No Name of Product Quantity (Kg/Day) Conc. (mg/l) Water Input
TDS COD Total Effluent
TDS COD
Group - I 1 Sulfanilamide 42000 8171 730 51969.4 157236 14053
Group - II 2 Sulfarpyridine 22000 4351 2040 28624.5 152002 71272 3 Sulfa salazine 20000 2078 839 20479.5 101491 40946 Total - II 42000 6429 2879 49104.0 130935 58624
Worst Case - Any One Group 42000 8171 2879 51969 157236 55392
Table 2.12 Technical Specifications of Biological Treatment Plant Design inputs Data Flow from Evaporation : 42.0 KLD LTDS effluent : 50.0 KLD Total Flow : 92 KLD Design Capacity : 96 m3/day 1.Equalization Tank Peak Flow ( Designed) : 3.83 m3/hr Hydraulic retention time : 10 Hrs. at peak flow Volume of the tank : 40 m3 Tank dimensions : 4 x 4 x 2.5 L X B X H, m Air required for agitation : 0.01 m3/m2 min Total air required : 9.6 m3/hr Air blower required : 3HP m3/[email protected] 2) Primary clarifier Design quantity : 92 KLD Width : 2300 mm Length : 1300 mm Depth : 1200 mm No.of plates : 15 3) Biozone (Aeration)Tank Actual Flow : 92 KLD Length : 6900 mm Width : 2200 mm Diameter of Rotor : 1500 mm No of Rotors : 3 No.s 4) Secondary Clarifier : Width : 2300 mm Length : 1600 mm Depth : 1200 mm No.of plates : 22 5). Holding tank The flow from the each individual settling tank I,e the supernatant liquid is let into the respective Pre-Filtration Tank, which has a minimum 8 hours holding capacity. 6) MGF Capacity : 92 KLD Feed pump flow rate : 4.0 m3 Head : 30 m 8. ACF Capacity : 92 KLD Feed pump flow rate : 4.0 m3 Head : 30 M Rverse Osmosis Plant – I : 70 KL Rverse Osmosis Plant – I : 20 KL
Source: Bruce and Rayment (1982). Ca/mg Ratio Base Saturation as a criterion of leaching
Description Range (%BS) Rating <1 Ca Deficient 70-100 Very Weakly Leached 1-4 Ca (Low) 50-70 Weakly Leached 4-6 Balanced 30-50 Moderately Leached 6-10 Mg (Low) 15-30 Strongly Leached >10 Mg deficient 0-15 Very Strongly Leached Source: Eckert (1987) Source: Metson (1961)
Rating of Total Nitrogen Extractable Potassium (K) Rating (% by W) Description K <0.05 Very low low <150 ppm* (< 0.4 meq/100 g soil) 0.05-0.15 Low medium 150–250 ppm (0.4–0.6 meq/100 g soil) 0.15-0.25 Modium high 250–800 ppm (0.6–2.0 meq/100 g soil) 0.25-0.50 High excessive >800 ppm (>2.0 meq/100 g soil) >0.5 Very High Source: Abbott (1989) Source: Bruce and Rayment (1982)
Table 3.7 National Ambient Air Quality Standards Pollutant Time
Weighted Average
Concentration in Ambient Air
Industrial, Residential, Rural and
Other Area
Ecological Sensitive Area (Notified by
Central Government)
Methods of Measurement
Sulphur Dioxide (SO2)
Annual* 24 Hours**
50
80
20
80
Improved west and Gaeke Ultraviolet fluorescence
Nitrogen Dioxide (NO2)
Annual* 24 Hours**
40
80
30
80
Modified Jacob & Hochheiser (Nn-Arsenite) Chemiluminescence
Particulate Matter (Size Less than 10µm) or PM10
Annual* 24 Hours**
60
100
60
100
Gravimetic TOEM Beta Attenuation
Particulate Matter (Size Less than 2.5µm) or PM2.5
Annual* 24 Hours**
40
60
40
60
Gravimetic TOEM Beta Attenuation
Ozone (O3) 8 hours** 1 hour**
100
180
100
180
UV Photometric Chemilminescence Chemical Method
Lead (Pb) Annual* 24 hours**
0.50
1.0
0.50
1.0
AAS /ICP method after sampling on EPM 2000 or equivalent filter paper ED - XRF using Teflon filter.
Carbon Monoxide (CO)
8 hours** 1 hour**
02
04
02
04
Non Dispersive Infra Red (NDIR) Spectroscopy
Ammonia (NH3) Annual* 24 hours**
100 400
100 400
Chemilminescence Indophenol blue method
Benzene (C6H6) Annual* 05 05 Gas Chromotography based continuous analyzer Absorption and Desorption followed by GC analysis
Benzo (o) Pyrene(BaP) – Particulate Phase only,
Annual* 01 01 Solvent extraction followed by HPLC/GC analysis
Arsenic (As), Annual* 06 06 AAS/ICP method after sampling on EPM 2000 or equivalent filter paper
Nickel (Ni), Annual* 20 20 AAS/ICP method after sampling on EPM 2000 or equivalent filter paper
G.S.No.826 (E) dated 16th November, 2009. Vide letter no. F. No. Q-15017/43/2007-CPW *Annual Arithmetic mean of minimum 104 measurements in a year at a particular site taken twice a week 24 hourly at uniform interval. **24 hourly/8/1 hourly monitored values as applicable, shall be complied with 98 percent of the time in a year.2% of time they may be exceeded the limits but not on two consecutive days of monitoring.
Table 3.11 Effects on Human Beings at Different Noise Levels Source Noise Level dB(A) Effects
Large Rocket Engine (near by) 180 Threshold of Pains Hydraulic Press ( 1 m ) 130 Jet take off (60 m) 120 Maximum vocal effort
possible Automobile Horn (1m) 120 Construction Noise (3m) 110 Jet Take off (600 m) 110 Shout, Punch, Press, Circular Saw 100 Very annoying Heavy Truck (15m), Farm Machinery 90 Prolonged exposure
Endangers Lathes, Sports Car, Noisy Machines hearing loss
intrusive Loud Conversations 60 Living Room in Home 50 Quiet Power Station (15m) 50 Bed Room in Home 40 Soft Whisper (5m) 30 Very quiet Tick of Wall clock (1m) 30 Low radio Reception 20 Whisper 20 Rattling of Leaves by Breeze 10 Barely audible 0 Threshold of hearing
Table 3.12 Equivalent Noise levels in the Study Area (Terms of Reference No. 6(vii)
S.No. Location Equivalent Noise Levels dB(A) Leq day Leq night
Category Population Total Population 101506 Male 53244 Female 48262 Population <6 years 15194 Male <6 years 7846 Females < 6years 7348 Scheduled Caste Population - Total 13654 Male – SC 6826 Female – SC 6828 Scheduled Tribe Population - Total 3365 Male – ST 1680 Female – ST 1685
3.6.1.2 Literacy
Census operations consider a literate as a person who is above six years old and who
can write and read as per the census. Table 3.14 presents the literacy levels in the
study area.
The population below six years old is 15194 consists of 7846 males and 7348 females,
which is 14.96 % of the study area population. It may be observed that the literacy
levels among females in general are low compared to the literacy levels among
males.
Table 3.14 Literacy - Study Area Category Population Total Population 101506 Total Population – Male 53244 Total Population - Female 48262 Population <6 years 15194 Male <6 years 7846 Females < 6years 7348 Total Literates 51834 Male –Literates 32623 Female – Literates 19211 Total Illiterates 49672 Male –Illiterate 20621 Female – Illiterate 29051
The percentage of literacy level in the study area among males is 32.13 and 18.93
among females. It may be observed that the literacy level among females is
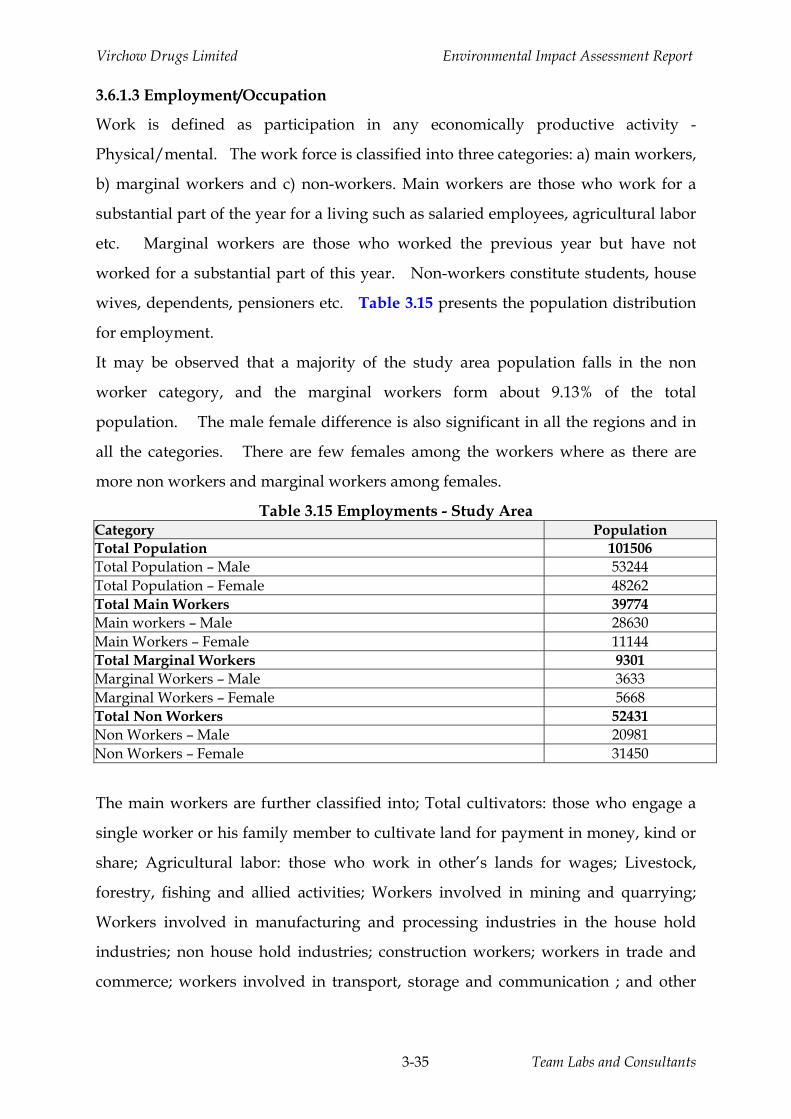
Work is defined as participation in any economically productive activity -
Physical/mental. The work force is classified into three categories: a) main workers,
b) marginal workers and c) non-workers. Main workers are those who work for a
substantial part of the year for a living such as salaried employees, agricultural labor
etc. Marginal workers are those who worked the previous year but have not
worked for a substantial part of this year. Non-workers constitute students, house
wives, dependents, pensioners etc. Table 3.15 presents the population distribution
for employment.
It may be observed that a majority of the study area population falls in the non
worker category, and the marginal workers form about 9.13% of the total
population. The male female difference is also significant in all the regions and in
all the categories. There are few females among the workers where as there are
more non workers and marginal workers among females.
Table 3.15 Employments - Study Area Category Population Total Population 101506 Total Population – Male 53244 Total Population – Female 48262 Total Main Workers 39774 Main workers – Male 28630 Main Workers – Female 11144 Total Marginal Workers 9301 Marginal Workers – Male 3633 Marginal Workers – Female 5668 Total Non Workers 52431 Non Workers – Male 20981 Non Workers – Female 31450
The main workers are further classified into; Total cultivators: those who engage a
single worker or his family member to cultivate land for payment in money, kind or
share; Agricultural labor: those who work in other’s lands for wages; Livestock,
forestry, fishing and allied activities; Workers involved in mining and quarrying;
Workers involved in manufacturing and processing industries in the house hold
industries; non house hold industries; construction workers; workers in trade and
commerce; workers involved in transport, storage and communication ; and other
services: government employees, teachers, priests, artists etc. Table 3.16 presents
the main workers distribution among the study area population.
It may be observed that over 8.3 % of the study area population is involved in
cultivation or agriculture labor, followed by other services to the tune of 8.4%. It may
also be observed that the people involved in non household industry are
significantly more reflecting on the industrial nature of the area. Significant
differences are observed among the male and female workers, Female workers are
found to be more in agricultural activity largely due to more percentage of females
being agricultural labor.
Table 3.16 Main Workers - Study Area Category Population Total Population 101506 Total Population – Male 53244 Total Population – Female 48262 Total Main Workers 39774 Main workers – Male 28630 Main Workers – Female 11144 Total Cultivators 8393 Cultivators – Male 5821 Cultivators- Female 2572 Total Agriculture Labor 8534 Agriculture Labor – Male 4102 Agriculture Labor – Female 4432 Total Household Workers 693 Household Workers – Male 438 Household Workers – Female 255 Total Others 22154 Others – Male 18269 Others – Female 3885
3.6.2 Living Standards and Infrastructure
Sustainable development of any area is dependent not only the population but also
on the availability of infrastructure which leads to better living standards. The
infrastructure facilities are essential in providing education, awareness, health,
communication, potable water, transport etc. The standards of living are the sum of
the availability of the infrastructure to the subject community, wide variations in
terms of income, economic conditions and patterns of spending.
dependent on Kerosene, dried cow dung cakes, wood from roadside trees for their
domestic energy needs.
VI. Post and Telegraph facilities
There are 21 post offices in the area and one post & Telegraph office in the study
area. Phone facilities however are extended to some of the villages.
VII. Housing
Census defines the house hold as a group of persons living together and sharing
their meals from a common kitchen. The number of households in the impact zone
is 22509, while the number of the houses is 21408. The density of the households is
approximately five. The traditional houses made up of mud walls and covered by
dry common grass and leaves of bourses are commonly found in the rural area,
which are not considered pucca houses. The government has been augmenting the
housing standards by constructing housing colonies for various weaker sections of
the society.
3.6.3 Land Utilization
Land use patterns can be prepared on the basis of revenue records though it is not an
exact indicator of the actual use of the land at a given time. The impact zone has a
large area in the coast and the ocean, where land is essentially marshy on the coast.
Land use is presented under the heads of area under forest cover irrigated land, area
under cultivation and cultivable wasteland in Table 3.17.
Table 3.17 Land Utilization Pattern Category Area in Ha Forest Land 4088 Irrigated Land 4188 Culturable waste Land 4554 Unculturable Waste Land 8162 Unirrigated Land 8272 Total Land 292614
It may be observed that a majority of the study area is unirrigated, followed by
Unculturable Waste Land and Culturable waste Land.
Table 3.21 List of vertebrates other than birds found in and around the project site
Common name Scientific name Local name MAMMALS Large bandicoot rat Bandicota indica Pandikokku Short-nosed fruit bat Cynopterus sphinx Gabbilam Three striped squirrel Funambulus palmarum Udatha Indian bush rat Golunda ellioti myothrix Yeluka Indian grey mongoose Herpestes edwardsinyula Mungeesa Indian crested porcupine Hystrix indica Mullapandi Common Indian field mouse Mus booduga Yeluka Mouse Mus musculus homeurus Yeluka Home mouse Mus musculus tytleri Yeluka Bandicoot rat Nosokia indica indica Pandikokku Leopard Panthera pardus * (NT) Chirutha Puli Indian pygmy pipistrelle Pipistrellus mimus mimus Gabbilam Long-eared bat Plecotus auritus homochrous Gabbilam Common Indian rat Rattus rattus gangutrianus Yeluka Common Indian rat Rattus rattus refescens Yeluka Greater yellow bat Scotophillus heathi heathi Gabbilam Savvy pygmy shrew Suncus etruscus micronyx Chuchu House shrew Suncus murinus tytleri Chuchu Wild boar Sus scrofa Adavi Pandi REPTILES Chameleon Chameleon zeylanicus Oosaravelli Cobra Naja naja Naagu paamu Common Indian Krait Bungarus caeruleus Katla paamu Common Indian Monitor Varanus bengalensis Udumu Garden lizard Calotes versicolor Thonda Giant Blind Snake Typhlops diardii Rendu talala
paamu Indian python Python molurus Kond chiluva Indian star tortoise Geochelone elegans Nakshatra
taabelu Rat snake Ptyas mucosa / Tripidonatus pisactor Jerri pothu Russell’s viper Vipera russseli Rakta pinjari Saw scaled viper Echis carinatus Pinjari Slender Blind Snake Typhlops porrectus --- Indian wall lizard Hemidactylus flaviviridis Balli Tree Snake Chrysopelea taprobanica Pasirika paamu Whip Snake Dryphis nasutus --- AMPHIBIANS Indian Burrowing frog Sphaerotheca breviceps Burada kappa Green Pond Frog Rana hexadactyla. Kappa Common Indian Toad Bufo melonosticatus Toad Tiger Frog Hoplobatrachus tigerinus (Rana
Table 3.22 List of Birds either spotted or reported from the areas in and around the project site.
Scientific Name Common Name Family WPA Schedule
Accipiter badius Shikra Accipitridae IV Acridotheres tristis Common myna Sturnidae IV Aegithinia tiphia Common Iora Irenidae IV Alcedo atthis Smallblue kingfisher Alcedinidae IV Amaurornis phoenicurus White-breasted waterhen Recurvirostridae IV Anas poecilorhyncha Spot-billed duck Anatidae IV Ardea cinerea Grey Heron Ardeidae IV Ardeola grayii Pond Heron Ardeidae IV Athene brama Spotted owlet Noctuidae IV Bubulcus ibis Cattle Egret Ardeidae IV Centropus sinasis Greater coucal Phasianidae IV Ceryle rudis Lesser pied Kingfisher Alcedinidae IV Columba livia Blue rock pigeon Columbidae IV Coracias benghalensis Indian roller Coraciidae IV Corvus splendens House crow Corvidae V Dendrocitta vagabunda Indian tree pie Corvidae IV Dendrocygna javanica Lesser whistling-duck Anatidae IV Dicaeum erythrorhynchos Tickell’s flower pecker Dicaeidae IV Dicrurus macrocercus Black drongo Dicruridae IV Egretta garzetta Little egret Ardeidae IV Elanus caeruleus Black-shouldered kite Accipitridae IV Eudynamys scolopace Asian koel Cuculidae IV Fulica atra Coot Rallidae IV Gallinula chloropus Indian Moorhen Rallidae IV Halcyon smyrnensis White-Breasted King
fisher Alcedinidae IV
Hierococcyx varius Brain fever bird Ardeidae IV Himantopus himantopus Black-winged stilt Recurvirostridae IV Hydrophasianus chrugus Pheasant tailed Jacana Jacanidae IV Lanius excubitor Great grey shrike Daniidae IV lxobrychus cinnamomeus Chestnut bittern Ardeidae IV Megalaima haemacephala Copper smith Barbet Capitonidae IV Merops orientalis Small Bee eater Meropidae IV Milvus migrans Black kite Accipitridae IV Motacilla alba White wagtail Motacillidae IV Motacilla flava Yellow wagtail Motacillidae IV Motacilla maderaspatensis Large pied wagtail Motacillidae IV Nectarinia asiatica Purple sunbird Nectariniidae IV Nectarinia zeylonica Purple-rumped sunbird Nectariniidae IV Oriolus oriolus Eurasian golden oriole Oriolidae IV Passer domesticus House sparrow Passeridae IV Pavo cristatus Pea cock / Pea Fowl
(National Bird) Phasianidae I (LC as
per IUCN)
Perirocotus cinnomomeus Small Minivet Phasianidae IV Phalacrocorax carbo Large Cormorant Phalacrocoracidae IV
Phalacrocorax niger Little cormorant Phalacrocoracidae IV Porphyrio porphyrio Purple moorhen Rallidae IV Prinia inornata Plain prinia Cisticolidae IV Prinia socialis Ashy prinia Cisticolidae IV Psittacula cyanocephala Blossom headed
Parakeet Psittacidae IV
Psittacula krameri Rose-Ringed Parakeet Psittacidae IV Pycnonotus cafer Red-vented bulbul Pycnonotidae IV Saxicolodies fulicata Indian robin Turdinae IV Streptopelia chinensis Spotted dove Columbidae IV Streptopelia decaocto Eurasian Collared-Dove Columbidae IV Streptopelia Senegalensis Little brown dove Columbidae IV Streptopelia tranquebarica Red Collared-Dove Columbidae IV Sturnus pagodarum Brahminy starling Sturnidae IV Terpsiphone paradisi Asian paradise-
flycatcher Muscicapidae IV
Turdoides caudatus Common babbler Timalinae IV Upupa epops Common hoopoe Upupidae IV Vanellus indicus Red-wattled lapwing Charadriidae IV
4.3 Prediction of Impact on Air Quality 4.3.1 Details of Mathematical Modeling A large number of different mathematical models for dispersion calculations are in
practice in many parts of the world. Most of the models for prediction of down wind
concentrations are based on Gaussian dispersion. The principle behind the Gaussian
dispersion models is Gaussian probability distribution of concentration in both vertical
and horizontal cross wind directions about the plume central line.
Predictions of ground level concentrations of the pollutants were carried out based on
site meteorological data collected during the study period. For calculation of predicted
ground level concentrations, ISCST3 model of Lakes Environmental based on USEPA,
ISCST3 algorithms, was used; as it’s based on more sophisticated algorithm
incorporating deposition, better algorithm for area sources, etc.
Brief History of the ISC Models
The ISC3 models are based on revisions to the algorithms contained in the ISC2 models.
The latter came about as a result of a major effort to restructure and reprogram the ISC
models that began in April 1989, and was completed in March 1992. The
reprogramming effort was largely motivated by the need to improve the quality,
reliability, and maintainability of the code when numerous "bugs" were discovered after
the implementation of the revised downwash algorithms for shorter stacks. However,
the goals of the reprogramming effort also included improving the user interface by
modifying the input file structure and the output products.
Overview of New Features in the ISC3 Models
The ISC3 models include several new features. A revised area source algorithm and
revised dry deposition algorithm have been incorporated in the models. The ISC3
models also include an algorithm for modeling impacts of particulate emissions from
open pit sources, such as surface coal mines. The Short Term model includes a new wet
deposition algorithm, and also incorporates the COMPLEX1 screening model algorithms
for use with complex and intermediate terrain. When both simple and complex terrain
algorithms are included in a Short Term model run, the model will select the higher
impact from the two algorithms on an hour-by-hour, source-by-source, and receptor by-
Table 4.1 Salient Features of the ISCST3 Model S.No Item Details
1 Model name ISCST3 (Based on USEPA algorithm) 2 Source Types Point, Area, Volume, Open Pits 3 Dispersion Equation Steady State Gaussian Plume Equation 4 Diffusion Parameters Pasquill Gifford Co-efficient 5 Plume Rise Briggs Equation 6 Time Average 1 hr to Annual/Period Has Short Term and Long Term
modeling options 7 Deposition Both Dry and Wet Deposition 8 Application Input Data: (i) Source Data Stack co-ordinates (ii) Receptor Data Grid interval, number of receptors,receptor elevations (iii) Meteorological Data Hourly meteorological data i.e. wind speed, direction,
ambient temperature, stability and mixing heights
4.3.1.1 Model Formulation
The model uses the following steady state Gaussian plume equation. The basic
equation for calculating the concentration of pollutants for any point in x, y, z co-
C(x,y,z,H) = Q/2π σy σz U exp[-1/2(y/σy)2] x [exp{-1/2(z-h/σz)2} + exp{-1/2 (z+H/σz)2}]
Where C= Concentration of pollutants in mg/cu m Q= Strength of emissions in g/sec. H= Effective Height (m), i.e., physical height + plume raise y, z= diffusion coefficients in y and z directions in m. U= average wind velocity in m/sec. The following assumptions are made in Gaussian dispersion model.
This model assumes no diffusion in the down wind direction and thus applicable to a
plume and not a puff of pollutant. The dispersion parameter values used for
horizontal dispersion coefficient and vertical dispersion coefficients are those given in
the “Work book of atmospheric dispersion estimates”. These dispersion coefficients
assume a sampling time of about 10 min., the height values of interest to be in the
lowest several hundred meters of the atmosphere, a surface corresponding to the open
country. The stacks are tall enough to be free from building turbulence so that no
aerodynamic down wash occurs. The given stability exists from ground level to well
above the top of the plume.
The Gaussian dispersion model has been tested extensively for its validity and found to
be reasonably applicable for different atmospheric conditions. BIS has also adopted this
basic plume dispersion model. Hence the same model is adopted for predictions of
downwind concentrations of pollutants in this report.
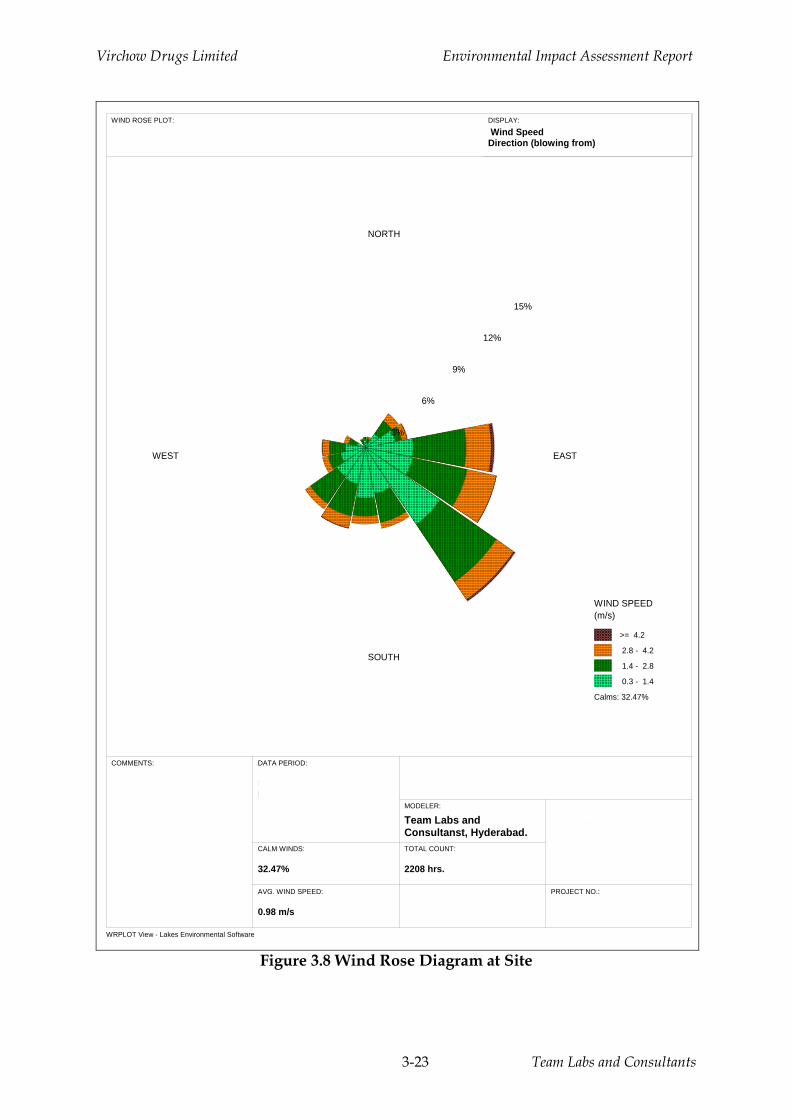
4.3.1.2 Meteorological Data
Data recorded by the weather monitoring station at site on wind speed, direction, solar
insolation, temperature and cloud cover at one hourly interval for three months i.e.One
full season has been used for computations. Hourly atmospheric stability determined
based on the technique suggested by Turner. Visual observations were made on for the
solar insolation and cloud cover during study period. The methodology adopted for
establishing the hourly stability class is given in Table 4.2.
4.3.2.4 Prediction of Concentration of Solvents in the Indoor Environment Due to
Solvent Loss and Fugitive Emissions
A simple Box Model (EVAPMOD) was used to calculate the solvent concentration in
the indoor environment. The methodology adopted was to calculate the concentration
for the product group which has the largest amount of solvent losses.
General Box Model:
Indoor air pollution models developed and used by USEPA and others consider the
conservation of air contaminant mass in a volume or "box" of workroom air. Airborne
concentrations are derived by solving the following general equation (Jay jock, 1988):
C = (Ain - Aout) / Volume of Box ---------- (1) Where
C = Concentration at time ti (assume C=0 @ t0 = 0) Ain = Mass of contaminant that went into the box during time interval ti - t0 Aout = Mass of contaminant that left the box during time interval ti - t0
The diffusion coefficient and the generation rate of the contaminant were calculated to
arrive at the airborne concentration in the environment.
For the General Ventilation Model, the overall estimate of the airborne concentration
of a contaminant is obtained by use of following equation.
Cv = (1.7*105) Ta*G M*Q*m
Where: C v = Contaminant concentration in workplace (ppm) Ta = Ambient temperature of the air (°K) G = Vapor generation rate (gm/sec) M = Molecular Weight (gm/gm-mole) Q = Ventilation rate (ft3/min) m = Mixing factor (dimensionless) Higher solvent loss and the predicted airborne concentrations of the various solvents
The sound pressure level generated by noise source decreases with increasing
distance from the source due to wave divergence. An additional decrease in sound
pressure levels also occurs with increasing distance from the source due to
atmospheric effect or interaction with the objects in the transmission path. This is
due to excess attenuation. The sound pressure level is also affected by medium of
travel and environmental conditions. The propagation model has been devised to
take into account these factors and predict the noise levels at various distances round
a single or a multiple source. The model uses the following formula as a basis for
such predictions.
(Lob) = (Lr) - (Ldiv) - (Latm) Where (Lob) = Observed noise level at a distance R from source (Lr) = Noise level of source measured at reference distance r (Ldiv) = Loss due to divergence at distance R from source = 20 log (R/r) (Latm) = Attenuation due to atmosphere at distance R from the source. = a x R/100, where a is atmospheric attenuation coefficient in dB (A)/100m.
For hemispherical wave divergence in a homogenous loss free atmosphere (Latm) = 0.
The total impact of all sources at particular place is then estimated by adding as the contribution of noise from each of the following sources as follows; i=n (Lob)i/10 (Leq) = 10 log Σ {10 } i=1
Where n = total number of sources
The calculated noise levels are further super imposed (logarithmically) on the
background noise levels. The model assumes that the noise spectrum is mainly
To be applicable only when water is chlorinated. Tested at consumer end. When protection against viral infection is required, it should be Min 0.5 mg/l
DESIRABLE CHARACTERISTICS 1 Dissolved
solids mg/l, Max
500 Beyond this palatability decreases and may cause gastro intestinal irritation
2000 3025 (Part 16) 1984
-
2 Calcium (as Ca) mg/l, Max
75 Encrustation in water supply structure and adverse effects on domestic use
200 3025 (Part 40) 1991
-
3 Magnesium (as Mg), mg/l, Max
30 Encrustation to water supply structure and adverse effects on domestic use
100 16, 33, 34 of IS 3025: 1964
-
4 Copper (as Cu) mg/l, Max
0.05 Astringent taste, discoloration and corrosion of pipes, fitting and utensils will be caused beyond this
1.5 36 of 3025: 1964
-
5 Manganese (as Mn) mg/l, Max
0.1 Beyond this limit taste/appearance are affected, has adverse effects on domestic uses and water supply structures
0.3 35 of 3025: 1964
-
6 Sulphate (as 200 SO4) mg/l, Max
200 Beyond this causes gastro intestinal irrita-tion when
400 3025 (Part 24) 1986
May be extended up to 400 provided (as Mg) does not exceed 30
responsible institutional arrangements are detailed in the Environmental Monitoring
Plan (Table 5.3)
Table 5.3 Noise level standards (CPCB) Type Noise level for Day Noise level for Industrial area 75 70 Commercial area 65 55 Residential area 55 45 Silence zone 50 40 Day time - 6.00 am - 9.00 pm (15 hours)
The monitoring plan along with the environmental parameters and the time frame is
presented in the Table 5.4.
Table 5.4 Environmental Monitoring Plan (Terms of Reference No. 7(xii) & B(4) S.No Particulars Monitoring
Frequency Standards Duration
of Sampling
Important monitoring parameters
Ambient Air Quality Monitoring 1 Industry
Main Gate, Domadugu Bonthpally Villages
Quarterly Air (Prevention and Control of Pollution) Rules, CPCB, 1994
24 hrs PM10, PM2.5, SO2, Nox, & VOC
2 Work Place Monitoring : Production blocks 2 locations, Solvent Tankfarm, and ETP area
Considering operating modes of the facility, and based on available resources the
following hazard identification process chosen are:
a) Fire Explosion and Toxicity Index (FETI) Approach; b) HAZOP studies; c) Maximum Credible Accident and Consequence Analysis (MCACA); d) Classification of Major Hazard Substances; e) Manufacture Storage and Import of Hazardous Chemical Rules, 1989 (GOI Rules,
1989); f) Identification of Major Hazardous Units.
The interpretation of “The Manufacture Storage and Import of Hazardous chemicals”
issued by the Ministry of Environment and Forests, GOI, which guides the preparation of
various reports necessary for safe handling and storage of chemicals shows that the
present project requires preparation of safety reports before commencing operation and
risk assessment is not mandatory. The applicability of various rules is presented in
Table 6.5.
Table 6.5 Applicability of GOI Rules to Storage/Pipeline S. No
Chemical Inventory KL
Threshold Quantity (T) For Application of Rules Applicable Rules 5,7-9, 13-15 10-12
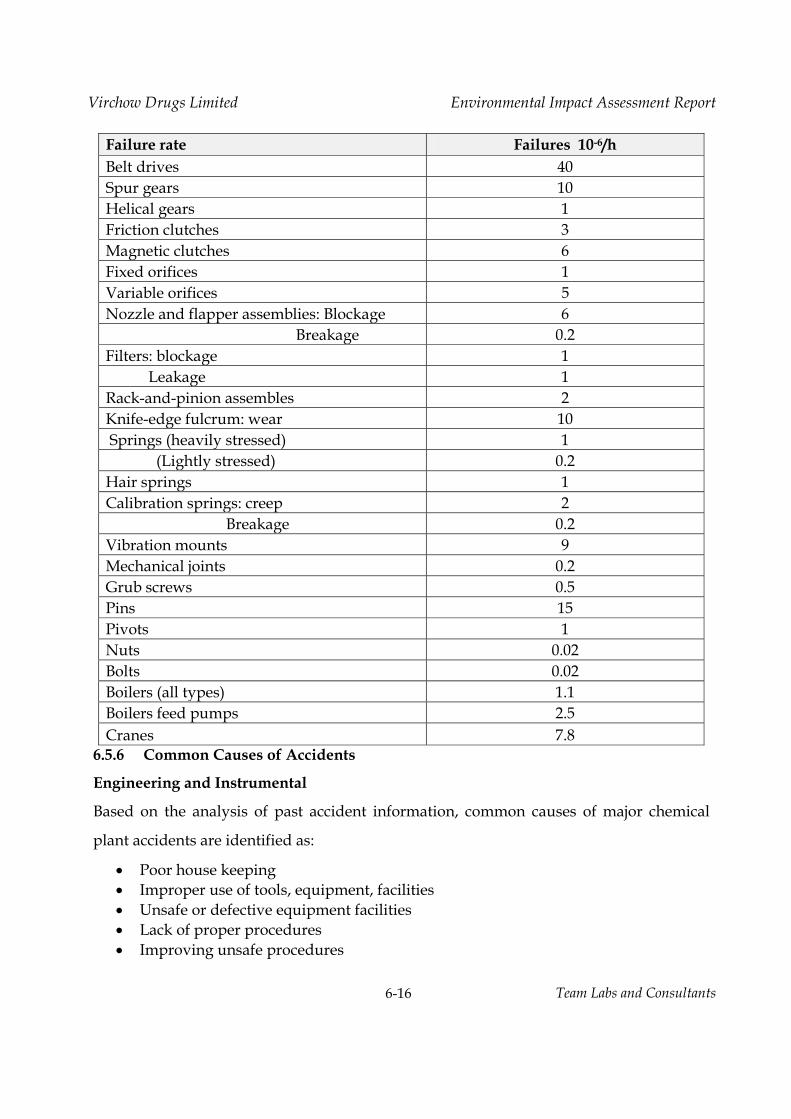
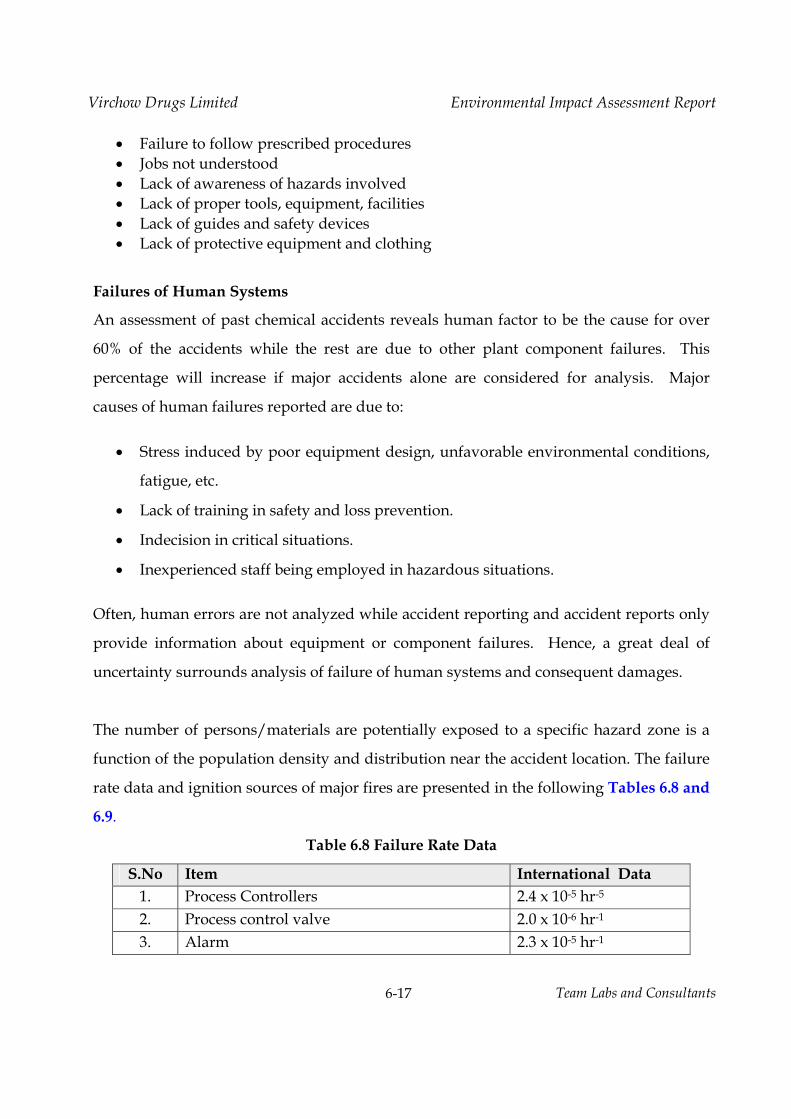
• Failure to follow prescribed procedures • Jobs not understood • Lack of awareness of hazards involved • Lack of proper tools, equipment, facilities • Lack of guides and safety devices • Lack of protective equipment and clothing
Failures of Human Systems
An assessment of past chemical accidents reveals human factor to be the cause for over
60% of the accidents while the rest are due to other plant component failures. This
percentage will increase if major accidents alone are considered for analysis. Major
causes of human failures reported are due to:
• Stress induced by poor equipment design, unfavorable environmental conditions,
fatigue, etc.
• Lack of training in safety and loss prevention.
• Indecision in critical situations.
• Inexperienced staff being employed in hazardous situations.
Often, human errors are not analyzed while accident reporting and accident reports only
provide information about equipment or component failures. Hence, a great deal of
uncertainty surrounds analysis of failure of human systems and consequent damages.
The number of persons/materials are potentially exposed to a specific hazard zone is a
function of the population density and distribution near the accident location. The failure
rate data and ignition sources of major fires are presented in the following Tables 6.8 and
6.9.
Table 6.8 Failure Rate Data
S.No Item International Data 1. Process Controllers 2.4 x 10⁻⁵ hr-5 2. Process control valve 2.0 x 10⁻⁶ hr-1 3. Alarm 2.3 x 10⁻⁵ hr-1
Full bore rupture 8.8*10-7/m.year Significant leak 8.8*10-6/m.year
>50 mm =150 mm dia
Full bore rupture 2.6*10-7/m.year Significant leak 5.3*10-6/m.year
>150 mm dia
Full bore rupture 8.8*10-8/m.year Significant leak 2.6*10-6/m.year
Hose Rapture/Failure 4.0*10-5/hr Unloading arm Rapture/Failure 3.0*10-8/hr Check valve Failure on demand 1.0*10-4/on demand motor operated valve Failure on demand 1.0*10-3/ on demand Flange Leak 3.0*10-4/ Year Pump seal Leak 5.0*10-3/ Year Gasket failure Failure 5.0*10-5/ Year Process safety valve(PSV)
Lifts heavily 4.0*10-3/ Year Blocked 1.0*10-3/ Year Lifts lightly 6.0*10-2/ Year
6.7 CONSEQUENCE ANALYSIS
The accidental release of hazardous chemicals leads to subsequent events, which actually
cause the damage. The damages are of three types.
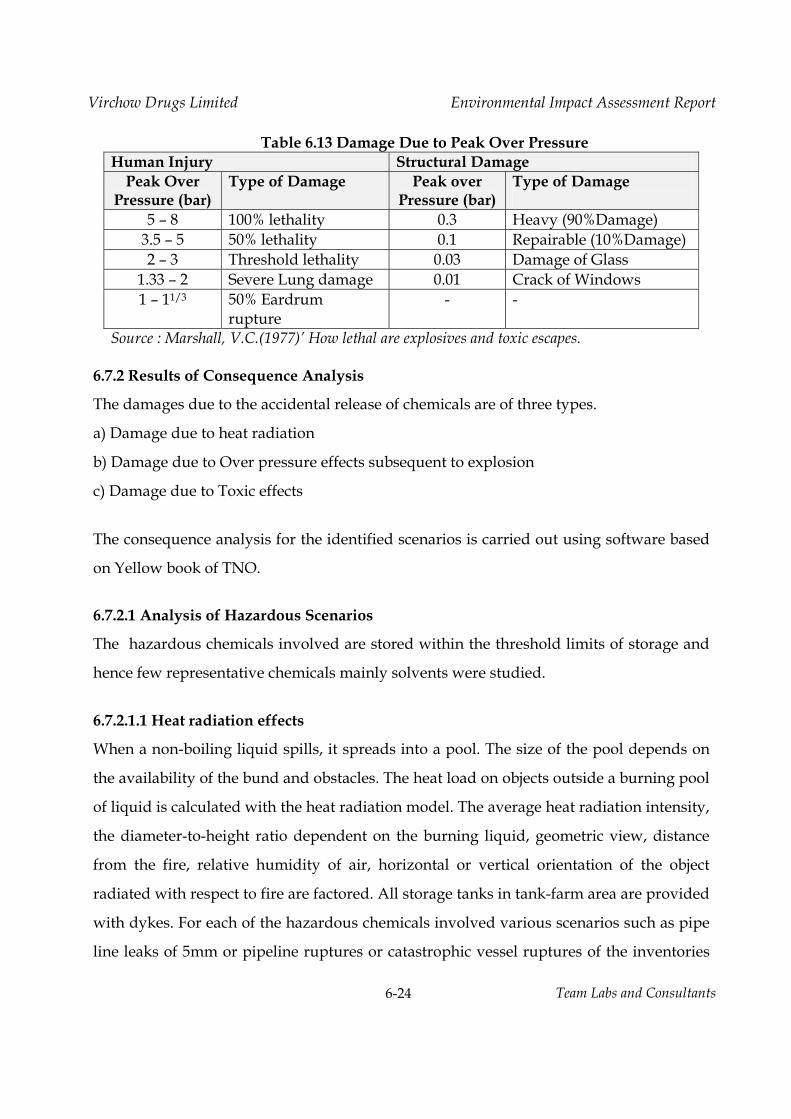
1) Damage due to heat radiation. 2) Damage due to Over pressure effects subsequent to explosion 3) Damage due to toxic effects
The type of damage and extent of damage depends on nature of chemical, the conditions
of release, atmospheric conditions and the subsequent events. The sequence of probable
events following the release of a hazardous chemical is schematically shown in Figure
6.2. The best way of understanding and quantifying the physical effects of any accidental
release of chemicals from their normal containment is by means of mathematical
modeling. This is achieved by describing the physical situations by mathematical
equations for idealized conditions and by making corrections for deviation of the
practical situations from ideal conditions. In the present study ALOHA software from
USEPA. These models for various steps are described in the following sub-sections.
Office room is identified as Assembly point and is in a low intensity fire affected zone.
Additionally the following places in plan are designated as safe assembly points: Time
office, and green belt area near the main road. The locations of assembly points would be
reviewed later.
c) Fire fighting Facilities
The fire fighting facilities which shall be provided are presented in Table 6.17.
Table 6.17 List of Fire Extinguishers S.No Description of Item Quantity
1. DCP 10 kg 6 Nos. 2. Foam 50 ltrs 3 Nos. 3. CO2 22.5 kg 3 Nos. 4. CO2 6.8 kg 8 Nos. 5. ABC Soda Acid 5 kg 3 Nos. 6. ABC Soda Acid 1 kg 9 Nos. 7. Fire Buckets with stand 15 Nos.
d) Location of First aid Boxes
The first aid boxes will be located at the following places: preparation areas,
administrative office, time office, and will be under the charge of security coordinator.
e) Emergency siren
Emergency siren will be provided with 0.5 km range of audibility and the location will be
time office. The siren will operate on regular supply and also on emergency electrical
supply. Shift electrical engineer of plant on receipt of information from shift incharge, is
authorized to operate the siren.
f) Emergency escapes
Emergency escapes in the plant area and floor wise emergency escapes will be
STUDIES AND DOCUMENTATION BY TEAM Labs and Consultants B‐115‐117 & 509, Annapurna Block, Aditya Enclave, Ameerpet, Hyderabad‐500 038. Phone: 040‐23748 555/23748616, Telefax: 040‐23748666
SUBMITTED TO STATE LEVEL ENVIRONMENT IMPACT ASSESSMENT AUTHORITY,
TELANGANA, GOVERNMENT OF INDIA
Virchow Drugs Limited Contents
CONTENTS Page No.
1.0 Introduction 1‐11.1 Environment Management Plan 1‐2
1.1.1 Operation Phase 1‐2 2.0 Sources of Pollution from Manufacturing Process 1‐2 2.1 Water Pollution 1‐2
2.1.1 Process Description and Technical Specification of Effluent Treatment System 1‐4 2.2 Air Pollution 1‐8
2.2.1 Emissions from Utilities 1‐8 2.2.2 Emissions from Process 1‐9 2.2.3 Diffuse Emissions 1‐9 2.2.4 Fugitive Emissions 1‐9 2.2.5 Odor Management 1‐10 2.3 Solvent Use and Recycle 1‐10 2.4 Solid Waste 1‐11 2.5 Noise Pollution 1‐12 3.0 Rainwater Harvesting 1‐12 4.0 Occupational Safety and Health 1‐13 4.1 Medical Check ‐up 1‐14 5.0 Prevention, maintenance and operation of Environment Control System 1‐15 6.0 House Keeping 1‐16 7.0 Socio Economic Environment 1‐168.0 Transport systems 1‐16 9.0 Recovery – Reuse of Waste Products 1‐17 10.0 Energy Conservation 1‐17 11.0 Green Belt Development 1‐18 12.0 Corporate Environmental Responsibility 1‐2013.0 Environment Management Cell 1‐20 14.0 CREP Guidelines 1‐21 15.0 Other Management Practices 1‐21 16.0 Cost Estimate for Environment Management Plan 1‐22
Virchow Drugs Limited Contents
List of Tables
List of Figures
S.No Description Page. No. 1.1 Total Effluents Generated and Mode of Treatment 1‐3 1.2 Effluents Generated and Characteristics from Process – Product Wise 1‐3 1.3 Technical Specifications of Effluent Treatment System 1‐6 1.4 Technical Specifications of Biological Treatment Plant 1‐7 1.5 Emission Details of Pollutants from Stack 1‐8 1.6 Total Solvent Balance – Product Wise 1‐10 1.7 Total Solid Waste and Mode of Disposal 1‐11 1.8 Frequency of Health Monitoring 1‐15 1.9 List of Plants Identified for Greenbelt Development 1‐18 1.10 Environmental Management Cost estimate 1‐22
S.No Description Page. No.1.1 Schematic Diagram of Effluent Treatment System 1‐5 1.2 Rain Water Harvesting Scheme 1‐12 1.3 Green Belt Development of M/s. Virchow Drugs Limited 1‐19
Virchow Drugs Limited Environment Management Plan
1-1 Team Labs and Consultants
ENVIRONMENT MANAGEMENT PLAN
1.0 Introduction
Environmental protection is an issue that no organization can neglect and hope to survive.
The by-products of civilization are being dumped upon the environment to a degree that the
environment finds difficult to assimilate. The key to the success of the integrated approach to
pollution prevention and control is the management and operation of the organization.
Effective committed management delivers a successful industry. As total commitment to the
environment, not just for compliance with legal or regulatory compliance will be the essence
of environment management of an industry. Many companies have recognized the benefits
of implementing an effective environmental management system.
Environmental management plan can be effectively implemented to mitigate the pollution
levels by observing the following;
1. Pollution will be prevented or reduced at the source,
2. Pollution that cannot be prevented will be recycled in an environmentally safe manner,
3. Pollution that cannot be prevented or recycled will be treated in environmentally safe
manner, and
4. Disposal and other releases into the environment will be used “only as a last resort”
and will be conducted in an environmentally safe manner.
The management plan is drawn in consultation with the project proponents with reference to
various potential monitored, identified and predicted in the previous chapters. And the
necessary measures to be taken for the mitigation and control of the same presented, various
pollution control measures adopted which are present in the proposed expansion and
measures identified for adoption are discussed in the Environmental Impact Assessment
Report of the same are presented in appendix of the Environmental Impact Assessment
Report. Review of the process is the essential component of Environmental Management M/s.
Virchow Drugs Limited has been conducting experiments to optimize the consumption of
raw materials and to increase the purity of the product.
Virchow Drugs Limited Environment Management Plan
1-2 Team Labs and Consultants
1.1 Environment Management Plan
1.1.1 Operation Phase
During operation stage the major pollution from the proposed expansion is from liquid
effluents from process, utilities and domestic facilities, and air pollution from utilities and or
combustion of fuels/wastes. The effluent treatment system based on zero liquid discharge
principle, shall convert most of the liquid effluents to solids by way of evaporation of salts
and ETP sludge. The environment management plan is drawn in consultation with the project
authorities, R&D experts of Granules Limited and other technical consultants involved in
preparing the project plan. The management, mitigation and enhancement measures
identified for significant impact sources are presented as follows;
2.0 Sources of Pollution from Manufacturing Process:
The major contributions of pollution from proposed project are effluent generation from
process, utilities and domestic sources and gaseous emission from process and utilities. The
water pollution is due to the effluent generated from process, washings, Scrubber, utility
blow downs and domestic sources. Majority of effluents generated will be from process and
it will have considerable amount of COD and TDS load and suspended solids, which has to
be effectively treated. The air pollution is caused due to combustion of both fuels and
solid/gaseous wastes. The quantities and quality of effluents, emissions and solid wastes
are identified and quantified in the environmental impact assessment study. The
environment management measures proposed are described as follows;
2.1 Water Pollution (Terms of Reference No. 3 (vi) & 7(iv))
The effluents generated in the process, separation techniques and during purification
contain organic residues and inorganic raw materials, solvents, and products. Hence the
effluents contain both organic and inorganic salts in various quantities leading to high COD
and TDS levels respectively. Effluents from process, washings, Scrubbing media, utility
blow downs and domestic effluent will be sent to the effluent treatment system. The treated
effluent will be reused for cooling tower makeup. The total effluent generated and mode of
Virchow Drugs Limited Environment Management Plan
1-3 Team Labs and Consultants
treatment is presented in Table 1.1. The quantity and quality of effluents generated from
process for each product is presented in Table 1.2.
Table 1.1 Total Effluents Generated and Mode of Treatment
Description Quantity (KLD) Mode of Treatment Permitted After
Expansion HTDS Effluents (TDS & COD> 15000 mg/l)
Process 9.045 51.97 Sent to Stripper followed by forced evaporator and ATFD. Stripper Condensate is reused in process. Evaporator and ATFD Condensate sent to Biological treatment plant followed by RO. RO rejects sent to Forced evaporator and permeate are reused in cooling towers make-up.
Scrubber Effluent 3 Sent to Forced evaporator followed by ATFD, Biological treatment plant and RO.
RO/DM rejects
4.5
Total - I 9.045 59.47 LTDS Effluents (TDS & COD< 15000 mg/l)
Washings 1 5 Sent to Biological Treatment System followed by RO. RO permeate reused for cooling towers makeup. RO rejects sent to Forced evaporator.
Boiler Blow downs 0.5 3 CT Blow downs 1 30 Domestic 1 4.5 Total - II 3.5 42.5 Grand Total (I+II) 12.545 101.97
Table 1.2 Effluents Generated and Characteristics from Process – Product Wise S.No Name of Product Quantity (Kg/Day) Conc. (mg/l)
Water Input
TDS COD Total Effluent
TDS COD
Group - I 1 Sulfanilamide 42000 8171 730 51969.4 157236 14053
Group - II 2 Sulfarpyridine 22000 4351 2040 28624.5 152002 71272 3 Sulfa salazine 20000 2078 839 20479.5 101491 40946 Total - II 42000 6429 2879 49104.0 130935 58624
Worst Case - Any One Group 42000 8171 2879 51969 157236 55392
Virchow Drugs Limited Environment Management Plan
1-4 Team Labs and Consultants
2.1.1 Process Description and Technical Specification of Effluent Treatment System
The Effluent management system is developed to ensure `Zero Liquid Discharge’. The
effluents are segregated into two streams; High COD/ TDS and Low COD/ TDS streams.
The effluents are segregated stream wise based on the characteristics of effluents, i.e., less
than 15000 mg/l of TDS and COD are considered as low TDS effluents, while the others are
considered as high COD/TDS effluents.
The High TDS/ COD Effluents
The treatment system for treating High TDS/ COD effluents consists of Equalization,
Neutralization, Settling tank, Stripper, forced evaporator followed by Agitated Thin Film
Dryer (ATFD). The organic distillate from the stripper is reused in process and aqueous
bottom from stripper is sent to forced evaporator followed by ATFD for evaporation. The
condensate from the forced evaporator and ATFD are sent to ETP (Biological). Salts from
ATFD are disposed to TSDF.
The Low TDS/ COD Effluents:
These effluents along with the condensate from forced evaporator and ATFD are treated in
primary treatment consisting of equalization, neutralization, and primary sedimentation
followed by secondary biological treatment consisting of aeration tank and clarifier.
The treated effluents after biological treatment are subjected to tertiary treatment in a reverse
osmosis system. Permeate from RO is reused for cooling tower and rejects are sent to forced
evaporator followed by ATFD. Sludge from various units of Biological treatment are
thickened in sludge handling system and sent to TSDF. Schematic diagram of effluent
treatment system is presented in Fig 1.1. Technical specifications of effluent treatment system
is presented in Table 1.3 and 1.4 respectively.
Virchow Drugs Limited Environment Management Plan
1-5 Team Labs and Consultants
Fig
1.1
Sche
mat
ic D
iagr
am o
f Eff
luen
t Tre
atm
ent S
yste
m
Strip
per
Multip
le Effec
t Ev
apor
ator
Agita
ted Th
in
Film Dryer
Salts to TSD
F
Settlin
g tank
Equa
lization
& Ne
utraliz
ation
Org. Dist
illate
reus
ed in Pro
cess
Orga
nic
Distilla
te
High TD
S/CO
D
CondensateLo
w TDS &
COD
Scre
enCh
ambe
r
Slud
ge
Dryin
g Be
d
Oil
Skim
mer
Equa
lization
& Ne
utraliz
ation
Aeratio
nTa
nkClarifier
Holding
Tank
Filte
rs
Trea
ted W
ater
Stor
age Ta
nk
Filte
r Pre
ss
Slud
ge Cak
e to
TSDF
Doub
le
RO Pl
ant
Recy
cle W
ater
Colle
ction
Sump
To C
oolin
g To
wer
s
Rejects
Scru
bber Effluen
t, DM
/RO
Rejects
To M
EE
Slud
ge to
TSDF
Virchow Drugs Limited Environment Management Plan
1-6 Team Labs and Consultants
Table 1.3 Technical Specifications of Effluent Treatment System S.No Description Unit Capacity
Existing Proposed Stripper for Process and Washings
1 Design Capacity KLD 56 2 Feed Rate Kg/hr 2166 3 Specific Gravity of Feed ≈ 1.2 4 Initial Feed COD PPM 55392 5 Feed Total Solid % 18.8 6 High Heating Temperature OC 80 7 High COD Condensate recovery LPH 90 8 Dry Saturated Steam requirement at 3.0Kg/cm2 (g) TPH 0.3 9 Cooling Water circulation rate for condenser m3/hr 10 10 Cooling Water Inlet Temperature OC 30 11 Cooling Water Outlet Temperature OC 33 12 Operating Condition
Forced Evaporator 1 Design Capacity KLD 15 45 2 Feed Rate Kg/hr 500 1576 3 Feed Concentration mg/l 150000 157236 4 Feed Temperature OC 80 5 Initial Solids % 20 18.8 6 Solids in Concentrate % 30 30 7 Concentrate Output Kg/hr 330 1030 8 Water Evaporation Rate Kg/hr 170 546 9 Designed Water Evaporation Rate Kg/hr 250 750 10 Dry Saturated Steam requirement at 5.0Kg/cm2 (g) TPH 0.2 0.6 11 Cooling Water Circulation Rate at 30 – 32OC m3/hr 40 120 12 Cooling Water Inlet Temperature OC 30 30 13 Cooling Water Outlet Temperature OC 33 33
Agitated Thin Film Dryer (ATFD) 1 Designed Capacity KLD 20 20 2 Designed Heat Transfer Area Sq.m 25 25 3 Feed Rate Kg/hr 680 680 4 Initial Feed Solid Content % 30 30 5 Final Moisture in Dry Bag-gable Product % 8 8 6 Water Evaporation Rate Kg/hr 450 450 7 Designed Water Evaporation Kg/hr 750 750 8 Solid Output in Bag-gable form at 5 – 10% moisture Kg/hr 230 230 9 Dry Saturated Steam requirement at 5.0Kg/cm2 (g) TPH 0.5 0.5 10 Cooling Water Circulation Rate at 30 – 32OC m3/hr 130 130 11 Cooling Water Inlet Temperature OC 30 30 12 Cooling Water Outlet Temperature OC 33 33
Virchow Drugs Limited Environment Management Plan
1-7 Team Labs and Consultants
Table 1.4 Technical Specifications of Biological Treatment Plant Design inputs Data Flow from Evaporation : 42.0 KLD LTDS effluent : 50.0 KLD Total Flow : 92 KLD Design Capacity : 96 m3/day 1.Equalization Tank Peak Flow ( Designed) : 3.83 m3/hr Hydraulic retention time : 10 Hrs. at peak flow Volume of the tank : 40 m3 Tank dimensions : 4 x 4 x 2.5 L X B X H, m Air required for agitation : 0.01 m3/m2 min Total air required : 9.6 m3/hr Air blower required : 3HP m3/[email protected] 2) Primary clarifier Design quantity : 92 KLD Width : 2300 mm Length : 1300 mm Depth : 1200 mm No.of plates : 15 3) Biozone (Aeration)Tank Actual Flow : 92 KLD Length : 6900 mm Width : 2200 mm Diameter of Rotor : 1500 mm No of Rotors : 3 No.s 4) Secondary Clarifier : Width : 2300 mm Length : 1600 mm Depth : 1200 mm No.of plates : 22 5). Holding tank The flow from the each individual settling tank I,e the supernatant liquid is let into the respective Pre-Filtration Tank, which has a minimum 8 hours holding capacity. 6) MGF Capacity : 92 KLD Feed pump flow rate : 4.0 m3 Head : 30 m 8. ACF Capacity : 92 KLD Feed pump flow rate : 4.0 m3 Head : 30 M Rverse Osmosis Plant – I : 70 KL Rverse Osmosis Plant – I : 20 KL
Virchow Drugs Limited Environment Management Plan
1-8 Team Labs and Consultants
2.2 Air Pollution (Terms of Reference No. 3 (vi))
The manufacturing process consists of reaction, separation and purification. The reaction is
conducted in closed reactors, while the separation is conducted in centrifuge, filtration
equipment etc. Purification would be conducted in reactors or filtration equipment. The
transfer of materials will be through closed pipelines. Various sources of emissions are
identified from process operations. The usage of boiler for steam generation and DG sets
for emergency power back up also releases emissions.
2.2.1 Emissions from Utilities (Terms of Reference No. 7(v))
It is proposed to establish 4 TPH coal fired boiler for proposed expansion and changing fuel
of existing 3TPH boiler from Oil fired to Coal fired and dismantling existing 1 TPH coal
fired boiler after expansion. The proposed air pollution control equipment for boiler is
Multicone Cyclone separators. DG sets shall be provided with stack heights based on the
CPCB formula for effective stack height. The emission rates of SO2, NOx and SPM from
each stack are presented in Table 1.5.
Table 1.5 Emission Details of Pollutants from Stack S.No Stack Attached to Stack
Height (m)
Dia of stack
at top (m)
Temp. of exhaust
gases (0C)
Exit Velocity (m/sec)
Pollutant Emission Rate (g/sec)
PM SO2 NOx
Existing 1* 1TPH Oil fired
boiler 30 0.4 130 8 0.03 0.12 0.02
2** 3 TPH Coal Fired Boiler
30 0.6 160 12 0.15 0.4 0.21
3# 200KVA DG Set 3 0.1 200 10 0.003 0.08 0.01 4# 500 KVA DG set 7.5 0.2 160 15 0.004 0.16 0.03
Proposed 1 4TPH Coal Fired
Boiler 30 0.8 160 8.5 0.2 0.4 0.5
* Shall be dismantled after expansion ** Fuel changed from oil to coal. # DG sets will be used during load shut down by TSTRANSCO.
Virchow Drugs Limited Environment Management Plan
1-9 Team Labs and Consultants
2.2.2 Emissions from Process
The source of process emissions are reactors, where gaseous products are released, or excess
gaseous raw material used in production, which mainly contain inorganic gases. The other
emissions from process operations and effluent treatment system are mainly known as
diffuse emissions containing dusts, fumes and volatile organic compounds. The VOCs from
among the diffuse emissions are the main cause of odour in the plant area and its
neighborhood. Spillage, leakage and accidental releases are the causes of fugitive emissions,
releasing solids, liquids and fumes of volatile organic compounds resulting in soil and
ground water contamination in addition to odour in the plant area.
2.2.3 Diffuse Emissions
Emissions are also released from various operations of manufacturing like centrifuge,
drying, distillation, extraction etc. These emissions mainly contain volatile contents of the
material sent for processing. The emissions are normally passed through vent scrubber
before releasing into atmosphere to mitigate odour. The emissions from distillation are
passed through condensers, which mitigate odour. It is proposed to provide vent
condensers in series to reactors, distillation columns, driers and centrifuge etc. to mitigate
VOC emissions release. Other vents are connected to common headers and scrubbers. The
transfer of solvents shall be mainly by closed pipeline systems, while drum transfer is by
using air operated diaphragm pumps in closed hoods. The charging of solid raw materials
shall be by using closed hoppers to avoid dust emissions and hazard of static electricity.
Breather valves shall be provided to storage tanks. Thermal insulation and condensers will
be provided for storage tanks of low boiling point solvents. The reactor or solvent storage
tank vents when not use shall be kept closed.
2.2.4 Fugitive Emissions
Fugitive emissions are anticipated from equipment leakage and transfer spills. The
periodic maintenance program shall ensure integrity of equipment mitigating the
equipment leakage. The spills however shall be managed by adopting the spill
management scheme as mentioned in the respective MSDS, spill control kit shall be
Virchow Drugs Limited Environment Management Plan
1-10 Team Labs and Consultants
provided in storage, and production blocks. The fugitive emissions shall be reduced by
closed transfer and handling of all hazardous solvents and chemicals. The ventilation
system provided will reduce health impact on the employees by way of dilution of work
room air and also dispersion of contaminated air.
2.2.5 Odour Management ((Terms of Reference No. B(6))
Odour is caused mainly by diffuse and fugitive emissions of low boiling organic chemicals/
compounds releasing volatile organic compounds. The above mentioned measures for
mitigation and control of diffuse and fugitive emissions shall reduce release of VOC’s into
atmosphere and the resultant odour.
2.3 Solvent Use and Recycle
Solvents are used for extraction of products and as reaction medium. Solvents constitute
major consumable material of synthetic organic chemical manufacturing, mainly used as
reaction medium. The used solvents constitute major waste stream of synthetic organic
chemical manufacturing. Hence it is proposed to recycle the solvents by distillation for reuse
in process, thereby reducing total solvent consumption in the plant and reducing the waste
quantity to be disposed. The distillation columns are mainly provided to remove moisture
and impurities from spent single solvents, and mixed solvents. The recycled single solvents
are reused in the process, while the mixed solvents are sold to end users. The total solvent
balance product wise and stage wise is presented in Table 1.6.
Table 1.6 Total Solvent Balance Name of Product Name of Solvent Quantity (Kg/day)
Solid wastes are generated from the process, solvent distillation, wastewater treatment and
utilities. The effluent treatment system generates, stripper distillate, ATFD salts and ETP
sludge. The process operations generate process residue, activated carbon and inorganic
residue. The utilities i.e., coal fired boiler generates ash while DG sets generate waste oil and
used batteries. All the wastes except coal ash are considered hazardous. The other non
hazardous wastes are container, packing material, empty drums etc. The containers and
drums are detoxified before disposing to authorized buyers. The hazardous wastes of
process residue and activated carbon are sent cement plants for co-incineration, thereby
reducing the load on TSDF facility and consumption of non renewable resource of coal in
cement plant kilns, stripper distillate is reused in process. The inorganic wastes, salts from
ATFD, and ETP sludge are sent to TSDF facility located at Dundigal, Ranga Reddy district.
The waste oil and used batteries are sold to authorized recyclers. Coal ash is sold to brick
manufacturers in the local area. The quantity and disposal plan for the solid wastes is
presented in Table 1.7.
Table 1.7 Solid Waste and Mode of Disposal S.
No Description Units Quantity Mode of Treatment/Disposal
Permitted After Expansion
1 Ash from Boiler TPD 5.44 18.74 Sold to Brick manufactures and cement plants
2 Organic residue TPD 0.86 Sent to TDSF/Cement Plants for Co-incineration
3 Stripper Distillate KLD 2 Reused in process 4 Spent Carbon Kg/day 53 140 Sent to Cement Industries for
Co-incineration. 5 Inorganic Residue TPD 0.582 Sent to TSDF 6 Evaporation salts TPD 1.145 9.77 Sent to TSDF 7 ETP Sludge Kg/
month 280 Sent to TSDF
8 Detoxified containers
No.s/ Month
10 300 Sold to authorized vendors
9 Waste oil Lit/ Month
5 15 Sent to Authorized Recyclers
10 Used batteries No.s/Yr 10 15 Sent to Authorized Recyclers
Virchow Drugs Limited Environment Management Plan
1-12 Team Labs and Consultants
2.5 Noise Pollution
Noise is anticipated from motors, compressors and DG set. The DG shall be kept in a
separate enclosed room with acoustic enclosure. The motors and compressors shall be
provided with guards and shall be mounted adequately to ensure the reduction of noise and
vibration. The employees working in noise generating areas shall be provided with
earmuffs.
3.0 Rainwater Harvesting (Terms of Reference No. 7(x))
Rain water harvesting shall be adopted by providing rain water harvesting structures along
the drains, storm water storage sump and tanks. Storm water drains are provided with rain
water harvesting structures which will act as flow dissipaters and also as infiltration
trenches. Filtration points shall ensure percolation of water and enhance the ground water
table. The site area will be provided with 10 nos. of rain water harvesting structures. The
roof water shall be collected in a sump of 25 KL capacity connected to down spouts of the
roofs, and the collected water shall be reused for process and green belt development. The
The scheme for rain water harvesting structure is presented in Fig 1.4.
Fig 1.2 Rain Water Harvesting Scheme
Virchow Drugs Limited Environment Management Plan
1-13 Team Labs and Consultants
4.0 Occupational Safety and Health (Terms of Reference No. 8(iii) & B(14))
Many worker health and safety hazards are posed by synthesis operations. They include
safety hazards from moving machine parts, pressurized equipment and pipes; heavy manual
handling of materials and equipment; steam, hot liquids, heated surfaces and hot workplace
environments; confined spaces and hazardous energy sources (e.g., electricity); and high
noise levels.
Acute and chronic health risks may result from worker exposures to hazardous chemicals
during synthesis operations. Chemicals with acute health effects can damage the eyes and
skin, be corrosive or irritating to body tissues, cause sensitization or allergic reactions or
be asphyxiants, causing suffocation or oxygen deficiency. Chemicals with chronic health
effects may cause cancer, or damage the liver, kidneys or lungs or affect the nervous,
endocrine, reproductive or other organ systems. Worker exposure to chemicals can occur
during manufacturing when chemicals spill, leak, or discharge from the process system and
contaminate areas where workers are present. The most frequently reported industrial
exposure occurs during the transfer of materials. The entry of workers into systems,
equipment, or enclosures that are contaminated may occur inadvertently, but routine
servicing, nonscheduled maintenance, and process monitoring appear to be the kind of
activities with potential for significant exposure. Health and safety hazards may be
controlled by implementing appropriate control measures (e.g., process modifications,
engineering controls, administrative practices, personal and respiratory protective
equipment).
The process modification shall be a constant exercise of the Research and development wing
of the organization, resulting in reduced pollution loads, and increased yields. The measures
proposed are selection of alternative solvents/routes of synthesis, avoidance of hazardous
chemicals usage, and application of green chemistry principles.
The engineering controls proposed for reducing occupational hazards are; provision of
scrubbers, condenser systems for process equipment, piping systems, insulation to reactors,
Virchow Drugs Limited Environment Management Plan
1-14 Team Labs and Consultants
usage of transfer pumps with mechanical seals, AOD pumps, trolleys for transfer of drums
or bags, closed hoods for charging raw materials, dip pipe provision for solvent and liquid
raw material charging, level indicators, pressure and temperature indicators, barrier guards
on moving machine parts, optimization of chemical inventory, control switches and
emergency stop devices to mitigate and avoid physical, chemical, electrical and mechanical
hazards.
Administrative practices proposed for improving occupational safety are induction training
programs, safety training programs, rotation of workers, implementation of proactive
maintenance schedule, provision of standard operating procedures for all plant operations,
access to MSDS for all employees, access to emergency numbers of contact, and avoidance of
crowded work place, and provision of occupational safety centre.
Personal protective equipment shall be provided to all the employees including contract
employees. All the employees shall be provided with gumshoe, helmet, masks, goggles. The
other equipment like ear muffs, gloves, respirators, aprons etc., will be provided to
employees depending on the work area allocated to them. The PPE selection shall strictly
follow the prescribed guidelines of MSDS.
4.1 Medical Check-up (Terms of Reference No. 8(ii))
The plant have a medical program of pre employment screening, periodic medical
examination, emergency treatment, non emergency treatment, and record keeping and
review. The pre employment screening and periodic medical examination shall follow the
guidelines of factories act. The pre employment screening shall obtain medical history,
occupational history followed by physical examination and baseline monitoring for specific
exposures. The frequency of periodic medical examination and type of evaluation is
presented in Table 1.8.
Virchow Drugs Limited Environment Management Plan
1-15 Team Labs and Consultants
Table 1.8 Frequency of Health Monitoring
Occupation Type of evaluation Frequency Process area Chest X-ray, spirometry and vision testing,
complete blood count, platelet count, and measurement of kidney and liver function, and medical examination with focus on liver, kidney, nervous system and skin,
Every 5 years to age <30; every 4 years to age 31 – 40; and every 2 years to age 41-50; Once a year above 50 years.
Noise prone areas
Audiometry Annually
The plant shall have an occupational health centre to provide emergency and non emergency
treatment, by way of emergency first aid on site, liaison with local hospitals and specialists,
arranging decontamination of victims, arranging transport of victims to hospitals, and to
transfer medical records, and to provide details of incident and medical history to next care
provider. The occupational health centre shall be supervised by a qualified physician. The
occupational health centre shall maintain the health records and shall analyse the records for
any common symptoms and common health problems which may be due to exposure to
chemicals, and or due to other occupational hazards.
5.0 Prevention, maintenance and operation of Environment Control System
The pollution control equipment, and the effluent treatment systems and effluents will be
monitored periodically and will be checked for its performance and pro-active maintenance
will be adopted. The environmental monitoring results will be evaluated to identify the
problems/under performance of the equipment. Necessary steps will be taken to rectify the
identified problems/defects. The management agrees that the evaluation of the performance
of pollution control measures and occupational safety measures to arrive at their efficiency
and proposes to adopt new measures for efficient pollution control which will be a regular
exercise.
All pollution control equipments are adequately designed and operating staff of the
pollution control equipment have good experience in the operation and maintenance of the
equipment. Standby equipment provided for all critical equipment to ensure continuous
operation of pollution control equipment and preventive maintenance is done as per the
Virchow Drugs Limited Environment Management Plan
1-16 Team Labs and Consultants
schedule to avoid breakdown. Characteristics of influent and effluent are monitored on daily
basis by the industry and air emissions and effluent characteristics on monthly basis by third
party.
6.0 House Keeping
Good house-keeping practices will be adopted. Floor washing is avoided and wet mopping
will be adopted to minimize liquid waste generation. Paper waste is minimized by adopting
intra office network. Sufficient workspace and proper lighting will be provided.
7.0 Socio Economic Environment (Terms of Reference No. 11(i)
The expansion of project provides an opportunity for the local people to get employment
directly or indirectly and helps in the up liftment of the socioeconomic status of the area. The
project proponents propose to involve in social activities of the stakeholders/surrounding
community by planning the betterment of neighbouring social conditions through awareness
and welfare programs will ensure an improved relation, useful in the long run. Many of the
beneficiaries of such programs shall include own employees as well. The goodwill of the
local populace can never be ignored. Another important facet of social environment
identified by the project proponents is a green appearance, hence the management will
develop a green belt towards aesthetic beautification as the same is necessary to be
considered as a responsible, social neighbour.
1. Social Investment Funding: 2% of the profits of the unit are spent on socio
economic development programs in consultation with revenue authorities and
public representative annually. 2.5% of the capital cost i.e., Rs. 5 lakhs shall be
spent additionally during 2016-2021. The investment on CSR activity shall benefit
the stake holders within the impact area.
2. Local Content: 25% employees are from the surrounding villages.
8.0 Transport systems
All the raw materials and finished products are transported by road. Dedicated parking
facility is provided for transport vehicles. The plant is located in an industrial area, and
Virchow Drugs Limited Environment Management Plan
1-17 Team Labs and Consultants
there will not be any unauthorized shop or settlements along the road connecting the plant
site. There will be 2 truck trips per day to the factory. Traffic signs are placed in the battery
limit. The drivers of the vehicles will be provided with TREM cards and will be explained the
measure to be adopted during various emergencies.
9.0 Reduce, Recovery and Reuse (Terms of Reference No. 7(vii))
It is the endeavor of the project authorities to increase the yields of the products through
constant research and development activity. The development activity shall concentrate on
increasing the yields, using less quantity of raw material, using alternative solvents with low
hazards adopting green chemistry principles. The solvents shall be recycled for reuse in the
process by distillation. The mother liquors from the first crop shall be reused for process.
The cleaning cycles will be reduced by adopting appropriate production plan with minimum
changeovers of the product. Hydro jets or high pressure cleaning shall be adopted for
washing the reactors to minimize washing effluents. It is proposed to use third and fourth
washing water for first and second washing of the reactor and centrifuges. The steam
condensate shall be reused for boiler feed. Treated effluent is reused for cooling tower
makeup, while boiler blow down is reused for scrubbing. A cross functional team shall
constantly evaluate various options of reduce, reuse and recycle for water conservation,
reduction in wastewater generation, effluent segregation, reuse of wastes, alternate treatment
methods, leakage/spillage control, avoidance of overflow and contamination. As part of the
above exercise the proponent identified few compounds which can be recovered as
byproducts and sold. It is also proposed to explore recovery of various salts from MEE salts,
and from process effluents to reduce effluent loads, and quantity of solid waste.
10.0 Energy Conservation (Terms of Reference No. 7(vii))
It is proposed to use screw compressors (Air/Refrigeration) for energy efficiency ( 10 – 12%
saving), evaporative condensers in the chilling circuit to reduce overall power, Cooling tower
fan control to switch off at times not required (Low temp), energy efficient pumps to conserve
energy.
Virchow Drugs Limited Environment Management Plan
1-18 Team Labs and Consultants
11.0 Green Belt Development (Terms of Reference No. 7(ix))
The Granules India Limited is an existing chemical plant. Green belt is developed in an
area of 0.99 acres, covering the boundary of the site as part of environment management
plan. It has taken adequate measures for prevention and control of pollution. It has a
fully fledged Environment monitoring management cell. As there is no provision for
expansion of greenbelt on three sides of this old plant, it is proposed to grow more
numbers of trees in the lands owned by the industry in its close proximity. A list of
plants identified for reinforcement of greenbelt and avenue plantations is given in Table
1.9 and green belt plan presented in Fig. 1.3
Table 1.9 List of Plants identified for Green belt Development Botanical name Importance Acacia auriculiformis Tall Evergreen drought resistant Avenue tree Ailanthus excelsa Tall branched semievergreen tree. Albizia lebbeck Branced evergreen leguminous tree Alstonia scholaris Beautiful medicinal tree. Azadirachta indica Neem oil & neem products Bauhinia racemosa Ornamental tree Cassia fistula Ornamental and bark is a source of tannin Cassia siamea Ornamental avenue tree Cocos nucifera Coconut palm Dalbergia sissoo Avenue and timber tree Dendrocalamus strictus Bamboo products Casuarina equisetifolia Pulp and construction material Delonix regia Ornamental avenue tree Eucalyptus sp Grown in high density along the boundary Ficus benghalensis Shade and a source of food for birds Ficus racemosa Edible fruits Ficus religiosa Shade and a source of food for birds Gmelina arborea Timber Muntingia calabura Shade and edible fruit Polyalthia longifolia Avenue tree Samania saman Shade, timber and fruits are a good live stock feed. Sapindus emarginatus Soap nut tree Spathodea companulata Ornamental avenue tree Terminalia arjuna Common avenue tree Terminalia catappa Yield edible almond seed Syzygium cumini Edible fruits Tamarindus indica Tamarind fruit and leaf Tectona grandis Timber
Virchow Drugs Limited Environment Management Plan
1-19 Team Labs and Consultants
Fig 1.3 Green Belt Development of Virchow Drugs Limited
Virchow Drugs Limited Environment Management Plan
1-20 Team Labs and Consultants
12.0 Corporate Environmental Responsibility (Terms of Reference No. 9(i))
The broad guidelines of the Environmental Policy are presented below. The environmental
Management System shall have standard operating procedures for various aspects identified
which include infringement/deviation/violation of Environmental related statutory
regulations.
Broad guidelines of the Environmental Policy
Virchow Drugs Limited is committed to take adequate precautions related to Environment,
Health and Safety in developing manufacturing, storing and handling of chemical products
and in its business. It is our policy to provide a workplace free from accidents, injuries and
exposure to hazardous chemicals; conserve natural resources and prevent pollution to protect
the environment.
Towards this, we have set our objectives and are committed to:
Comply with applicable Environment, Health and Safety (EHS) legislation and statutory, regulatory and other requirements
Respond to community concerns regarding EHS and address them proactively in our operations
Integrate EHS considerations into Business Planning and decision making Use process safety management techniques like Safety Audits, Analysis, Operability
Studies and Documentation of safety related information to minimize EHS associated with our operations
Euip ourselves to address EHS emergencies Champion EHS responsibility among all the employees and impart the requisite
training Communicate our EHS policy and other concerns to our contractors and vendors and
seek their compliance Continually review objectives and set targets to improve our EHS performance
13.0 Environment Management Cell (Terms of Reference No. 9(iii))
The post project monitoring can be an activity of M/s. Virchow Drugs Limited is by hiring
services of the consultants. The industry shall have environmental wing which is supervised
by the production manager and the following staff is available under this wing:
1 Air pollution Control 6 20 2 Water pollution Control 70 100 3 Noise pollution Control 0.2 0.8 4 Environment Monitoring and Management 3 6 5 Occupational Health 3 8 6 Green Belt 2 3 7 Others (S. Waste) 50 30
Total (Lakhs) 134.2 167.8 Note: Value in Rs. Lakhs
VIRCHOW DRUGS LIMITED SY.NO. 639 (PART), IDA BONTHAPALLY,
STUDIES AND DOCUMENTATION BY TEAM Labs and Consultants B‐115‐117 & 509, Annapurna Block, Aditya Enclave, Ameerpet, Hyderabad‐500 038. Phone: 040‐23748 555/23748616, Telefax: 040‐23748666
SUBMITTED TO STATE LEVEL ENVIRONMENT IMPACT ASSESSMENT AUTHORITY,
TELANGANA, GOVERNMENT OF INDIA
181
STANDARD TERMS OF REFERENCE (TOR) FOR EIA/EMP REPORT FORPROJECTS/ACTIVITIES REQUIRING ENVIRONMENT CLEARANCE
5(f):STANDARD TERMS OF REFERENCE FOR CONDUCTINGENVIRONMENT IMPACT ASSESSMENT STUDY FOR SYNTHETICORGANIC CHEMICALS INDUSTRY (DYES & DYEINTERMEDIATES; BULK DRUGS AND INTERMEDIATESEXCLUDING DRUG FORMULATIONS; SYNTHETIC RUBBERS;BASIC ORGANIC CHEMICALS, OTHER SYNTHETIC ORGANICCHEMICALS AND CHEMICAL INTERMEDIATES) ANDINFORMATION TO BE INCLUDED IN EIA/EMP REPORT
A. STANDARD TERMS OF REFERENCE1) Executive Summary
2) Introduction
i. Details of the EIA Consultant including NABET accreditation
ii. Information about the project proponent
iii. Importance and benefits of the project
3) Project Description
i. Cost of project and time of completion.
ii. Products with capacities for the proposed project.
iii. If expansion project, details of existing products with capacities and whether adequate landis available for expansion, reference of earlier EC if any.
iv. List of raw materials required and their source along with mode of transportation.
v. Other chemicals and materials required with quantities and storage capacities
vi. Details of Emission, effluents, hazardous waste generation and their management.
vii. Requirement of water, power, with source of supply, status of approval, water balance diagram,man-power requirement (regular and contract)
viii. Process description along with major equipments and machineries, process flow sheet(quantative) from raw material to products to be provided
ix. Hazard identification and details of proposed safety systems.
x. Expansion/modernization proposals:
c. Copy of all the Environmental Clearance(s) including Amendments thereto obtained forthe project from MOEF/SEIAA shall be attached as an Annexure. A certified copy of thelatest Monitoring Report of the Regional Office of the Ministry of Environment and Forestsas per circular dated 30th May, 2012 on the status of compliance of conditions stipulatedin all the existing environmental clearances including Amendments shall be provided. In
182
STANDARD TERMS OF REFERENCE (TOR) FOR EIA/EMP REPORT FOR PROJECTS/ACTIVITIES REQUIRING ENVIRONMENT CLEARANCE
addition, status of compliance of Consent to Operate for the ongoing Iexisting operation ofthe project from SPCB shall be attached with the EIA-EMP report.
d. In case the existing project has not obtained environmental clearance, reasons for nottaking EC under the provisions of the EIA Notification 1994 and/or EIA Notification2006 shall be provided. Copies of Consent to Establish/No Objection Certificate andConsent to Operate (in case of units operating prior to EIA Notification 2006, CTE andCTO of FY 2005-2006) obtained from the SPCB shall be submitted. Further, compliancereport to the conditions of consents from the SPCB shall be submitted.
4) Site Details
i. Location of the project site covering village, Taluka/Tehsil, District and State, Justificationfor selecting the site, whether other sites were considered.
ii. A toposheet of the study area of radius of 10km and site location on 1:50,000/1:25,000 scaleon an A3/A2 sheet. (including all eco-sensitive areas and environmentally sensitive places)
iii. Details w.r.t. option analysis for selection of site
iv. Co-ordinates (lat-long) of all four corners of the site.
v. Google map-Earth downloaded of the project site.
vi. Layout maps indicating existing unit as well as proposed unit indicating storage area, plantarea, greenbelt area, utilities etc. If located within an Industrial area/Estate/Complex, layoutof Industrial Area indicating location of unit within the Industrial area/Estate.
vii. Photographs of the proposed and existing (if applicable) plant site. If existing, showphotographs of plantation/greenbelt, in particular.
viii. Landuse break-up of total land of the project site (identified and acquired), government/private - agricultural, forest, wasteland, water bodies, settlements, etc shall be included. (notrequired for industrial area)
ix. A list of major industries with name and type within study area (10km radius) shall beincorporated. Land use details of the study area
x. Geological features and Geo-hydrological status of the study area shall be included.
xi. Details of Drainage of the project upto 5km radius of study area. If the site is within 1 kmradius of any major river, peak and lean season river discharge as well as flood occurrencefrequency based on peak rainfall data of the past 30 years. Details of Flood Level of theproject site and maximum Flood Level of the river shall also be provided. (mega green fieldprojects)
xii. Status of acquisition of land. If acquisition is not complete, stage of the acquisition processand expected time of complete possession of the land.
xiii. R&R details in respect of land in line with state Government policy.
183
STANDARD TERMS OF REFERENCE (TOR) FOR EIA/EMP REPORT FORPROJECTS/ACTIVITIES REQUIRING ENVIRONMENT CLEARANCE
5) Forest and wildlife related issues (if applicable):
i. Permission and approval for the use of forest land (forestry clearance), if any, andrecommendations of the State Forest Department. (if applicable)
ii. Landuse map based on High resolution satellite imagery (GPS) of the proposed site delineatingthe forestland (in case of projects involving forest land more than 40 ha)
iii. Status of Application submitted for obtaining the stage I forestry clearance along with lateststatus shall be submitted.
iv. The projects to be located within 10 km of the National Parks, Sanctuaries, Biosphere Reserves,Migratory Corridors of Wild Animals, the project proponent shall submit the map dulyauthenticated by Chief Wildlife Warden showing these features vis-à-vis the project locationand the recommendations or comments of the Chief Wildlife Warden-thereon.
v. Wildlife Conservation Plan duly authenticated by the Chief Wildlife Warden of the StateGovernment for conservation of Schedule I fauna, if any exists in the study area.
vi. Copy of application submitted for clearance under the Wildlife (Protection) Act, 1972, to theStanding Committee of the National Board for Wildlife.
6) Environmental Status
i. Determination of atmospheric inversion level at the project site and site-specific micro-meteorological data using temperature, relative humidity, hourly wind speed and directionand rainfall.
ii. AAQ data (except monsoon) at 8 locations for PM10, PM2.5, SO2, NOX, CO and otherparameters relevant to the project shall be collected. The monitoring stations shall be basedCPCB guidelines and take into account the pre-dominant wind direction, population zoneand sensitive receptors including reserved forests.
iii. Raw data of all AAQ measurement for 12 weeks of all stations as per frequency given in theNAQQM Notification of Nov. 2009 along with - min., max., average and 98% values foreach of the AAQ parameters from data of all AAQ stations should be provided as an annexureto the EIA Report.
iv. Surface water quality of nearby River (100m upstream and downstream of discharge point)and other surface drains at eight locations as per CPCB/MoEF&CC guidelines.
v. Whether the site falls near to polluted stretch of river identified by the CPCB/MoEF&CC, ifyes give details.
vi. Ground water monitoring at minimum at 8 locations shall be included.
vii. Noise levels monitoring at 8 locations within the study area.
viii. Soil Characteristic as per CPCB guidelines.
ix. Traffic study of the area, type of vehicles, frequency of vehicles for transportation of materials,additional traffic due to proposed project, parking arrangement etc.
184
STANDARD TERMS OF REFERENCE (TOR) FOR EIA/EMP REPORT FOR PROJECTS/ACTIVITIES REQUIRING ENVIRONMENT CLEARANCE
x. Detailed description of flora and fauna (terrestrial and aquatic) existing in the study area shallbe given with special reference to rare, endemic and endangered species. If Schedule-Ifauna are found within the study area, a Wildlife Conservation Plan shall be prepared andfurnished.
xi. Socio-economic status of the study area.
7) Impact and Environment Management Plan
i. Assessment of ground level concentration of pollutants from the stack emission based onsite-specific meteorological features. In case the project is located on a hilly terrain, theAQIP Modelling shall be done using inputs of the specific terrain characteristics fordetermining the potential impacts of the project on the AAQ. Cumulative impact of all sourcesof emissions (including transportation) on the AAQ of the area shall be assessed. Details ofthe model used and the input data used for modelling shall also be provided. The air qualitycontours shall be plotted on a location map showing the location of project site, habitationnearby, sensitive receptors, if any.
ii. Water Quality modelling - in case of discharge in water body
iii. Impact of the transport of the raw materials and end products on the surrounding environmenthall be assessed and provided. In this regard, options for transport of raw materials andfinished products and wastes (large quantities) by rail or rail-cum road transport or conveyor-cum-rail transport shall be examined.
iv. A note on treatment of wastewater from different plant operations, extent recycled and reusedfor different purposes shall be included. Complete scheme of effluent treatment. Characteristicsof untreated and treated effluent to meet the prescribed standards of discharge under E(P)Rules.
v. Details of stack emission and action plan for control of emissions to meet standards.
vi. Measures for fugitive emission control
vii. Details of hazardous waste generation and their storage, utilization and management. Copiesof MOU regarding utilization of solid and hazardous waste in cement plant shall also beincluded. EMP shall include the concept of waste-minimization, recycle/reuse/recovertechniques, Energy conservation, and natural resource conservation.
viii. Proper utilization of fly ash shall be ensured as per Fly Ash Notification, 2009. A detailedplan of action shall be provided.
ix. Action plan for the green belt development plan in 33 % area i.e. land with not less than1,500 trees per ha. Giving details of species, width of plantation, planning schedule etc. shallbe included. The green belt shall be around the project boundary and a scheme for greeningof the roads used for the project shall also be incorporated.
x. Action plan for rainwater harvesting measures at plant site shall be submitted to harvestrainwater from the roof tops and storm water drains to recharge the ground water and also to
185
STANDARD TERMS OF REFERENCE (TOR) FOR EIA/EMP REPORT FORPROJECTS/ACTIVITIES REQUIRING ENVIRONMENT CLEARANCE
use for the various activities at the project site to conserve fresh water and reduce the waterrequirement from other sources.
xi. Total capital cost and recurring cost/annum for environmental pollution control measuresshall be included.
xii. Action plan for post-project environmental monitoring shall be submitted.
xiii. Onsite and Offsite Disaster (natural and Man-made) Preparedness and Emergency ManagementPlan including Risk Assessment and damage control. Disaster management plan should belinked with District Disaster Management Plan.
8) Occupational health
i. Plan and fund allocation to ensure the occupational health & safety of all contract and casualworkers
ii. Details of exposure specific health status evaluation of worker. If the workers' health is beingevaluated by pre designed format, chest x rays, Audiometry, Spirometry, Vision testing (Far& Near vision, colour vision and any other ocular defect) ECG, during pre placement andperiodical examinations give the details of the same. Details regarding last month analyzeddata of above mentioned parameters as per age, sex, duration of exposure and departmentwise.
iii. Details of existing Occupational & Safety Hazards. What are the exposure levels of hazardsand whether they are within Permissible Exposure level (PEL). If these are not within PEL,what measures the company has adopted to keep them within PEL so that health of the workerscan be preserved,
iv. Annual report of heath status of workers with special reference to Occupational Health andSafety.
9) Corporate Environment Policy
i. Does the company have a well laid down Environment Policy approved by its Board ofDirectors? If so, it may be detailed in the EIA report.
ii. Does the Environment Policy prescribe for standard operating process / procedures to bringinto focus any infringement / deviation / violation of the environmental or forest norms /conditions? If so, it may be detailed in the EIA.
iii. What is the hierarchical system or Administrative order of the company to deal with theenvironmental issues and for ensuring compliance with the environmental clearanceconditions? Details of this system may be given.
iv. Does the company have system of reporting of non compliances / violations of environmentalnorms to the Board of Directors of the company and / or shareholders or stakeholders atlarge? This reporting mechanism shall be detailed in the EIA report
186
STANDARD TERMS OF REFERENCE (TOR) FOR EIA/EMP REPORT FOR PROJECTS/ACTIVITIES REQUIRING ENVIRONMENT CLEARANCE
10) Details regarding infrastructure facilities such as sanitation, fuel, restroom etc. to be provided to thelabour force during construction as well as to the casual workers including truck drivers duringoperation phase.
11) Enterprise Social Commitment (ESC)
i. Adequate funds (at least 2.5 % of the project cost) shall be earmarked towards the EnterpriseSocial Commitment based on Public Hearing issues and item-wise details along with timebound action plan shall be included. Socio-economic development activities need to beelaborated upon.
12) Any litigation pending against the project and/or any direction/order passed by any Court of Lawagainst the project, if so, details thereof shall also be included. Has the unit received any noticeunder the Section 5 of Environment (Protection) Act, 1986 or relevant Sections of Air and WaterActs? If so, details thereof and compliance/ATR to the notice(s) and present status of the case.
13) A tabular chart with index for point wise compliance of above TOR.
B. SPECIFIC TERMS OF REFERENCE FOR EIA STUDIES FOR SYNTHETICORGANIC CHEMICALS INDUSTRY (DYES & DYE INTERMEDIATES;BULK DRUGS AND INTERMEDIATES EXCLUDING DRUGFORMULATIONS; SYNTHETIC RUBBERS; BASIC ORGANICCHEMICALS, OTHER SYNTHETIC ORGANIC CHEMICALS ANDCHEMICAL INTERMEDIATES)
1. Detailsonsolvents to be used,measuresfor solventrecovery and for emissions control.
2. Details of process emissions from the proposed unit and its arrangement to control.
3. Ambient air quality data should include VOC, otherprocess-specificpollutants* like NH3*, chlorine*,HCl*, HBr*, H2S*, HF*,etc.,(*-asapplicable)
4. Work zone monitoring arrangements for hazardous chemicals.
5. Detailed effluent treatment scheme including ssegregation of effluent streams for units adopting'Zero' liquid discharge.
6. Action plan for odour control to be submitted.
7. A copy of the Memorandum of Understanding signed with cement manufacturers indicating clearlythat they co-process organic solid/hazardous waste generated.
8. Authorization/Membership for the disposal of liquid effluent in CETP and solid/hazardous waste inTSDF, if any.
9. Action plan for utilization of MEE/dryers salts.
10. Material Safety Data Sheet for all the Chemicals are being used/will be used.
11. Authorization/Membership for the disposal of solid/hazardous waste in TSDF.
187
STANDARD TERMS OF REFERENCE (TOR) FOR EIA/EMP REPORT FORPROJECTS/ACTIVITIES REQUIRING ENVIRONMENT CLEARANCE
12. Details of incinerator if to be installed.
13. Risk assessment for storage and handling of hazardous chemicals/solvents. Action plan for handling& safety system to be incorporated.
14. Arrangements for ensuring health and safety of workers engaged in handling of toxic materials.
***
Virchow Drugs Limited TOR Compliances
Page 1
Compliance of Terms of Reference Compliance of Standard TOR for “Synthetic Organic Chemicals Industry (dyes and dye
intermediates; bulk drugs and intermediates excluding drug formation; synthetic rubber; basic organic chemicals, other synthetic organic chemicals and chemical intermediates” Issued by
MoEF&CC for EIA/EMP report for Projects/Activates requiring Environmental Clearance Under EIA Notification, 2006
S.No Compliance of Terms or Reference Response
A. STANDARD TERMS OF REFERENCE 1 Executive Summary Included in EIA report. 2 Introduction i. Details of the EIA Consultant including
NABET accreditation EIA Consultants: Team Labs and Consultants List of QCI/NABET Consultants: S.No.161
ii. Information about the project proponent Presented in Chapter 1 of EIA report at Page No. 1-1
iii. Importance and benefits of the project Presented in Chapter 1 of EIA report at Page No. 1-1
3 Project Description i. Cost of project and time of completion. Cost of Project for Proposed Expansion is 2
crores. ii. Products with capacities for the proposed
project. Presented in Chapter 1 of EIA report at Page No. 1-3
iii. If expansion project, details of existing products with capacities and whether adequate land is available for expansion, reference of earlier EC if any.
Presented in Chapter 1 of EIA report at Page No. 1-3. The proposed expansion is within existing plant site. Total land area (existing): 3 acres.
iv. List of raw materials required and their source along with mode of transportation.
Presented in Chapter 6 of EIA report at Page No. 6-3
v. Other chemicals and materials required with quantities and storage capacities
Presented in Chapter 6 of EIA report at Page No. 6-3
vi. Details of Emission, effluents, hazardous waste generation and their management.
Presented in Environment Management Plan. Emissions: 1-8 to 1-10 Effluents: 1-2 to 1-7 Hazardous Waste: 1-11.
vii. Requirement of water, power, with source of supply, status of approval, water balance diagram, man-power requirement (regular and contract)
Total water required: 249.5 KLD Fresh water: 159.5 KLD Recycled water: 90 KLD Water Balance is Presented in Chapter of EIA report at Page No. 2-9
viii. Process description along with major equipments and machineries, process flow sheet (quantative) from raw material to products to be provided
Presented in Chapter of EIA report at Page No. 2-1 to 2-8 Separate Annexure
ix. Hazard identification and details of proposed safety systems.
Presented in Chapter 6 of EIA report at Page No. 6-8 to 6-10.
x. Expansion/modernization proposals: a. Copy of all the Environmental Clearance(s)
including Amendments thereto obtained Copy of Environmental Clearance and status of compliance of conditions
Virchow Drugs Limited TOR Compliances
Page 2
for the project from MOEF/SEIAA shall be attached as an Annexure. A certified copy of the latest Monitoring Report of the Regional Office of the Ministry of Environment and Forests as per circular dated 30th May, 2012 on the status of compliance of conditions stipulated in all the existing environmental clearances including Amendments shall be provided. In addition, status of compliance of Consent to Operate for the ongoing existing operation of the project from SPCB shall be attached with the EIA-EMP report.
stipulated in EC presented in Annexure - I. Point wise compliance of Consent for Operate (CFO) Presented at Annexure – II.
b. In case the existing project has not obtained environmental clearance, reasons for not taking EC under the provisions of the EIA Notification 1994 and/or EIA Notification 2006 shall be provided. Copies of Consent to Establish/No Objection Certificate and Consent to Operate (in case of units operating prior to EIA Notification 2006, CTE and CTO of FY 2005-2006) obtained from the SPCB shall be submitted. Further, compliance report to the conditions of consents from the SPCB shall be submitted.
Not Applicable
4 Site Details i. Location of the project site covering village,
Taluka/Tehsil, District and State, Justification for selecting the site, whether other sites were considered.
Virchow Drugs Limited Sy. No. 639 (Part), IDA Bonthapally, Jinnaram Mandal, Medak District, Telangana. Proposed expansion is within existing plant site of area 3 acres.
ii. A topo sheet of the study area of radius of 10km and site location on 1:50,000/1:25,000 scale on an A3/A2 sheet. (including all eco-sensitive areas and environmentally sensitive places)
Presented in Chapter 1 of EIA report at Page No. 1-5.
iii. Details w.r.t. option analysis for selection of site
Proposal is for expansion of manufacturing capacity within existing plant site.
iv. Co-ordinates (lat-long) of all four corners of the site.
v. Google map-Earth downloaded of the project site.
Enclosed at Annexure - III
vi. Layout maps indicating existing unit as well as proposed unit indicating storage area, plant area, greenbelt area, utilities etc. If located
Plant layout is presented in Chapter 1 of EIA report at Page No. 1-6
Virchow Drugs Limited TOR Compliances
Page 3
within an Industrial area/Estate/Complex, layout of Industrial Area indicating location of unit within the Industrial area/Estate.
vii. Photographs of the proposed and existing (if applicable) plant site. If existing, show Photographs of plantation/greenbelt, in particular.
Photographs of Plant site is presented in Chapter 3 of EIA report at Page No. 3-2
viii. Land use break-up of total land of the project site (identified and acquired), government/ private - agricultural, forest, wasteland, water bodies, settlements, etc shall be included. (not required for industrial area)
Plant layout is presented in Chapter 1 of EIA report at Page No. 1-6
ix. A list of major industries with name and type within study area (10km radius) shall be Incorporated. Land use details of the study area
Land use and Land Cover map of the study area is presented in Chapter 3 of EIA report at Page No. 3-6.
x. Geological features and Geo-hydrological status of the study area shall be included.
Presented in Chapter 3 of EIA report at Page No. 3-2 to 3-3
xi. Details of Drainage of the project upto 5km radius of study area. If the site is within 1 km radius of any major river, peak and lean season river discharge as well as flood occurrence Frequency based on peak rainfall data of the past 30 years. Details of Flood Level of the Project site and maximum Flood Level of the river shall also be provided. (mega green field projects)
Drainage pattern of the impact area is presented in Chapter 3 of EIA report at Page No. 3-14
xii. Status of acquisition of land. If acquisition is not complete, stage of the acquisition process and expected time of complete possession of the land.
Proposal is for expansion of manufacturing capacity within existing plant site of area 3 acres.
xiii. R&R details in respect of land in line with state Government policy.
Not Applicable. Expansion within existing site area.
5 Forest and wildlife related issues (if applicable): i. Permission and approval for the use of forest
land (forestry clearance), if any, and recommendations of the State Forest Department. (if applicable)
Not Applicable
ii. Land use map based on High resolution satellite imagery (GPS) of the proposed site delineating the forestland (in case of projects involving forest land more than 40 ha)
The present proposal is for expansion within existing plant site, however land use map is presented in Chapter 3 of EIA report at Page No. 3-8
iii. Status of Application submitted for obtaining the stage I forestry clearance along with latest status shall be submitted.
Not Applicable
iv. The projects to be located within 10 km of the National Parks, Sanctuaries, Biosphere Reserves, Migratory Corridors of Wild Animals, the project proponent shall submit the map duly authenticated by Chief Wildlife Warden showing these features vis-à-vis the
There are no National Parks, Sanctuaries, Biosphere Reserves, Migratory Corridors of Wild Animals within the impact area of 10 km.
Virchow Drugs Limited TOR Compliances
Page 4
project location and the recommendations or comments of the Chief Wildlife Warden-thereon.
v. Wildlife Conservation Plan duly authenticated by the Chief Wildlife Warden of the State Government for conservation of Schedule I fauna, if any exists in the study area.
Not Applicable
vi. Copy of application submitted for clearance under the Wildlife (Protection) Act, 1972, to the Standing Committee of the National Board for Wildlife.
Not Applicable
6 Environmental Status i. Determination of atmospheric inversion level at
the project site and site-specific micrometeorological data using temperature, relative humidity, hourly wind speed and direction and rainfall.
Site-specific micrometeorological data presented in Chapter 3 of EIA report at Page No. 3-21 to 3-23
ii. AAQ data (except monsoon) at 8 locations for PM10, PM2.5, SO2, NOX, CO and other parameters relevant to the project shall be collected. The monitoring stations shall be based CPCB guidelines and take into account the pre-dominant wind direction, population zone and sensitive receptors including reserved forests.
AAQ data presented in Chapter 3 of EIA report at Page No. 3-28
iii. Raw data of all AAQ measurement for 12 weeks of all stations as per frequency given in the NAQQM Notification of Nov. 2009 along with - min., max., average and 98% values for each of the AAQ parameters from data of all AAQ stations should be provided as an annexure to the EIA Report.
AAQ data is presented in Chapter 3 of EIA report at Page No. 3-28 to 3-29
iv. Surface water quality of nearby River (100m upstream and downstream of discharge point) and other surface drains at eight locations as per CPCB/MoEF&CC guidelines.
Representative water samples were observed to be dry.
v. Whether the site falls near to polluted stretch of river identified by the CPCB/MoEF&CC, if yes give details.
No. The site located at IDA, Bonthapally, Jinnaram Mandal, Medak District, Telangana.
11.53 Km away from Critically Polluted Area of Patancheru – Bollaram Industrial Estates
vi. Ground water monitoring at minimum at 6 locations shall be included.
Ground Monitoring locations presented in Chapter 3 of EIA report at Page No. 3-13 and 3-15.
vii. Noise levels monitoring at 6 locations within the study area.
Noise levels monitoring is presented in Chapter 3 of EIA report at Page No. 3-32.
viii. Soil Characteristic as per CPCB guidelines. Soil Characteristics is presented in Chapter 3 of EIA report at Page No. 3-8 to 3-9.
ix. Traffic study of the area, type of vehicles, The additional traffic generated due to the
Virchow Drugs Limited TOR Compliances
Page 5
frequency of vehicles for transportation of materials, additional traffic due to proposed project, parking arrangement etc.
proposed expansion shall be 2 truck trips per day.
x. Detailed description of flora and fauna (terrestrial and aquatic) existing in the study area shall be given with special reference to rare, endemic and endangered species. If Schedule-I fauna are found within the study area, a Wildlife Conservation Plan shall be prepared and furnished.
Flora and Fauna of the Impact area is presented in Chapter 3 of EIA report at Page No. 3-39 to 3-48
xi. Socio-economic status of the study area. Socio-Economic status of the impact area is presented in Chapter 3 of EIA report at Page No. 3-33 to 3-38
7 Impact and Environment Management Plan i. Assessment of ground level concentration of
pollutants from the stack emission based on site-specific meteorological features. In case the project is located on a hilly terrain, the AQIP Modelling shall be done using inputs of the specific terrain characteristics for determining the potential impacts of the project on the AAQ. Cumulative impact of all sources of emissions (including transportation) on the AAQ of the area shall be assessed. Details of the model used and the input data used for modelling shall also be provided. The air quality contours shall be plotted on a location map showing the location of project site, habitation nearby, sensitive receptors, if any.
Predictions of ground level concentrations using ISC-AERMOD using ISCST3 model is of the pollutants presented in Chapter 4 of EIA report at Page No. 4-16 to 4-23. There will be 2 truck trips per day after expansion. Emissions considered from transport of vehicles as line source.
ii. Water Quality modelling - in case of discharge in water body
Total effluent generated sent to “Zero Liquid Discharge “System and treated effluent reused for cooling tower make-up.
iii. Impact of the transport of the raw materials and end products on the surrounding environment shall be assessed and provided. In this regard, options for transport of raw materials and finished products and wastes (large quantities) by rail or rail-cum road transport or conveyor cum- rail transport shall be examined.
There will be 2 truck trips per day. Truck transport Incidents and concerns are presented in Chapter 6 of EIA report at Page No. 6-28.
iv. A note on treatment of wastewater from different plant operations, extent recycled and reused for different purposes shall be included. Complete scheme of effluent treatment. Characteristics of untreated and treated effluent to meet the prescribed standards of discharge under E (P) Rules.
Quantity, quality of effluent generated from different operation is presented in Environment Management Plan of EIA report at Page No. 1-2 to 1-7.
Effluent Treatment System (ZLD) is presented in Environment Management Plan of EIA report at Page No. 1-2 to 1-7
v. Details of stack emission and action plan for control of emissions to meet standards.
Presented in Environment Management Plan of EIA report at Page No. 1-8.
vi. Measures for fugitive emission control Presented in Environment Management
Virchow Drugs Limited TOR Compliances
Page 6
Plan of EIA report at Page No. 1-15. vii. Details of hazardous waste generation and
their storage, utilization and management. Copies of MOU regarding utilization of solid and hazardous waste in cement plant shall also be included. EMP shall include the concept of waste-minimization, recycle/reuse/recover Techniques, Energy conservation, and natural resource conservation.
Presented in Environment Management Plan of EIA report at Page No. 1-11. Reduce, reuse and recycled concept is presented in waste-minimization, Energy conservation is presented in Environment Management Plan of EIA report at Page No. 1-17.
viii. Proper utilization of fly ash shall be ensured as per Fly Ash Notification, 2009. A detailed plan of action shall be provided.
Ash generated from coal fired boilers is 18.74 TPD and same sent to brick manufacturers.
ix. Action plan for the green belt development plan in 33 % area i.e. land with not less than 1,500 trees per ha. Giving details of species, width of plantation, planning schedule etc. shall be included. The green belt shall be around the project boundary and a scheme for greening of the roads used for the project shall also be incorporated.
0.99 acres developed for green area. Layout showing green belt development is presented in Environment Management Plan at Page No. 1-18 to 1-19.
x. Action plan for rainwater harvesting measures at plant site shall be submitted to harvest rainwater from the roof tops and storm water drains to recharge the ground water and also to use for the various activities at the project site to conserve fresh water and reduce the water requirement from other sources.
Presented in Environment Management Plan of EIA report at Page No. 1-12.
xi. Total capital cost and recurring cost/annum for environmental pollution control measures shall be included.
Total Capital Cost: Rs. 2 crores EMP Cost estimate: Rs. 1.678crores Recurring Cost on EMP: Rs. 1.342 crores. Details are presented in Environment Management Plan at Page no. 1-22.
xii. Action plan for post-project environmental monitoring shall be submitted.
Presented in Chapter 5 of EIA report at Page No. 5-8.
xiii. Onsite and Offsite Disaster (natural and Man-made) Preparedness and Emergency Management Plan including Risk Assessment and damage control. Disaster management plan should be linked with District Disaster Management Plan.
Disaster Management Plan is presented in Chapter 6 of EIA report.
Onsite and Offsite Disaster is presented in Chapter 6 of EIA .
8 Occupational Health i. Plan and fund allocation to ensure the
occupational health & safety of all contract and casual workers
Total: 7 Lakhs/annum PPE: 5 Lakhs/annum Health Check-up: 5 Lakhs/annum
ii. Details of exposure specific health status evaluation of worker. If the workers' health is being evaluated by pre designed format, chest x rays, Audiometry, Spirometry, Vision testing (Far & Near vision, colour vision and any other ocular defect) ECG, during pre placement and Periodical examinations give the details of the
Medical health check-up is Environment Management Plan of EIA report at Page No. 1-14 to 1-15.
Virchow Drugs Limited TOR Compliances
Page 7
same. Details regarding last month analyzed data of above mentioned parameters as per age, sex, duration of exposure and department wise.
iii. Details of existing Occupational & Safety Hazards. What are the exposure levels of hazards and whether they are within Permissible Exposure level (PEL). If these are not within PEL, what measures the company has adopted to keep them within PEL so that health of the workers can be preserved,
Presented in Environment Management Plan of EIA report at Page No. 1-13 to 1-14
Suitable PPE is prescribed to the employees working in area where the conc. Exceeds PEL values. Simultaneously the project and R&D team are consulted to suggest mitigative measures and or engineering control measures.
The focus shall always be in ensuring concentration within PEL by adopting engineering controls as when requires.
iv. Annual report of heath status of workers with special reference to Occupational Health and Safety.
Annual report of Health Status of workers is enclosed at Annexure
9 Corporate Environment Policy i. Does the company have a well laid down
Environment Policy approved by its Board of Directors? If so, it may be detailed in the EIA report.
Corporate Environment Policy is presented in Environment Management Plan of EIA report at Page No. 1-20.
ii. Does the Environment Policy prescribe for standard operating process / procedures to bring into focus any infringement / deviation / violation of the environmental or forest norms / conditions? If so, it may be detailed in the EIA.
Environment engineer is responsible to bring to focus to higher management in case of deviation/ violation of the environmental or forest norms / conditions.
iii. What is the hierarchical system or Administrative order of the company to deal with the environmental issues and for ensuring compliance with the environmental clearance Conditions? Details of this system may be given.
Environment Management Cell is presented in Environment Management Plan of EIA report at Page No. 1-20.
iv. Does the company have system of reporting of non compliances / violations of environmental norms to the Board of Directors of the company and / or shareholders or stakeholders at large? This reporting mechanism shall be detailed in the EIA report
No
10 Details regarding infrastructure facilities such as sanitation, fuel, restroom etc. to be provided to the labour force during construction as well as to the casual workers including truck drivers during operation phase.
The present proposal is for expansion in existing area of 3 cares.
11 Enterprise Social Commitment (ESC) i. Adequate funds (at least 2.5 % of the project
cost) shall be earmarked towards the Corporate Social Responsibilities – Budget is presented in Environment Management
Virchow Drugs Limited TOR Compliances
Page 8
Enterprise Social Commitment based on Public Hearing issues and item-wise details along with time bound action plan shall be included. Socio-economic development activities need to be elaborated upon.
Plan of EIA report at Page No. 1-16.
12 Any litigation pending against the project and/or any direction/order passed by any Court of Law against the project, if so, details thereof shall also be included. Has the unit received any notice under the Section 5 of Environment (Protection) Act, 1986 or relevant Sections of Air and Water Acts? If so, details thereof and compliance/ATR to the notice(s) and present status of the case.
No Individual Court case against the Project.
13 A tabular chart with index for point wise compliance of above TOR.
Enclosed at Compliance of Terms of Reference along with EIA & EMP.
B. SPECIFIC TERMS OF REFERENCE FOR EIA STUDIES FOR SYNTHETIC ORGANIC CHEMICALS INDUSTRY (DYES & DYE INTERMEDIATES; BULK DRUGS AND INTERMEDIATES EXCLUDING DRUG FORMULATIONS; SYNTHETIC RUBBERS; BASIC ORGANIC CHEMICALS, OTHER SYNTHETIC ORGANIC CHEMICALS AND CHEMICAL INTERMEDIATES)
1 Details on solvents to be used, measures for solvent recovery and for emissions control.
Details of solvents used and balance is presented in Chapter 2 of EIA report at Page No. 2-17 to 2-18.
2 Details of process emissions from the proposed unit and its arrangement to control.
No process emission will generate from proposed expansion.
3 Ambient air quality data should include VOC, other process-specific pollutants* like NH3*, chlorine*, HCl*, HBr*, H2S*, HF*,etc., (*-as applicable)
AAQ data is presented in Chapter 3 of EIA report at Page No. 3-28
4 Work zone monitoring arrangements for hazardous chemicals.
Presented in Chapter 5 of EIA report at Page No. 5-8 to 5-9.
5 Detailed effluent treatment scheme including segregation of effluent streams for units adopting 'Zero' liquid discharge.
Details of Effluent Treatment System (ZLD) are presented in Environment Management Plan.
6 Action plan for odour control to be submitted. Presented in Environment Management Plan of EIA report at Page No. 1-10.
7 A copy of the Memorandum of Understanding signed with cement manufacturers indicating clearly that they co-process organic solid/hazardous waste generated.
Enclosed at Annexure - IV
8 Authorization/Membership for the disposal of liquid effluent in CETP and solid/hazardous waste in TSDF, if any.
Enclosed at Annexure - IV
9 Action plan for utilization of MEE/dryers salts. Salts generated from MEE/ATFD sent to TSDF.
10 Material Safety Data Sheet for all the Chemicals are being used/will be used.
Enclosed at Annexure
11 Authorization/Membership for the disposal of solid/hazardous waste in TSDF.
Enclosed at Annexure - IV
12 Details of incinerator if to be installed. Not Applicable. Organic waste sent to cements plant for co-incineration.
Virchow Drugs Limited TOR Compliances
Page 9
13 Risk assessment for storage and handling of hazardous chemicals/solvents. Action plan for handling & safety system to be incorporated.
Presented in Chapter 6 of EIA report
14 Arrangements for ensuring health and safety of workers engaged in handling of toxic materials.
Presented in Environment Management Plan of EIA report at Page No. 1-13.
VIRCHOW DRUGS LIMITED SY.NO. 639 (PART), IDA BONTHAPALLY,
JINNARAM MANDAL, MEDAK DISTRICT, TELANGANA
Status of compliance of the conditions stipulated in the Environmental Clearance
STUDIES AND DOCUMENTATION BY TEAM Labs and Consultants B‐115‐117 & 509, Annapurna Block, Aditya Enclave, Ameerpet, Hyderabad‐500 038. Phone: 040‐23748 555/23748616, Telefax: 040‐23748666
SUBMITTED TO STATE LEVEL ENVIRONMENT IMPACT ASSESSMENT AUTHORITY,
TELANGANA, GOVERNMENT OF INDIA
VIRCHOW DRUGS LIMITED
Compliance report of CFO
SCHEDULE-B
S.No 1 The Industry shall not manufacture any un-
consented products and exceeding capacities without obtaining Consent for Establishment (CFE) and Consent for Operation (CFO)
Noted the condition
2 The industry shall file the water cess returns in Form-1 as required under section (5) of Water (Prevention and control of pollution) Cess Act, 1977, on or before the 5th of every calendar month, showing the quantity of water consumed in the previous month alongwith water meter readings. The Industry shall remit water cess as per the assessment orders as and when issued by Board. The industry shall provide separate water meters with necessary pipeline for assessing the quantity of water used for each of the purposes as per Cess Form-I
Noted the condition, we are remitting the water cess and returns are submitted in Form-I to HO&RO-II.
3 The industry shall take steps to reduce water consumption to the extent possible and consumption shall NOT exceed the quantities mentioned below.
Water consumption is below the limits mentioned in the order
4 The emissions shall not contain constituents in excess of the prescribed limits mentioned below.
The emission standards prescribed under the act are complied.
5 The industry shall comply with ambient air quality standards of PM10
We comply with ambient air quality standards as specified under the act.
6 The industry vide letter dt.09.10.2013 stated that there are no process emissions in the manufacturing process and so scrubber was not provided. In case any change in their process, the industry shall obtain permission of the Board.
We donot have process emmissions. For fugitive emmissions control one scrubber is provided.
7 The industry shall provide online VOC
analysers and connect the data to APPCB website within 3 months, as committed vide letter dt.09.10.2013
Noted the condition.
8 The industry shall provide dyke wall to all storage tanks within 1 month, as committed vide letter dt.09.10.2013
All the tanks are provided with dyke walls.
9 The Industry shall provide digital flow meters for FE feed and FE condensate within 3 months, as committed vide letter dt. 09.10.2013.
Digital flow meters are provided
10 The industry shall submit bank guarantee of Rs.50,000/- with validity of 3 years for development of additional green belt of 0.8 Acre to meet the norms, at Regional Office, RC Puram, Medak district.
Green belt is developed as per the norms
11 The industry shall earmark an amount of Rs.2 lakhs per annum for 10 years towards the Enterprises Social Responsibility (ESR) activities and spend the amount in Local area.
We are spending the amount as per the directions in our local area.
12 The industry shall explore possibility of recovery of salts such as Ammonium sulphate, Sodium Sulphate etc., from the effluents generated by way of segregation of streams instead of evaporation of combined effluents and sending the salts to the TSDF for landfill.
R&D efforts are on regarding the possibility of recovery of salts from effluents
13 There shall not be any spillages/discharges of chemicals/effluents on ground. The drums containing chemicals & wastes shall be stores in elevated platform provided with leachate/spillages collection pit.
Noted and follwed the condition
14 The Industry shall maintain the following records and the same shall be made available to the Board Officials during the inspection.
a. Daily production details RG-I records and Central Excise Returns
b. Quantity of effluents generated, forced evaporated, first fore run & secondary condensate generation of daily basis.
c. Daily solid waste generated and disposed to TSDF
d. Log books for pollution control systems.
Noted the condition.Records are maintained and are available for inspection.
15 Regular monitoring of vents of the storage tanks and work room concentration shall be carried out using sensors
Yes, followed.
16 The proponent shall not use odour causing substances or Mercaptans and cause odour nuisance in the surroundings
We are not using any odour causing substances.
17 The industry shall operate Solvent Recovery Plant within plant premises. Solvents shall be recovered to the maximum extent possible and shall be reused. The industry shall submit status of efficiency of Solvent Recovery Plant to the concerned Regional Officer. The Industry shall not dispose spent solvents/mixed spent solvents to the traders/recyclers.
Solvents are recovered and reused in process. Recovery is above 95 %.
18 The evaporation losses in solvents shall be controlled by taking all preventive measures such as circulation of chilled brine, transfer of solvents by using pumps instead of manual handling closed centrifuges, providing primary and secondary condensers to all the reactor vents and all the solvents storage tanks and keeping solvent storage in ground storage tanks with closed pipeline to Reactors.
Pumps are used for transfer and vent condensers with chilled water circulation are provided.
19 As per G.O.Rt.No.286, the industry shall transport the industrial effluents and plying on the roads is allowed between 6 A.M. to 6 P.M only, if the industry is engaged in sending the effluents to CETP in the stipulated time frame.
Noted the condition.
20 The applicant shall submit Environment statement in Form-V to the Regional office before 30th September of every year as per rule No.14 of E(P) rules, 1986 & amendments thereof.
Form V is submitted to RO-II every year before 30 th september.
21 The industry shall comply with ‘Task force directions issued by Board from time to time.
Noted the condition.
22 All the rules & regulations notified by Ministry of Law and justice, government of India regarding Public Liability Insurance Act, 1991, should be followed.
Noted the condition and followed.
23 The conditions stipulated in this order are without prejudice to rights and contentions of this Board in any Hon’ble court of law.
Noted the condition
SCHEDULE –C (see rule 5(4))
(CONDITIONS OF AUTHORISATION FOR OCCUPIER OR OPERATOR HANDLING HAZARDOUS WASTES)
1 The Industry shall give top priority for waste minimization and cleaner production practices
We are giving top priority for waste minimization and cleaner production practices.
2 The industry shall not store hazardous waste for more than 90 days as per Hazardous Wastes (Management Handling ad Transboundary Movement) rules, 2008 and amendments thereof. The industry shall maintain 6 copy manifest system for transportation of waste generated and copies of receipt of consignee shall be submitted to the Concerned Regional Office. The Industry shall maintain proper records for Hazardous Wastes stated in authorization in FORM-3 i.e. quantity of Incinerable waste, land disposal waste, recyclable waste etc. and file annual returns in Form-4 as per rule 22(2) of the Hazardous Wastes (Management,Handling & Transboundary Movement) rules, 2008 and amendments thereof.
Noted the condition. We are maintaining 6 copy manifest system for transporting waste and is submitted to RO-II. Records for Hazardous waste are maintained and returns are filed in Form-4.
3 the Industry shall dispose/sell the Hazardous Waste to only industries/agencies authorized by the State Pollution control Boards. The industry shall verify the authorization of the Board given to the party before disposing its waste to the External Party.
Noted the condition and followed
4 The industry shall maintain proper records for Hazardous Wastes disposal and its concurrence with authorization. In case of variation in generation, industry shall submit explanation and obtain amendment in Environmental clearance/CFE/CFO in this regard
Noted and maintaining records
5 The industry shall store used/waste oil and Used Lead Acid Batteries in a secured way in their premises till its disposal. Waste oils shall be disposed to the authorized reprocessors/recyclers and used lead acid batteries shall be disposed to the manufacturers/dealers on buyback basis. The industry shall take necessary practical steps for prevention of oil spillages and carry over of oil from the premises. The industry shall check the certificate/authorisation/order of MoEF issued to the Re-users/recycle units while disposing the waste oil.
Waste oil is stored in drums, and all precautions taken to avoid oil spillages. Followed MOEF order.
6 The industry shall dispose of e-waste to the authorised recyclers only
Noted the condition
7 The industry shall conform to the co-processing guidelines of CPCB in sending wastes to co-processing for cement plants.
Noted the condition
8 The industry shall maintain good house keeping
Maintaining good house keeping
9 The industry shall submit the condition wise compliance report of the conditions stipulated in Schedule B & C of this order on half yearly basis to Board Office, Hyderabad and concerned Regional Office.
Noted the condition
Sche
me
for
Accr
edit
atio
n of
EIA
Con
sulta
nt O
rgan
izat
ions
Lis
t o
f A
ccre
dit
ed
Co
nsu
lta
nt
Org
an
iza
tio
ns
(Alp
ha
be
tica
lly
)/ R
ev
. 4
0 A
pr.
08
, 20
16
) P
ag
e 1
29
*d
enot
es P
rovi
sion
ally
Acc
redi
ted
Cons
ulta
nts
S.
No.
Co
nsul
tant
Org
aniz
atio
n
Scop
e of
Acc
redi
tatio
n As
per
NAB
ET S
chem
e Pr
ojec
t or A
ctiv
ity a
s per
Sc
hedu
le o
f MoE
F N
otifi
catio
n da
ted
Sept
embe
r 14,
200
6 an
d su
bseq
uent
am
endm
ents
Sect
or
Num
ber
Nam
e of
Sec
tor
Cate
gory
Cond
ition
s app
ly
man
agem
ent f
acili
ty (C
MSW
MF)
38
Build
ing
and
larg
e co
nstr
uctio
n pr
ojec
ts in
clud
ing
shop
ping
mal
ls,
mul
tiple
xes,
com
mer
cial
com
plex
es,
hous
ing
esta
tes,
hosp
itals,
in
stitu
tions
B 8
(a)
39
Tow
nshi
ps a
nd A
rea
deve
lopm
ent
proj
ects
B
8 (b
)
159
TEAM
Lab
s and
Con
sulta
nts*
Ad
dres
s:
B-
115
&
509,
An
napu
rna
Bloc
k,
Adity
a En
clav
e, A
mee
rpet
, Hyd
erab
ad
500
038
e. m
ail:t
eam
labs
@gm
ail.c
om
Tel.:
040
2
3748
666/
237
4861
6
0
9866
4159
66
Cond
ition
s app
ly
1 M
inin
g of
min
eral
s inc
ludi
ng O
pen
cast
/ U
nder
grou
nd m
inin
g A
1 (a
) (i)
4 Th
erm
al p
ower
pla
nts
A 1
(d)
8 M
etal
lurg
ical
indu
strie
s (fe
rrou
s onl
y)
bot
h pr
imar
y an
d se
cond
ary
A 3
(a)
9 Ce
men
t pla
nts
A 3
(b)
13
Chlo
r-al
kali
indu
stry
A
4 (d
)
17
Pest
icid
es in
dust
ry a
nd p
estic
ide
spec
ific
inte
rmed
iate
s (ex
clud
ing
form
ulat
ions
) A
5 (b
)
21
Synt
hetic
org
anic
che
mic
als i
ndus
try
(dye
s & d
ye in
term
edia
tes;
bul
k dr
ugs
and
inte
rmed
iate
s exc
ludi
ngdr
ug
form
ulat
ions
; syn
thet
ic ru
bber
s; b
asic
or
gani
c ch
emic
als,
oth
er sy
nthe
tic
orga
nic
chem
ical
s and
che
mic
al
inte
rmed
iate
s)
A 5
(f)
Sche
me
for
Accr
edit
atio
n of
EIA
Con
sulta
nt O
rgan
izat
ions
Lis
t o
f A
ccre
dit
ed
Co
nsu
lta
nt
Org
an
iza
tio
ns
(Alp
ha
be
tica
lly
)/ R
ev
. 4
0 A
pr.
08
, 20
16
) P
ag
e 1
30
*d
enot
es P
rovi
sion
ally
Acc
redi
ted
Cons
ulta
nts
S.
No.
Co
nsul
tant
Org
aniz
atio
n
Scop
e of
Acc
redi
tatio
n As
per
NAB
ET S
chem
e Pr
ojec
t or A
ctiv
ity a
s per
Sc
hedu
le o
f MoE
F N
otifi
catio
n da
ted
Sept
embe
r 14,
200
6 an
d su
bseq
uent
am
endm
ents
Sect
or
Num
ber
Nam
e of
Sec
tor
Cate
gory
31
Indu
stria
l est
ates
/ par
ks/
com
plex
es/A
reas
, exp
ort p
roce
ssin
g Zo
nes(
EPZs
), Sp
ecia
l eco
nom
ic
zone
s(SE
Zs),
Biot
ech
Park
s, L
eath
er
Com
plex
es
A 7
(c)
34
High
way
s, R
ailw
ays,
tran
spor
t te
rmin
als,
mas
s rap
id tr
ansp
ort
syst
ems
A 7
(f)
38
Build
ing
and
cons
truc
tion
proj
ects
B
8(a)
39
Tow
nshi
ps a
nd A
rea
deve
lopm
ent
proj
ects
B
8 (b
)
160
Tech
no E
nviro
n En
gine
ers
Addr
ess:
Nilg
unge
, Bar
asat
-Bar
rack
pore
Roa
d, K
olka
ta
700
121
e.
mai
l: te
chno
.env
irone
ngin
eers
@gm
ail.c
om
Tel.:
033
- 253
5013
1/ 9
0889
1933
0 **
Tho
ugh
the
EIA
Coor
dina
tors
for
thes
e se
ctor
s w
ere
foun
d su
itabl
e fo
r Cat
. A, h
owev
er, t
he o
rgan
izatio
n as
a
who
le w
as a
ccre
dite
d fo
r Ca
t. B,
in
view
of
thei
r ha
ving
sc
ored
le
ss
than
60
%
mar
ks
in
Offi
ce
Asse
ssm
ent.
They
can
take
up
proj
ects
in th
ese
sect
ors
1 M
inin
g of
min
eral
s inc
ludi
ng O
pen
cast
/ Und
ergr
ound
min
ing
B**
1 (a
) (i)
8
Met
allu
rgic
al in
dust
ries
onl
y se
cond
ary
stee
l mel
ting
proc
esse
s (o
ther
than
prim
ary
ferr
ous a
nd n
on-
ferr
ous)
B**
3(a)
9 Ce
men
t Pla
nts
B**
3 (b
)
1
GOVERNMENT OF ANDHRA PRADESH ABSTRACT
Promotion of Industries – Declaring Gaddapotharam (Kazipally), Bonthapally & Gundlamachnoor areas as Notified Industrial Areas – Orders Issued. --------------------------------------------------------------------------------------------------------------------
INDUSTRIES & COMMERCE (IP) DEPARTMENT
G.O.Ms. No. 120 Dated. 22.10.2013.
Read the following:
1. Letter No. Nil, dated 14/08/2012 of the President, Model Industrial Association, Hyderabad.
2. Letter No. Nil, dated 02/09/2013 of the President, Bulk Drug Manufacturers Association, Hyderabad.
3. Recommendation of the Committee constituted for this purpose 4. Single File No.29/1/2012/13884 of Commissioner of Industries, dated
11.10.2013 5. D.O.Lr.No.15/36/2013/EP (Engg./Pharma), Dated:30-04-2013 of the Commerce
Secretary to Government of India 6. G.O.Ms.No.64,EFS&T(ENV),Dated:25/07/2013
*** ORDER:
1. In the reference 1st & 2nd read above, the President, Model Industrial Association, Hyderabad and President, Bulk Drug Manufacturers Association (BDMA) have submitted representations for declaration of Gaddapotharam (Kazipally), Bonthapally & Gundlamachnoor industrial areas as the notified industrial areas, informing that the members of their associations have set-up Chemical and Pharma industries in five industrial pockets in the area viz. Khazipally-Gaddapotharam, Bonthapally, Bonthapally-Domadugu, Borapatla and Gundlamachnoor, way back in 1990s after getting all the required permissions and approvals including Consent for Operations (CFO). He has requested the Government for notifying the said locations as industrial areas so as to facilitate the industries to avail various benefits being announced by the Central Government under the Industrial Infrastructure Up-gradation Scheme (IIUS) and also incentives announced, from time to time, by the State Government, as these areas have immense potential to develop further as a major manufacturing hub for pharmaceuticals and related chemical products.
]
2. It is further be noted that Andhra Pradesh, particularly Hyderabad, has emerged as a major player in the Bulk Drug Industry sector. There are about 266 bulk drug manufacturing companies in Andhra Pradesh, of which 90 per cent are located around Hyderabad. Hyderabad is contributing about 35% of the country’s bulk drug production and has been labeled as Bulk Drug capital of India. The Commerce Secretary, Government of India, in the reference 5th cited has stated that the share in export of bulk drugs and pharmaceuticals from the state of Andhra Pradesh is about 30% of the total exports from the country and recommended for expansion of the existing units subject to compliance of Andhra Pradesh Pollution Control Board norms in order to give further boost to the exports from this sector.
3. In the reference 6th read above the Government permitted the existing Bulk Drug and Bulk Drug intermediates manufacturing units only subject to the installations of Zero Liquid Discharge (ZLD) facilities by such units to go for expansion duly complying with all extant environmental and other norms.
4. The matter was carefully examined by an expert committee constituted by the Commissioner of Industries which submitted its recommendations vide the reference 3rd read above. Based on their recommendations the Commissioner of Industries has submitted his recommendations vide the reference 4th read above.
2
-2-
5. The Government after careful examination of the matter and in view of the recommendations of the Commissioner of Industries, A.P., Hyderabad and under various provisions of the Industrial Investment Promotion Policy 2010-15 (IIPP 2010-15), hereby decided to notify the following areas as Notified Industries Areas, as these areas are already located within Manufacturing Zones as notified in the master plan of Hyderabad Metropolitan Development Authority and more than 140 industries are operating in these areas with all the required clearances including Consent for operations (CFO).
S.N Location Village Survey Nos Area in Ha. Full Part
1
Kazipally-
Gadda potharam Area
Kazipally --- 180 99.41
Gaddapotharam 12 to 16 7 to 10 , 25 , 28, 52 138.3
3,16,17,30,31,269 to 272, 373, 376 to 378, 385, 391,397
32.304
6. Further, it is noted that though the Industries located in Gundlamachanoor have
converted their lands for industrial use, the same has not been reflected in the master plan of Hyderabad Metropolitan Development Authority as manufacturing zone. The Bulk Drug Manufacturers Association vide their Letter No. BDMA/Commissioner/MPDA/2013-14 dated. 21-09-2013 have requested the Commissioner, Hyderabad Metropolitan Development Authority to correct the anomaly by notifying the above location as Manufacturing Zone. Therefore, the following location is also notified as Industrial area subject to notification of the area as Manufacturing Zone by the Hyderabad Metropolitan Development Authority in their master plan.
3
1 Gundla machnoor
Gundla machnoor
374, 375, 376, 377, 378 & 379
44.51
-3- 7. The following conditions will apply:
(a) All the industries coming within these locations must have a valid Consent for Operation (CFO) issued by A.P. Pollution Control Board as on the date of notifying as Industrial Area.
(b) The location including the areas of different survey numbers shall be within the manufacturing zone of the Hyderabad Metropolitan Development Authority Master Plan.
(c) All other clearances, approvals, approvals under various applicable laws, acts and rules of all relevant departments as required shall be applicable to all the industries coming within these notified locations; and
(d) All new industrial units proposed in the proposed Industrial Areas to be notified and those attract the provisions of Water (Prevention and Control Pollution) Act, 1974 and Air (Prevention and Control Pollution) Act, 1981, shall invariably obtain prior Consent for Establishment (CFE) from A.P. Pollution Control Board.
8. The Commissioner of Industries, Hyderabad shall take necessary action, in the matter.
(BY ORDER AND IN THE NAME OF THE GOVERNOR OF ANDHRA PRADESH)
K.PRADEEP CHANDRA, PRINCIPAL SECRETARY TO GOVERNMENT AND COMMISSIONER FOR INDUSTRIAL PROMOTION
To The Commissioner of Industries, A.P., Hyderabad. The MA & UD Department The EFS & T Department The Member Secretary, Andhra Pradesh Pollution Control Board, Hyderabad The Vice Chairman & Managing Director, APIIC, Hyderabad. The PR & RD Department The DT & CP Department The Revenue (CT) Department. The Energy Department. The Irrigation (Reforms) Dept. The Ind. & Com. (INF) Department. The Chairman & Managing Director, APTRANSCO., Hyderabad The Managing Director, APCPDC Ltd., Hyderabad The District Collector, Medak District.
//FORWARDED::BY ORDER//
SECTION OFFICER
VIRCHOW DRUGS LIMITED SY.NO. 639 (PART), IDA BONTHAPALLY,
JINNARAM MANDAL, MEDAK DISTRICT, TELANGANA
STUDIES AND DOCUMENTATION BY TEAM Labs and Consultants QCI: MoE&F OM, List A‐1, S.No.25. (An ISO 9001:2008, ISO 14001:2004 & OHSAS 18001:2007 Certified Organization) B‐115, Annapurna Block, Aditya Enclave Ameerpet, Hyderabad‐500 038. Phone: 040‐23748 555/616, Telefax: 040‐23748666 Email: [email protected]