FSIS Comparative Risk Assessment for Listeria monocytogenes In Ready-to-eat Meat and Poultry Deli Meats Prepared by Risk Assessment Division Office of Public Health Science Food Safety and Inspection Service United States Department of Agriculture May 2010
Transcript
FSIS Comparative Risk Assessment for
Listeria monocytogenes In Ready-to-eat Meat and
Poultry Deli Meats
Prepared by
Risk Assessment Division Office of Public Health Science
Food Safety and Inspection Service United States Department of Agriculture
May 2010
FSIS Comparative Risk Assessment for Listeria monocytogenes in Ready-to-eat Meat and Poultry Deli Meats Report
ii
Contributors
Heather Hicks Quesenberry1
Daniel Gallagher2
Sarah Endrikat2
David LaBarre1
Eric Ebel1
Carl Schroeder1
Janell Kause1
1 Risk Assessment Division, Office of Public Health Science, Food Safety and Inspection Service, U.S.
Department of Agriculture, Washington DC. 2 Department of Civil & Environmental Engineering, Virginia Tech University, Blacksburg, VA.
FSIS Comparative Risk Assessment for Listeria monocytogenes in Ready-to-eat Meat and Poultry Deli Meats Report
iii
Acknowledgements Many people within and outside the Food Safety and Inspection Service, U.S. Department of Agriculture contributed to the development of this risk assessment, including Daniel Engeljohn, Carol Maczka, Regis Pouillot, James Lindsey, Dare Akingbade, Flora Tsui, and researchers of the National Alliance for Food Safety and Security.
FSIS Comparative Risk Assessment for Listeria monocytogenes in Ready-to-eat Meat and Poultry Deli Meats Report
2.1 Stage I: Prevalence and Level of L. monocytogenes in RTE Meat and Poultry deli meats at retail .................................................................................................................. 7 2.2 Stage II: Growth of L. monocytogenes from retail purchase to consumption ........ 14 2.3 Stage III: Deli Meat Consumption .......................................................................... 18
2.3.1 Consumer Storage Time and Temperature ...................................................... 18 2.3.2 Serving Sizes and Categories ........................................................................... 21
2.4 Stage IV: L. monocytogenes Dose-response Relationship ...................................... 22
3.1 Estimated Deaths and Illnesses by Slicing Location and Growth Inhibitor Use .... 23 3.2 Comparison with other food groups ....................................................................... 29 3.3 Sensitivity Analyses ................................................................................................ 31
3.3.1 Consumer Storage Times / Temperatures ........................................................ 31 3.3.2 Shelf Life .......................................................................................................... 34 3.3.3 Total Number of Deaths ................................................................................... 37
3.4 Relative Impacts of Model Variables ..................................................................... 38
Appendix A: L. monocytogenes in Ready-to-eat Meat and Poultry Deli meat .......... 42
A-1 Data Collection Methods ....................................................................................... 42 A-2 Statistical Analyses ................................................................................................ 43 A-3 Study Results ......................................................................................................... 44
A-3.1 Prevalence and Number of Samples ............................................................... 44 A-3.2 Logistic Regression ......................................................................................... 53 A-3.3 Comparison of Findings of the National Alliance for Food Safety and Security with those of the Food Processors’ Association ....................................................... 56
FSIS Comparative Risk Assessment for Listeria monocytogenes in Ready-to-eat Meat and Poultry Deli Meats Report
v
FIGURES Figure 1. a) Prevalence of L. monocytogenes in federally inspected facilities from the all
RTE monitoring programs1 and b) Incidence of listeriosis per 100,000 from CDC FoodNet surveillance2. ................................................................................................ 4
Figure 2. A conceptual model of the stages in this risk assessment and the critical inputs considered within each stage. ..................................................................................... 6
Figure 3. Cumulative density functions for the amount of L. monocytogenes in prepackaged compared to retail-sliced RTE deli meats. ............................................. 8
Figure 4. Probability plots for fitted lognormal (base 10) distribution to observed levels for (a) retail-sliced and (b) prepackaged deli meat .................................................. 11
Figure 5. Fitted cumulative distribution plots and observed retail data for L. monocytogenes levels in retail-sliced versus prepackaged deli meats. Illustration (a) is over the range of observed L. monocytogenes levels. Illustration (b) is over the entire range of L. monocytogenes levels in deli meats used as an input into deli meat exposure pathway of the 2003 FDA-FSIS risk assessment model. .......................... 12
Figure 6. Quantile-quantile plot of fitted distributions for L. monocytogenes levels from retail-sliced and prepackaged deli meat. (A 1:1 reference line is included for visual comparison). .............................................................................................................. 13
Figure 7. Relative frequency of storage time for retail-sliced versus prepackaged product. ................................................................................................................................... 19
Figure 8. Storage times for retail-sliced and prepackaged product. ................................. 20Figure 9. Relative frequencies for consumer storage temperature. .................................. 21Figure 10. Estimated number of listeriosis deaths per annum for retail-sliced and
prepackaged product based on the 4,000 dose-response simulations. ...................... 26Figure 11. Cumulative density plots estimated number of deaths per annum for retail-
sliced and prepackaged product based on the 4,000 dose-response simulations. ..... 27Figure 12. Comparison of estimated deaths per annum and deaths per serving across the
various food groups. (a) deli meat categories combined into one category. (b) deli meat treated as 4 separate categories. ....................................................................... 30
Figure 13. Relative ratio of deaths with differing storage times between retail-sliced and prepackaged product. ................................................................................................ 34
Figure 14. Impact of varying shelf life for a) total estimated deaths, b) fraction of deaths from retail-sliced product, and c) risk ratio. .............................................................. 36
Figure 15. Recursive partitioning and regression tree for comparing importance of slicing location versus growth inhibitor usage. Consumer storage time temperature data from RTI. ........................................................................................................... 38
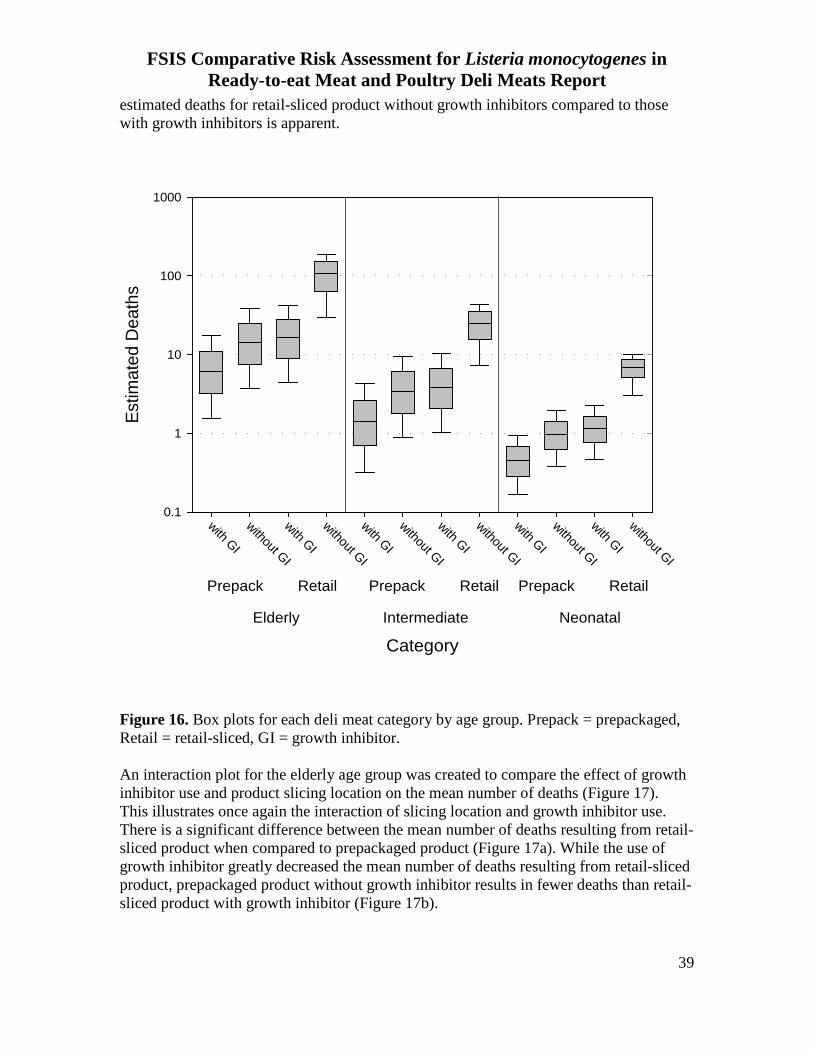
Figure 16. Box plots for each deli meat category by age group. Prepack = prepackaged, Retail = retail-sliced, GI = growth inhibitor. ............................................................ 39
FSIS Comparative Risk Assessment for Listeria monocytogenes in Ready-to-eat Meat and Poultry Deli Meats Report
vi
Figure 17. Interaction plots comparing the effect of growth inhibitor (GI) use and slicing location on the mean number of deaths from listeriosis. .......................................... 40
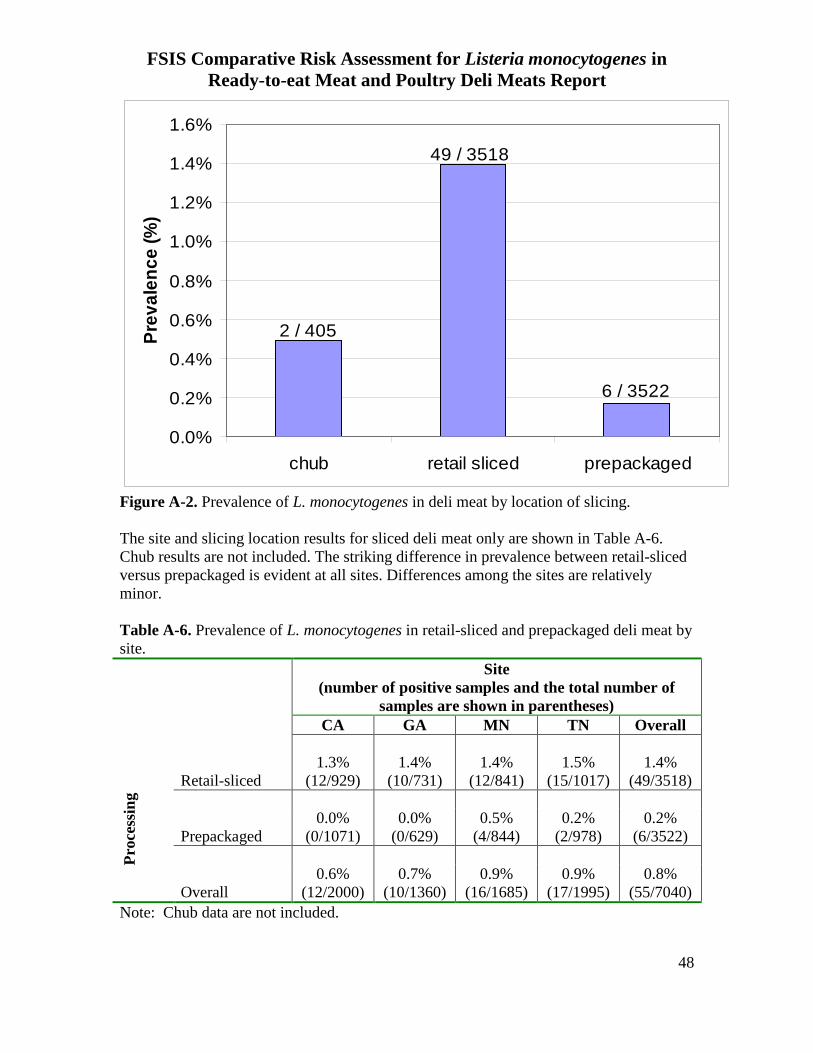
Figure A-1. Number of RTE samples by location of slicing (source). ............................. 47Figure A-2. Prevalence of L. monocytogenes in deli meat by location of slicing. ........... 48Figure A-3. Number of deli meat samples collected per store. MN data are not included
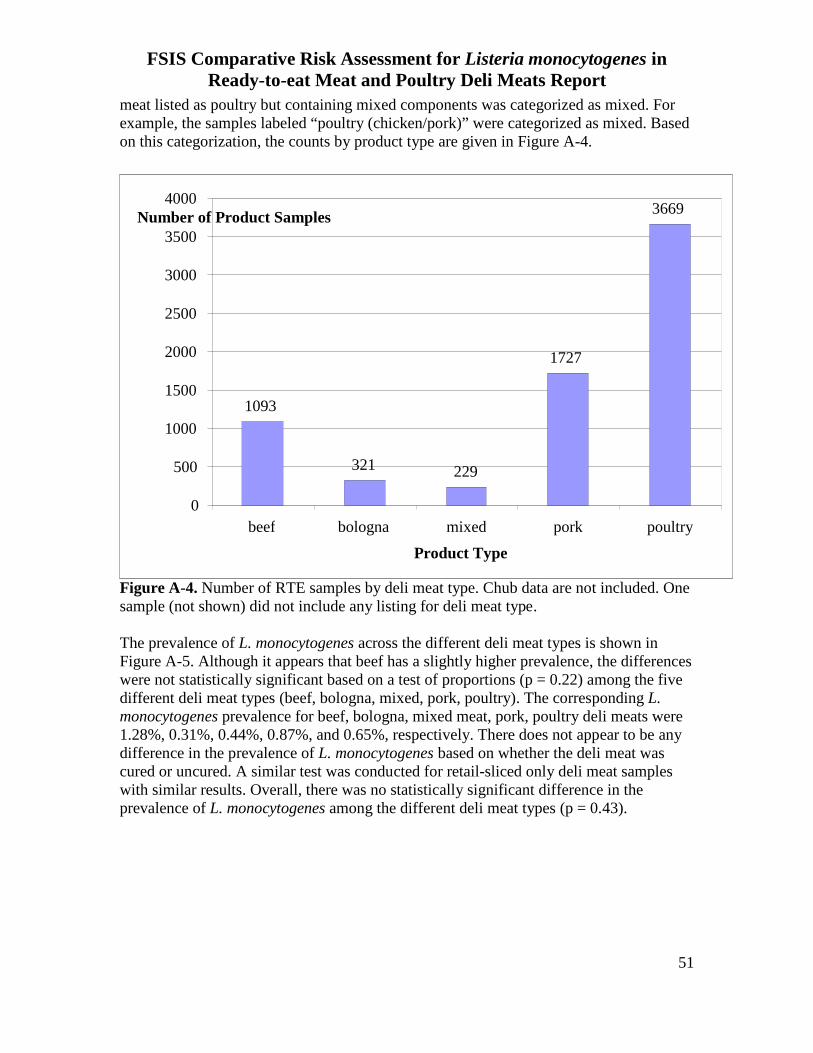
because stores could not be identified. ..................................................................... 50Figure A-4. Number of RTE samples by deli meat type. Chub data are not included. One
sample (not shown) did not include any listing for deli meat type. .......................... 51Figure A-5. Prevalence of L. monocytogenes in RTE deli meats by deli meat type. Chubs
were not included. ..................................................................................................... 52Figure A-6. Prevalence of L. monocytogenes in RTE deli meats samples sliced at retail.
The estimated store visit was based on similar sampling date and time. No sample times were provided for MN; thus, MN data not included. Thirty-seven total deli meat samples are shown. ........................................................................................... 53
Figure A-7. Graphical display of logistic regression results using deli meat sample prevalence at individuals stores as the dependent variable. MN data not included. . 55
FSIS Comparative Risk Assessment for Listeria monocytogenes in Ready-to-eat Meat and Poultry Deli Meats Report
vii
TABLES
Table 1. Survival analysis input for statistical distribution fitting for the level of L. monocytogenes in deli meats at retail. ................................................................................ 9
Table 2. Best fit maximum likelihood results and probability plot distribution parameters for retail-sliced deli meat. ................................................................................................... 9
Table 3. Best fit maximum likelihood results and probability plot distribution parameters for prepackaged deli meat. ................................................................................................ 10
Table 4. Quantiles from fitted lognormal distributions for retail-sliced and prepackaged L. monocytogenes levels........................................................................................................ 14
Table 5. Plant distribution and estimated fraction of production prior to the Interim Final Rule. .................................................................................................................................. 16
Table 6. Fitted Weibull distributions according to the deli meat category ....................... 19
Table 7. Storage times for retail-sliced and prepackaged product. ................................... 20
Table 8. Percent of deli meat production by slicing location and antimicrobial growth inhibitor use during July 2007. ......................................................................................... 22
Table 9. Estimated mean number of deaths per year from L. monocytogenes in deli meat among three populations stratified by age and four deli meat categories using the storage time that differed between prepackaged and retail-sliced product. .................................. 24
Table 10. Estimated mean number of illnesses per year from L. monocytogenes in deli meat among three populations stratified by age and four deli meat categories. ............... 25
Table 11. Summary of estimated listeriosis death (%) by deli meat product category. ... 27
Table 12. Statistical comparison of mean number of estimated listeriosis deaths by deli meat type. .......................................................................................................................... 28
Table 13. Estimated mean number of deaths per serving among the three age groups and four deli meat categories. .................................................................................................. 28
Table 14. Comparison of NFPA versus NAFSS L.monocytogenes Prevalence Data ...... 29
Table 15. Estimated mean number of listeriosis deaths per year from deli meat among three populations stratified by age and four deli meat categories. .................................... 32
Table 16. Summary of estimated percent deaths by product category. ............................ 33
Table 17. Estimated mean number of deaths and illnesses per annum by fraction of consumer storage time between retail-sliced and prepackaged product. .......................... 33
Table 18. EGR for product with and without growth inhibitor by shelf life. ................... 35
FSIS Comparative Risk Assessment for Listeria monocytogenes in Ready-to-eat Meat and Poultry Deli Meats Report
viii
Table 19. Estimated percent listeriosis deaths by deli meat category for 80 day shelf life............................................................................................................................................ 37
Table 20. Estimated percent listeriosis deaths by deli meat category when total deaths across all food groups are reduced by 50%. ..................................................................... 37
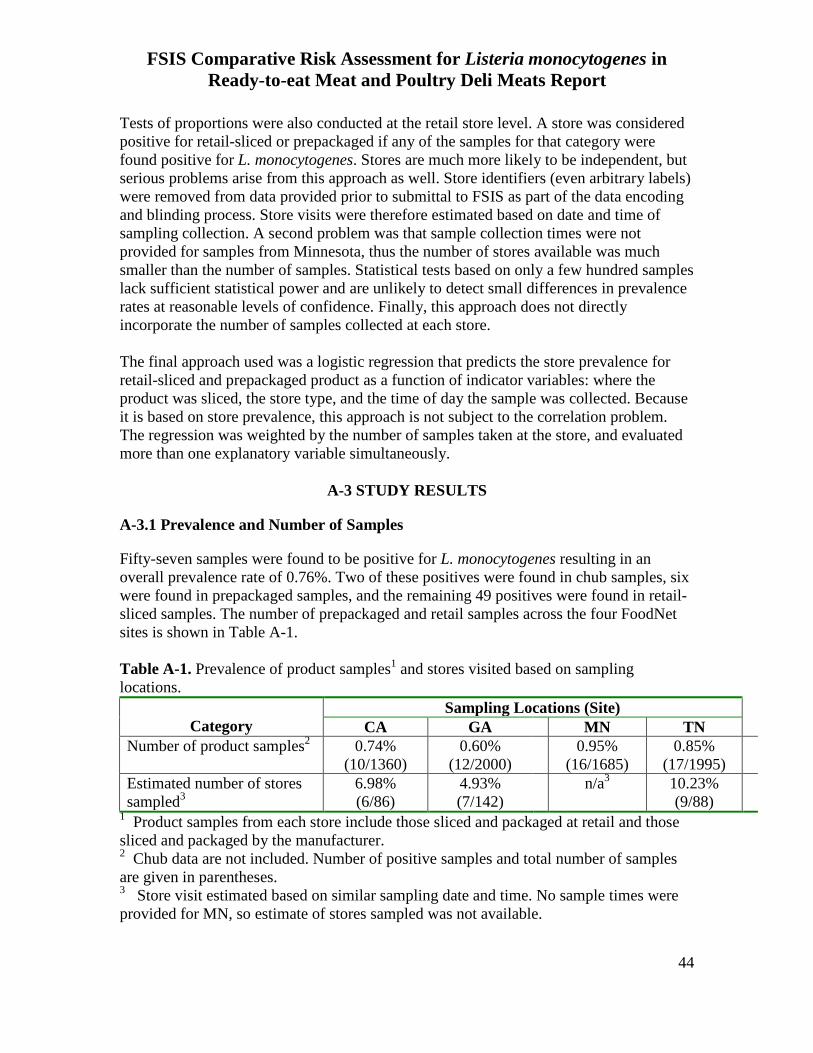
Table A-1. Prevalence of product samples1 and stores visited based on sampling locations. ........................................................................................................................... 44
Table A-2. Prevalence of product samples (retail-sliced, prepackaged) and stores visited based on quarter of year. ................................................................................................... 45
Table A-3. Prevalence of product samples (retail-sliced, prepackaged) and stores visited based on time of day (AM versus PM). ............................................................................ 45
Table A-4. Prevalence of only retail-sliced product and stores visited based on time of day (AM versus PM). ........................................................................................................ 46
Table A-5. Prevalence of product samples (retail-sliced, prepackaged, and chubs) and stores visited based on store type (major grocery chain versus other grocers). ................ 46
Table A-6. Prevalence of L. monocytogenes in retail-sliced and prepackaged deli meat by site. .................................................................................................................................... 48
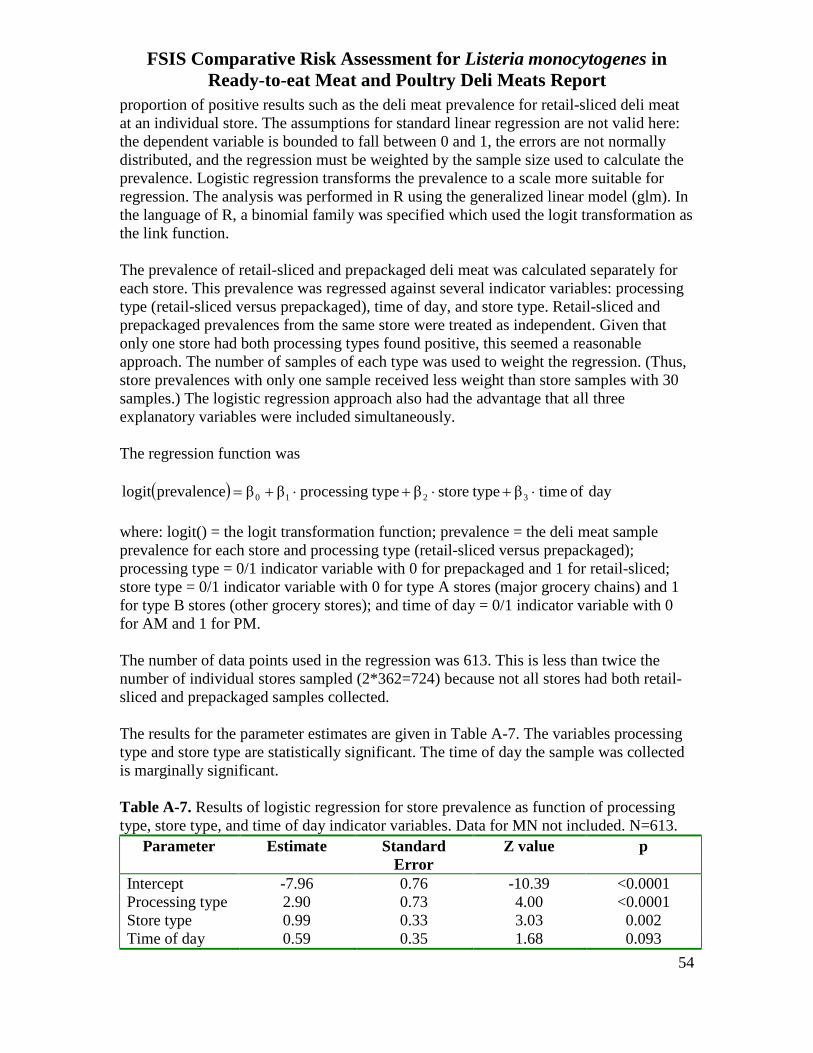
Table A-7. Results of logistic regression for store prevalence as function of processing type, store type, and time of day indicator variables. Data for MN not included. N=613.54
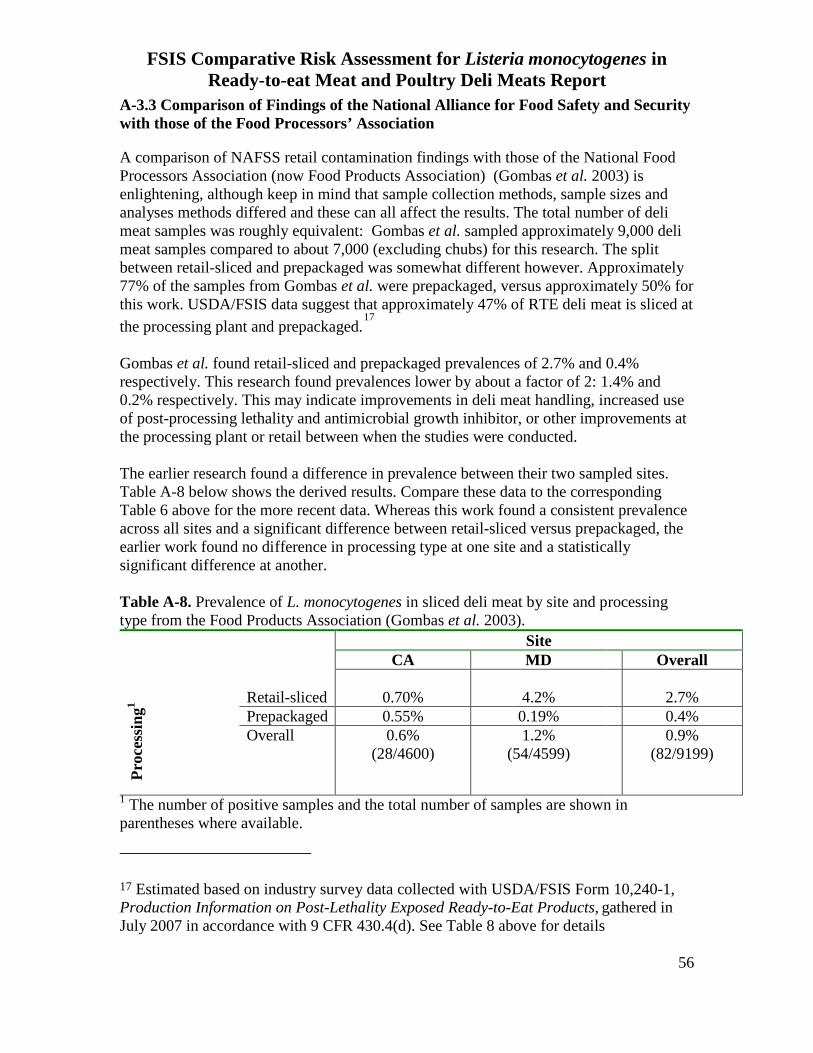
Table A-8. Prevalence of L. monocytogenes in sliced deli meat by site and processing type from the Food Products Association (Gombas et al. 2003). ..................................... 56
Table A-9. Overall results of statistical tests for prevalence of L. monocytogenes on RTE meat and poultry deli meats by location, season, time of day for slicing at retail, and by deli meat type. ................................................................................................................... 57
FSIS Comparative Risk Assessment for Listeria monocytogenes in Ready-to-eat Meat and Poultry Deli Meats Report
1
Executive Summary FSIS Comparative Risk Assessment for Listeria monocytogenes in Ready-to-eat Meat and
Poultry Deli Meats
May 2010
BACKGROUND Listeria monocytogenes (L. monocytogenes) is an important foodborne pathogen, estimated to cause approximately 2,500 illnesses, 2,300 hospitalizations, and 500 deaths each year in the United States. In an effort to understand better the sources of foodborne L. monocytogenes infection, the Food and Drug Administration (FDA) and the Food Safety and Inspection Service (FSIS), working collaboratively, developed a quantitative microbial risk assessment for L. monocytogenes that compared the risk of listeriosis among twenty-three categories of ready-to-eat (RTE) foods. The results of the risk assessment, completed in 2003, indicated that deli meats pose the greatest risk for listeriosis, accounting for approximately 1,600 illnesses per year. Based on these findings, FDA and FSIS conducted a preliminary analysis using the 2003 FDA-FSIS L. monocytogenes risk assessment model to evaluate the relative risk of illness from L. monocytogenes on deli meat sliced and packaged at federally-inspected processing establishments (prepackaged deli meat) compared to deli meat sliced at retail facilities. This risk assessment contained industry data for L. monocytogenes on retail deli meat from delicatessens in California and Maryland (Gombas et al., 2003). The results of this risk assessment indicated a high percentage of listeriosis cases related to deli meats were associated with those sliced at retail. Because these results, however, were based on limited retail L. monocytogenes contamination data for deli meats, FSIS sought to gather additional data specifically to examine the relative risk of illness from prepackaged deli meat compared to deli meat sliced at retail facilities more closely. Therefore, the U.S. Department of Agriculture, Agricultural Research Service funded the National Alliance for Food Safety and Security (NAFSS) – a consortium of twenty-five research universities – to conduct a four-state study in which prepackaged deli meat and deli meat sliced and packaged at retail were analyzed for the prevalence and level of L. monocytogenes (Draughon, 2006).
METHODS Data from the NAFSS study, described in Appendix A of this risk assessment report, were used as inputs to the deli meat exposure pathway developed by modifying the above-mentioned 2003 FDA-FSIS L. monocytogenes risk assessment model for RTE foods. The pathway consists of four distinct stages. The Retail Stage determines the level of L. monocytogenes in prepackaged deli meats and in deli meats sliced at retail. The Growth Stage uses an exponential growth rate function to model growth of L. monocytogenes in deli meat between purchase at retail and consumption. The Consumption Stage uses information about deli meat serving sizes and the number of servings consumed to estimate consumer exposure to L. monocytogenes in deli meat. Lastly, by integrating the predicted exposure with a dose-response relationship, the Dose-
FSIS Comparative Risk Assessment for Listeria monocytogenes in Ready-to-eat Meat and Poultry Deli Meats Report
2
Response Stage predicts the probability of death from consuming L. monocytogenes on deli meat. The modified model considered four categories of deli meats: retail-sliced versus prepackaged and with or without growth inhibitor. Consumer storage times were based on a consumer survey conducted by RTI International, Tennessee State University, and Kansas State University (Cates et al. 2006). The results of the survey indicated prepackaged deli meat was stored for statistically significant longer periods than deli meat sliced at retail. The survey did not find any difference for storage temperature.
RESULTS This risk assessment, using current retail contamination data for deli meat (Draughon, 2006) and current consumer behavior data for deli meats (Cates et al., 2006) indicates that of those listeriosis cases and deaths attributed to deli meats, approximately 83% are associated with deli meats sliced at retail. The estimated mean number of deaths per year from L. monocytogenes in retail-sliced deli meats was 166.9 (95% CI: 164.5 – 169.3). In contrast, the estimated mean number of deaths from prepackaged product was 34.1 (95% CI: 33.4 – 34.9). Similarly, 919.6 (906.8-932.4) illnesses were attributed to retail-sliced product while 188.6 (184.7-192.4) illnesses were attributed to prepackaged product. Of the four categories of RTE deli meat, most of the predicted deaths were attributed to retail-sliced product (which had a higher starting concentration) without growth inhibitor (which allowed for greater growth rates). Almost 70% of all predicted deaths fell into this category. The results illustrate the significant interaction between slicing location and use of growth inhibitor. Sensitivity analyses indicated that the percentage of deaths attributed to retail-sliced deli meats was not appreciably affected by consumer storage time, product shelf life, or total number of deaths.
CONCLUSIONS Of those illnesses and deaths from L. monocytogenes from deli meat consumption, approximately 83% are attributed to deli meat sliced and packaged at retail facilities (Endrikat et al., 2010). The remainder is from prepackaged deli meat. Similar results were obtained by Pradhan et al. (2010) in a study that compared the risk of listeriosis in both retail-sliced and prepackaged ham and turkey. Studies are needed to determine how contamination of deli meat at retail occurs and to design effective interventions for reducing listeriosis associated with the consumption of deli meat sliced at retail.
FSIS Comparative Risk Assessment for Listeria monocytogenes in Ready-to-eat Meat and Poultry Deli Meats Report
3
1.0 Introduction In 2000, the Food and Drug Administration (FDA) and the U.S. Department of Agriculture’s Food Safety and Inspection Service (USDA/FSIS) began a risk assessment to identify which ready-to-eat (RTE) foods pose the greatest risk for listeriosis in the U.S. (FDA-FSIS 2003). Deli meat was found to pose the greatest risk of listeriosis among all RTE food categories. Based on these results and in response to public comments on the FSIS proposed rule Performance Standards for the Production of Processed Meat and Poultry Products (66 FR 12589), FSIS developed a risk assessment for L. monocytogenes in RTE meat and poultry products (FSIS 2003) that focused on federally inspected processing plants. The risk assessment model predicted that the use of post-lethality interventions and antimicrobial growth inhibitors significantly lowered the public health risk of listeriosis compared to either control if used independently or compared to sampling alone. Post-processing lethality treatments that reduced L. monocytogenes in products formulated or processed to inhibit the growth of any remaining L. monocytogenes were predicted to be the most effective in protecting public health. Both the 2003 FDA-FSIS and 2003 FSIS Listeria risk assessments served as the scientific basis for FSIS’ interim final rule for the control of L. monocytogenes during processing (“Control of Listeria monocytogenes in Ready-to-Eat Meat and Poultry Products,” 68 FR 34208; June 6, 2003 (revised January 1, 2006); 9 CFR 430). These controls appear to be successful at federally inspected establishments. As shown in Figure 1a, the prevalence of L. monocytogenes has declined since 1990. However, the incidence of foodborne listeriosis has been relatively constant and has not changed significantly since 2001 (Figure 1b). Thus, strides to reduce L. monocytogenes contamination in RTE meat and poultry product samples collected in federal establishments are not being translated into improvements in public health.
FSIS Comparative Risk Assessment for Listeria monocytogenes in Ready-to-eat Meat and Poultry Deli Meats Report
4
Year
Figure 1. a) Prevalence of L. monocytogenes in federally inspected facilities from the all RTE monitoring programs1 and b) Incidence of listeriosis per 100,000 from CDC FoodNet surveillance2. 1 http://www.fsis.usda.gov/Science/Micro_Testing_RTE/ 2 http://www.cdc.gov/foodnet/factsandfigures/2009/Table1b_all_incidence_96-09.pdf
0.0
0.5
1.0
1.5
2.0
2.5
3.0
3.5
4.0
4.5
5.0Pe
rcen
t Pos
itive
0.0
0.1
0.2
0.3
0.4
0.5
0.6
0.7
0.8
0.9
1990
1991
1992
1993
1994
1995
1996
1997
1998
1999
2000
2001
2002
2003
2004
2005
2006
2007
2008
2009
Inci
denc
e pe
r 10
0,00
0 Po
pula
tion
a) FSIS Regulatory Testing for L. monocytogenes in RTE Products
b) Incidence of Foodborne Illness: Listeria
National Health Objective: 0.24 cases per 100,000
FSIS Comparative Risk Assessment for Listeria monocytogenes in Ready-to-eat Meat and Poultry Deli Meats Report
5
Subsequently, in 2004, FDA and FSIS did a preliminary analysis using L. monocytogenes contamination data for retail deli meat from California and Maryland (Gombas et al. 2003) to estimate the relative risk of listeriosis from deli meat sliced and packaged in FSIS-inspected processing establishments (hereafter termed prepackaged) versus those sliced and packaged at retail facilities. Results suggested that deli meat sliced and packaged at retail posed the greater risk, accounting for approximately 80% of all listeriosis cases from deli meat. In 2006, researchers with the National Alliance for Food Safety and Security (NAFSS) – a consortium of 25 research universities – completed a study of L. monocytogenes contamination in prepackaged RTE meat and poultry deli meats and those sliced and packaged at retail from California, Minnesota, Georgia, and Tennessee (Draughon 2006). FSIS adapted the FDA-FSIS (2003) risk assessment model to examine data from the NAFSS study and reanalyze the comparative risk of listeriosis from prepackaged RTE deli meat versus RTE deli meat sliced and packaged at retail. This report describes the analysis and its findings.
FSIS Comparative Risk Assessment for Listeria monocytogenes in Ready-to-eat Meat and Poultry Deli Meats Report
6
2.0 Methods
This analysis uses the deli meat exposure pathway from the risk assessment model developed and utilized in a previous L. monocytogenes risk assessment (FDA-FSIS, 2003) that estimated risk of death attributable to 23 ready-to-eat (RTE) food categories. This analysis separates the deli meat category into prepackaged deli meats
3
and those sliced at retail establishments. Because of increased use of antimicrobial growth inhibitors in deli meat, each deli meat type is divided into those with or without antimicrobial growth inhibitors. Consistent with the FDA-FSIS (2003) risk assessment model, this analysis considers four conceptual stages (Figure 2).
Retail occurrence
• Product type (prepackaged or retail-sliced deli meat)
Growth
• Exponential growth rate (EGR)
• Growth inhibitor usage
• Storage time• Storage
temperature
Consumption
• Serving size• Number of
servings
Dose-response
• Age of consumer (neonatal, intermediate, elderly)
Outputs
• Annual illnesses and deaths• Annual mortality by Age• Risk of death per serving
Figure 2. A conceptual model of the stages in this risk assessment and the critical inputs considered within each stage.
• The Retail Stage determines the presence and level of L. monocytogenes in the two deli meat types (retail-sliced versus prepackaged).
• The Growth Stage uses an exponential growth rate modified to account for antimicrobial
growth inhibitor usage to predict growth of L. monocytogenes in deli meat between retail and consumption.
• The Consumption Stage predicts the L. monocytogenes exposure dose consumed in
servings of deli meats, which is a consequence of serving size and the number of servings.
3 For our purpose, meat and poultry are considered together when discussing deli products (i.e., deli meat refers to
any product containing beef, pork and/or poultry).
FSIS Comparative Risk Assessment for Listeria monocytogenes in Ready-to-eat Meat and Poultry Deli Meats Report
7
• The Dose-response Stage predicts the probability of death from L. monocytogenes per serving by integrating the predicted exposure distribution with a dose-response relationship.
The output of these four stages in this risk assessment is the annual number of illnesses and deaths (and the corresponding risk of illness or death per serving) from L. monocytogenes in deli meat. While these four stages are updated in the 2003 FDA-FSIS risk assessment model for the deli meat food category, all other food categories remain as they were originally described. This risk assessment describes the analysis used to parameterize each of the four updated stages in more detail below.
2.1 STAGE I: PREVALENCE AND LEVEL OF L. MONOCYTOGENES IN RTE MEAT AND POULTRY DELI MEATS AT RETAIL
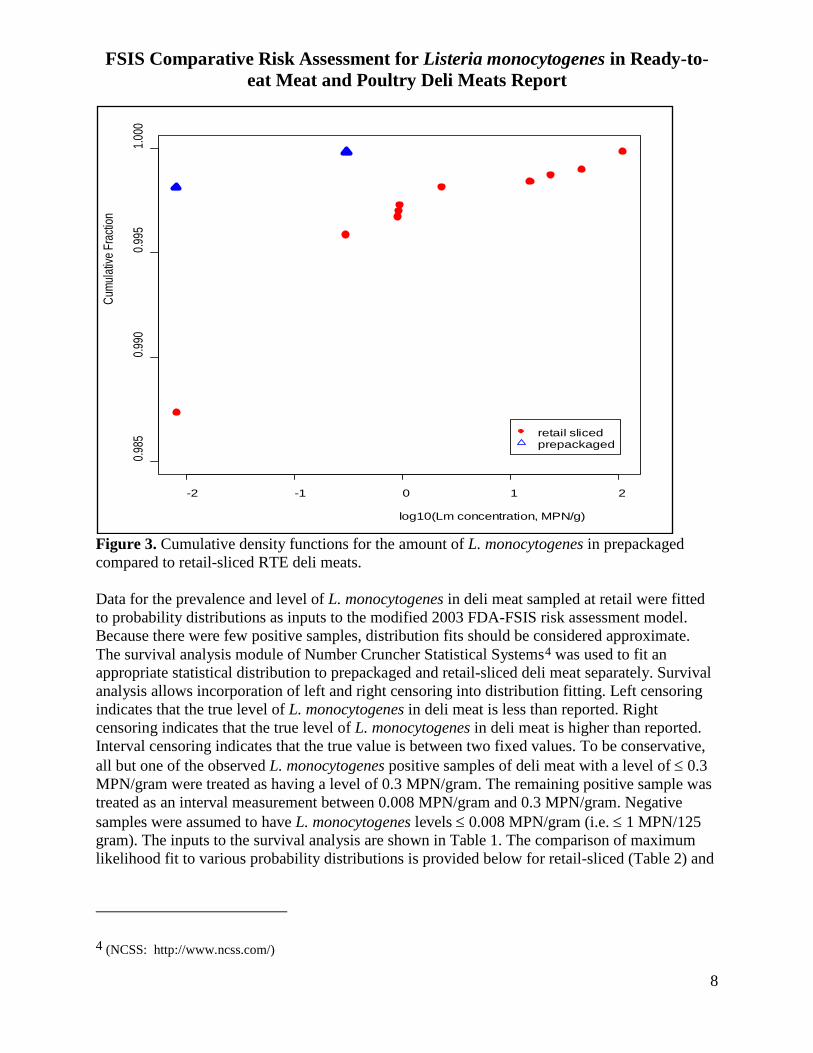
The prevalence and level of L. monocytogenes in RTE meat and poultry deli meats at retail establishments were determined using data from a study conducted by the NAFSS in which 6 of 3,522 (0.17%) samples and 49 of 3,518 (1.39%) samples tested positive for L. monocytogenes from prepackaged and retail-sliced deli meats, respectively. This difference was statistically significant (p <0.05). Analyses of these data are described in depth in Appendix A. Of the six positive samples from prepackaged deli meat, all had L. monocytogenes levels ≤0.3 MPN/gram. Of the 49 positive samples from deli meat sliced and packaged at retail, L. monocytogenes levels ranged from <0.3 to ≥110 MPN/gram. Cumulative density plots, assuming a detection limit of 0.008 MPN/gram (i.e. 1 MPN/125 g), are shown in Figure 3.
FSIS Comparative Risk Assessment for Listeria monocytogenes in Ready-to-eat Meat and Poultry Deli Meats Report
8
Figure 3. Cumulative density functions for the amount of L. monocytogenes in prepackaged compared to retail-sliced RTE deli meats. Data for the prevalence and level of L. monocytogenes in deli meat sampled at retail were fitted to probability distributions as inputs to the modified 2003 FDA-FSIS risk assessment model. Because there were few positive samples, distribution fits should be considered approximate. The survival analysis module of Number Cruncher Statistical Systems4
4 (NCSS: http://www.ncss.com/)
was used to fit an appropriate statistical distribution to prepackaged and retail-sliced deli meat separately. Survival analysis allows incorporation of left and right censoring into distribution fitting. Left censoring indicates that the true level of L. monocytogenes in deli meat is less than reported. Right censoring indicates that the true level of L. monocytogenes in deli meat is higher than reported. Interval censoring indicates that the true value is between two fixed values. To be conservative, all but one of the observed L. monocytogenes positive samples of deli meat with a level of ≤ 0.3 MPN/gram were treated as having a level of 0.3 MPN/gram. The remaining positive sample was treated as an interval measurement between 0.008 MPN/gram and 0.3 MPN/gram. Negative samples were assumed to have L. monocytogenes levels ≤ 0.008 MPN/gram (i.e. ≤ 1 MPN/125 gram). The inputs to the survival analysis are shown in Table 1. The comparison of maximum likelihood fit to various probability distributions is provided below for retail-sliced (Table 2) and
-2 -1 0 1 2
0.985
0.990
0.995
1.000
log10(Lm concentration, MPN/g)
Cumu
lative
Fra
ction
retail slicedprepackaged
FSIS Comparative Risk Assessment for Listeria monocytogenes in Ready-to-eat Meat and Poultry Deli Meats Report
9
prepackaged (Table 3) deli meat. The parameters for each distribution were determined by least-squares regression fit to the corresponding probability plot. Table 1. Survival analysis input for statistical distribution fitting for the level of L. monocytogenes in deli meats at retail.
Retail (deli) sliced Prepackaged No.
Samples1 L. monocytogenes
level (MPN/gram)1
Censor Type2
No. Sample
s
L. monocytogenes level (MPN/gram)
Censor
Type2
3,469 ≤0.008 L 3,516 ≤ 0.008 L 1 Between 0.008 and
0.3 I 1 Between 0.008 and
0.3 I
29 0.3 F 5 0.3 F
3 0.92 F 1 0.93 F 1 0.94 F 3 2.3 F 1 15.3 F 1 24 F 1 46 F 3 ≥ 110 R
1 L. monocytogenes levels were not given for five positive retail-sliced deli meat samples. These data were thus not used in the distribution fitting. 2 Censor type refers to the censoring used by the survival analysis fit. L indicates left censoring (actual value is less than observed); I indicates interval censoring (actual value is between two known values). F indicates actual value is observed level. R indicates right censoring (actual value is greater than observed). Table 2. Best fit maximum likelihood results and probability plot distribution parameters for retail-sliced deli meat.
Distribution Log Likelihood Shape1 Scale1 Weibull -315.606 NA2 NA2 Lognormal -316.634 -25.6314 9.309884 Lognormal10 -316.634 -11.1316 4.043231 Loglogistic -318.041 -19.0915 3.277907 Logistic -375.906 -13.795 3.168052 Extreme Value -396.146 -22.3905 15.19124 Exponential -13046.5 1 0.012057 Normal NA2 NA2 NA2 1 The interpretation of these parameters varies depending on the distribution. For most distributions, the shape is the mean of the distribution and the scale is the standard deviation. 2 The probability plot estimate could not be calculated for these parameters.
FSIS Comparative Risk Assessment for Listeria monocytogenes in Ready-to-eat Meat and Poultry Deli Meats Report
10
Table 3. Best fit maximum likelihood results and probability plot distribution parameters for prepackaged deli meat.
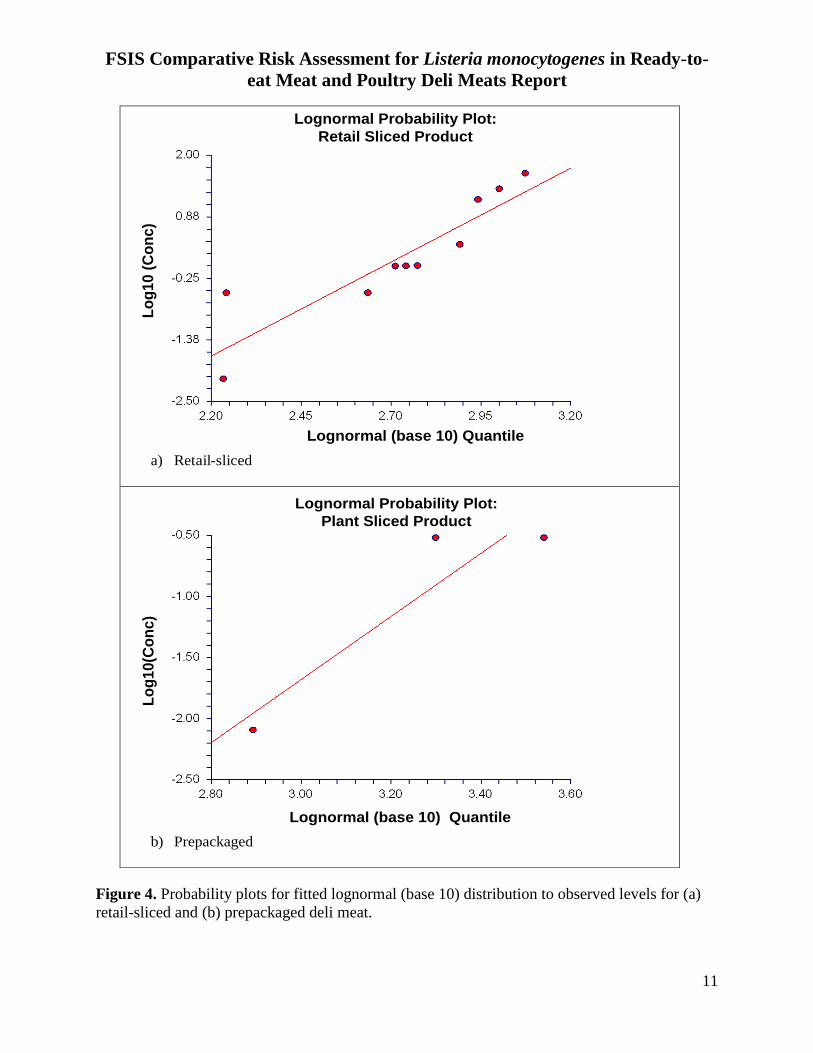
Distribution Log Likelihood Shape1 Scale1 Extreme Value -43.1107 -2.38335 1.303234 Normal -43.2915 -1.80981 0.628146 Logistic -43.5157 -1.14005 0.183313 Weibull -49.6842 NA2 NA2 Lognormal10 -49.865 -27.3912 7.79663 Lognormal -49.865 -11.8958 3.386033 Loglogistic -50.0892 -19.078 2.275309 Exponential -715.407 1.00E+00 1.37E-03 1 The interpretation of these parameters varies depending on the distribution. For most distributions, the shape is the mean of the distribution and the scale is the standard deviation. 2 The probability plot estimate could not be calculated for these parameters. Though the Weibull and extreme value distributions are suggested as best fitting these data (based on the maximum likelihood criterion), the lognormal distribution was selected as the most appropriate.
5 The lognormal fit to the distribution of the level of L. monocytogenes in retail-
sliced deli meat is statistically no different from the Weibull distribution. It is preferred that both retail-sliced and prepackaged distributions are modeled as the same type. Environmental contaminants such as bacterial levels are often fit to a lognormal distribution and this distribution has theoretical justification.
6
5 Note that the lognormal and lognormal (base 10) are equivalent in terms of fit.
The probability plots and the resulting fit for both retail-sliced and prepackaged deli meat are shown on the following page in Figure 4. The fitted cumulative density plots and observed data points are shown in Figure 5a. The fit for the retail-sliced deli meat appears adequate. The distribution fit for the prepackaged deli meat is uncertain because of only two data points. Figure 5b extrapolates the cumulative density curves to lower levels. The deli meat exposure assessment model uses levels as low as 10-8 MPN/gram as inputs.
6 See, for example, van Belle 2002.
FSIS Comparative Risk Assessment for Listeria monocytogenes in Ready-to-eat Meat and Poultry Deli Meats Report
11
Figure 4. Probability plots for fitted lognormal (base 10) distribution to observed levels for (a) retail-sliced and (b) prepackaged deli meat.
Log1
0 (C
onc)
Lognormal (base 10) Quantile
Lognormal Probability Plot: Retail Sliced Product
a) Retail-sliced
Lognormal (base 10) Quantile
Log1
0(Co
nc)
Lognormal Probability Plot: Plant Sliced Product
b) Prepackaged
FSIS Comparative Risk Assessment for Listeria monocytogenes in Ready-to-eat Meat and Poultry Deli Meats Report
12
Figure 5. Fitted cumulative distribution plots and observed retail data for L. monocytogenes levels in retail-sliced versus prepackaged deli meats. Illustration (a) is over the range of observed L. monocytogenes levels. Illustration (b) is over the entire range of L. monocytogenes levels in deli meats used as an input into the deli meat exposure pathway of the 2003 FDA-FSIS risk assessment model.
-3 -2 -1 0 1 2 3
0.98
50.
990
0.99
51.
000
log10(Lm concentration, MPN/
Cum
ulat
ive
Frac
tion
retail slicedprepackaged
(a)
-10 -5 0 5
0.3
0.4
0.5
0.6
0.7
0.8
0.9
1.0
log10(Lm concentration, MPN/
Cum
ulat
ive
Frac
tion
retail slicedprepackaged
(b)
FSIS Comparative Risk Assessment for Listeria monocytogenes in Ready-to-eat Meat and Poultry Deli Meats Report
13
The quantile-quantile plot of the two fitted distributions is shown in Figure 6. Because the same distribution shape (lognormal) was selected for both retail-sliced and prepackaged, the quantile-quantile plot is a straight line. The quantile-quantile line is below the 1:1 reference line, indicating, as expected, that for a given percentile, the prepackaged L. monocytogenes level is lower than the retail-sliced L. monocytogenes level over the range of interest. The quantile-quantile line is not parallel to the reference line. The difference between the two distributions is greater at the extreme upper tails of the distributions.
Figure 6. Quantile-quantile plot of fitted distributions for L. monocytogenes levels from retail-sliced and prepackaged deli meat. (A 1:1 reference line is included for visual comparison). A fixed number of quantiles from the distribution of L. monocytogenes levels in deli meats serve as inputs to the 2003 FDA-FSIS exposure assessment model. Based on the fitted parameters shown in Table 2 and Table 3, the quantiles needed for the exposure assessment model were
FSIS Comparative Risk Assessment for Listeria monocytogenes in Ready-to-eat Meat and Poultry Deli Meats Report
14
determined using the open source statistical software, R (R Development Core Team, 2007). These quantiles are given in Table 4. Table 4. Quantiles from fitted lognormal distributions for retail-sliced and prepackaged L. monocytogenes levels.
1Based on simulation of 1,000,000 random numbers from the appropriate fitted distribution. The risk assessment analysis used in this report assumed independence among samples. This assumption may not be met for these data, however, because the samples collected from the same retail location are likely to be correlated. Cross-contamination or poor hygienic conditions within a retail location may result in the clustering of positive L. monocytogenes findings by store; therefore, analyzing the data by store location may provide a more accurate estimate of the relative risk ratio for retail-sliced versus prepackaged products. However, due to the blinding process used during sample collection, individual store identifiers were removed. Without these store identifiers, store visits can only be estimated based on time and date of sample collection. Also, sample collection times were not provided for samples from Minnesota, so differentiating individual store visits was not possible. As a result of these data limitations, all individual samples were treated as independent for this risk assessment analysis. A comparison of the results based on the assumption of independence of samples versus samples grouped by approximate store visit may be found in the Appendix. 2.2 STAGE II: GROWTH OF L. MONOCYTOGENES FROM RETAIL PURCHASE TO
CONSUMPTION To assess consumer exposures, the growth of L. monocytogenes from retail purchase to consumption was modeled. Given regulatory changes
7
7 FSIS’ interim final rule for the control of L. monocytogenes during processing (“Control of Listeria
Monocytogenes in Ready-to-Eat Meat and Poultry Products,” 68 FR 34208; June 6, 2003 (revised January 1, 2006); 9 CFR 430).
subsequent to the development of the 2003 FDA-FSIS risk assessment, the model’s predicted growth for deli meats needed adjustment. The primary determinant of growth rate is whether or not the product used growth inhibitor. Total amount of growth depends on growth rate and consumer’s storage time and temperature.
FSIS Comparative Risk Assessment for Listeria monocytogenes in Ready-to-eat Meat and Poultry Deli Meats Report
15
FSIS provides three alternatives for establishments producing certain RTE meat and poultry deli meats to control for L. monocytogenes (9 CFR 430, 2003):
• Alternative 1: Employ both a post-lethality treatment and an antimicrobial growth inhibitor for Listeria monocytogenes on RTE deli meats.
• Alternative 2: Employ either (a) a post-lethality treatment or (b) an antimicrobial growth
inhibitor for the pathogen on RTE deli meats.
• Alternative 3: Employ sanitation measures only (uses neither a post-lethality treatment nor an antimicrobial growth inhibitor).
Deli meat that uses an antimicrobial growth inhibitor is expected to have lower growth rates of L. monocytogenes than deli meat that does not use antimicrobial growth inhibitor. Data on production volumes for each category were used to estimate the use of antimicrobial growth inhibitors in RTE deli meat, and current regulations were used to estimate conservative maximum allowable growth rates. To qualify as using an antimicrobial growth inhibitor under the Interim Final Rule 9 CFR 430,
8
the growth of L. monocytogenes may not exceed two logs during the shelf life of the product. This information was used to modify the existing 2003 FDA-FSIS risk assessment model to account for different growth in deli meat with and without antimicrobial growth inhibitors. The comparison of retail-sliced versus prepackaged was calculated by splitting the deli meat category into four separate categories based on two factors: 1) where the deli meat was sliced and 2) whether antimicrobial growth inhibitor was used. Exponential growth rates for L. monocytogenes were calculated for product with and without antimicrobial growth inhibitors using data from the 2003 FDA-FSIS risk assessment and the estimated fraction of deli meat in each category prior to the implementation of the Interim Final Rule. These older data were used for calculating growth rates because it better matched the period of reported growth rates in the 2003 FDA-FSIS risk assessment model. Once the growth rates were determined, this risk assessment used the more current manufacturer production volume data to calculate the fraction of deli meat in each category, i.e. the current best estimate of growth inhibitor use was used for all model runs. The older data was only used to calculate L. monocytogenes growth rates.
Prior to the Interim Final Rule, fewer plants employed alternatives that used antimicrobial growth inhibitors therefore less product was formulated with an antimicrobial growth inhibitor when compared to current conditions. The overall growth rate of L. monocytogenes should be lower after the implementation of the Interim Final Rule because the composition of the product is different – a greater fraction of product contains antimicrobial growth inhibitors.
8 9 CFR 430 provides requirements for the FSIS’ interim final rule, “Control of Listeria Monocytogenes in Ready-to-Eat Meat and Poultry Products,” (68 FR 34208; June 6, 2003 (revised January 1, 2006)).
FSIS Comparative Risk Assessment for Listeria monocytogenes in Ready-to-eat Meat and Poultry Deli Meats Report
16
To calculate the relative growth rates for deli meat with and without antimicrobial growth inhibitor, the fraction of deli meat using antimicrobial growth inhibitor prior to the Interim Final Rule was needed. The number of establishments using each L. monocytogenes control alternative (1, 2 (a or b), or 3) was estimated by FSIS economists. This is shown in Table 5. The fraction of production was estimated by assuming that each plant within a Pathogen Reduction/Hazard Analysis and Critical Control Point (PR/HACCP) size category produced the same volume, and that the total fraction of production was 48%, 48%, and 4% for large, small, and very small plants (FSIS 2003) respectively. Table 5. Plant distribution and estimated fraction of production prior to the Interim Final Rule.
Lm Control Alternative
PR/HACCP Size Category1 Large Small Very Small Total
no.2 Fraction3
no.2 Fraction3
no.2 Fraction3
no.2 Fraction3
(1) Both post processing lethality and antimicrobial growth inhibitor
7
0.018
20
0.007
15
0.000
42
0.026
(2a) Post processing lethality only
15 0.039 79 0.029 49 0.001 143 0.068
(2b) Antimicrobial growth inhibitor only
40 0.104 122 0.044 65 0.001 227 0.149
(3) Neither post processing lethality nor antimicrobial growth inhibitor
123
0.319
1107
0.400
2072
0.038
3302
0.757
Total 185 0.480 1328 0.480 2201 0.040 3714 1.000 1 Based on PR/HACCP classification. 2 no. is the number of plants. 3 Fraction is the fraction of production = number of plants within size and alternative / total number of plants within size * total fraction by size. Based on this analysis, it was estimated that 17.5% (2.6% + 14.9%) of deli meat used antimicrobial growth inhibitors prior to the implementation of the Interim Final Rule. The
FSIS Comparative Risk Assessment for Listeria monocytogenes in Ready-to-eat Meat and Poultry Deli Meats Report
17
percentage of deli meat using antimicrobial growth inhibitors was assumed the same for prepackaged and retail-sliced deli meat. The exposure assessment portion of the 2003 FDA-FSIS risk assessment model was adjusted to account for possible use of antimicrobial growth inhibitor by adjusting the exponential growth rate (EGR) of L. monocytogenes among RTE meat and poultry deli meats. The 2003 FDA-FSIS risk assessment model estimated that the mean EGR at 5oC was 0.282 log10 CFU/gram/day. The model treats this as a stochastic parameter and adjusts for stochastic consumer storage time, temperature, and a correlation between the two. Appendix 8 in the 2003 FDA-FSIS risk assessment report lists the references used to calculate this value as 15 published articles with 23 reported growth rates across a range of deli meat products. Most of these reference data are from the late 1980s to early 1990s, which is why the use of production data from prior to the implementation of the Interim Final Rule was deemed appropriate. Note that this older data was only used to calculate the growth rates. The current levels of growth inhibitor use were used in the risk assessment itself as described below. FSIS L. monocytogenes Compliance Guidelines
9
state that to qualify as utilizing one of two most stringent alternative L. monocytogenes control options (Alternative 1 or 2) in the Interim Final Rule, no more than 2 log10 growth is allowed over the entire shelf life of the product. No temperature is specified during this shelf life, nor is the shelf life itself specified. If this standard is interpreted to be 2 log10 growth over 14 days at 5oC, the exponential growth rate is 2 log10 CFU/gram/14 days = 0.143 log10 CFU/gram/day. Using this calculation, as the product shelf life is reduced; the calculated EGR would increase because the same 2 log10 growth would occur in a shorter time.
For comparison, consumer storage time is available based on an American Meat Institute (AMI 2001) survey. Results of the survey suggest that approximately 40% of ready-to-eat product is stored for less than 3 days, and another 45% of product is stored from 4 to 7 days. A total of 96% of product is stored for less than 14 days. While consumer storage time is not the same as shelf life, the 14-day assumption appears reasonable. A sensitivity analysis of this shelf life assumption is provided in Section 3.3.2 below. If the EGR for product with antimicrobial growth inhibitor (GI) is based on the regulation, then to calculate the EGR for product without GI:
fGI x EGRwith + (1 - fGI) x EGRwithout = EGRFDA 0.175 x 0.143 log10 CFU/gram/d + 0.825 x EGRwithout = 0.282 log10 CFU/gram/day EGRwithout =0.311 log10 CFU/gram/day
where fGI = fraction of product with growth inhibitor (prior to Interim Final Rule) 9 (http://www.fsis.usda.gov/OPPDE/rdad/FRPubs/97-013F/Lm_Rule_Compliance_Guidelines_May_2006.pdf )
FSIS Comparative Risk Assessment for Listeria monocytogenes in Ready-to-eat Meat and Poultry Deli Meats Report
18
EGRFDA = EGR used in 2003 FDA-FSIS risk ranking EGRwith = EGR for product with growth inhibitor EGRwithout = EGR for product without growth inhibitor
The EGR for both product with and without antimicrobial growth inhibitor are within the observed range for the 23 literature values noted previously and within one standard deviation of the mean EGR. The maximum L. monocytogenes level that can occur in product can also be adjusted. As there are no additional data for this parameter, it was left unchanged from the original 2003 FDA-FSIS risk assessment model. To adjust the growth rates in the deli meat exposure pathway of the 2003 FDA-FSIS risk assessment model, an additional multiplier based on adjusting the mean EGR was added. If the product did not have GI, the stochastic EGR for each iteration was multiplied by 0.311/0.282 = 1.104. If the product did have GI, the stochastic EGR for each iteration was multiplied by 0.143/0.282 = 0.507. Note that the EGR for product with GI is calculated based on FSIS regulation, not on actual industry performance, which may be different.
2.3 STAGE III: DELI MEAT CONSUMPTION
2.3.1 Consumer Storage Time and Temperature
The comparative risk analysis used consumer storage time/temperature analysis from a national survey of U.S. adults using a Web-enabled panel survey approach. The survey was conducted by RTI International, Tennessee State University, and Kansas State University. The purpose of the survey was to characterize home storage and refrigeration practices for a variety of refrigerated ready-to-eat (RTE) foods and consumers' knowledge including use of open date statements among pregnant women, seniors, and the remaining population. A description of the survey and an analysis of the data are given by Cates et al. (2006) and Kosa et al. (2007). The study design, survey questionnaire (PDF format), data dictionary, respondent and survey data (Microsoft Excel format) are available online10
. Note that the survey asked consumers how long the package was stored until the product was consumed. The reported storage times represent the time for the last serving, but some product would normally be consumed prior to this. Because the same question was used for both prepackaged and retail sliced product, and because longer storage times represent the greater risk, the reported storage times for the last serving were used to compare retail-sliced versus prepackaged product. The results are reported in Pouillot et al. (2010).
The data were filtered to consider storage time-temperature for deli meats only. For storage time, there was a statistically significant difference between retail-sliced versus prepackaged product. Both storage time distributions could be fit by Weibull distributions as shown in Table 6.
FSIS Comparative Risk Assessment for Listeria monocytogenes in Ready-to-eat Meat and Poultry Deli Meats Report
19
Table 6. Fitted Weibull distributions according to the deli meat category Deli Meat Category n Shape Scale
Retail-sliced 443 1.830 7.777 Prepackaged 387 1.137 18.390 These different distributions are shown graphically in Figure 7. Note the long tail for the prepackaged product storage time indicating that the prepackaged product was held for longer times than the retail-sliced product.
Figure 7. Relative frequency of storage time for retail-sliced versus prepackaged product. These distributions were used to calculate the storage time for the cumulative probabilities used in the 2003 FDA-FSIS risk assessment model. The results, along with the existing FDA-FSIS times, are shown in Table 7 and Figure 8.
FSIS Comparative Risk Assessment for Listeria monocytogenes in Ready-to-eat Meat and Poultry Deli Meats Report
20
Table 7. Storage times for retail-sliced and prepackaged product.
Cumulative Probability
Consumer Storage Time (d) FDA-FSIS Retail-Sliced Prepackaged
Figure 8. Storage times for retail-sliced and prepackaged product. Two points stand out from this analysis. The first is that storage time for retail-sliced product is significantly shorter than for prepackaged product. The median storage time for retail-sliced product is 6.4 days, while for prepackaged product is 13.3 days. The second point is that both storage distributions are longer than the distribution used in the original 2003 FDA-FSIS risk assessment model except for the extreme tail of the retail-sliced distribution.
FSIS Comparative Risk Assessment for Listeria monocytogenes in Ready-to-eat Meat and Poultry Deli Meats Report
21
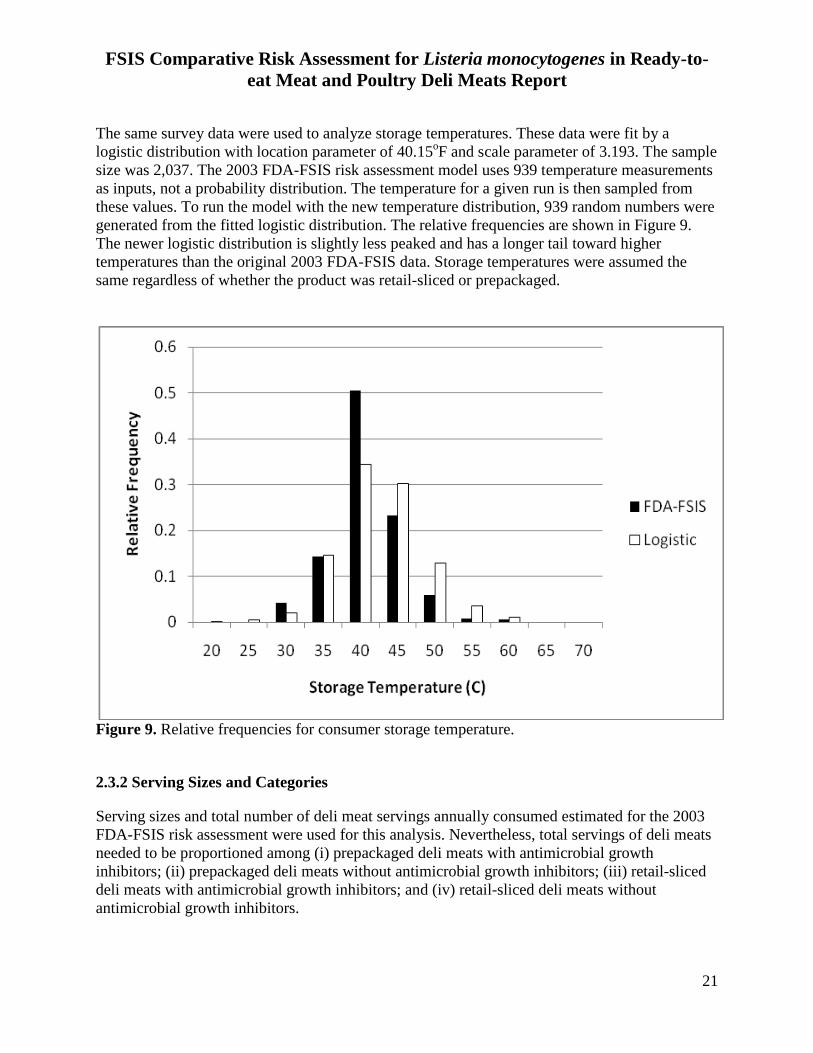
The same survey data were used to analyze storage temperatures. These data were fit by a logistic distribution with location parameter of 40.15oF and scale parameter of 3.193. The sample size was 2,037. The 2003 FDA-FSIS risk assessment model uses 939 temperature measurements as inputs, not a probability distribution. The temperature for a given run is then sampled from these values. To run the model with the new temperature distribution, 939 random numbers were generated from the fitted logistic distribution. The relative frequencies are shown in Figure 9. The newer logistic distribution is slightly less peaked and has a longer tail toward higher temperatures than the original 2003 FDA-FSIS data. Storage temperatures were assumed the same regardless of whether the product was retail-sliced or prepackaged.
Figure 9. Relative frequencies for consumer storage temperature.
2.3.2 Serving Sizes and Categories
Serving sizes and total number of deli meat servings annually consumed estimated for the 2003 FDA-FSIS risk assessment were used for this analysis. Nevertheless, total servings of deli meats needed to be proportioned among (i) prepackaged deli meats with antimicrobial growth inhibitors; (ii) prepackaged deli meats without antimicrobial growth inhibitors; (iii) retail-sliced deli meats with antimicrobial growth inhibitors; and (iv) retail-sliced deli meats without antimicrobial growth inhibitors.
FSIS Comparative Risk Assessment for Listeria monocytogenes in Ready-to-eat Meat and Poultry Deli Meats Report
22
Therefore, the fraction of servings for each of the four deli meat categories was estimated from industry survey data from USDA/FSIS Form 10,240-1, Production Information on Post-Lethality Exposed Ready-to-Eat Products, gathered in July 2007 in accordance with 9 CFR 430.4(d). For example, 32.2% of servings were calculated to be prepackaged product with antimicrobial growth inhibitor. Overall, approximately 47% of deli meat is sold prepackaged, and 53% is retail-sliced (Table 8). Table 8. Percent of deli meat production by slicing location and antimicrobial growth inhibitor use during July 2007.
Alternative Prepackaged (sliced at plant)
Retail-Sliced Total
With antimicrobial growth inhibitor
32.2% 26.7% 58.9%
Without antimicrobial growth inhibitor
14.4% 26.7% 41.1%
Total 46.6% 53.4% 100% The current version of the exposure analysis model does not incorporate a lag time prior to growth. There is evidence that product with growth inhibitor has a longer lag time than product without inhibitor (Legan et al., 2004; Pradhan et al., 2009), and this should be considered in future modeling. However, the growth inhibitor usage affects both retail-sliced and prepackaged products. This difference might increase the estimated relative risk because a slightly higher fraction of prepackaged product uses growth inhibitor (Table 8).
2.4 STAGE IV: L. MONOCYTOGENES DOSE-RESPONSE RELATIONSHIP In the 2003 FDA-FSIS risk assessment, there are three age-specific dose-response relationships that have been developed – one for those 60 years of age or older (referred to as “elderly” in the 2003 FDA-FSIS risk assessment), those who are more than 30 days old to 60 years of age (“intermediate” age population), and fetuses and neonates from 16 weeks after fertilization to 30 days old (“neonatal” population). The methods used in the 2003 FDA-FSIS risk assessment are the same as those used here. The dose-response model was run in calibrated mode. In calibrated mode, a scaling factor was used for each of the 4,000 simulations to adjust the dose-response curve from the mouse dose-response model to meet a specified number of deaths in humans. For this analysis, the comparative risk assessment was calibrated to the number of deaths attributed to deli meats, based on data from the Centers for Disease Control and Prevention, used in the 2003 FDA-FSIS risk assessment. Given the increased implementation of Listeria monocytogenes control procedures at the processing plant and antimicrobial growth inhibitor use in the product; these values are likely to overstate estimated deaths under current conditions. Thus, the estimated deaths are meant for comparative purposes only. A sensitivity analysis that modifies the total number of deaths is described in Section 3.3.3.
FSIS Comparative Risk Assessment for Listeria monocytogenes in Ready-to-eat Meat and Poultry Deli Meats Report
23
3.0 Results
3.1 ESTIMATED DEATHS AND ILLNESSES BY SLICING LOCATION AND GROWTH INHIBITOR USE
The original deli meat category in the 2003 FDA-FSIS Listeria risk assessment was split into four separate categories such that exposure distributions were estimated (using that model) for (i) prepackaged deli meats with antimicrobial growth inhibitors; (ii) prepackaged deli meats without antimicrobial growth inhibitors; (iii) retail-sliced deli meats with antimicrobial growth inhibitors; and (iv) retail-sliced deli meats without antimicrobial growth inhibitors. These exposure distributions were generated from the two contamination distributions at retail (i.e., one for prepackaged deli meat and another for retail-sliced deli meat). The growth predictions applied to each of these distributions predicted the effects of variable storage times but similar temperatures on the number of L. monocytogenes per gram of deli meat depending on whether it included antimicrobial growth inhibitors or not. The exposure distribution finally determined the variability in dose per serving by incorporating the distribution of serving size of deli meat in grams. In the 2003 FDA-FSIS risk assessment model, these exposure distributions were integrated with the FDA-FSIS L. monocytogenes dose-response models (one for each of the three age-specific subpopulations) to predict the annual number of deaths attributed to each of the four categories. The estimated mean numbers of deaths per year are given in Table 9 below. Clearly, the use of antimicrobial growth inhibitors reduces the number of estimated deaths. This is most notable for the retail-sliced product, which starts with a higher concentration of L.monocytogenes level at retail. Also notable is the impact that the lower L. monocytogenes starting distribution has on lowering the number of deaths from prepackaged products. The estimated mean number of deaths per year associated with prepackaged product was 34.1, and the estimated mean number of deaths per year associated with retail-sliced product was 166.9, with an estimated total annual number of deaths equal to 201.0 (Table 9). Seventeen percent of the estimated per annum deaths (34.1/201.0 = 16.96%) are attributable to prepackaged product, while the remaining 83% are attributable to retail-sliced product (166.9/201.0 = 83.03%). The relative risk on a per annum basis for deli meats sliced at retail versus those sliced in plants is thus 166.9/34.1 = 4.89. These results are almost identical to the findings of the preliminary analysis from the 2003 FDA-FSIS L. monocytogenes risk assessment model, which used NFPA retail data (Gombas et al., 2003). A similar analysis was conducted for illnesses. The 2003 FDA-FSIS risk assessment model assumes a constant illness to mortality ratio by age group of 3.7, 11.3, and 12.7 for elderly, intermediate, and neonatal age groups respectively. Corresponding results for estimated illnesses are in Table 10. Because the illnesses are calculated directly from estimated deaths, the attributions between prepackaged and retail-sliced product did not change appreciably.
FSIS Comparative Risk Assessment for Listeria monocytogenes in Ready-to-eat Meat and Poultry Deli Meats Report
24
Table 9. Estimated mean number of deaths per year from L. monocytogenes in deli meat among three populations stratified by age and four deli meat categories using the storage time that differed between prepackaged and retail-sliced product.
Deli Meat Category Elderly (95% CI)
Intermediate Age (95% CI)
Neonatal (95% CI)
All Age Groups (95% CI)
Prepackaged with growth inhibitor
8.1 (7.9, 8.3)
1.9 (1.9, 2.0)
0.5 (0.5, 0.5)
10.5 (10.3, 10.8)
Prepackaged without growth inhibitor
18.1 (17.7, 18.6)
4.4 (4.3, 4.5)
1.1 (1.1, 1.1)
23.6 (23.0, 24.2)
Retail-sliced with growth inhibitor
20.4 (19.9, 20.9)
4.9 (4.7, 5.0)
1.3 (1.2, 1.3)
26.5 (25.9, 27.2)
Retail-sliced without growth inhibitor
108.2 (106.4, 109.9)
25.4 (25.0, 25.8)
6.7 (6.7, 6.8)
140.3 (138.1, 142.6)
Subtotal: Prepackaged 26.2 (25.7, 26.8)
6.3 (6.2, 6.4)
1.6 (1.6, 1.6)
34.1 (33.4, 34.9)
Subtotal: Retail-sliced 128.6 (126.7, 130.5)
30.3 (29.9, 30.7)
8.0 (7.9, 8.1)
166.9 (164.5, 169.3)
Subtotal: With growth inhibitor 28.5 (27.9, 29.1)
6.8 (6.6, 6.9)
1.8 (1.7, 1.8)
37.1 (36.3, 37.8)
Subtotal: Without growth inhibitor
126.3 (124.4, 128.1)
29.8 (29.4, 30.3)
7.8 (7.7, 7.9)
163.9 (161.6, 166.3)
Total 154.8 (152.7, 156.9)
36.6 (36.2, 37.1)
9.6 (9.5, 9.7)
201.0 (198.4, 203.6)
FSIS Comparative Risk Assessment for Listeria monocytogenes in Ready-to-eat Meat and Poultry Deli Meats Report
25
Table 10. Estimated mean number of illnesses per year from L. monocytogenes in deli meat among three populations stratified by age and four deli meat categories.
Deli Meat Category
Elderly (95% CI)
Intermediate Age (95% CI)
Neonatal (95% CI)
All Age Groups (95% CI)
Prepackaged with growth inhibitor
30.0 (29.2, 30.8)
21.7 (21.1, 22.3)
6.5 (6.4, 6.6)
58.2 (56.7, 59.7)
Prepackaged without growth inhibitor
67.1 (65.4, 68.7)
49.6 (48.4, 50.9)
13.7 (13.4, 13.9)
130.4 (127.3, 133.5)
Retail-sliced with growth inhibitor
75.5 (73.7, 77.3)
54.9 (53.6, 56.3)
16.0 (15.7, 16.2)
146.4 (143.0, 149.8)
Retail-sliced without growth inhibitor
400.2 (393.6, 406.8)
287.5 (282.8, 292.1)
85.6 (84.5, 86.6)
773.2 (761.1, 785.4)
Subtotal: Prepackaged
97.1 (95.1, 99.1)
71.3 (69.8, 72.9)
20.2 (19.8, 20.5)
188.6 (184.7, 192.4)
Subtotal: Retail-sliced
475.7 (468.7, 482.7)
342.4 (337.6, 347.2)
101.5 (100.4, 102.6)
919.6 (906.8, 932.4)
Subtotal: With growth inhibitor
105.5 (103.4, 107.7)
76.6 (75.0, 78.2)
22.5 (22.1, 22.8)
204.6 (200.5, 208.6)
Subtotal: Without growth inhibitor
467.3 (460.3, 474.2)
337.1 (332.3, 341.9)
99.2 (98.1, 100.3)
903.6 (890.9, 916.4)
Total
572.8 (565.1, 580.5)
413.7 (408.5, 418.9)
121.7 (120.5, 122.9)
1108.2 (1094.4, 1122.1)
FSIS Comparative Risk Assessment for Listeria monocytogenes in Ready-to-eat Meat and Poultry Deli Meats Report
26
The estimated number of deaths was summed across each age group for each simulation. A histogram and cumulative density plot of the estimated number of deaths between retail-sliced and prepackaged product are shown Figure 10 and 11, respectively. Both figures clearly indicate the public health impact of retail-slicing of deli meats.
Figure 10. Estimated number of listeriosis deaths per annum for retail-sliced and prepackaged product based on the 4,000 dose-response simulations.
FSIS Comparative Risk Assessment for Listeria monocytogenes in Ready-to-eat Meat and Poultry Deli Meats Report
27
Figure 11. Cumulative density plots estimated number of deaths per annum for retail-sliced and prepackaged product based on the 4,000 dose-response simulations. Table 11 summarizes the interaction between slicing location and growth inhibitor use. Note that among the 4 categories, 69.8% of deaths are attributed to retail-sliced product that does not contain growth inhibitor. Table 11. Summary of estimated listeriosis death (%) by deli meat product category.
Category
% of predicted listeriosis deaths per year
Prepackaged Retail-sliced TOTAL
Used growth inhibitor 5.2% 13.2% 18.4% Did not use growth inhibitor
11.7% 69.8% 81.5%
TOTAL 16.9% 83.0% 100.0%
FSIS Comparative Risk Assessment for Listeria monocytogenes in Ready-to-eat Meat and Poultry Deli Meats Report
28
To evaluate better if the estimated mean number of deaths among the different scenarios were statistically different, a bootstrap analysis comparing the means of the scenarios was undertaken. One hundred thousand samples (with replacement) were sampled from the 4,000 simulations of each specified scenario. The mean of each of these 100,000 samples was then calculated. This process was repeated 100,000 times to generate a distribution of means. The mean and 95% confidence interval from this distribution was then obtained. Sensitivity analysis indicated that even the 2.5th and 97.5th % quantiles had stabilized with 100,000 runs. Recall that these simulations were based on the starting L. monocytogenes distributions at retail for either the retail-sliced or prepackaged. Uncertainty about these distributions was not included. Thus, the resulting confidence intervals are narrower and will find statistical differences compared to when the initial distributions included uncertainty as well (Table 12). Table 12. Statistical comparison of mean number of estimated listeriosis deaths by deli meat type.
Scenario Mean LCL1 (2.5%) UCL2 (97.5%)
Prepackaged 34.1 33.4 34.8 Retail-sliced 166.8 164.4 169.1 Difference in means (retail-sliced – prepackaged)
132.6 130.2 135.2
1 LCL=lower confidence level about the mean. 2 UCL=upper confidence level about the mean. The 95% confidence interval for the difference in means does not include 0. Thus, the difference in means is statistically significant from 0 at 95% confidence. Using the fractions of each product in Table 8 and an annual number of deli meat servings of 2.84x10⁹, 1.78x10¹⁰, and 5.95x10⁶ for elderly, intermediate, and neonatal, the estimated deaths per serving are shown in Table 13. The number of servings is taken from FDA-FSIS (2003). The neonatal values are based on the intermediate number of servings corrected for a pregnancy rate of 0.0174 and an exposure period of between 1 and 30 days with the most likely value of 7 days based on triangular distribution. Table 13. Estimated mean number of deaths per serving among the three age groups and four deli meat categories.
FSIS Comparative Risk Assessment for Listeria monocytogenes in Ready-to-eat Meat and Poultry Deli Meats Report
29
3.2 COMPARISON WITH OTHER FOOD GROUPS The prevalence of L. monocytogenes at both federally inspected processing plants and at retail have decreased. The evidence for this at the plant is from FSIS’s monitoring program results (see Figure 1; prevalence is number of positive results obtained compared to total number of samples collected expressed as a percentage) and a comparison of the NFPA versus NAFSS datasets shown below in Table 14. (The NFPA data is shown for comparison, and was not used as part of the risk assessment.) Table 14. Comparison of NFPA versus NAFSS L. monocytogenes Prevalence Data
Product
Prevalence NFPA1 NAFSS2
Retail-sliced 2.7% 1.4% Prepackaged 0.4% 0.2% n 9199 7040 Sampling dates 2000-2001 2005-2006 Sample size 25 g 125 g
1 National Food Processors Association (Gombas et al., 2003) 2 National Alliance for Food Safety and Security (Draughon, 2006) The data were collected approximately five years apart and indicate that the more recent prevalences at retail are approximately half of the earlier values. The changes are actually greater because the more recent NAFSS study used a larger sample size, and so would have been more likely to find low levels of L. monocytogenes as positives and thus increase the prevalence. This reduction in the contamination rate for L. monocytogenes was incorporated through the measured NAFSS retail data. In other words, the comparative risk assessment was conducted with the most recent retail data available. A full risk ranking analysis of multiple food categories as done for the 2003 FDA-FSIS risk assessment was beyond the scope of this project. However, a section that analyzes the results across the 23 or 26 food categories (depending on whether deli meats were considered as a single category or stratified into four categories) is given below. Because only data for deli meats in the 2003 FDA-FSIS risk assessment was updated, this may impact the results. For example, improvements by other industries, e.g. changes in milk pasteurization processes, were not evaluated. So the analysis in effect compares the Listeria monocytogenes contamination in deli meat associated with industry practices in place around 2006 with the other RTE foods reflecting industry practices prior to 2003. The results show that, when treating deli meat as four categories, the greatest number of deaths per annum and the greatest risk per serving is attributed to retail-sliced deli meat without growth inhibitors. Treating deli meat as one combined category indicates that deli meats are associated with the greatest number of deaths per annum, and rank third for the highest risk per serving behind raw frankfurters and pâté (Figure 12).
FSIS Comparative Risk Assessment for Listeria monocytogenes in Ready-to-eat Meat and Poultry Deli Meats Report
30
Median estimated deaths per annum
0 50 100 150 200
Med
ian
estim
ated
dea
ths
per s
ervi
ng
0.0
5.0e-9
1.0e-8
1.5e-8
2.0e-8
2.5e-8
Med
ian
estim
ated
dea
ths
per s
ervi
ng
0.0
5.0e-9
1.0e-8
1.5e-8
2.0e-8
2.5e-8
3.0e-8
retail-sliced deli meat without growth inhibitors
milk
raw frankfurters
raw frankfurter
milk
deli meats
pate
A. Combined deli meat categories
B. Individual deli meat categories
pate
Figure 12. Comparison of estimated deaths per annum and deaths per serving across the various food groups. (a) deli meat categories combined into one category. (b) deli meat treated as 4 separate categories. Note that all data are from the 2003 FDA-FSIS risk assessment except those of deli meats.
FSIS Comparative Risk Assessment for Listeria monocytogenes in Ready-to-eat Meat and Poultry Deli Meats Report
31
3.3 SENSITIVITY ANALYSES
3.3.1 Consumer Storage Times / Temperatures
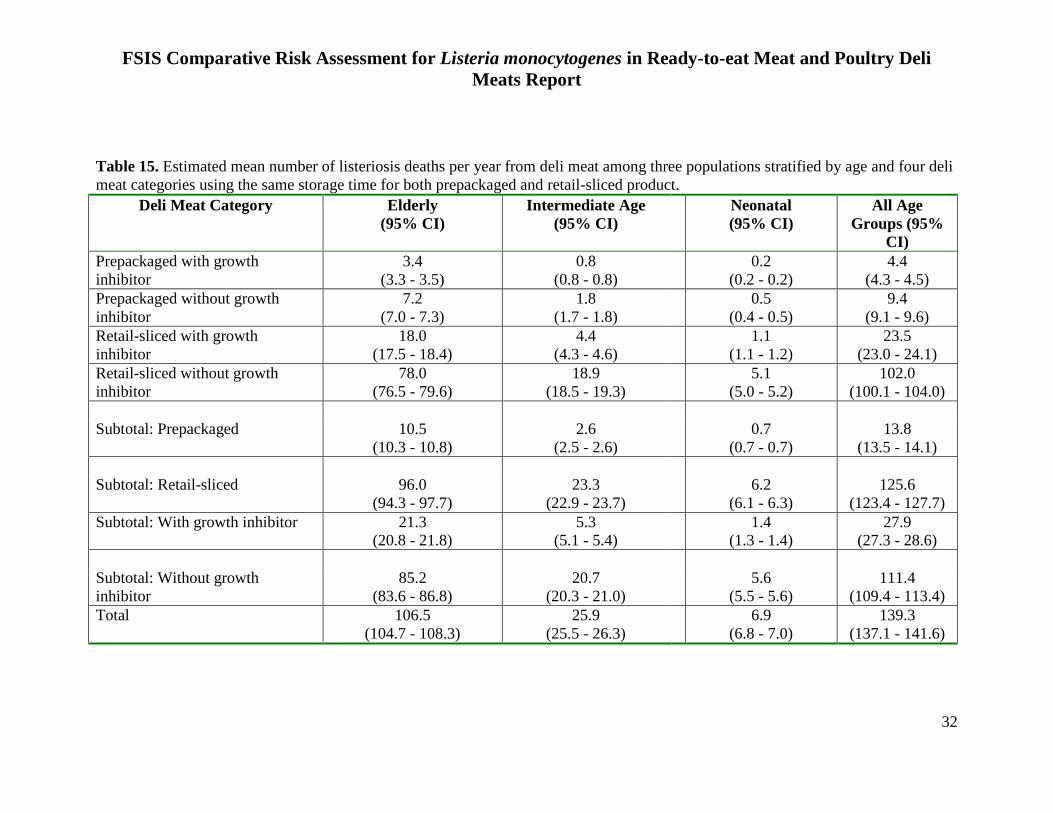
A sensitivity analysis was conducted to better evaluate the impact that different consumer storage time distributions between retail-sliced and prepackaged had on the comparative risk. The storage time and temperatures from the original 2003 FDA-FSIS risk assessment model were used and the storage time for the retail-sliced product was modified to be some fraction of the prepackaged product (which remained unchanged throughout). Thus for the first run of the sensitivity analysis, the consumer storage times were assumed to be the same for retail-sliced and for prepackaged product. Consumer storage times used in the 2003 FDA-FSIS exposure assessment model were taken from a consumer survey conducted by the American Meat Institute (AMI) (2001). Results of the survey suggest that approximately 40% of ready-to-eat product is stored for less than 3 days, and another 45% of product is stored from 4 to 7 days. A total of 96% of product is stored for less than 14 days. Results of this sensitivity analysis are shown in Table 15. The estimated mean number of deaths per year associated with prepackaged product was 13.8 (4.4+9.4), and the estimated mean number of deaths per annum associated with retail-sliced product was 125.5 (23.5+102.0), with an estimated total annual number of deaths equal to 139.3.11
All of these values are lower than the corresponding numbers for the original analysis because the consumer storage times were shorter (see Figure 8). There were 139.3 deaths estimated for the original analysis. Ten percent of the estimated per annum deaths (13.8/139.3 = 9.89%) are attributable to prepackaged product, while the remaining 90% are attributable to retail-sliced product (125.6/139.3 = 90.11%). The relative risk on a per annum basis for deli meats sliced at retail versus sliced at plant is thus 125.6/13.8 = 9.1. A mean of 698.0 illnesses were attributed to retail-sliced product and a mean of 76.8 illnesses were attributed to prepackaged product, for a relative risk ratio of 9.1. In other words, if retail-sliced product is held by the consumer for similar lengths of time to prepackaged product, the risk ratio increases (The risk ratio when storage times differ for both prepackaged and retail-sliced product is 4.89, as shown in Section 3.1).
11 The risk assessment calibration mode used was set to 390 deaths across all food groups. This number
may be lower today given the increased use of post-processing lethality and antimicrobial growth inhibitors compared to when the original 2003 FDA-FSIS risk assessment model was developed.
FSIS Comparative Risk Assessment for Listeria monocytogenes in Ready-to-eat Meat and Poultry Deli Meats Report
32
Table 15. Estimated mean number of listeriosis deaths per year from deli meat among three populations stratified by age and four deli meat categories using the same storage time for both prepackaged and retail-sliced product.
Deli Meat Category Elderly (95% CI)
Intermediate Age (95% CI)
Neonatal (95% CI)
All Age Groups (95%
CI) Prepackaged with growth inhibitor
3.4 (3.3 - 3.5)
0.8 (0.8 - 0.8)
0.2 (0.2 - 0.2)
4.4 (4.3 - 4.5)
Prepackaged without growth inhibitor
7.2 (7.0 - 7.3)
1.8 (1.7 - 1.8)
0.5 (0.4 - 0.5)
9.4 (9.1 - 9.6)
Retail-sliced with growth inhibitor
18.0 (17.5 - 18.4)
4.4 (4.3 - 4.6)
1.1 (1.1 - 1.2)
23.5 (23.0 - 24.1)
Retail-sliced without growth inhibitor
78.0 (76.5 - 79.6)
18.9 (18.5 - 19.3)
5.1 (5.0 - 5.2)
102.0 (100.1 - 104.0)
Subtotal: Prepackaged 10.5
(10.3 - 10.8) 2.6
(2.5 - 2.6)
0.7 (0.7 - 0.7)
13.8 (13.5 - 14.1)
Subtotal: Retail-sliced 96.0
(94.3 - 97.7) 23.3
(22.9 - 23.7)
6.2 (6.1 - 6.3)
125.6 (123.4 - 127.7)
Subtotal: With growth inhibitor 21.3 (20.8 - 21.8)
5.3 (5.1 - 5.4)
1.4 (1.3 - 1.4)
27.9 (27.3 - 28.6)
Subtotal: Without growth inhibitor
85.2 (83.6 - 86.8)
20.7 (20.3 - 21.0)
5.6 (5.5 - 5.6)
111.4 (109.4 - 113.4)
Total 106.5 (104.7 - 108.3)
25.9 (25.5 - 26.3)
6.9 (6.8 - 7.0)
139.3 (137.1 - 141.6)
FSIS Comparative Risk Assessment for Listeria monocytogenes in Ready-to-eat Meat and Poultry Deli Meats Report
33
The summary interaction analysis between slicing location and growth inhibitor use is shown in Table 16. The public health impact has worsened slightly compared to when both prepackaged and retail-sliced product had different storage time as shown in Table 11. Since the retail-sliced product is more likely to be contaminated, and have higher L. monocytogenes concentrations when it is contaminated, the longer retail sliced product is held by the consumer the greater the potential for bacterial growth. Table 16. Summary of estimated, percent of listeriosis deaths by deli meat category.
Category Percent of predicted deaths per year
Prepackaged retail-sliced TOTAL Used growth inhibitor 3.2% 16.9% 20.1% Did not use growth inhibitor
6.7% 73.2% 79.9%
TOTAL 9.9% 90.1% 100.0% This sensitivity analysis used the same storage time distribution for both retail-sliced and prepackaged product. Consumers most likely store retail-sliced deli meats for shorter periods than prepackaged deli meats. Thus, to assess the effect of a reduced consumer storage time, the storage time distribution in the retail exposure model was adjusted by arbitrary factors of 0.25, 0.50, and 0.75. The results in terms of the number of deaths and illnesses are shown in Table 17. The ratio of deaths caused by retail-sliced versus prepackaged product is shown in Figure 13. The comparative risk ratio decreased as the consumer storage times for the retail-sliced meats decreased; however, retail-sliced product is estimated to cause 1.7 times more deaths than prepackaged product even when stored for a quarter of the time. All else being equal, if consumers store retail sliced deli meat for only 25% of the time that they store prepackaged deli meat, retail sliced product still causes a greater number of deaths than prepackaged product. Table 17. Estimated mean number of listeriosis deaths and illnesses per annum by fraction of consumer storage time between retail-sliced and prepackaged product.
Storage Time Fraction 25% 50% 75% 100% Deaths 70.7 105.5 127.1 139.3 Illnesses 397.8 589.9 708.0 774.7 Ratio of Deaths, Retail-sliced: Prepackaged 1.7 3.7 5.4 9.1
FSIS Comparative Risk Assessment for Listeria monocytogenes in Ready-to-eat Meat and Poultry Deli Meats Report
34
Figure 13. Relative ratio of listeriosis deaths with differing consumer storage times between retail-sliced and prepackaged product.
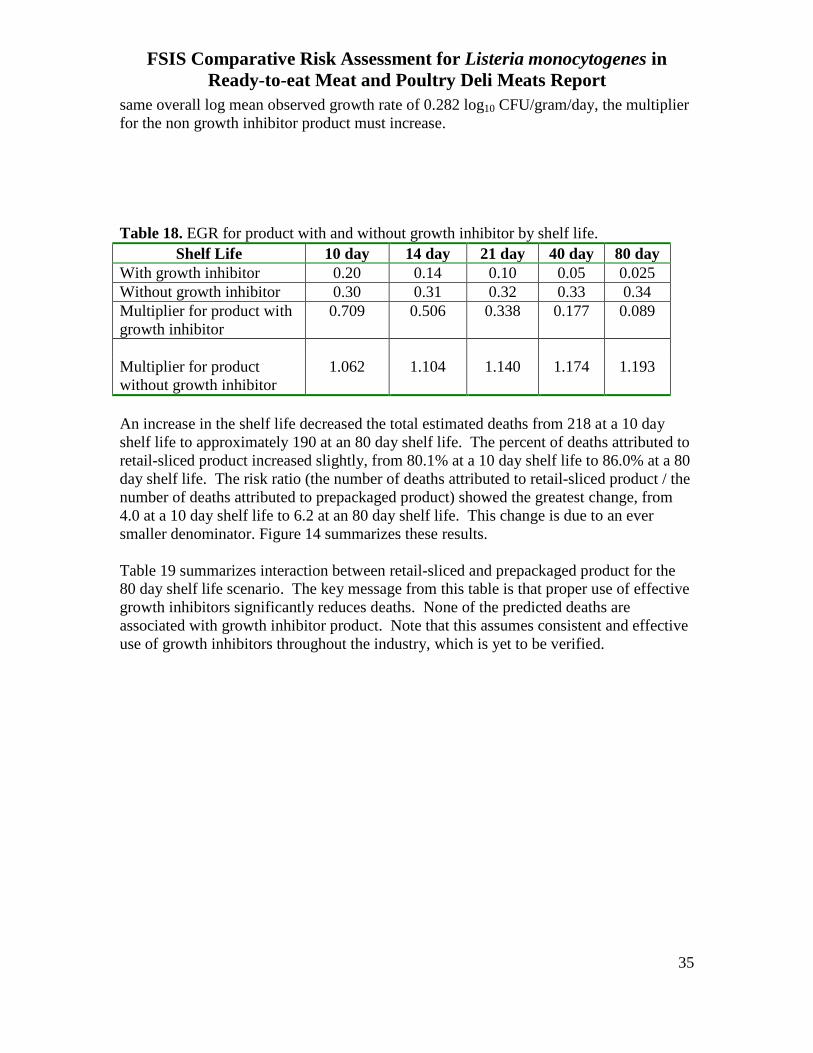
3.3.2 Shelf Life
To evaluate the effect that different shelf life assumptions had on the results, the shelf life was varied among 10 days, 14 days (base run already reported), 21 days, 40 days, and 80 days. Recall that shelf life is not directly incorporated into the model. Rather, based on the requirements to qualify for growth inhibitor use under the Interim Final Rule, it is used to calculate the exponential growth rates for product with and without growth inhibitor. In effect, for this model the shelf life is a measure of the effectiveness of the growth inhibitor. Longer shelf lives imply more effective growth inhibitors. Table 18 summarizes the growth rates and growth multipliers for each of the shelf lives considered. Note that as the shelf life increases, growth inhibitors are assumed to be more effective (the multiplier for the growth inhibitor product decreases). To keep the
FSIS Comparative Risk Assessment for Listeria monocytogenes in Ready-to-eat Meat and Poultry Deli Meats Report
35
same overall log mean observed growth rate of 0.282 log10 CFU/gram/day, the multiplier for the non growth inhibitor product must increase. Table 18. EGR for product with and without growth inhibitor by shelf life.
Shelf Life 10 day 14 day 21 day 40 day 80 day With growth inhibitor 0.20 0.14 0.10 0.05 0.025 Without growth inhibitor 0.30 0.31 0.32 0.33 0.34 Multiplier for product with growth inhibitor
0.709 0.506 0.338 0.177 0.089
Multiplier for product without growth inhibitor
1.062 1.104 1.140 1.174 1.193
An increase in the shelf life decreased the total estimated deaths from 218 at a 10 day shelf life to approximately 190 at an 80 day shelf life. The percent of deaths attributed to retail-sliced product increased slightly, from 80.1% at a 10 day shelf life to 86.0% at a 80 day shelf life. The risk ratio (the number of deaths attributed to retail-sliced product / the number of deaths attributed to prepackaged product) showed the greatest change, from 4.0 at a 10 day shelf life to 6.2 at an 80 day shelf life. This change is due to an ever smaller denominator. Figure 14 summarizes these results. Table 19 summarizes interaction between retail-sliced and prepackaged product for the 80 day shelf life scenario. The key message from this table is that proper use of effective growth inhibitors significantly reduces deaths. None of the predicted deaths are associated with growth inhibitor product. Note that this assumes consistent and effective use of growth inhibitors throughout the industry, which is yet to be verified.
FSIS Comparative Risk Assessment for Listeria monocytogenes in Ready-to-eat Meat and Poultry Deli Meats Report
36
Tota
l est
imat
ed d
eath
s
0
50
100
150
200
250Fr
actio
n of
tota
l dea
ths
from
reta
il-sl
iced
pro
duct
0.0
0.2
0.4
0.6
0.8
Shelf Life (d)
10 14 21 40 80
Ris
k ra
tio
reta
il-sl
iced
/pre
pack
aged
0
2
4
6
(a)
(b)
(c)
Figure 14. Impact of varying shelf life for a) total estimated deaths, b) fraction of deaths from retail-sliced product, and c) risk ratio.
FSIS Comparative Risk Assessment for Listeria monocytogenes in Ready-to-eat Meat and Poultry Deli Meats Report
37
Table 19. Estimated percent listeriosis deaths by deli meat category for 80 day shelf lif
Category
e. Percent of predicted deaths per year
prepackaged retail-sliced TOTAL Used growth inhibitor 0.0% 0.0% 0.0% Did not use growth inhibitor
14.0% 86.0% 100.0%
TOTAL 14.0% 86.0% 100.0% The overall conclusion from the shelf life sensitivity is that the estimated percentage of deaths attributed to retail-sliced product is not sensitive to the shelf life assumption. The 14-day shelf life assumption found that 83% of deaths from deli meats are attributable to retail-sliced product, i.e. retail-sliced products are 4.88 times riskier than prepackaged. The sensitivity analysis found that if the shelf life varied from 10 to 80 days, the percentage of deaths attributed to retail-sliced product varied from 80% to 86%. Thus, the shelf life is not a sensitive variable here for the major conclusions of the risk assessment.
3.3.3 Total Number of Deaths
This risk assessment kept the same total number of deaths in each age group across all food categories the same as the 2003 FDA-FSIS risk assessment and this value may well have changed since the 2003 report. However, the total number of deaths applies to all food categories combined, and the percent of deaths attributed to any specific food category is not impacted by the specific value used for the total number of deaths. A sensitivity analysis was conducted by arbitrarily reducing the number of deaths in each age group across all 26 food categories12
by 50% (Table 20). While, as expected, the predicted mean total number of deaths dropped from 201 to 99.5 per year, the percent breakdown among the four deli meat categories (prepackaged with growth inhibitor, retail-sliced with growth inhibitor, prepackaged without growth inhibitor and retail-sliced without growth inhibitor) remained largely unchanged – 83% of deaths attributed to deli meats are from retail-sliced product.
Table 20. Estimated percent listeriosis deaths by deli meat category when total deaths across all food groups are reduced by 50%.
Category Percent of predicted deaths per year
prepackaged retail-sliced TOTAL Used growth inhibitor 5.2% 13.2% 18.4%
Did not use growth inhibitor
11.8% 69.8% 81.6%
TOTAL 17.0% 83.0% 100.0%
12 In the 2003 FDA-FSIS risk assessment, 23 food categories were ranked according to their inherent risk.
In that risk assessment, deli meat was considered as one category. However, for the purpose of this risk assessment, deli meat was split into 4 categories based on slicing location and whether it contained growth inhibitor or not. Therefore, this risk assessment considered 26 food categories rather than 23.
FSIS Comparative Risk Assessment for Listeria monocytogenes in Ready-to-eat Meat and Poultry Deli Meats Report
38
3.4 RELATIVE IMPACTS OF MODEL VARIABLES Using the original comparative risk assessment model results, statistical analyses were conducted to elucidate the relative importance of model inputs. A recursive partitioning and regression tree was generated in R to determine which factor (age, slicing location, or growth inhibitor use) had the greatest effect on the number of resulting deaths (Figure 15). The first division in the tree indicates that age is the most important factor and that the elderly are more likely to die from listeriosis than either the neonatal or the intermediate population. Following the tree along the elderly branch, the next division is by slicing location. The tree indicates that retail-sliced product is at greater risk for causing listeriosis than prepackaged product. Finally, the retail-sliced product is divided according to growth inhibitor use. Because the slicing location split always occurs prior to the growth inhibitor use split, this indicates that slicing location is a better predictor of the number of deaths than growth inhibitor use.
Age = neonatal &
Intermediate
mean deaths = 16.7n = 48000
Age = Elderly
Sliced = prepackaged
Sliced = retail
GI = yes GI = no
mean deaths = 38.7n = 16000
mean deaths = 5.8n = 32000
mean deaths = 1.9n = 16000
mean deaths = 9.6n = 16000
mean deaths = 3.1n = 8000
mean deaths = 16.1n = 8000
Age = neonatal Age = intermediate
mean deaths = 6.7n = 4000
mean deaths = 25.3n = 4000
Sliced = prepackaged Sliced = retail
mean deaths = 13.2n = 8000
mean deaths = 64.2n = 8000
GI = yes GI = no
mean deaths = 20.4n = 4000
mean deaths = 108.1n = 4000
Figure 15. Recursive partitioning and regression tree for comparing importance of slicing location versus growth inhibitor usage. Consumer storage time temperature data from RTI. Using the data from all 4,000 simulations, box plots were generated for each deli meat category by age group (Figure 16). As seen in the box plots, each of the four deli meat categories follows a similar trend, with the elderly age group at the highest risk for death. Both retail categories consistently had higher medians than either plant-sliced category, e.g. retail-sliced product with growth inhibitors was associated with slightly more deaths than prepackaged product without growth inhibitors. The significant increase in
FSIS Comparative Risk Assessment for Listeria monocytogenes in Ready-to-eat Meat and Poultry Deli Meats Report
39
estimated deaths for retail-sliced product without growth inhibitors compared to those with growth inhibitors is apparent.
Category
with GI
without GI
with GI
without GI
with GI
without GI
with GI
without GI
with GI
without GI
with GI
without GI
Estim
ated
Dea
ths
0.1
1
10
100
1000
Prepack Retail Prepack Retail Prepack Retail
Elderly Intermediate Neonatal
Figure 16. Box plots for each deli meat category by age group. Prepack = prepackaged, Retail = retail-sliced, GI = growth inhibitor. An interaction plot for the elderly age group was created to compare the effect of growth inhibitor use and product slicing location on the mean number of deaths (Figure 17). This illustrates once again the interaction of slicing location and growth inhibitor use. There is a significant difference between the mean number of deaths resulting from retail-sliced product when compared to prepackaged product (Figure 17a). While the use of growth inhibitor greatly decreased the mean number of deaths resulting from retail-sliced product, prepackaged product without growth inhibitor results in fewer deaths than retail-sliced product with growth inhibitor (Figure 17b).
FSIS Comparative Risk Assessment for Listeria monocytogenes in Ready-to-eat Meat and Poultry Deli Meats Report
40
Figure 17. Interaction plots comparing the effect of growth inhibitor (GI) use and slicing location on the mean number of deaths from listeriosis.
FSIS Comparative Risk Assessment for Listeria monocytogenes in Ready-to-eat Meat and Poultry Deli Meats Report
41
4.0 Conclusions Based on this analysis, RTE meat and poultry products sliced at retail are approximately 4.88 times more risky on an annual basis than prepackaged product in terms of deaths from listeriosis. Retail-sliced products are associated with 83% of all L. monocytogenes deaths from deli meats. This percentage is largely unaffected by consumer storage time, product shelf life, or total number of L. monocytogenes associated deaths. This risk assessment shows that the interaction of high L. monocytogenes prevalence and concentrations in retail-sliced product together with the lack of growth inhibitors for some product are the primary drivers of the risk of death from listeriosis. Potentially, retail delis have two options available to lower this risk. First, retail delis may wish to consider using product that incorporates growth inhibitors, when available. Second, retail delis can exert controls on the transmission and cross-contamination of L. monocytogenes within the retail environment. Finally, in order to proffer effective and efficient mitigation strategies to reduce the risk of contracting listeriosis from retail-sliced products, it is very important to understand the events, actions and occurrences of the retail deli and its environment. Such understanding will study the acts of deli workers while handling, slicing and packaging retail deli products and must be able to pinpoint risk areas and opportunities for reducing the inherent risks.
FSIS Comparative Risk Assessment for Listeria monocytogenes in Ready-to-eat Meat and Poultry Deli Meats Report
42
Appendix A: L. monocytogenes in Ready-to-eat Meat and Poultry Deli meat The presence and level of L. monocytogenes in RTE meat and poultry products were determined using data from a study conducted by the National Alliance for Food Safety and Security (NAFSS) (Draughon, 2006).
A-1 DATA COLLECTION METHODS The sampling group was comprised of four designated sites in the Foodborne Disease Active Surveillance Network (FoodNet). These were Northern California (CA), Georgia (GA), Minnesota (MN), and Tennessee (TN). Sampling was weighted by the populations in counties (http://www.census.gov) so that exposure could be estimated. Approximately 75% of shopping is done at major supermarket chains and 25% is done at other grocers, such as independent retailers (Gombas et al. 2003). The number of samples collected from supermarkets versus independent retailers was weighted accordingly. Also, >50% of consumers purchase RTE meat products that are sliced at delicatessens with the remainder purchasing sliced prepackaged products. USDA data suggest that approximately 47% of RTE deli meat is sliced at the processing plant and prepackaged.
13
The relative number of samples between prepackaged and retail-sliced was therefore kept approximately equal as part of the sampling design. Sample data were encoded by the researchers to prevent identification of the store.
Approximately 2,000 samples (125 grams each) were analyzed from each of the four designated sites, with approximately equal numbers of samples sliced at retail versus sliced at a processing establishment and a smaller number of intact product samples. The sampling protocol was designed to allow for statistically valid comparisons among sites, RTE products type, and retail-sliced versus prepackaged, assuming an α = 0.05 and a 90% power of detecting a difference of 2% in the comparison of binomial proportions. The following product types were sampled: cured poultry, uncured poultry, pork, and beef. Analysis of approximately 1,000 samples of each product type was done to support conclusions at the desired level of certainty. Use of any antimicrobial or growth inhibiting agents was noted at the time of sample collection. Intact samples were collected by purchasing whole, intact hams, roast beefs, turkey rolls, etc. These large pieces of cooked meat are commonly referred to as “logs” or “chubs.” Each chub tends to weigh between 10 and 20 pounds. A random number table was used to choose five 35-gram core samples from each intact chub. The core samples were then tested for presence and level of L. monocytogenes.
13 Estimated based on industry survey data collected with USDA/FSIS Form 10,240-1, Production
Information on Post-Lethality Exposed Ready-to-Eat Products, gathered in July 2007 in accordance with 9 CFR 430.4(d). (Table 8)
FSIS Comparative Risk Assessment for Listeria monocytogenes in Ready-to-eat Meat and Poultry Deli Meats Report
43
Specific instructions were provided for sample collectors, including the product category, the number of samples of each type of product to be obtained, size of the sample to be purchased, and how to choose, collect, hold and transport the sample. Sample collection was standardized to maintain consistency. Sampling and laboratory analyses followed standard laboratory practices. This included temperature monitoring during shipment, chain of custody documentation, aseptic transfer and handling within the laboratory, and initiating analyses within 24 hours of receipt of sample. The laboratories were instructed to discard any sample with package damage such that the microbiological integrity of the sample was not compromised. Samples not meeting quality control requirements were noted and discarded. The FSIS standard laboratory method for L. monocytogenes detection was implemented by the laboratories for use in this study. Presence/absence for L. monocytogenes was determined by inoculation in UVM broth followed by Fraser broth then modified Oxford (MOX) agar. Positive samples were quantified using a FSIS protocol 9-tube Most Probable Number (MPN) method with a reported detection limit of 0.3 MPN/gram. Typical colonies appearing on MOX plates were spot inoculated onto RAPID’ L. mono (BioRad, Hercules, CA) for species identification. Additionally, MOX plates characterized by esculin hydrolysis were screened for genetic confirmation using Gene-Trak assay (Neogen Corporation, Lansing, MI). NAFSS research laboratories, as approved by FSIS, were experienced in detecting L. monocytogenes in food. Samples were assigned codes and the following product information recorded: sampling location (FoodNet site along with producer information, retailer’s name, and location of purchase), date of receipt at the laboratory, whether the sample appeared to be packaged in-store or prepackaged, and the use-by or sell-by date. Any store information or identifiers were removed prior to transfer to FSIS.
A-2 STATISTICAL ANALYSES Statistical analyses were performed using Number Cruncher Statistical Systems (NCSS) 2001 (Hintz, 2001) and R version 2.6.1 (R Development Core Team, 2007). For statistical tests, p values less than 0.05 were considered statistically significant, and p values between 0.05 and 0.10 were considered marginally significant. Data were analyzed in a variety of ways. The prevalence of L. monocytogenes among product samples sliced at retail and those that were prepackaged were analyzed by sampling site, product type, store type, time of day (morning or afternoon), and quarter of the year using tests of proportions. The null hypothesis for this test is that all the prevalences are equal. The alternative hypothesis is that at least one prevalence differs from some other. This type of statistical test assumes independence among the samples, an assumption that is not likely met for these data. Because multiple samples were collected at the same store, multiple positive L. monocytogenes findings are likely to be correlated because of cross-contamination and poor hygienic conditions at the store. Statistical tests with correlated positive samples would, on average, claim to find statistically significant results more commonly than intended.
FSIS Comparative Risk Assessment for Listeria monocytogenes in Ready-to-eat Meat and Poultry Deli Meats Report
44
Tests of proportions were also conducted at the retail store level. A store was considered positive for retail-sliced or prepackaged if any of the samples for that category were found positive for L. monocytogenes. Stores are much more likely to be independent, but serious problems arise from this approach as well. Store identifiers (even arbitrary labels) were removed from data provided prior to submittal to FSIS as part of the data encoding and blinding process. Store visits were therefore estimated based on date and time of sampling collection. A second problem was that sample collection times were not provided for samples from Minnesota, thus the number of stores available was much smaller than the number of samples. Statistical tests based on only a few hundred samples lack sufficient statistical power and are unlikely to detect small differences in prevalence rates at reasonable levels of confidence. Finally, this approach does not directly incorporate the number of samples collected at each store. The final approach used was a logistic regression that predicts the store prevalence for retail-sliced and prepackaged product as a function of indicator variables: where the product was sliced, the store type, and the time of day the sample was collected. Because it is based on store prevalence, this approach is not subject to the correlation problem. The regression was weighted by the number of samples taken at the store, and evaluated more than one explanatory variable simultaneously.
A-3 STUDY RESULTS
A-3.1 Prevalence and Number of Samples
Fifty-seven samples were found to be positive for L. monocytogenes resulting in an overall prevalence rate of 0.76%. Two of these positives were found in chub samples, six were found in prepackaged samples, and the remaining 49 positives were found in retail-sliced samples. The number of prepackaged and retail samples across the four FoodNet sites is shown in Table A-1. Table A-1. Prevalence of product samples1 and stores visited based on sampling locations.
Category
Sampling Locations (Site) CA GA MN TN
Number of product samples2 0.74% (10/1360)
0.60% (12/2000)
0.95% (16/1685)
0.85% (17/1995)
Estimated number of stores sampled3
6.98% (6/86)
4.93% (7/142)
n/a3 10.23% (9/88)
1 Product samples from each store include those sliced and packaged at retail and those sliced and packaged by the manufacturer. 2 Chub data are not included. Number of positive samples and total number of samples are given in parentheses. 3 Store visit estimated based on similar sampling date and time. No sample times were provided for MN, so estimate of stores sampled was not available.
FSIS Comparative Risk Assessment for Listeria monocytogenes in Ready-to-eat Meat and Poultry Deli Meats Report
45
Slightly fewer product samples were taken in CA than other sites. More stores were sampled in GA than other sites. In addition to prepackaged and retail-sliced product samples, 105 and 300 additional chub samples were collected in MN and TN respectively. Assuming independence, a test of proportions indicated no statistically significant difference for the prevalence within product samples among the four sites (p = 0.75). Neither was there any statistical difference for the store prevalence across the sites (p = 0.31). This allowed for pooling of the data for purposes of discussing total prevalence. The number and prevalence for retail-sliced and prepackaged samples by quarter of the year is shown in Table A-2. More product samples and more stores were visited in the 3rd quarter than in other quarters. Assuming independence, a test of proportions indicated a statistically significant difference for the prevalence within product samples (p = 0.01) but not store prevalence (p = 0.31). Table A-2. Prevalence of product samples (retail-sliced, prepackaged) and stores visited based on quarter of year.
Category
Quarter of Year 1st 2nd 3rd 4th
Number of product samples 0.16% (2/1275)
0.74% (13/1746)
1.15% (28/2430)
0.76% (12/1589)
Estimated number of stores sampled1
2.63% (2/76)
7.37% (7/95)
5.34% (7/131)
10.00% (6/60)
1 Store visit estimated based on similar sampling date and time. No sample times were provided for MN, so product samples include MN but stores sampled do not. Chub data are not included. The number and prevalence for retail-sliced and prepackaged samples by time of day is shown in Table A-3. Slightly more product samples and stores were sampled in the afternoon. Assuming independence, a test of proportions indicated a statistically significant difference for the prevalence within product samples (p = 0.04) but not store prevalence (p = 0.75). Table A-3. Prevalence of product samples (retail-sliced, prepackaged) and stores visited based on time of day (AM versus PM).
Category
Time of Day AM PM
Number of product samples1 0.51% (13/2540)
1.04% (32/3060)
Estimated number of stores sampled1 5.42% (9/166)
6.81% (13/191)
1 Store visit estimated based on similar sampling date and time. No sample times were provided for MN, so neither product samples nor stores sampled include MN. Chub data are not included.
FSIS Comparative Risk Assessment for Listeria monocytogenes in Ready-to-eat Meat and Poultry Deli Meats Report
46
The more interesting time of day analysis looked solely at retail-sliced product as shown in Table A-4. Retail-sliced product samples collected in the afternoon were more than twice as likely to test positive for L. monocytogenes – 1.92% versus 0.92%. Assuming independence, this difference was statistically significant (p = 0.04). While the store prevalences were also higher in the afternoon (7.83% versus 5.80%), the differences were not statistically significant (p = 0.64). Table A-4. Prevalence of only retail-sliced product and stores visited based on time of day (AM versus PM).
Category
Time of Day AM PM
Number of product samples1 0.92% (12/1307)
1.92% (31/1612)
Estimated number of stores sampled1 5.80% (8/138)
7.83% (13/166)
1 Store visit estimated based on similar sampling date and time. No sample times were provided for MN, so neither product samples nor stores sampled include MN. The number and prevalence for retail-sliced and prepackaged samples is shown in Table A-5. As designed, more product samples were collected at major grocery chains. Assuming independence, a test of proportions found a marginal statistically significant difference for the prevalence within product samples (p = 0.07) but not store prevalence (p = 0.82). Table A-5. Prevalence of product samples (retail-sliced, prepackaged, and chubs) and stores visited based on store type (major grocery chain versus other grocers).
Category
Store Type2 A B
Number of product samples1 0.64% (31/4801)
1.10% (24/2186)
Estimated number of stores sampled1 5.58%
(11/197) 6.71%
(11/164) 1 Store visit estimated based on similar sampling date and time. No sample times were provided for MN, so product samples include MN but stores sampled do not. 2 A represents major grocery chains. B represents other grocers. Product samples were collected from prepackaged product, from product sliced at retail delis, and a limited number from intact chubs collected at retail. The number of RTE product samples by location of slicing is shown in Figure A-1. A total of 3,518 retail-sliced samples, 3,522 prepackaged samples, and 405 chub samples were collected. A given chub may have been sampled multiple times making the number of unique chubs uncertain.
FSIS Comparative Risk Assessment for Listeria monocytogenes in Ready-to-eat Meat and Poultry Deli Meats Report
47
Figure A-1. Number of RTE samples by location of slicing (source). The data also indicate that deli meat sliced at retail is more likely to be contaminated than prepackaged deli meat (1.39% versus 0.17%). The results are shown in Figure A-2. Assuming independence, a test of proportions between retail and prepackaged prevalence indicated retail-sliced deli meat had a statistically significant higher prevalence (p < 0.0001).
14
14 Chub data were not included in this test of proportions.
405
3518 3522
0
500
1000
1500
2000
2500
3000
3500
4000
chub retail sliced prepackaged
Source
Tota
l Num
ber o
f Sam
ples
FSIS Comparative Risk Assessment for Listeria monocytogenes in Ready-to-eat Meat and Poultry Deli Meats Report
48
Figure A-2. Prevalence of L. monocytogenes in deli meat by location of slicing. The site and slicing location results for sliced deli meat only are shown in Table A-6. Chub results are not included. The striking difference in prevalence between retail-sliced versus prepackaged is evident at all sites. Differences among the sites are relatively minor. Table A-6. Prevalence of L. monocytogenes in retail-sliced and prepackaged deli meat by site. Site
(number of positive samples and the total number of samples are shown in parentheses)
CA GA MN TN Overall
Pr
oces
sing
Retail-sliced
1.3% (12/929)
1.4% (10/731)
1.4% (12/841)
1.5% (15/1017)
1.4% (49/3518)
Prepackaged
0.0% (0/1071)
0.0% (0/629)
0.5% (4/844)
0.2% (2/978)
0.2% (6/3522)
Overall
0.6% (12/2000)
0.7% (10/1360)
0.9% (16/1685)
0.9% (17/1995)
0.8% (55/7040)
Note: Chub data are not included.
0.0%
0.2%
0.4%
0.6%
0.8%
1.0%
1.2%
1.4%
1.6%
chub retail sliced prepackaged
Prev
alen
ce (%
)49 / 3518
6 / 3522
2 / 405
FSIS Comparative Risk Assessment for Listeria monocytogenes in Ready-to-eat Meat and Poultry Deli Meats Report
49
For the 362 stores identified across the three sites available (CA, GA, TN) retail-sliced deli meat was sampled at 308 stores and prepackaged deli meat was sampled at 313 stores. For most stores, both types of deli meat was collected – 259 of these stores had both retail-sliced and prepackaged samples collected, 49 had only retail-sliced samples collected, and 54 had only prepackaged sliced samples collected. The testing results showed that only one store had positives samples for both retail-sliced and prepackaged deli meat. An additional 20 of the stores had positive retailed-sliced samples, and one store had positive prepackaged deli meat only. Histograms of the number of retail-sliced and prepackaged deli meat samples taken at each store are shown in Figure A-3. For retail-sliced deli meat, the number of deli meat samples per store ranged from 1 to 30, with a median of 8. The 25th and 75th% quantiles were 6 and 10 respectively. For prepackaged deli meat, the number of deli meat samples ranged from 1 to 24, with a median of 9. The 25th and 75th% quantiles were 6 and 11, respectively.
FSIS Comparative Risk Assessment for Listeria monocytogenes in Ready-to-eat Meat and Poultry Deli Meats Report
50
Figure A-3. Number of deli meat samples collected per store. MN data are not included because stores could not be identified. Some differences existed among the different sites for labeling types of deli meats. After correcting for obvious misspellings and accounting for multiple orderings, the types of deli meats listed in the data were: beef, beef/chicken/pork, beef/chicken/turkey, beef/pork, beef/pork/turkey, bologna, chicken, chicken/pork, chicken/turkey/pork, ham, mixed, pork, pork/turkey, poultry, poultry (chicken), poultry (chicken/pork), poultry (chicken/pork/beef), poultry (turkey), poultry (turkey/pork), and roast beef. Many categories of deli meat types had very few samples. For purposes of this analysis, these categories were combined into 5: beef, bologna, pork, poultry, or mixed. Deli meat labeled as “bologna” was classified into different product types. If labeled by the sampler as “beef bologna,” it was categorized as beef. If labeled with mixed components, it was categorized as mixed. If labeled simply as bologna, it was categorized as bologna. Deli
FSIS Comparative Risk Assessment for Listeria monocytogenes in Ready-to-eat Meat and Poultry Deli Meats Report
51
meat listed as poultry but containing mixed components was categorized as mixed. For example, the samples labeled “poultry (chicken/pork)” were categorized as mixed. Based on this categorization, the counts by product type are given in Figure A-4.
Figure A-4. Number of RTE samples by deli meat type. Chub data are not included. One sample (not shown) did not include any listing for deli meat type. The prevalence of L. monocytogenes across the different deli meat types is shown in Figure A-5. Although it appears that beef has a slightly higher prevalence, the differences were not statistically significant based on a test of proportions (p = 0.22) among the five different deli meat types (beef, bologna, mixed, pork, poultry). The corresponding L. monocytogenes prevalence for beef, bologna, mixed meat, pork, poultry deli meats were 1.28%, 0.31%, 0.44%, 0.87%, and 0.65%, respectively. There does not appear to be any difference in the prevalence of L. monocytogenes based on whether the deli meat was cured or uncured. A similar test was conducted for retail-sliced only deli meat samples with similar results. Overall, there was no statistically significant difference in the prevalence of L. monocytogenes among the different deli meat types (p = 0.43).
1093
321 229
1727
3669
0
500
1000
1500
2000
2500
3000
3500
4000
beef bologna mixed pork poultry
Product Type
Number of Product Samples
FSIS Comparative Risk Assessment for Listeria monocytogenes in Ready-to-eat Meat and Poultry Deli Meats Report
52
Figure A-5. Prevalence of L. monocytogenes in RTE deli meats by deli meat type. Chubs were not included. Samplers were asked to identify if the sample included an antimicrobial formulation. Of the 7,446 samples, 51 were identified as using an antimicrobial agent, 1,008 did not use an antimicrobial agent, and 6,387 were blank. Antimicrobial agents listed included potassium lactate, sodium diacetate, calcium lactate, sodium phosphate, and sodium benzoate. Of the 57 samples positive for L. monocytogenes, 1 listed sodium lactate/sodium diacetate use, 6 listed sodium erythorbate (not considered a growth inhibitor), and 50 were blank.
15
There is an indication that positive retail-sliced samples were clustered by store when positive L. monocytogenes results were found. Figure A-6 illustrates the deli meat sample prevalence for retail-sliced deli meat among the 21 stores with at least one positive result. Three of these stores had 50% or greater prevalence, and six of these stores had greater than 30% prevalence. Of the 308 identified stores sampled for retail-sliced deli meat, 37 15 Because of the large number of blanks, this antimicrobial formulation data was not used as part of the risk assessment described below. Instead, USDA data on current industry practices were used to estimate the fraction of product with antimicrobial usage.
0.00%
0.20%
0.40%
0.60%
0.80%
1.00%
1.20%
1.40%
beef bologna mixed pork poultry Grand Total
Product Type
Prevalence of Product Samples (%) 14 / 1093
1 / 321 1 / 229
15 / 1727
24 / 3669
55 / 7040
FSIS Comparative Risk Assessment for Listeria monocytogenes in Ready-to-eat Meat and Poultry Deli Meats Report
53
L. monocytogenes positive deli meat samples were found among 22 stores. The remaining positive samples were from MN, where individual stores could not be identified. Six of these stores accounted for 21 of the 37 positive samples found. Thus, it appears that a few retail stores accounted for most of the positive deli meat samples found. This finding is indicative of cross contamination at the retail establishment. It is also the reason that the independence assumption of the test of proportions for deli meat samples is likely not completely valid.
Figure A-6. Prevalence of L. monocytogenes in RTE deli meats samples sliced at retail. The estimated store visit was based on similar sampling date and time. No sample times were provided for MN; thus, MN data not included. Thirty-seven total deli meat samples are shown.
A-3.2 Logistic Regression
To overcome the limitations with the test of proportions used above (non-independence for deli meat samples and small sample size for store samples), a logistic regression was performed. Logistic regression is appropriate when the dependent variable represents a
0%
10%
20%
30%
40%
50%
60%
70%
80%
90%
100%
A B C D E F G H I J K L M N O P Q R S T U
Store ID
Prod
uct S
ampl
e Pr
eval
ence
(%)
2/2
5/7
1/2
4/103/8
3/94/14
1/5 1/51/52/11
FSIS Comparative Risk Assessment for Listeria monocytogenes in Ready-to-eat Meat and Poultry Deli Meats Report
54
proportion of positive results such as the deli meat prevalence for retail-sliced deli meat at an individual store. The assumptions for standard linear regression are not valid here: the dependent variable is bounded to fall between 0 and 1, the errors are not normally distributed, and the regression must be weighted by the sample size used to calculate the prevalence. Logistic regression transforms the prevalence to a scale more suitable for regression. The analysis was performed in R using the generalized linear model (glm). In the language of R, a binomial family was specified which used the logit transformation as the link function. The prevalence of retail-sliced and prepackaged deli meat was calculated separately for each store. This prevalence was regressed against several indicator variables: processing type (retail-sliced versus prepackaged), time of day, and store type. Retail-sliced and prepackaged prevalences from the same store were treated as independent. Given that only one store had both processing types found positive, this seemed a reasonable approach. The number of samples of each type was used to weight the regression. (Thus, store prevalences with only one sample received less weight than store samples with 30 samples.) The logistic regression approach also had the advantage that all three explanatory variables were included simultaneously. The regression function was
( ) day of timeβ typestoreβ typeprocessingββprevalencelogit 3210 ⋅+⋅+⋅+= where: logit() = the logit transformation function; prevalence = the deli meat sample prevalence for each store and processing type (retail-sliced versus prepackaged); processing type = 0/1 indicator variable with 0 for prepackaged and 1 for retail-sliced; store type = 0/1 indicator variable with 0 for type A stores (major grocery chains) and 1 for type B stores (other grocery stores); and time of day = 0/1 indicator variable with 0 for AM and 1 for PM. The number of data points used in the regression was 613. This is less than twice the number of individual stores sampled (2*362=724) because not all stores had both retail-sliced and prepackaged samples collected. The results for the parameter estimates are given in Table A-7. The variables processing type and store type are statistically significant. The time of day the sample was collected is marginally significant. Table A-7. Results of logistic regression for store prevalence as function of processing type, store type, and time of day indicator variables. Data for MN not included. N=613.
Parameter Estimate Standard Error
Z value p
Intercept -7.96 0.76 -10.39 <0.0001 Processing type 2.90 0.73 4.00 <0.0001 Store type 0.99 0.33 3.03 0.002 Time of day 0.59 0.35 1.68 0.093
FSIS Comparative Risk Assessment for Listeria monocytogenes in Ready-to-eat Meat and Poultry Deli Meats Report
55
As expected from examining the data, whether the sample was prepackaged versus retail-sliced was strongly statistically significant. This is consistent with the test of proportions for deli meat samples. The result for time of day is consistent with the deli meat sample test of proportions for time of day. Both results indicate marginal statistical significance. Figure A-7 illustrates the results using a logistic regressions based on one explanatory variable at a time as the explanatory variable. Because the vast majority of points had 0 prevalence and only two values (0/1) were used for the explanatory variables, a small random number was added to the (x,y) coordinate for each point in order to better illustrate the density of points at 0 prevalences.
16
Figure A-7. Graphical display of logistic regression results using deli meat sample prevalence at individual stores as the dependent variable. MN data not included.
16 The statistical term for this is jitter.
Process Type
Sto
re P
reva
lenc
e
0.0
0.2
0.4
0.6
0.8
1.0
prepackaged retail-sliced
Store Type
Sto
re P
reva
lenc
e
0.0
0.2
0.4
0.6
0.8
1.0
A B
Time of Day
Sto
re P
reva
lenc
e
0.0
0.2
0.4
0.6
0.8
1.0
AM PM
FSIS Comparative Risk Assessment for Listeria monocytogenes in Ready-to-eat Meat and Poultry Deli Meats Report
56
A-3.3 Comparison of Findings of the National Alliance for Food Safety and Security with those of the Food Processors’ Association
A comparison of NAFSS retail contamination findings with those of the National Food Processors Association (now Food Products Association) (Gombas et al. 2003) is enlightening, although keep in mind that sample collection methods, sample sizes and analyses methods differed and these can all affect the results. The total number of deli meat samples was roughly equivalent: Gombas et al. sampled approximately 9,000 deli meat samples compared to about 7,000 (excluding chubs) for this research. The split between retail-sliced and prepackaged was somewhat different however. Approximately 77% of the samples from Gombas et al. were prepackaged, versus approximately 50% for this work. USDA/FSIS data suggest that approximately 47% of RTE deli meat is sliced at the processing plant and prepackaged.
17
Gombas et al. found retail-sliced and prepackaged prevalences of 2.7% and 0.4% respectively. This research found prevalences lower by about a factor of 2: 1.4% and 0.2% respectively. This may indicate improvements in deli meat handling, increased use of post-processing lethality and antimicrobial growth inhibitor, or other improvements at the processing plant or retail between when the studies were conducted. The earlier research found a difference in prevalence between their two sampled sites. Table A-8 below shows the derived results. Compare these data to the corresponding Table 6 above for the more recent data. Whereas this work found a consistent prevalence across all sites and a significant difference between retail-sliced versus prepackaged, the earlier work found no difference in processing type at one site and a statistically significant difference at another. Table A-8. Prevalence of L. monocytogenes in sliced deli meat by site and processing type from the Food Products Association (Gombas et al. 2003). Site
CA MD Overall
Proc
essi
ng1 Retail-sliced 0.70% 4.2% 2.7%
Prepackaged 0.55% 0.19% 0.4% Overall 0.6%
(28/4600) 1.2%
(54/4599)
0.9% (82/9199)
1 The number of positive samples and the total number of samples are shown in parentheses where available.
17 Estimated based on industry survey data collected with USDA/FSIS Form 10,240-1, Production Information on Post-Lethality Exposed Ready-to-Eat Products, gathered in July 2007 in accordance with 9 CFR 430.4(d). See Table 8 above for details
FSIS Comparative Risk Assessment for Listeria monocytogenes in Ready-to-eat Meat and Poultry Deli Meats Report
57
Gombas et al. also found that the prevalence was higher for retail-sliced deli meat, but that the levels for positives were actually higher for prepackaged deli meat. This current work found consistently that both the prevalence and levels were higher for retail-sliced deli meat compared to prepackaged.
A-4 CONCLUSIONS
Table A-9 summarizes the results of all the statistical testing. RTE deli meat is more contaminated with L. monocytogenes, both in terms of prevalence and level, when sliced at retail than when prepackaged. The marginal statistical link between positive results and time of day as well as the clustering according to the store where the sample was collected is an indication that cross contamination within retail establishments is occurring. There was no significant difference in prevalence of L. monocytogenes among the various four FoodNet sites. Table A-9. Overall results of statistical tests for prevalence of L. monocytogenes on RTE meat and poultry deli meats by location, season, time of day for slicing at retail, and by deli meat type.
Variable
Statistical Test1 Deli meat samples2
Stores3 Logistic regression4
Geographic location N
(p=0.75) N
(p=0.31)
Quarter of year Y
(p=0.01) N
(p=0.31)
Time of Day Y
(p=0.04) N
(p=0.75) M
(p=0.093) Time of day (retail-sliced only) Y
(p=0.04) N
(p=0.64)
Store Type M (p=0.07)
N (p=0.82)
Y (p=0.002)
Prepackaged versus retail-sliced
Y (p<0.0001)
Y (p<0.0001)
Deli meat Type
N (p=0.22)
Deli meat Type (retail-sliced only)
N (p=0.43)
1 Chub data were not included in any of the analyses. Statistical test results were considered statistically significant if α < 0.05 and marginal if 0.05 ≤ α ≤ 0.10. A “Y” indicates the differences were statistically significant; an “N” indicates that they were
FSIS Comparative Risk Assessment for Listeria monocytogenes in Ready-to-eat Meat and Poultry Deli Meats Report
58
not; an “M” indicates that the differences were marginally significant. The exact p values for the test result are given in parentheses below. 2 Deli meat samples were assumed independent for the purposes of the test of proportions. In practice, because multiple samples were collected from the same store, samples were not independent. Thus, the test of proportions is more likely to erroneously claim a statistically significant result than the choice of α would indicate. 3 A store was considered positive if at least one of the deli meat samples collected at the store was positive for L. monocytogenes. 4 All three explanatory variables were included simultaneously.
FSIS Comparative Risk Assessment for Listeria monocytogenes in Ready-to-eat Meat and Poultry Deli Meats Report
59
References American Meat Institute. 2001. Consumer Handling of RTE Meats. (Unpublished Data Submitted to Docket No. 99N-1168 as part of the FDA-FSIS Risk Assessment.) Cates, S.C., R.A. Morales, S.A. Karns, L.A. Jaykus, K.M. Kosa, T. Teneyck, C.M. Moore, P. Cowen. 2006. Consumer Knowledge, Storing, and Handling Practices Regarding Listeria in Frankfurters and Deli meats: Results of a Web-based Survey. Journal of Food Protection. 69(7):1630-39. CDC. 2007. Preliminary FoodNet Data on the Incidence of Infection with Pathogens Transmitted Commonly Through Food --- 10 States, 2006. Morbidity and Mortality Weekly Report 56(14):336-339. Draughon, A.F. 2006. A Collaborative Analysis/Risk assessment of Listeria monocytogenes in Ready-to-Eat Processed Meat and Poultry Collected in Four FoodNet States. Symposium S-16: Contamination of Ready-to-Eat Foods: Transfer and Risk: Listeria monocytogenes and Other Microorganisms. International Association for Food Protection 93rd Annual Meeting, Calgary, Alberta. August 13-16. Endrikat, S., D. Gallagher, R. Pouillot, H. Quesenberry, D. LaBarre, C. Schroeder, and J. Kause. 2010. A Comparative Risk Assessment for Listeria monocytogenes in Prepackaged versus Retail-Sliced Deli Meat. Journal of Food Protection, 73: 612-619 FDA-FSIS. 2003. Quantitative Assessment of Relative Risk to Public Health from Foodborne Listeria monocytogenes Among Selected Categories of Ready-to-Eat foods. Washington, DC. Available at: http://www.fda.gov/Food/ScienceResearch/ResearchAreas/RiskAssessmentSafetyAssessment/ucm183966.htm. FSIS. 2003. Risk Assessment for Listeria monocytogenes in Deli Meat. Washington, DC. Available at: http://www.fsis.usda.gov/PDF/Lm_Deli_Risk_Assess_Final_2003.pdf. Gombas, D.E., Y. Chen, R.S. Clavero, and V.N. Scott. 2003. Survey of Listeria monocytogenes in Ready-to-Eat Foods. Journal of Food Protection 66(4):559-69. Hintz, J. 2001. NCSS and Pass. Number Cruncher Statistical Systems. Kaysville, UT. Kosa, K.M., S.C. Cates, S. Karns, S.L. Godwin, and D. Chambers. 2007. Consumer Knowledge and Use of Open Dates: Results of a Web-based Survey. Journal of Food Protection. 70(5):1213-1219. Legan, J.D., D.L. Seman, A.L. Milkowski, J.A. Hirschey, and M.H. Vandeven. 2004. Modeling the Growth Boundary of Listeria monocytogenes in Ready-to-Eat cooked meat products as a Function of the Product Salt, Moisture, Potassium Lactate, and Sodium Diacetate Concentrations. Journal of Food Protection 67(20): 2195-2204
FSIS Comparative Risk Assessment for Listeria monocytogenes in Ready-to-eat Meat and Poultry Deli Meats Report
60
Lianou, A., and J.N. Sofos. 2007. A Review of the Incidence and Transmission of Listeria monocytogenes in Ready-to-Eat Products in Retail and Food Service Environments. Journal of Food Protection 70:2172-2198. Mead, P.S., L. Slutsker, V. Dietz, L.F. McCaig, J.S. Bresee, C. Shapiro, P.M. Griffin, and R. V. Tauxe. 1999. Food-Related Illness and Death in the United States. Emerging Infectious Disease, 5:607–625. Pouillot, R., M.B. Lubran, S.C. Cates, and S. Dennis. 2010. Estimating Parametric Distributions of Storage Time and Temperature of Ready-to-Eat Foods for U.S. Households. Journal of Food Protection 73(2): 312-321. Pradhan, A., R. Ivanek, Y. T. Grohn, I. Geornaras, J. N. Sofos and M. Wiedmann. 2009. Quantitative Risk Assessment for Listeria monocytogenes in Selected Categories of Deli Meats: Impact of Lactate and Diacetate, Journal of Food Protection 72:978-989.
R Development Core Team. R: A Language and Environment for Statistical Computing. R Foundation for Statistical Computing, Vienna, Austria. 2007. ISBN 3-900051-07-0. Available at: http://www.R-project.org. Van Belle, G. 2002. Statistical Rules of Thumb. Wiley-Interscience, New York.