A report submitted to the school of Engineering and Information Technology, Murdoch University in partial fulfilment of the Requirements for the degree of Bachelor of Engineering MURDOCH UNIVERSITY Final Internship Report 2013 Clint Armstrong 2/3/2014
Transcript
A report submitted to the school of Engineering and Information Technology, Murdoch University in partial fulfilment of the Requirements for the degree of Bachelor of Engineering
MURDOCH UNIVERSITY
Final Internship Report 2013 Clint Armstrong
2/3/2014
II
ABSTRACT WorleyParsons and Murdoch University have come to an agreement allowing one student the
opportunity in his/her final year of Instrumentation and Electrical Engineering to complete an
internship at the BP Kwinana Refinery, located in WA. This report demonstrates the work completed
and experience gained over the duration of the internship.
Background information is provided in this report to ensure that there is a substantial understanding
of the refinery’s processes and operation. This was required to complete the project work to a high
standard.
This report summarises all the major projects allocated during the time at the BP refinery. The
design, construction and commissioning stages of the project are discussed, detailing the
instrumentation roles of each. Projects will be covered in greater detail highlighting background
information, methods and procedures. The projects are listed below.
DCS Upgrade Phase 3 (HYDY2) project. This project is the upgrade of all obsolete control system
hardware on the hydrofiner unit. It is a multimillion dollar project that is estimated to be completed
May 2014.
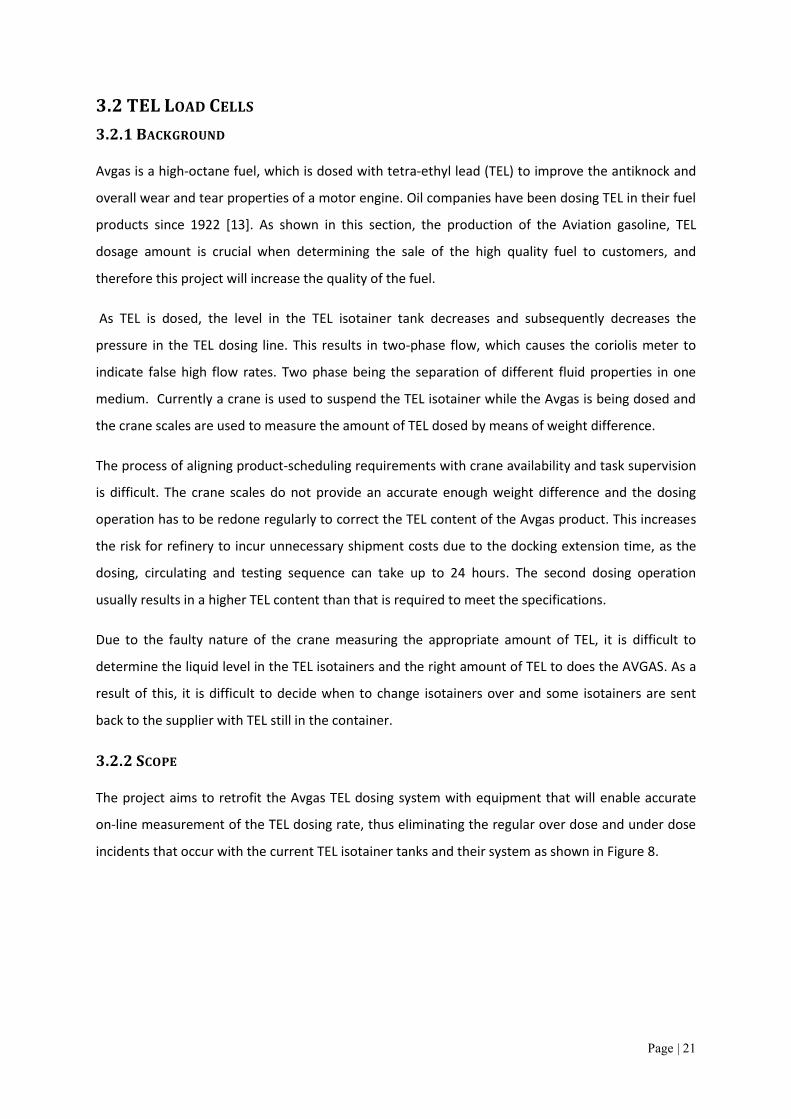
TEL Load Cells project. Aviation fuel is a high quality manufactured product that requires accurate
dosing amounts of tetra ethyl lead. This project involves the installation of new load cells that will
accurately measure the TEL dosed in the AVGAS, as apposed to the current inaccurate setup.
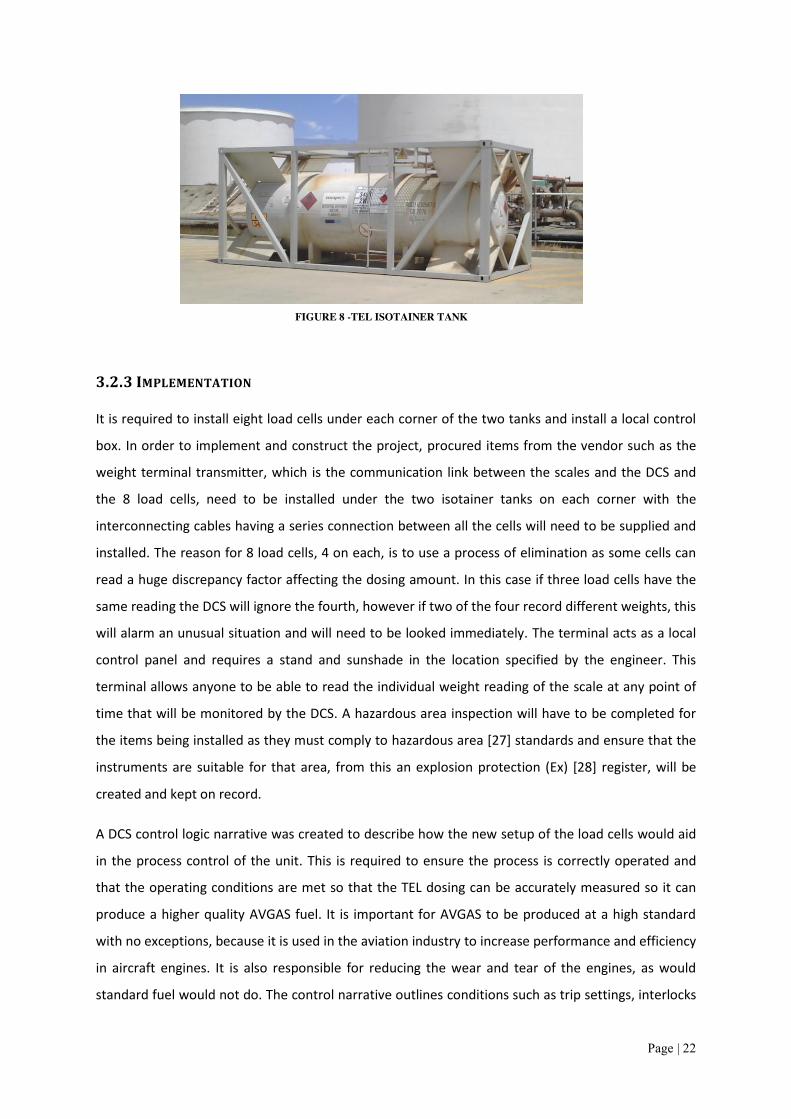
WWTP Flow Weighting Autosampler project. The waster water treatment plant at the refinery is
required to sample and purify the water in order to meet environmental standards as explained in
section 3.4. It is required to program the autosampler to take averaged flow samples every hour on
the hour. In order to implement such project, optimisation techniques were used to ensure that
these samples would meet the minimum requirements.
The program affords the opportunity to be exposed to industry projects. This permits the student to
demonstrate and applies his/her skills learnt at university by putting what is produced in an office
environment and executing the practical part of the project on site.
III
DISCLAIMER All of the work discussed in this report is the work of the author unless otherwise referenced.
I declare the following to be my own work, unless otherwise referenced, as defined by Murdoch
University’s policy on plagiarism.
Signed By Clint Armstrong: ……………………………………………….
December 2013
IV
ACKNOWLEDGEMENTS Foremost I would like to thank WorleyParsons and BP for providing the rare opportunity to complete
an internship with the Instrumentation and Electrical team at the Kwinana refinery. This internship
has provided first hand experience in instrumentation and electrical engineering projects.
Thank you to the Instrumentation and Electrical team at WorleyParsons for their patience,
enthusiasm and support. Special thanks to Mark Spiranovic who is the BP contract Manager and Paul
Copland who is the Instrumentation Manager for WA for making this internship possible. I would
also like to off my thanks to my industry supervisor Scott Russell for donating his time and effort to
ensure I received the best relevant experience and knowledge to contribute to my development as a
professional engineer.
I would also like to thank all the engineering staff at Murdoch University who has seen me develop
throughout the course of my degree. Very special thanks to Doctor Linh Vu for all her help and
support throughout the years of my degree and having faith in me and Dr Gareth Lee for mentoring
me through the internship. I also thank Associate Professor Graeme Cole and Professor Paris Bahri,
for providing the foundation to the School of Engineering and Information Technology at Murdoch.
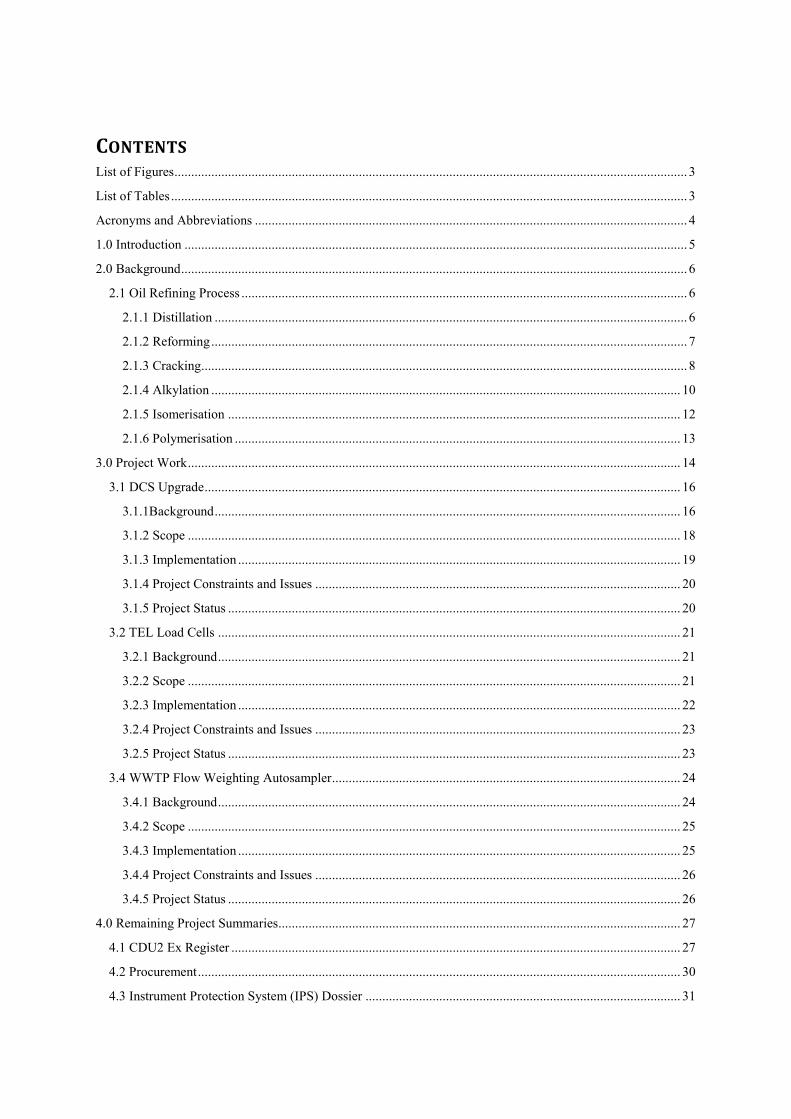
CONTENTS
List of Figures ......................................................................................................................................................... 3 List of Tables .......................................................................................................................................................... 3 Acronyms and Abbreviations ................................................................................................................................. 4 1.0 Introduction ...................................................................................................................................................... 5 2.0 Background ....................................................................................................................................................... 6
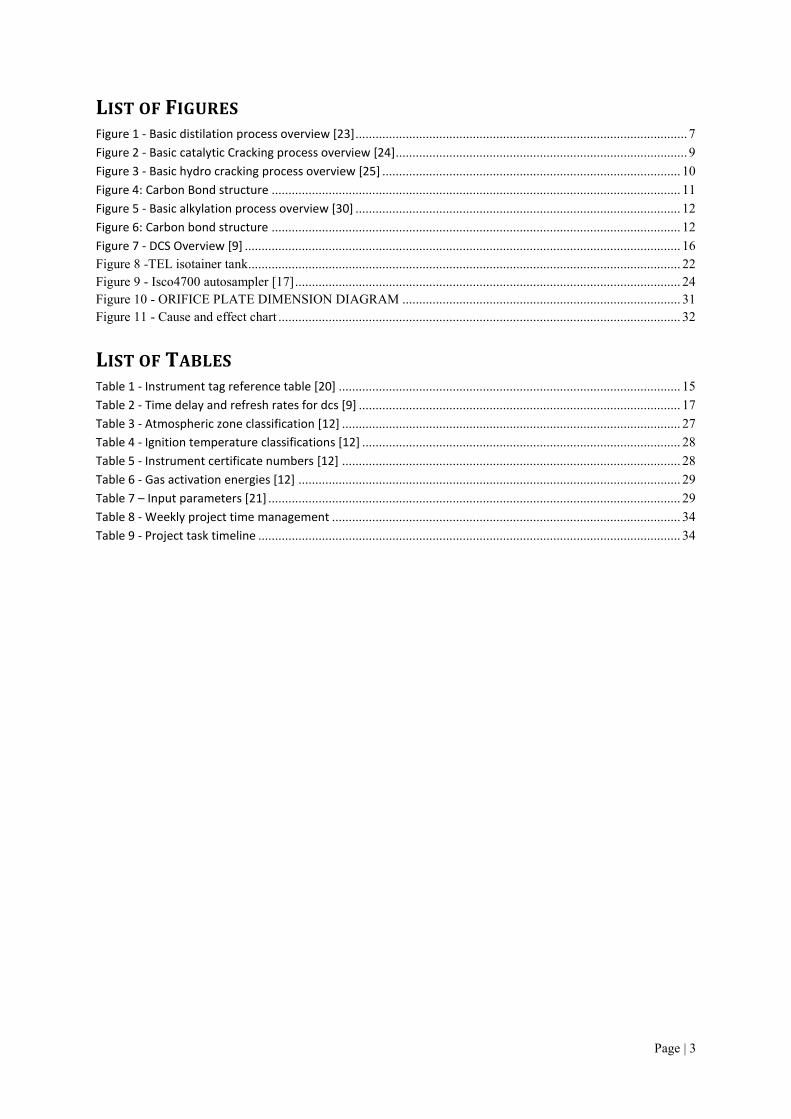
LIST OF FIGURES Figure 1 - Basic distilation process overview [23] ................................................................................................... 7 Figure 2 - Basic catalytic Cracking process overview [24] ....................................................................................... 9 Figure 3 - Basic hydro cracking process overview [25] ......................................................................................... 10 Figure 4: Carbon Bond structure .......................................................................................................................... 11 Figure 5 - Basic alkylation process overview [30] ................................................................................................. 12 Figure 6: Carbon bond structure .......................................................................................................................... 12 Figure 7 - DCS Overview [9] .................................................................................................................................. 16 Figure 8 -TEL isotainer tank................................................................................................................................. 22 Figure 9 - Isco4700 autosampler [17] ................................................................................................................... 24 Figure 10 - ORIFICE PLATE DIMENSION DIAGRAM ................................................................................... 31 Figure 11 - Cause and effect chart ........................................................................................................................ 32
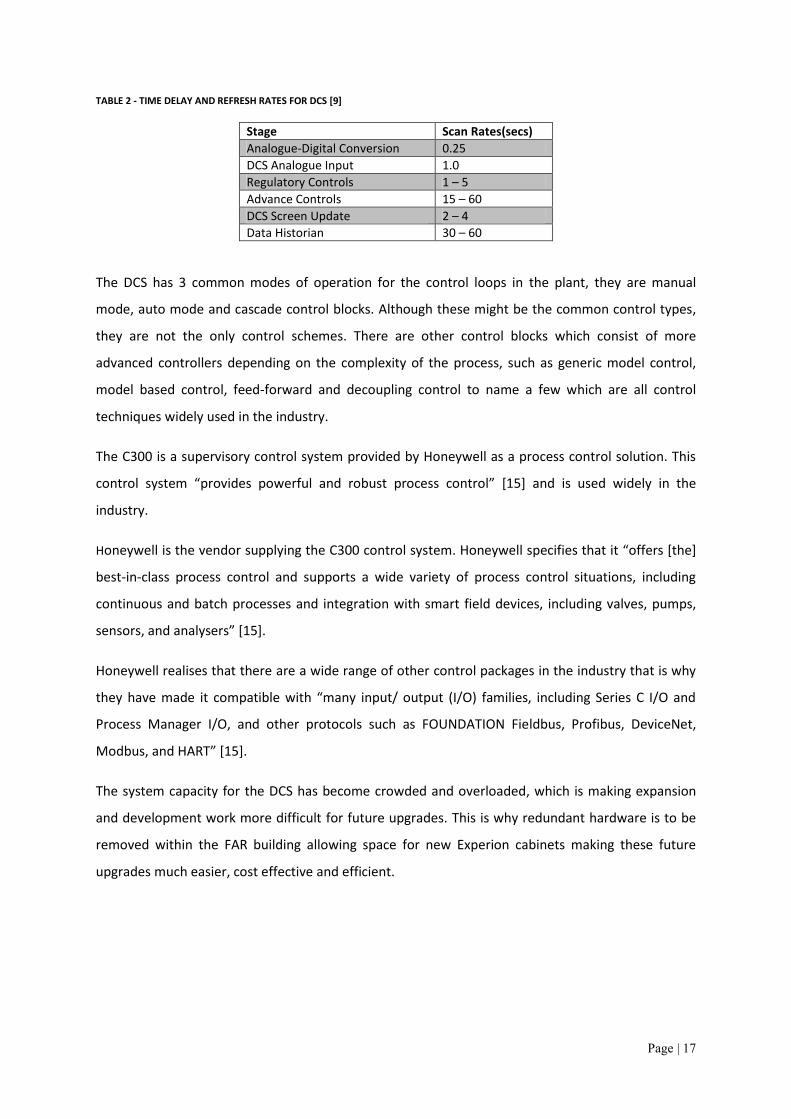
LIST OF TABLES Table 1 - Instrument tag reference table [20] ...................................................................................................... 15 Table 2 - Time delay and refresh rates for dcs [9] ................................................................................................ 17 Table 3 - Atmospheric zone classification [12] ..................................................................................................... 27 Table 4 - Ignition temperature classifications [12] ............................................................................................... 28 Table 5 - Instrument certificate numbers [12] ..................................................................................................... 28 Table 6 - Gas activation energies [12] .................................................................................................................. 29 Table 7 – Input parameters [21] ........................................................................................................................... 29 Table 8 - Weekly project time management ........................................................................................................ 34 Table 9 - Project task timeline .............................................................................................................................. 34
Page | 4
ACRONYMS AND ABBREVIATIONS BP British Petroleum AIP Australian Institute of Petroleum ALKY Alkylation AVGAS Aviation Gasoline CCB Central Control Building CDU2 Crudes Distillation Unit 2 Cold Cut-over To completely replace control system DCS Distributed Control System DEC Department of Environment and Conservation DIB Deisobutaniser Ex Explosion Protected FAR Field Auxiliary Room FTA Field Termination Assembly HCO Heavy Cycle Oils HF Hydrogen Fluoride HI-WAY Control Communication Network HMI Human Machine Interface Hot Cut-over To simultaneously run old with new control system HPM High Performance Manager HYD2 Hydrofiner 2 IPS Instrument Protection System IS Intrinsically Safe LCO Light Cycle Oils LPG Liquid Petroleum Gas MIT Minimum Ignition Temperature RCU Residual Cracking Unit SDOOL Sepia Depression Ocean Outfall Line TAR Turnaround TEL Tetra Ethyl Lead WP Worley Parsons WWTP Waste Water Treatment Plant
Page | 5
1.0 INTRODUCTION The BP Kwinana refinery was first opened in 1955 and is located 30 kilometres south of Perth,
Western Australia. The Kwinana refinery is Australia’s largest oil refinery, producing 140,000 barrels
of oil a day with a workforce of almost 400 people [1]. It is Western Australia’s only refinery,
producing its petrol, diesel and jet fuel supplying the main operators in WA. The BP Kwinana refinery
is currently preparing for a multimillion dollar scheduled shutdown. This is a sign that the refinery is
here to stay in operation under BP indefinitely, since they will be spending money on maintenance
and upgrades. Australia’s high operating costs are often quoted as the reason refining margins or
profit margins are low. As a result the companies are currently considering a sale or conversion into
fuel import terminals [14].
Oil refining is a very complex process in the oil and gas industry with a small profit margin. This is
why there are very few small refineries around the world as it has proven to be more profitable with
higher barrel volumes. It is said “refineries need a production capacity of at least 200,000 barrels per
day (bpd) in order to reach the minimum efficient scale”[16]. With high volumes of fuel produced
sophisticated technology is needed to supply the industry with its needs. Therefore, instrumentation
and control teams continuously work on upgrades, monitoring and maintenance to ensure the
refinery runs safely and efficiently while being cost effective. This report will cover the projects that
have been completed or are undergoing construction by the Instrumentation and Electrical team,
detailing the background, scope and implementation of the work done.
Page | 6
2.0 BACKGROUND As a new employee to BP it is required that all staff have a substantial understanding of the
background information of the oil and gas refining processes, operations and control systems in
order to complete the work with full competency.
Therefore this section of the report will provide a brief description of each of the particular
processes throughout the refinery and the purpose that they serve. This enables a new employee to
the refinery to gain an understanding on a broad spectrum of the units and the projects to be
covered to ensure that engineering is completed to its utmost quality.
2.1 OIL REFINING PROCESS
The oil goes through three major stages: separation, conversion and purification. These processes
are divided into several other stages in the production of petrol, aviation fuel (AVGAS), liquid
petroleum gas (LPG), lubricant oils and diesel [7].
2.1.1 DISTILLATION
The objective for a distillation unit is to separate the feed stream into light-component and heavy-
component product streams.
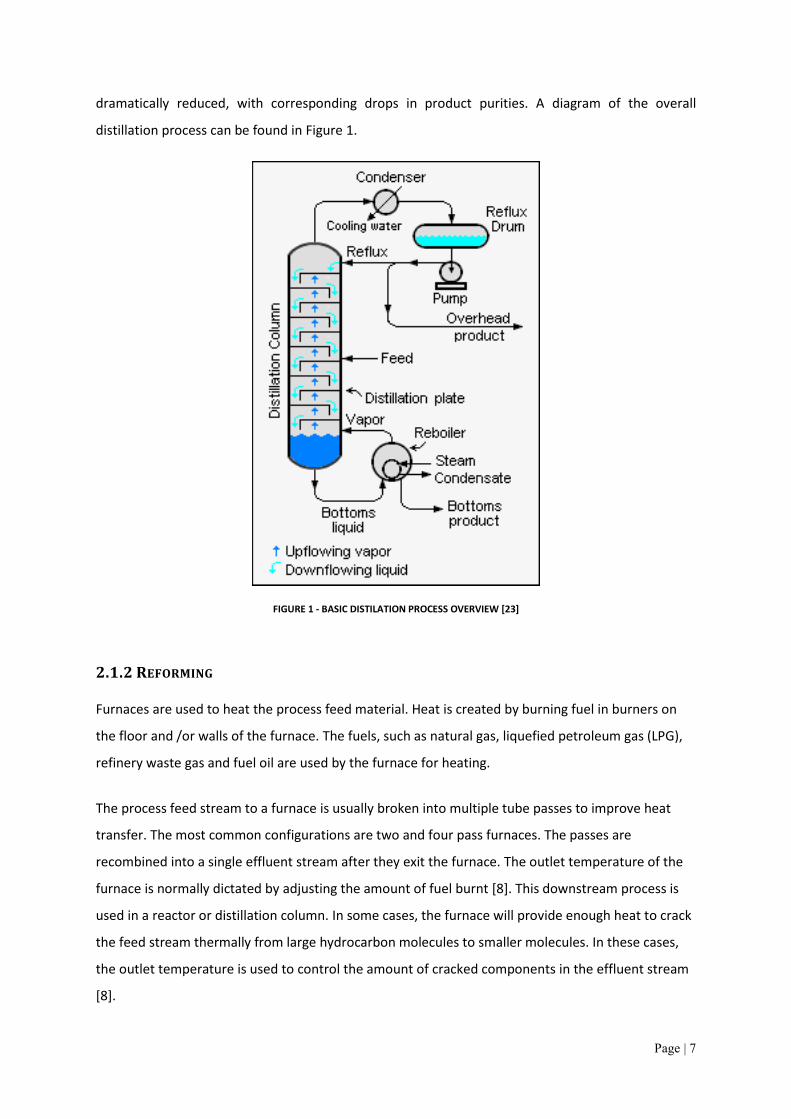
The distillation process relies on the relative volatility between the components that make up the
feed stream. These consist of high volatility (lighter) components, which boil at a lower temperature
than will the low-volatility (heavier) components. Therefore, when heat is added to the column
through a bottom reboiler, the lighter materials are vaporized and will rise to the top of the column
where the overhead vapors are cooled until they condense and become liquid again.
The efficiency of the distillation depends on the amount of contact between the vaporising and the
liquid falling down through the column. As a result some of the overhead liquid product is sent back
which is also known as refluxed, to the top of the column. Increasing the reflux will improve the
purity of the overhead product. However, it also requires more heat from the re-boiler to re-
vaporize the lighter components in the reflux stream to ensure further purification. The basic
operation of a distillation column comes down to the balancing of two elements, for example the
product purity and energy use to complete the distillation process [7].
If the amount of vapor and liquid traveling through the column become too great, the column can
flood [6]. Other problems include reflux flow or too much re-boil heat. This results in too much vapor
and also can cause flooding. When flooding occurs, the efficiency of the distillation column is
Page | 7
dramatically reduced, with corresponding drops in product purities. A diagram of the overall
distillation process can be found in Figure 1.
FIGURE 1 - BASIC DISTILATION PROCESS OVERVIEW [23]
2.1.2 REFORMING
Furnaces are used to heat the process feed material. Heat is created by burning fuel in burners on
the floor and /or walls of the furnace. The fuels, such as natural gas, liquefied petroleum gas (LPG),
refinery waste gas and fuel oil are used by the furnace for heating.
The process feed stream to a furnace is usually broken into multiple tube passes to improve heat
transfer. The most common configurations are two and four pass furnaces. The passes are
recombined into a single effluent stream after they exit the furnace. The outlet temperature of the
furnace is normally dictated by adjusting the amount of fuel burnt [8]. This downstream process is
used in a reactor or distillation column. In some cases, the furnace will provide enough heat to crack
the feed stream thermally from large hydrocarbon molecules to smaller molecules. In these cases,
the outlet temperature is used to control the amount of cracked components in the effluent stream
[8].
Page | 8
2.1.3 CRACKING
The cracking process is an important process in oil refining where the breakdown of heavier
hydrocarbon molecules with high boiling points creates lighter products such as petrol and diesel.
These processes are split between catalytic cracking and hydrocracking, both processes will be
explained below in further detail [8].
Catalytic cracking is the process of cracking heavy feedstocks such as gas oils, vacuum gas oils, and
residual material into gasoline. The cracked components are produced by selective reactions in a
fluidized catalyst bed in the presence of heat, which in turn aids in the process of producing the
relative fuels.
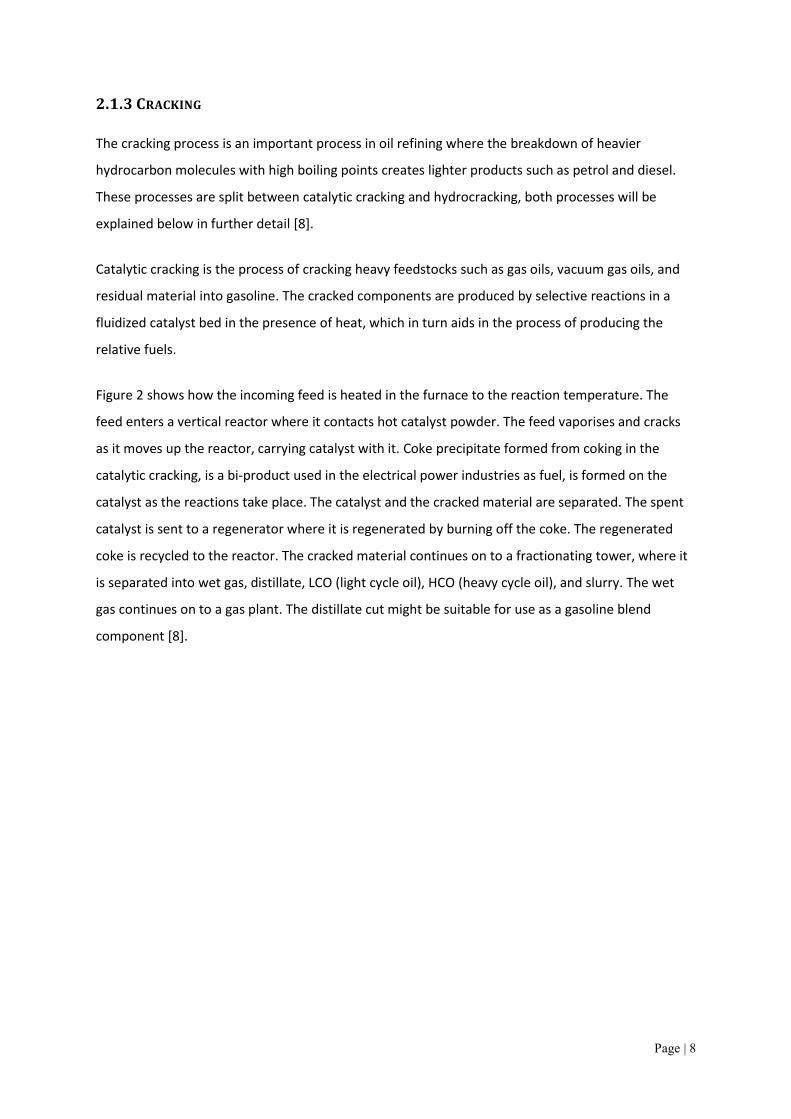
Figure 2 shows how the incoming feed is heated in the furnace to the reaction temperature. The
feed enters a vertical reactor where it contacts hot catalyst powder. The feed vaporises and cracks
as it moves up the reactor, carrying catalyst with it. Coke precipitate formed from coking in the
catalytic cracking, is a bi-product used in the electrical power industries as fuel, is formed on the
catalyst as the reactions take place. The catalyst and the cracked material are separated. The spent
catalyst is sent to a regenerator where it is regenerated by burning off the coke. The regenerated
coke is recycled to the reactor. The cracked material continues on to a fractionating tower, where it
is separated into wet gas, distillate, LCO (light cycle oil), HCO (heavy cycle oil), and slurry. The wet
gas continues on to a gas plant. The distillate cut might be suitable for use as a gasoline blend
component [8].
Page | 9
FIGURE 2 - BASIC CATALYTIC CRACKING PROCESS OVERVIEW [24]
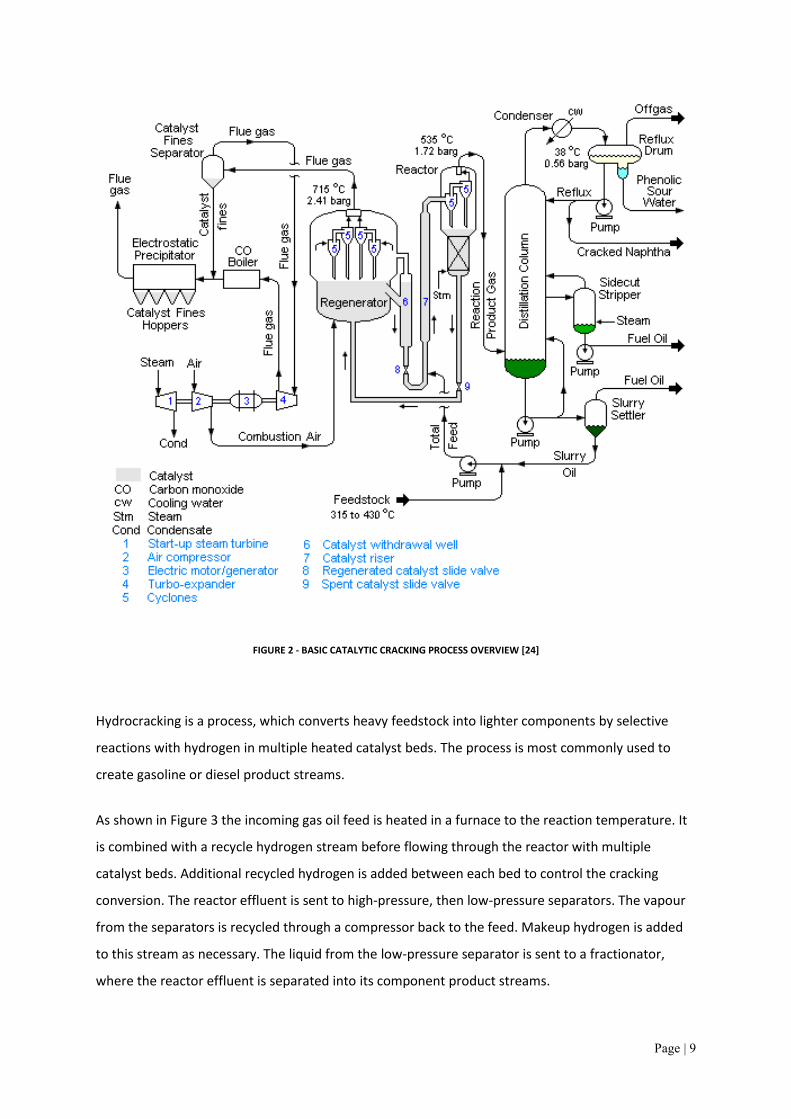
Hydrocracking is a process, which converts heavy feedstock into lighter components by selective
reactions with hydrogen in multiple heated catalyst beds. The process is most commonly used to
create gasoline or diesel product streams.
As shown in Figure 3 the incoming gas oil feed is heated in a furnace to the reaction temperature. It
is combined with a recycle hydrogen stream before flowing through the reactor with multiple
catalyst beds. Additional recycled hydrogen is added between each bed to control the cracking
conversion. The reactor effluent is sent to high-pressure, then low-pressure separators. The vapour
from the separators is recycled through a compressor back to the feed. Makeup hydrogen is added
to this stream as necessary. The liquid from the low-pressure separator is sent to a fractionator,
where the reactor effluent is separated into its component product streams.
Page | 10
FIGURE 3 - BASIC HYDRO CRACKING PROCESS OVERVIEW [25]
2.1.4 ALKYLATION
The Alkylation unit is used to convert light olefins, usually propylene or butylene, produced by a
cracking unit or delayed coker unit into a gasoline blending component called alkylate. Alkylate is
one of more valuable blending components for gasoline because it has a high octane rating coupled
with a low Reid vapor pressure which is “a common measure of the volatility of gasoline”[18].
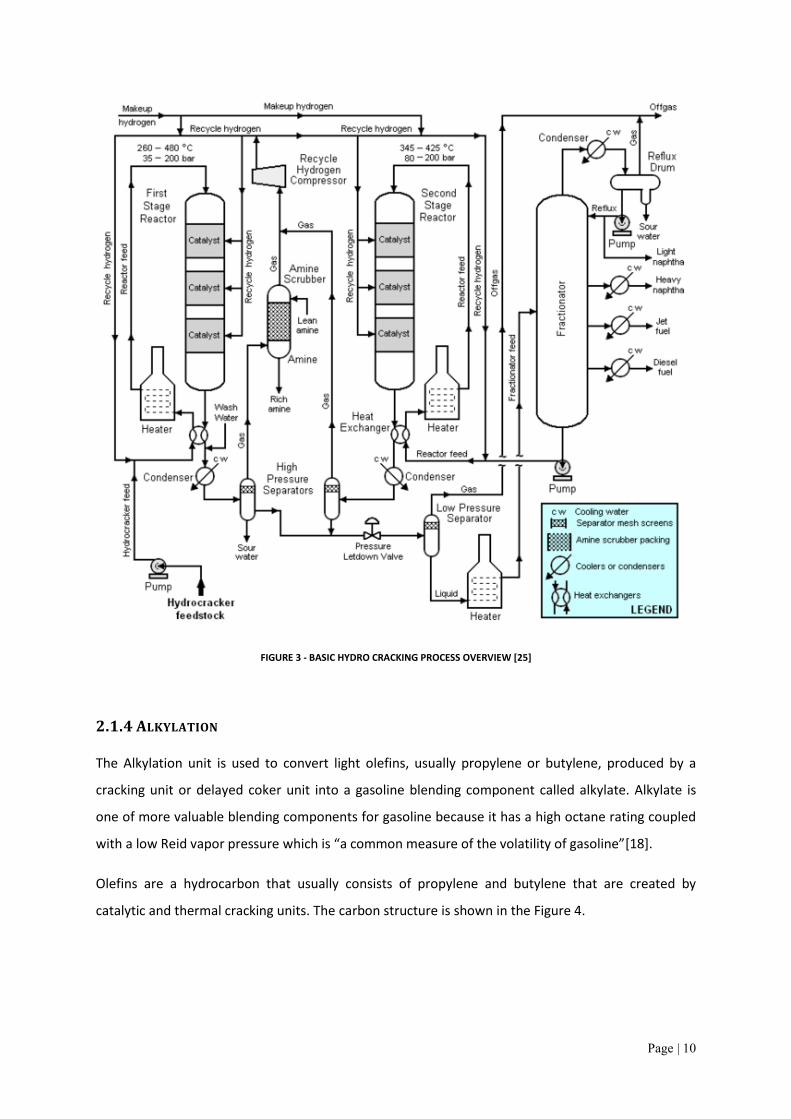
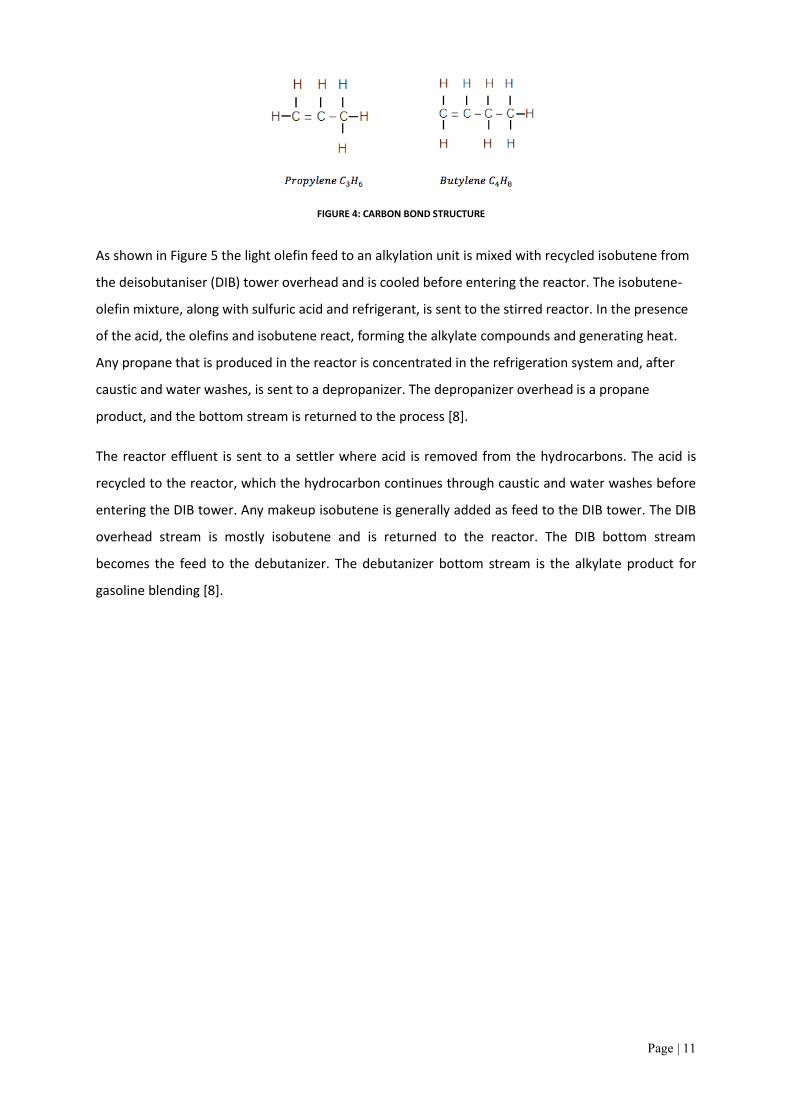
Olefins are a hydrocarbon that usually consists of propylene and butylene that are created by
catalytic and thermal cracking units. The carbon structure is shown in the Figure 4.
Page | 11
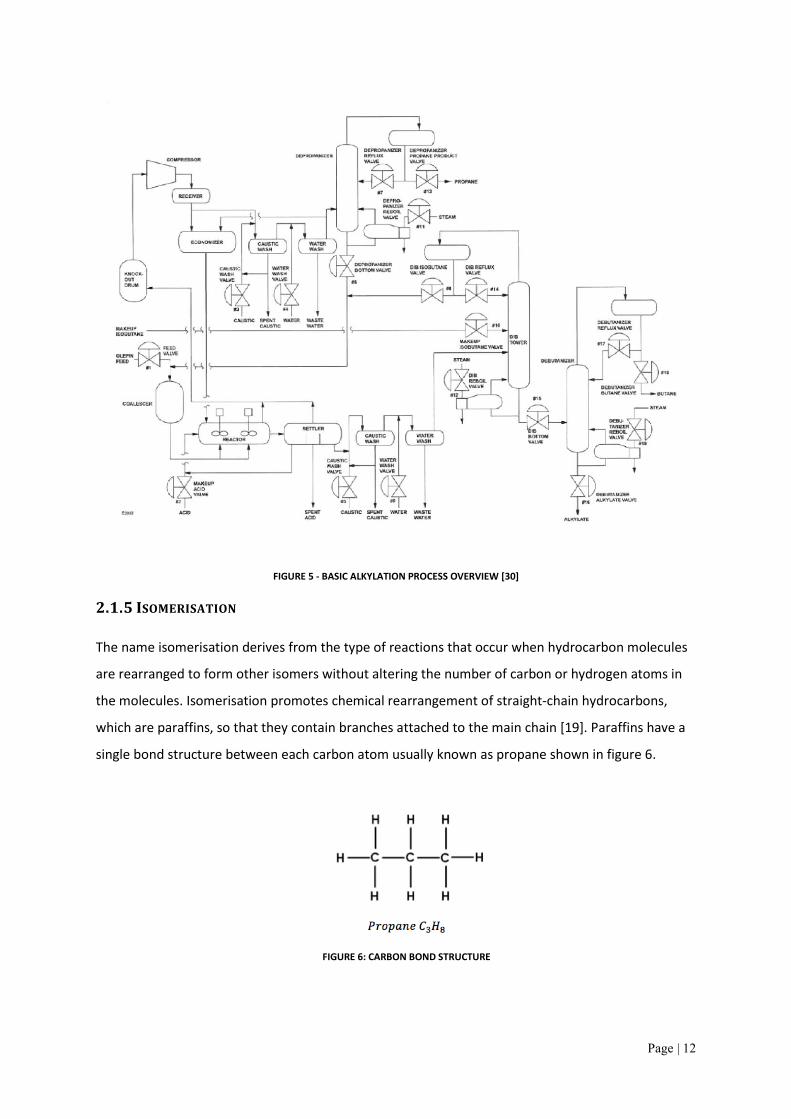
As shown in Figure 5 the light olefin feed to an alkylation unit is mixed with recycled isobutene from
the deisobutaniser (DIB) tower overhead and is cooled before entering the reactor. The isobutene-
olefin mixture, along with sulfuric acid and refrigerant, is sent to the stirred reactor. In the presence
of the acid, the olefins and isobutene react, forming the alkylate compounds and generating heat.
Any propane that is produced in the reactor is concentrated in the refrigeration system and, after
caustic and water washes, is sent to a depropanizer. The depropanizer overhead is a propane
product, and the bottom stream is returned to the process [8].
The reactor effluent is sent to a settler where acid is removed from the hydrocarbons. The acid is
recycled to the reactor, which the hydrocarbon continues through caustic and water washes before
entering the DIB tower. Any makeup isobutene is generally added as feed to the DIB tower. The DIB
overhead stream is mostly isobutene and is returned to the reactor. The DIB bottom stream
becomes the feed to the debutanizer. The debutanizer bottom stream is the alkylate product for
gasoline blending [8].
FIGURE 4: CARBON BOND STRUCTURE
Page | 12
FIGURE 5 - BASIC ALKYLATION PROCESS OVERVIEW [30]
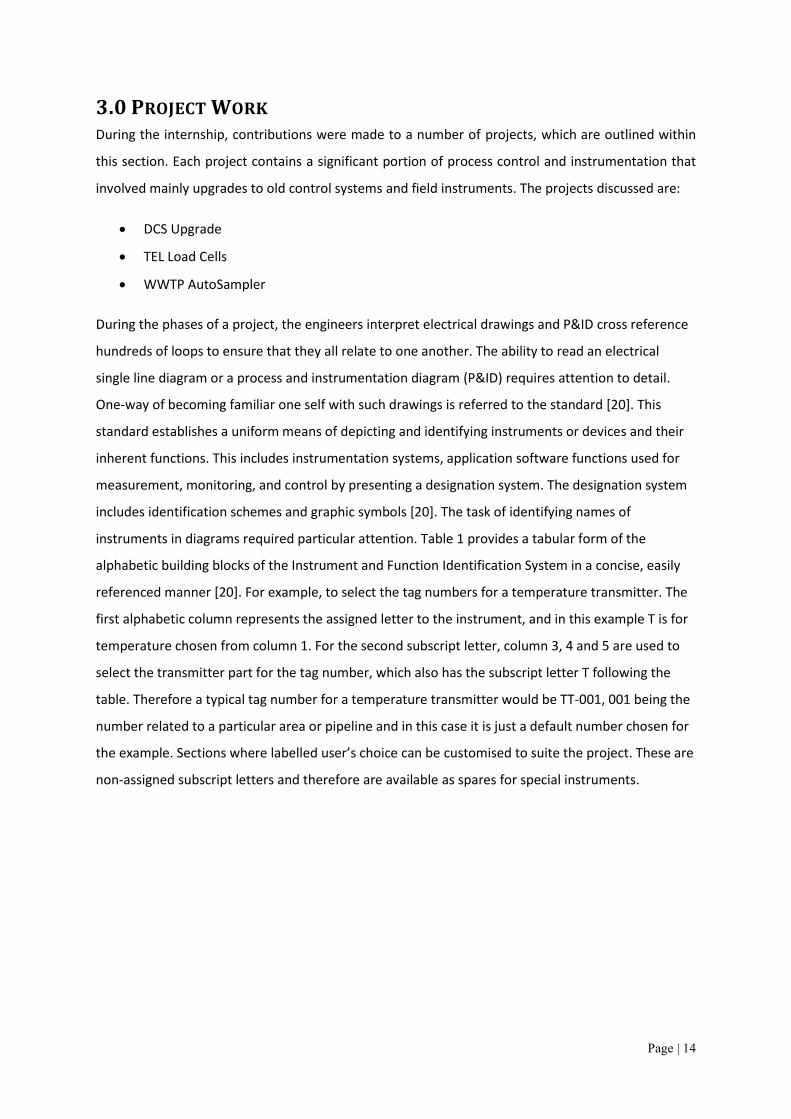
2.1.5 ISOMERISATION
The name isomerisation derives from the type of reactions that occur when hydrocarbon molecules
are rearranged to form other isomers without altering the number of carbon or hydrogen atoms in
the molecules. Isomerisation promotes chemical rearrangement of straight-chain hydrocarbons,
which are paraffins, so that they contain branches attached to the main chain [19]. Paraffins have a
single bond structure between each carbon atom usually known as propane shown in figure 6.
FIGURE 6: CARBON BOND STRUCTURE
Page | 13
This is done for two reasons; they create extra isobutane feed for alkylation and they improve the
octane of straight run pentanes and hexanes and hence make them into better petrol blending
components. Isomerisation is achieved by mixing normal butane with a little hydrogen and chloride
gas. This allows it to react in the presence of a catalyst to form isobutane and a small amount of
normal butane and some lighter gases. The products are separated in a fractionator and the lighter
gases are used as refinery fuel and the butane is recycled as feed [8].
2.1.6 POLYMERISATION
Under pressure and temperature, over an acidic catalyst, light unsaturated hydrocarbon molecules
react and combine with each other to form larger hydrocarbon molecules. Such process can be used
to react butenes with iso-butane to obtain a high octane olefinic petrol blending component called
polymer gasoline.
Page | 14
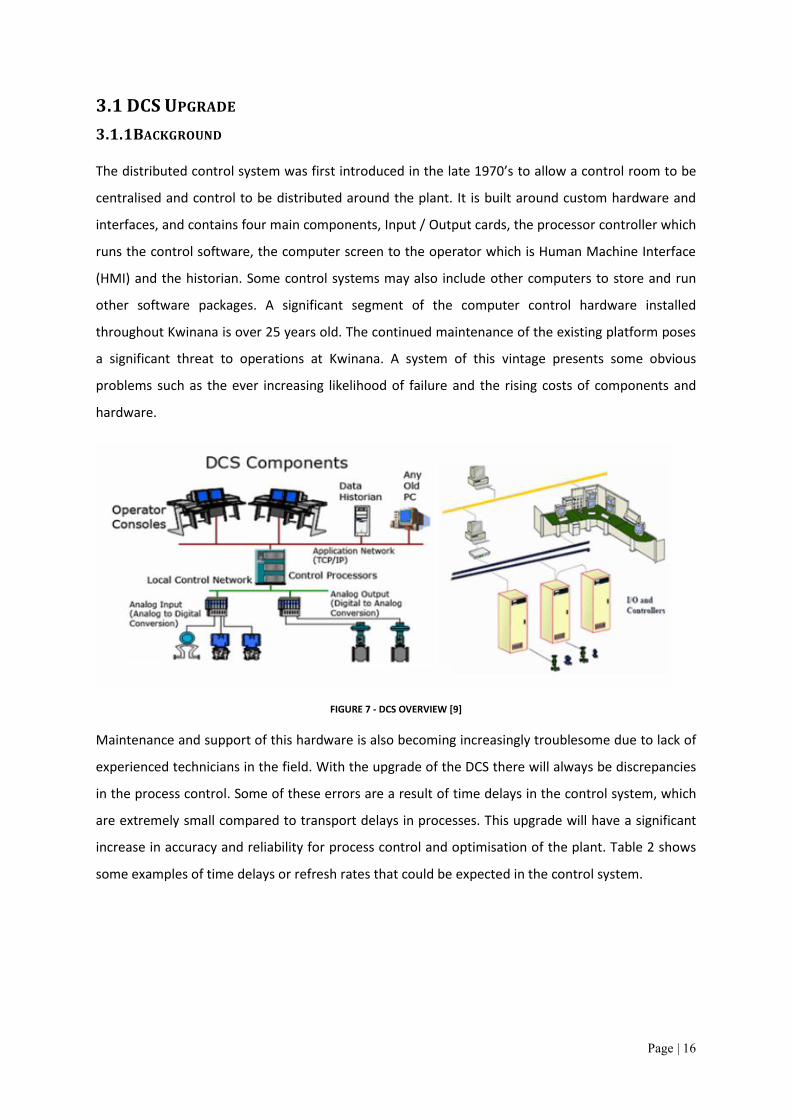
3.0 PROJECT WORK During the internship, contributions were made to a number of projects, which are outlined within
this section. Each project contains a significant portion of process control and instrumentation that
involved mainly upgrades to old control systems and field instruments. The projects discussed are:
x DCS Upgrade
x TEL Load Cells
x WWTP AutoSampler
During the phases of a project, the engineers interpret electrical drawings and P&ID cross reference
hundreds of loops to ensure that they all relate to one another. The ability to read an electrical
single line diagram or a process and instrumentation diagram (P&ID) requires attention to detail.
One-way of becoming familiar one self with such drawings is referred to the standard [20]. This
standard establishes a uniform means of depicting and identifying instruments or devices and their
inherent functions. This includes instrumentation systems, application software functions used for
measurement, monitoring, and control by presenting a designation system. The designation system
includes identification schemes and graphic symbols [20]. The task of identifying names of
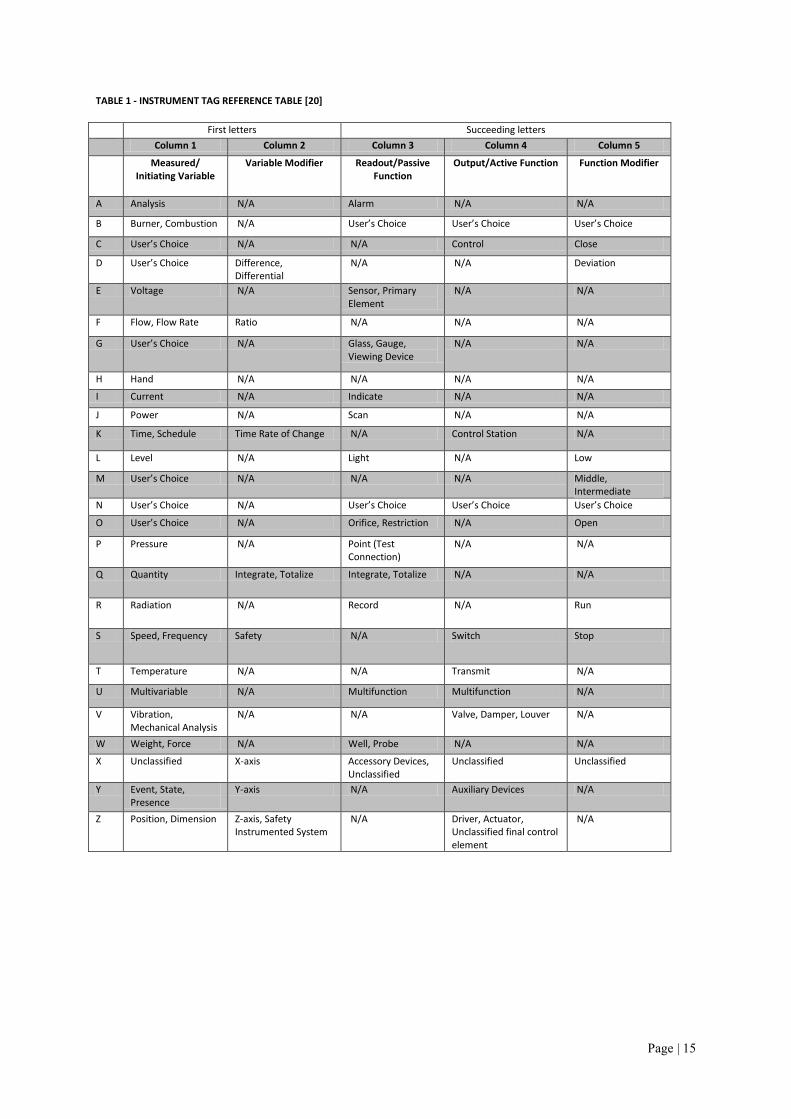
instruments in diagrams required particular attention. Table 1 provides a tabular form of the
alphabetic building blocks of the Instrument and Function Identification System in a concise, easily
referenced manner [20]. For example, to select the tag numbers for a temperature transmitter. The
first alphabetic column represents the assigned letter to the instrument, and in this example T is for
temperature chosen from column 1. For the second subscript letter, column 3, 4 and 5 are used to
select the transmitter part for the tag number, which also has the subscript letter T following the
table. Therefore a typical tag number for a temperature transmitter would be TT-001, 001 being the
number related to a particular area or pipeline and in this case it is just a default number chosen for
the example. Sections where labelled user’s choice can be customised to suite the project. These are
non-assigned subscript letters and therefore are available as spares for special instruments.
Based on the classifications shown in Table 4, the task at hand was to locate 200 existing
instruments in the field on the Crudes Distillation Unit. Once this was achieved, records were made
as to what zone and temperature class the instrument fell under. Once these details had been
identified, it must comply with the Australian and European standard for ignition classification. The
certificate numbers are stamped on the instruments and must be recorded in the register as shown
in Table 5. This is because the standard could change in the future and the instrument may no longer
complie with the new standards, and therefore must be replaced. This certificate number proves if
the instrument is an I.S. instrument. Ignition certificate numbers are as follows:
TABLE 5 - INSTRUMENT CERTIFICATE NUMBERS [12]
Certificate Number Classification Ex e Increased Safety Ex n Non-Sparking Ex ia Intrinsic Safety 2 fault tolerant Ex ib Intrinsic Safety 1 fault tolerant Ex iaD Intrinsic Safety 2 fault tolerant Ex ibD Intrinsic Safety 1 fault tolerant Ex v Ventilation (Heat Dissipation)
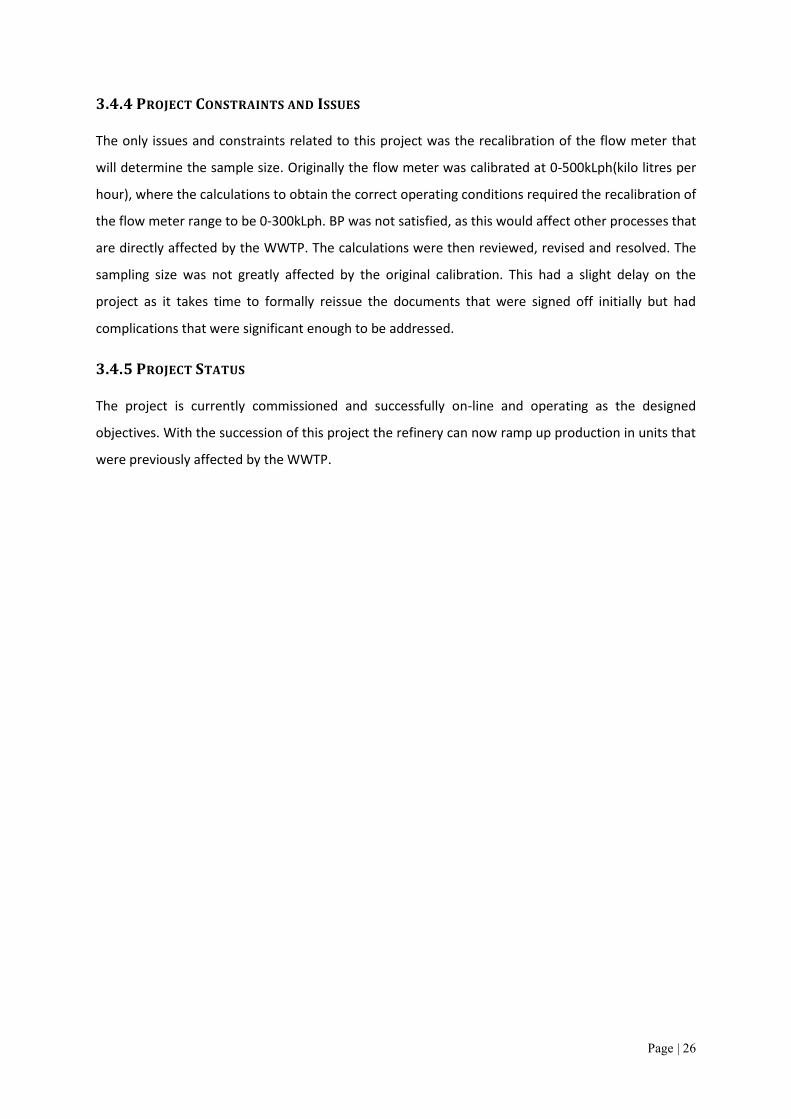
The spark ignition energy is the required energy it takes to cause a spark, which will in turn cause a
fire or explosion. It is an important classification because it details the minimum energy required for
an ignition source to cause an explosion. Table 6 shows the group classification identified on an
instrument nameplate describing the energy requirements for the spark potential.
Page | 29
TABLE 6 - GAS ACTIVATION ENERGIES [12]
Group Class Gas Type Spark Ignition Energy (micro joules) IIA Propane 180PJ IIB Ethylene 60PJ IIC Hydrogen 20PJ
Once the required fields were filled, the next step was to do the cable calculations to determine if
the limiting current from the I.S barrier will be sufficient to supply the instrument with a strong
enough signal. This is done by determining the length of the cable from the barrier within the FAR to
the instrument in the field. The capacitance, voltage and inductance of that particular instrument
are then used to calculate the minimum requirements for each instrument to meet. Once the
calculations are done, it is then clear to the engineer to see if the instrument will fail or pass the
standard of I.S equipment in a hazardous area.
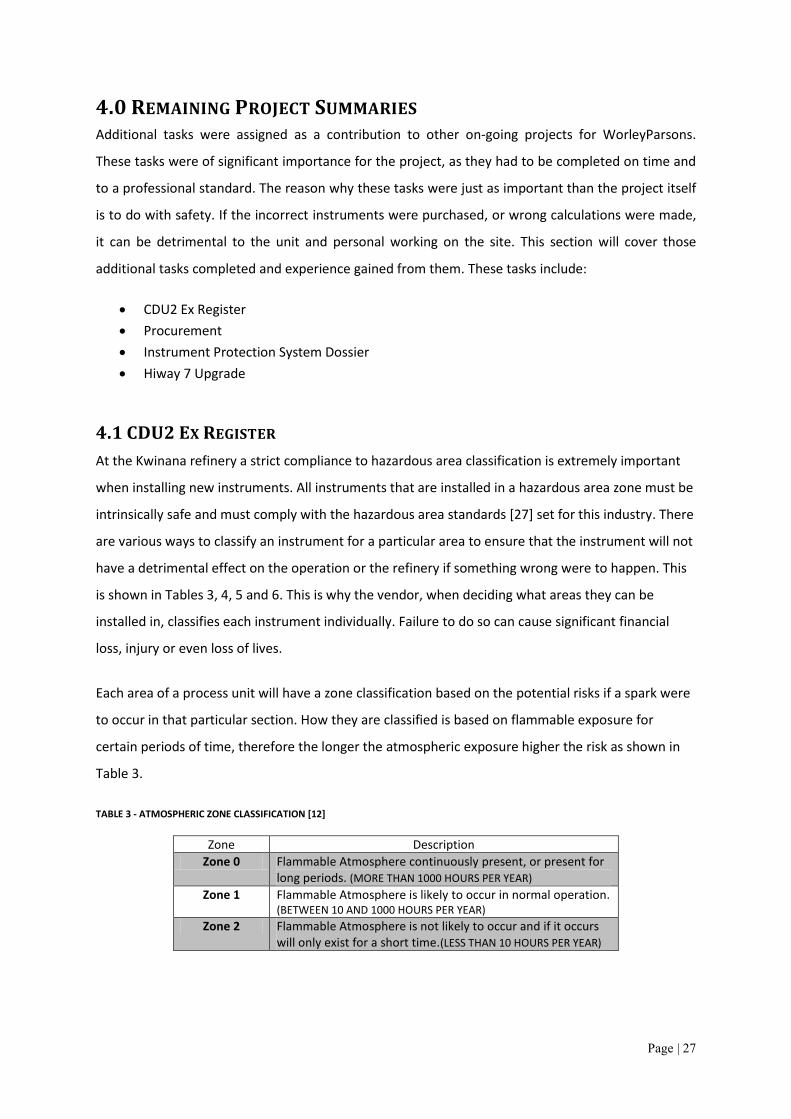
Once the gas group class, zone class and temperature class have been established, it is then required
to produce the cable calculations for each individual instrument. The calculations determine if the
instrument will pass the minimum requirement for voltage through the cable. These calculations
confirm that it will be safe to use the instrument in that area by maintaining a sufficient voltage
signal and supply to the device for operation. Some specific information about the electrical inputs
and outputs is required from the vendor to complete such calculation as shown in Table 7. These
values are for a Rosemount 3144P temperature transmitter. The subscript ‘i’ represents the initial
parameters of that particular unit of measure.
TABLE 7 – INPUT PARAMETERS [21]
Power/Loop Sensor
Ui = 30V Uo = 13.6V
Ii = 300mA Io = 56mA
Pi = 1.0W Po = 190mW
Ci = 5nF Ci = 78nF
Li = 0 Li = 0
As this document is important to the installation of new intrinsically safe instruments, it is also to
keep a record of existing instruments up to date as standards can change and the refinery is aware
of the certified instruments out in the field. In the event of a fire or explosion, the first thing the
investigating authorities will look at is the Ex registers to see if there were any non-IS instruments in
the hazardous area that were not certified. Companies become exposed to new litigation claims.
Page | 30
4.2 PROCUREMENT Procurement is the purchasing of items for a project. It is an important part of a project as it is a
huge cost and has potential to throw a project over budget if not managed properly. Some
instruments can cost up to several hundred thousand dollars, whereas the instruments explained in
this section were all a manageable amount for an intern.
When purchasing an instrument, communication between all disciplines is necessary. A datasheet is
created with a list of basic information of the instruments that are mostly capable of achieving the
desired objectives. The datasheet requires an engineering mark-up defining the process conditions
to realise if the selected instrument is suitable within those conditions. These conditions consist of,
temperature, pressure, flow rate, fluid state and fluid type. The next step is to liaise with the
mechanical and piping engineers to see if the instrument will line up and fit perfectly within the
process line. This is usually to do with flange connections, direct tapings or sometimes complete new
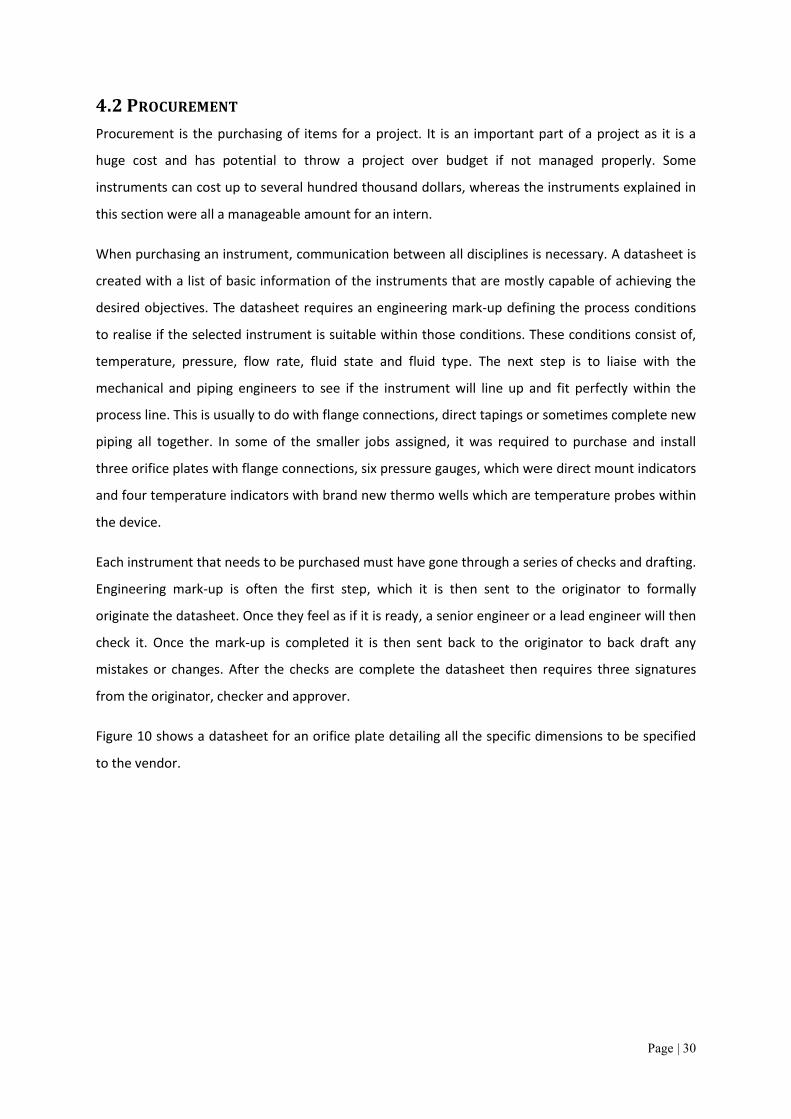
piping all together. In some of the smaller jobs assigned, it was required to purchase and install
three orifice plates with flange connections, six pressure gauges, which were direct mount indicators
and four temperature indicators with brand new thermo wells which are temperature probes within
the device.
Each instrument that needs to be purchased must have gone through a series of checks and drafting.
Engineering mark-up is often the first step, which it is then sent to the originator to formally
originate the datasheet. Once they feel as if it is ready, a senior engineer or a lead engineer will then
check it. Once the mark-up is completed it is then sent back to the originator to back draft any
mistakes or changes. After the checks are complete the datasheet then requires three signatures
from the originator, checker and approver.
Figure 10 shows a datasheet for an orifice plate detailing all the specific dimensions to be specified
to the vendor.
Page | 31
4.3 INSTRUMENT PROTECTION SYSTEM (IPS) DOSSIER An IPS dossier is produced for use by the Maintenance and Engineering team at Kwinana who carry
out tests to facilitate periodic on-line testing and testing during plant shutdown, normally following
overhaul of the equipment. The IPS must be fully tested during every unit overhaul along with all
field devices, which should require calibration before inspecting logic systems and final control
elements [22].
It is not considered necessary to carry out a full overhaul and calibration if the unit is taken off-line
before a six-month time period has elapsed from start-up after overhaul unless, during that outage,
the IPS has been modified or disturbed. The exception to this would be if the unit were left
shutdown for production reasons for more than one month [22]
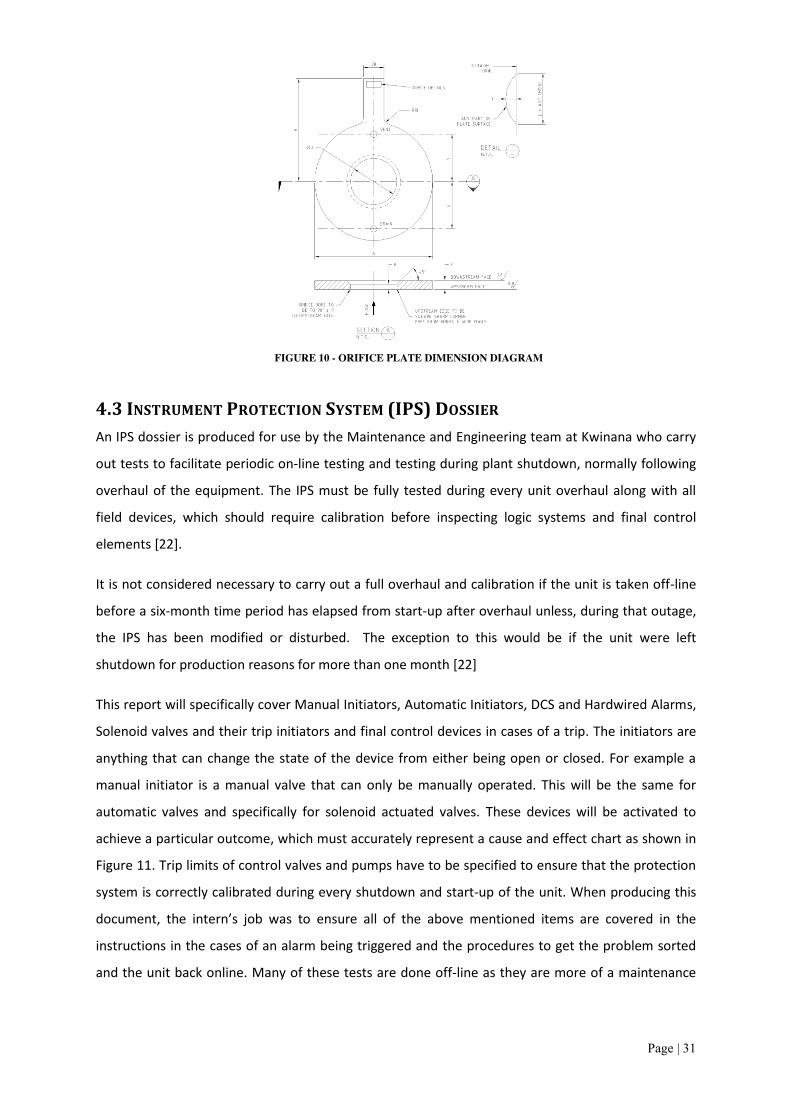
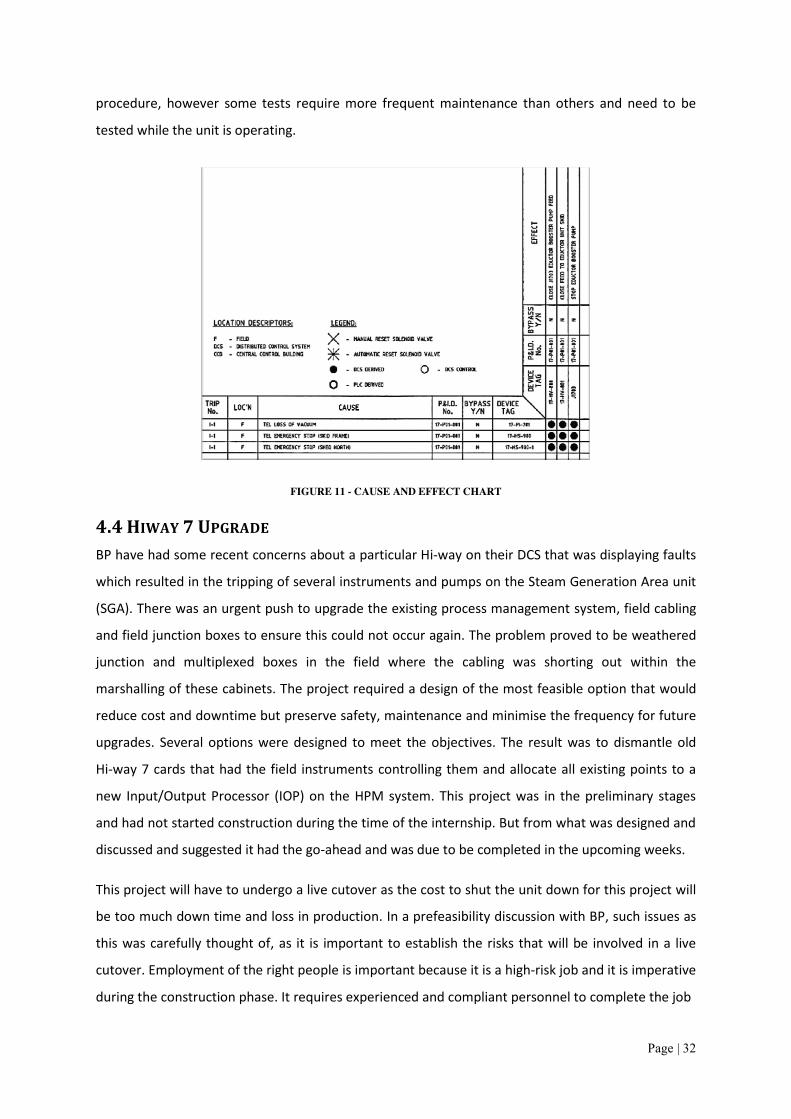
This report will specifically cover Manual Initiators, Automatic Initiators, DCS and Hardwired Alarms,
Solenoid valves and their trip initiators and final control devices in cases of a trip. The initiators are
anything that can change the state of the device from either being open or closed. For example a
manual initiator is a manual valve that can only be manually operated. This will be the same for
automatic valves and specifically for solenoid actuated valves. These devices will be activated to
achieve a particular outcome, which must accurately represent a cause and effect chart as shown in
Figure 11. Trip limits of control valves and pumps have to be specified to ensure that the protection
system is correctly calibrated during every shutdown and start-up of the unit. When producing this
document, the intern’s job was to ensure all of the above mentioned items are covered in the
instructions in the cases of an alarm being triggered and the procedures to get the problem sorted
and the unit back online. Many of these tests are done off-line as they are more of a maintenance
FIGURE 10 - ORIFICE PLATE DIMENSION DIAGRAM
Page | 32
procedure, however some tests require more frequent maintenance than others and need to be
tested while the unit is operating.
FIGURE 11 - CAUSE AND EFFECT CHART
4.4 HIWAY 7 UPGRADE BP have had some recent concerns about a particular Hi-way on their DCS that was displaying faults
which resulted in the tripping of several instruments and pumps on the Steam Generation Area unit
(SGA). There was an urgent push to upgrade the existing process management system, field cabling
and field junction boxes to ensure this could not occur again. The problem proved to be weathered
junction and multiplexed boxes in the field where the cabling was shorting out within the
marshalling of these cabinets. The project required a design of the most feasible option that would
reduce cost and downtime but preserve safety, maintenance and minimise the frequency for future
upgrades. Several options were designed to meet the objectives. The result was to dismantle old
Hi-way 7 cards that had the field instruments controlling them and allocate all existing points to a
new Input/Output Processor (IOP) on the HPM system. This project was in the preliminary stages
and had not started construction during the time of the internship. But from what was designed and
discussed and suggested it had the go-ahead and was due to be completed in the upcoming weeks.
This project will have to undergo a live cutover as the cost to shut the unit down for this project will
be too much down time and loss in production. In a prefeasibility discussion with BP, such issues as
this was carefully thought of, as it is important to establish the risks that will be involved in a live
cutover. Employment of the right people is important because it is a high-risk job and it is imperative
during the construction phase. It requires experienced and compliant personnel to complete the job
Page | 33
5.0 ADDITIONAL TASKS COMPLETED The additional tasks in this section are not outlined in project scope of works or strictly related. This
work includes the tasks, which an engineer would do on a daily or periodic basis that are related to
the operation, maintenance and safety of the refinery. These tasks are highlighted below.
5.1 MONTHLY SAFETY MEETINGS The last Friday of every month, the Kwinana Projects Team hold a safety meeting lead by Mark
Spiranovic, who is the contract manager for WorleyParsons. This meeting included all safety updates
not only limited to projects, but also anything that has the best interests of everyone’s safety on site
from the maintenance and operations to the engineers who are mainly in the office. The items
specifically discussed in the meetings are to do with assessing any incident that occurred for the
month, realising what could have been done to prevent it and as individuals can assure this will
never happen again. Everyone in of the projects team will attend this meeting and sign an
attendance sheet to show that they were aware of this month’s updates and have no excuses to
follow through the discussion objectives for the following month. This helped develop a safer
perspective in the designing phase of projects and increased employees awareness to hazards during
day-to-day work.
5.2 PROJECT MEETINGS During the course of a project it is required that all personnel on the project schedule a meeting to
ensure everyone is up to date and ahead or on schedule and that any issues that have occurred to
be addressed immediately. The most important meetings are usually the ones that involve time
planning and scheduling. In one project it was imperative that all of the engineers met the required
dates for issuing the work, as the construction work would take place during the turnaround, which
is a scheduled shutdown. This meeting was for everyone to discuss and inform other disciplines as to
why there might be delays in the issuing of work packs. This detail must be communicated to the
project managers and client to ensure that everyone is kept calm and understand of what is going
on. Other meetings related to the preliminary stages of projects, where the discussion is what is the
scope of work, what is the timeframe and urgency and when is the project expected to go online.
Other topics of discussion at these meetings include the typical costs and what resources are going
to be used on the project to ensure a high quality of work, efficiency and being cost affective at the
same time.
Page | 34
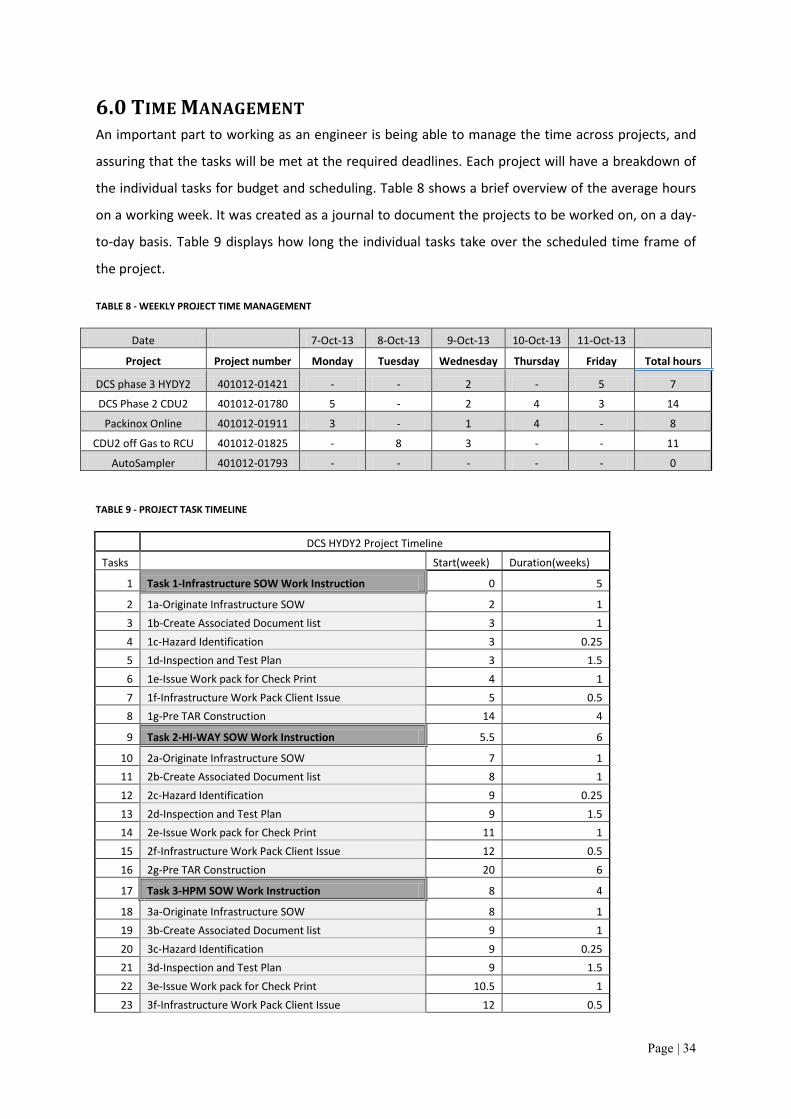
6.0 TIME MANAGEMENT An important part to working as an engineer is being able to manage the time across projects, and
assuring that the tasks will be met at the required deadlines. Each project will have a breakdown of
the individual tasks for budget and scheduling. Table 8 shows a brief overview of the average hours
on a working week. It was created as a journal to document the projects to be worked on, on a day-
to-day basis. Table 9 displays how long the individual tasks take over the scheduled time frame of
the project.
TABLE 8 - WEEKLY PROJECT TIME MANAGEMENT
Date 7-Oct-13 8-Oct-13 9-Oct-13 10-Oct-13 11-Oct-13
Project Project number Monday Tuesday Wednesday Thursday Friday Total hours
DCS phase 3 HYDY2 401012-01421 - - 2 - 5 7
DCS Phase 2 CDU2 401012-01780 5 - 2 4 3 14
Packinox Online 401012-01911 3 - 1 4 - 8
CDU2 off Gas to RCU 401012-01825 - 8 3 - - 11
AutoSampler 401012-01793 - - - - - 0
TABLE 9 - PROJECT TASK TIMELINE
DCS HYDY2 Project Timeline
Tasks
Start(week) Duration(weeks)
1 Task 1-Infrastructure SOW Work Instruction 0 5
2 1a-Originate Infrastructure SOW 2 1 3 1b-Create Associated Document list 3 1 4 1c-Hazard Identification 3 0.25 5 1d-Inspection and Test Plan 3 1.5 6 1e-Issue Work pack for Check Print 4 1 7 1f-Infrastructure Work Pack Client Issue 5 0.5 8 1g-Pre TAR Construction 14 4
9 Task 2-HI-WAY SOW Work Instruction 5.5 6
10 2a-Originate Infrastructure SOW 7 1 11 2b-Create Associated Document list 8 1 12 2c-Hazard Identification 9 0.25 13 2d-Inspection and Test Plan 9 1.5 14 2e-Issue Work pack for Check Print 11 1 15 2f-Infrastructure Work Pack Client Issue 12 0.5 16 2g-Pre TAR Construction 20 6
17 Task 3-HPM SOW Work Instruction 8 4
18 3a-Originate Infrastructure SOW 8 1 19 3b-Create Associated Document list 9 1 20 3c-Hazard Identification 9 0.25 21 3d-Inspection and Test Plan 9 1.5 22 3e-Issue Work pack for Check Print 10.5 1 23 3f-Infrastructure Work Pack Client Issue 12 0.5
Page | 35
With this project task timeline a gannt chart has been created to outline the amount of time and
estimated start and finish dates for all-important project that were assigned. This chart was used to
manage the progression to monitor the project and has been constantly modified throughout the
internship as project time management plans differ due to external factors.
There will always be external factors that will affect the project time line and deadlines. That is why
it was important to remain flexible in scheduling. The compromising of quality was not an option
when it comes to safely designing something or the money spent shouldn’t be a factor that will
cause a detrimental risk to the life span of the project and people’s safety.
Page | 36
7.0 INTERNSHIP REVIEW The internship program has been an invaluable experience with extensive exposure to the field of
Instrumentation. The projects assigned had been structured to ensure that the engineering and
design was of valuable experience to the intern. This allowed the opportunity to apply the skills and
knowledge gained from both fields of Instrumentation and Process Control Engineering.
WorleyParsons has shown great structure in their student and graduate training programs to ensure
the professional development for a young engineer.
Having completed the internship, the BP refinery is only a small portion to what the oil and gas
industry has to offer. The process units that had current projects, allowed the study of processes in
further detail, such as, control logic and production extracts. All projects were conducted in a safe
and professional manner with no compromising of designs or work ethic. Having a good
understanding for the procuring of instruments is something that will be of great use in professional
development. The experience in tracing control loops was extensive and demanded great attention
to detail. Overall this was a great opportunity and will recommend this program to future students
looking for a placement at the refinery.
Page | 37
8.0 CONCLUSION From a design, maintenance and operations perspective, the refinery requires a high level of quality
engineers from all disciplines, specifically the Instrumentation Control and Electrical team. The
knowledge gained from the projects worked on at the Kwinana refinery offered to the intern has
been an invaluable learning experience for the 16-week period. Such as procurement processes,
installation of new instruments, commissioning new PLC’s and understanding and interpreting
relevant documents related to instrumentation. The internship has enabled the realisation of rare
opportunities, learning and experiences in the specific time at the refinery. The project work
completed for the duration of the internship has been arduous, fulfilling and immensely relevant to
the discipline.
This report has presented the project work completed during the intern’s placement agreement with
BP, underlining specific engineering practices executed to achieve desired outcomes for the project.
Through the project work completed it will prove to have a beneficial effect on the refinery in terms
of its operations, increased efficiency and decreased equipment failure. Having worked towards the
project objectives, invaluable knowledge has been gained from the tasks assigned to an
Instrumentation and Control Engineer. In addition to the project work completed, the intern has
been exposed to realistic workplace situations involving communication between disciplines as well
as client and vendors in relation to administrative duties and unplanned engineering issues.
This internship has been successful, providing a leading edge to the engineering industry enabling
the ability to obtain the experience in the Instrumentation discipline. The time spent at the Kwinana
Oil refinery has facilitated the professional development from an engineering student to an engineer
working in the industry.
Page | 38
BIBLIOGRAPHY [1] BP Kwinana refinery. Kwinana home website
http://www.bp.com/sectiongenericarticle.do?categoryId=9026995&contentId=7049443 Retrieved: September 2013. (Information on the overall site production and general information was obtained from the home page).
[2] BP Supplied Documents. DCS Upgrade Project Phase 3 Hydy 2 Inlec Construction Scope of Work.
Retrieved: October 2013. (This document is originated from the statement of requirements specified from BP outlying the scope of the project. Once the document has had the appropriate approval the construction scope of work and procurement can begin).
[3] BP Supplied Documents. WWTP Autosampler Project Inlec Construction Scope of Work
Retrieved: October 2013. (BP produced the information specified in the statement of requirements document where they state that this project must meet the requirements for Water Corp Australia standards for the Sepia Depression Ocean Outfall Line. From there we can specify and design the project around those requirements).
[4] BP Supplied Documents. TEL Load Cells Project Inlec Construction Scope of Work. Retrieved:
October 2013. (BP has produced all information in this document unless specified otherwise. Figure 2 was taken from this document).
[5] Vendor Supplied Documents. Honeywell FTE Specification, 29th May 2008. Retrieved: October
2013. (This document is supplied to BP by the vendor as a information pack on the software package purchase. Figure 1 was taken from this document.)
[6] Oil refining process. http://oilrefiningprocess.com/. Retrieved September 2013
(Basic oil refining processes were found on this website; no real content was obtained and put in the report but more of a gain in understanding of the oil and gas industry.)
[7] Australian Institute of Petroleum (AIP). http://www.aip.com.au/industry/fact_refine.htm.
Retrieved October 2013. [8] Emerson Process Management (EPM). 2004. Control Valve Sourcebook. 1sted. Fisher Controls.
USA (This handbook was provided by the vendor who came to site, the information on refining was obtained from this book along with the basic process diagrams.)
[9] BP Learning Management Systems (LMS). 2013. Refining Engineer Training. BP (BP’s learning
management system is used for training new staff or even as a refresher course for the individual process units and all details and background on what is needed to know about refining.)
[10] American National Standard. 2009. Instrumentation Symbols and Identification. ISA. North
[11] Australian Standard. Electrical equipment for explosive atmosphere AS/NZS 2381.1. Australia Retrieved November 2013
[12] MOXI. 2005. Competencies for Working with Electrical Equipment for Hazardous Areas (EEHA)
Training Module NUEH001 Explosion-Protection Principle. Moxi. Perth Australia Retrieved November 2013
[13] “Today I found Out”-Why Lead used to be Added to Gasoline (feature article). November
14th.2011.http://www.todayifoundout.com/index.php/2011/11/why-lead-used-to-be-added-to-gasoline/ Retrieved January 2014
[14] The West Australian.“Kwinana Shutdown a sign BP’s here to stay”. Peter Klinger. Wednesday
January 8 2014. [15] HoneyWell C300 Controller Product Information.
https://www.honeywellprocess.com/en-US/explore/products/control-monitoring-and-safety-systems/integrated-control-and-safety-systems/experion-pks/controllers/Pages/c300.aspx Retrieved January 2014.
[16] The conversation. Security In Doubt as Australia’s aging oil refineries shut down. February 2012.
https://theconversation.com/security-in-doubt-as-australias-aging-oil-refineries-shut-down-5553 Retrieved January 2014.
[17] Isco 4700 Autosampler product information.
http://www.isco.com/products/products1.asp?PL=201 Retrieved January 2014.