127
May 21, 2010 Final Report Life Cycle Impact Assessment of Aluminum Beverage Cans Prepared for: Aluminum Association, Inc. Washington, D.C. Prepared by: PE Americas
May 21, 2010
Final Report
Life Cycle Impact Assessment of
Aluminum Beverage Cans
Prepared for:
Aluminum Association, Inc.
Washington, D.C.
Prepared by:
PE Americas

Final Report: Can LCA
PE Americas
Contact:
Nuno da Silva
Neil d’Souza
Marc Binder
PE Americas
344 Boylston Street
Boston, MA 02116, USA
Phone +1 [617] 247‐4477
Fax +1 [617] 236‐2033
E‐mail n.daSilva@pe‐international.com
Internet www.pe‐americas.com

Cha
pter
: Tab
le o
f Con
tent
s
TABLE OF CONTENTS TABLE OF CONTENTS ..................................................................................................................... III
TABLE OF FIGURES.........................................................................................................................VI
LIST OF TABLES ............................................................................................................................VIII
ACRONYMS .................................................................................................................................VIII
EXECUTIVE SUMMARY...................................................................................................................XI
1 INTRODUCTION ....................................................................................................................... 1
2 GOAL AND SCOPE OF THE STUDY ............................................................................................. 2
2.1 GOAL......................................................................................................................................... 2
2.2 SCOPE........................................................................................................................................ 3
2.2.1 Product System(s) Boundaries............................................................................................ 3
2.2.2 Data Collection, Software and Databases .......................................................................... 7
2.2.3 Data Calculation ................................................................................................................. 8
2.2.4 Functional Unit ................................................................................................................... 9
2.2.5 Cut‐ off Criteria ................................................................................................................... 9
2.2.6 Allocation.......................................................................................................................... 10
2.2.7 Life Cycle Impact Assessment Methodology & Impact Categories Considered ................ 10
2.2.8 Data Quality Requirements .............................................................................................. 10
2.2.9 Critical Review .................................................................................................................. 12
3 PRIMARY ALUMINUM PRODUCTION...................................................................................... 13
3.1 PROCESS DESCRIPTION................................................................................................................. 13
3.1.1 Bauxite Mining ................................................................................................................. 14
3.1.2 Alumina Production.......................................................................................................... 17
3.1.3 Anode Production ............................................................................................................. 23
3.1.4 Aluminum Smelting .......................................................................................................... 25
3.1.5 Primary Ingot Casting (Cast House).................................................................................. 34
3.1.6 Electrical Power Mix Model for Electrolysis...................................................................... 38
3.2 LCI RESULTS.............................................................................................................................. 41
3.2.1 Primary Energy Demand................................................................................................... 41
3.2.2 Carbon dioxide Emissions ................................................................................................. 43
3.3 LCIA RESULTS ........................................................................................................................... 44
3.3.1 Acidification Potential ...................................................................................................... 44

Final Report: Can LCA
PE Americas
3.3.2 Eutrophication Potential ...................................................................................................45
3.3.3 Global Warming Potential (100 years)..............................................................................46
3.3.4 Photochemical Ozone Creation Potential..........................................................................49
4 BEVERAGE CAN PRODUCTION ............................................................................................... 51
4.1 PROCESS DESCRIPTION.................................................................................................................51
4.1.1 Can Sheet ..........................................................................................................................51
4.1.2 Can Manufacturing ...........................................................................................................58
4.1.3 Secondary Aluminum Ingot / Recycling.............................................................................63
4.2 DATA COLLECTION AND MODELING................................................................................................69
4.2.1 Can Sheet ..........................................................................................................................69
4.2.2 Can Manufacturing ...........................................................................................................69
4.3 LCI RESULTS (AVERAGED “GATE‐TO‐GATE” INVENTORIES)...................................................................73
4.3.1 Beverage Can Sheet ..........................................................................................................73
4.3.2 Can Manufacturing ...........................................................................................................74
4.3.3 Secondary Aluminum Ingot / Recycling.............................................................................75
4.4 LCI AND LCIA RESULTS PER 1000 CANS..........................................................................................77
4.4.1 Closed Loop Approach.......................................................................................................77
4.4.2 Recycled content approach ...............................................................................................81
4.5 UBC RECYCLING SCENARIOS ..........................................................................................................84
5 CONCLUSIONS....................................................................................................................... 86
BIBLIOGRAPHY............................................................................................................................. 87
APPENDIX A: ESTIMATION OF TOTAL PRIMARY ENERGY DEMAND................................................ 89
APPENDIX B: TRANSPORTATION DATA FOR RAW MATERIALS AND FINISHED PRODUCTS .............. 94
APPENDIX C: IMPACT INDICATORS ............................................................................................... 95
PRIMARY ENERGY CONSUMPTION..............................................................................................................95
GLOBAL WARMING POTENTIAL .................................................................................................................96
ACIDIFICATION POTENTIAL........................................................................................................................97
EUTROPHICATION POTENTIAL....................................................................................................................98
PHOTOCHEMICAL OZONE CREATION POTENTIAL (SMOG)................................................................................99
OZONE DEPLETION POTENTIAL ..................................................................................................................99
APPENDIX D: DATA QUALITY EVALUATION ..................................................................................101
APPENDIX E: CRITICAL REVIEW REPORT.......................................................................................102
5.1 ALUMINUM BEVERAGE CAN LCI REPORT FEBRUARY 2010 ...............................................................103
REVIEWER COMMENTS FEBRUARY 26, 2010 .............................................................................................103

Cha
pter
: Tab
le o
f Con
tent
s
5.2 ALUMINUM BEVERAGE CAN LCI REPORT OCTOBER 2009................................................................ 104
REVIEWER COMMENTS DECEMBER 4, 2009 ............................................................................................. 104
APPENDIX F: CRITICAL REVIEWERS’ BIO....................................................................................... 107

Final Report: Can LCA
PE Americas
TABLE OF FIGURES Figure 1: Process flow chart for aluminum beverage can under closed loop recycling......................... 5
Figure 2: Process flow chart for aluminum beverage can under recycled content conditions.............. 6
Figure 3: Illustration of the Vertical averaging method. ........................................................................ 8
Figure 4: Illustration of the Horizontal averaging method..................................................................... 9
Figure 5: Process chain for the production of 1000 kg of primary aluminum. .................................... 13
Figure 6: Bauxite imports into North America. .................................................................................... 14
Figure 7: Bauxite mining in Brazil. ........................................................................................................ 17
Figure 8: The transportation of Bauxite imported to the US ............................................................... 18
Figure 9: Alumina (Al2O3) production process in the U.S. in 2005...................................................... 21
Figure 10: Breakdown of alumina imports and domestically produced alumina in the U.S................ 22
Figure 11: Illustration of the Anode production process. .................................................................... 27
Figure 12: Electrolysis mix representative for the U.S. in 2005. .......................................................... 29
Figure 13: Electrolysis process model for crude aluminum production .............................................. 30
Figure 14: Electrolysis process model for crude aluminum imported to the U.S.. .............................. 32
Figure 15: Primary ingot casting process model for primary aluminum production ........................... 37
Figure 16: Electrical power mix for electrolysis (domestic mix)........................................................... 38
Figure 17: Electrical power mix for electrolysis (imports).................................................................... 38
Figure 18: European power mix using Russia as the representative country. ..................................... 39
Figure 19: Primary energy demand for primary aluminum ingot production ..................................... 42
Figure 20: Carbon dioxide emissions during primary aluminum ingot production ............................. 43
Figure 21: Acidification potential results for primary aluminum ingot production. ............................ 45
Figure 22: Eutrophication potential results for primary aluminum production .................................. 46
Figure 23: Global warming potential results for primary aluminum ingot production........................ 47
Figure 24: POCP results for primary aluminum ingot production........................................................ 50
Figure 25: Unit process chain representative for one particular rolling mill site................................. 52
Figure 26: Illustration of the Can making process................................................................................ 59
Figure 27: Unit process chain at one selected secondary aluminum production site ......................... 64
Figure 28: Power Mix Process for the Can Manufacturing Model ....................................................... 72
Figure 29: Mass flows of the beverage can under closed loop approach............................................ 79
Figure 30: Primary energy demand of the can under closed loop approach....................................... 81

Cha
pter
: Tab
le o
f F
igur
es
Figure 31: Mass flows of the beverage can under recycled content approach................................... 82
Figure 32: Primary energy demand of the can under recycled content approach.............................. 84
Figure 33. Primary energy demand under different UBC recycling rate scenarios ............................. 85
Figure 34: Total primary energy demand for 1 kWh generation of electricity in the U.S. .................. 90
Figure 35: Direct energy and Primary energy demand (for 1 kg of aluminum (liquid) in the U.S. ...... 92
Figure 36: Greenhouse effect ................................................................................................................ 1
Figure 37: Acidification Potential ........................................................................................................... 1
Figure 38: Eutrophication Potential ....................................................................................................... 1
Figure 39: Photochemical Ozone Creation Potential ............................................................................. 1
Figure 40: Ozone Depletion Potential ................................................................................................ 100

Final Report: Can LCA
PE Americas
LIST OF TABLES Table 1: Summary of system boundaries ............................................................................................... 3
Table 2: Key characteristics of the closed loop and recycled content approaches................................ 7
Table 3 Inputs and outputs for the bauxite mining process ................................................................ 15
Table 4: Breakdown of bauxite imports to the U.S. in 2005 ................................................................ 16
Table 5: Inputs and outputs for the Alumina production unit process................................................ 18
Table 6: Country‐wise breakdown of alumina imports to the U.S. in 2005 ......................................... 23
Table 7: Inputs and outputs for the anode production unit process ................................................... 24
Table 8: Crude aluminum consumption in the U.S. in 2005 (USGS, 2006)........................................... 28
Table 9: Inputs and outputs for the domestic component of Electrolysis unit process. ..................... 30
Table 10: Inputs and outputs for the imported component of Electrolysis unit process .................... 33
Table 11: Inputs and outputs for primary ingot casting unit process .................................................. 36
Table 12: Breakdown of electrical power (MJ) consumed in electrolysis by energy source ............... 40
Table 13: Relative contribution of electrical power consumed in electrolysis by energy source........ 40
Table 14: LCI parameters for the production of 1000 kg of primary aluminum ingot in NA ............... 42
Table 15: Scope 1, 2, and 3 CO2 Equivalent emissions for primary aluminum ingot production........ 48
Table 16: LCIA results for production of 1000 kg of primary aluminum ingot in North America. ....... 50
Table 17: Input and Output flows for the can sheet making unit process........................................... 52
Table 18: Input and Output flows for the can sheet making unit process........................................... 55
Table 19: Inputs and outputs for the can making unit process............................................................ 60
Table 20: Input and output flows for scrap preparation unit processes.............................................. 65
Table 21: Input and output flows for remelting and casting unit processes. ...................................... 66
Table 22: Distribution of the can production volume by can size in 2006........................................... 70
Table 23: Averaged LCI data for can sheet (mix) production process.................................................. 73
Table 24: Averaged LCI data on can manufacturing process ............................................................... 74
Table 25: Averaged LCI data for scrap preparation ............................................................................. 75
Table 26: Averaged LCI data for remelting and casting ....................................................................... 76
Table 27: Selected LCI/LCIA results per 1000 cans under closed loop approach................................. 80
Table 28: Selected LCI and LCIA results per 1000 cans under the recycled content approach ........... 83
Table 29: Total primary energy demand for 1 kWh generation of electricity in the U.S. .................... 89
Table 30: Total primary energy demand for 1 kWh generation of electricity in Canada..................... 90

Cha
pter
: Lis
t of
Tab
les
Table 31: Transportation data for raw materials and finished products............................................. 94
Table 32: Data quality evaluation matrix ........................................................................................... 101
Table 33: Results data quality evaluation .......................................................................................... 101

Final Report: Can LCA
PE Americas
ACRONYMS
AA Aluminum Association AP Acidification Potential CMI Can Manufacturers Institute CML Centre of Environmental Science at Leiden EoL End‐of‐Life EP Eutrophication Potential GaBi Ganzheitliche Bilanzierung (German for holistic balancing) GHG Greenhouse Gas GWP Global Warming Potential IAI International Aluminum Institute ISO International Organization for Standardization LCA Life Cycle Assessment LCI Life Cycle Inventory LCIA Life Cycle Impact Assessment NMVOC Non‐methane volatile organic compound ODP Ozone Depletion Potential PEA PE Americas POCP Photochemical Ozone Creation Potential RSI Recycled scrap ingot UBC Used Beverage Can USGS United States Geological Survey VOC Volatile organic compound

Cha
pter
: Exe
cutiv
e S
umm
ary
EXECUTIVE SUMMARY This report outlines the life cycle inventory of an aluminum beverage can produced in the
United States. The study was commissioned by the Aluminum Association (AA) to respond appropri‐ately to the increasing market demand for life cycle data on the environmental performance of products. A life cycle inventory of a product quantifies all material and energy use and environ‐mental releases over its entire life cycle ‐ from raw material acquisition through to ultimate disposal.
The goal of this study is to provide the Aluminum Association, concerned aluminum industry stakeholders, and life cycle assessment practitioners with up‐to‐date life cycle inventory data for beverage cans of the following sizes as produced in North America: 8 oz., 12 oz., 16 oz., 24 oz. and 32 oz. The scope of the study is “cradle‐to‐grave”, i.e. starting with the extraction of the bauxite ore and including all processes required to produce an aluminum ingot, manufacture the aluminum beverage can, and recover and recycle secondary raw material from the used beverage can (UBC).
Two approaches to model the recycling system (closed loop recycling approach and recycled content approach) were considered to ensure that the study’s results can be directly compared with the results of other studies, which might use either of these approaches.
Both approaches used a common set of baseline assumptions, as defined below:
Average can weight of 13.34 kg per 1000 cans
The used beverage can recycling rate in the year 2006 is 51.6%
The recycled content of the beverage can in the U.S. in 2007 is 67.8%
Post production and run‐a‐round scrap from rolling mills is completely recycled in a closed loop. The production of secondary aluminum ingot from post production and run‐a‐round scrap does not require any input of primary aluminum.
Can manufacturing scrap is dealt with in the same manner as UBC scrap and included in the recycled content of the can.
Aluminum beverage cans are manufactured through the following major processes (Figure A): pri‐mary aluminum production (including bauxite mining and alumina refining), secondary aluminum production; aluminum can sheet production, and can manufacturing. These are shown in Figure A.
At the end of life of its useful functions, UBCs are collected, shipped and recycled back to new aluminum metal. A proportion of the UBCs, however, are lost to landfills or other types of sinks due to consumer behaviors.
In modeling both the primary aluminum and secondary aluminum production processes, a func‐tional unit of 1000 kg aluminum ingot is used. Separate models for North America (US and Canada) and global production were used to reflect the mixture of primary aluminum consumption in the US in the target year. The production of secondary aluminum starts with scrap collection and ends with secondary metal processing. The casting of aluminum for subsequent can sheet production is con‐sidered as one process.
In producing 1000 kg of primary aluminum, 5246 kg of mined and processed bauxite was used to produce 1915 kg of alumina. 1018 kg of liquid metal was generated out of the electrolysis

Final Report: Can LCA
PE Americas
reduction process, 1000 kg of ingot was casted in the end, and the rest of the metal was recycled back in a closed loop.
Figure A: Processes in the life‐cycle of aluminum cans (recycled content perspective)
Process based primary energy demand, which includes primary energy used for fuel produc‐tion, transportation, and electricity generation and transmission, for 1000 kg primary aluminum (bauxite mining, alumina refining, electrolysis, and ingot casting) is shown in the table below.
Process‐Based Primary Energy Demand for 1000kg Primary Aluminum Production
Bauxite Mining
Alumina Refining
Electrolysis Ingot Casting
Primary Energy Demand for fuel pro‐duction, transportation, & electricity generation and transmission
1.02 GJ 27.36 GJ 124.27 GJ 2.36 GJ
Energy from non‐fossil fuel sources, from above numbers
0.02 GJ 0.28 GJ 49.75 GJ 0.23 GJ
Cha
pter
: Exe
cutiv
e S
umm
ary
Primary energy demand for 1000 kg secondary aluminum production was 6909 MJ (includ‐ing scrap preparation) which required 1059 kg of unprocessed scrap as input.
In making can sheets, primary aluminum, secondary aluminum, and can making scrap (the skeleton, or web scrap, usually sold by can makers) were mixed and melted in the secondary melting furnaces, and/or in the primary cast house to produce ingots for rolling. The rolled can sheets, in‐cluding can body sheets and can lid sheets, were shipped to can makers to manufacture the final products.
Under the closed‐loop/end‐of‐life approach, the production of 1000 cans at a can manufac‐turing plant requires 16.78 kg of aluminum sheet (inclusive of can body and lid). The can manufac‐turing process yields 3.447 kg of post‐industrial scrap (the skeleton) and is shipped back to the re‐melting plants. The rolling mills generates 6.501 kg of scrap metal and it is immediately recycled back to the rolling process. This is treated as an internal run‐around scrap.
In order to produce 16.78 kg of aluminum sheet (for 1000 cans), the total amount of alumi‐num ingot input required for the rolling process is 23.31 kg. This is produced from:
8.736 kg of secondary aluminum produced from UBC scrap, non‐can post‐consumer scrap, and non‐can post‐industrial scrap
3.447 kg of aluminum produced from can post‐industrial scrap (skeleton from can manufac‐turing plants)
5.8 kg of primary aluminum, and
6.501 kg of aluminum from rolling process which is treated as a internal run‐around scrap
At the End of Life (EoL), 6.984 kg of UBC scrap (51.6% of the average can weight of 13.34 kg per 1000 cans) are recovered. The can product system in the U.S. for the year 2006 requires 12.23 kg of scrap for the production of secondary ingot. An additional 1.797 kg of scrap is therefore required to make up this deficit. In the recycled content approach, this additional scrap is sourced from a “scrap sink” and there is no “net burden” given to the product system. The “scrap sink” can be con‐sidered as a stockpile of secondary raw material which is not utilized for further processing and re‐covery of the material.
In the recycled content system, the total primary energy demand per 1000 cans with a 51.6% UBC recycling rate is 1692 MJ. The share of total primary energy demand over all life cycle stages of the can is shown in Figure B.

Final Report: Can LCA
PE Americas
Figure B: PE breakup for can life‐cycle (recycled content)
The solid color portion of each bar represents the non‐renewable fraction of primary energy and the light‐shaded portion represents the renewable fraction of primary energy.
The environmental footprint of 1000 cans under each approach (closed loop and recycled content) is listed in the table below:
Table A. Environmental Footprint of 1000 Cans
Selected LCI Parameters Closed Loop Recycled Content Unit
Primary energy demand 1943 1692 MJ
Non renewable energy resources 1540 1374 MJ
Renewable energy resources 403.3 318.3 MJ
INPUTS
Can sheet 16.78 16.78 Kg
OUTPUTS
Carbon dioxide 121.6 105.9 Kg
Carbon monoxide 0.047 0.041 Kg

Cha
pter
: Exe
cutiv
e S
umm
ary
Nitrogen oxides 0.24 0.211 Kg
Sulphur dioxide 0.436 0.376 Kg
VOCs 0.209 0.188 Kg
Selected LCIA Parameters (CML 2001)
Global warming potential (GWP 100 years) 131.5 113.8 kg CO2 Eq.
Acidification potential (AP) 0.613 0.532 kg SO2 Eq.
Eutrophication potential (EP) 1.565 1.561 kg Phosphate
Eq.
Photochemical Ozone creation potential (POCP)
0.051 0.046 kg Ethene Eq.
Ozone Layer depletion potential (OPD) 3.76E‐06 3.61E‐06 kg R11 Eq.
Under the closed loop approach, the mass flows per 1000 cans are similar to the recycled content approach flows except for the fact that the deficit scrap metal which is imported into the system is assigned a “net burden” which is the sum of the environmental burdens associated with the amount of primary aluminum ingot required to replace this deficit minus those associated with the re‐melting of surplus scrap to produce secondary aluminum ingot. Therefore, the environmental footprint of the cans in the recycled content approach appears to be lower than in the closed loop consideration.
To examine the influence of the UBC recycling rates on the environmental performance of the beverage can product system, additional scenarios are evaluated based on the following UBC recycling rates:
30% ‐ Hypothetical low UBC recycling rate
45.1% ‐ UBC recycling rate estimated by Container Recycling Institute (ca. 2004) (CRI, 2008)
62% ‐ Peak UBC recycling rate achieved during the mid 1990s
75% ‐ Aluminum Association future goal for UBC recycling rate
The variation in total primary energy demand per 1000 cans under different scenarios is shown in Figure C and the results are presented for both closed loop/end‐of‐life and recycled con‐tent approaches.

Final Report: Can LCA
PE Americas
Figure C: Variation of primary energy with recycling rates for closed loop and recycled content approaches
At a higher UBC recycling rate (i.e. 75%), the closed loop approach seems more favorable, whereas at a lower recycling rate (i.e. 30%), the recycled content approach seems more favorable, as the product system would still try to maintain the recycled content of the can and sources of scrap might be from product systems other than the can system. The reason is that the recycled content approach cuts off both, surplus UBC scrap as well as an unsaturated scrap demand in case the recycling rate is lower than the recycled content of the can.. As a result, the primary energy de‐mand under the recycled constant approach does not change as the recycling rate is varied. It is likely that recycled content of the can will increase as the UBC recycling rate increases, under the assumption that more UBC scrap will be available in the market for can making. However, there are other market forces (e.g. export of UBC scrap to other countries, use of UBC scrap for automotive sheet production) which can influence the availability of UBC scrap to secondary aluminum produc‐ers. The influence of various factors which determine the recycled content of the can in United States is beyond the scope of this study. Therefore, in the study the recycled content of UBCs in cans was kept constant at 67.8% and only the UBC recycling rate was varied in scenario analysis.
Detailed discussions of the study’s results are extensively documented in this report, but the following main conclusions can be drawn from the results of the study:
The environmental profile of primary aluminum production has a significant influence on the overall environmental burden results for the manufacture of a beverage can. The contribution is around 53% in the case of the recycled content approach and 46% for closed loop approach.

Cha
pter
: Exe
cutiv
e S
umm
ary
The electrolysis unit process of primary aluminum production accounts for between 72 and 79% of the can’s environmental impacts. However, it is the upstream environmental burdens associated with the electricity used for electrolysis that is the main contributor to these impacts1. Can manufacturing and rolling operations also contribute considera‐bly to the environmental burdens associated with production of beverage cans.
At present, with the used beverage can (UBC) recycling rate of 51.6%, the difference of 250MJ per 1000 cans between environmental burdens under closed loop and recycled content approaches is significant and in favor of the recycled content approach. This is due to the fact that the amount of metal needed to satisfy the recycled content of the can sheet is greater than the amount of metal collected. In the closed loop approach, this deficit is sourced from primary metal while in the recycled content approach, the additional scrap is imported into the system burden‐free. However, as the Aluminum As‐sociation achieves higher UBC recycling rates, the closed loop approach will produce more favorable results.
1 Power production and consumption associated with those upstream processes however are out of control of the aluminum
industry and thus cannot be directly influenced by the aluminum industry.


Cha
pter
: Int
rodu
ctio
n
1 INTRODUCTION Life cycle assessment (LCA) is a standardized scientific method for systematic analysis of
flows (e.g. mass and energy) associated with the life cycle of a specified product, a technology, a service or manufacturing process systems (ISO, 2006a). The approach in principle aims at a holistic and comprehensive analysis of the above items including raw materials acquisition, manufacturing as well as use and End‐of‐life (EoL) management. According to the International Organization for Standardization (ISO) 14040/44 standards, an LCA study consists of four phases : (1) goal and scope (framework and objective of the study); (2) life cycle inventory (input/output analysis of mass and energy flows from operations along the aluminum products value chain); (3) life cycle impact as‐sessment (evaluation of environmental relevance, e.g. global warming potential); and (4) interpreta‐tion (e.g. optimization potential) (ISO, 2006a; ISO, 2006b).
The goal and scope stage outlines the rationale of the study, the anticipated use of the re‐sults of the study, the boundary conditions, the data requirements and the assumptions to analyze the product system under consideration, and other similar technical specifications for the study. The goal of the study is to answer the specific questions which have been raised by the target audience and the stakeholders involved, while considering potential uses of the study’s results. The scope of the study defines the systems’ boundary in terms of technological, geographical, and temporal cov‐erage of the study, attributes of the product system, and the level of detail and the complexity ad‐dressed by the study.
The life cycle inventory (LCI) stage documents qualitatively and quantitatively analyze the materials and energy used (inputs) as well as the products and by‐products generated and the envi‐ronmental releases in terms of non‐retained emissions to the environmental compartments and the wastes to be treated (outputs) for the product system being studied. The LCI data can be used on its own to: understand total emissions, wastes and resource‐use associated with the material or the product being studied; improve production or product performance; or be further analyzed and interpreted to provide insights into the potential environmental impacts from the system (life cycle impact assessment and interpretation, LCIA).
In 1991, Alcoa, Alcan, and Reynolds commissioned a LCI analysis of the 12 oz. North Ameri‐can aluminum beverage can. The results of this previous study represented:
The industry average information on environmental performance of the three participating companies with respect to their operations on primary aluminum ingot production, secon‐dary aluminum ingot production, and aluminum can sheet production (Alcoa, Alcan and Rey‐nolds (acquired by Alcoa in 2000)),
The cumulative resources and environmental burdens associated with the manufacturing of 1,000 cans including bauxite mining, alumina refining, smelting, ingot casting, can sheet fab‐rication, can making, can‐filling (including the burdens of the beverage as well), consumer use and recovery of used beverage cans (UBC), and recycling,
The actual industry average operations and a 62.4% post consumer recycling rate represen‐tative of the North American aluminum beverage can industry in 1991.
The study quantified all significant inputs and outputs of the beverage can system. The input categories included 99.0% of the mass of raw materials identified in the system and 99.6% of the energy consumed. The environmental releases were quantified for air, water and solid waste and sub‐divided into process‐related, fuel‐related and transportation‐related data categories. More de‐tailed information and results are available in the study report of Pomper, Hauser and Richards

Final Report: Can LCA
PE Americas
(1994). The companies were competitors in the beverage can market and thus prohibited the shar‐ing of market relevant data under anti‐trust regulations. Therefore, the information generated by the study was consolidated by the LCI practitioner. The information derived from the study was pre‐sented in an aggregated form as a weighted averaged of the three individual company’s data and thus was in line with the anti‐trust regulations.
In order to conform with the increasing pressure from product manufacturers and the con‐sumer retail markets to select environmentally preferable packaging options, Aluminum Association (AA) engaged PE Americas (PEA) to help update the aluminum beverage can LCI to the most up‐to‐date industry data available.
The aim of the study is to generate high‐quality, up‐to‐date data on the environmental per‐formance of aluminum beverage can production including the flow of secondary materials from End of Life back into beverage cans. With such an LCI database, the Aluminum Association and its mem‐ber companies can assist other organizations to understand and communicate the environmental benefits of manufacturing with aluminum rather than other materials with similar physical proper‐ties. At the same time, this database helps site‐level personnel understand the environmental per‐formance of their manufacturing processes, and the potential environmental benefits of process improvements. Beyond the operations of a single manufacturing site, the LCI database evaluates the environmental performance of beverage cans throughout their entire life cycle. It provides useful insights for different stakeholder groups, such as primary or secondary aluminum producers, alumi‐num users, waste recyclers, government agencies, non‐governmental organizations, LCA practitio‐ners, and media.
For this study, a core project team was established to direct, review, and coordinate the ac‐tivities associated with methodological agreement, collection of data, modeling, presentation and dissemination of the LCI results. The members of the core group for this project are: Craig Covert [Alcoa], Geoff Cullen [Can Manufacturers Institute], Jim Fava [PE Americas & Five Winds Interna‐tional], Ken Martchek [Alcoa], Robert Strieter [Aluminum Association] and Gerri Walsh [Ball].
Different companies participated in the study to provide data for the various production stages of the beverage can include: Mill Rolling (Alcoa, Logan Aluminum, and Wise Alloys), Can Manufacturing (Can Manufacturing Institute) and other Secondary Aluminum Producers (Aleris, Novelis).
2 GOAL AND SCOPE OF THE STUDY
2.1 GOAL The goal of this LCA study is to provide the Aluminum Association, the aluminum industry
stakeholders, and the LCA practitioners with up‐to‐date LCI data for beverage cans of the following sizes2: 8 oz., 12 oz., 16 oz., 24 oz. and 32 oz.
The update of the beverage can LCI became necessary as the original LCI became increas‐ingly out of date ‐ partly due to technological and technical changes and partly due to the fact that
2 The LCI data for the different sizes represent weighted averages.

Cha
pter
: Goa
l and
Sco
pe o
f th
e S
tudy
the original LCI could no longer meet the information needs of today. The updated LCI shall reflect the current technological situation as well as the North American Market situation.
The intended audience for this study is the Aluminum Association itself, the potential cus‐tomers and decision makers in industry, as well as the general public. The Aluminum Association experts will use the information from this study in an aggregated manner for public communica‐tions, to develop marketing materials for potential customers and to provide data to customers for the purpose of developing LCIs within their own applications.
The present update of the beverage can LCI is intended to be used for comparative asser‐tions to be disclosed to the public, and is therefore subject to external critical review according to ISO 14044 guidelines.
2.2 SCOPE The scope of the study comprises a “cradle‐to‐grave” LCI, starting with the extraction of the
bauxite ore at the mine, including the production of aluminum ingot and the manufacturing of the aluminum beverage can, and ending after the recovery and recycling of the UBC. Table 1 summa‐rizes the system boundaries with regard to the general processes/quantities that are considered in the study. The LCI profile results are provided for each of two different recycling approaches:
Closed loop recycling
Recycled content
2.2.1 Product System(s) Boundaries
The product being examined is an average beverage can made of aluminum. Its content, manufacture, and impact represent the current technological and technical situation in the North American market. The function of the beverage can is to serve as container for beverages such as beer or soft drinks. There are no other functions of the analyzed average beverage can considered in this study.
Table 1: Summary of system boundaries
Included Excluded
Raw materials extraction
Energy and fuel inputs
Further processing materials (e.g. chemicals, solvents, etc.)
Processing of raw materials and semi‐finished products
Transportation of raw and processed materials
Product recycling
Capital equipment and maintenance
Overhead (heating, lighting) of manufacturing facilities when easily differentiated
Maintenance and operation of equipment
Manufacture of any beverage and its filling in cans
Internal transportation of materials
Use of product
Packaging of cans for distribution to consumers
Human labor
Product disposal (i.e. land filling)

Final Report: Can LCA
PE Americas
2.2.1.1 Closed loop recycling approach
The system flow chart for closed loop conditions is presented below in Figure 1. The flow chart highlights the recycling of post‐industrial clean can scrap (from rolling and can manufacturing) as well as the recycling of post‐consumer scrap (UBC from the EoL phase).
The closed loop approach is based on a product life cycle and material stewardship perspec‐tive. It considers the fate of products after their use phase and the resultant material output flows. In evaluating the environmental impacts of a product system using this approach, the EoL manage‐ment of the product is also taken into account and therefore, possible changes to improve the sys‐tem can be considered. The specific origin of input material (whether primary or recycled) is irrele‐vant as typically the net conservation of material is what minimizes the total environmental impacts.
Under this framework, the product being examined is considered to be completely recycled once it reaches the EoL phase. Material losses during the collection and processing of UBC as well as those associated with the production of secondary material feedstock out of UBC are taken into account. Consistent with ISO 14044, these losses are considered to be replaced by primary material feedstock. For a given product system, a certain amount of secondary raw material feedstock is re‐quired (determined by existing market conditions). It is sourced from both post‐industrial and post‐consumer scrap. In most product systems, post‐industrial scrap is recycled in a closed loop and par‐tially satisfies the demand for secondary raw material feedstock (Figure 1). The remaining demand for secondary material feedstock is met with post‐consumer scrap, i.e. UBC.
If the amount of UBC scrap generated is less than what the product system requires, then the environmental burdens associated with meeting the secondary raw material feedstock demand are included in this closed‐loop model, i.e. the environmental implications associated with supple‐mentary raw material production is considered (Table 2). If, however, the amount of UBC scrap is larger than what the product system requires, then the product system receives a net credit, equiva‐lent to the sum of environmental impacts from primary material extraction and re‐melting of surplus post‐consumer scrap.
A designer using this approach focuses on optimizing product recovery and material recy‐clability. By facilitating greater end‐of‐life recycling, the decision‐maker mitigates the loss of mate‐rial after product use. This approach assesses the consequences at the end‐of‐life of the product based on established technical practices, and supports decisions for an efficient market. This con‐cept allows design for recycling.

Cha
pter
: Goa
l and
Sco
pe o
f th
e S
tudy
Figure 1: Process flow chart indicating the system boundary for aluminum beverage can under closed loop recycling conditions. The product being examined is considered to be completely recy‐cled once it reaches the EoL phase. Material losses during both the collection and the processing of UBC as well as losses associated with the production of secondary material feedstock out of UBC are taken into account. In the case of excess UBC scrap, the product system receives a net credit equivalent to the sum of primary material avoided. The flow chart highlights the recycling of post‐industrial can scrap (from rolling and can manufacturing) as well as the recycling of post‐consumer (UBC) scrap (from the EoL phase).
2.2.1.2 Recycled content approach
The system flow chart for the recycled content approach is presented below in Figure 2. The recycled content approach adopts a waste management perspective, where the sourcing of raw material feedstock (both primary and secondary raw materials) is considered to be of importance. It assumes that the use of recycled material is a good indicator of environmental benefit. In the case of Aluminum for example, the benefits of recycling (primary material production and waste disposal avoidance) outweigh the burdens of post‐consumer collection and processing. The recycled content approach aims at promoting a market for recycled materials that is otherwise limited, uneconomic or immature. It may also serve as a good metric for materials that would otherwise be incinerated or landfilled as waste (assuming that these waste management treatment processes would result in higher environmental impacts than the material’s recycling).

Final Report: Can LCA
PE Americas
Figure 2: Process flow chart indicating the system boundary for aluminum beverage can under recycled content conditions. This approach excludes consideration of actual collection and recy‐cling efficiencies, rather considers “snap shots” of current material feed situation in terms of pri‐mary and secondary materials. If the amount of UBC scrap is greater than what the product sys‐tem requires, then the surplus UBC scrap leaves the system without any consideration of envi‐ronmental burdens associated.
In the recycled content approach, the amount of secondary raw material feedstock in the fi‐nal product is usually specified. The product system then meets the specified recycled content by sourcing secondary raw materials from post‐industrial scrap and from UBC. This approach differs from the closed loop approach in its accounting for environmental impacts when the amount of aluminum available from post‐industrial scrap and UBC recovery does not meet the specified amount of recycled content. If the amount of post‐industrial scrap and UBC recycling is less than the product system requires, then additional secondary aluminum is imported burden‐free, i.e. the envi‐ronmental burdens associated with meeting the secondary raw material feedstock demand are ex‐cluded (Figure 2). If, however, the amount of UBC scrap is greater than what the product system requires, then the surplus UBC scrap leaves the system without receiving credit for avoided envi‐ronmental burdens. In this manner the system boundary is still constructed to fairly allocate envi‐ronmental burdens in a system with recycled content. It should be noted that the recycling of post‐

Cha
pter
: Goa
l and
Sco
pe o
f th
e S
tudy
industrial rolling scrap is still considered part of a closed loop, which is generally true of current manufacturing practices.
Unfortunately, the application of the recycled content approach may create market distor‐tions and environmental inefficiencies. If a designer specifies a high recycled content in a well‐meaning effort to increase the overall environmental performance of a product, it may stimulate the market to direct recycled feedstock towards designated products and away from production where recycling is most economical. For metals, where there is a limited supply of recycled feedstocks, market stimulation is ineffective and may result in inefficient processing and unnecessary transpor‐tation.
The key characteristics of the two approaches are described in Table 2.
Table 2: Key characteristics of the closed loop and recycled content approaches
Closed loop approach Recycled content approach
Adopts a product life cycle and material stewardship perspective
EoL material is recycled and fed back in a closed loop (can to can) production
Metal losses have to be replaced by virgin material (losses during remelting of production and EoL scrap, collection and processing of UBCs)
In case the amount of UBC scrap collected in the EoL phase exceeds the amount of UBC scrap consumed (as secondary raw material) for can production in a given system, the product sys‐tem under consideration receives a net credit equivalent to the sum of primary aluminum avoided and the remelting of surplus UBC scrap
If the can product system for a given system requires more secondary raw materials from UBC than it generates, then additional burdens associated with the production of primary raw material replacing the missing amount of secon‐dary raw material from UBC scrap are included
Adopts a waste management perspective
Excludes the consideration of actual collection and recycling efficiencies, rather considers “snap shots” of current material feed situation in terms of primary and secondary raw materials
Surplus secondary material in form of UBC scrap leaves the can production system burden free (i.e. no burdens associated with remelting of surplus UBC scrap and no credit for the equivalent amount of primary alu‐minum avoided is assigned)
If the can product system for a given system requires more UBC scrap than it generates, then additional bur‐dens of importing UBC scrap are excluded (UBC scrap is imported without consideration of remelting efforts).
2.2.2 Data Collection, Software and Databases
The study included data collection in the following categories for rolling, can manufacturing and secondary aluminum production:
Fuel and energy use,
Use of raw materials, ancillary materials,
Products, co‐products,
Emissions to air, water and soil,

Final Report: Can LCA
PE Americas
Wastes.
Primary data collection of information, which is representative for specific production op‐erations, was accomplished by distributing documented questionnaires in the form of EXCEL spread‐sheets to all participating companies. Wherever possible, this study is based on primary data col‐lected from the participating companies and their respective production sites. In cases where pri‐mary data was not available, secondary data readily available from literature, previous LCI studies, and life cycle databases was used for the analysis. The sources for secondary data are documented in this study report. In the absence of secondary data, expert approximations were used to close the data gaps.
The LCA model was created using the GaBi 4 software system (current release GaBi 4.3, http://www.gabi‐software.com) for life cycle assessment, developed by PE INTERNATIONAL. The databases contained in the GaBi software provide the LCI data of the raw and process materials used in the background system.
2.2.3 Data Calculation
This study utilized a combination of vertical and horizontal averaging methods to derive the mean value of the primary data. The vertical method (see Figure 3) was applied consistently to all the companies as this method is more representative of actual industrial processes. However, in the case of identical processes, e.g. rolling, the horizontal averaging method (see Figure 4) was used.
Figure 3: Illustration of the Vertical averaging method. The final average is calculated from a weighted mean of the sum of all the operations of each company. Intermediate averages may also be calculated after each operation. (ECOBILAN, 2001).

Cha
pter
: Goa
l and
Sco
pe o
f th
e S
tudy
Figure 4: Illustration of the Horizontal averaging method. Averages are calculated after each op‐eration and are used as the inputs for the next operation. In our context, this method is used when a particular company does not produce an intermediate product or when there is insuffi‐cient data for an intermediate operation (ECOBILAN, 2001).
2.2.4 Functional Unit
The functional unit of the study is to produce one thousand aluminum beverage cans repre‐senting weighted averages of the can sizes defined above.
2.2.5 Cut- off Criteria
The following cut‐off criteria were used to ensure that all relevant environmental impacts were represented in the study:
Mass – If a flow is less than 1% of the cumulative mass of all the inputs and outputs depend‐ing on the type of flow) of the LCI model, it may be excluded, provided its environmental re‐levance is not a concern.
Energy – If a flow is less than 1% of the cumulative energy of all the inputs and outputs de‐pending on the type of flow) of the LCI model, it may be excluded, provided its environ‐mental relevance is not a concern.

Final Report: Can LCA
PE Americas
Environmental relevance – If a flow meets the above criteria for exclusion, yet is thought to potentially have a significant environmental impact, it will be included. All material flows which leave the system (emissions) and whose environmental impact is higher than 1 % of the whole impact of an impact category that has been considered in the assessment, shall be covered.
The sum of the neglected material flows shall not exceed 5% of mass, energy or environ‐mental relevance.
2.2.6 Allocation
In this study, no allocation was applied as all co‐products are considered in each of the recy‐
cling models described above (ISO, 2006b). Any recovered materials recycled into other products are
treated as waste, thereby providing a maximum allocation of burdens to aluminum can production.
2.2.7 Life Cycle Impact Assessment Methodology & Impact Categories Considered
It was determined during the scope development process that a comprehensive set of envi‐ronmental impact categories were to be investigated. For the purposes of succinct communication of the study results, the following impact categories were determined to best represent the Alumi‐num Association’s priorities in issues related to sustainability:
Global Warming Potential (GWP) (100 years; includes carbon dioxide (CO2) and other green‐house gas (GHG) relevant emissions),
Acidification Potential (AP),
Photochemical Ozone Creation Potential (POCP) – also called Summer Smog,
Eutrophication Potential (EP), and
Ozone Depletion Potential (ODP).
The meaning and significance of these impact categories is discussed in detail in Appendix C: Impact Indicators of this report. The impact assessment results were calculated using characteriza‐tion factors published by the Centre of Environmental Science at Leiden University (CML), the Neth‐erlands (CML, 2001). The CML 2001 methodology is the most widely applied impact assessment method in LCA studies around the world.
2.2.8 Data Quality Requirements
The following paragraphs document the comprehensive data quality requirements adopted according to ISO14044 (ISO, 2006b).
2.2.8.1 Temporal Coverage
Primary data collected from the participating companies and associations for their opera‐tional activities are representative for the year 2006 (reference year). Additional data necessary to model base material production and energy generation, etc. were adopted from the GaBi 4 software system database. The most recent North American LCI sub‐dataset from the International Aluminum Institute (IAI) LCI Dataset for primary aluminum dates back to 2005. This deviation from the defined reference year has been taken into account as it is being assumed that there are no radical changes in the technology for rolling operations and can manufacturing from the year 2005 to 2006.
Cha
pter
: Goa
l and
Sco
pe o
f th
e S
tudy
2.2.8.2 Geographical Coverage
The geographical coverage for this study is as follows:
Primary Aluminum Production ‐ North America,
Data source: IAI, representative for North American situation
Aluminum Sheet Rolling – United States
3 major sheet producers (4 sites) in the US accounting for about 1.7 million tons of sheet produced in the US
Can Manufacturing – United States
Data source: CMI,representative for operations in the U.S
Secondary Aluminum Production – United States
Data source: 4 of the largest producers (5 sites) of secondary aluminum in the US cover‐ing about 2 million metric tons of secondary aluminium production.
2.2.8.3 Technological Coverage
In this study, site‐specific data representing the current technology mix for aluminum can sheet production, can manufacture, and secondary aluminum production was collected. Primary aluminum production data (including bauxite mining, alumina refining, aluminum smelting, and pri‐mary ingot production) in North America were provided by the IAI. The scope of the IAI data on primary aluminum production in North America is as follows:
Bauxite mining – global average,
Alumina refining – global average,
Electrolysis – North America,
Primary ingot casting – North America.
Ancillary and process material data, such as the production of chemicals, fuels, energy and power, was adopted as average industry mixes from the GaBi 4 software system database (current release GaBi 4.3, http://www.gabi‐software.com).
2.2.8.4 Completeness
During the data collection, each production facility was required to assign a data quality in‐dicator to the data reported. The data quality indicators are classified as follows:
Measured ‐ If the data value reported is based upon continuous physical measurement (e.g. electricity or water consumption is based upon measurement of respective meters at the fa‐cility),
Calculated ‐ If the data reported has been calculated using a certain empirical formula or factors (e.g. emission factor for CO2 or SO2 depending upon the type of fuel used and proc‐ess technology),
Averaged ‐ If the data reported is based upon an average of a number of values or meas‐urements (e.g. the amount of smelting slag generated),

Final Report: Can LCA
PE Americas
Estimated ‐ If the data reported is based upon informed estimates or expert judgment (e.g. the distance the raw materials are transported before they arrive at the facility).
Although it is difficult to conduct a comprehensive data quality and reliability check on the data reported from several production sites, consistency and quality checks for mass and energy balance results were conducted and results compared with published data ‐ particularly process and flow data in previous LCI studies. The checks showed that the reported data was in the range re‐ported by similar studies within comparable boundary conditions. In addition the data quality was evaluated using the Weidema methodology on LCA data quality (Weidema et al., International Jour‐nal of LCA 3 (5) page 259‐265; 1998). Appendix D shows the results of the evaluation as well as the applied evaluation criteria for data quality, ranging for one to five, where one is the best quality and five the most uncertain. The evaluation showed the data conformed to criteria values of one or two (see Appendix D).
This quality assurance (QA) process was performed at different stages of the project. The objective of the QA process was to ensure that the data collection, the development of the LCI mod‐el, and the final results are consistent with the scope of the study and that the study delivers the required information.
2.2.9 Critical Review
The results of the LCA study are intended to support external communication; therefore in order to be compliant with ISO 14044, a critical review of the study was conducted.
The goal and scope of the critical review is defined in accordance with ISO 14044, paragraph 6.1. Following ISO 14044, the critical review process shall ensure that (ISO, 2006b):
the methods used to carry out the LCA are consistent with this International Standard
the methods used to carry out the LCA are scientifically and technically valid
the data used are appropriate and reasonable in relation to the goal of the study
the interpretations reflect the limitations identified and the goal of the study
the study report is transparent and consistent
The review of this study was done by the LCI core group members and an independent re‐view panel comprised of the following members:
Todd Boggess [Secat], Chair
Mary Ann Curran [United States Environmental Protection Agency]
Bruce Vigon [SETAC]
A dialogue between the critical reviewers and the project team allowed continual integra‐tion of critical review feedback into the structure of the study, and the drafting of this final report.

Cha
pter
: Prim
ary
Alu
min
um P
rodu
ctio
n
3 PRIMARY ALUMINUM PRODUCTION This chapter describes the unit processes associated with primary aluminum ingot produc‐
tion. The following sections cover a description of the process being modeled (Chapter 3.1), presen‐tation of the LCI results (Chapter 3.2) and presentation of the LCIA Results (Chapter 3.3). The rele‐vant supporting information used to model the LCI profile of a primary aluminum ingot produced in North America is noted where relevant to the portions of this section (e.g. IAI, 2005; USGS, 2006, 2007).
3.1 PROCESS DESCRIPTION The life cycle stages of primary aluminum material processing includes the component proc‐
esses of bauxite mining, alumina refining, electrolysis (including smelting and anode production), and primary ingot casting. A process flow diagram is shown in Figure 5. The initial raw material is the bauxite ore and final product is the primary aluminum ingot with intermediate products of alumina (aluminum oxide) and aluminum (liquid) metal.
Figure 5: Process chain for the production of 1000 kg of primary aluminum.
In this study, the primary aluminum production in the U.S. is modeled based upon the LCI data obtained from IAI and statistics on bauxite, alumina and aluminum published annually by the
Final Report: Can LCA
PE Americas
U.S. Geological Survey (USGS). Overall, the data quality and consistency of the IAI data has been identified to be of high quality.
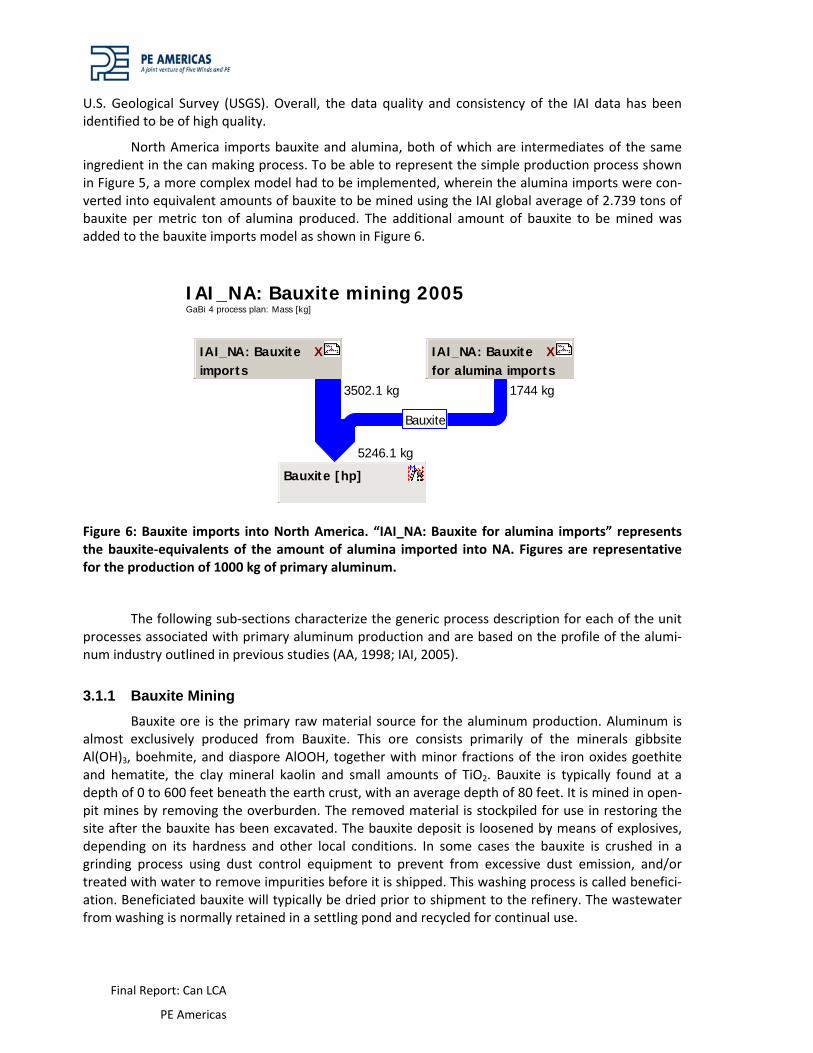
North America imports bauxite and alumina, both of which are intermediates of the same ingredient in the can making process. To be able to represent the simple production process shown in Figure 5, a more complex model had to be implemented, wherein the alumina imports were con‐verted into equivalent amounts of bauxite to be mined using the IAI global average of 2.739 tons of bauxite per metric ton of alumina produced. The additional amount of bauxite to be mined was added to the bauxite imports model as shown in Figure 6.
IAI_NA: Bauxite mining 2005GaBi 4 process plan: Mass [kg]
Bauxite
3502.1 kg 1744 kg
5246.1 kg
XIAI_NA: Bauxitefor alumina imports
XIAI_NA: Bauxiteimports
Bauxite [hp]
Figure 6: Bauxite imports into North America. “IAI_NA: Bauxite for alumina imports” represents the bauxite‐equivalents of the amount of alumina imported into NA. Figures are representative for the production of 1000 kg of primary aluminum.
The following sub‐sections characterize the generic process description for each of the unit processes associated with primary aluminum production and are based on the profile of the alumi‐num industry outlined in previous studies (AA, 1998; IAI, 2005).
3.1.1 Bauxite Mining
Bauxite ore is the primary raw material source for the aluminum production. Aluminum is almost exclusively produced from Bauxite. This ore consists primarily of the minerals gibbsite Al(OH)3, boehmite, and diaspore AlOOH, together with minor fractions of the iron oxides goethite and hematite, the clay mineral kaolin and small amounts of TiO2. Bauxite is typically found at a depth of 0 to 600 feet beneath the earth crust, with an average depth of 80 feet. It is mined in open‐pit mines by removing the overburden. The removed material is stockpiled for use in restoring the site after the bauxite has been excavated. The bauxite deposit is loosened by means of explosives, depending on its hardness and other local conditions. In some cases the bauxite is crushed in a grinding process using dust control equipment to prevent from excessive dust emission, and/or treated with water to remove impurities before it is shipped. This washing process is called benefici‐ation. Beneficiated bauxite will typically be dried prior to shipment to the refinery. The wastewater from washing is normally retained in a settling pond and recycled for continual use.

Cha
pter
: Prim
ary
Alu
min
um P
rodu
ctio
n
This bauxite mining unit process begins with the extraction and processing of the bauxite ore and it ends with the output of beneficiated bauxite to be refined in the subsequent process to produce alumina. The operations associated with this unit process include (AA, 1999; IAI, 2005):
The extraction of bauxite rich minerals on‐site,
Beneficiation activities such as grinding, washing, screening, and drying,
Treatment of mining site residues and waste, and
Restoration activities such as grading, dressing, and planting.
Unit process inputs and outputs are show in Table 3.
Table 3 Inputs and outputs for the bauxite mining process. Flows are representative for 1000 kg primary aluminum production
Flow Unit Amount
Inputs
Diesel [Crude oil products] kg 6.0436
Power [Electric power] MJ 36.21
Thermal energy (heavy fuel oil) [Thermal energy] MJ 52.89
Thermal energy (natural gas) [Thermal energy] MJ 0.07
Bauxite [Non renewable resources] kg 5775.8
Water (sea water) [Water] kg 302
Water (surface water) [Water] kg 2633.7
Outputs
Bauxite [Inorganic intermediate products] kg 5246.2
Dust (unspecified) [Particles to air] kg 5.1
Overburden (deposited) [Stockpile goods] kg 529.6
Steam [Inorganic emissions to air] kg 143.6
Water (sea water) [Water] kg 261.6
Water (surface water) [Water] kg 2514.9
The domestic bauxite production in the US is less than 1% of the total demand of bauxite (USGS, 2007). Most of the domestically produced bauxite is utilized for non‐metallurgical applica‐tions such as abrasives, chemical, refractory materials (USGS, 2007). Therefore, the bauxite demand for metallurgical purposes (i.e. to produce metallic aluminum) in the U.S. is primarily met through
Final Report: Can LCA
PE Americas
imports. The bauxite imports based on their country of origin to the U.S. in 2005 is given in Table 4. Brazil is the largest exporter of bauxite (accounting for approximately 33% of the total bauxite im‐ports to the U.S.) followed by Guinea and Jamaica. The group of countries included in the “Others” category are China, India, the Dominican Republic and Venezuela.
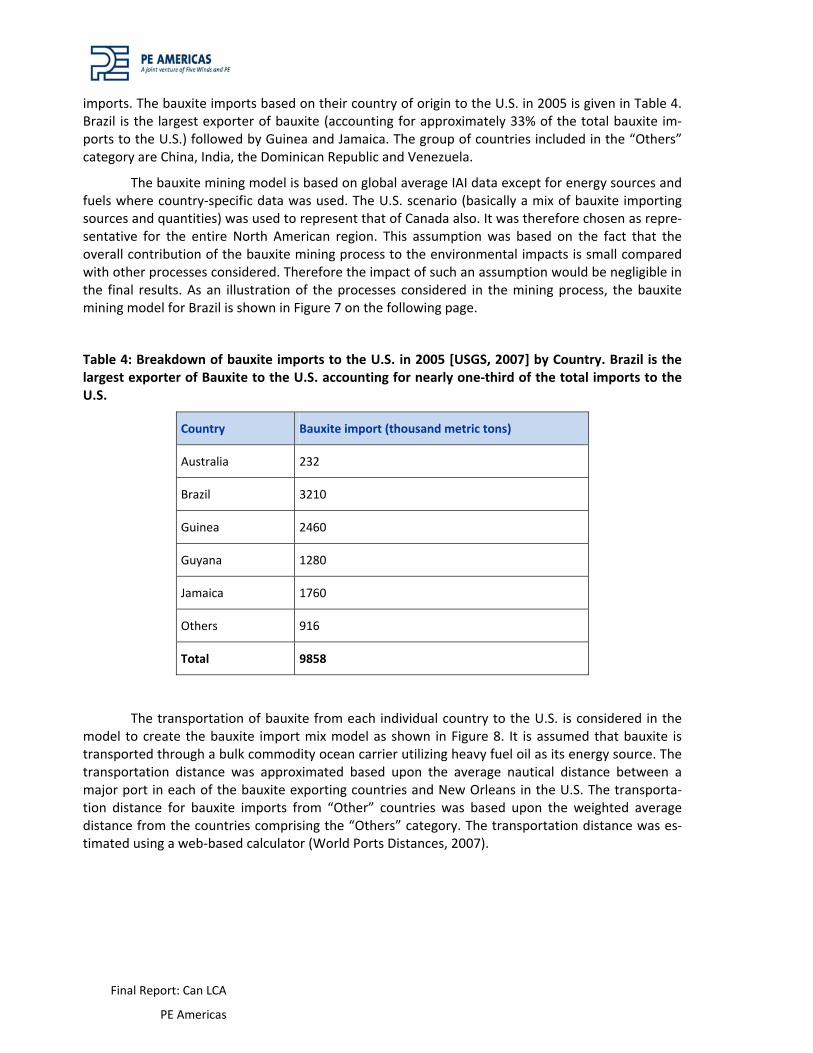
The bauxite mining model is based on global average IAI data except for energy sources and fuels where country‐specific data was used. The U.S. scenario (basically a mix of bauxite importing sources and quantities) was used to represent that of Canada also. It was therefore chosen as repre‐sentative for the entire North American region. This assumption was based on the fact that the overall contribution of the bauxite mining process to the environmental impacts is small compared with other processes considered. Therefore the impact of such an assumption would be negligible in the final results. As an illustration of the processes considered in the mining process, the bauxite mining model for Brazil is shown in Figure 7 on the following page.
Table 4: Breakdown of bauxite imports to the U.S. in 2005 [USGS, 2007] by Country. Brazil is the largest exporter of Bauxite to the U.S. accounting for nearly one‐third of the total imports to the U.S.
Country Bauxite import (thousand metric tons)
Australia 232
Brazil 3210
Guinea 2460
Guyana 1280
Jamaica 1760
Others 916
Total 9858
The transportation of bauxite from each individual country to the U.S. is considered in the model to create the bauxite import mix model as shown in Figure 8. It is assumed that bauxite is transported through a bulk commodity ocean carrier utilizing heavy fuel oil as its energy source. The transportation distance was approximated based upon the average nautical distance between a major port in each of the bauxite exporting countries and New Orleans in the U.S. The transporta‐tion distance for bauxite imports from “Other” countries was based upon the weighted average distance from the countries comprising the “Others” category. The transportation distance was es‐timated using a web‐based calculator (World Ports Distances, 2007).
Cha
pter
: Prim
ary
Alu
min
um P
rodu
ctio
n
Figure 7: Bauxite mining in Brazil. Figure used as an example to illustrate the mining process mod‐eled for the LCI. Flows are representative for the production of 1000 kg of primary aluminum (scaled to the share of bauxite imports from Brazil).
3.1.2 Alumina Production
Alumina refining comprises the conversion of bauxite to aluminum oxide Al2O3 (alumina) us‐ing the Bayer process (e.g. Chin 1988; Droy and Michaux 2003; Mylona et al. 2003; Frank et al. 2008). Most refineries use a mixture of blended bauxite to provide feedstock with consistent prop‐erties. The mixture is ground and blended with recycled plant liquor. This liquor contains dissolved sodium carbonate and sodium hydroxide recovered from previous extraction cycles plus super‐natant liquor recycled from red mud holding ponds. The slurry is heated and pumped to digesters, which are heated in pressure tanks. In digestion, iron and silicon impurities form insoluble oxides called red mud. The red mud settles out and a rich concentration of sodium aluminates is filtered and seeded to form hydrate alumina crystals in precipitators. These crystals are then heated in a calcination process. The heat in the calciners drives off combined water leaving alumina.
This step of manufacturing begins with the processing of beneficiated bauxite and ends with the output of alumina to be subsequently processed in the smelter. The operations associated with this unit process include (AA, 1999; IAI, 2005):
bauxite grinding, digestion, and processing of liquors,
alumina precipitation and calcination,
maintenance and repair of plants and equipment, and
treatment of process air, liquids, and solids.
The unit process inputs and outputs are listed in Table 5.

Final Report: Can LCA
PE Americas
IAI_NA: Bauxite mining (Bauxite imports)GaBi 4 process plan: Mass [kg]
Bauxite fromAustralia82.42 kg
Bauxite from Brazil1140.4 kg
Bauxite from Guinea873.93 kg
Bauxite from Guyana454.73 kg
Bauxite fromJamaica625.25 kg
Bauxite from othercountries325.42 kg
Bauxite
3502.1 kg
pAU: Bauxitemining with transport
pBR: Bauxitemining with transport
pGN: Bauxitemining with transport
pGY: Bauxitemining with transport
pJA: Bauxitemining with transport
pGLO: Bauxitemining with transport
XpBauxite importsmixer [hp]
Product
Figure 8: The transportation of Bauxite imported to the US is included in each country‐specific model. Prefixes for labels are standard country codes and represent country‐specific mining mod‐els already discussed. GLO represents the global average mining model applied to mining from other minor exporting countries. Flow quantities are representative of 1000 kg of primary alumi‐num production (scaled to the share of bauxite imports).
Table 5: Inputs and outputs for the Alumina production unit process. Flows are representative for 1000 kg primary aluminum production.
Flows Unit Amount
Inputs
Inorganic intermediate products
Bauxite kg 5246.2
Sodium hydroxide (50%; caustic soda) kg 172
Lime quicklime (lumpy) [Minerals] kg 75.5

Cha
pter
: Prim
ary
Alu
min
um P
rodu
ctio
n
Energy and fuel inputs
Diesel kg 1.31
Power [Electric power] MJ 865.6
Thermal energy from hard coal MJ 3060.2
Thermal energy from heavy fuel oil MJ 7851.7
Thermal energy from natural gas MJ 7909.6
Water
Sea water kg 201.2
Surface water kg 15190
Outputs
Products
Aluminum oxide (alumina) kg 1915.4
Waste for recovery
Lubricant (grease) [Hazardous waste for recovery] kg 0.91
Waste for disposal
Red mud (dry) [Hazardous waste for disposal] kg 2187
Industrial waste for municipal disposal kg 29.3
Waste (solid) kg 47.1
Sand (Alumina production) kg 58.3
Emissions to air
Steam kg 4989.7
Mercury (+II) kg 4.02E‐04
Emissions to water
Solids (suspended) kg 0.091
Water (sea water) kg 241.4
Water (surface water) kg 10160.5

Final Report: Can LCA
PE Americas
According to the IAI, the production of 1 metric ton of alumina requires approximately 2.739 metric tons of bauxite (taking into account the purity of bauxite and losses during processing and transportation) (IAI, 2005). This is a global representative average that has been adopted to model the alumina production process in North America. The alumina production process is shown in Figure 9.

Cha
pter
: Prim
ary
Alu
min
um P
rodu
ctio
n
Figure 9: Alumina (Al2O3) production process in the U.S. in 2005. Flow quantities are representative of 1000 kg of primary aluminum production (scaled to the share of direct alumina production).

Final Report: Can LCA
PE Americas
According to the USGS, the U.S. imported 1,866,000 metric tons of alumina and domestically produced 4,724,000 metric tons of alumina in 2005 (USGS, 2007). The fraction of alumina imports to total alumina consumed for primary aluminum production is approximately 40% (Figure 10).
IAI_NA: Alumina (Production + Imports)GaBi 4 process plan: Mass [kg]
Aluminum oxide(alumina)
1160,7 kg 754,66 kg
1915,4 kg
XIAI_NA:ALUMINA (USA)
XAlumina <hp>
IAI_NA: ALUMINAImports to USA
Figure 10: Breakdown of alumina imports and domestically produced alumina in the U.S. in 2005. Flows are representative for producing 1000 kg of primary aluminum.
The imports of alumina from Australia and Suriname accounted for approximately 80% of the total alumina imports to the U.S. The country‐specific breakdown of alumina imports to the U.S. in 2005 is given in Table 6. The transportation of alumina imported to the US is included in each country‐specific model.

Cha
pter
: Prim
ary
Alu
min
um P
rodu
ctio
n
Table 6: Country‐wise breakdown of alumina imports to the U.S. in 2005 [USGS, 2007]
Country Alumina imports (thousand metric tons)
Australia 932
Brazil 17
Canada 103
China 10
France 16
Germany 49
Jamaica 116
Japan 5
Suriname 560
Venezuela 27
Others 31
Total 1866
As with the bauxite mining process, it was assumed that the alumina production in the U.S is representative of the entire North American region. As the contribution of the processes involved in producing alumina from bauxite plays a significant role in the environmental impacts of the entire can‐making process, this assumption was based upon two key factors: (1) The fact that the most significant environmental factor in alumina production is energy derived directly from fossil fuels (see Figure 9) and therefore, any differences in the results would be minor and only contributed by the difference in efficiencies of the energy converters. (2) The difference in environmental impacts (e.g. GWP‐100) between imported and domestically produced alumina is less than 1% and therefore differences in this ratio for Canada do not affect results significantly. A simple sensitivity analysis was used to confirm these assertions.
3.1.3 Anode Production
There are two generic types of reduction cells: prebake and Söderberg (Anseen, Okstad, In‐nvar, & Olsen, 1979;Bergsdal, Strömann, & Hertwich, 2004; IAI, 2005). The Söderberg design has a single anode which covers most of the top surface of the reduction cell. Anode paste (briquettes) is fed to the top of the anode and as the anode is consumed in the process, the paste feeds downward by gravity. Heat from the pot bakes the paste into a monolithic mass before it gets to the electrolytic bath interface.

Final Report: Can LCA
PE Americas
The prebake design has pre‐fired blocks of solid carbon suspended from axial busbars. The busbars both hold the anodes in place and carry the current required for electrolysis.
The process for making the aggregate for briquettes or prebake blocks is identical. Coke is calcined, ground and blended with pitch to form a paste that is subsequently extruded into blocks or briquettes and allowed to cool. While the briquettes are sent directly to the pots for consumption, the blocks are then sent to a separate baking furnace.
Baking furnace technology has evolved from simple pits that discharged volatiles to the at‐mosphere during the baking cycle to closed loop type designs that convert the caloric heat of the volatile into a process fuel that reduces net energy consumption. The IAI data for electrolysis repre‐sents 85% of production from prebake facilities and the remaining 15% from Söderberg facilities (IAI, 2005).
The operations associated with anode production include (AA, 1999; IAI, 2005):
recovery of spent anode materials,
anode mix preparation, block or briquette forming and baking,
rodding of baked anodes,
maintenance and repair of plant and equipment, and
treatment of process air, liquids, and solids.
An illustration of the anode production process implemented in the model is shown in Figure 11. The unit process inputs and outputs are listed in Table 7. Note that for all unit processes, only reported values of carbon dioxide are listed here. These (when shown) are direct emissions from fuel consumption. Note: for the calculation of the LCI and LCIA results, these reported values were excluded and standard GaBi processes were used to calculate emissions. This approach guar‐antees that all emissions are accounted for correctly and accurately.
Table 7: Inputs and outputs for the anode production unit process. Flows are representative for the production of 1000 kg of primary aluminum.
Flow Unit Amount
Inputs
Materials
Coke (C carrier) kg 345.2
Hard coal pitch‐Mix (C Träger) kg 92.32
Refractory [Minerals] kg 5.819
Steel sheet part (St) [Metal parts] kg 1.706
Cooling water kg 200.7
Energy and Fuels

Cha
pter
: Prim
ary
Alu
min
um P
rodu
ctio
n
Diesel kg 0.401
Power [Electric power] MJ 213.13
Thermal energy from hard coal MJ 45.16
Thermal energy from heavy fuel oil MJ 93.32
Thermal energy from natural gas MJ 1035.6
Outputs
Products
Anode (C carrier) kg 437.5
Emissions to air
Carbon dioxide kg 177.6
Fluorides kg 0.004
Benzo{a}pyrene [Group PAH to air] kg 3.48E‐05
Polycyclic aromatic hydrocarbons [Group PAH to air] kg 0.0281
Emissions to water
Fluoride kg 0.0002
Oil (unspecified) kg 5.02E‐05
Polycyclic aromatic hydrocarbons (PAH) kg 5.52E‐05
Solids (suspended) kg 0.0005
3.1.4 Aluminum Smelting
Molten aluminum is produced from alumina by the Hall‐Heroult electrolytic process (e.g. Frank, et al., 2008; Grjotheim & Kvande, 1993). This involves two steps: dissolving the alumina (Al2O3) produced in the preceding aluminum refining step in a molten cryolitic bath, and passing electric current through this solution, thereby decomposing the alumina into aluminum and oxygen. Aluminum is tapped out of the reduction cell (pot) at daily intervals and the oxygen bonds with the carbon to form carbon dioxide and carbon monoxide.
Aluminum smelters typically use air pollution control systems to monitor and reduce emis‐sions. The primary system is typically a scrubber. Some plants use dry scrubbers with alumina as the absorbent that is subsequently fed to the pots and allows for the recovery of scrubbed materials. Other plants use wet scrubbers, which re‐circulate an alkaline solution to absorb emissions. Unlike dry scrubbers, wet scrubbers absorb carbon dioxide, nitrogen oxide and sulfur dioxide that are en‐trained in the waste water liquor.

Final Report: Can LCA
PE Americas
This unit process begins with the processing of alumina and ends with the output of molten primary aluminum to be subsequently cast into primary ingot in the casting process. The operations associated with electrolysis include (AA, 1999; IAI, 2005):
recovery, preparation, and handling of process materials,
manufacture of major process equipment (e.g., cathode shells),
process of control activities (metal, bath, heat),
maintenance and repair of plant and equipment, and
treatment of process air, liquids, and solids.
The total crude aluminum consumption in the U.S. in the year 2005 is shown in the Table 8. The domestic production of primary aluminum in the U.S. and imports from Canada account for approximately 42% and 32%, respectively, of the total crude aluminum consumption.

Cha
pter
: Prim
ary
Alu
min
um P
rodu
ctio
n
Figure 11: Illustration of the Anode production process. All flows are representative for 1000 kg primary Al. production (domestic component).
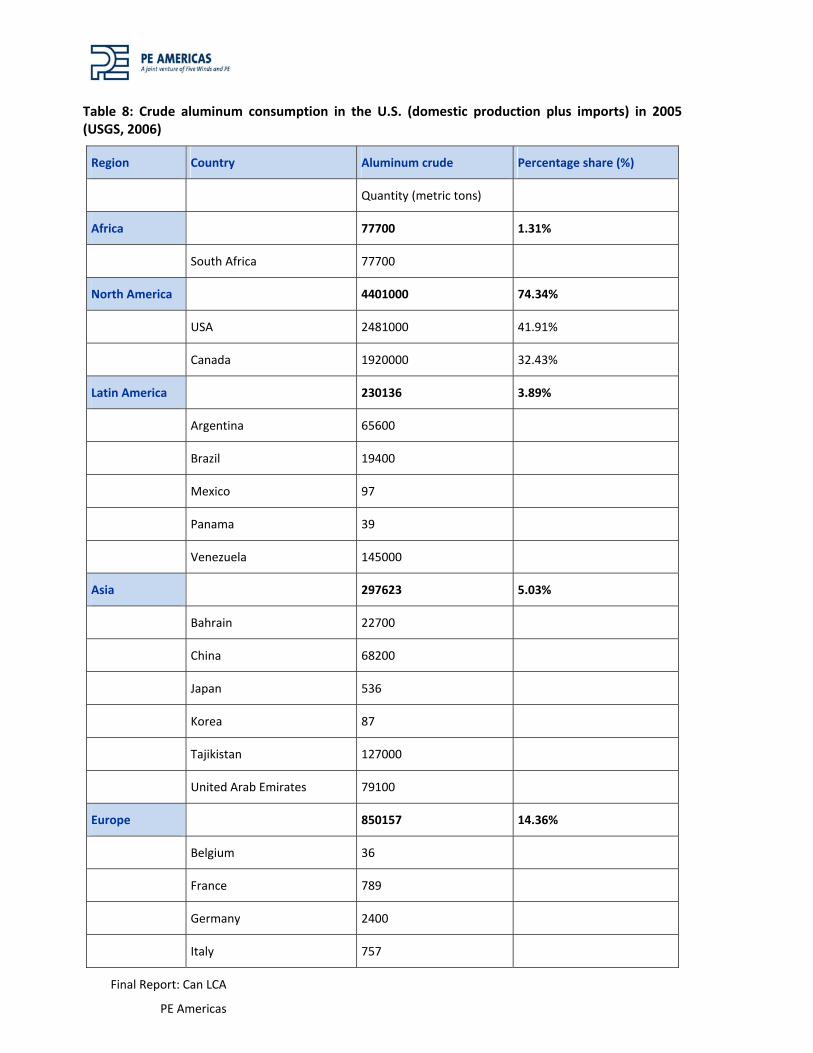
Final Report: Can LCA
PE Americas
Table 8: Crude aluminum consumption in the U.S. (domestic production plus imports) in 2005 (USGS, 2006)
Region Country Aluminum crude Percentage share (%)
Quantity (metric tons)
Africa 77700 1.31%
South Africa 77700
North America 4401000 74.34%
USA 2481000 41.91%
Canada 1920000 32.43%
Latin America 230136 3.89%
Argentina 65600
Brazil 19400
Mexico 97
Panama 39
Venezuela 145000
Asia 297623 5.03%
Bahrain 22700
China 68200
Japan 536
Korea 87
Tajikistan 127000
United Arab Emirates 79100
Europe 850157 14.36%
Belgium 36
France 789
Germany 2400
Italy 757

Cha
pter
: Prim
ary
Alu
min
um P
rodu
ctio
n
Netherlands 436
Norway 4060
Spain 79
UK 22600
Russia 819000
Oceania 63200 1.07%
Australia 63200
Total 5919816 100%
The imports of crude aluminum to the U.S. (excluding Canada) account for 26% of the total consumption and therefore, the North American share (U.S. and Canada) is 74%. The breakdown of the electrolysis mix into imported and domestic components is highlighted in Figure 12.
Figure 12: Electrolysis mix representative for the U.S. in 2005. All flows are representative for pro‐ducing 1000 kg of primary aluminum.
The electrolysis process models for domestic production and import mix are shown in Figure 13 and Figure 14, respectively. Table 9 and Table 10 list the inputs and outputs of these two proc‐esses.
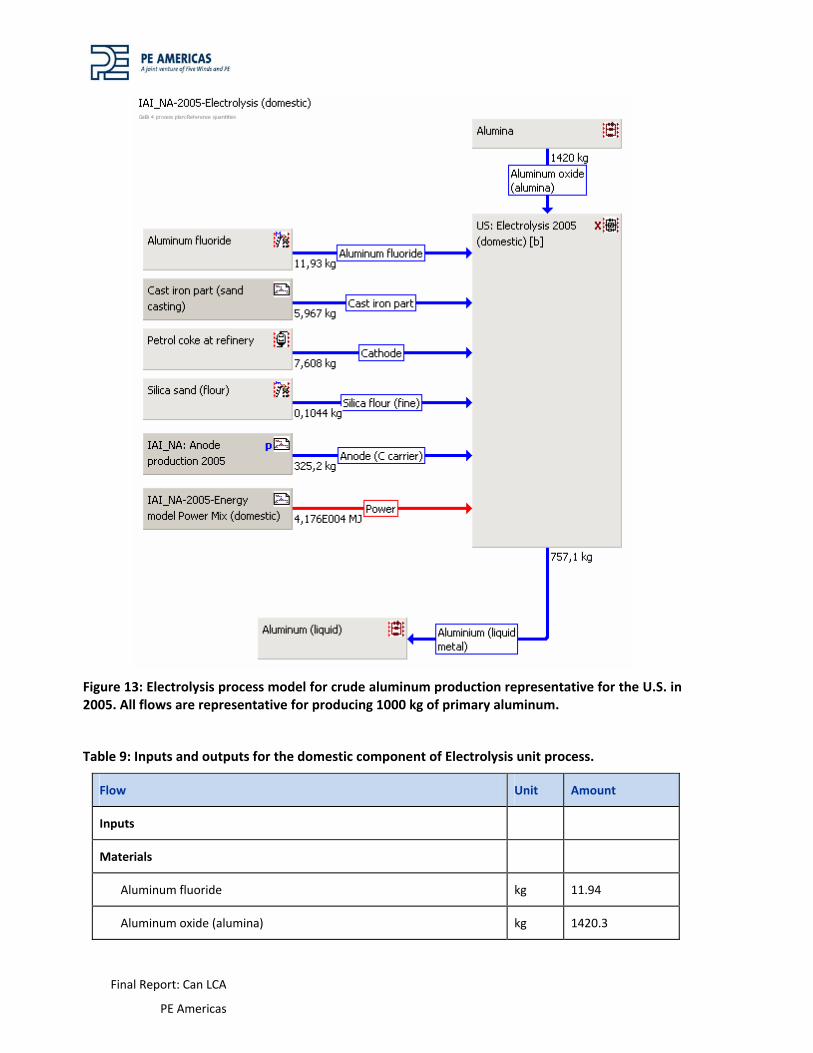
Final Report: Can LCA
PE Americas
Figure 13: Electrolysis process model for crude aluminum production representative for the U.S. in 2005. All flows are representative for producing 1000 kg of primary aluminum.
Table 9: Inputs and outputs for the domestic component of Electrolysis unit process.
Flow Unit Amount
Inputs
Materials
Aluminum fluoride kg 11.94
Aluminum oxide (alumina) kg 1420.3
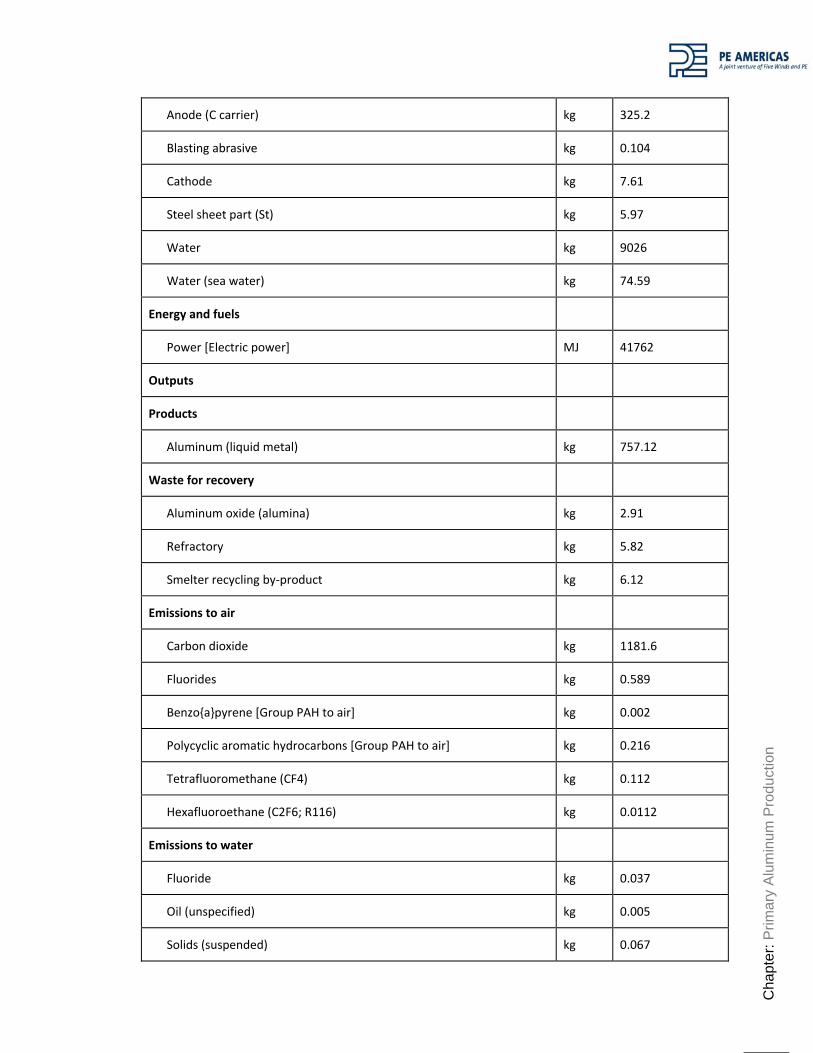
Cha
pter
: Prim
ary
Alu
min
um P
rodu
ctio
n
Anode (C carrier) kg 325.2
Blasting abrasive kg 0.104
Cathode kg 7.61
Steel sheet part (St) kg 5.97
Water kg 9026
Water (sea water) kg 74.59
Energy and fuels
Power [Electric power] MJ 41762
Outputs
Products
Aluminum (liquid metal) kg 757.12
Waste for recovery
Aluminum oxide (alumina) kg 2.91
Refractory kg 5.82
Smelter recycling by‐product kg 6.12
Emissions to air
Carbon dioxide kg 1181.6
Fluorides kg 0.589
Benzo{a}pyrene [Group PAH to air] kg 0.002
Polycyclic aromatic hydrocarbons [Group PAH to air] kg 0.216
Tetrafluoromethane (CF4) kg 0.112
Hexafluoroethane (C2F6; R116) kg 0.0112
Emissions to water
Fluoride kg 0.037
Oil (unspecified) kg 0.005
Solids (suspended) kg 0.067

Final Report: Can LCA
PE Americas
Polycyclic aromatic hydrocarbons (PAH, unspec.) kg 1.79E‐04
Hazardous waste
Carbon (unspecified) kg 5.45
Refractory kg 10.67
Sludge kg 12.83
Water [Water] kg 11860
Water (sea water) [Water] kg 74.6
IAI_NA-2005-Electrolysis (imports)GaBi 4 process plan:Reference quantities
Aluminum fluoride4,223 kg
Power1,417E004 MJ
Cast iron part1,699 kg
Anode (C carrier)112 kg
Cathode2,06 kg
Aluminium (liquidmetal)
261,3 kg
Aluminum oxide(alumina)
495,1 kg
Aluminum fluoride
Cast iron part (sandcasting)
XGLO: Electrolysis2005 (US imports) [b]<b>
pIAI_NA: Anodeproduction 2005
Petrol coke atrefinery
IAI_NA-2005-Energy model Power Mix
Aluminum (liquid)
Alumina
Figure 14: Electrolysis process model for crude aluminum imported to the U.S. as representative for 2005. All flows are representative for producing 1000 kg of primary aluminum.

Cha
pter
: Prim
ary
Alu
min
um P
rodu
ctio
n
In the electrolysis process, electrical energy is the primary energy resource. The electrical power mix model for electrolysis is discussed below in Section 3.1.6. In this study, the power con‐sumption of electrolysis is found to be 15552 kWh per metric ton of primary aluminum. Overall, according to IAI, the world average power consumption of the electrolysis process is 15289 kWh per metric ton of primary aluminum.
Table 10: Inputs and outputs for the imported component of Electrolysis unit process
Flow Unit Amount
Inputs
Materials
Aluminum fluoride kg 4.22
Aluminum oxide (alumina) kg 495.1
Anode (C carrier) kg 112
Cathode kg 2.059
Steel sheet part (St) kg 1.699
Water kg 2755
Water (sea water) kg 4531.5
Energy and fuels
Power [Electric power] MJ 14169
Outputs
Products
Aluminum (liquid metal) kg 261.3
Emissions to air
Carbon dioxide kg 401
Fluorides kg 0.268
Tetrafluoromethane (CF4) kg 0.039
Hexafluoroethane (C2F6; R116) kg 0.004
Polycyclic aromatic hydrocarbons (PAH) [Group PAH to air] kg 0.075
Benzo{a}pyrene [Group PAH to air] kg 6.69E‐04

Final Report: Can LCA
PE Americas
Emissions to water
Solids (suspended) kg 0.052
Fluoride kg 0.082
Polycyclic aromatic hydrocarbons (PAH, unspec.) kg 4.22E‐04
Oil (unspecified) kg 0.002
Hazardous waste
Refractory kg 3.527
Carbon (unspecified) kg 3.012
Sludge kg 1.210
Waste for recovery
Refractory kg 1.622
Smelter recycling by‐product kg 2.292
Aluminum oxide (alumina) kg 0.669
Water [Water] kg 2626.3
Water (sea water) [Water] kg 4.532
PFC (Perfluorocarbon) generation in Aluminum Smelting
PFC emissions in the aluminum smelting process are listed in Table 9 and Table 10 (as Hexaf‐louroethane and Tetrafluoroethane) for domestic and imported components respectively. It is estimated that 165.5g of PFCs are emitted per ton of primary aluminum production (IAI, 2005). CO2 equivalents are calculated based on CML 20013 values of 5700 (kg) for CF4 and 11900 (kg) for C2F6 and are listed in Table 15.
3.1.5 Primary Ingot Casting (Cast House)
Molten metal siphoned from the pots is sent to a resident cast house found in each smelter. In some cases, due to proximity, molten metal is transported directly to a shape casting foundry. Molten metal is then transferred to a holding furnace where the composition is adjusted to the spe‐cific alloy requested by a customer. In some instances, depending on the application and the bath composition in the pots, some initial hot metal treatment to remove impurities may be done.
3 The USEPA and other governments are still using the IPCC 2nd Assessment values of 6,500 for CF4 and 9,200 for C2F6.

Cha
pter
: Prim
ary
Alu
min
um P
rodu
ctio
n
When the alloying is complete, the melt is fluxed to remove impurities and reduce gas con‐tent. The fluxing consists of slowly bubbling a combination of nitrogen and chlorine or of carbon monoxide, argon, and chlorine through the metal. Fluxing may also be accomplished with an inline degassing technology which performs the same function in a specialized degassing unit.
Fluxing removes entrained gases and inorganic particulates by flotation to the surface of the metal. These impurities (typically called dross) are skimmed off. The skimming process also takes some aluminum and drosses are normally further processed to recover the aluminum content and to make products used in the abrasives and insulation industries.
Depending on the application, metal is then processed through an inline filter to remove any oxides that may have formed. Subsequently, metal is cast into ingots in a variety of methods: open molds (typically for remelt ingot), through direct chill molds for various fabrication shapes, electro‐magnetic molds for some sheet ingots, and through continuous casters for aluminum coils.
This unit process begins with the processing of molten primary aluminum and ends with the output of sheet ingot suitable for rolling, extruding, or shape casting. The various operations carried out in the cast house include (AA, 1999; IAI, 2005):
Pretreatment of hot metal (cleaning and auxiliary heating);
Recovery and handling of internal process scrap;
Batching, metal treatment, and casting operations;
Homogenizing, sawing, and packaging and casting operations;
Maintenance and repair of plant and equipment; and
Treatment of process air, liquids, and solids.
The model for the primary ingot casting process is shown in Figure 15 . Following the IAI in‐ventory data (IAI, 2005), alloying materials are not considered in the model. The ingot is considered to be composed of 100% aluminum as can be seen in the figure where the alloying process box is used only to re‐introduce recycled dross back into the casting process. For the purpose of simplify‐ing the model, the deficit from the otherwise expected 15kg input of alloying material is obtained from the aluminum DC cast ingot.
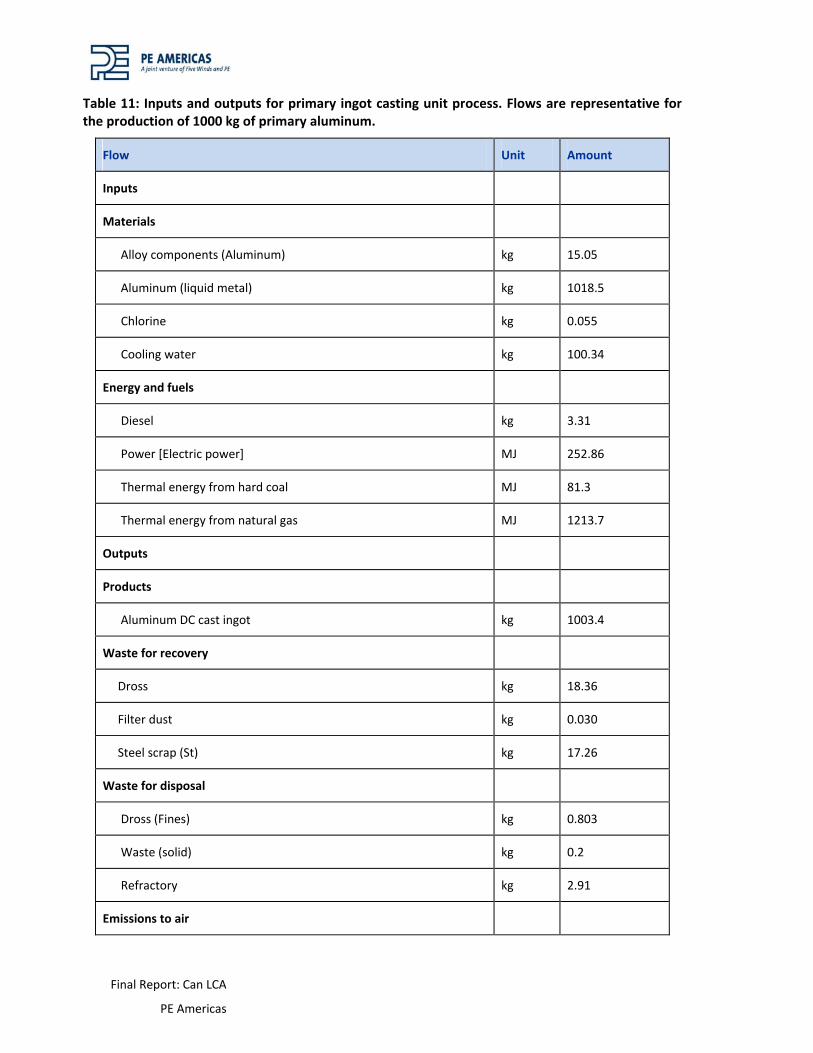
Final Report: Can LCA
PE Americas
Table 11: Inputs and outputs for primary ingot casting unit process. Flows are representative for the production of 1000 kg of primary aluminum.
Flow Unit Amount
Inputs
Materials
Alloy components (Aluminum) kg 15.05
Aluminum (liquid metal) kg 1018.5
Chlorine kg 0.055
Cooling water kg 100.34
Energy and fuels
Diesel kg 3.31
Power [Electric power] MJ 252.86
Thermal energy from hard coal MJ 81.3
Thermal energy from natural gas MJ 1213.7
Outputs
Products
Aluminum DC cast ingot kg 1003.4
Waste for recovery
Dross kg 18.36
Filter dust kg 0.030
Steel scrap (St) kg 17.26
Waste for disposal
Dross (Fines) kg 0.803
Waste (solid) kg 0.2
Refractory kg 2.91
Emissions to air
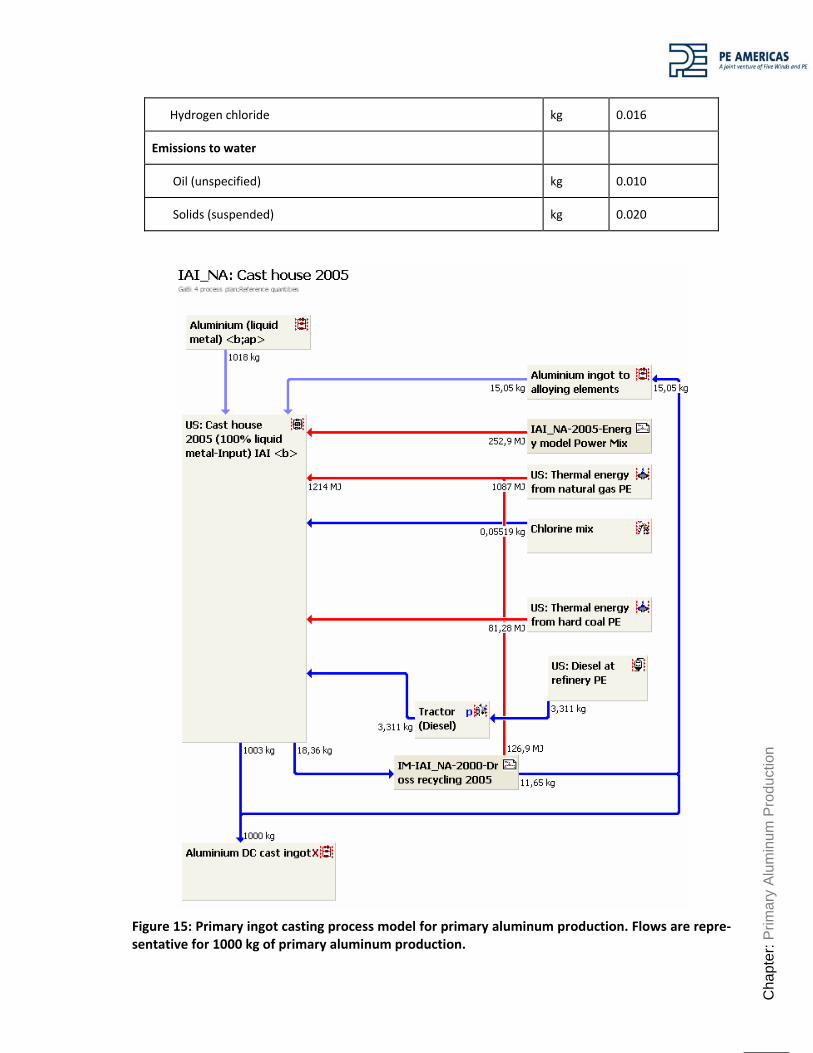
Cha
pter
: Prim
ary
Alu
min
um P
rodu
ctio
n
Hydrogen chloride kg 0.016
Emissions to water
Oil (unspecified) kg 0.010
Solids (suspended) kg 0.020
Figure 15: Primary ingot casting process model for primary aluminum production. Flows are repre‐sentative for 1000 kg of primary aluminum production.
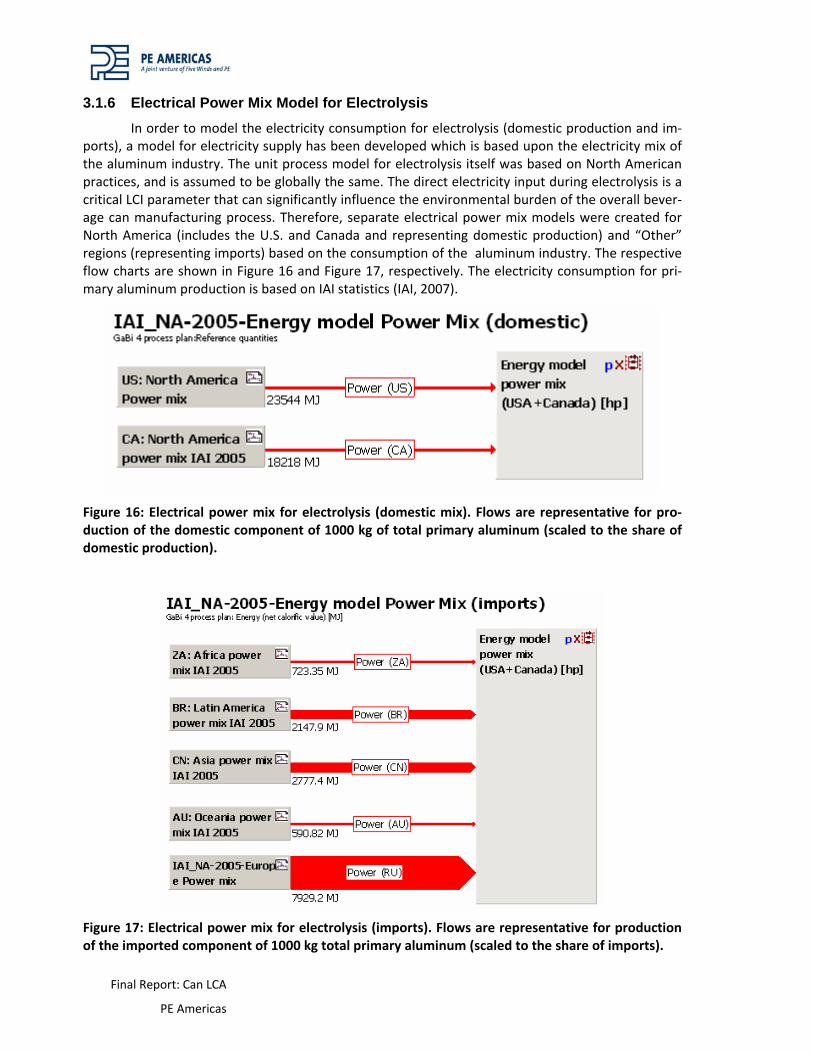
Final Report: Can LCA
PE Americas
3.1.6 Electrical Power Mix Model for Electrolysis
In order to model the electricity consumption for electrolysis (domestic production and im‐ports), a model for electricity supply has been developed which is based upon the electricity mix of the aluminum industry. The unit process model for electrolysis itself was based on North American practices, and is assumed to be globally the same. The direct electricity input during electrolysis is a critical LCI parameter that can significantly influence the environmental burden of the overall bever‐age can manufacturing process. Therefore, separate electrical power mix models were created for North America (includes the U.S. and Canada and representing domestic production) and “Other” regions (representing imports) based on the consumption of the aluminum industry. The respective flow charts are shown in Figure 16 and Figure 17, respectively. The electricity consumption for pri‐mary aluminum production is based on IAI statistics (IAI, 2007).
Figure 16: Electrical power mix for electrolysis (domestic mix). Flows are representative for pro‐duction of the domestic component of 1000 kg of total primary aluminum (scaled to the share of domestic production).
Figure 17: Electrical power mix for electrolysis (imports). Flows are representative for production of the imported component of 1000 kg total primary aluminum (scaled to the share of imports).

Cha
pter
: Prim
ary
Alu
min
um P
rodu
ctio
n
The composition of each of the continental or regional power mixes was compiled according to the respective shares of different power production technologies. A representative country from each region having a significant share of the regional power consumption for electrolysis was se‐lected to model the power mix for each region, e.g. Russia for Europe (see Figure 18), Australia for Oceania, etc. (IAI, 2007).
Figure 18: European power mix using Russia as the representative country. Flows are representa‐tive for production of the European imports component of 1000 kg of total primary aluminum (scaled to the share of imports).
According to the IAI statistics (IAI, 2007), the power mixes representative for the U.S. and Canada are of the same composition, as they both belong to the category North America (refer to “Area 2” in Table 12 and Table 13). The breakdown of electrical power by energy source consumed in the electrolysis process for the different regions is shown in Table 12 while Table 13 provides the relative contributions of electrical power by energy source consumed in the electrolysis for each region is illustrated. It can be observed that hydropower has the largest share (approximately 69%) in terms of total electricity input for electrolysis for the U.S. and Canada.

Final Report: Can LCA
PE Americas
Table 12: Breakdown of electrical power (MJ) consumed in electrolysis by energy source for each region [IAI, 2007]
Reported Electrical Power Consumed (Gigawatt hours)
Area 1 Area 2 Area 3 Area 4/5 Area 6A/6B Area 7 Energy Source
Africa North America
Latin America
Asia Europe Oceania
Total
Hydro 5808 55249 33195 3868 88228 7659 194187
Coal 17992 23702 0 14182 13480 25618 95334
Oil 0 4 0 599 1722 2 2327
Natural gas 76 233 1412 21572 6704 0 29997
Nuclear 951 473 0 0 15697 0 17121
Total 24827 79841 34607 40221 126191 33279 338966
Table 13: Relative contribution of electrical power consumed in electrolysis by energy source for each region [IAI, 2007]
Reported Electrical Power Consumed (%)
Area 1 Area 2 Area 3 Area 4/5 Area 6A/6B Area 7 Energy Source
Africa North America
Latin America
Asia Europe Oceania Total
Hydro 23.4% 69.2% 95.9% 9.6% 69.9% 23.0% 57.3%
Coal 72.5% 29.7% 0.0% 35.3% 10.7% 77.0% 28.1%
Oil 0.0% 0.0% 0.0% 1.5% 1.4% 0.0% 0.7%
Natural gas 0.3% 0.3% 4.1% 53.6% 5.3% 0.0% 8.8%
Nuclear 3.8% 0.6% 0.0% 0.0% 12.4% 0.0% 5.1%
Total 100.0% 100.0% 100.0% 100.0% 100.0% 100.0% 100.0%

Cha
pter
: Prim
ary
Alu
min
um P
rodu
ctio
n
3.2 LCI RESULTS In this chapter, the most important LCI results are represented for the production of 1 met‐
ric ton of primary aluminum ingot in the North America region.
3.2.1 Primary Energy Demand
The primary energy demand is a measure of the total amount of primary energy extracted from the earth, including both non‐renewable (i.e. fossil fuels) and renewable (hydropower, wind, solar, etc.) resources, taking into account the efficiency of electric power generation and heating methods.
It is necessary to distinguish the primary energy demand and the energy that is received as so‐called “end energy” at the operation site. An example may help to make this point clear:
1. Primary energy would be the amount of hydropower energy generated at the gen‐eration site (at the resources sites, for instance in hydropower plants)
2. Hydropower in the “power grid mix” indicates the energy in the distribution net‐work that is ready to be used at the operation site.
The energy efficiency coefficient indicates the efficiency of the energy conversion (and its transmission, if applicable) system, and relates the primary energy demand and the end energy through the following equation:
The energy required for electrolysis is primarily provided as electrical power. In the U.S. and Canada, hydroelectric generation provides the majority of electrical power. However, this is not the case for other countries, e.g. Australia, where electrical power generated from coal is the dominant source of energy consumed in the electrolysis process.
More detailed information on the methodology to estimate the primary energy demand from direct energy use data is documented in Appendix A.
The primary energy demand results are illustrated in Figure 19, including a breakdown be‐tween non‐renewable and renewable resources. The production of 1 metric ton of primary alumi‐num ingot representative for North American conditions requires 105 GJ of energy from non‐renewable sources and 50 GJ from renewable sources. The electrolysis process accounts for 80% of the total primary energy demand. The electrolysis process and the anode production (anode pro‐duction contributes approximately 14% of the primary energy demand for electrolysis) are highly energy intensive processes compared to other unit processes. As a result of the different power production efficiencies, the overall non‐renewable fraction of primary energy for electrolysis is greater than the renewable fraction. The primary energy demand results are summarized in Table 14 below.

Final Report: Can LCA
PE Americas
Table 14: LCI parameters for the production of 1000 kg of primary aluminum ingot in North Amer‐ica
Inventory
parameter
Unit Bauxite mining
Alumina Refining
Electrolysis Cast house Total
Primary Energy
Demand
GJ/ton 1.02 27.36 124.27 2.36 155.00
Non renewable GJ/ton 1.00 27.08 74.52 2.12 104.73
Renewable GJ/ton 0.02 0.28 49.75 0.23 50.27
CO2 emissions ton CO2/ ton
0.07 2.03 7.47 0.14 9.70
0
20
40
60
80
100
120
140
160
180
Bauxite Mining AluminaProduction
Electrolysis Casting Total
Unit Process
Pri
mar
y E
ner
gy
Dem
and
(G
J p
er m
etr
ic t
on
of
pri
ma
ry
alu
min
um
in
go
t)
RenewableNon-renewable
Figure 19: Primary energy demand from renewable and non‐renewable sources for primary alu‐minum ingot production per unit process and in total. Electrolysis accounts for the largest primary energy demand (80%) of which 40% comes from renewable sources, while alumina production, which accounts for only 17.6% of total primary energy demand utilizes 26% of the total non‐renewable energy.

Cha
pter
: Prim
ary
Alu
min
um P
rodu
ctio
n
3.2.2 Carbon dioxide Emissions
Carbon dioxide is one of the greenhouse gases that contributes to the global warming phe‐nomenon. Carbon dioxide emissions are mainly associated with the conversion of fossil energy car‐riers (e.g. lignite, crude oil, natural gas) into thermal and/or mechanical energy by means of burning and are expressed in kilograms of CO2. The carbon dioxide emission results of the LCI are illustrated in Figure 20. It is calculated that about 9.7 metric tons of carbon dioxide is emitted per metric ton of primary aluminum ingot produced. The carbon dioxide results are closely linked to the primary en‐ergy demand results and their graphs have much the same shape. The electrolysis process is the largest contributor, producing almost 7.5 metric tons of carbon dioxide for each ton of primary alu‐minum ingot produced. The upstream emissions associated with the electricity supply chain for elec‐trolysis account for 70% of the total 7.5 metric tons CO2 for electrolysis. The carbon dioxide results are summarized in Table 14.
0
1000
2000
3000
4000
5000
6000
7000
8000
9000
10000
Bauxite Mining Alumina Production Electrolysis Casting Total
Unit Process
kg C
O2/
met
ric
ton
pri
mar
y al
um
inu
m in
go
t
Figure 20: Carbon dioxide emissions during primary aluminum ingot production per unit process in total. Electrolysis is the major contributor to the total CO2 emissions of which 70% are from the electricity supply chain.
Final Report: Can LCA
PE Americas
3.3 LCIA RESULTS In this chapter, the Life Cycle Impact Assessment (LCIA) results are presented for the pro‐
duction of 1 metric ton of primary aluminum ingot in North America. Unlike the Life Cycle Inventory, which only reports sums for individual emissions, the LCIA includes methodologies for weighting and combining different emissions into a metric for significant the Life Cycle Inventory, a Life Cycle Im‐pact Assessment (LCIA).
As described in Section 2.2.7 of this report, the impact assessment results were calculated using characterization factors published by the Centre of Environmental Science at Leiden University (CML), Netherlands (CML, 2001). The CML 2001 methodology is the most widely applied impact assessment method in LCA studies around the world. Additional information on the significance of these impact categories is included in Appendix C: Impact Indicators of this report.
3.3.1 Acidification Potential
The acidification potential is a measure of emissions that cause acidifying effects to the envi‐ronment and is expressed as kilogram SO2 Equivalent.
The major acidifying emissions are nitrogen oxides (NOx) and sulfur dioxide (SO2), as well as ammonia emissions that lead to ammonium deposition. The acidification potential related to 1000 kg of primary aluminum ingot production in North America amounts to 50.43 kg SO2 equivalent (Figure 21; Table 16). The relative share of this acidification potential indicator from SO2 emissions to air is 74%, and from NOx emissions to air is 25%.
Breaking the emissions down by production stages shows that the electrolysis process is re‐sponsible for 77% of the total acidification potential result; followed by alumina refining which has an 18% contribution.
We also note that 74% of the acidification impacts are associated with upstream emissions during electricity production.

Cha
pter
: Prim
ary
Alu
min
um P
rodu
ctio
n
0
10
20
30
40
50
60
Bauxite Mining Alumina Production Electrolysis Casting Total
Unit Process
kg S
O2
Eq
uiv
./m
etri
c to
n o
f p
rim
ary
alu
min
um
in
go
t
Figure 21: Acidification potential results for primary aluminum ingot production. 77% of the total acidification potential result is attributed to the process of electrolysis and upstream emissions from electricity generation account for 74% of the total AP.
3.3.2 Eutrophication Potential
The eutrophication potential is a measure of emissions that cause eutrophying effects to the environment and is expressed as kilogram of Phosphate Equivalent. The eutrophication of aquatic systems is primarily caused by excessive inputs of nitrogen and phosphorus (mostly as a result of over‐fertilization).
The eutrophication potential related to the manufacture of 1 metric ton of primary alumi‐num ingot in North America amounts to almost 2.35 kg Phosphate equivalent (Figure 22; Table 16). The eutrophication potential from emissions to air (mainly NOx emissions) contributes to 95% of the total impacts. The remaining 4% of the eutrophication potential is due to emissions to water (mainly from nitrate emissions, chemical oxygen demand COD and NOx releases to water). The remainder of the eutrophication impact indicator comes from emissions to soil, which represents 0.7% (mainly from ammonia and phosphorus releases).
Breaking the impact down by contributions from different production stages, Figure 22 shows that the alumina refining and electrolysis processes together are responsible for 91% of the eutrophication impacts result, with individual contributions of 72% and 19%, respectively. Emissions to air from upstream processes (such as electricity production) account for approximately two‐thirds (67%) of the total eutrophication potential result.

Final Report: Can LCA
PE Americas
0.0
0.5
1.0
1.5
2.0
2.5
3.0
Bauxite Mining Alumina Production Electrolysis Casting Total
Unit Process
kg P
ho
sph
ate
Eq
uiv
/met
ric
ton
of
pri
mar
y al
um
inu
m
ing
ot
Figure 22: Eutrophication potential results for primary aluminum production. Alumina production and electrolysis together account for about 91% of the total EP of which indirect emissions to air account for 67%.
3.3.3 Global Warming Potential (100 years)
The Global Warming Potential (GWP) is a measure of the emission of greenhouse gases (GHG) such as CO2 and methane (CH4) and is expressed as kilogram of CO2‐equivalents. Greenhouse gas emissions are found to cause an increase in the absorption of radiation emitted by the sun and reflected by the earth, magnifying the natural greenhouse effect.
The total global warming potential (GWP) related to the production of 1 metric ton of pri‐mary aluminum ingot in North America is 11068 kg CO2 equivalent. A breakdown of the GWP impact by component greenhouse gases shows that almost 85.8% of the net GWP comes from CO2, 9.79% from Tetrafluoromethane, 2.56% from CH4, 1.6% from Hexafluoroethane, and 0.3% from nitrous oxide (N2O).
A breakdown of the results by individual production stages is shown in Figure 23 and shows that 79% of the global warming impacts come from the electrolysis process. Alumina refining is next largest contributor with a 19% share of net global warming potential.
The share of global warming potential from direct greenhouse gas emissions is approxi‐mately 25% of net GWP impact, while indirect CO2 emissions (mainly from electricity production) account for another 50% of net GWP impact.

Cha
pter
: Prim
ary
Alu
min
um P
rodu
ctio
n
Figure 23: Global warming potential results for primary aluminum ingot production. The electroly‐sis process is responsible for 79% of the global warming impacts, of which 85.8% are due to CO2 emissions.
GHG analysis and breakdown into scope 1, 2 and 3
Based upon the request of the Aluminum Association and the core group members, the GHG emission results for the primary aluminum ingot production were further categorized applying the concept of scopes as outlined in the Greenhouse Gas (GHG) Protocol (WRI and WBCSD, 2004). As the GHG Protocol was not designed to be applied to products4, the results categorization was per‐formed as closely as possible to the requirements of the GHG Protocol. Following the concept of scopes, the breakdown of the GHG emissions as determined in compliance with the ISO 14044 stan‐dard (ISO, 2006b) is provided for Scope 1 (direct GHG emissions), Scope 2 (indirect GHG emissions attributable to energy conversion processes) and Scope 3 (further GHG emissions from the supply chain)5. The results are illustrated in Table 15.
Scope 1: Direct GHG emissions occur from sources that are owned or controlled by the company, for example, emissions from combustion in owned or controlled boilers, furnaces, vehicles, etc.; emis‐sions from chemical production in owned or controlled process equipment.
Scope 2: Indirect GHG emissions from electricity are comprised of GHG emissions from the genera‐tion of purchased electricity consumed by the company. Purchased electricity is defined as electric‐
4 The GHG protocol is applicable to the companies only.
5 Detailed information about the standard and is application are available from www.ghgprotocol.org.
0
2000
4000
6000
8000
10000
12000
Bauxite Mining Alumina Production Electrolysis Casting Total
Unit Process
kg C
O2
Eq
uiv
/met
ric
ton
of
pri
ma
ry a
lum
inu
m i
ng
ot

Final Report: Can LCA
PE Americas
ity that is purchased or otherwise brought into the organizational boundary of the company. Scope 2 emissions physically occur at the facility where electricity is generated.
Scope 3: Other indirect GHG emissions are an optional reporting category that allows for the treat‐ment of all other indirect emissions. Scope 3 emissions are a consequence of the activities of the company, but occur from sources not owned or controlled by the company. Some examples of Scope 3 activities are extraction and production of purchased materials; transportation of purchased fuels; and use of sold products and services.
We recommend that sustainability issues be assessed and addressed by taking the whole supply chain (or rather the supply web) into account. This allows consideration of both direct GHG emissions as well as emissions indirectly associated with the respective production processes.
Table 15: Scope 1, 2, and 3 CO2 Equivalent emissions for primary aluminum ingot production.
kg CO2equiv. / ton Aluminum
Bauxite mining
Alumina refining
Anode pro‐duction
smelting casting Total
AA IAI AA IAI AA IAI AA IAI AA IAI AA IAI
Process 178 177 1584 1584 1762 1761
Electricity 11 5 170 122 19 30 5152 4922 40 36 5392 5115
Fossil fuels 58 23 1409 1346 95 69 95 84 1657 1522
PFC 1037 1159 1037 1159
Fuel supply chain 8 238 10 406 15 677 0
Auxiliary material 279 227 37 543 0
total scope 1+2 69 28 1579 1468 292 276 7773 7665 135 120 9848 9558
total scope 1+2 +3
77 2096 529 8216 150 11068
Scope 1 refers to GHG emissions from the process itself (1762 kg CO2 equivalent), from burning the fossil fuels for thermal energy demand at the factory (1657 kg CO2 equivalent) and spe‐cific emissions from the smelting stage(1037 kg CO2 equivalent).
Scope 2 refers to GHG emissions from upstream processes such as electricity production, which contribute 5392 kg CO2 equivalent.
Scope 3 refers to GHG emissions coming from the supply chains (677 kg CO2 equivalent) and auxiliary materials (543 kg CO2 equivalent), for a total of 1221 kg CO2 equivalent.
The sum of Scope 1 and 2 emissions indicates the GHG emissions which are the responsibil‐ity of the factory, which for production of one metric ton of primary aluminum ingot is 9848 kg CO2

Cha
pter
: Prim
ary
Alu
min
um P
rodu
ctio
n
equivalent6. This value is in the same range as the 9558 kg CO2 equivalent figure mentioned in the IAI report. However, this figure for Scope 1 and 2 emissions does not reflect the full life cycle im‐pacts, and the 1221 kg CO2 equivalent Scope 3 emissions must be included to find that the full life cycle global warming potential from producing one metric ton of primary aluminum ingot is 11068 kg of CO2 equivalent.
3.3.4 Photochemical Ozone Creation Potential
The Photochemical Ozone Creation Potential (POCP) measures the emissions of precursors that contribute to low level smog (also called Summer Smog), produced by the reaction of NOx and volatile organic compounds (VOC) under the influence of ultra violet light. POCP is expressed as kg Ethene equivalent.
The POCP results are illustrated in Figure 24 as well as in Table 16. The POCP related to the production of one metric ton of primary aluminum in North America is 3.06 kg Ethene equivalent. The breakdown of emissions to air which contribute to smog creation potential for primary alumi‐num production is 59% from SO2, 19% from non‐methane volatile organic compounds (NMVOC), 17 % from NOx, and 2% from methane.
Like the other life cycle impact categories, the electrolysis process is the largest contributor to smog creation impacts, accounting for 77% of the total POCP. This is followed by alumina refining which is responsible for 19% of the net smog creation impact.
Approximately 70% of these contributing emissions are associated with production of elec‐tricity required for primary aluminum ingot production.
6 Note: these figures indicates a CO2‐equivalent for all GHG‐emissions (total score) and is not to be mistaken for effective CO2
emissions.

Final Report: Can LCA
PE Americas
0.0
0.5
1.0
1.5
2.0
2.5
3.0
3.5
4.0
Bauxite Mining Alumina Production Electrolysis Casting Total
Unit Process
kg E
the
ne
Eq
uiv
/met
ric
ton
of
pri
mar
y al
um
inu
m i
ng
ot
Figure 24: Photochemical ozone creation potential results for primary aluminum ingot production. Electrolysis is the largest contributor to smog creation impacts, accounting for 77% of the total POCP, of which 70% are attributed to electricity production.
Table 16: LCIA results for production of 1000 kg of primary aluminum ingot in North America.
Impact Assessment Category
Unit Bauxite mining
Alumina Refining
Electrolysis Cast house
Total
Global Warming Potential
ton CO2 Equiv./ton
0.05 2.12 8.74 0.15 11.06
Acidification Potential kg SO2 Equiv./ton
1.80 9.16 38.92 0.55 50.43
Eutrophication Potential
kg Phos‐phate Equiv./ton
0.16 0.47 1.79 0.05 2.48
Photochemical Ozone Creation Potential
kg Ethene Equiv./ton
0.10 0.58 2.35 0.04 3.06

Cha
pter
: Bev
erag
e C
an P
rodu
ctio
n
4 BEVERAGE CAN PRODUCTION This chapter describes in a comprehensive way the manufacturing of beverage cans as rep‐
resentative for the U.S. market conditions. It includes sub‐sections on the process description (Chap‐ter 4.1), data collection and modeling (Chapter 4.2), the LCI results (Chapter 4.3) and the LCIA results (Chapter 4.4).
4.1 PROCESS DESCRIPTION 4.1.1 Can Sheet
The manufacturing of the aluminum beverage can begins with the conversion of ingots into can stock and lid stock coil, which are subsequently converted into can bodies and lids at the can manufacturing plant. The process chain at a rolling mill is illustrated in Figure 25. In Hot mill rolling, aluminum ingots (approximately 18 to 26 inches thick and weighing approximately 15 to 30 metric tons) are preheated to about 1000°F and fed through a hot reversing mill. In the reversing mill, the coil passes back and forth between rollers and the thickness is reduced from the initial thickness to between 1 to 2 inches with a corresponding increase in length. Following the reverse mills, the slabs are fed to a continuous hot mill where the thickness is further reduced to less that ¼ inch in thick‐ness. The metal, called re‐roll or hot coil, is rolled into coil and ready to be transferred to the cold mill.
Prior to the cold mill, the coils may be annealed to give the metal the workability for down‐stream processing. Some plants have moved towards self annealing which requires no additional energy investment as the industry has improved their energy management. The coils are then passed through multiple sets of continuous rollers to reduce the gauge to approximately 0.012 inches required by the can makers. The coils are slit to the width and cut to the length required by can manufacturers. The coils are packaged to prevent damage to the metal in shipping.
Sheet rolling differs slightly based on the final use of the can sheet – for the body of the can or the lid. The main difference is a coating step for sheets that are used in lid making. Inputs and outputs for the sheet rolling process are shown in Table 17 and Table 18 for the body sheet and lid sheet processes respectively.

Final Report: Can LCA
PE Americas
Figure 25: Unit process chain representative for one particular rolling mill site. The flow chart de‐monstrates the assembly of the single process steps in the GaBi4‐Software in order to quantify the average LCI data for a can sheet. Can sheet making is separated into two parts, related to the production of the a) lid and b) the body components. The can sheet making process differs in the coating which the lids receive. The ratio of lid to body production (by weight) is approximately 22/78. This single model was customized for each of the surveyed sites and resulting inventories were weighted and averaged.
Table 17: Input and Output flows for the can sheet making unit process (scaled to the body com‐ponent). Flows are representative for 1000 kg of can sheet production (780 kg of body compo‐nent).
Flows Units Amount
INPUTS
Energy and Fuels
Thermal energy (natural gas) MJ 3077
Power MJ 1025

Cha
pter
: Bev
erag
e C
an P
rodu
ctio
n
Thermal energy (heavy fuel oil) MJ 36.45
Steam (MJ) MJ 6.95
Thermal energy (light fuel oil) MJ 3.079
Thermal energy (LPG) MJ 1.262
Kerosene kg 0.1
Diesel kg 0.079
Gasoline (regular) kg 0.011
Heavy fuel oil kg 0.003
Metals
Aluminum Ingot kg 1072
Steel kg 0.13
Operating Materials
Process water kg 835.6
Cooling water kg 473.0
Rolling oil kg 3.603
Lubricant (unspecified) kg 1.185
Hydraulic oil kg 0.811
Filter media kg 0.616
Lubricating oil kg 0.391
Solvent kg 0.006
Other Materials
Wooden pallets (EURO, 40% moisture) kg 2.535
Coatings (unspecified) kg 2.306
Sulphuric acid (100%) kg 0.651
Cardboard (packaging) kg 0.303
Polyethylene‐film (PE) kg 0.141
Paper Plastic Composite kg 0.073

Final Report: Can LCA
PE Americas
Foam kg 0.036
Phosphoric acid kg 0.024
Chromic acid kg 0.009
OUTPUTS
Products
Can stock body kg 780.0
Emissions to air
VOC (unspecified) kg 1.333
Dust (unspecified) kg 0.136
Nitrogen oxides kg 0.117
Carbon monoxide kg 0.088
Hydrogen fluoride kg 0.002
Ethyl benzene kg 0.001
Sulphur dioxide kg 0.001
Emissions to water
Waste water kg 2032
Solids (dissolved) g 144.2
Solids (suspended) g 24.36
Biological oxygen demand (BOD) g 12.39
Chloride g 9.185
Chemical oxygen demand (COD) g 2.479
Aluminum ion (+III) g 0.144
Aluminum (+III) g 4.73E‐02
Zinc (+II) g 2.2E‐02
Ammonium / ammonia g 1.23E‐03
Other wastes

Cha
pter
: Bev
erag
e C
an P
rodu
ctio
n
Aluminum scrap kg 291.6
Non‐hazardous waste for land‐filling kg 4.113
Non‐hazardous waste for further processing kg 0.949
Scrap metal for recycling, excluding aluminum kg 0.405
Hazardous waste for further processing kg 0.068
Hazardous waste for land‐filling kg 0.022
Table 18: Input and Output flows for the can sheet making unit process (scaled to the lid compo‐nent). Flows are representative for 1000 kg of can sheet production (220 kg lid component).
Flows Units Amount
INPUTS
Energy and Fuels
Thermal energy (natural gas) MJ 917.7
Power MJ 636.5
Thermal energy (MJ) MJ 47.87
Steam (MJ) MJ 41.59
Thermal energy (heavy fuel oil) MJ 10.06
Thermal energy (light fuel oil) MJ 0.695
Kerosene kg 0.186
Diesel kg 0.107
Gasoline (regular) kg 0.009
Metals
Aluminum Ingot kg 316.9
Steel kg 0.034
Operating Materials
Process water kg 312.0
Cooling water kg 108.3

Final Report: Can LCA
PE Americas
Solvent kg 6.712
Lubricant (unspecified) kg 3.706
Rolling oil kg 3.354
Hydraulic oil kg 0.229
Filter media kg 0.214
Lubricating oil kg 0.15
Other Materials
Epoxy resin kg 9.265
Wooden pallets (EURO, 40% moisture) kg 3.851
Vinyl chloride (VCM; chloroethene) kg 0.761
Coatings (unspecified) kg 0.598
Cardboard (packaging) kg 0.365
Naphtha kg 0.350
Sodium carbonate (soda) kg 0.304
Sulphuric acid (100%) kg 0.28
Polyester resin (unsaturated; UP) kg 0.223
Succinic acid dibutylene ester kg 0.180
Xylene (o‐xylene; 1,2‐dimethyl benzene) kg 0.179
Phosphoric acid kg 0.133
OUTPUTS
Products
Can stock lid ‐ packaged Kg 220
Emissions to air
VOC (unspecified) Kg 0.395
Nitrogen oxides Kg 0.063
Dust (unspecified) Kg 0.027

Cha
pter
: Bev
erag
e C
an P
rodu
ctio
n
Xylene (dimethyl benzene) Kg 0.020
Carbon monoxide Kg 0.019
Trimethylbenzene g 3.01
Toluene (methyl benzene) g 2.31
Ammonia g 1.389
Ethyl benzene g 1.233
Methyl isobutyl ketone g 7.76
Sulphur dioxide g 4.11
Cumene (isopropylbenzene) g 2.89
Emissions to water
Waste water kg 1063
Solids (dissolved) kg 0.032
Solids (suspended) g 20.05
Biological oxygen demand (BOD) g 7.798
Chemical oxygen demand (COD) g 7.172
Chloride g 2.356
Aluminum ion (+III) g 0.242
Aluminum (+III) g 1.23E‐02
Chromium (unspecified) g 2.37E‐03
Other Wastes
Aluminum scrap kg 95.72
Non‐hazardous waste for further processing kg 3.030
Non‐hazardous waste for land‐filling kg 1.684
Hazardous waste for land‐filling kg 1.093
Hazardous waste for incineration kg 1.026
Hazardous waste for further processing kg 0.323

Final Report: Can LCA
PE Americas
4.1.2 Can Manufacturing
Aluminum coils are shipped from the rolling mills to can manufacturing plants. Within the can manufacturing plants, coils are set upright and moved into position to feed the cupping press. The coil is unwound and lubricated at a rate needed to feed the press. In the cupping press, blanks or discs are stamped and then pressed into cups. This process results in generation of manufacturing (skeleton) scrap which is then shipped back to secondary casting facilities. The cups then undergo a series of forming, ironing, and punching operations to form the final profile of the can as per the desired specifications. In order to ensure a flat top, the cans are trimmed at the top. The trim scrap is also shipped back to secondary casting facilities. After trimming, the cans undergo a series of washing steps before being dried in an oven. Paints are then applied externally to the cans, the paint acting as a label for the can product. The cans are then further internally coated to establish a bar‐rier between the metal and beverage.
The next step, necking of the can, reduces the diameter of the open end of the can to match the diameter of the lid. The diameter of the lid is smaller than the can diameter, allowing for an overall reduction in the amount of aluminum used in a finished aluminum can. After the diameter has been reduced, the flange that forms part of the seal to the lid is formed. The cans then undergo a quality control process to check the integrity of the final product before they are shipped to fillers. The cans are stacked onto plastic pallets in shipping.
Layers of cans are separated using corrugated paper or plastic sheets. The entire pallet is then banded together with plastic bands and in rare cases is covered with shrink wrap to protect the cans from damage and dirt during both shipping and storage.
Can lids are manufactured from a different alloy than can body. Alloys for can lids have higher magnesium content in place of the manganese used in the bodies, as lids are designed to be stiffer than the can body. Following the cold rolling, the can stocks for lids is cleaned and coated and shipped to the manufacturer. Lids can be manufactured from either coils or from scrolled sheets. The manufacturing steps are very similar independent of the type of feed so only the coil fed proc‐ess will be described here. The major steps in the process are stamping out ends, curling the edges of the shells, applying the sealing compound, stamping tabs, stamping the end features onto the ends, and finally attaching the tabs to the ends to make a completed lid. An illustration of the can making process is shown in Figure 26 and Table 19 lists the inputs and outputs of the can‐making process.

Cha
pter
: Bev
erag
e C
an P
rodu
ctio
n
Figure 26: Illustration of the Can making process. Flows are representative for the production of 1000 cans. Data is contributed by the weighted average of inventories in the surveyed sites (see Data Collection and Modeling).

Final Report: Can LCA
PE Americas
Table 19: Inputs and outputs for the can making unit process. Flows are representative for the manufacturing of 1000 cans from aluminum sheet.
Flows Units Amount
INPUTS
Energy and Fuels
Power MJ 77.62
Thermal energy (natural gas) MJ 70.37
Thermal energy (LPG) MJ 0.6
Diesel g 3.329
Metals
Aluminum sheet kg 16.78
Other Materials
Water kg 85.77
Coatings (can) kg 0.916
Hydrogen fluoride kg 0.225
Sulphuric acid aq. (96%) kg 0.198
Lime quicklime (lumpy) g 77.20
Lubricating oil g 39.42
Inks (can) g 31.25
Polyethylene part (PE) g 13.61
Polypropylene part (PP) g 17.87
Solvent g 8.781
OUTPUTS
Products
2 PC Can pcs. 1000
Emissions to air

Cha
pter
: Bev
erag
e C
an P
rodu
ctio
n
Alcohols (unspec.) g 43.77
Ethylene glycol g 23.9
Ether (unspec.) g 4.03
Formaldehyde (methanol) g 2.02
Naphtha g 0.987
Xylene (dimethyl benzene) g 2.36E‐2
Manganese (+II) g 1.13E‐2
Hydrogen fluoride g 9.21E‐3
Ethyl benzene g 6.23E‐4
Methanol g 2.47E‐4
Emissions to water
Waste water kg 58.63
Phosphorus kg 0.5
Solids (dissolved) kg 0.11
Sulphate kg 0.045
Chemical oxygen demand (COD) kg 0.026
Calcium (+II) kg 0.02
Biological oxygen demand (BOD) g 3.9
Chloride g 3.5
Solids (suspended) g 3.5
Total organic bounded carbon g 2.4
Sodium (+I) g 2.1
Oil (unspecified) g 1.4
Nitrogen (as total N) g 0.84
Fluoride g 0.45
Aluminum (+III) g 0.43

Final Report: Can LCA
PE Americas
Potassium g 0.3
Magnesium (+III) kg 1.4E‐4
Silicate particles kg 7.6E‐5
Arsenic (+V) kg 3E‐5
Strontium kg 1.4E‐5
Manganese (+II) kg 9.2E‐6
Phenol (hydroxy benzene) kg 8.3E‐6
Sulphide kg 5.2E‐6
Iron kg 3.3E‐6
Zinc (+II) kg 3E‐6
Selenium kg 2.9E‐6
Copper (+II) kg 2.6E‐6
Barium kg 1.3E‐6
Chlorine kg 1.2E‐6
Lead (+II) kg 9.1E‐7
Chromium (unspecified) kg 9E‐7
Cadmium (+II) kg 8.6E‐7
Cyanide kg 5.2E‐7
Nickel (+II) kg 3.5E‐7
Silver kg 2.9E‐7
Mercury (+II) kg 1.1E‐8
Other Wastes
Aluminum scrap kg 3.447
Total waste for incineration kg 0.225
Sludge kg 0.174
Waste (recycling) kg 0.13

Cha
pter
: Bev
erag
e C
an P
rodu
ctio
n
Waste (incineration) g 49.66
Waste (landfill) g 44.03
Sludge (from processing) g 26.31
Hazardous waste for incineration g 0.752
4.1.3 Secondary Aluminum Ingot / Recycling
The secondary aluminum production process includes the unit processes of shredding, de‐coating, remelting and secondary ingot casting as shown in Figure 27. The secondary aluminum in‐got is produced from post‐consumer scrap (UBC) recovered from the consumer waste stream. The UBCs may be collected in a municipal curbside program and dropped off by individuals or groups interested in generating revenue.
UBCs must be treated prior to their melting in a furnace. First, the UBCs are shredded to re‐move trapped water and other contaminants. The uniform size of the shreds helps material flow in downstream processing. The shreds are passed under magnetic separators to remove ferrous con‐tamination. In some facilities, air knives are also used to prevent the inclusion of heavy contamina‐tion such as lead, stainless steel, or zinc.
The metal leaves the shredders and passes into a decoating unit. This unit heats the metal and coatings, resulting in the vaporization and oxidation of the coatings. The decoating process re‐sults in the transfer of the hot metal to the melting furnace. Primary aluminum metal is consumed to make up for system melt loss and sweeten the composition if necessary. In addition, alloying ad‐ditives are also added to the final specifications of the ingot to be produced. The casting process is similar to the process described in the section on Primary Ingot Casting (Cast House) (Chapter 3.1.5).
The scrap preparation is separated from remelting and casting and unit process information is shown in Table 20 and Table 21. It is important to note that these numbers are specific for alumi‐num ingots used in can making and in no way are representative of the aluminum ingot production in general (AA).

Final Report: Can LCA
PE Americas
Figure 27: Unit process chain at one selected secondary aluminum production site illustrating the attempt to quantify the LCI data for secondary aluminum ingot production

Cha
pter
: Bev
erag
e C
an P
rodu
ctio
n
Table 20: Input and output flows for scrap preparation unit processes (i.e. shredding & decoating). The figures indicate the average overall surveyed sites. Flows are representative for 1000 kg of prepared scrap.
Flows Units Amount
INPUTS
Energy and Fuels
Thermal energy (MJ) MJ 281.22
Power MJ 30.91
Metals
Aluminum scrap kg 1013
Operating Materials
Calcium hydroxide kg 0.656
OUTPUTS
Products
Aluminum scrap (processed) kg 1000
Emissions to air
Hydrogen chloride g 6.21
Nitrogen dioxide g 2.071
Sulphur dioxide kg 8.63E‐06
VOC (unspecified) g 3.667
Other emissions to air kg 3.97E‐10
Dust (unspecified) g 23.49
Other wastes
Aluminum Fines kg 5.103
Hazardous waste for land‐filling kg 0.1
Baghouse lime kg 0.042
Non‐hazardous waste for land‐filling kg 2.791

Final Report: Can LCA
PE Americas
UBC Contamination kg 6.57
Table 21: Input and output flows for remelting and casting unit processes. The figures indicate the average overall surveyed sites. Flows are representative for 1000 kg of rolling ingot.
Flows Units Amount
INPUTS
Energy and Fuels
Thermal energy (natural gas) MJ 1890
Power MJ 1022
Thermal energy (LPG) MJ 15.56
Thermal energy (light fuel oil) MJ 1.481
Diesel kg 0.704
Power (From waste) MJ 0.020
Gasoline (regular) kg 0.012
Kerosene g 1.074
Thermal energy (propane) MJ 6.53E‐04
Metals
Aluminum kg 1046
Alloy components kg 5.669
Operating Materials
Cooling water kg 848
Filter media kg 0.972
Hydraulic oil kg 0.823
Lubricant (unspecified) kg 0.496
Process water kg 716.5
Salt (flux) kg 0.176

Cha
pter
: Bev
erag
e C
an P
rodu
ctio
n
Other Materials
Sodium chloride (rock salt) kg 2.564
Potassium chloride kg 2.564
Sodium chloride (rock salt) kg 0.6
Sodium hydroxide (100%; caustic soda) kg 0.097
Sulphuric acid (100%) kg 0.867
Cryolite kg 0.214
Sodium hypochlorite kg 0.014
Refractory kg 0.007
OUTPUTS
Products
Aluminum rolling ingot kg 1000
Emissions to air
Dust (unspecified) kg 0.121
Nitrogen oxides kg 0.112
Hydrogen chloride kg 0.106
Nitrogen dioxide kg 0.102
Carbon monoxide kg 0.083
Sulphur dioxide g 4.336
Hydrogen fluoride g 3.451
Chlorine g 1.62
Other emissions to air g 1.355
Ammonia g 0.444
Lead (+II) kg 4.51E‐06
Dioxins (unspec.) kg 1.5E‐11
Emissions to water

Final Report: Can LCA
PE Americas
Waste water kg 1637
Solids (dissolved) kg 0.128
Chemical oxygen demand (COD) kg 0.021
Biological oxygen demand (BOD) kg 0.013
Chloride g 9.47
Suspended solids, unspecified g 3.014
Oil (unspecified) g 2.08
Solids (suspended) g 1.755
Aluminum (+III) g 0.844
Aluminum ion (+III) g 0.166
Ammonia kg 3.61E‐05
Zinc ion (+II) kg 2.15E‐05
Zinc (+II) kg 4.51E‐06
Cyanide kg 4.51E‐06
Other wastes
Dross kg 39.37
Non‐hazardous waste for further processing kg 28.33
Non‐hazardous waste for land‐filling kg 6.922
Coated scrap (All 5XXX series alloy) kg 3.526
Scrap metal for recycling, excluding aluminum kg 1.07
Baghouse lime kg 0.560
Aluminum Fines kg 0.275
Post‐industrial scrap or manufacturing scrap is produced at rolling mills, can manufacturing plants, and can fillers (excluded from data collection in this study). In the rolling mills, scrap is mainly generated by trimming the ends and sides of the sheet during the production of the coils. Within can manufacturing, skeleton scrap is generated in the stamping process to manufacture the cups. The scrap from rolling mills and can manufacturing plants is treated in a similar manner since neither has
Cha
pter
: Bev
erag
e C
an P
rodu
ctio
n
been coated (i.e. it is clean scrap). In the underlying model, this scrap is considered to be directly re‐melted into ingots and fed back into the rolling process.
4.2 DATA COLLECTION AND MODELING
4.2.1 Can Sheet
In total, four sites provided data on can sheet production for this study. Overall, the data quality and the consistency of the collected data have been identified to be of medium to high qual‐ity. Participating sites represent the following listing of can sheet producers:
Alcoa – Two sites
Logan Aluminum (a joint venture of Novelis Inc. and ARCO Aluminum) – One site
Wise Alloys – One site
In total, about 1.7 million metric tons per year of can sheet production are represented by the provided data.
The process model for each of the received data sets was created in the GaBi 4 software sys‐tem database (release GaBi 4.3, http://www.gabi‐software.com). The following data requirements for upstream supplies have been applied:
Energy supply, including electricity and fuels: Regional electricity grid mixes (representative
of the state/region in which the rolling mill is located) and U.S. specific fuels data available in
GaBi 4 database have been used.
Aluminum ingots: For primary aluminum ingots, the inventory represented in section 3.1
which is based on the IAI data, has been used. For secondary ingots, two separate LCI pro‐
files were estimated . The two profiles represent the production of secondary aluminum in‐
got from UBC scrap. Manufacturing scrap is considered to be directly re‐melted and fed back
into the rolling process.
Process materials: Data from the GaBi 4 software system database have been used.
In addition, transportation burdens (transport of primary and secondary ingots to rolling mills and transport of aluminum can sheet to can manufacturing plants) were also included. The data on transportation was based upon information provided by companies and/or informed esti‐mates and are given in Appendix B
4.2.2 Can Manufacturing
In this study, the manufacturing of cans was modeled based upon the data provided by the Can Manufacturers Institute (CMI). CMI provided aggregated industry average information on a per‐one thousand‐can basis, representative for operations in the U.S. It also provided data on direct raw material, ancillary, and energy inputs as well as direct releases to the environment from can manu‐facture operations. Overall, the data quality and consistency of the provided data has been identi‐fied to be of high quality. The distribution of the production volume by different can sizes in 2006 is illustrated in Table 22. It can be observed that the 12 oz (including all variants) beverage can ac‐counts for approximately 89.37% of the total two piece aluminum beverage can production in the U.S.

Final Report: Can LCA
PE Americas
Table 22: Distribution of the can production volume by can size in 2006 [Source: CMI]
Can Size Production volume (%)
8 oz 3.48
12 oz 89.37
16 oz 3.96
Others 3.19
The system boundary for modeling the can manufacturing in this study was defined from de‐livery of aluminum sheets to can manufacturers to packaged can bodies and lids leaving the gate of the can manufacturing facility. The following data requirements for upstream supplies have been applied:
Energy supply, including electricity and fuels: CMI provided the state‐wise breakdown of
electricity consumption data. The state‐wise electricity data was aggregated to estimate re‐
gional breakdowns of electricity consumption. A regional power mix process on a 1 MJ basis
was created utilizing the regional grid mixes datasets available in GaBi 4 LCI database for the
U.S. The power mix process is illustrated in Figure 28. The fuel datasets (e.g. diesel, natural
gas) from the GaBi 4 database have been used.
Aluminum sheet: The aluminum sheet inventory generated within this study has been used,
representing the most up‐to‐date information on aluminum sheet production.
Coating, Inks, and Solvents: CMI provided representative information on the composition of
coatings, inks and solvents. In view of the confidentiality of the composition mix, further de‐
tails cannot be provided in this report. Representative datasets from GaBi 4 were used to
create the composition mix for coatings, inks, and solvents.
Other process materials: Data from the GaBi 4 databases have been used to characterize other ancillary materials used in can manufacturing.
In total, five sites provided data on secondary aluminum production for this study. Overall, the data quality and consistency of the collected data has been identified to be of medium quality.
Participating sites represent the following listing of secondary aluminum producers:
Alcoa – Two sites
Aleris – One site
Logan Aluminum (a joint venture of Novelis Inc. and ARCO Aluminum) – One site
Novelis – One site
In total, about 2 million metric tons per year of secondary aluminum ingot production are represented by the provided data.

Cha
pter
: Bev
erag
e C
an P
rodu
ctio
n
The process model for each of the received datasets was created in the GaBi 4 software sys‐tem database (release GaBi 4.3, http://www.gabi‐software.com). The following data requirements for upstream supplies have been applied:
Energy supply, including electricity and fuels: Regional electricity grid mixes (representative
of the state/region in which a secondary aluminum production facility is located) and U.S.
specific fuels data available in the GaBi 4 database have been used.
Aluminum ingots: For recycled scrap ingots (RSI), dataset from the GaBi 4 database has been
used.
Process materials: Data from the GaBi 4 software system database (release GaBi 4.3,
http://www.gabi‐software.com) have been used.
In addition, transportation burdens (transport of primary ingots to the facility, transport of manufacturing and UBC scrap) were included. The data on transportation was based upon informa‐tion provided by the companies and/or informed estimates and are given in Appendix B.
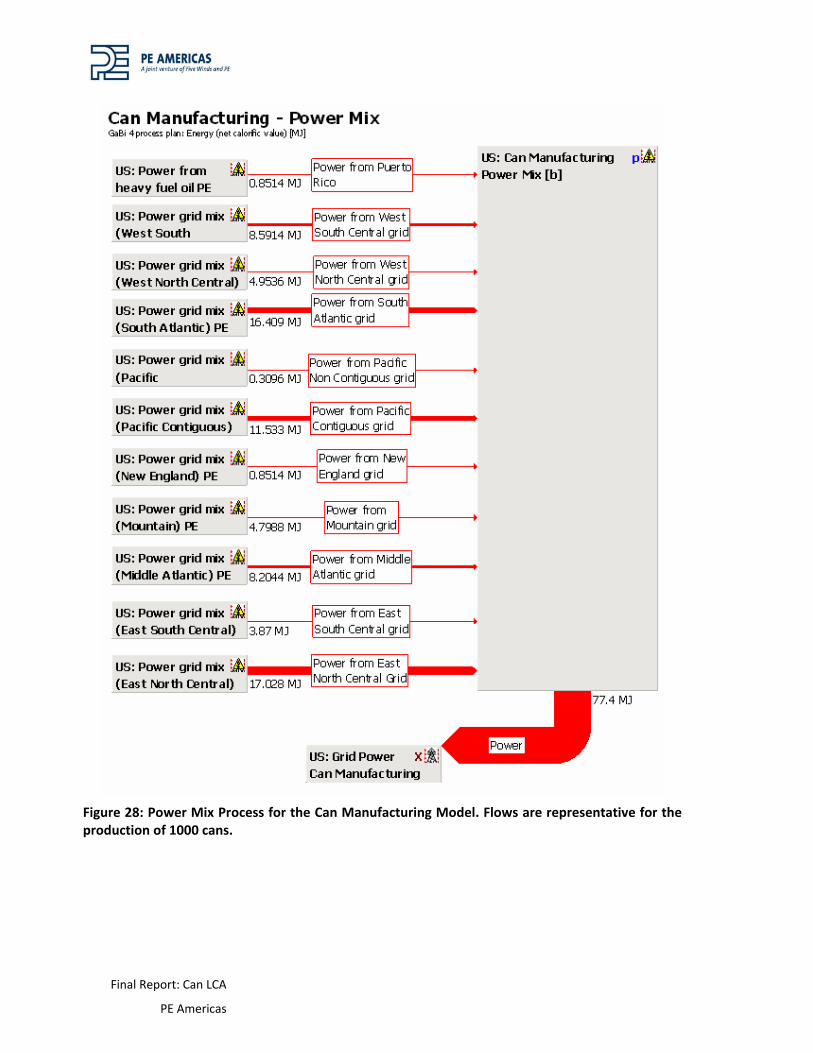
Final Report: Can LCA
PE Americas
Figure 28: Power Mix Process for the Can Manufacturing Model. Flows are representative for the production of 1000 cans.
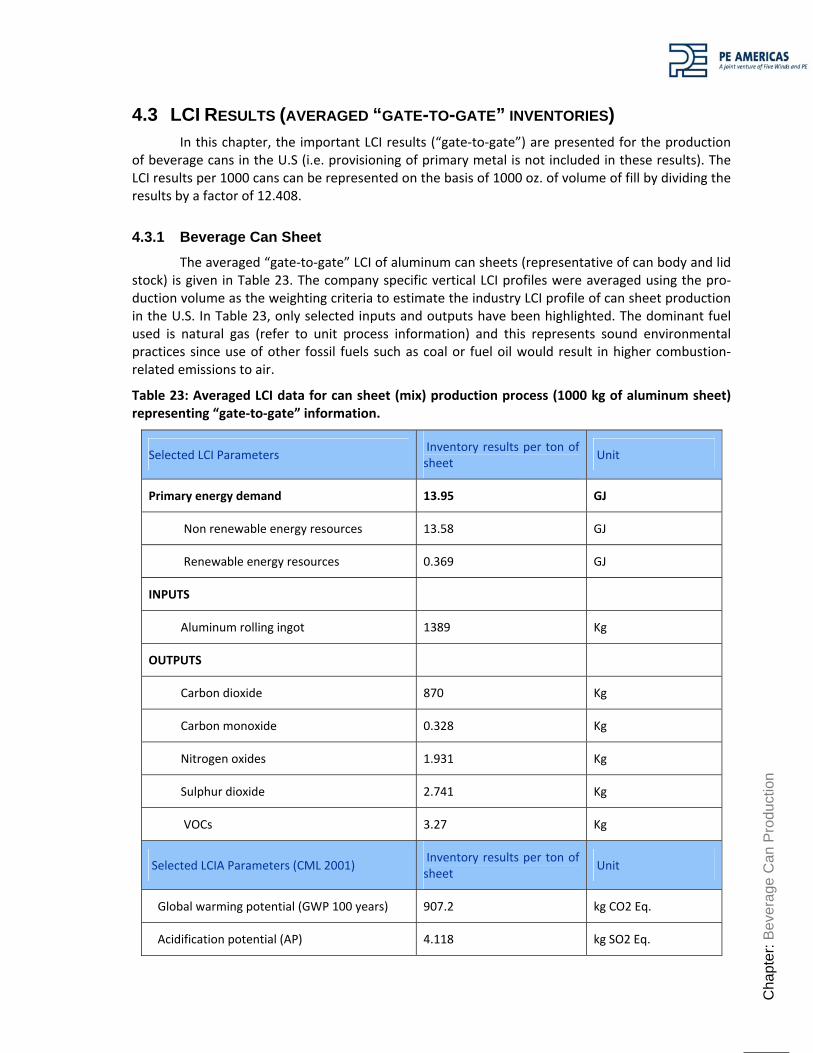
Cha
pter
: Bev
erag
e C
an P
rodu
ctio
n
4.3 LCI RESULTS (AVERAGED “GATE-TO-GATE” INVENTORIES) In this chapter, the important LCI results (“gate‐to‐gate”) are presented for the production
of beverage cans in the U.S (i.e. provisioning of primary metal is not included in these results). The LCI results per 1000 cans can be represented on the basis of 1000 oz. of volume of fill by dividing the results by a factor of 12.408.
4.3.1 Beverage Can Sheet
The averaged “gate‐to‐gate” LCI of aluminum can sheets (representative of can body and lid stock) is given in Table 23. The company specific vertical LCI profiles were averaged using the pro‐duction volume as the weighting criteria to estimate the industry LCI profile of can sheet production in the U.S. In Table 23, only selected inputs and outputs have been highlighted. The dominant fuel used is natural gas (refer to unit process information) and this represents sound environmental practices since use of other fossil fuels such as coal or fuel oil would result in higher combustion‐related emissions to air.
Table 23: Averaged LCI data for can sheet (mix) production process (1000 kg of aluminum sheet) representing “gate‐to‐gate” information.
Selected LCI Parameters Inventory results per ton of sheet
Unit
Primary energy demand 13.95 GJ
Non renewable energy resources 13.58 GJ
Renewable energy resources 0.369 GJ
INPUTS
Aluminum rolling ingot 1389 Kg
OUTPUTS
Carbon dioxide 870 Kg
Carbon monoxide 0.328 Kg
Nitrogen oxides 1.931 Kg
Sulphur dioxide 2.741 Kg
VOCs 3.27 Kg
Selected LCIA Parameters (CML 2001) Inventory results per ton of sheet
Unit
Global warming potential (GWP 100 years) 907.2 kg CO2 Eq.
Acidification potential (AP) 4.118 kg SO2 Eq.

Final Report: Can LCA
PE Americas
Eutrophication potential (EP) 0.281 kg Phosphate Eq.
Photochemical Ozone creation potential (POCP)
0.488 kg Ethene Eq.
Ozone Layer depletion potential (ODP) 3.44E‐05 kg R11 Eq.
4.3.2 Can Manufacturing
The “gate‐to‐gate” inventory parameters of the can manufacturing model are illustrated in Table 24. This inventory characterizes only selected direct raw material, ancillary, and energy inputs and the direct releases to the environment for the can manufacturing process. The included air emissions result from the combustion of natural gas and liquefied petroleum gas and the use of diesel, coatings, inks, and solvents during can manufacturing.
The average weight of 1000 cans was estimated using two approaches. In the first approach, the weight was estimated as the difference of the total aluminum sheet input and the amount of scrap generated during can manufacturing. Using this approach, the average weight per 1000 cans is 13.3356 kg. Alternatively, the average weight per 1000 cans can be determined by taking the weighted average of the weight of different can sizes. The average weight for different can sizes was provided by CMI. Using the second approach, the average weight of 1000 cans was estimated to be 13.534 kg. Therefore, the difference in weight per 1000 cans for two approaches is approximately 0.1984 kg. The core group of the project recommended using the estimate of 13.3356 kg per 1000 cans in this study.
Table 24: Averaged LCI data on can manufacturing process (per 1000 cans) representing “gate‐to‐gate” information
Selected LCI Parameters Inventory results per 1000 cans
Unit
Primary energy demand 404.5 MJ
Non renewable energy resources 386.3 MJ
Renewable energy resources 18.2 MJ
INPUTS
Can sheet 16.78 Kg
OUTPUTS
Carbon dioxide 24.62 Kg
Carbon monoxide 8.439 g
Nitrogen oxides 49.87 g

Cha
pter
: Bev
erag
e C
an P
rodu
ctio
n
Sulphur dioxide 78.36 g
VOCs 0.1137 Kg
Selected LCIA Parameters (CML 2001) Inventory results per 1000 cans
Unit
Global warming potential (GWP 100 years) 25.07 kg CO2 Eq.
Acidification potential (AP) 0.116 kg SO2 Eq.
Eutrophication potential (EP) 1.538 kg Phosphate Eq.
Photochemical Ozone creation potential (POCP)
0.017 kg Ethene Eq.
Ozone Layer depletion potential (ODP) 1.87E‐06 kg R11 Eq.
4.3.3 Secondary Aluminum Ingot / Recycling
The averaged “gate‐to‐gate” LCI of secondary aluminum production is illustrated in Table 25 and Table 26. The company‐specific vertical LCI profiles were averaged using production volumes as the weighting criteria to estimate the industry LCI profile of secondary aluminum ingot in the U.S. In the following tables, only selected inputs and outputs have been compiled and the included air emissions arise from the consumption of natural gas and diesel. The primary energy source is natu‐ral gas (refer to unit process information).
Table 25: Averaged LCI data for scrap preparation (1000 kg of prepared scrap) representing “gate‐to‐gate” information
Selected LCI Parameters Inventory results per ton of prepared scrap
Unit
Primary energy demand 437.4 MJ
Non renewable energy resources 435.1 MJ
Renewable energy resources 2.282 MJ
INPUTS
Aluminum scrap 1013 Kg
OUTPUTS
Carbon dioxide 28.5 Kg
Carbon monoxide 88.46 g
Nitrogen oxides 52.55 g
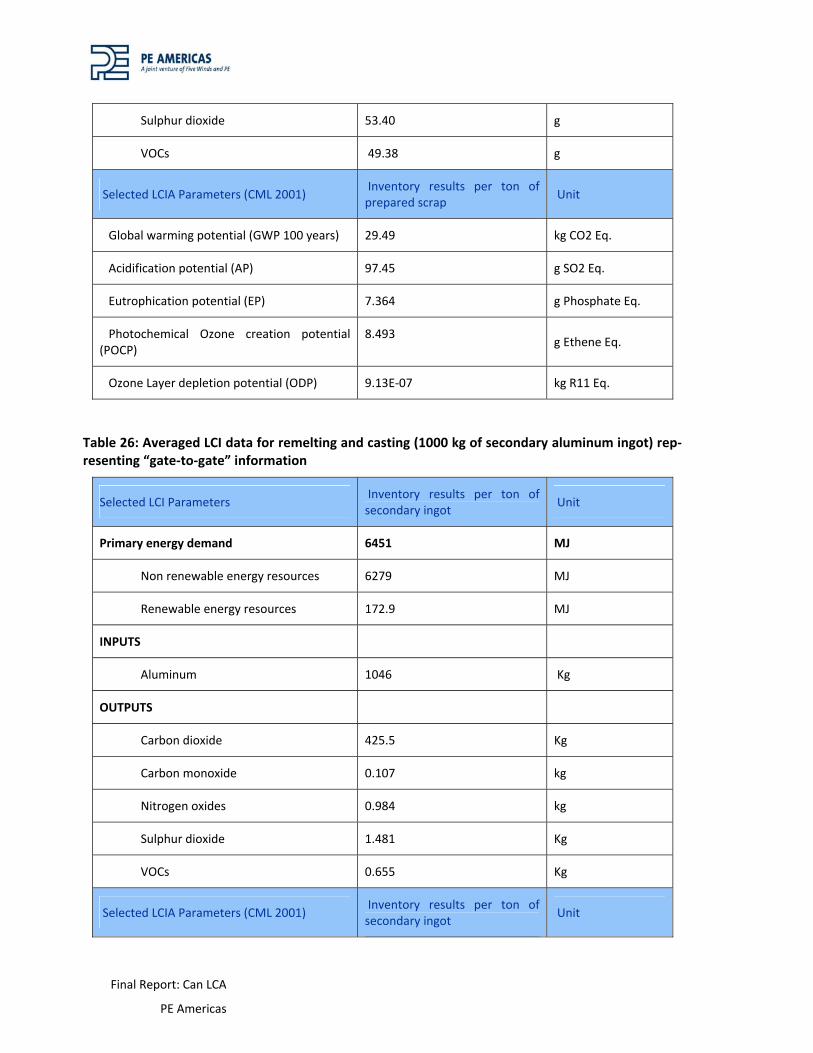
Final Report: Can LCA
PE Americas
Sulphur dioxide 53.40 g
VOCs 49.38 g
Selected LCIA Parameters (CML 2001) Inventory results per ton of prepared scrap
Unit
Global warming potential (GWP 100 years) 29.49 kg CO2 Eq.
Acidification potential (AP) 97.45 g SO2 Eq.
Eutrophication potential (EP) 7.364 g Phosphate Eq.
Photochemical Ozone creation potential (POCP)
8.493 g Ethene Eq.
Ozone Layer depletion potential (ODP) 9.13E‐07 kg R11 Eq.
Table 26: Averaged LCI data for remelting and casting (1000 kg of secondary aluminum ingot) rep‐resenting “gate‐to‐gate” information
Selected LCI Parameters Inventory results per ton of secondary ingot
Unit
Primary energy demand 6451 MJ
Non renewable energy resources 6279 MJ
Renewable energy resources 172.9 MJ
INPUTS
Aluminum 1046 Kg
OUTPUTS
Carbon dioxide 425.5 Kg
Carbon monoxide 0.107 kg
Nitrogen oxides 0.984 kg
Sulphur dioxide 1.481 Kg
VOCs 0.655 Kg
Selected LCIA Parameters (CML 2001) Inventory results per ton of secondary ingot
Unit

Cha
pter
: Bev
erag
e C
an P
rodu
ctio
n
Global warming potential (GWP 100 years) 431.7 kg CO2 Eq.
Acidification potential (AP) 2.348 kg SO2 Eq.
Eutrophication potential (EP) 0.148 kg Phosphate Eq.
Photochemical Ozone creation potential (POCP)
0.133 kg Ethene Eq.
Ozone Layer depletion potential (ODP) 2.05E‐05 kg R11 Eq.
4.4 LCI AND LCIA RESULTS PER 1000 CANS This section presents the LCIA results for the beverage cans for the two EoL approaches –
closed loop and recycled content. A baseline scenario is defined for the approaches and the parame‐ters and/or assumptions:
Average can weight of 13.34 kg per 1000 cans
The UBC recycling rate in the year 2006 is 51.6% (AA, 2007)
The recycled content of the beverage can in the U.S. in 2007 is 67.8%
Post production and run‐a‐round scrap from rolling mills is completely recycled in a closed loop (as seen in Figure 1). The production of secondary aluminum ingot from post produc‐tion and run‐a‐round scrap does not require any input of primary aluminum.
Can manufacturing scrap is dealt with in the same manner as UBC scrap and included in the recycled content of the can.
The LCIA results per 1000 cans can be represented on the basis of 1000 oz. of volume of fill by dividing the results by a factor of 12.41.
The energy for primary ingot production represented here in all considerations includes part of the aluminum output as liquid metal. This means that not all aluminum output from this process is in ingot form and therefore, these numbers cannot be directly compared with those stated earlier (e.g. Table 14) for primary aluminum production.
4.4.1 Closed Loop Approach
Under a closed loop approach, the mass flows (per 1000 cans) over the complete life cycle of the beverage can are shown in Figure 29.
The production of 1000 cans at a can manufacturing plant requires 16.78 kg of aluminum sheet (inclusive of can body and lid). The can manufacturing process yields 3.447 g of post produc‐tion scrap. The amount of post production scrap generated at rolling mills is 6.501 kg.
In order to produce 16.78 kg of aluminum sheet, the total amount of aluminum ingot input required for the rolling process is 23.31 kg. This consists of:
6.218 kg of ingot produced from post production scrap (from rolling mills) and

Final Report: Can LCA
PE Americas
17.09 kg secondary ingot with 67.8% scrap input (excluding rolling scrap) to the remelting process
At the End of Life (EoL), 6.984 kg of UBC scrap (51.6% of the average can weight of 13.34 kg per 1000 cans) is recovered. 12.23 kg of scrap is required, of which only 10.433 kg are recovered from can makers and UBC collection combined. The deficit of 1.797 kg in the latter are assigned a “net burden” which amount to the corresponding amount of primary metal needed as a replace‐ment, minus the burdens for scrap preparation and remelting. The selected LCI/LCIA results of the beverage can under the closed loop approach are shown in Table 27.
With regard to the primary energy demand in the closed loop system, the total primary en‐ergy demand per 1000 cans with a 51.6% UBC recycling rate is 1,943 MJ. The breakdown share of total primary energy demand over all life cycle stages of the can is shown in Figure 30. The primary energy demand for the production process (including the “upstream” processes such as raw materi‐als and energy) are presented for both the primary and the secondary aluminum ingot production. Similarly, the impact scores for the rolling and can manufacturing are given. The fraction of renew‐able energy sources is shown as light shaded bars; the fraction of non‐renewable energy sources is shown as full bars.
Overall, a majority of the primary energy demand is met with non‐renewable energy re‐sources. As discussed previously in Section 3.2.1 on primary energy demand, the end‐energy used at the operation sites is dominated by hydropower (which generates power based upon renewable resources). However, the significantly lower conversion efficiency of other power generation plants that use non‐renewable energy sources (such as hard coal) causes the impact score to be higher than that associated with the renewable energy resources. The calculations are developed in detail in Appendix A.
Examining the LCI results for CO2 emission to air, it can be observed that the production of primary aluminum ingot has a significant influence on the overall environmental impact score be‐cause of its high primary energy consumption.

Cha
pter
: Bev
erag
e C
an P
rodu
ctio
n
Figure 29: Mass flows (per 1000 cans) over the complete life cycle of the beverage can under closed loop approach (UBC recycling rate 51.6%)
The total amount of carbon dioxide emissions per 1000 cans is around 122 kg. A breakdown of emissions from the different can manufacturing stages woauld show that CO2 emissions closely match the primary energy demand trends shown in Figure 30, and, therefore, is not shown here.

Final Report: Can LCA
PE Americas
The process breakdown shows that for both primary energy demand and CO2 emissions to air, the production of primary aluminum is the key impact source, followed by the can manufactur‐ing with the respective shares of approximately 67% and 20%. With regard to the secondary alumi‐num production, it is noticed that this process plays a minor role in contributing to the primary en‐ergy demand and CO2 emissions. A detailed examination of energy consumption required for secon‐dary aluminum production shows that most energy required for secondary production goes to pro‐duction from UBC scrap (around 6% to the overall results), and only a very small share goes to the remelting of the post production scrap (less than 1%).
Table 27: Selected LCI/LCIA results per 1000 cans under closed loop approach
Selected LCI Parameters Results Unit
Primary energy demand 1943 MJ
Non renewable energy resources 1540 MJ
Renewable energy resources 403.3 MJ
INPUTS
Can sheet 16.78 Kg
OUTPUTS
Carbon dioxide 121.6 Kg
Carbon monoxide 0.047 Kg
Nitrogen oxides 0.24 Kg
Sulphur dioxide 0.436 Kg
VOCs 0.209 Kg
Selected LCIA Parameters (CML 2001)
Global warming potential (GWP 100 years) 131.5 kg CO2 Eq.
Acidification potential (AP) 0.613 kg SO2 Eq.
Eutrophication potential (EP) 1.565 kg Phosphate Eq.
Photochemical Ozone creation potential (POCP) 0.051 kg Ethene Eq.
Ozone Layer depletion potential (OPD) 3.76E‐06 kg R11 Eq.

Cha
pter
: Bev
erag
e C
an P
rodu
ctio
n
Figure 30: Share of total primary energy demand (MJ per 1000 cans) over the life cycle of the can under closed loop approach. The solid color portion of each bar represents the non‐renewable fraction of primary energy and the light‐shaded portion represents the renewable fraction of pri‐mary energy. Expectedly, primary aluminum production has the highest primary energy demand compared to all other processes.
4.4.2 Recycled content approach
The mass flows (per 1000 cans) over the complete life cycle of the beverage can modeled under a recycled content approach are shown in Figure 31.
The mass flows per 1000 cans are similar to the closed loop approach flows, except for the deficit UBC scrap flows. In the recycled content approach, the surplus UBC scrap flow is assigned to a “scrap sink” and there is no “net burden” given to the product system. The “scrap sink” can be con‐sidered as a stockpile of secondary raw material which is not utilized for further processing and re‐covery of the material. As a result, the environmental burdens of the can product system decreases compared with the closed loop system.
Examining how this change affects our primary LCI metrics, the total primary energy de‐mand is found to decrease by 251 MJ to 1692 MJ per 1000 cans, while the CO2 emissions decrease by 16 kg to 106 kg CO2 per 1000 cans. A breakdown of primary energy demand by energy source and life cycle stages for this system model is shown in Figure 32. Except for remelting of surplus UBC and gross credit values, the relative share of total primary demand of other life cycle stages is not differ‐ent from the closed loop results. The primary energy demand for the production processes (includ‐ing the “upstream” processes such as raw materials extraction and energy production) are pre‐sented for both the primary and the secondary aluminum ingot production. Again, the fraction of renewable energy sources is shown as light‐shaded bars, and the fraction of non‐renewable energy sources are shown as full bars.

Final Report: Can LCA
PE Americas
Figure 31: Mass flows (per 1000 cans) over the complete life cycle of the beverage can under recy‐cled content approach (UBC recycling rate 51.6%)
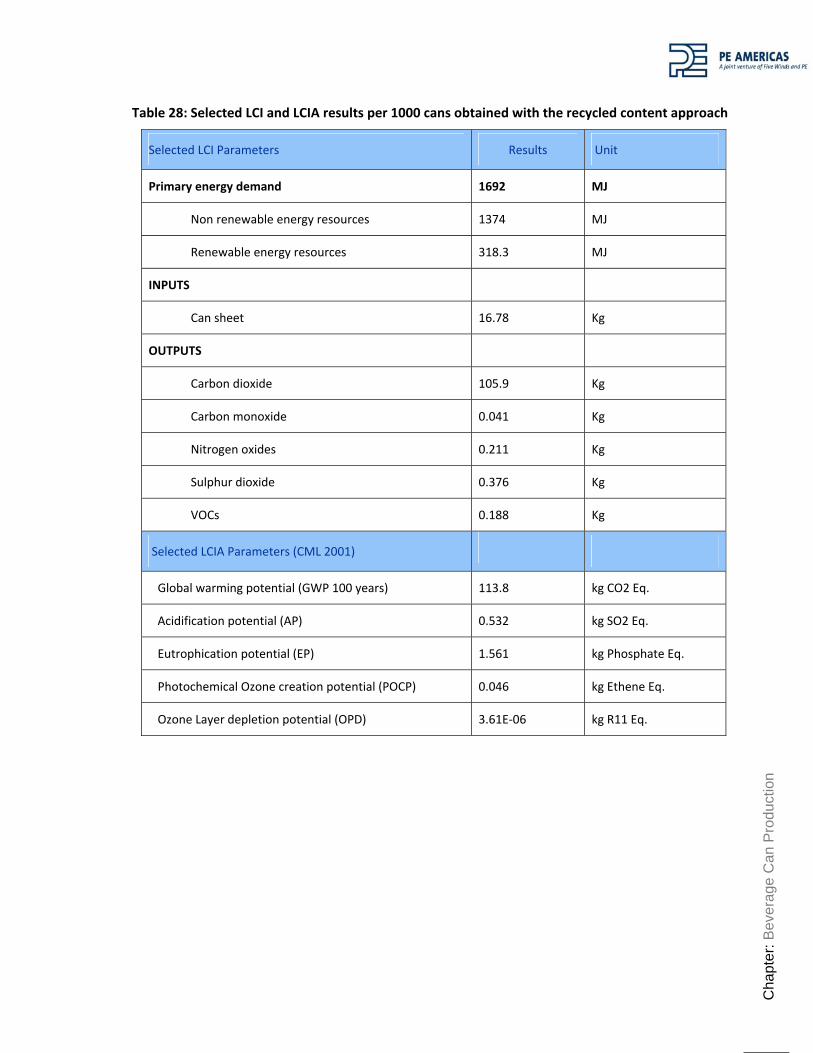
Cha
pter
: Bev
erag
e C
an P
rodu
ctio
n
Table 28: Selected LCI and LCIA results per 1000 cans obtained with the recycled content approach
Selected LCI Parameters Results Unit
Primary energy demand 1692 MJ
Non renewable energy resources 1374 MJ
Renewable energy resources 318.3 MJ
INPUTS
Can sheet 16.78 Kg
OUTPUTS
Carbon dioxide 105.9 Kg
Carbon monoxide 0.041 Kg
Nitrogen oxides 0.211 Kg
Sulphur dioxide 0.376 Kg
VOCs 0.188 Kg
Selected LCIA Parameters (CML 2001)
Global warming potential (GWP 100 years) 113.8 kg CO2 Eq.
Acidification potential (AP) 0.532 kg SO2 Eq.
Eutrophication potential (EP) 1.561 kg Phosphate Eq.
Photochemical Ozone creation potential (POCP) 0.046 kg Ethene Eq.
Ozone Layer depletion potential (OPD) 3.61E‐06 kg R11 Eq.

Final Report: Can LCA
PE Americas
Figure 32: Relative share of total primary energy demand (MJ per 1000 cans) over the life cycle of the can under recycled content approach. The solid color portion for each bar represents the non‐renewable fraction of primary energy and the hashed portion represents the renewable fraction of primary energy.
4.5 UBC recycling scenarios
The influence of the UBC recycling rate on the environmental performance of the beverage can product system was evaluated by considering additional scenarios for the following UBC recy‐cling rates:
30% ‐ Hypothetical low UBC recycling rate
45.1% ‐ UBC recycling rate estimated by Container Recycling Institute (ca. 2004) (CRI, 2008)
62% ‐ Peak UBC recycling rate achieved during the mid 1990s
75% ‐ Aluminum Association future goal for UBC recycling rate
The lower hypothetical recycling rate scenario was selected to interpret the results, when the recycling rate is lower than the recycled content. The variation in total primary energy demand per 1000 cans under different scenarios is shown in Figure 33 and the results are presented for both closed loop and recycled content approaches. At a higher UBC recycling rate (i.e. 75%), the closed loop approach seems more favorable, whereas at a lower recycling rate (i.e. 30%), the recycled con‐tent seems more favorable, as the product system would still try to maintain the recycled content of the can. The reason is that the recycled content approach cuts off both surplus UBC scrap (no addi‐tional benefit or credit) as well as an unsaturated scrap demand in case of a recycling rate lower than the recycled content (additional scrap necessary comes without burden). As a result, the pri‐mary energy demand under recycled constant approach does not change as the recycling rate is varied. It is likely that recycled content of the can will increase as the UBC recycling rate increases,
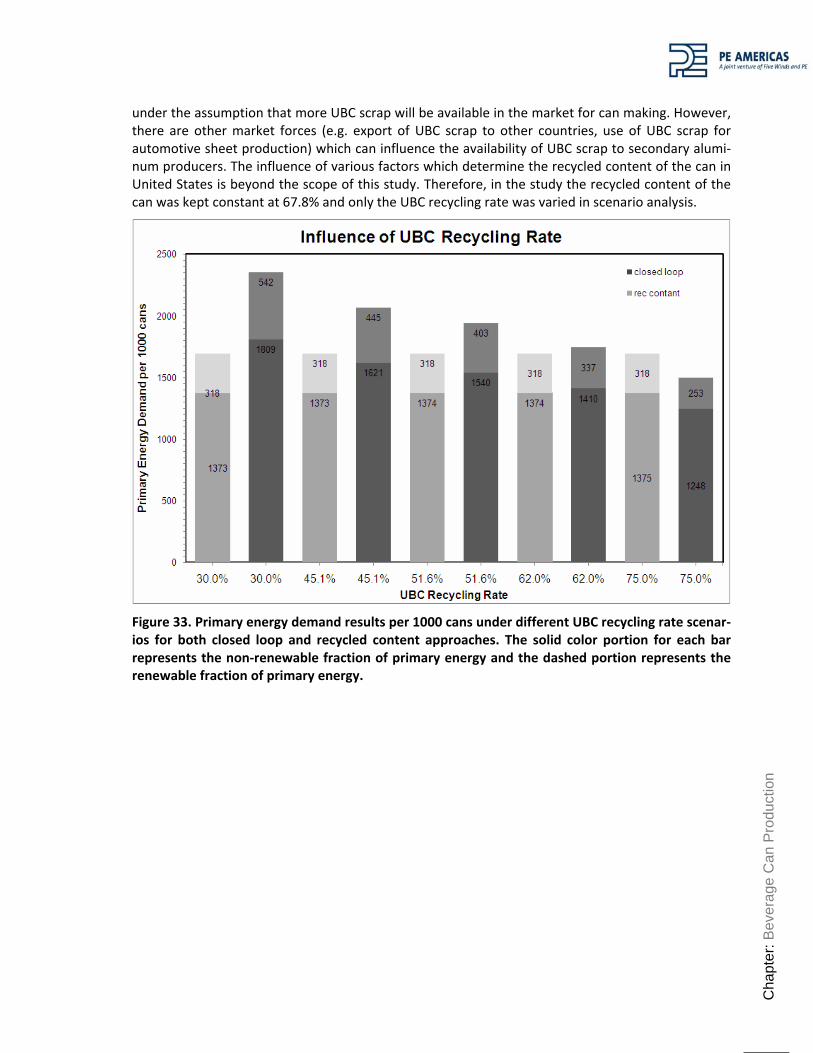
Cha
pter
: Bev
erag
e C
an P
rodu
ctio
n
under the assumption that more UBC scrap will be available in the market for can making. However, there are other market forces (e.g. export of UBC scrap to other countries, use of UBC scrap for automotive sheet production) which can influence the availability of UBC scrap to secondary alumi‐num producers. The influence of various factors which determine the recycled content of the can in United States is beyond the scope of this study. Therefore, in the study the recycled content of the can was kept constant at 67.8% and only the UBC recycling rate was varied in scenario analysis.
Figure 33. Primary energy demand results per 1000 cans under different UBC recycling rate scenar‐ios for both closed loop and recycled content approaches. The solid color portion for each bar represents the non‐renewable fraction of primary energy and the dashed portion represents the renewable fraction of primary energy.

Final Report: Can LCA
PE Americas
5 CONCLUSIONS This study provides the Aluminum Association and its member companies with an updated
LCI and LCIA of primary aluminum production in North America and aluminum beverage can produc‐tion in the U.S.
This study quantifies all the significant inputs and outputs to the beverage can system under two approaches to modeling end‐of‐life impacts: closed loop and recycled content. The system boundary of this life cycle assessment for beverage cans includes primary aluminum production, secondary aluminum production; aluminum can sheet production, can manufacturing, and recycling of UBC.
Information on the primary energy demand for primary aluminum production in North America shows that 67% comes from non‐renewable resources. Electrolysis accounts for 80% of the total energy demand for primary production. It is estimated that 11.1 metric tons of CO2 are emitted per ton of primary aluminum ingot produced of which 8.7 tons (78%)are from the electrolysis proc‐ess alone. The carbon dioxide emissions profile is similar to the energy profile, since the greatest contribution to greenhouse gases is associated with the combustion of fossil fuels for heat at pro‐duction sites and upstream environmental burdens associated with generation of electricity. The electrolysis process during primary aluminum production in the U.S. consumes approximately two‐thirds of its electricity demand from hydropower. This translates into a relatively lower carbon foot‐print compared to the use of electricity generated from fossil fuels. However, on account of the lower energy conversion efficiency of fossil fuel‐based power generation, the renewable fraction of total primary energy demand is lower than the non‐renewable fraction. A further analysis of green‐house gas (GHG) emissions was done following the guidelines in the GHG Protocol (WRI and WBCSD). Scopes 1 and 2 (direct GHG emissions and indirect GHG emissions attributable to energy conversion processes) together contribute to 9,847 kg. CO2 equivalents emitted per ton of primary aluminum produced while Scope 3 (further GHG emissions from the supply chain) adds another 1,221 kg. CO2 equivalents to these emissions. Scopes 1 and 2 indicate the emissions that are the direct responsibility of the production factories and the results follow closely with previous studies (IAI).
Concerning the end‐of‐life considerations, the results of the study indicate that the raw ma‐terial extraction and processing represent 67% of the total primary energy demand (1943 MJ per 1000 cans) under a closed loop approach, with production of the primary aluminum ingot alone accounting for 46% of net primary energy demand, and production of the secondary aluminum ingot (incl. scrap preparation) accounting for 8% of net primary energy demand. Under the recycled con‐tent system model, the contribution of raw material acquisition to total primary energy demand (1692 MJ per 1000 cans) decreases slightly to 62%. This is due to the net “burden” which is given to deficit UBC scrap in the closed loop system model.

Cha
pter
: Bib
liogr
aphy
BIBLIOGRAPHY AA. (2007). Aluminum Can Reclamation. Retrieved April 2008, from www.aluminum.org:
http://www.aluminum.org/Content/ContentFolders/AssociationHeadlines/June2007/UBC_Recycling_Rate_2006.pdf
AA. (1998). Life Cycle Inventory Report for the North American Aluminum Industry. Washing‐ton D.C.: The Aluminum Association.
Anseen, A. G., Okstad, S., Innvar, R., & Olsen, L. (1979). Operation of Soderberg Electrodes. Elkem Seminar in Smelting. Rio de Janeiro.
Artherton, J. (2007). C. International Journal of Life Cycle Assessment , 12 (1), 59‐60.
Bergsdal, H., Strömann, A. H., & Hertwich, E. G. (2004). The Aluminium Industry – Environ‐ment, Technology and Production. NTNU Program for industriell ökologi Raport. No.: 8/2004.
CML. (2001). Life cycle assessment – An operational guide to ISO standards, Vol 1, 2 and 3. Leiden: Center for Environmental Science, Leiden University.
CRI. (2008). Aluminum Recycling Rates. Retrieved April 2008, from Container Recycling Insti‐tute: http://www.container‐recycling.org/alum_rates.htm
Droy, B., & Michaux, D. (2003). Patent No. US 6,555,076, B1. United States.
ECOBILAN. (2001). Eco‐profile of high volume commodity phthalate esters (DEHP/DINP/DIDP). The European Council for Plasticisers and Intermediates (ECPI).
Frank, W. B., Haupin, W. E., Dawless, R. K., Granger, D. A., Wei, M. W., Calhoun, K. J., et al. (2008). Aluminum. Ulllmann’s Encyclopedia of Industrial Chemistry. John Wiley & Sons, Inc.
Grjotheim, U., & Kvande, H. (1993). Introduction to Aluminum Electrolysis. Understanding the Hall‐Heroult Process. Aluminum Verlag GmbH , 260.
IAI. (2007). Historical IAI Statistics. Retrieved November 2007, from www.world‐aluminum.org: http://www.world‐aluminum.org/Statistics/Historical+statistics
IAI. (2005). Life cycle assessment of Aluminum: Inventory data for the Primary Aluminum In‐dustry, Year 2005 Update. London: International Aluminum Institute.
ISO. (2006a). International Standard, ISO 14040, Environmental management – life cycle as‐sessment – principles and framework, 2006. Geneva: International Standard Organization.
ISO. (2006b). International Standard, ISO, 14044, Environmental management – life cycle as‐sessment – requirements and guidelines, 2006. Geneva: International Standard Organization.
Mylona, E., Kalamboki, T., & Xenidis, A. (2003). Processing of Bauxite Ores in: BAUXITE AND ALUMINA PROCESSING METHOD AND TAILINGS PRODUCTION. Retrieved from Mineral Industry Re‐search Organisation: http://www.miro.co.uk/tailsafe‐if/restricted/docs/wp1_2_6_bauxite.pdf
USGS. (2006). 2005 Minerals Yearbook – Aluminum. Washington, D.C.: United States Geo‐logical Survey, Department of Interior.
USGS. (2007). 2005 Minerals Yearbook – Bauxite and Alumina. Washington, D.C.: United States Geological Survey, Department of Interior.

Final Report: Can LCA
PE Americas
USGS. (2008). 2007 Minerals Yearbook Bauxite and Alumina [Advance Release]. Washington, D.C: United States Geological Survey, Department of Interior.
World Ports Distances. (2007). Retrieved November 2007, from World Ports Distances: http://www.distances.com
WRI & WBCSD. (2004). The Greenhouse Gas Protocol – A Corporate Accounting and Report‐ing Standard (revised edition). World Resources Institute Washington, D.C. and World Business Council for Sustainable Development, Geneva.

Cha
pter
: App
endi
x A
: Est
imat
ion
of T
otal
Prim
ary
Ene
rgy
Dem
and
fro
m D
irect
En
ergy
Use
APPENDIX A: ESTIMATION OF TOTAL PRIMARY ENERGY DE-
MAND FROM DIRECT ENERGY USE In the U.S., during the production of aluminum (liquid) metal during the electrolysis process,
the consumption of direct electricity is mainly from hydropower (approximately 70%). However, due to significantly lower energy conversion efficiency from coal, the environmental impacts associated with the generation of end electricity from coal (efficiency of about 30%) outweigh the relatively low environmental impacts of hydropower (efficiency of about 80%). Because of this, power production from coal dominates the environmental impacts of the total electricity production per kg aluminum (liquid).
The total primary energy demand7 required to produce 1 kWh of end electricity (3.6 MJ) from each energy source in the U.S. and Canada is given in Table 29 and Table 30, respectively.
Table 29: Total primary energy demand for 1 kWh generation of electricity from different energy sources in the U.S. Data source: GaBi 4 software system database (current release GaBi 4.3, http://www.gabi‐software.com)
Unit Power from nuclear power plant
Power from hard coal
Power from hydropower plant
Power from natural gas
Primary energy MJ/kWh 14.323 11.298 4.524 11.136
Non renewable energy resources MJ/kWh 14.301 11.295 0.022 11.092
Renewable energy resources MJ/kWh 0.022 0.003 4.502 0.044
In the U.S., to produce 1 kWh from hard coal, it requires approximately 11.3 MJ of primary energy, whereas to produce 1 kWh from hydropower, it requires only 4.5 MJ of primary energy. This difference is on account of variations in the overall efficiency of electricity production as stated above. This is also graphically illustrated in Figure 34.
7 Primary energy demand is the quantity of energy directly withdrawn from the hydrosphere, atmosphere, geosphere, or other energy source without any anthropogenic changes

Final Report: Can LCA
PE Americas
0
2
4
6
8
10
12
14
16
Power from nuclear powerplant
Power from hard coal Power from hydropower Power from natural gas
To
tal
pri
mar
y en
erg
y d
eman
d (
MJ
per
kW
h)
Renewable
Non-renewable
Figure 34: Total primary energy demand for 1 kWh generation of electricity from energy sources in the U.S. (Source: GaBi 4.3 LCI database)
Table 30: Total primary energy demand for 1 kWh generation of electricity from different energy sources in Canada. Data source: GaBi 4 software system database (current release GaBi 4.3, http://www.gabi‐software.com)
Unit Power from nuclear power plant
Power from hard coal
Power from hy‐droelectric plant
Power from natu‐ral gas
Primary energy MJ/kWh 14.323 12.179 4.500 10.592
Non renewable energy resources MJ/kWh 14.301 12.162 0.021 10.382
Renewable energy resources MJ/kWh 0.022 0.017 4.479 0.210
Due to the fact that electricity generation from fossil fuels is less efficient than hydroelectric power generation, sourcing a unit of energy from fossil fuel‐based generation sources creates a much higher primary energy demand than sourcing the same amount of energy from renewable resources. As a result, the non‐renewable fraction of total primary energy demand is higher than the renewable fraction.
In our study, the direct electricity use of 55.16 MJ per kg aluminum (liquid) metal corre‐sponds to a total primary energy demand of 102.7 MJ (non‐renewable fraction – 55.1 MJ and re‐newable fraction – 47.6 MJ). Although hydropower constitutes approximately 69.4% of direct elec‐

Cha
pter
: App
endi
x A
: Est
imat
ion
of T
otal
Prim
ary
Ene
rgy
Dem
and
fro
m D
irect
En
ergy
Use
tricity use for electrolysis in the U.S. and Canada, the renewable fraction is only 46.35% of the total primary energy demand. The estimation of total primary energy demand can be expressed by the following generic formula:
In the U.S. and Canada, as provided by the IAI data, it requires approximately 55.16 MJ of di‐rect electricity used to produce 1 kg of aluminum (liquid) metal. The breakdown for electricity gen‐eration is 31.1 MJ (56.38%) in the U.S. and 24.06 MJ (43.62%) in Canada. The relative fractions for energy source mix for electricity production for electrolysis in the U.S. and Canada are given below (assumed same for both countries as per IAI data):
Hydro – 69.4%
Coal – 29.7%
Natural gas – 0.6%
Nuclear – 0.3%
The primary energy demand for electrolysis (from electricity use only) in the U.S. and Can‐ada are calculated as below:
U.S.
The above results are also graphically illustrated in Figure 35.

Final Report: Can LCA
PE Americas
21.6
27.0
30.1
9.5
0
10
20
30
40
50
60
Direct energy (MJ) Primary energy demand (MJ)
En
erg
y (M
J p
er k
g a
lum
inu
m (
liq
uid
) m
etal
)
Non renewable
Renewable
Hydro
Coal + natural gas + nuclear
Figure 35: Direct energy (in MJ) and Primary energy demand (in MJ; for electricity use only) for 1 kg of aluminum (liquid) in the U.S.
Canada
Total

Cha
pter
: App
endi
x A
: Est
imat
ion
of T
otal
Prim
ary
Ene
rgy
Dem
and
fro
m D
irect
En
ergy
Use

Final Report: Can LCA
PE Americas
APPENDIX B: TRANSPORTATION DATA FOR RAW MATERIALS
AND FINISHED PRODUCTS Table 31: Transportation data for raw materials and finished products
Raw material/product Tonnage fraction transported (%)
Mode of transpor‐tation
Distance (km)
Primary ingot to secondary furnaces 100% Rail 2400
Can Body Stock to Can Manufacturer 100% Rail 100
Transport of UBC scrap from collec‐tion point to secondary aluminum producers
100% Truck 160
Transport of manufacturing scrap to secondary aluminum producer
100% Truck 160
Cha
pter
: App
endi
x C
: Im
pact
Indi
cato
rs
APPENDIX C: IMPACT INDICATORS The following describes briefly the various impact categories included in the report8.
PRIMARY ENERGY CONSUMPTION Primary energy demand is the quantity of energy directly withdrawn from the hydrosphere,
atmosphere, geosphere, or energy source without any anthropogenic changes.
It is a measure of the resource used across the life cycle of a product.
For fossil fuels and uranium, this would be the amount of resource withdrawn expressed in its energy equivalent (i.e. the energy content of the raw material). For renewable resources, the energy‐characterized amount of biomass consumed would be described. For hydropower, it would be based on the amount of energy that is gained from the change in the potential energy of the water (i.e. from the height difference). As aggregated values, the following primary energies are designated:
The total “Primary energy consumption non‐renewable”, given in MJ, essentially character‐izes the gain from the energy sources natural gas, crude oil, lignite, coal and uranium. Natural gas and crude oil will be used both for energy production and as material constituents, e.g. in plastics. Coal will primarily be used for energy production. Uranium will only be used for electricity produc‐tion in nuclear power stations.
The total “Primary energy consumption renewable”, given in MJ, is generally accounted separately and comprises hydropower, wind power, solar energy, and biomass. It is important that the end energy (e.g. 1 kWh of electricity) and the primary energy used are not miscalculated with each other; otherwise the efficiency for production or supply of the end energy will not be ac‐counted for.
The energy content of the manufactured products will be considered as feedstock energy content. It will be characterized by the net calorific value of the product. It represents the still usable energy content.
8 Please refer to CML (2001) and GaBi documentation at http://documentation.gabi‐software.com for more details on the impact categories.

Final Report: Can LCA
PE Americas
GLOBAL WARMING POTENTIAL The mechanism of the greenhouse effect can be observed on a small scale in, as the name
suggests, greenhouses. These effects are also occurring on a global scale. Incident short‐wave radia‐tion from the sun comes into contact with the earth’s surface and is partly absorbed (leading to di‐rect warming) and partly reflected as infrared radiation. The reflected part is absorbed by so‐called greenhouse gases in the troposphere and is re‐radiated in all directions, including back to earth. This results in a warming effect at the earth’s surface.
In addition to the natural mechanism, the greenhouse effect is enhanced by human activities. Greenhouse gases that are considered to be caused, or increased, anthropogenically are, for exam‐ple, carbon dioxide, methane, and CFCs.
Page 25The alongside figure shows the main processes of the an‐thropogenic greenhouse effect. An analysis of the greenhouse effect should consider possible long term global effects. The global warming potential is calculated in carbon diox‐ide equivalents (CO2‐Eq.). This means that the greenhouse potential of an emission is given in relation to CO2. Since the residence time of the gases in the atmosphere is incorporated into the calculation, a time range for the assessment must also be specified. A period of 100 years is customary.
Figure 36: Greenhouse effect

Cha
pter
: App
endi
x C
: Im
pact
Indi
cato
rs
ACIDIFICATION POTENTIAL The acidification of soils and water occurs predominantly through the transformation of air
pollutants into acids. This leads to a decrease in the pH‐value of rainwater and fog from 5.6 to 4 or lower. Sulfur dioxide and nitrogen oxide and their respective acids (H2SO4 and HNO3) produce rele‐vant contributions to this acidification. This damages ecosystems, whereby forest dieback is the most well known impact.
Acidification has both direct and indirect damaging effects (such as nutrients being washed out of soils or an increased solubility of metals into soils). But even buildings and building materials can be damaged. Examples include metals and natural stones, which are corroded or disintegrated at an increased rate.
When analyzing acidification, it should be considered that although it is a global problem, the regional effects of acidification can vary. Figure 37 displays the primary impact pathways of acidification. The acidification potential is given in sulfur dioxide equivalents (SO2‐Eq.). The acidification potential is de‐scribed as the ability of certain substances to build and release H+ ions. Certain emis‐sions can also be considered to have an acidification potential, if the given S‐, N‐ and halogen atoms are set in proportion to the molecular mass of the emission. The reference substance is sulfur dioxide.
Figure 37: Acidification Potential

Final Report: Can LCA
PE Americas
EUTROPHICATION POTENTIAL Eutrophication is the enrichment of nutrients in a certain place. Eutrophication can be
aquatic or terrestrial. Air pollutants, wastewater, and fertilization in agriculture all contribute to eutrophication.
The result in water is an accelerated algae growth, which in turn, prevents sunlight from reaching the lower depths. This leads to a decrease in photosynthesis and less oxygen production. In addition, oxygen is needed for the decomposition of dead algae. Both effects cause a decreased oxygen concentration in the water, which can eventually lead to fish dying and to anaerobic decom‐position (decomposition without the presence of oxygen). Hydrogen sulfide and methane are there‐by produced. This can lead, among others, to the destruction of the eco‐system.
In eutrophicated soils, an increased susceptibility of plants to diseases and pests is often ob‐served, as is a degradation of plant stability. If the nutrification level exceeds the amounts of nitro‐gen necessary for a maximum harvest, it can lead to an enrichment of nitrate. This can cause, by means of leaching, increased nitrate content in groundwater. Nitrate also ends up in drinking water. Nitrate at low levels is harmless from a toxicological point of view. However, nitrite, a reaction product of nitrate, is toxic to humans. The causes of eutrophication are displayed in Figure 38.
The eutrophication potential is calcu‐lated in phosphate equivalents (PO4‐Eq). As with acidification potential, it’s important to remember that the effects of eutrophication potential differ regionally.
Figure 38: Eutrophication Potential
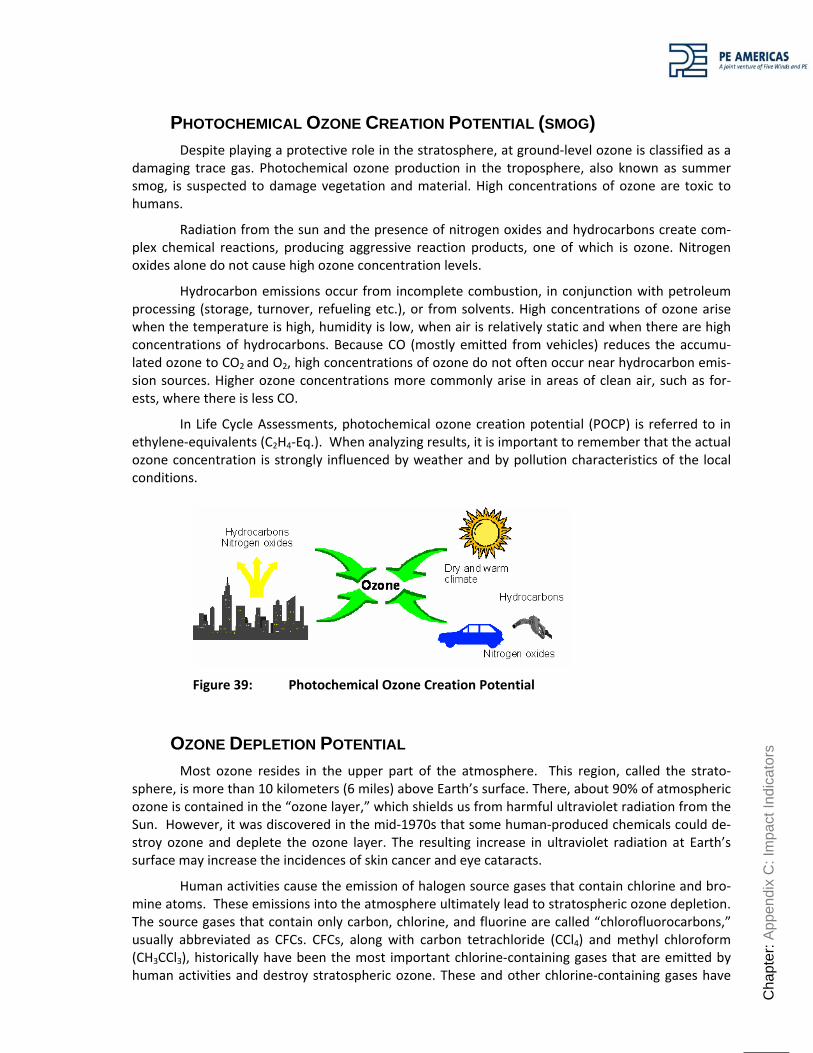
Cha
pter
: App
endi
x C
: Im
pact
Indi
cato
rs
PHOTOCHEMICAL OZONE CREATION POTENTIAL (SMOG) Despite playing a protective role in the stratosphere, at ground‐level ozone is classified as a
damaging trace gas. Photochemical ozone production in the troposphere, also known as summer smog, is suspected to damage vegetation and material. High concentrations of ozone are toxic to humans.
Radiation from the sun and the presence of nitrogen oxides and hydrocarbons create com‐plex chemical reactions, producing aggressive reaction products, one of which is ozone. Nitrogen oxides alone do not cause high ozone concentration levels.
Hydrocarbon emissions occur from incomplete combustion, in conjunction with petroleum processing (storage, turnover, refueling etc.), or from solvents. High concentrations of ozone arise when the temperature is high, humidity is low, when air is relatively static and when there are high concentrations of hydrocarbons. Because CO (mostly emitted from vehicles) reduces the accumu‐lated ozone to CO2 and O2, high concentrations of ozone do not often occur near hydrocarbon emis‐sion sources. Higher ozone concentrations more commonly arise in areas of clean air, such as for‐ests, where there is less CO.
In Life Cycle Assessments, photochemical ozone creation potential (POCP) is referred to in ethylene‐equivalents (C2H4‐Eq.). When analyzing results, it is important to remember that the actual ozone concentration is strongly influenced by weather and by pollution characteristics of the local conditions.
OZONE DEPLETION POTENTIAL Most ozone resides in the upper part of the atmosphere. This region, called the strato‐
sphere, is more than 10 kilometers (6 miles) above Earth’s surface. There, about 90% of atmospheric ozone is contained in the “ozone layer,” which shields us from harmful ultraviolet radiation from the Sun. However, it was discovered in the mid‐1970s that some human‐produced chemicals could de‐stroy ozone and deplete the ozone layer. The resulting increase in ultraviolet radiation at Earth’s surface may increase the incidences of skin cancer and eye cataracts.
Human activities cause the emission of halogen source gases that contain chlorine and bro‐mine atoms. These emissions into the atmosphere ultimately lead to stratospheric ozone depletion. The source gases that contain only carbon, chlorine, and fluorine are called “chlorofluorocarbons,” usually abbreviated as CFCs. CFCs, along with carbon tetrachloride (CCl4) and methyl chloroform (CH3CCl3), historically have been the most important chlorine‐containing gases that are emitted by human activities and destroy stratospheric ozone. These and other chlorine‐containing gases have
Figure 39: Photochemical Ozone Creation Potential

Final Report: Can LCA
PE Americas
been used in many applications, including refrigeration, air conditioning, foam blowing, aerosol pro‐pellants, and cleaning of metals and electronic components.
In Life Cycle Assessments, Ozone Depletion Potential (ODP) is referred to in CFC‐11‐equivalents. Since most ozone depleting compounds were phased out by the Montreal Protocol in 1987, the stratospheric ozone layer has been recovering and there are very few ozone depleting emissions.
CFCsNitrogen oxide
Stratosphere15 - 50 km Absorption Absorption
UV - radiation
CFCsNitrogen oxide
Stratosphere15 - 50 km Absorption Absorption
UV - radiation
Figure 40: Ozone Depletion Potential

Cha
pter
: App
endi
x D
: Dat
a qu
ality
eva
luat
ion
APPENDIX D: DATA QUALITY EVALUATION Data quality was evaluated using the Weidema methodology as described in the Interna‐
tional Journal of LCA 3 (5) page 259‐265; 1998, Weidema et al.; LCA data quality. The following ta‐bles show the evaluation matrix and the evaluation.
Table 32: Data quality evaluation matrix
Table 33: Results data quality evaluation

Final Report: Can LCA
PE Americas
APPENDIX E: CRITICAL REVIEW REPORT

Cha
pter
: App
endi
x E
: Crit
ical
rev
iew
rep
ort
5.1 ALUMINUM BEVERAGE CAN LCI REPORT FEBRUARY 2010
REVIEWER COMMENTS FEBRUARY 26, 2010
No Reviewers comments Followup
1 Regarding data quality and its discussion in the document, that still could pose some questions when the report is released. The response that data quality is now more uni‐formly treated, that is, each process or activity now has a statement regarding the quality of the data used, is cor‐rect. However, the actual basis for those statements and any implications of the resultant use of the data with that quality rating is not provided. Is it useful to say that the quality is high or medium, yes, because it gives a general impression of the degree of adherence to the four quality category parameters? Do I understand how that rating was arrived at or how/if it affected the use of the informa‐tion or the drawn conclusions, no.
Appendix D on Data quality evaluation added.
2 One of the original comments in the 4 December docu‐ment: Even for these operations it isn't possible to discern how the data quality indicators were applied to reach the conclusions regarding aggregated quality." The response merely says "Updated in several places." However, what does it mean to say that data were found to be of high quality? How data quality was determined needs to be explained
Point 1.
3 Page 13 mentions the critical review but where can readers find the review comments? As we discussed the other day, an important part of a critical review for public assertion is full disclosure of what the review found and how issues were resolved. The review process and comments should be included as an appendix.
Appendix E added
4 Specific comments:
‐ Page 3; Should this read "the Aluminum Associa‐tion experts.." not expects?
‐ Why does Figure 1 have a blue box around the can production but Figure 2 does not?
‐ Figure 9: Are the years (1999 2005 (b)) needed in the Alumina box? The caption says the data reflect 2005. [I realize the figures are probably generated from GaBi and may not be revisable.]
Page 74: Only selected data, and impacts, are
Formatting/typographical mistakes fixed.

Final Report: Can LCA
PE Americas
shown in this chapter. Where can the entire LCI be found?
Page 97: Page 25The alongside figure... ??
5.2 ALUMINUM BEVERAGE CAN LCI REPORT OCTOBER 2009
REVIEWER COMMENTS DECEMBER 4, 2009
No Reviewers comments Followup
1 While our comments have been individually addressed, I feel that some of the responses are cursory (some are even ar‐gumentative without a real basis). For example, PEA’s re‐sponse to being asked for the method that will be used for averaging data, the reply is "The final LCI profile will repre‐sent industry average of various unit processes." This reply does not provide a description of the method.
There is a section on data cal‐culation where the methods for averaging are explained.
2 I have the impression that the authors have diligently con‐sidered our comments, even if the written responses are thin. I see no problem with moving ahead with the next step (conference call?) in the review process
‐
3 In the report a number of statements are made in qualitative or non‐numerical fashion that does not allow the reader to judge the validity of the preparer’s decisions. For example, page x of the Executive Summary contains the statement “Modeling for domestic production was used to reflect the fact that the majority of secondary aluminum consumed in the target year was produced in the US.” Without a numeri‐cal value, it is not possible to understand if this was a correct determination or not. If the percentage is 85, then it is rea‐sonable; if it is 51, it may not be. Section 2.2.8.2 on page 12 is even less descriptive of why the geographic coverages are valid.
OK. Comment about domestic production was removed as it was misleading. Can ingot is produced in recycling facilities in the US using domestic scrap.
4 There are some numerical discrepancies between the report and the addendum that are not explained. For example, in the third bullet point on page x of the Executive Summary (and elsewhere in the report) it states the recycled content percentage is 67.8%, while on page 5 of the addendum it is 60.1% for the same data year of 2007.
This is mentioned in the ad‐dendum. It is a different way of counting recycled content and the results of the adden‐dum reflect this.
5 There are some assumptions or conditions inherent in the system accounting that may not be understandable to audi‐
Additional commentary added

Cha
pter
: App
endi
x E
: Crit
ical
rev
iew
rep
ort
ence members who are not thoroughly familiar with LCI ac‐counting rules. For example, a statement in one of the EoL scenarios that imports scrap burden free is not intuitive. Specifically, the comment “An additional 1.797 kg of scrap is therefore required to make up the deficit which in the recy‐cled content approach is imported “burden‐free”…” should have additional commentary as to why this is reasonable. Section 4.4.2, 2nd par. provides a better explanation and should be considered for insertion in the Executive Sum‐mary.
in several places.
6 In addition to some grammatical and typographic issues, which, in a minor way, detract from the report’s credibility, there are some place where editing would improve the un‐derstanding of the study context and results. For example, on page 2 it states “The aim of the study is to generate high‐quality, up‐to‐date data on the environmental performance of aluminum beverage can production.” It is suggested that slightly amending this to add “including the flow of secon‐dary materials from End of Life back into beverage cans.”, would make it clear that can production is the focus, but sourcing/processing of reusable aluminum is essential to this characterization.
Updated in several places.
7 The rationale for the recycled content approach (page 5) needs to be clear that in addition to the assumptions stated, the benefits of recycling (primary material production and waste disposal avoidance) outweigh the burdens of post‐consumer collection and processing. As currently described this net benefit requirement is not clear.
While this is true for Alumi‐num, it is not always the case with other materials. Com‐ment added.
8 In Section 2.2.9, please correct my affiliation to reflect the transition from Battelle (initial study review) to SETAC (final report and addendum).
OK; no reference in addendum
9 In Section 3.1.5, it indicates that materials from ingot casting (e.g. dross and filter dust)recovered for use in systems other than beverage cans are being treated as wastes (i.e. have no co‐product burdens), even though the text implies these are co‐products. Although this distinction may be inconsequen‐tial in terms of flows or impacts, it seems inconsistent with the statement made earlier regarding allocation. In Section 2.2.6 it stated “In this study, no allocation was applied as all co‐products are considered in each of the recycling models described above (ISO, 2006b). Some clarification to the ef‐fect that any recovered materials cycled into other products are treated as waste, thereby providing a maximum alloca‐tion of burdens to aluminum can production, would resolve this apparent inconsistency.
OK.added in section 2.2.6

Final Report: Can LCA
PE Americas
10 The data quality discussion throughout the report is inconsis‐tent and in most cases lacking altogether. Actual discussion of data quality, regardless of specificity, is provided for only three sets of processes, primary Al, can sheet, and can pro‐duction. Even for these operations it is not possible to dis‐cern how the data quality indicators were applied to reach the stated conclusions regarding aggregated quality.
Updated in several places.
11 In Section 4.4.1 the first paragraph has a formatting error flagged that has not been fixed
Should be fine now
12 In general, the addendum commentary regarding the two EoL options is understandable and responsive to the earlier input from the review panel. However, there are a number of places where the connection to the full study report needs to be more explicit. For example, nowhere in the addendum does it state that the analysis is for 12 ounce cans. If it is possible for the additional analyses somehow to be sepa‐rated from the report, the addendum should be more or less stand‐alone
The addendum is not for dis‐closure and therefore, not meant to be a stand‐alone document
13 In a similar vein, references to or sources of data need to be complete. In the addendum, either they are missing alto‐gether, for example the 2007 recycled content percentage, or are cited in (source, date) format with the actual citation not included. This is not transparent
Point 12.
14 The significance or lack thereof for the different results be‐tween the addendum and the report should be explained. The text simply states they are “minor” and the final para‐graph states “there is no significance to the overall LCA re‐sults”. That much is obvious from the numerical values, but it would be useful to understand why the differences are considered non‐significant. If this simply due to the small numerical changes, the data variability, or the difference in impact consequences themselves, the report should so state.
This is stated in the first para‐graph – it is another way of counting recycled content. The reason for the differences are explained.
15 The comment made earlier by the review team, and in prin‐ciple agreed upon by the consultant, to either provide vol‐ume‐based results or a conversion factor appears not to have been implemented in the addendum. Although the text in Section 4.3 of the report does provide a num‐ber:volume conversion factor, it was not clear whether the 1000 can basis conversion to volume was for 12 oz. cans or a weighted average of all sizes
The addendum uses the same parameters as the case of the report. In section 2.1 it is stated that the LCI data repre‐sent the weighted average of the different can sizes.
16 If these results, or those of the original report for that mat‐ter, are going to be released to third parties, some details on
CML and GaBi References
Cha
pter
: App
endi
x F
: Crit
ical
rev
iew
ers’
Bio
the aggregation of inventory flows into LCIA categories and the conversion to impacts needs to be included, even if the actual computations are done entirely within the software. Otherwise, there is a loss of transparency and consequen‐tially credibility. The Appendix C material discusses this in general but does not provide a mapping of flows to impacts, particularly where there is a possibility of inconsistencies in assigning inventory flows to impact categories
added.
17 Schematic on page 4 of Addendum: Shows can manufactur‐ing scrap remelted with rolling process scrap. The reality is that can manufacturing scrap is usually coated, decorated (inks) or contains compound for sealing the can (lids), there‐fore it is sent through the secondary system, much like UBCs. The arrow should be extended horizontally to connect with that recycle loop. I don’t think this affects the analysis, but it represents what actually occurs.
This is the approach adopted in the main report.
18 Assumption on page 5 of Addendum: The comment about no primary aluminum required for production of RSI is correct. However, RSI made from can lids and bodies is generally used to make new can body stock. The RSI made from this mix contains more magnesium than is allowed in 3004 or 3104 alloy specifications, therefore some amount of primary (or other form of purer scrap) is used to dilute the magne‐sium percentage
This is accounted for in the material flows and has been confirmed by AA.
19 The report seems to exclude the facts that
1. UBCs are used in other aluminum sheet end prod‐ucts, such as building products sheet
2. Other forms of scrap such as building products sheet are used to make RSI that is used in the recycle loop for can body stock.
Based on especially (b) above, my belief is the recy‐cled content of cans (from all forms of scrap) is higher than stated in the report
Scrap is treated as scrap in the model irrespective of whether it is can scrap or industrial scrap (as it does not have an influence on the LCA). The percentage of secondary alu‐minum (from AA and produc‐ers) includes all kinds of scrap.
APPENDIX F: CRITICAL REVIEWERS’ BIO

Final Report: Can LCA
PE Americas
Dr. Bruce W. Vigon
Dr. Vigon has designed and executed research and development programs ranging from short term focused studies to multi‐million dollar, multi‐year efforts for a range of corporate clients and government agencies, both domestically and internationally. Efforts have involved organizations as diverse as the US Environmental Protection Agency, Environment Canada, US Department of De‐fense, state and provincial governments, various academic institutions, the World Business Council for Sustainable Development, World Wildlife Fund and other environmental advocacy organizations, and a host of private sector companies ranging across the automotive, textiles, consumer products, electronics, defense, and packaging industries. Bruce is a member of SETAC and is active in several focus areas, including life cycle assessment, environmental systems analysis, environmental chemis‐try, contaminant fate and effects research, and risk assessment, since 1990. He has been Editor of the SETAC Globe LCA Community of Practice newsletter for more than 18 years and has been chair and critical review panelist on more than a half dozen LCA studies, including several highly complex and controversial product and service systems.
Dr. Mary Ann Curran
Dr. Curran directs the US EPA System Analysis Branch’s Life Cycle Assessment (LCA) research program which includes the development of LCA methodology, the performance of life‐cycle case studies, life‐cycle workshops and conferences, and the development of a life cycle data and re‐sources website (www.epa.gov/ORD/NRMRL/lcaccess). As a recognized international expert in LCA, Dr. Curran works closely with the Society of Environmental Toxicology and Chemistry (SETAC), which has been instrumental in advancing LCA awareness worldwide, and actively participates in the UNEP/SETAC Life Cycle Initiative. Dr. Curran also serves on the SETAC ‐North America LCA Advisory Group. In addition, Dr. Curran is on the editorial boards of the International Journal of Life Cycle Assessment, Management of Environmental Quality, and the advisory boards of the on‐line journals Sustainability and the International Journal of Environmental Research and Public Health. Since 2005, Dr. Curran has served as the Subject Editor (Cleaner Production Tools) for the Journal of Cleaner Production. She provides technical support to EPA program offices in developing policy and regulations including guidelines for the federal procurement of environmentally‐preferable prod‐ucts. Dr. Curran provides technical review and assistance to outside groups on the application of the life cycle concept to areas such as green product and process design and development. She has participated in the technical peer review of industry‐sponsored life‐cycle studies on various prod‐ucts, such as electricity, diapers, cleaners, plastics, coal ash, building materials, and packaging.
Todd Boggess
Todd is a 1998 graduate of the University of Kentucky with a BS in Economics. Todd is a member of Alpha Kappa Psi, a professional business fraternity. Following graduation, Todd spent two years as a consultant with Systems & Computer Technology, where he provided financial input into the design and update of accounting software for nonprofit organizations. In 2001, Todd ac‐cepted a position with the University of Kentucky in the Sponsored Projects Accounting department. There, he managed federal and state funded grants for the University of Kentucky Research Founda‐

Cha
pter
: App
endi
x F
: Crit
ical
rev
iew
ers’
Bio
tion. In December of 2001, Todd joined Secat, Inc. as Business Manager where he oversees all finan‐cial and accounting responsibilities. Todd acts as project manager for US Department of Energy con‐tracts granted to Secat, Inc. Todd also serves as Secretary for the Board of Directors for Secat. Secat provides technology and R&D services to materials companies. Todd is currently enrolled in the MBA program at Western Kentucky University and expects to graduate in June 2011.


