Management LBO Project – Student’s Eponym Used for Sponsorship Firm/Private Equity Firm for LBO of Monster Worldwide, Inc.
13
Monster Worldwide, Inc. Leveraged Buyout Acquisition Plan Proposal Submitted to Mr. Patterson “Pat” Waldenheimat, Chairman and CEO of Msverde Capital Assets, LLP by Mr. M. Scott Green, EVP and Director of Global Investments 4/18/2012
Transcript
Monster Worldwide, Inc.
Leveraged Buyout Acquisition Plan Proposal Submitted to
Mr. Patterson “Pat” Waldenheimat, Chairman and CEO of Msverde Capital Assets, LLP
by Mr. M. Scott Green, EVP and Director of
Global Investments4/18/2012
Table of Contents
I. LBO Trigger: CEO Iannuzzi & R. W. Baird Co. Conference
II. Executive Summary and Financial Request
III. Company Background
IV. Financial Review
V. Q & A
VI. References
LBO Trigger: Monster’s CEO Iannuzzi & the R. W. Baird & Co. Conference
Marketing Accounted for 21% of 2011 Revenue
A 25% Spike Registered in Intraday Trading following Comments
59% Decline in Stock Value since March 31, 2011
The Oracle Speaks: “…strategic alternatives…”
Executive Summary
• Conditions Prompting the LBO Proposal
• Business Growth Cycle Stage
• Financial Performance Record to Date
• Causes for Poor Performance: Internal and External Factors
• LBO Management Reorganization/Restructuring Bid
4/18/2012
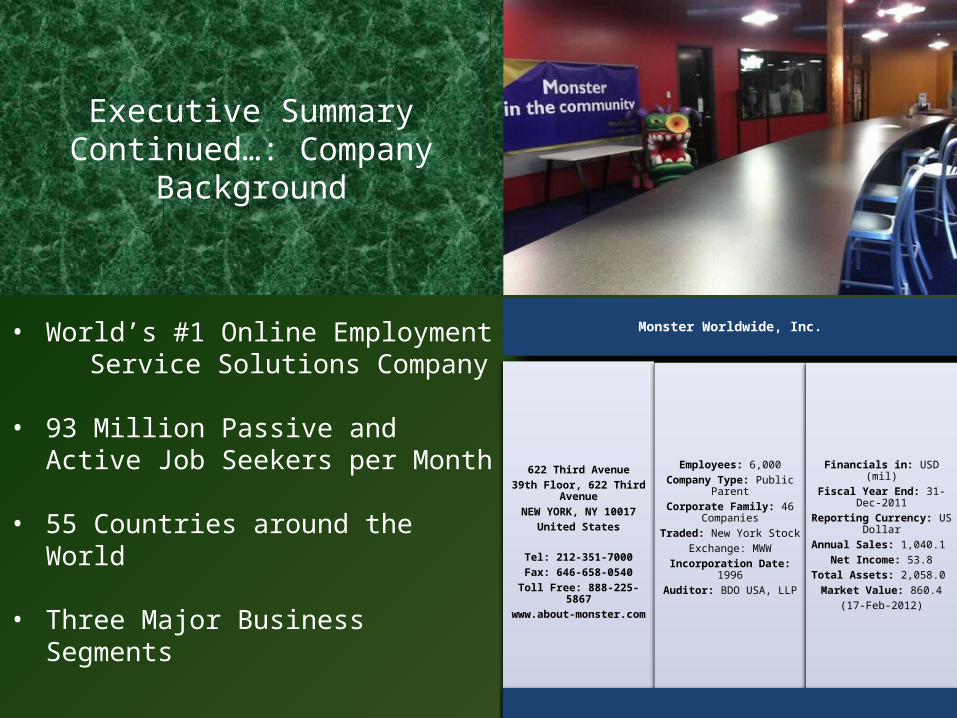
Executive Summary Continued…: Company Background
• World’s #1 Online Employment Service Solutions Company
• 93 Million Passive and Active Job Seekers per Month
Shares Outstanding (as of April 17, 2012) = 123,923,000
10-Year Treasury Note: 1.988%
Monster Risk Free Rate: 2.97%
WACC = Since there is no debt or preferred stock, the WACC is the
Return on Stock, 16.6681
Market Value = $1,106,632,000
Line of Credit (LOC): Prime Rate plus Libor Rate
Expected Rate of Return on Equity = 8.47%
Cost of Equity =16.6681
Effective Tax Rate = 20%
Prime Rate: 3.25%
Monster Beta: Range 2.16-2.97; Average 2.57
Stock Price (as of April 17, 2012) = $8.93
Termination Fee = 8.5% of Deal Value
Business Revenue Segmentation Regression Analysis: Null Hypothesis: Monster Worldw ide revenue is affected by [selected] global economic factors
Regression StatisticsMultiple R 0.80R Square 0.64Adjusted R Square 0.10Standard Error 102385.87Observations 11
ANOVA
df SS MS F Significance FRegression 6 75188006372 12531334395 1.20 0.45Residual 4 41931462351 10482865588Total 10 1.17119E+11
Coefficients Standard Error t Stat P-value Lower 95% Upper 95% Lower 95.0% Upper 95.0%Intercept 187945.772 77026.25135 2.44002231 0.07 -25913.39 401804.93 -25913.39 401804.93Unemployment Rate % Yearly Weighted Average Increase/Decrease (YOY)2610827.75 1260899.922 2.070606638 0.11 -889991.67 6111647.17 -889991.67 6111647.17CPI Delta % Average -1632.6281 28574.67459 -0.057135491 0.96 -80968.64 77703.39 -80968.64 77703.39Real GDP per Employee Person Average Increase/Decrease % (YOY)-3509900.7 10764750.06 -0.32605501 0.76 -33397638.31 26377836.92 -33397638.31 26377836.92Patents Total (YOY) 3538123.76 22226157.7 0.159187378 0.88 -58171582.99 65247830.51 -58171582.99 65247830.51Patents Inventions (YOY) -1135330 22299430 -0.050912959 0.96 -63048473.24 60777813.32 -63048473.24 60777813.32Patents Designs (YOY) -469805.11 1340318.171 -0.350517602 0.74 -4191124.94 3251514.72 -4191124.94 3251514.72
• Market- and Industry-Based Exclusivity• Conservative Rates, Where Permitted
(e.g., Termination Fee %)
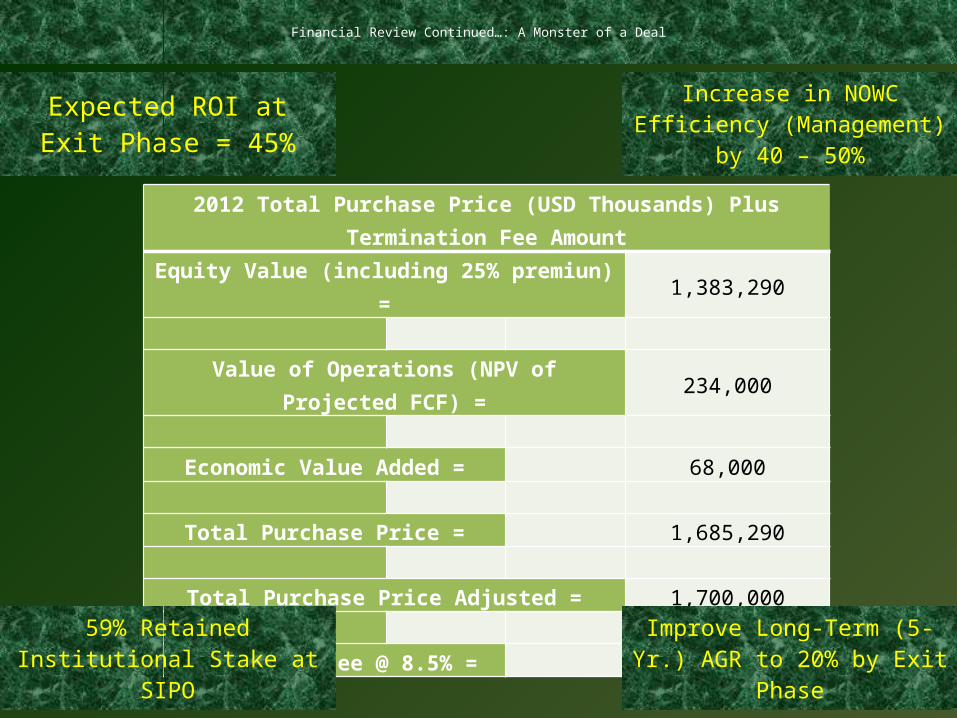
Financial Review Continued…: A Monster of a Deal
Expected ROI at Exit Phase = 45%
2012 Total Purchase Price (USD Thousands) Plus Termination Fee Amount
Equity Value (including 25% premiun) = 1,383,290
Value of Operations (NPV of Projected FCF) = 234,000
Economic Value Added = 68,000
Total Purchase Price = 1,685,290
Total Purchase Price Adjusted = 1,700,000
Termination Fee @ 8.5% = 144,500
Increase in NOWC Efficiency (Management)
by 40 – 50%
Improve Long-Term (5-Yr.) AGR to 20% by Exit
Phase
59% Retained Institutional Stake at SIPO
4/18/2012
Monstering Up A Little Q & A
4/18/2012
Monster References
• Cravath, Swaine & Moore LLP (2012). Home: Information. Retrieved March 2, 2012, from http://www.cravath.com/• Credit Suisse Group AG (1997-2012). Home: Information. Retrieved March 2, 2012, from
https://www.credit-suisse.com/investment_banking/advisory_services/en/mergers_and_aquisitions.jsp• Culbert, K. (2011). Ibis World Industry Report. Retrieved February 14, 2012, from www.ibisworld.com• Datamonitor (2012). Monster Worldwide, Inc.: SWOT Analysis. Retrieved February 14, 2012, from
http://0-online.datmonitor.com.library.ggu.edu• Federal Trade Commission (2012). FTC Premerger Notification Program. Retrieved March 24, 2012, from
http://www.ftc.gov/bc/hsr/hsrform.shtm• Hermann, J. T. (2003). Pacific Coast Capital, Inc.: Writing a Business Plan for a Leveraged Buyout. Retrieved on April 02, 2012
from www.pacific-coast-capital.com• International Monetary Fund.com (2012). Economic Outlook. Retrieved February 14, 2012, from www.imf.com• Mergent.com (N/A). Mergent Online Search. Retrieved February 14, 2012, from http://0-online.mergent.com.library.ggu.edu• Monster Worldwide, Inc. (2012). About Us. Retrieved March 1, 2012, from www.about-monster.com• MorningStar, Inc. (2012). Investment Research Center. Retrieved on April 12, 2012 from
http://0-library.morningstar.com.library.ggu.edu/• Observations (2011). Average Stock Market Returns. Retrieved April 2, 2012, from
http://observationsandnotes.blogspot.com/2009/03/average-annual-stock-market-return.html• OneSource Information Services, Inc. (2012). Company Summary Report: Monster Worldwide, Inc. Retrieved February 14,
2012, from http://0-online.onesource.com.library.ggu.edu• Standard & Poor’s (2012). S&P Capital IQ: NetAdvantage. Retrieved April 12, 2012 from
• The Securities and Exchange Commission (2010). Filings & Forms. Retrieved March 14, 2012, from http://www.sec.gov/about/forms/secforms.htm#proxy
• U.S. Census Bureau (2011). Statistical Abstract. Retrieved March 24, 2012, from http://www.census.gov/compendia/statab/cats/international_statistics.html
• Yahoo, Inc. (2012). Yahoo Finance. Retrieved February 14, 2012, from http://finance.yahoo.com/q/bc?t=1d&s=MWW&l=on&z=m&q=l&c=%5EYHOh825