34
CHESTER SENSORS CAPSIM: STOCKHOLDERS BRIEFING PRESENTATION Monday, December 07, 2015 Presented by: Paul LaBarge Rickie Lieu Steven Quenzel BUSN464 Professor: Gene Davis
| Date post: | 14-Feb-2017 |
| Category: |
Documents |
| Upload: | steven-quenzel |
| View: | 192 times |
| Download: | 4 times |
CHESTER SENSORSCAPSIM: STOCKHOLDERS BRIEFING
PRESENTATION
Monday, December 07, 2015
Presented by:Paul LaBarge
Rickie LieuSteven Quenzel
BUSN464Professor: Gene Davis
Strategy
DIFFERENTIATOR WITH PRODUCT LIFECYCLE FOCUS
Provide a range of products to meet the needs of all markets sectors.
Gaining market advantage by supplying reliable cutting edge sensor at affordable prices.
Staying ahead of the competition with a rigorous R & D program.
Using automation in order to keep manufacturing costs in check.
Mission Statement
Providing high quality, reliable sensor products for the electronics industry that will be ahead of our
competition.
The stakeholders are our stockholders, employees and customers, whom we strive to exceed their
expectations at all times.
Today’s Agenda
Financial Analysis
Marketing Analysis
Production Analysis
The Future
Competition Wrap up
Chester SensorsFINANCIAL ANALYSIS
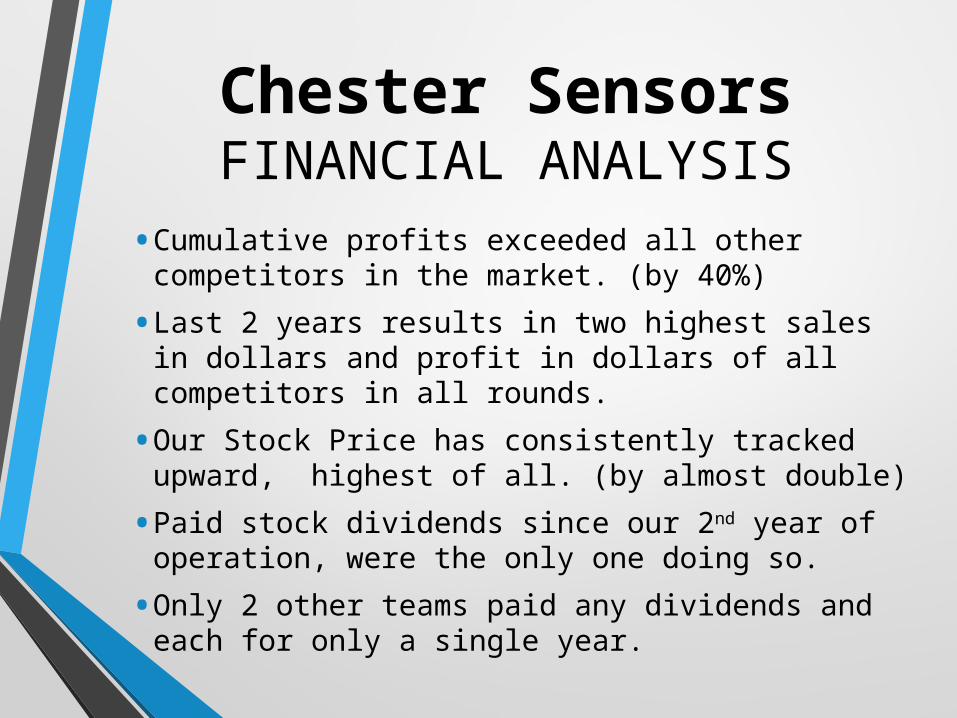
• Cumulative profits exceeded all other competitors in the market. (by 40%)
• Last 2 years results in two highest sales in dollars and profit in dollars of all competitors in all rounds.
• Our Stock Price has consistently tracked upward, highest of all. (by almost double)
• Paid stock dividends since our 2nd year of operation, were the only one doing so.
• Only 2 other teams paid any dividends and each for only a single year.

If you invested $10,000 in our stock in 2015.When we split!
REINVESTED ALL DIVIDENDS IN STOCK EACH YEAR!
YOUR STOCK WOULD BE WORTH:
$111,163TODAY
FastTrack 0 - 8

Closing Stock Prices
Chester’s stock price had an increase from $15.79 in 2016, to $119.57 in 2023
Total Market Cap. = $315,672,931
FastTrack 8

2016-2023 Bond Ratings for ChesterYear Bond Rating2016 A2017 AA2018 AA2019 AAA2020 AA2021 AA2022 AAA2023 AAA
Bond Ratings
• Chester’s bond rating slipped a bit in round 5 and 6 due to our underestimating ending inventory those years.
• It is now the highest rating available.
FastTrack 0 - 8
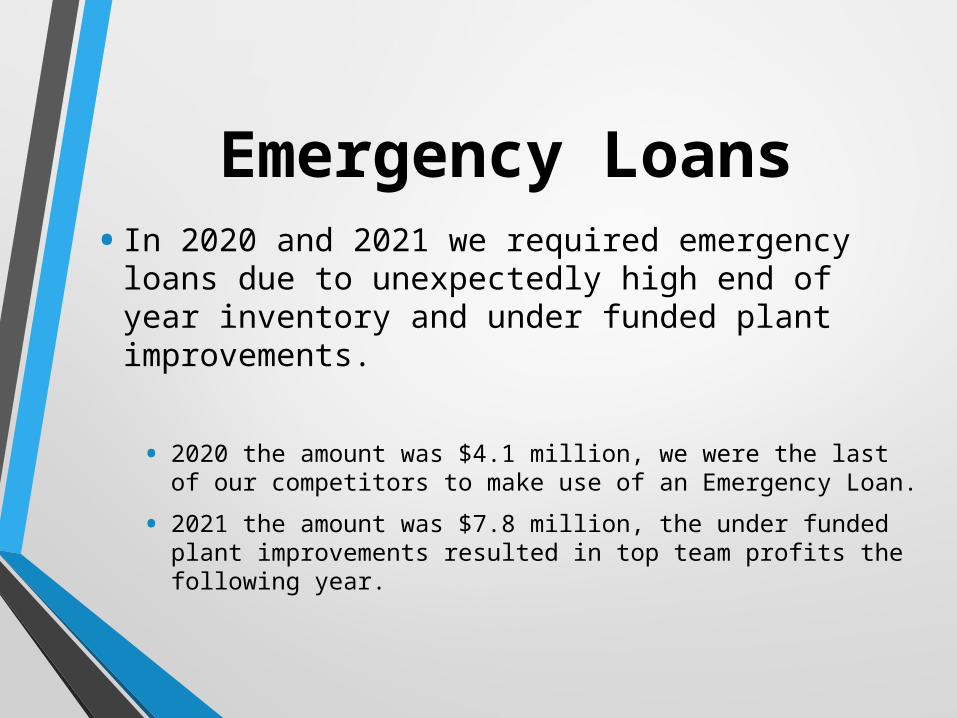
Emergency Loans• In 2020 and 2021 we required emergency loans due to
unexpectedly high end of year inventory and under funded plant improvements.
• 2020 the amount was $4.1 million, we were the last of our competitors to make use of an Emergency Loan.
• 2021 the amount was $7.8 million, the under funded plant improvements resulted in top team profits the following year.
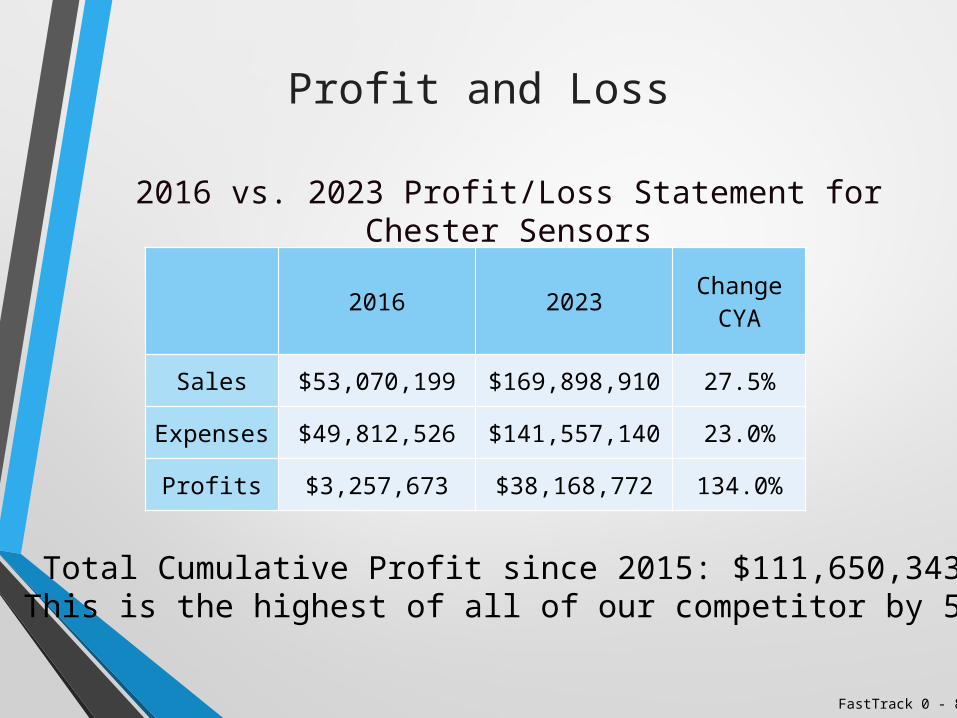
Profit and Loss
2016 vs. 2023 Profit/Loss Statement for Chester Sensors
FastTrack 0 - 8
Total Cumulative Profit since 2015: $111,650,343 This is the highest of all of our competitor by 53%
2016 2023 Change CYA
Sales $53,070,199 $169,898,910 27.5%
Expenses $49,812,526 $141,557,140 23.0%
Profits $3,257,673 $38,168,772 134.0%

Return On Assets
• Return on Assets Ratio= Net Income/ Average Total Assets • Competitive ROA for period since split• Chester has highest Average ROA among competitors
since split.• 16.6% which is 43% higher than nearest competitor
Andrews Baldwin Chester Digby Erie Ferris2016 6.0% 13.8% 11.4% -0.7% 16.9% 4.4%2017 1.4% 12.7% 12.3% 22.8% 5.8% 7.9%2018 4.2% 11.2% 19.0% 24.2% 19.9% -14.2%2019 4.0% -2.3% 11.4% -3.5% -0.1% -12.8%2020 14.6% -2.4% 8.8% 11.2% 5.5% 16.7%2021 15.0% -5.7% 18.9% 6.8% 4.1% 6.6%2022 12.6% -12.9% 25.5% 12.3% 21.0% 6.1%2023 14.4% 23.5% 25.6% 15.8% 19.3% 21.5%
FastTrack 0 - 8

Return On Sales
• Competitive ROS 2016 through 2023• Chester Group has the highest average ROS of all
Groups at 11.5%
Andrews Baldwin Chester Digby Erie Ferris Avg2016 3.5% 7.1% 6.1% -0.5% 9.0% 3.4% 4.8%2017 0.9% 7.9% 7.1% 11.5% 5.0% 6.3% 6.5%2018 2.8% 6.3% 11.5% 12.9% 13.4% -67.6% -3.5%2019 1.8% -1.8% 8.5% -3.5% -0.1% -15.3% -1.7%2020 7.1% -2.2% 8.5% 8.7% 4.8% 12.7% 6.6%2021 9.8% -8.7% 13.6% 5.9% 5.1% 6.8% 5.4%2022 11.3% -19.0% 16.7% 9.0% 15.5% 7.6% 6.9%2023 12.1% 9.5% 20.0% 9.9% 18.6% 26.3% 16.1%
FastTrack 0 - 8

Return On Equity
• Return on Equity Ratio= Net Income/Shareholder’s Equity • Competitive ROE 2016 through 2023 • Chester Group had the highest average ROE of all
groups at 20.8%
Andrews Baldwin Chester Digby Erie Ferris
2016 10.0% 20.6% 18.0% -1.0% 24.7% 6.9%
2017 3.1% 17.5% 18.3% 35.1% 7.7% 12.4%
2018 4.2% 11.2% 19.0% 24.2% 19.9% -14.2%
2019 9.3% -3.4% 15.5% -6.5% -0.2% -48.3%
2020 27.3% -4.1% 13.0% 12.0% 8.4% 35.3%
2021 24.1% -21.6% 25.7% 7.5% 9.2% 16.4%
2022 16.6% -51.6% 29.4% 13.3% 21.6% 15.3%
2023 19.5% 30.1% 27.4% 17.2% 20.0% 31.2%
FastTrack 0 - 8
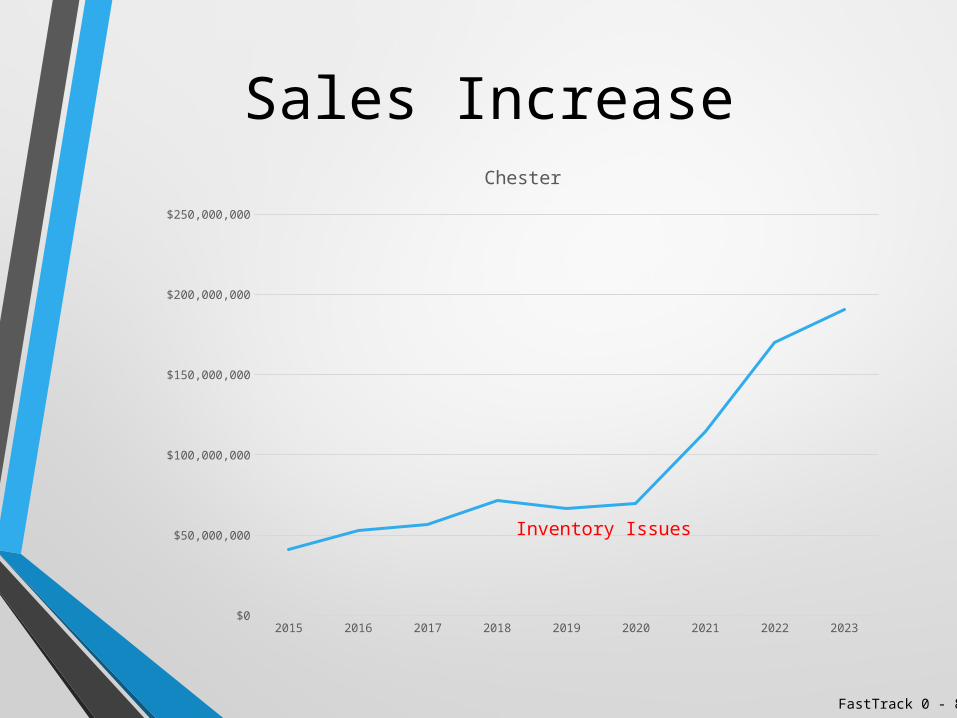
Sales Increase
2015 2016 2017 2018 2019 2020 2021 2022 2023$0
$50,000,000
$100,000,000
$150,000,000
$200,000,000
$250,000,000
Chester
Inventory Issues
FastTrack 0 - 8
Marketing
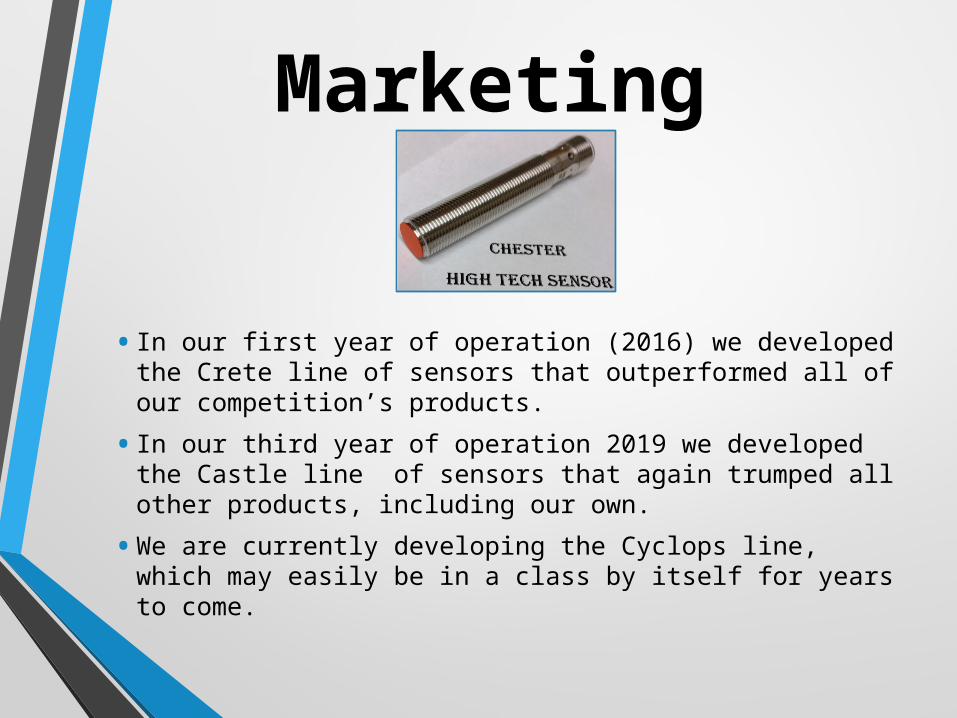
• In our first year of operation (2016) we developed the Crete line of sensors that outperformed all of our competition’s products.
• In our third year of operation 2019 we developed the Castle line of sensors that again trumped all other products, including our own.
• We are currently developing the Cyclops line, which may easily be in a class by itself for years to come.

Market Share by Industry2016 vs. 2023
20232016
FastTrack 1 and 8
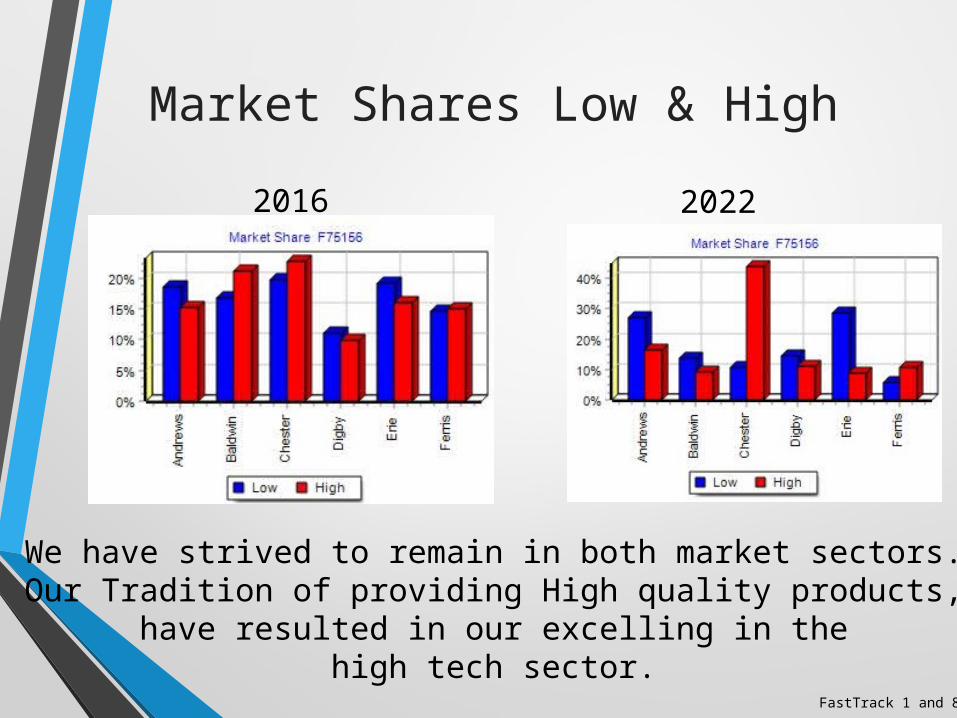
Market Shares Low & High
2016 2022
We have strived to remain in both market sectors.Our Tradition of providing High quality products,
have resulted in our excelling in thehigh tech sector.
FastTrack 1 and 8
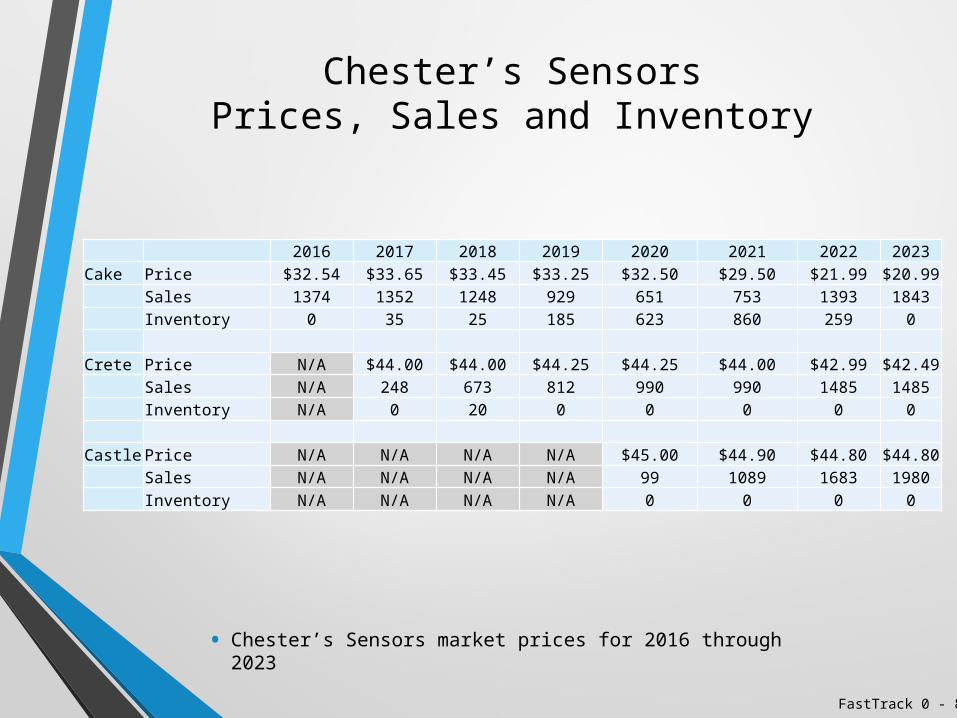
Chester’s SensorsPrices, Sales and Inventory
• Chester’s Sensors market prices for 2016 through 2023
2016 2017 2018 2019 2020 2021 2022 2023Cake Price $32.54 $33.65 $33.45 $33.25 $32.50 $29.50 $21.99 $20.99
Sales 1374 1352 1248 929 651 753 1393 1843Inventory 0 35 25 185 623 860 259 0
Crete Price N/A $44.00 $44.00 $44.25 $44.25 $44.00 $42.99 $42.49Sales N/A 248 673 812 990 990 1485 1485Inventory N/A 0 20 0 0 0 0 0
Castle Price N/A N/A N/A N/A $45.00 $44.90 $44.80 $44.80Sales N/A N/A N/A N/A 99 1089 1683 1980Inventory N/A N/A N/A N/A 0 0 0 0
FastTrack 0 - 8
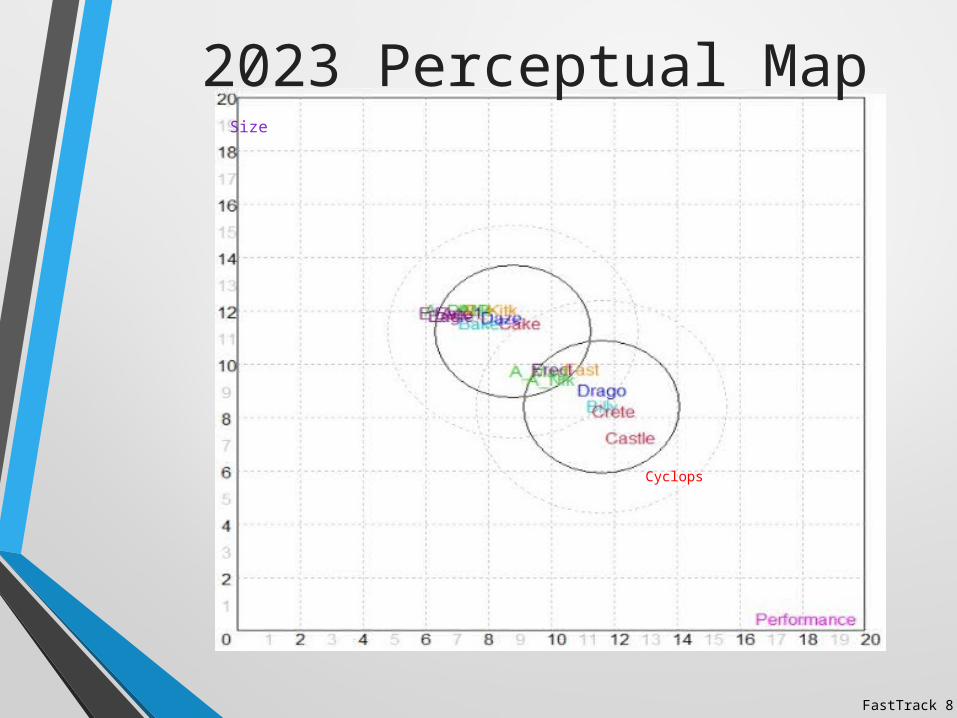
2023 Perceptual MapSize
Cyclops
FastTrack 8
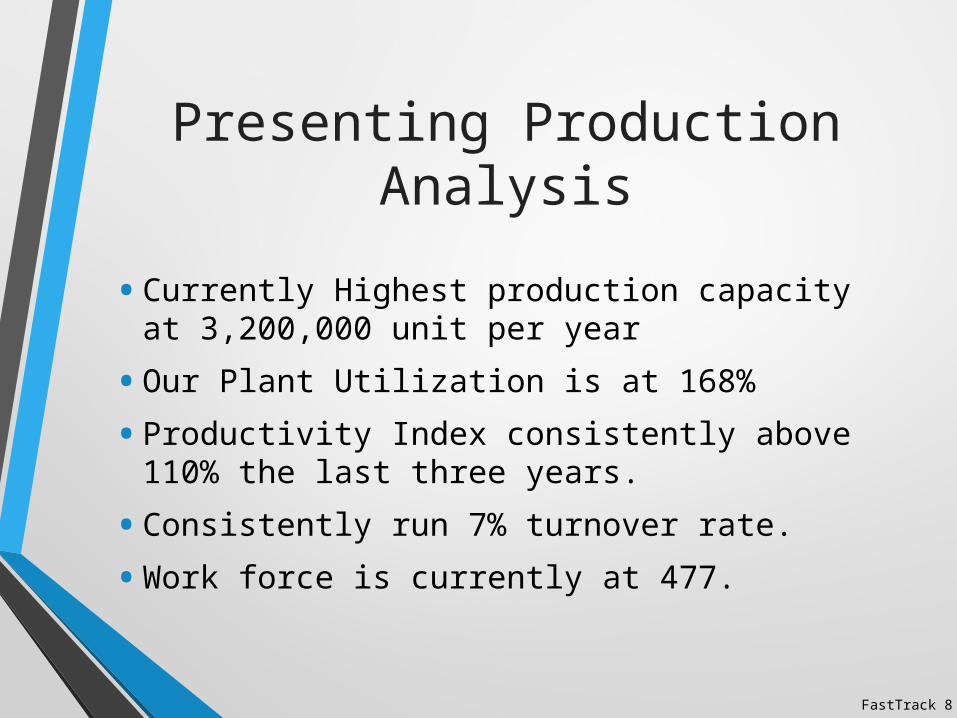
Presenting Production Analysis
• Currently Highest production capacity at 3,200,000 unit per year
• Our Plant Utilization is at 168%
• Productivity Index consistently above 110% the last three years.
• Consistently run 7% turnover rate.
• Work force is currently at 477.
FastTrack 8
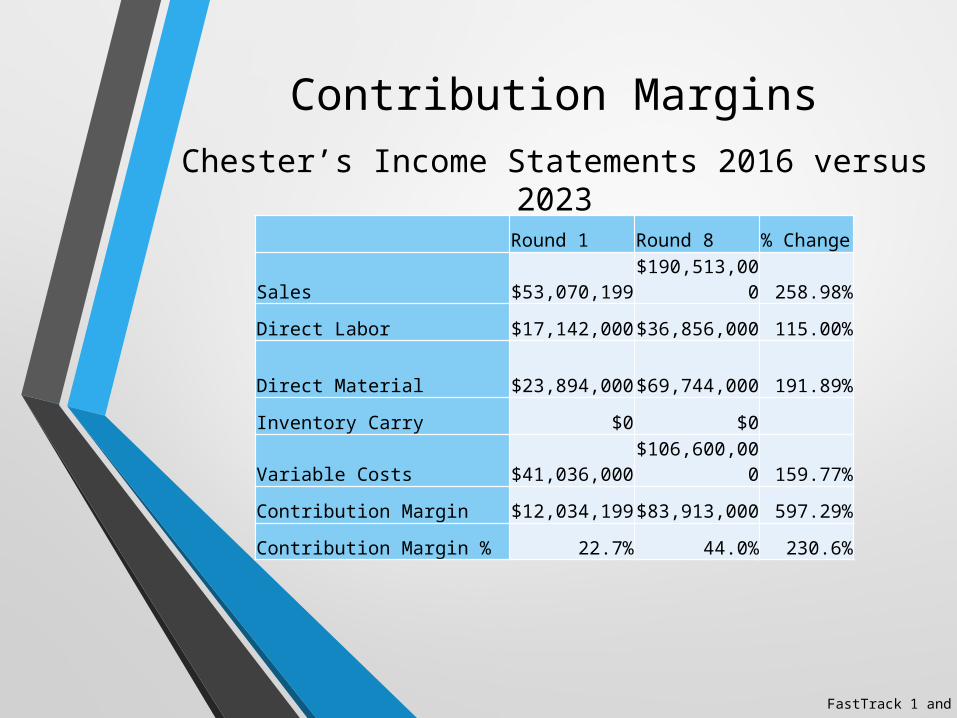
Contribution MarginsChester’s Income Statements 2016 versus 2023
Round 1 Round 8 % Change
Sales $53,070,199 $190,513,000 258.98%
Direct Labor $17,142,000 $36,856,000 115.00%
Direct Material $23,894,000 $69,744,000 191.89%
Inventory Carry $0 $0
Variable Costs $41,036,000 $106,600,000 159.77%
Contribution Margin $12,034,199 $83,913,000 597.29%
Contribution Margin % 22.7% 44.0% 230.6%
FastTrack 1 and 8
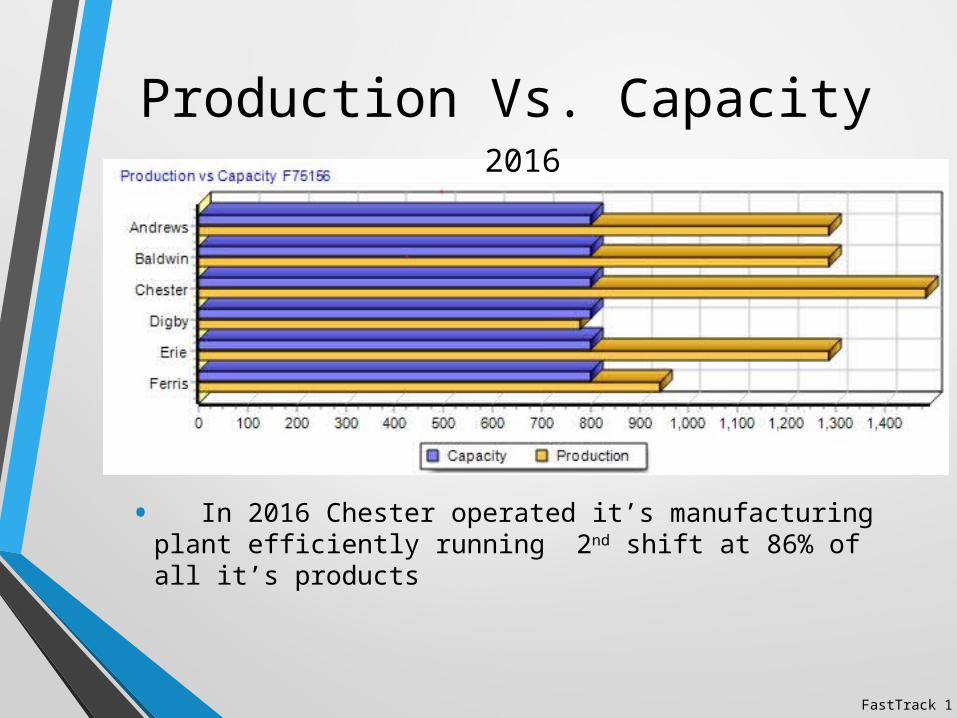
Production Vs. Capacity
• In 2016 Chester operated it’s manufacturing plant efficiently running 2nd shift at 86% of all it’s products
FastTrack 1
2016
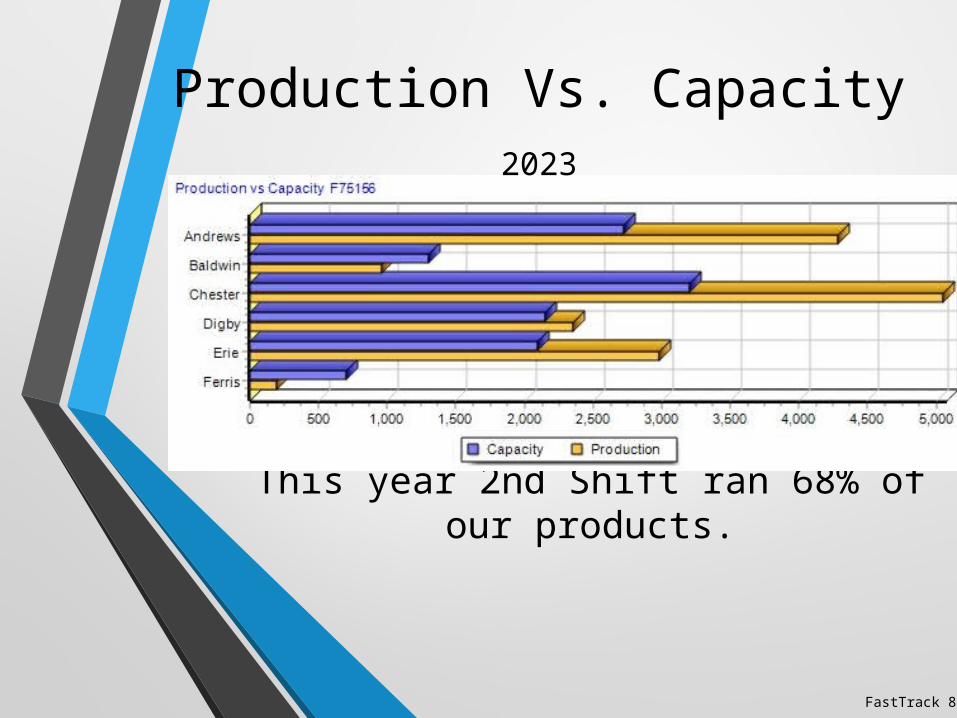
This year 2nd Shift ran 68% of our products.
Production Vs. Capacity
FastTrack 8
2023
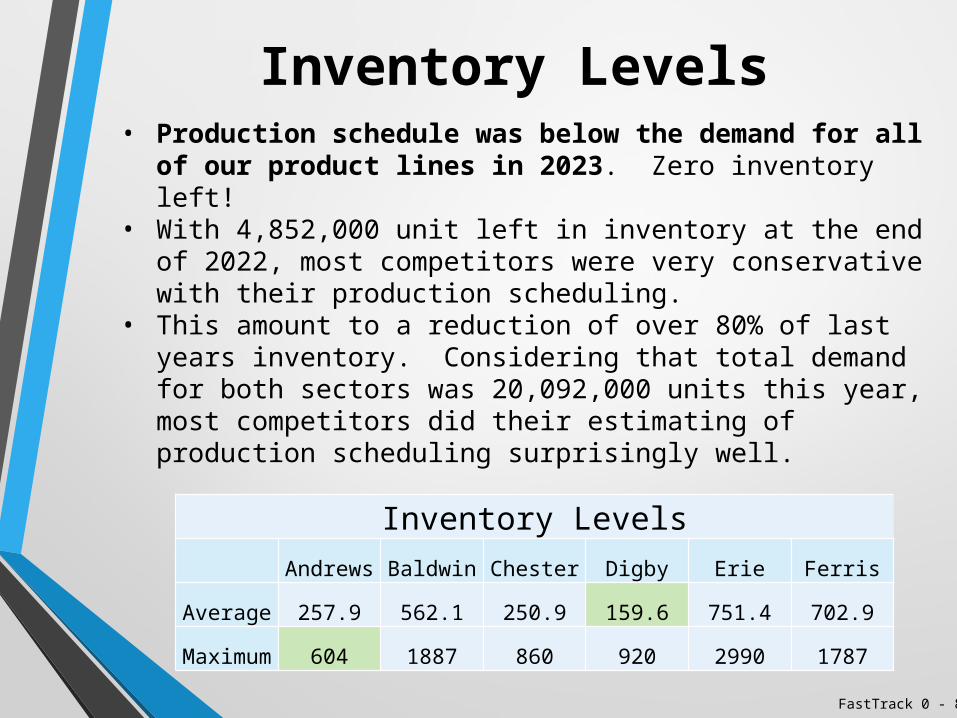
Inventory Levels• Production schedule was below the demand for all of our
product lines in 2023. Zero inventory left!• With 4,852,000 unit left in inventory at the end of 2022, most
competitors were very conservative with their production scheduling.
• This amount to a reduction of over 80% of last years inventory. Considering that total demand for both sectors was 20,092,000 units this year, most competitors did their estimating of production scheduling surprisingly well.
Inventory Levels Andrews Baldwin Chester Digby Erie Ferris
Average 257.9 562.1 250.9 159.6 751.4 702.9
Maximum 604 1887 860 920 2990 1787
FastTrack 0 - 8

2023
Market Share, Promo & Awareness
Sector Product Unit Sales Market Share Promotion Budget
Cust. Awareness Sales Budget Cust.
Accessibility Cost/unit
Rank in Sector
LowCake
1464000 14%$2,200,000 100% $2,275,000 70% $2.428
1
High379000 4% 9
Crete 1466000 16% $2,350,000 100% $2,350,000 100% $3.206 2Castle 1980000 21% $2,100,000 100% $2,100,000 100% $2.121 1
Sector Product Unit Sales Market Share Promotion Budget
Cust. Awareness Sales Budget Cust.
AccessibilityCost/unit
Rank in Sector
LowCake
1021000 20%$1,100,000 61% $1,500,000 42% $1.654
1
High 551000 23% 1
2016
FastTrack 1 and 8
TQM investment
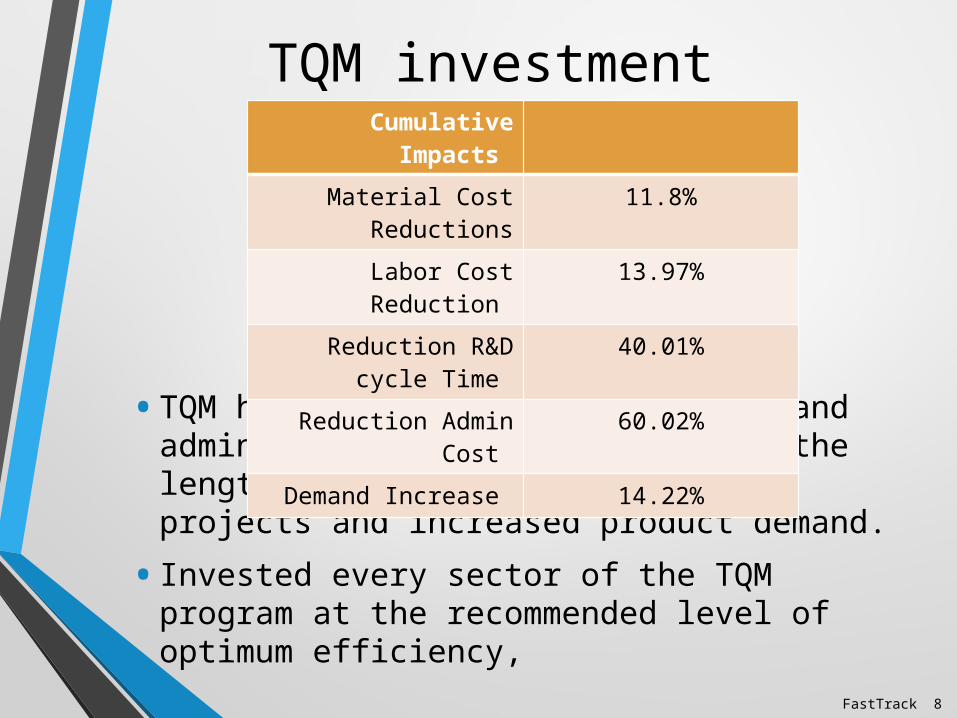
• TQM has reduced material , labor and administrative costs. Shortened the length of time required for R & D projects and increased product demand.
• Invested every sector of the TQM program at the recommended level of optimum efficiency,
Cumulative Impacts
Material Cost Reductions
11.8%
Labor Cost Reduction 13.97%Reduction R&D cycle
Time 40.01%
Reduction Admin Cost
60.02%
Demand Increase 14.22%
FastTrack 8

CYCLOPSWHAT IS IN STORE FOR NEXT YEAR
• We are designing a new line to better compete in the Ultra-High tech sector:
• Line will be fully (10) automated in order to keep labor costs as low as possible.
• Performance rating of 14.2, Size of 5.9, and MTBF of 23,000. This will allow for our sensors to be used in advanced ultra miniature electronic devices.
• The expected cost of production is $22.67, and we intend to sell for $47.99. This should net a profit margin of 45%.
• Once the new Cyclops line is up and running, we intend to phase out the Cake line and shift the Crete line towards the lower sector.
• This will allow for some of the work force to move to the new line.
• This is why we are still running the Cake line at a break even margin, we wish to retain those quality employees until the new line is operational.
• Automation of the Crete and Castle lines will increase to 9 thus reducing labor costs in the future.
THE FUTURE

Balanced Scorecard
Chester 50 47 58 61 57 71 80 73 177Poss. Points 82 89 89 100 100 100 100 100 240
Scored 674 out of a total of 1000 points
Final Score Relative

Poorest Round (2)
Best Round (8)
Balanced Scorecard
Final Score Relative
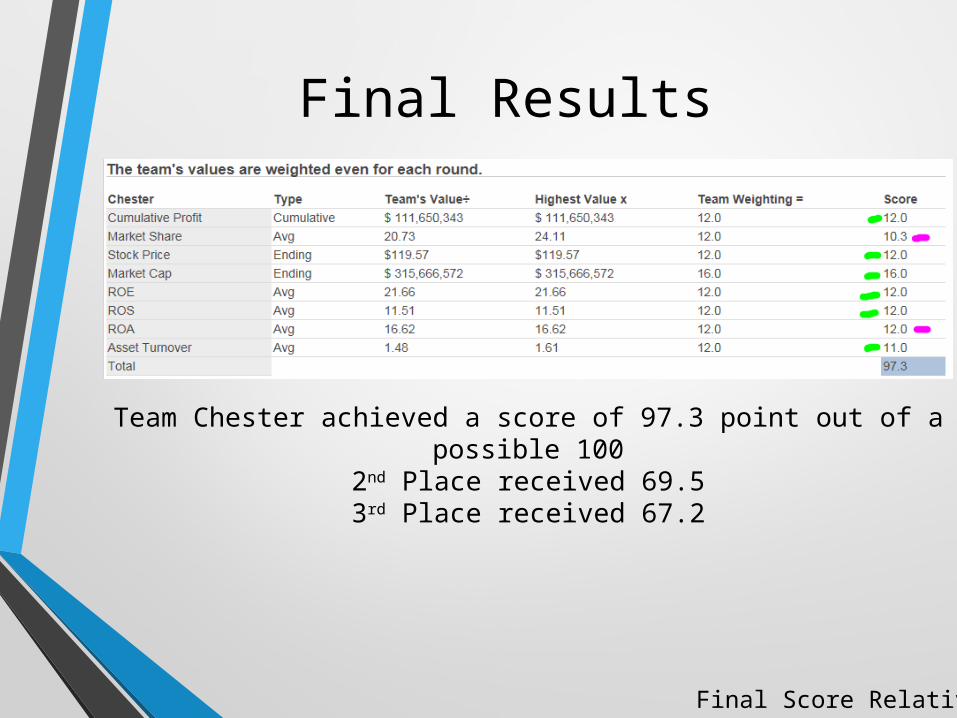
Final Results
Team Chester achieved a score of 97.3 point out of a possible 1002nd Place received 69.53rd Place received 67.2
Final Score Relative
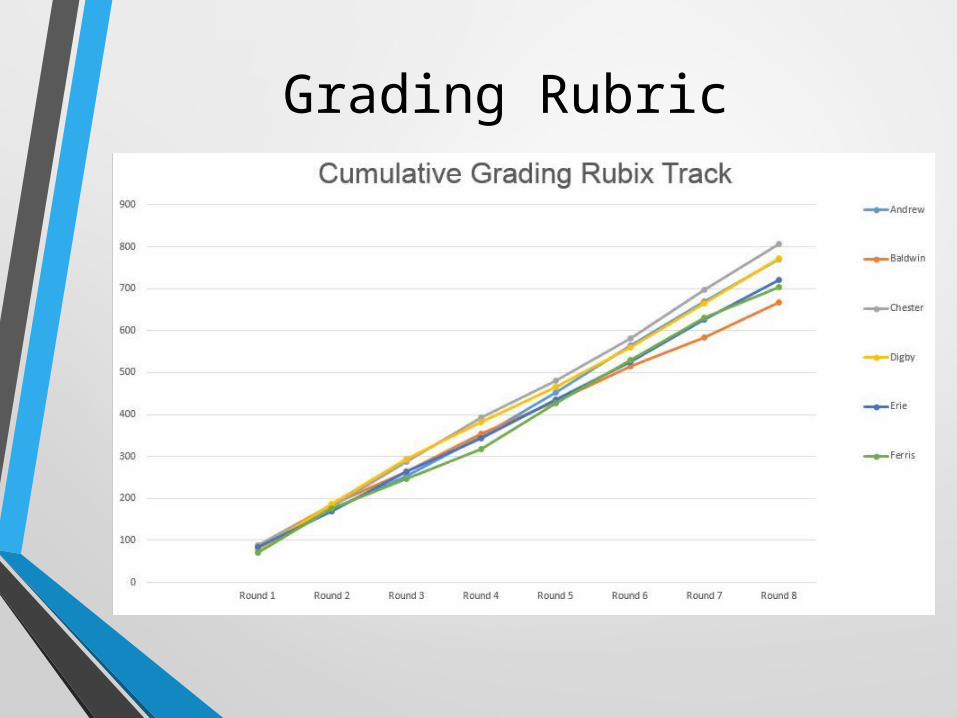
Grading Rubric

Summary • Success was achieved by only one team member
making official decisions, as instructed at beginning of competition.
• Screen shots were circulated among team members for suggestions.
• Spreadsheet were created to look at how all other teams were doing things, best idea were adapted into our game plans.
• We looked at this as it were an actual business model and looked out for all stakeholders.
References
CAPSIM Final Score Relative: Industry Results – Debrief – Final Score Relative.http://new.capsim.com/student/portal/index.cfm?template=reports.debrief.finalscore_relative_2004 CAPSIM FastTrack Reports: Generated Rounds0 through 8http://new.capsim.com/student/portal/index.cfm?template=reports.reports.annualNewspaper_2004•

Questions?


