This document arises from the NANOGENOTOX Joint Action which has received funding from the European Union, in the framework of the Health Programme under Grant Agreement n°2009 21. This publication reflects only the author’s views and the Community is not liable for any use that may be made of the information contained therein. Grant Agreement n° 2009 21 01 Towards a method for detecting the potential genotoxicity of nanomaterials Final protocol for producing suitable manufactured nanomaterial exposure media – Report The generic NANOGENOTOX dispersion protocol – Standard Operation Procedure (SOP) and background documentation July, 2011
Transcript
This document arises from the NANOGENOTOX Joint Action which has received
funding from the European Union, in the framework of the Health Programme
under Grant Agreement n°2009 21.
This publication reflects only the author’s views and the Community is not liable
for any use that may be made of the information contained therein.
Grant Agreement n° 2009 21 01
Towards a method for detecting
the potential genotoxicity of nanomaterials
Final protocol for producing suitable manufactured nanomaterial exposure media
–
Report
The generic NANOGENOTOX dispersion protocol –
Standard Operation Procedure (SOP) and background documentation
July, 2011
Grant Agreement n° 2009 21 01
1 The NANOGENOTOX Joint Action is co-funded by the Executive Agency
for Health and Consumers (Grant Agreement n°2009 21 01) under the European Union 2nd Health Programme.
www.nanogenotox.eu
WP 4 : Physicochemical Characterisation of Manufactured Nanomaterials (MNs) and Exposure Media (EMs)
Deliverable 3: Final protocol for producing suitable MN exposure media
Deliverable leader: NRCWE
Keld Alstrup Jensen
The National Research Centre for the Working Environment (NRCWE),
Lersø Parkallé 105, DK-2100 Copenhagen, DENMARK
Grant Agreement n° 2009 21 01
The NANOGENOTOX Joint Action is co-funded by the Executive Agency for Health and Consumers (Grant Agreement n°2009 21 01) under the European Union 2nd Health Programme.
www.nanogenotox.eu
2
Workflow
Author(s)
Keld Alstrup Jensen, Yahia Kembouche, Elzbieta Christiansen, Nicklas R Jacobsen, and Håkan Wallin (NRCWE)
4.2 Hydrodynamic size-distributions of batch dispersions 20
4.2.1 TiO2 test materials 20 4.2.2 Synthetic Amorphous Silica test materials 22 4.2.3 MWCNT test materials 23
5. Stabilities and redispersion of NM batch dispersions 26
6. Range finding for optimizing the BSA concentration 27
References 31
Grant Agreement n° 2009 21 01
The NANOGENOTOX Joint Action is co-funded by the Executive Agency
for Health and Consumers (Grant Agreement n°2009 21 01) under
the European Union 2nd Health Programme.
www.nanogenotox.eu
4
1. Introduction This report fulfills Deliverable report 3 of the EAHC (Executive Agency for Health and Consumers) Joint Action, NANOGENOTOX. The report contains the final Standard Operation Procedures (SOPs) for preparing batch dispersions of manufactured nanomaterials (MNs) to be used for toxicity testing and demonstration of size-distributions and stabilities of particle dispersions as well as background information on the protocol development.
The NANOGENOTOX protocol was developed considering the outcomes of the project Kick-of Meeting in Paris, March, 2010, where it was decided 1) to develop a procedure using the biologically relevant serum albumin for particle stabilization, and 2) to use as low albumin concentrations as possible to limit potential unwanted toxicological side-effects due to the dispersion agent. At the same meeting it was agreed to attempt adoption of the sonication procedure developed in the EU FP7 project, ENPRA, in which 2.56 mg/ml nanoparticles are dispersed in a 2% w/v full serum water solution by sonication in an ice-water bath for 16 min using a 400W probe sonicator set at 10% amplitude (Jacobsen et al., 2009). A final draft version of the NANOGENOTOX dispersion protocol was disseminated to the Consortium for comments on December 8, 2010. Subsequent working experience lead to minor editorial revisions discussed in Deliverable 2: Standard operating procedures for characterization of the selected manufactured nanomaterial types (Jensen et al., 2011). For comparability, it has been chosen to sonicate the batch dispersions in the recommended scintillation vials. Vial dimensions may affect the efficiency of probe sonication. A small change has occurred with precision of a five-step, instead of four-step, pre-wetting procedure, which reduces the amount of material deposits on sidewalls before sonication. Another important issue is the calibration of applied sonication energy when using different sonicators, which was found by comparison of probe sonicators using a watt-meter.
Figure 1.1. Paradigm of the generic NANOGENOTOX dispersion protocol is preparation of a well-dispersed common particle suspension “stock dispersion” (left) and dilution or direct administration or dilution into any in vitro or in vivo test system. The stability agglomeration Principle types of stabilizing particles in liquid dispersions and the mixed electrosteric stabilization. For charge-stabilization, the different ionic layers are described with indication of characteristics resulting in a zeta-potential.
The NANOGENOTOX batch dispersion medium consists of 0.5 % v/v ethanol used for pre-wetting and 0.05% w/v sterile-filtered BSA water. Sterile filtration results in a true BSA-concentration of ca. 0.036% w/v due to adsorption. As for the ENPRA protocol, the batch dispersion is intended for direct administration or dilution in the different test media. The paradigm considered is that the particle
Grant Agreement n° 2009 21 01
The NANOGENOTOX Joint Action is co-funded by the Executive Agency
for Health and Consumers (Grant Agreement n°2009 21 01) under
the European Union 2nd Health Programme.
www.nanogenotox.eu
5
dispersions are prepared in the same manner and delivered with the same size distribution and in the same medium to any test system (Figure 1.1). This is the reason for the 2.56 mg/ml MN concentration, which enables easy dilution to reach target concentrations in the series 0.01, 0.02, 0.04, 0.08, …, 0.64, 1.28, 2.56 mg/ml. The subsequent potential changes such as agglomeration, sedimentation, dissolution etc. are then considered reactions occurring in the test systems and is considered “part of the test”.
The use of a minimum amount of albumin is anticipated to facilitate dosing (smear, instillation, injection, ingestion or in vitro dispersion) of the test item in a state as close as possible to the pristine material. However, in any case, exposure to powder or dust particles dispersed in a liquid will always cause changes in surface characteristics of the test item. Either the material reacts directly with the water by e.g., hydration, protonation, hydroxylation, or by sorption of (bio)molecules or complexation with ions present in the solution.
The use serum albumin is thought to be “bio-mimicking” and relevant due to its presence or compatibility in most relevant primary exposure organs (skin, lung, and circulation). A recent incubation study in synthetic lung fluid solution shows that Bovine Serum Albumin (BSA) is preferently taken up by citrate-functionalized silver nanoparticles (MacCuspie et al., 2011). BSA adsorption or improved stabilities have also been documented in various BSA-bearing mediums with either gold, ZnO, TiO2, CNT (Tsai et al., 2011; Tantra et al., 2010; Ji et al., 2010; Vippola et al., 2009; Bihari et al., 2008).
Charge stabilization(Electrostatic)
Steric stabilization
-- -
--
--
-
Depletion stabilization(polymeric stabilization)
+
-- -
---
--
++
+ ++
+
+
++
++
+
+
+++
+-
-
-
-
-
-+
+
+Gauy-Chapman layer
Stern layer -
-
-
+
+
Zeta-potential [mV]Electrosteric Stabilization
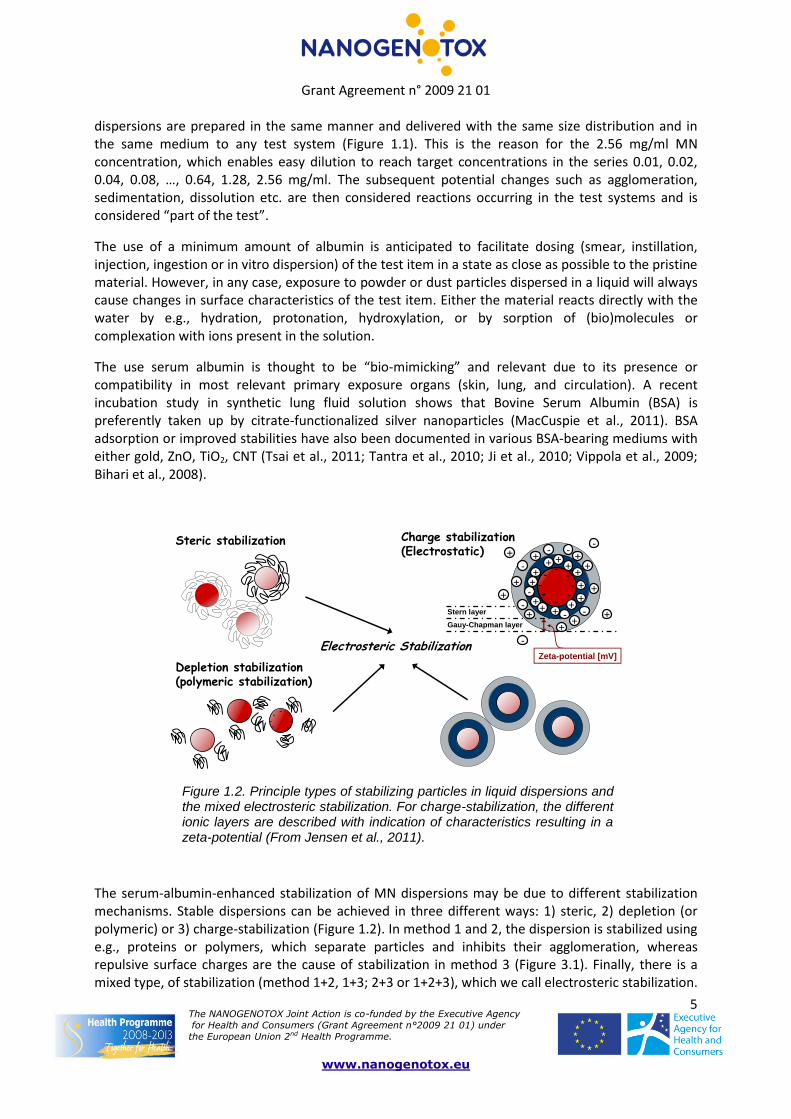
Figure 1.2. Principle types of stabilizing particles in liquid dispersions and the mixed electrosteric stabilization. For charge-stabilization, the different ionic layers are described with indication of characteristics resulting in a zeta-potential (From Jensen et al., 2011).
The serum-albumin-enhanced stabilization of MN dispersions may be due to different stabilization mechanisms. Stable dispersions can be achieved in three different ways: 1) steric, 2) depletion (or polymeric) or 3) charge-stabilization (Figure 1.2). In method 1 and 2, the dispersion is stabilized using e.g., proteins or polymers, which separate particles and inhibits their agglomeration, whereas repulsive surface charges are the cause of stabilization in method 3 (Figure 3.1). Finally, there is a mixed type, of stabilization (method 1+2, 1+3; 2+3 or 1+2+3), which we call electrosteric stabilization.
Grant Agreement n° 2009 21 01
The NANOGENOTOX Joint Action is co-funded by the Executive Agency
for Health and Consumers (Grant Agreement n°2009 21 01) under
the European Union 2nd Health Programme.
www.nanogenotox.eu
6
The electrosteric stabilization may be the actual stabilization mechanism in most of our batch dispersions, because exact dosing or titration of albumin (as well as any other stabilizing agent) is very difficult in practice. Nanoparticle charge stabilization by pH adjustment and subsequent steric stabilization and pH-adjustment to physiological levels is a more difficult process, in which both the nanomaterial and the proteins may be affected by the pH levels needed for electrostatic stabilization. E.g, BSA changes morphology and is completely denaturated at pH levels < 4 and almost completely folded-up at pH 4.5 to 8 (Carter and Ho, 1994). On the other hand probe sonication may also affect the BSA structure. Changes in BSA structure have been shown to occur at 15 min
ultrasound sonication if the temperature reaches between 55 and 70 C (Güzey et al., 2006). Corrosion or deterioration of the nanomaterial surface or its coating (if present) may also initiate at even short-term episodes at pH-levels outside near-neutral conditions. This artifact is expected in most cases to be less pronounced when dispersion is made directly in BSA-water.
In this protocol, we aimed for a batch dispersion protocol, where the same amounts and procedures are used for all test materials. Hence, we accept that the dispersions may be over- or undersaturated with albumin. It was attempted to minimize this error by an initial range finding analysis to determine the common best BSA concentrations using a TiO2 material (NM-101) and a Multi-Walled Carbon Nanotube (MWCNT; NM-400) that represent materials, which are relatively easy and difficult to disperse in water, respectively. Even-though NM-101, finally is not used in Nanogenotox, it was included at the beginning of dispersion testing for contingency reasons. Subsequently, the protocol was made generically applicable by adding the ethanol pre-wetting procedure to enable dispersibility of both hydrophobic and hydrophilic nanomaterials. The ethanol may affect some organic coatings, but not the ones expected in the NANOGENOTOX materials. We also decided to use a pH-unbuffered dispersion medium. Therefore the dispersions may partially equilibrate their pH with the specific test materials. Hence, we also accept that some variation may occur in the pH levels of the batch dispersion.
Grant Agreement n° 2009 21 01
The NANOGENOTOX Joint Action is co-funded by the Executive Agency
for Health and Consumers (Grant Agreement n°2009 21 01) under
the European Union 2nd Health Programme.
www.nanogenotox.eu
7
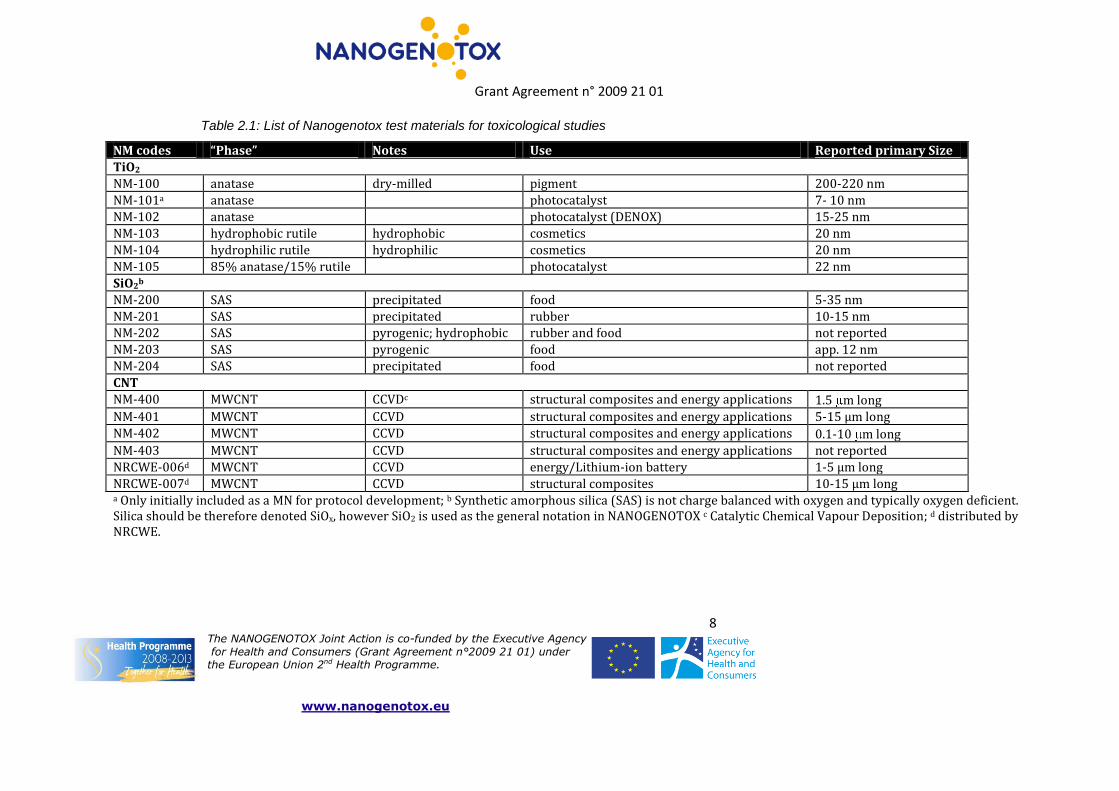
2. Nanomaterials, storage and handling The tested NANOGENOTOX materials include 5 titania-based products, 4 silica products and 6 multi-walled carbon nanotubes (MWCNTs). Table 2.1 shows a list of these materials with basic information on primary particle size and presence of coatings. The toxicological studies will be conducted using a select series of these nanomaterials. In addition to the listed formal nanomaterials, the toxicity testing will include ZnO (NM-110) and Printex 90 as benchmark materials.
Good and safe laboratory practice is required in this project to enable traceability and due to the fact that nanomaterials may possess unknown hazards (e.g., Oberdörster et al., 2005) as well as increased risk of exposure due to higher levels of dustiness as compared to conventional materials (e.g., Schneider and Jensen, 2008). Exposure may occur during several work stages in the laboratory. The most critical steps are powder handling, high-power sonication and discard of waste. If work is not conducted with care, human exposure to dust may occur despite working in fume hoods (Johnson et al., 2010).
For general good practice we recommend that:
1) each material is registered in each laboratory and marked with specific indication on that this is a nanomaterial.
2) each material is stored in transparent easy accessible boxes under conditions suggested by the vender/distributer (upright in vials at room temperature and darkness) (See Figure 2.1).
3) each laboratory develops a handling-guidance document for each nanomaterial for storage, handling, disposal and actions to be taken in case of accidental exposure and spills (See Figure 2.1).
4) laboratory transport of vials and dispersions is done in a tray or a bin to reduce risk of spill and contamination.
5) powder handling (weighing, dispensing, sonication, characterization and testing is done under suitable ventilated conditions (ventilated weighing boxes, fume hoods, glove boxes etc.) (See Figure 2.1)
6) disposal of waste is done according to national or institutional decisions on nanomaterial waste handling (See Figure 2.1). We recommend collection of waste in designated containers for correct chemical or biological waste.
Figure 2.1 Examples of suggested good practice for storage and handling of NM. A) Storage of vials in an easy accessible transparent box. B) Handling of powder in small amount. C) Sonication of dispersions in a fume-hood. D) Discard of nanomaterial waste in a designate waste-contained for chemical waste.
Grant Agreement n° 2009 21 01
8 The NANOGENOTOX Joint Action is co-funded by the Executive Agency
for Health and Consumers (Grant Agreement n°2009 21 01) under the European Union 2nd Health Programme.
www.nanogenotox.eu
Table 2.1: List of Nanogenotox test materials for toxicological studies
NM-201 SAS precipitated rubber 10-15 nm NM-202 SAS pyrogenic; hydrophobic rubber and food not reported
NM-203 SAS pyrogenic food app. 12 nm
NM-204 SAS precipitated food not reported
CNT
NM-400 MWCNT CCVDc structural composites and energy applications 1.5 m long
NM-401 MWCNT CCVD structural composites and energy applications 5-15 µm long
NM-402 MWCNT CCVD structural composites and energy applications 0.1-10 m long NM-403 MWCNT CCVD structural composites and energy applications not reported
NRCWE-006d MWCNT CCVD energy/Lithium-ion battery 1-5 µm long
NRCWE-007d MWCNT CCVD structural composites 10-15 µm long a Only initially included as a MN for protocol development; b Synthetic amorphous silica (SAS) is not charge balanced with oxygen and typically oxygen deficient. Silica should be therefore denoted SiOx, however SiO2 is used as the general notation in NANOGENOTOX c Catalytic Chemical Vapour Deposition; d distributed by NRCWE.
Grant Agreement n° 2009 21 01
9 The NANOGENOTOX Joint Action is co-funded by the Executive Agency
for Health and Consumers (Grant Agreement n°2009 21 01) under the European Union 2nd Health Programme.
www.nanogenotox.eu
3. The generic NANOGENOTOX dispersion protocol
3.1 General description This SOP was developed for preparation of general batch dispersions for in vitro and in vivo toxicity testing in NANOGENOTOX. The method aims to produce a highly dispersed state of any MN by ethanol prewetting to handle hydrophobic materials followed by dispersion in sterile-filtered 0.05% w/v BSA-water at a fixed concentration of 2.56 mg/ml using probe sonication. The protocol may not produce the smallest particle size in the dispersion as possible, but is a generically applicable procedure that ensures reasonable dispersion of the test materials selected for NANOGENOTOX. Moreover, the protocol is developed with the aim to use or characterize the dispersion immediately after its production. The current protocol can ensure stable dispersion for 0.5 to 1 hour before considering redispersing due to onset of agglomeration and/or sedimentation. However, the possible sedimented particles can easily be re-dispersed by vortexing the dispersion for 10 seconds. Long-term storage of MN in liquids should also be avoided in general due to risk of partial alteration of the original MN or its coatings and other hydrochemical reactions. Background information for selection of BSA concentrations can be found in Chapter 4. Background information for stability analysis can be found in Chapter 5. Background information for capability to re-disperse settled particles to mimic initial behavior of the stock dispersion is exemplified in Chapter 6.
3.2 Preparation of stock dispersion
A 2.56 mg/ml stock dispersion is prepared by prewetting powder in 0.5 vol% ethanol ( 96% purity) followed by dispersion in 0.05 wt% BSA-water during 16 minutes of probe sonication. For harmonization of dispersion energy and stabilities it is recommended to produce a 6-8 ml dispersion in the 20 ml tall glass scintillation vials. It takes 15.36 mg to produce a 6 ml 2.56 mg/ml stock dispersion (se below for further details).
3.2.1 Materials
Pure and sterile-filtered water Bovine Serum Albumin (sterile) Ethanol (96 vol%) 1 flask for batch dissolution of BSA 1 flask for sterile-filtered 1% w/v stock BSA-water solution 1 flask for 0.05% w/v BSA-dispersion medium
Sterile filter (0.2 m) Vials: 20ml Scint-Burk glass pp-lock+Alu-foil (WHEA986581; Wheaton Industries Inc.) for weighing out MN and sonication Steel and glass spatula Pipette and pipette tips Weighing boat/weighing paper Electrostatic neutralizer Weigh Control or reference weights Probe sonicator Ice (Ice-water)
Grant Agreement n° 2009 21 01
The NANOGENOTOX Joint Action is co-funded by the Executive Agency
for Health and Consumers (Grant Agreement n°2009 21 01) under
the European Union 2nd Health Programme.
www.nanogenotox.eu
10
Water
It is recommended to use the purest available water. The protocol has been tested using both Nanopure Diamond UV and Millipore MilliQ-filtered water (Figures 3.1 and 3.2). No differences were observed in the quality of the batch dispersions. However, if chemical analyses of especially Fe and Zn are to be conducted, it may be recommended to use Nanopure or controlled water because water from some Millipore systems has been found to be contaminated with these elements at promille levels even after mounted after de-ionization units.
Quality control of the water may be done before use. Especially in case that analysis and experiments may be influenced by trace-elements at low concentrations.
For general sampling and validation, we suggest collection of water in acid cleaned chemically stable bottles suitable for elemental analysis. Control the water quality (e.g., particles by DLS, elemental concentration by Atomic Absorption Spectrometry (AAS) or Inductive Coupled Mass Spectrometry (ICP-MS), CFU and endotoxin by growth in petri dishes or specific analysis) before use. If the water sample passes the quality test, the water is evaluated as pure and can be used for the experiment.
a. Nanopure Diamond UV water:
The Thermo Nanopure Diamond® UV-water system (Thermo Scientific) water purification system is made by Thermo Scientific and designed with 4 stages of de-ionization combined with UV light-
treatment and final particle filtration Filter: 0.2 m filter ( -irradiated Barnstead D3750 Hollow fibre filter). The water quality is listed as:
Resistivity: 18.2 MΩ-cm at 25ºC Pyrogens: < 0.001 EU/ml Total Organic Carbon: < 3.0 ppb Other: nuclease-free (RNase andDNase).
Figure 3.1 Example of Thermo Nanopure Diamond® UV-water system (Thermo Scientific).
Grant Agreement n° 2009 21 01
The NANOGENOTOX Joint Action is co-funded by the Executive Agency
for Health and Consumers (Grant Agreement n°2009 21 01) under
the European Union 2nd Health Programme.
www.nanogenotox.eu
11
b. MilliQ-water:
Most Millipore water purification systems in toxicology laboratories are designed to filter water that has already been de-ionized. It contains an internal filtration unit and a final 0.22 μm MilliPark Gammagold (Millipore) filter for particle filtration. The quality of the Millipore water is listed as:
Figure 3.2 Example of a Millipore water filtration system (Millipore).
Serum Albumin
Several types of albumin may be selected to fit specific toxicological in vitro and in vivo tests systems (e,g, calf, mouse and rat). It is important that the selected albumin has passed tests for purity and sterility. This protocol was developed using Bovine Serum Albumin (BSA). The specifications are:
Bovine Serum Albumin (Fraction V), Sigma (catalogue number: A-9418) Cell culture tested Analysis: 16 wt% Nitrogen and 1.9 wt% H2O. Number of amino acid residues: 607 Molecular weight: 66,399 Da Isoelectric point in water at 25 °C: pH = 4.7 Physical dimensions: 140 x 40 x 40 Å (prolate ellipsoid where a = b < c) (Wright and Thompson, 1975)
Grant Agreement n° 2009 21 01
The NANOGENOTOX Joint Action is co-funded by the Executive Agency
for Health and Consumers (Grant Agreement n°2009 21 01) under
the European Union 2nd Health Programme.
www.nanogenotox.eu
12
3.2.2 Production of sterile-filtered BSA water
The production of the 0.05% w/v BSA-water (the dispersion medium) is done in two steps: 1) Preparing a sterile-filtered 1% w/v BSA stock solution and 2) Dilution to reach a 0.05% w/v BSA dispersion medium.
a. Procedure for making a 1% w/v BSA water stock solution:
1) Add from pipette 50 ml water Nanopure (or MilliQ) to a 100 ml mixing flask (e.g, re-useable acid-washed blue-cap flasks or similar).
2) Weigh out 1 g BSA (powder) in a weighing boat and pour it into the flask with 50 ml water, rinse the weighing boat into the mixing bottle with Nanopure (or MilliQ) water to retrieve as much BSA as possible into the mixing flask.
3) Fill Nanopure water (or MilliQ) into the mixing flask up until 100 ml to reach a 1 % w/v BSA-water solution.
4) Gently stir or swirl the BSA-solution for a few minutes (be careful to avoid foam by not using agitated stirring) and leave the mixing flask in the refrigerator over-night for complete dissolution of the BSA.
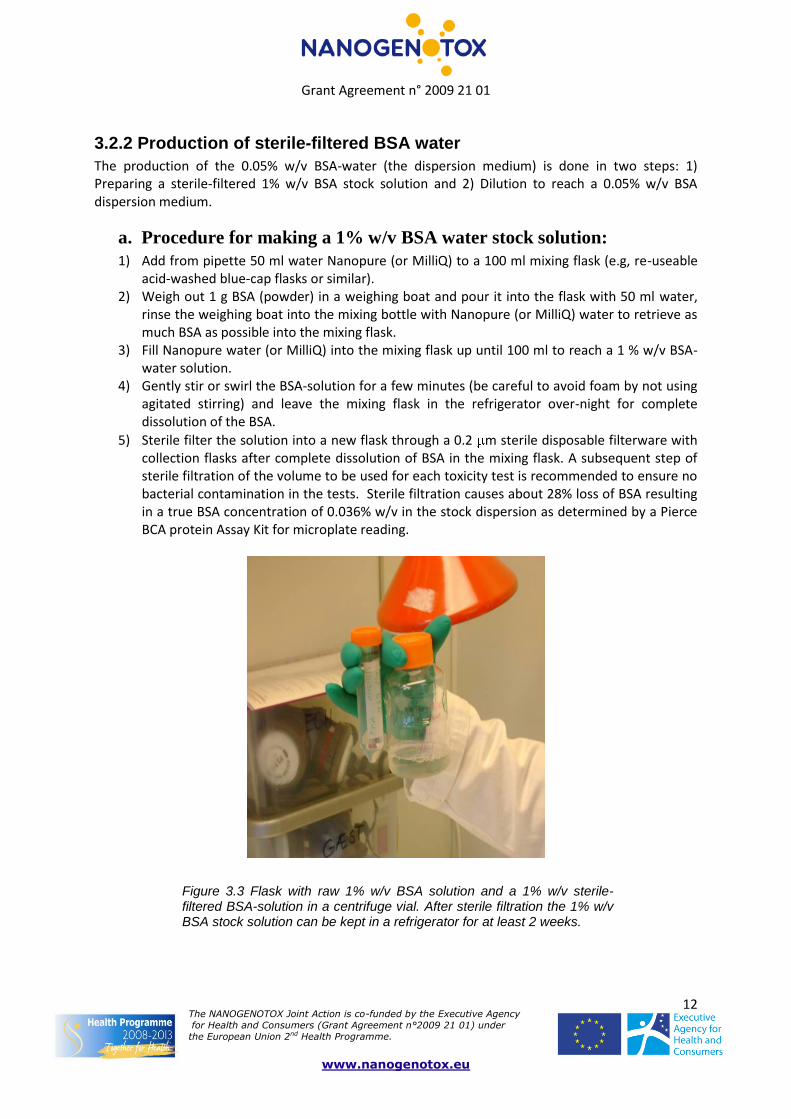
5) Sterile filter the solution into a new flask through a 0.2 m sterile disposable filterware with collection flasks after complete dissolution of BSA in the mixing flask. A subsequent step of sterile filtration of the volume to be used for each toxicity test is recommended to ensure no bacterial contamination in the tests. Sterile filtration causes about 28% loss of BSA resulting in a true BSA concentration of 0.036% w/v in the stock dispersion as determined by a Pierce BCA protein Assay Kit for microplate reading.
Figure 3.3 Flask with raw 1% w/v BSA solution and a 1% w/v sterile-filtered BSA-solution in a centrifuge vial. After sterile filtration the 1% w/v BSA stock solution can be kept in a refrigerator for at least 2 weeks.
Grant Agreement n° 2009 21 01
The NANOGENOTOX Joint Action is co-funded by the Executive Agency
for Health and Consumers (Grant Agreement n°2009 21 01) under
the European Union 2nd Health Programme.
www.nanogenotox.eu
13
b. Procedure for making the “0.05% w/v BSA-water solution” for
nanomaterial dispersion:
The 0.05% w/v BSA solution to be used for test item preparation is achieved by simple dilution of the sterile-filtered 1% w/v BSA batch solution. Remember that the 0.05% w/v BSA solution in reality contains ca. 0.036% BSA w/v due to loss in the sterile-filtration.
Example: 2 ml 1 % w/v BSA is diluted with 38 ml Nanopure water (or MilliQ) (Dilution factor = 20x) to reach a batch solution of 0.05 w/v%.
Weighing should be done in a ventilated weighing box, a glove box or a fume hood designated for sensitive weighing with an accuracy of at least 0.1 mg or better.
Materials
Microweigh with accuracy of 0.1 mg or better Reference or control weights with masses within the scale the weighing project Wet and dry wipes for cleaning Weighing boat Steel and glass spatula’s Vials: 20ml Scint-Burk glass pp-lock+Alu-foil (WHEA986581; Wheaton Induistries Inc.)a Vials with nanomaterials Tray for storage of vials Argon source.b a Can be re-used after acid washing or regular washing followed rinsing in ethanol. Add new pp-
lock+Alu-foil lids. b Maybe needed for handling NM-series materials distributed from JRC. See below.
Preparation of weighing area
1) Turn on the weighing box, glove box, fume-hood 15-30 minutes before use. 2) Ensure wearing appropriate work dress (two- or three layer gloves*, lab-coat, laboratory shoes)
and that personal respiratory protection equipment is easily accessible in case of accident. 3) Ensure all material to be used for weighing and storage is present (nanomaterials, bottles/vials
for weighing material in, cleaning tissue (both wet and dry wipes) before commencing the work. 4) Calibrate the weigh with traceable reference weight and log the data. Check that accuracy is
within acceptance.
* It is recommended to use two- or three layers of gloves for dermal protection. 1) Inner glove in textile 2) and or inner glove using long powder free nitril or latex rubber glove, 3) powder free nitril glove.
Weighing out the nanomaterial
5) a. Open a clean empty vial for preparation of the stock dispersion and place it on the weigh. b. Tara the weigh. 6) Carefully open the vial without shaking it (NM-materials are packed in argon atmosphere and a
special strategy may required for weighing and potential re-use for NM-samples – see below).
Grant Agreement n° 2009 21 01
The NANOGENOTOX Joint Action is co-funded by the Executive Agency
for Health and Consumers (Grant Agreement n°2009 21 01) under
the European Union 2nd Health Programme.
www.nanogenotox.eu
14
7) Remove the electrostatic charge on the vial using a neutralizer (e.g., ionization blower) and carefully weigh out the required mass with a spatula in steel or glass.
8) Close the lid on both vials 9) After completion of weighing materials, clean the weigh and work area for potential spills using
wet and dry wipes. 10) Waste is packed in a suitable waste bag and discarded according to local or institutional
directions. 11) Ventilate the work-area (ventilated weighing station, fume hood, glove box etc.) for 15 minutes
after weighing and cleaning has been completed.
Argon inlet
Small box
Nanomaterial vial
Argon inlet
Small box
Nanomaterial vial
Figure 3.3. Illustration of a simple setup for sample retrieval and re-sealing NM material vials under argon.
Calculations for preparing the 2.56 mg/ml stock dispersion
For preparing a 2.56 mg/ml stock dispersion in a 6 ml EtOH and BSA-water, each vial must contain at least 15.36 mg nanomaterial. For harmonization of the dispersion energy it is recommended to stay as close as possible to 6 ml EtOH and BSA-water.
Calculation of the correct volume is done simply according to equation 1: 1: V = m /c m = mass of nanomaterial (mg) c = concentration (normally 2.56 mg/ml) V = volume of dispersion medium (ml) 6 ml EtOH + BSA-water is required to disperse 15.36 mg powder.
0.5 vol% EtOH (96% or higher) is used for pre-wetting: 6 ml x 0.5/100 = 0.03 ml (30 l) EtOH 99.5 vol% sterile-filtered BSA-water (0.05% w/v) is used as dispersion medium: 6 – 0.03 = 5.97 ml BSA-water
3.2.4 Particle dispersion
Particles are pre-wetted using ethanol (EtOH). This procedure was previously introduced to enable dispersion of hydrophobic materials in water-based systems[1]. In this protocol, we have introduced EtOH pre-wetting for all materials to harmonize the treatment for all powder materials.
Grant Agreement n° 2009 21 01
The NANOGENOTOX Joint Action is co-funded by the Executive Agency
for Health and Consumers (Grant Agreement n°2009 21 01) under
the European Union 2nd Health Programme.
www.nanogenotox.eu
15
Pre-wetting procedure (volumes for 15.36 mg powder)
1) Carefully open the glass scintillation vial with pre-weighed powder (ideally 15.36 mg).
2) Tilt the scintillation vial ca. 45 and add 30 l EtOH drop-by-drop onto the particles in the vial by pipette.
3) Screw on the lid and gently mix the EtOH and powder by simoultaneous gently tapping the
vial on the table-top while rotating the tilted 45 vial from side to side between your fingers for approximately one minute.
4) Add 970 μl 0.05 % BSA water by pipette while slowly rotating and swirling the 45 tilted scintillation glass. Be careful to avoid foaming of BSA. The last ml BSA-water or so is added along the top of the inner wall of the vial to collect the powder in the fluid at the vial bottom.
5) Add the remaining 5 ml 0.05 % BSA water by pipette along the sidewalls of the scintillation vial to wash down any particles that may be stuck to the sidewalls.
6) Place the vial on ice for at least 5 minutes while the sonicator and ice-water is prepared.
3.2.5 Probe Sonication
The protocol was developed using a 400 Watt Branson Sonifier S-450D (Branson Ultrasonics Corp., Danbury, CT, USA) equipped with a standard 13 mm disruptor horn (Model number: 101-147-037). The horn can be seen at www.sonifier.com/pdf/DISRUPTO.PDF and the sonifier can be seen at http://www.sonifier.com/s450_digital.asp.).
The particle dispersions are continuously cooled in an ice-water bath to minimize heat development during sonication (Fig. 3.4).
Insulated box (e.g, flamingo)
Reversed glass-beaker with ice
Ice-water (ca. 85-90 vol% ice)
Glass scintillator vial with particle dispersion
Insulated box (e.g, flamingo)
Reversed glass-beaker with ice
Ice-water (ca. 85-90 vol% ice)
Glass scintillator vial with particle dispersion
Figure 3.4. Illustration showing a principle set-up for placement of sonication vial in ice-water bath. Different configurations are possible.
Sonication procedure
1) Fill a 250 ml glass beaker with ice and place it upside-down in a insulation box (flamingo/styrofoam)
2) Add ca. 85-90 vol% ice into the insulation box 3) Add ca. 10-15 vol% cold water into the insulation box 4) Carefully place the glass scintillation vial with powder on top of the upside-down glass-
beaker and pack the ice-water around the vial to keep the dispersion cooled. 5) Insert the sonication probe (between the upper quarter and upper half of the BSA-water
volume in the scintillation beaker (e.g., find the correct height using a vial with BSA-water alone).
6) Start sonication and run it for 16 min at 400 W and 10% amplitude while controlling that the sonication probe does not touch the walls of the scintillation vial. Use of different sonication conditions (power and amplitude) may require different sonication times as discussed below.
The NANOGENOTOX Joint Action is co-funded by the Executive Agency
for Health and Consumers (Grant Agreement n°2009 21 01) under
the European Union 2nd Health Programme.
www.nanogenotox.eu
16
8) Clean the sonication probe by sonication for 5 minutes (similar sonication settings) with the probe fully immersed in a 50:50 water-EtOH (>96%) mixture followed by rinsing in EtOH using a dispenser and a collection bottle underneath. The probe is allowed to air-dry in the fume-hood. Other in-house cleaning methods may also apply.
Selection of sonication time
Analysis of the energy consumption of different sonicators in the project showed that the Branson S-450D probe sonicator used for development of this dispersion protocol delivered 3,136 MJ/m3 during the 16 min sonication at 10% amplitude. It was found that a similar probe at a different laboratory delivered only 2,096 MJ/m3 within the same time-frame resulting. Different efficiencies of different sonicators may result in slightly different average particle sizes when using the same sonication time as shown below in tests of NM-105 (Figure 3.5). However, the average particle size decreases systematically as a power function of sonication time using any sonication instrument and the resulting particle sizes appears comparable at the same delivered energy (Figure 3.6).
Figure 3.5. Change in average intensity particle size by different DLS instruments as function of sonication time.
dZ = 723,45ES-0,18
R² = 0,93
0
50
100
150
200
250
300
350
400
0 1000 2000 3000 4000 5000 6000
Specific energy ES (MJ/m3)
Z-av
era
ge in
Inte
nsi
ty d
z (n
m)
UP 200H Hielscher + Vasco (INRS)
S-450D Branson + Vasco (INRS)
S-450D Branson + ZetaNanosizer (NRCWE)
NM 105 @ 2.56 mg/ml
Et-OH BSA (0.05% w/v)
V = 6 ml
Sonicator + DLS device
Figure 3.6. Change in average intensity particle size by different DLS instruments as function of specific sonication energy.
Grant Agreement n° 2009 21 01
The NANOGENOTOX Joint Action is co-funded by the Executive Agency
for Health and Consumers (Grant Agreement n°2009 21 01) under
the European Union 2nd Health Programme.
www.nanogenotox.eu
17
The amplitude was found to be the most critical parameter for dispersion efficiency. Based on the test results and sonicators available in the Consortium, it was decided at the General Assembly in Nancy, April 6-8, 2011, that sonicators which could be operated at 10% amplitude should use 16 min of sonication, whereas instruments which could not go lower than 20% amplitude should use sonication for 12 min.
3.3 Quality control
After sonication, the dispersions should be checked. The dispersion may be quickly characterized using dynamic light-scattering (DLS) or similar techniques (see e.g, SOP for dynamic light scattering in Jensen et al., 2011). For comparison of DLS data in quality control with the results shown in Chapter 4, it is recommended to compare the average intensity sizes (Z-average) obtained using measured viscosities and the optical parameters for water (medium), which do not change with the algorithms used for calculation of size distributions. The viscosities of dispersions with CNT may vary significantly from time to time. If comparisons are made with the reported size-distribution data, it is recommended to use the same optical parameters for both the medium (water) and the test materials, which were used in this report (Table 4.1; Chapter 4).
Rough qualitative assessment of the particle dispersions can also be made by different optical microscopy analysis, where presence of large agglomerates and aggregates should be negligible in all samples, but the CNT, where some micron-size infiltrated agglomerates and aggregates are inevitable.
Fast indication of dispersion quality can also be obtained by optical microscopy. For preparation of slides for optical, place e.g. 10μl on an objective glass and add a cover glass. Quickly check the dispersion by optical microcopy to assess whether there is presence of large agglomerates and aggregates. The abundance of such particles, larger than a few µm should be relatively low and well-dispersed particles are partly visible at high magnification by vibrating small dots.
3.4 Important notes to the NANOGENOTOX dispersion protocol
The original protocol erroneously wrote use nitrogen under the materials and chemicals section for keeping samples in inert air. Nitrogen should not be used to the risk in formation of nitrogen reaction products. It forms nitric oxide and nitrogen dioxide with oxygen, ammonia with hydrogen, and nitrogen sulfide with sulfur. Potential reactions with CNT and organic coatings could be a risk. Nitrogen gas is also slightly lighter (1.2506 kg/m3 at 273K) than air (1.2929 kg/m3 at 273K) and is therefore not recommended as the inert gas for the sample vials. It should have said Argon (1.7840 kg/m3 at 273K), which is also written under the procedures and recommended by JRC in order to avoid any surface reaction.
Improved wetting and particle recovery from sidewalls can be made by adding the 0.05% w/v BSA solution in two steps. A first step with 970 µl for prewetting and a second step with 5 ml to wash down sidewalls of the vials. Also store the vial ca. 5 min on ice while preparing the probe sonicater.
It has been found that the sonication efficiency and dispersion stability may vary with the vial type. It is now not only suggested, but requested for harmonization that batch dispersions are made in 20 ml Scint-Burk glass pp-lock+Alu-foil (WHEA986581; Wheaton Industries Inc.).
Grant Agreement n° 2009 21 01
The NANOGENOTOX Joint Action is co-funded by the Executive Agency
for Health and Consumers (Grant Agreement n°2009 21 01) under
the European Union 2nd Health Programme.
www.nanogenotox.eu
18
It is imperative that the sonication probe is placed between the upper third and upper half of the Scint-Burk sonication vial. At this position, one will avoid splashing and still retrieve as high efficiency of the sonication probe as possible. Lower positions may increase deterioration of the probe tip.
The probe tip should be inspected regularly for corrosion. If the tip starts to corrode, it must be replaced to avoid unnecessary contamination by probe debris. Careful cleaning and maintenance of the probe is imperative to ensure a good and clean test material.
Probe sonicators with 20% amplitude as the minimum setting and higher powers should keep the probe dimensions and reduce sonication time to 12 minutes. Matching exact energy used for the sonication can be done using a watt-meter as described in section 3.2.5.
This generic protocol may not always give the best dispersion possible regarding achievement of minimal size and stability, but it produces acceptable dispersions which satisfy the needs for cross-comparison in toxicity testing in being reasonably dispersed, made in the same way, with the same amount of dispersants etc. It should also be noted that MNs are sometimes strongly aggregated or agglomerated and dispersion to sub-100nm particles of MN may not always be possible nor relevant.
Grant Agreement n° 2009 21 01
The NANOGENOTOX Joint Action is co-funded by the Executive Agency
for Health and Consumers (Grant Agreement n°2009 21 01) under
the European Union 2nd Health Programme.
www.nanogenotox.eu
19
4. Size distributions and stabilities of batch dispersions
4.1 Analytical Techniques
Samples were prepared following the NANOGENOTOX dispersion protocol described in Chapter 3. Particle size-distributions in the batch dispersions were determined using dynamic light scattering at measured viscosities. Stabilities of the dispersions were assessed by measuring the variation in scattered intensity and calculated average zeta-(intensity)-sizes as function of time. Stabilities are recalculated to relative values using the scattered intensity of the first spectrum analysis. The listed methods are applied to obtain the results in both these Chapter, Chapter 5 and Chapter 6.
4.1.1 Viscosity measurement
The viscosity of the dispersions was determined using a AND Vibro Viscometer Model SV-10 (A&D Company, Ltd.) capable of measuring the viscosity between 0.3 and 10.000 mPaS. The viscosity was
measured at 25 C corresponding to the analytical conditions for dynamic light scatter analysis.
4.1.2 Dynamic Light Scattering Analysis
DLS analysis was done at 25 C using a Malvern Nano ZS. App. 0.7 – 1.0 ml suspension was entered in disposable standard 1 ml polystyrene cuvette using a plastic pipette tip and started to be analyzed within ca. 5-10 minutes after preparation.
Thermal equilibrium time was set to 2 minutes, and the data in this report was analyzed using optical parameters listed in table 4.1. Each size spectra is the average of six individual DLS analysis conducted using automatic optimization of analytical conditions and data treatment by general purpose size-analysis. As the calculation of the size-distribution from the photon correlation spectra may change depending on the mathematical approach, additional resolution may be obtained using the high-resolution algorithm in the Malvern software.
Table 4.1 Viscosities and optical DLS conditions
Water (STP) Rutile Anatase SiO2 CNT
Ri 1.33 2.903 2.49 1.544 2.02
Rabs 0.10 0.10 0.20 2.00
Viscosity [cP] 0.8872 Water€ water
€ water
€ 1 – 2.4
€ Measured viscosities varied between 0.99 and 1.13 suggesting that the viscosity is almost the same as water
The intensity data were re-calculated to number size-distributions using the general purpose mode in the DTS software (vs. 6.20) and automatic optimization of analytical conditions (time, duration, number of scans).
4.1.3 Imaging
Qualitative overviews of the particle dispersions were made by optical microscopy using a Leica DMIL optical cell microscope. Optical micrographs were obtained using Multicamera (A 0.23-S90) and the EASY GRAB software (Picolo Demonstrator 3.6.1.10; Eurosys s.a.).
Grant Agreement n° 2009 21 01
The NANOGENOTOX Joint Action is co-funded by the Executive Agency
for Health and Consumers (Grant Agreement n°2009 21 01) under
the European Union 2nd Health Programme.
www.nanogenotox.eu
20
4.2 Hydrodynamic size-distributions of batch dispersions
It is recommended to perform quick quality control of the batch dispersions by DLS or other similar equipment. This section briefly presents the hydrodynamic size distributions observed in MN batch dispersions made following the NANOGENOTOX dispersion protocol. The stabilities of the individual dispersions are also shown as tested
4.2.1 TiO2 test materials
Figure 4.1 shows the particle size-distributions observed in the TiO2 batch dispersions. It is observed that the TiO2 dispersions are dominated by a single mode with a peak-size close to 100 nm. All dispersions have a tail upwards, which may reach into the µm-size. NM-101, NM-102, and NM-105 have a minor second mode (by number) in the µm or near µm size-range. The corresponding average zeta-size and polydispersivity indices (PDI) of the size spectra are listed in Table 4.2. From size analysis, NM-103 and NM-105 and produces the smallest peak- and average sizes of the tested dispersions.
TiO2 samples
0
5
10
15
20
25
30
1 10 100 1000 10000
Hydrodyanmic Diameter, dH [nm]
Nu
mb
er
[%]
NM-100
NM-101
NM-102
NM-103
NM-104
NM-105
Figure 4.1 Hydrodynamic number size-distributions in batch dispersions with of TiO2 samples (n=6)
Table 4.2. Viscosity, average zeta-size, polydispersivity index of batch dispersions with TiO2 samples
NM Average zeta-size [nm] PDI Viscosity [cP]
NM-100 215 2 0.168 0.017 1.00
NM-101 483 20 0.334 0.039 0.99
NM-102 545 14 0.309 0,038 0.99
NM-103 194 2 0.324 0.020 1.00
NM-104 234 4 0.318 0.017 1.00
NM-105 155 1 0.135 0.017 1.00 € average of 6 repeated analysis
Grant Agreement n° 2009 21 01
The NANOGENOTOX Joint Action is co-funded by the Executive Agency
for Health and Consumers (Grant Agreement n°2009 21 01) under
the European Union 2nd Health Programme.
www.nanogenotox.eu
21
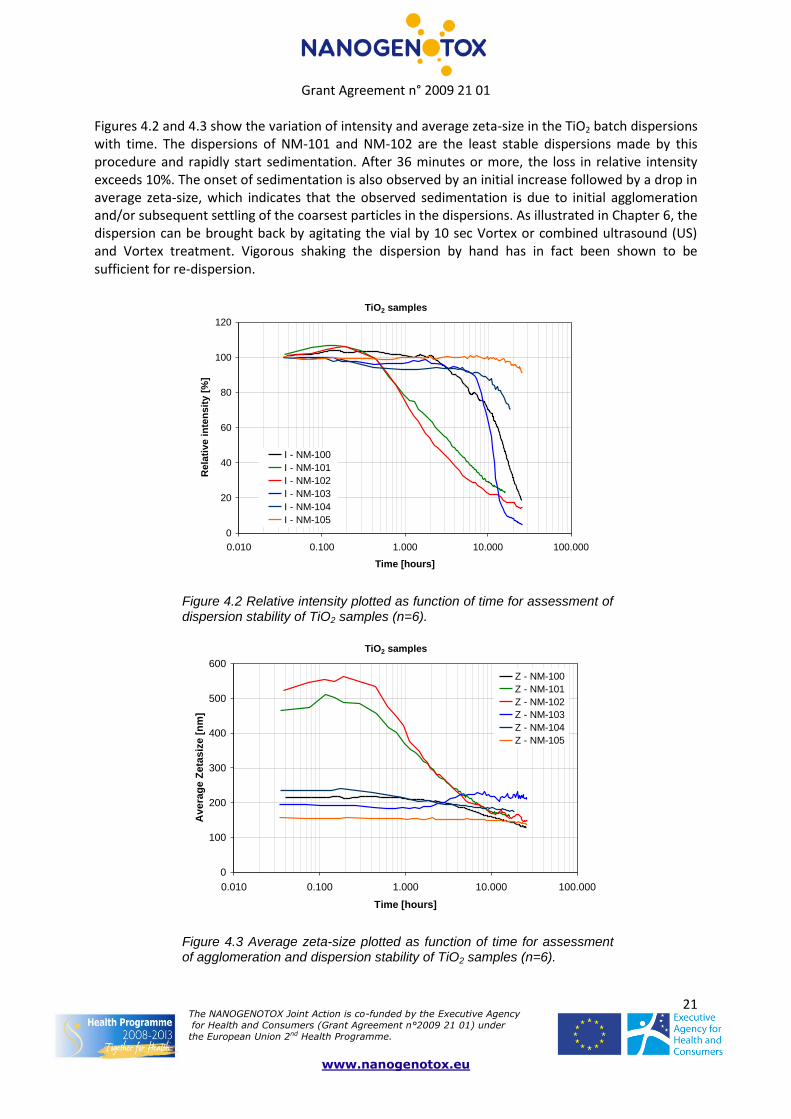
Figures 4.2 and 4.3 show the variation of intensity and average zeta-size in the TiO2 batch dispersions with time. The dispersions of NM-101 and NM-102 are the least stable dispersions made by this procedure and rapidly start sedimentation. After 36 minutes or more, the loss in relative intensity exceeds 10%. The onset of sedimentation is also observed by an initial increase followed by a drop in average zeta-size, which indicates that the observed sedimentation is due to initial agglomeration and/or subsequent settling of the coarsest particles in the dispersions. As illustrated in Chapter 6, the dispersion can be brought back by agitating the vial by 10 sec Vortex or combined ultrasound (US) and Vortex treatment. Vigorous shaking the dispersion by hand has in fact been shown to be sufficient for re-dispersion.
TiO2 samples
0
20
40
60
80
100
120
0.010 0.100 1.000 10.000 100.000
Time [hours]
Rela
tive i
nte
ns
ity [
%]
I - NM-100
I - NM-101
I - NM-102
I - NM-103
I - NM-104
I - NM-105
Figure 4.2 Relative intensity plotted as function of time for assessment of dispersion stability of TiO2 samples (n=6).
TiO2 samples
0
100
200
300
400
500
600
0.010 0.100 1.000 10.000 100.000
Time [hours]
Avera
ge Z
eta
siz
e [
nm
]
Z - NM-100
Z - NM-101
Z - NM-102
Z - NM-103
Z - NM-104
Z - NM-105
Figure 4.3 Average zeta-size plotted as function of time for assessment of agglomeration and dispersion stability of TiO2 samples (n=6).
Grant Agreement n° 2009 21 01
The NANOGENOTOX Joint Action is co-funded by the Executive Agency
for Health and Consumers (Grant Agreement n°2009 21 01) under
the European Union 2nd Health Programme.
www.nanogenotox.eu
22
4.2.2 Synthetic Amorphous Silica test materials
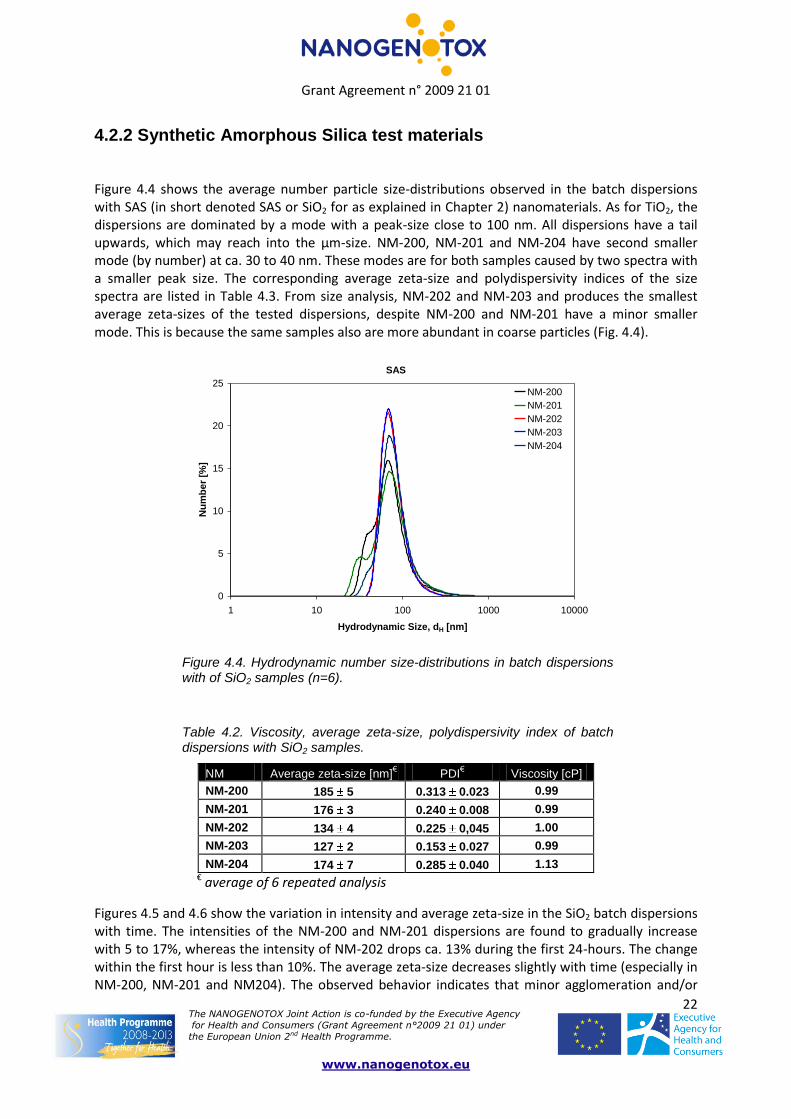
Figure 4.4 shows the average number particle size-distributions observed in the batch dispersions with SAS (in short denoted SAS or SiO2 for as explained in Chapter 2) nanomaterials. As for TiO2, the dispersions are dominated by a mode with a peak-size close to 100 nm. All dispersions have a tail upwards, which may reach into the µm-size. NM-200, NM-201 and NM-204 have second smaller mode (by number) at ca. 30 to 40 nm. These modes are for both samples caused by two spectra with a smaller peak size. The corresponding average zeta-size and polydispersivity indices of the size spectra are listed in Table 4.3. From size analysis, NM-202 and NM-203 and produces the smallest average zeta-sizes of the tested dispersions, despite NM-200 and NM-201 have a minor smaller mode. This is because the same samples also are more abundant in coarse particles (Fig. 4.4).
SAS
0
5
10
15
20
25
1 10 100 1000 10000
Hydrodynamic Size, dH [nm]
Nu
mb
er
[%]
NM-200
NM-201
NM-202
NM-203
NM-204
Figure 4.4. Hydrodynamic number size-distributions in batch dispersions with of SiO2 samples (n=6).
Table 4.2. Viscosity, average zeta-size, polydispersivity index of batch dispersions with SiO2 samples.
NM Average zeta-size [nm]€ PDI
€ Viscosity [cP]
NM-200 185 5 0.313 0.023 0.99
NM-201 176 3 0.240 0.008 0.99
NM-202 134 4 0.225 0,045 1.00
NM-203 127 2 0.153 0.027 0.99
NM-204 174 7 0.285 0.040 1.13 € average of 6 repeated analysis
Figures 4.5 and 4.6 show the variation in intensity and average zeta-size in the SiO2 batch dispersions with time. The intensities of the NM-200 and NM-201 dispersions are found to gradually increase with 5 to 17%, whereas the intensity of NM-202 drops ca. 13% during the first 24-hours. The change within the first hour is less than 10%. The average zeta-size decreases slightly with time (especially in NM-200, NM-201 and NM204). The observed behavior indicates that minor agglomeration and/or
Grant Agreement n° 2009 21 01
The NANOGENOTOX Joint Action is co-funded by the Executive Agency
for Health and Consumers (Grant Agreement n°2009 21 01) under
the European Union 2nd Health Programme.
www.nanogenotox.eu
23
sedimentation occurs in the dispersions over time. However, the differences are small and It is concluded that all dispersions are relatively stable and sedimentation appears to be limited within the first 24-hours.
Figure 4.5. Relative intensity plotted as function of time for assessment of dispersion stability of SiO2 samples (n=6).
SAS
0
50
100
150
200
250
0.010 0.100 1.000 10.000 100.000
Time [hours]
Avera
ge Z
eta
-siz
e [
nm
]
Z - NM-200
Z - NM-201
Z - NM-202
Z - NM-203
Z - NM-204
Figure 4.6. Average zeta-size plotted as function of time for assessment of agglomeration and dispersion stability of SiO2 samples.
4.2.3 MWCNT test materials
Figure 4.7 shows the apparent particle size-distributions observed in batch dispersions with MWCNT. It should be noted that calculated DLS sizes of the high aspect ratio CNT are very different from the physical sizes; hence, the term “apparent”. The viscosities of CNT dispersions vary significantly from sample to sample, but it may also vary from time to time (see e.g., Table 4.3). Therefore, the
Grant Agreement n° 2009 21 01
The NANOGENOTOX Joint Action is co-funded by the Executive Agency
for Health and Consumers (Grant Agreement n°2009 21 01) under
the European Union 2nd Health Programme.
www.nanogenotox.eu
24
calculated apparent sizes may be highly inaccurate, if the viscosity of the specific dispersion analyzed is not used. From the peak sizes observed in the dispersions, all MWCNT materials are partially to highly dis-entangled or even separated into individual CNT. The finest dispersions appear to be made from NM-400 and NRCWE-007. It should, however, be noted that the NM-400 spectrum is of an ethanol free dispersion. The dispersion of NM-402 appears to produce a fine dispersion, but the sample gives an unusual correlogram at high correlation times and high PDI suggesting the sample is highly unsuitable for sizing. NM-403 is also not suitable for sizing and the solutions to the correlation data vary considerably giving different spectra for almost every spectrum optained. Stability analyses also show and unusual behavior in both NM-402 and NM-403, which is under further investigation (Figures 4.8 and 4.9).
Figure 4.7. Apparent hydrodynamic number size-distributions in batch dispersions with MWCNT (n=6). #;## The samples appears to contain very large agglomerates/aggregates and may have settled partially before analysis. The correlogram of NM-402 suggests that the sample is not suitable for size-analysis. ### Average size spectrum of NM-403 is composed of different individual spectra and the PDI shows high polydispersivity. * The NM-400 spectrum is of an ethanol-free dispersion.
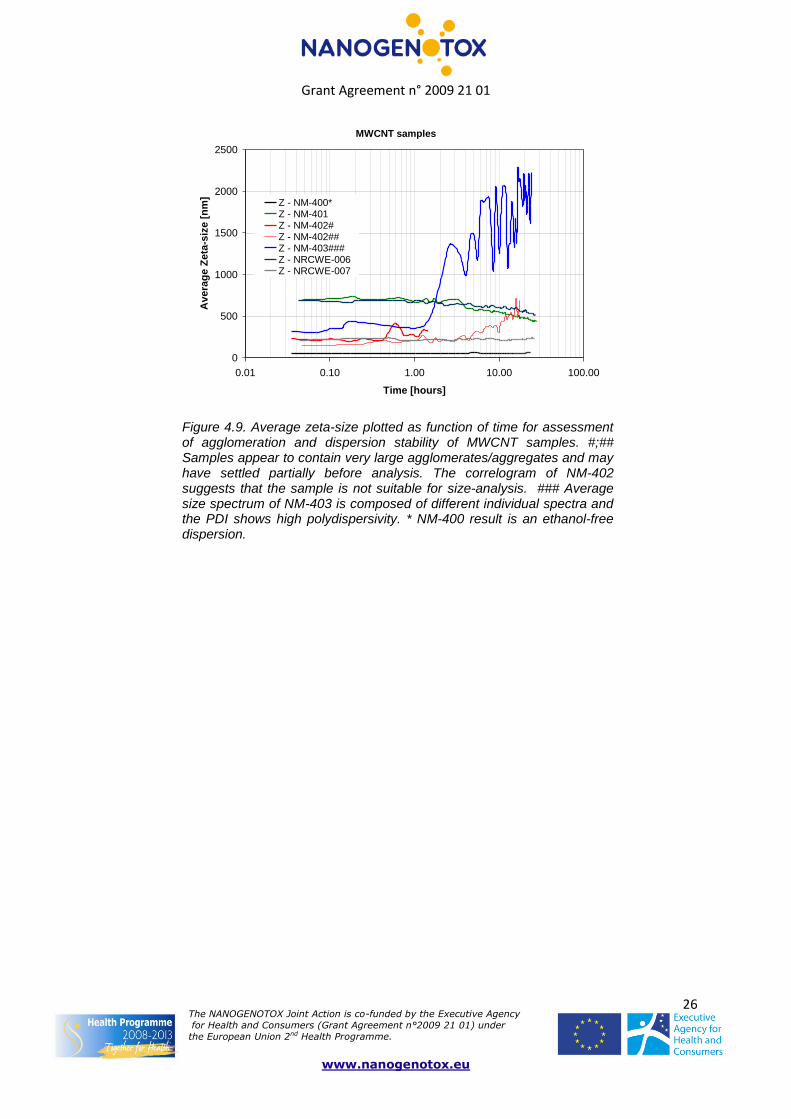
Figures 4.8 and 4.9 show the variation in intensity and average zeta-size in the MWCNT batch dispersions over time. Except NM-402 and NM-403, all dispersions are relatively stable and vary less than 10% in intensity within the first 10 hours. The average zeta-size of NM-401 and NRCWE-006 (Mitsui), however, starts to decrease after 2-3 hours suggesting that some sedimentation of the larger agglomerates and aggregates starts to occur. NM-402 and NM-403 show reasonable stability the 1 -2 hour and then startst to fluctuate in intensity and increasing sizes. CNT powders are challenging to disperse due to high degree of entanglement, aggregation and variations in small sub-samples. Therefore, it is recommended to observe the dispersions carefully and check whether there are apparent sample to sample variations.
Grant Agreement n° 2009 21 01
The NANOGENOTOX Joint Action is co-funded by the Executive Agency
for Health and Consumers (Grant Agreement n°2009 21 01) under
the European Union 2nd Health Programme.
www.nanogenotox.eu
25
Table 4.3. Viscosity, average zeta-size, polydispersivity index of batch dispersions with MWCNT.
NM Average zeta-size [nm]€ PDI
€ Viscosity [cP]
NM-400* 54.9 0.6 0.292 0.032 2.98
NM-401 710 17 0.249 0.02 1.00
NM-402 240 58
#
160 10##
0.707 0.016
0.551 0.097
1.09
2.31
NM-403 354 46###
0.720 0.013 1.76
NRCWE-006 682 13 0.261 0.022 1.00
NRCWE-007 223 12 0.479 0.049 1.00
€ average of 6 repeated analysis;
$ Not available at time of analysis;
#,##,### the correlograms suggests that the sample is unsuitable for sizing.
* The NM-400 spectrum is of an ethanol-free dispersion.
MWCNT samples
0
50
100
150
200
250
300
0.01 0.10 1.00 10.00 100.00
Time [hours]
Rela
tive I
nte
nsit
y [
%]
I - NM-400*
I - NM-401
I - NM-402#
I - NM-402##
I - NM-403###
I - NRCWE-006
I - NRCWE-007
Figure 4.8. Relative intensity plotted as function of time for assessment of dispersion stability of MWCNT samples. #,## The samples appears to contain very large agglomerates/aggregates and may have settled partially before analysis. . ### NM-403 shows high polydispersivity * NM-400 is an ethanol-free dispersion.
Grant Agreement n° 2009 21 01
The NANOGENOTOX Joint Action is co-funded by the Executive Agency
for Health and Consumers (Grant Agreement n°2009 21 01) under
Figure 4.9. Average zeta-size plotted as function of time for assessment of agglomeration and dispersion stability of MWCNT samples. #;## Samples appear to contain very large agglomerates/aggregates and may have settled partially before analysis. The correlogram of NM-402 suggests that the sample is not suitable for size-analysis. ### Average size spectrum of NM-403 is composed of different individual spectra and the PDI shows high polydispersivity. * NM-400 result is an ethanol-free dispersion.
Grant Agreement n° 2009 21 01
The NANOGENOTOX Joint Action is co-funded by the Executive Agency
for Health and Consumers (Grant Agreement n°2009 21 01) under
the European Union 2nd Health Programme.
www.nanogenotox.eu
27
5. Stabilities and redispersion of NM batch dispersions One of the critical aspects for using the NANOGENOTOX dispersion protocol is the time-lag between preparation of the stock dispersion and administration into the test system. It is recommended to work as fast as possible to avoid un-anticipated side-effects; such as particle alteration and consumed hydrochemical reactivity/radical formation, which could be mechanisms responsible for toxicological effects.
Another issue is sub-sampling of a representative sample from the batch dispersion. Slow settling of particles is one of the major risks for uncertainty in particle dose and particle size-fractionation. Therefore it is recommended always to use the dispersion as soon as possible (within 30 to 60 min) and to agitate the dispersion immediately before its use. This is to ensure that the sub-sample contains the intended particle concentration and size distribution.
A series of tests using the insoluble NM-101 have shown that partially settled batch dispersions made by the NANOGENOTOX dispersion protocol can easily be resuspended using Vortex shaking alone (Figure 5.1). Agitation by Vortex shaker gave the same result as 5 min ultrasound treatment in water bath followed by Vortex shaking and all resuspensions yielded the same sizes, intensities and settling profile as the batch dispersion. Similar observations have been made for other NANOGENOTOX test materials.
NM101 (TiO2)
0
20
40
60
80
100
120
0.010 0.100 1.000 10.000 100.000
Time [hours]
Sta
bilit
y [
% R
ela
tive in
ten
sit
y]
0
200
400
600
800
1000
1200
Avera
ge
In
ten
sit
y S
ize [
nm
]
I - Batch dispersionI - 10 sec VortexI - 5 min US+10 sec Vortex 1I - 5 min US+10 sec Vortex 2Z - Batch dispersionZ - 10 sec VortexZ 5 min US + 10 sec Vortex 1Z - 5 min US + 10 sec Vortex 2
Figure 5.1. Relative intensities and average zeta-size of NM-101 as determined by analysis of 1) the initial Batch dispersion, 2) resuspension of the same dispersion using a Vortex shaker, 3) 5 min ultrasonication (US) in a water-bath followed by 10 sec. Vortex shaking and 4) repetition of treatment 3.
Grant Agreement n° 2009 21 01
The NANOGENOTOX Joint Action is co-funded by the Executive Agency
for Health and Consumers (Grant Agreement n°2009 21 01) under
the European Union 2nd Health Programme.
www.nanogenotox.eu
28
6. Range finding for optimizing the BSA concentration A range finding study was established to investigate the optimum BSA concentrations for the dispersion protocol using NM-101 (TiO2) and NM-400 (MWCNT), respectively. Even though NM-101 is not really used in Nanogenotox, it was included at the beginning of dispersion testing for contingency reasons. The criteria were stable viscosities of the dispersions, high degree of dispersion based in DLS size-distribution analysis, low polydispersivity index (PDI), relatively slow settling of the batch dispersion. The concentrations tested were three repetitions at 1, 0.5, 0.2, 0.15, 0.1, 0.075, 0.050, 0.025, 0.00625, 0.0% w/v BSA-water. Relatively high BSA-concentrations were expected to be most suitable due to the presence of typically >60% albumin in full serum. However, as we shall see, high BSA concentrations did not result in stable NM dispersions.
First viscosity analysis showed moderate variations as function of BSA concentrations for NM-101 (TiO2) particle dispersions with values close to that of water (Fig. 6.1). Dispersions with NM-400 (MWCNT) on the other hand showed relatively large variations in viscosity and in some cases poor reproducibility. This is in part ascribed to non-Newtonian behaviour of the NM-400 dispersions. In particular, dispersions of NM-400 at 0.15% w/v BSA and above showed high instability and were visually poorly dispersed. A reproducible minimum was observed around 0.075 and 0.1% w/v BSA. This suggests a change in the particle structure in the dispersion from that value (and maybe lower concentrations). Hence, based on viscosity analysis of these material dispersions, the optimal BSA concentration appears to be less than 0.1% w/v.
0.0
0.5
1.0
1.5
2.0
2.5
3.0
3.5
4.0
4.5
0.000 0.001 0.010 0.100 1.000 10.000
% BSA in de-ionized NanoPure water
Kin
em
ati
c V
isc
os
ity
[m
Pa
.s]
NM101
NM400
Figure 6.1. Variation in the kinematic viscosity as function of NanoPure BSA concentrations in particle dispersions . The result at the left (at value 0,000) shows the viscosity in nanopure alone. Results are average of 3 repetitions and the error bars are standard deviations.
Size- analysis showed that the average zeta-size of NM-101 (TiO2) continuously decreased as function reduced BSA-amount added to the dispersion medium (Figure 6.2). Except for 1% BSA all average zeta-sizes are comparable or slightly smaller than the average zeta-size in pure water. For NM-101 the analysis indicate that the optimum dispersion occurs between the lowest tested BSA concentration (0,00625% w/v BSA) and BSA-free Nanopure water.
Grant Agreement n° 2009 21 01
The NANOGENOTOX Joint Action is co-funded by the Executive Agency
for Health and Consumers (Grant Agreement n°2009 21 01) under
the European Union 2nd Health Programme.
www.nanogenotox.eu
29
For NM-400 (MWCNT), it is evident that the lowest average zeta-size was found at BSA-concentrations between 0.025 and 0.15% w/v BSA dissolved in nanopure water. The smallest average zeta-size was observed at 0.05% BSA w/v (Figure 6.3).
NM-101 (TiO2)
1
10
100
1000
10000
100000
0,000 0,001 0,010 0,100 1,000 10,000
%BSA
Avera
ge Z
eta
-siz
e [
nm
]
Figure 6.2. Variation in average zeta-size (average intensity peak) with % BSA in Nanopure water for NM-101 (TiO2) dispersions. The result at the left (at value 0,000) shows the zeta-size for NM-101 in nanopure alone. Results are average of 3 repetitions (six analysis per repetition) and the error bars are standard deviations.
NM-400 (CNT)
1
10
100
1000
10000
100000
0,000 0,001 0,010 0,100 1,000 10,000
%BSA
Avera
ge Z
eta
-siz
e [
nm
]
Figure 6.3. Variation in average zeta-size (average intensity peak) with % BSA in Nanopure water for NM-400 (CNT) dispersions. The result at the left (at value 0,000) shows the zeta-size for NM-400 in nanopure alone. Results are average of 3 repetitions (six analysis per repetition) and the error bars are standard deviations
Analysis of the polydispersivity index (PDI) of the tested dispersions showed acceptable values for all NM-101 dispersions, except for the highest dose at 1% w/v BSA (Fig. 6.4). The PDI of NM-400 shows
Grant Agreement n° 2009 21 01
The NANOGENOTOX Joint Action is co-funded by the Executive Agency
for Health and Consumers (Grant Agreement n°2009 21 01) under
the European Union 2nd Health Programme.
www.nanogenotox.eu
30
larger scatter and often high values (Fig. 6.5). The lowest variation was observed at 0.025 and 0.05% w/v BSA. Dispersions at 0.075, 0.1 and 0.15% BSA may also be acceptable.
NM-101 (TiO2)
0,0
0,1
0,2
0,3
0,4
0,5
0,6
0,7
0,8
0,9
0,000 0,001 0,010 0,100 1,000 10,000
%BSA
Po
lyd
isp
ers
ivit
y I
nd
ex
Figure 6.4. Variation in polydispersivity index with % BSA in Nanopure water for NM-101 (TiO2) dispersions. The result at the left (at 0,000) shows the PDI for NM-101 in nanopure alone. Results are average of 3 repetitions (six analyses per repetition) and the error bars are standard deviations.
NM-400 (CNT)
0,0
0,2
0,4
0,6
0,8
1,0
1,2
0,000 0,001 0,010 0,100 1,000 10,000
%BSA
Po
lyd
isp
ers
ivit
y I
nd
ex
Figure 6.5. Variation in polydispersivity index with % BSA in Nanopure water for NM-400 (CNT) dispersions. The result at the left (at 0,000) shows the PDI for NM-400 in nanopure alone. Results are average of 3 repetitions (six analyses per repetition) and the error bars are standard deviations
All range-finding analysis suggests that MWCNT is the limiting material for selection of an optimum concentration of BSA in the dispersion medium. Clearly, serious instability of the dispersions was observed after sonication in BSA water with 0.2% BSA water or higher or less than 0.025% BSA. The smallest average zeta-sizes and lowest PDI was observed in NM-400 dispersions made with 0.05 and
Grant Agreement n° 2009 21 01
The NANOGENOTOX Joint Action is co-funded by the Executive Agency
for Health and Consumers (Grant Agreement n°2009 21 01) under
the European Union 2nd Health Programme.
www.nanogenotox.eu
31
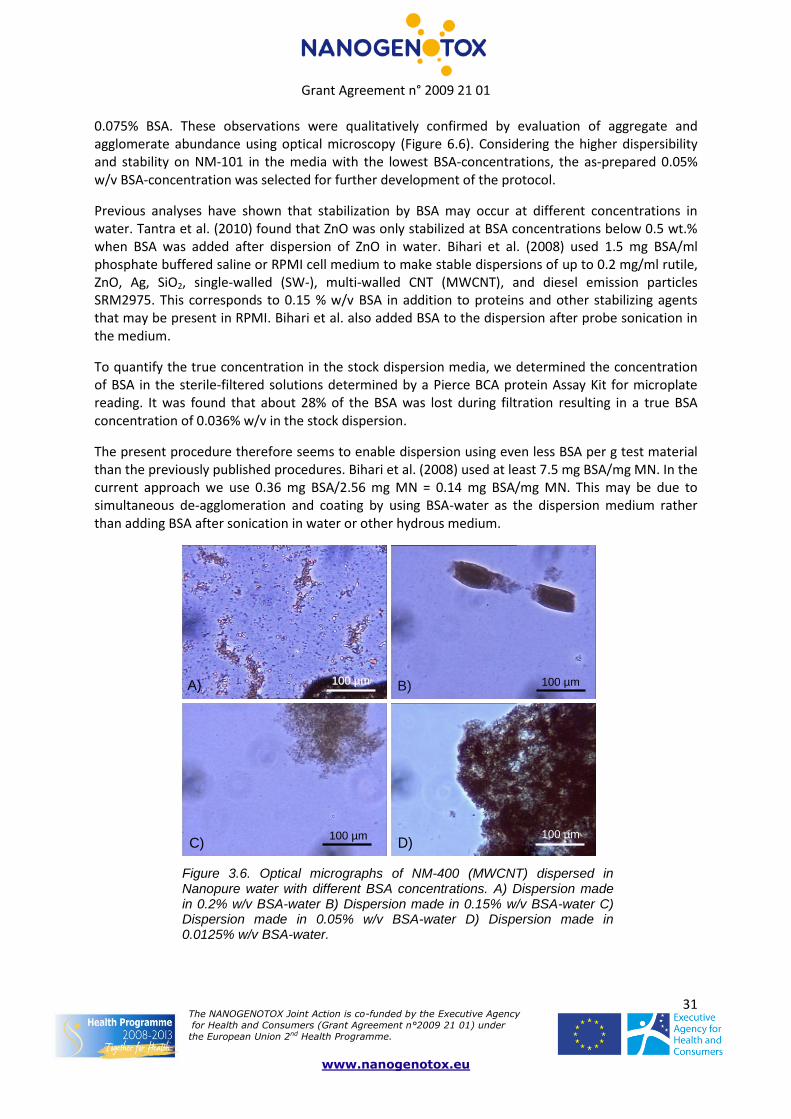
0.075% BSA. These observations were qualitatively confirmed by evaluation of aggregate and agglomerate abundance using optical microscopy (Figure 6.6). Considering the higher dispersibility and stability on NM-101 in the media with the lowest BSA-concentrations, the as-prepared 0.05% w/v BSA-concentration was selected for further development of the protocol.
Previous analyses have shown that stabilization by BSA may occur at different concentrations in water. Tantra et al. (2010) found that ZnO was only stabilized at BSA concentrations below 0.5 wt.% when BSA was added after dispersion of ZnO in water. Bihari et al. (2008) used 1.5 mg BSA/ml phosphate buffered saline or RPMI cell medium to make stable dispersions of up to 0.2 mg/ml rutile, ZnO, Ag, SiO2, single-walled (SW-), multi-walled CNT (MWCNT), and diesel emission particles SRM2975. This corresponds to 0.15 % w/v BSA in addition to proteins and other stabilizing agents that may be present in RPMI. Bihari et al. also added BSA to the dispersion after probe sonication in the medium.
To quantify the true concentration in the stock dispersion media, we determined the concentration of BSA in the sterile-filtered solutions determined by a Pierce BCA protein Assay Kit for microplate reading. It was found that about 28% of the BSA was lost during filtration resulting in a true BSA concentration of 0.036% w/v in the stock dispersion.
The present procedure therefore seems to enable dispersion using even less BSA per g test material than the previously published procedures. Bihari et al. (2008) used at least 7.5 mg BSA/mg MN. In the current approach we use 0.36 mg BSA/2.56 mg MN = 0.14 mg BSA/mg MN. This may be due to simultaneous de-agglomeration and coating by using BSA-water as the dispersion medium rather than adding BSA after sonication in water or other hydrous medium.
A) B)
C) D)100 µm 100 µm
100 µm100 100 µµmmA) B)
C) D)100 µm 100 µm
100 µm100 100 µµmm
Figure 3.6. Optical micrographs of NM-400 (MWCNT) dispersed in Nanopure water with different BSA concentrations. A) Dispersion made in 0.2% w/v BSA-water B) Dispersion made in 0.15% w/v BSA-water C) Dispersion made in 0.05% w/v BSA-water D) Dispersion made in 0.0125% w/v BSA-water.
Grant Agreement n° 2009 21 01
The NANOGENOTOX Joint Action is co-funded by the Executive Agency
for Health and Consumers (Grant Agreement n°2009 21 01) under
the European Union 2nd Health Programme.
www.nanogenotox.eu
32
References Bihari, P, Vippola, M, Schultes, S, Praetner, M, Khandoga, A.G, Reichel, CA, Coester, C, Tuomi, T, Rehberg, M, and Krombach, F (2008) Optimized dispersion of nanoparticles for biological in vitro and in vivo studies. Particle and Fibre Toxicology 5, article 14: DOI: 10.1186/1743-8977-5-14.
Carter, D. C. and Ho, J. X. (1994) Structure of Serum Albumin. Adv. Protein Chem. 45: 153-203.
Guzey D, Gulseren I, Bruce BD and Weiss J (2006) Interfacial Properties and Structural Conformation of Thermosonicated Bovice Serum Albumin. Food Hydrocolloids 20/5: 669-677.
Jacobsen NR, Pojano G, Wallin H and Jensen KA (2010). Nanomaterial dispersion protocol for toxicological studies in ENPRA. Internal ENPRA report. March 2010. National Research Centre for the Working Environment. 8 pp.
Jensen, KA, Clausen PA, Birkedal R, Kembouche Y, Christiansen E, Jacobsen NR, Levin M, Koponen I, Wallin H, de Temmerman PJ, Mast J, Guiot C, Spalla O, Motzkus C, Shivachev B, Rousset D, Witschger O (2011). Standard Operating Procedures for characterization of the selected manufactured nanomaterial types. NANOGENOTOX deliverable report n°3: June 2011: 78 pp.
Ji Z, Jin X, George S, Xia T, Meng H, Wang X, Suarez E, Zhang H, Hoek EM, Godwin H, Nel AE, Zink JI (2010) Dispersion and stability optimization of TiO2 nanoparticles in cell culture media. Environ Sci Technol. 44(19):7309-14.
Johnson DR, Methner MM, Kennedy AJ and Steevens JA (2010) Potential for Occupational Exposure to Engineered Carbon-Based Nanomaterials in Environmental Laboratory Studies. Environ Health Perspect 118(1): 49–54.
MacCuspie, R, Allen, AJ, and Hackley, VA (2011) Dispersion of silver nanoparticles in synthetic lung-flui studied under in situ conditions. Nanotoxicology 5/2: 140-156.
Schneider T and Jensen KA (2008) Combined single drop and rotating drum dustiness test of fine to nanosized powders using a small drum. Annals of Occupational Hygiene. 52/1, 23-34.
Oberdörster G, Maynard A, Donaldson K, Castranova V, Fitzpatrick J, Ausman K, Carter J, Karn B, Kreyling W, Lai D, Olin S, Monteiro-Riviere N, Warheit D, Yang H; ILSI Research Foundation/Risk Science Institute Nanomaterial Toxicity Screening Working Group. (2005) Principles for characterizing the potential human health effects from exposure to nanomaterials: elements of a screening strategy. Part Fibre Toxicol. 2005 Oct 6;2:8. p 8
Tantra, R, Tombkins, J, and Quincey, P (2010) Characterisation of the de-agglomeration effects of bovine serum albumin on nanoparticles in aquous suspension. Colloids and Surfaces: Biointerfaces 75: 275-281.
Tsai, D-H, DelRio, FW, Keene, AM, Tyner, KM, MacCuspie, RI, Cho, TJ, Zachariah, MR, and Hackley, VA (2011) Adsorption and conformation of serum albumin protein on gold nanoparticles investigated using dimensional measurements and in situ spectroscopic methods. Langmuir 27: 2464-2477.
Vippola M, Falck GCM, Lindberg HK, Suhonen S, Vanhala E, Norppa H, Savolainen K, Tossavainen A and Tuomi T (2009) Preparation of nanoparticle dispersions for in-vitro toxicity testing. Hum Exp Toxicol 28(6-7):377-385
Wright AK and Thompson MR (1975). "Hydrodynamic structure of bovine serum albumin determined by transient electric birefringence". Biophys. J. 15/2: 137–41.
This document arises from the NANOGENOTOX Joint Action which has received funding from the European Union, in the framework of the Health Programme under Grant Agreement n°2009 21. This publication reflects only the author’s views and the Community is not liable for any use that may be made of the information contained therein.