The CATCH trial CAT heter Infections in CH ildren: a randomised controlled trial and economic evaluation comparing impregnated and standard central venous catheters in children K Harron 1 , Q Mok 2 , K Dwan 3 , CH Ridyard 4 , T Moitt 3 , M Millar 5 , P Ramnarayan 2 , SM Tibby 6 , DA Hughes 4 , C Gamble 3 and RE Gilbert 1 * *Corresponding author: [email protected]1 Institute of Child Health, University College London, UK 2 Great Ormond Street Hospital, London, UK 3 Medicines for Children Research Network Clinical Trials Unit, University of Liverpool, UK 4 Centre for Health Economics & Medicines Evaluation, Bangor University, UK 5 Barts Health NHS Trust, London, UK 6 Evelina Children’s Hospital, London, UK Competing interests: M Millar was a member of the NIHR HTA Diagnostic Technologies and Screening Panel for the duration of the CATCH study. No other competing interests declared Final Draft Total word count 21144 1 1 2 3 4 5 6 7 8 9 10 11 12 13 14 15 16 17 18 19 20 21 22 23 24 25 26 27 28 29 30 31 32 33 34
Transcript
The CATCH trialCAT heter Infections in CH ildren: a
randomised controlled trial and economic evaluation comparing impregnated and
standard central venous catheters in children
K Harron1, Q Mok2, K Dwan3, CH Ridyard4, T Moitt3, M Millar5, P Ramnarayan2, SM Tibby6, DA Hughes4, C Gamble3 and RE Gilbert1**Corresponding author: [email protected] 1 Institute of Child Health, University College London, UK2 Great Ormond Street Hospital, London, UK3 Medicines for Children Research Network Clinical Trials Unit, University of Liverpool, UK4 Centre for Health Economics & Medicines Evaluation, Bangor University, UK5 Barts Health NHS Trust, London, UK6 Evelina Children’s Hospital, London, UK
Competing interests: M Millar was a member of the NIHR HTA Diagnostic Technologies and Screening Panel for the duration of the CATCH study. No other competing interests declared
Figure 1: CONSORT flow diagram for all trial participants.....................................................................24Figure 2 Number of children included in the primary outcome, the rate of BSI and catheter related BSI
according to time since randomisation.........................................................................................25Figure 3: Kaplan-Meier curve for time to first BSI by CVC allocation.....................................................26Figure 4: Flow diagram of the methods employed for the economic evaluation..................................56Figure 5: Ranking of total, 6-month costs by intervention group, indicating patients who experienced a
bloodstream infection..................................................................................................................57Figure 6: Cost-effectiveness acceptability curve based on a 6 month time horizon presenting the probability of
antibiotic and standard CVCs being cost-effective for given values of ceiling ratio expressed as cost per bloodstream infection (BSI) averted.............................................................................................58
Figure 7: Relation between total costs (cumulative) and time since randomisation, according to intervention group............................................................................................................................................58
Figure 8: Relation between the ICER for antibiotic CVC versus standard CVC, and time since randomisation. Positive ICERs are cost-incurring, negative values represent incremental savings per BSI averted59
Figure 9: Risk-adjusted rates in bloodstream infection for children expected to have central venous catheters based on linked PICANet-Labbase2 data for 16 PICUs in England; symbols=observed rates; lines=smoothed adjusted rates (log-scale)...................................................................................68
Figure 10: Probability distribution for the value of resources made available by averting BSI using antibiotic CVC in all PICUs in England during 2012, 90% of the distribution represented costs greater than the additional cost of purchasing antibiotic CVCs................................................................................................69
Figure 11: Cost-impact: Number of BSI averted and value of resources made available using antibiotic in place of standard CVCs for a range of baseline rates, assuming each BSI is associated with a mean cost of £10,975.........................................................................................................................................70
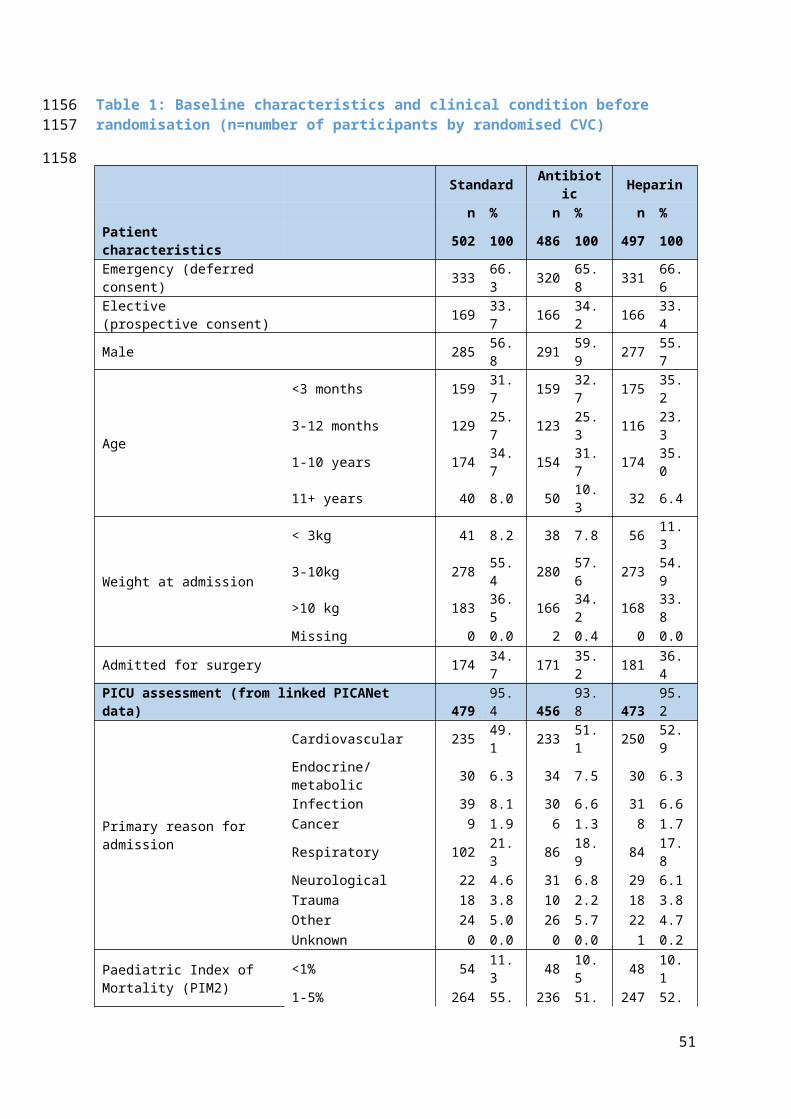
Table 1: Baseline characteristics and clinical condition before randomisation (n=number of participants by randomised CVC)..........................................................................................................................28
Table 2: Details of the intervention and characteristics at 48 hours post randomisation (n=number of participants with CVC inserted)....................................................................................................29
Table 3: Samples taken in primary outcome time window (n=number of participants by randomised CVC) 30Table 4: Primary outcome (absolute measures) and type of organism isolated, according to CVC allocation
(values are n by randomised CVC (%) unless otherwise stated))..................................................31Table 5: Risk difference for first BSI and hazard ratio for time to first BSI according to CVC allocation (hazard
ratios p<0.05 are in bold)..............................................................................................................31Table 6: Regression results for primary outcome..................................................................................32Table 7: Competing risk analysis for primary outcome of time to first BSI............................................32Table 8: Secondary outcomes (absolute measures) by CVC allocation (n is number of participants by
randomised CVC who experienced the outcome)........................................................................33Table 9: Risk difference and/or hazard ratios for secondary outcomes according to CVC allocation (hazard ratios
p<0.05 are in bold)........................................................................................................................34Table 10: Safety analyses of CVC-related adverse events and mortality (n is number by type of received or if
not inserted, type attempted to be inserted)...............................................................................35Table 11: PCR results for bacteria in blood samples taken during the primary outcome time window by CVC
type (N is number by randomised CVC)........................................................................................36Table 12: Unit cost for intensive care and high dependency care, based on HRGs from the National Schedule
tariff (2012-13).............................................................................................................................47Table 13: Hospital ward bed-day rates as provided by hospital finance departments and adjusted for inflation
(£ sterling, 2013)...........................................................................................................................48Table 14: Patients' lengths of stay and count of dominant HRGs relating to inpatient stays, from randomisation
to 6 months (including readmissions), according to place and intensity of care and by intervention group......................................................................................................................................................49
Table 15: Disaggregated and total costs (£) by intervention group from randomisation to end of the six-month timeframe.....................................................................................................................................50
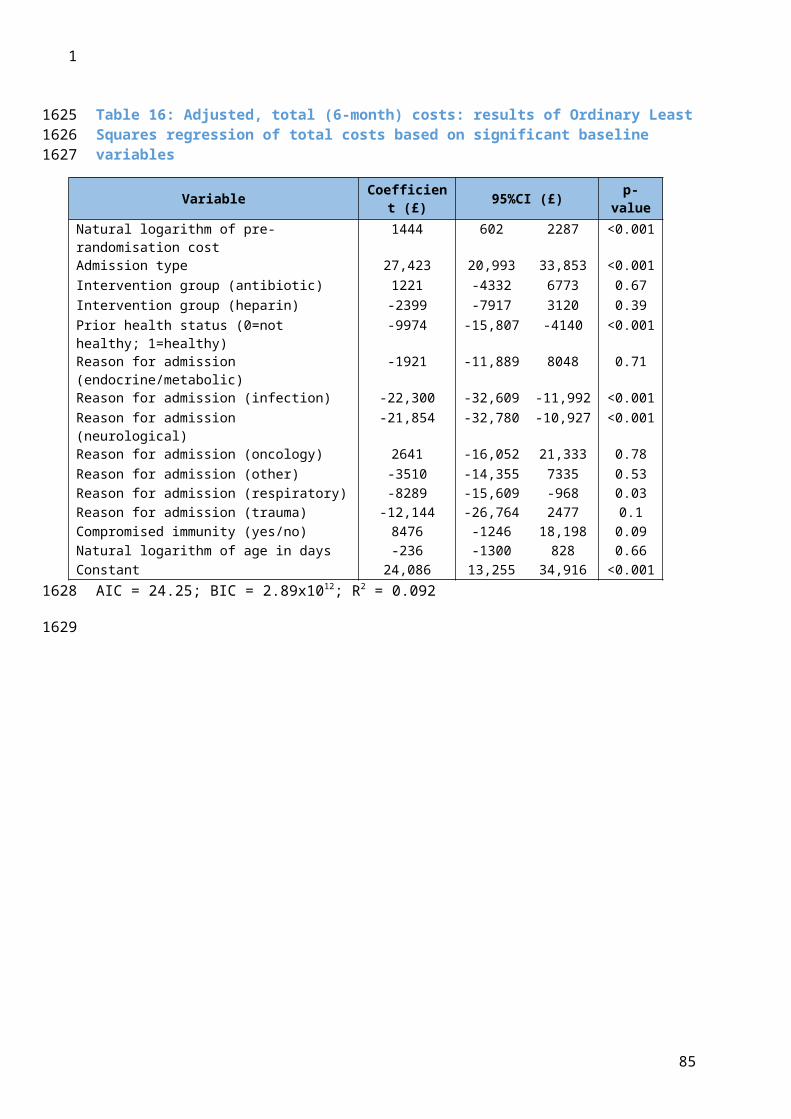
Table 16: Adjusted, total (6-month) costs: results of Ordinary Least Squares regression of total costs based on significant baseline variables........................................................................................................52
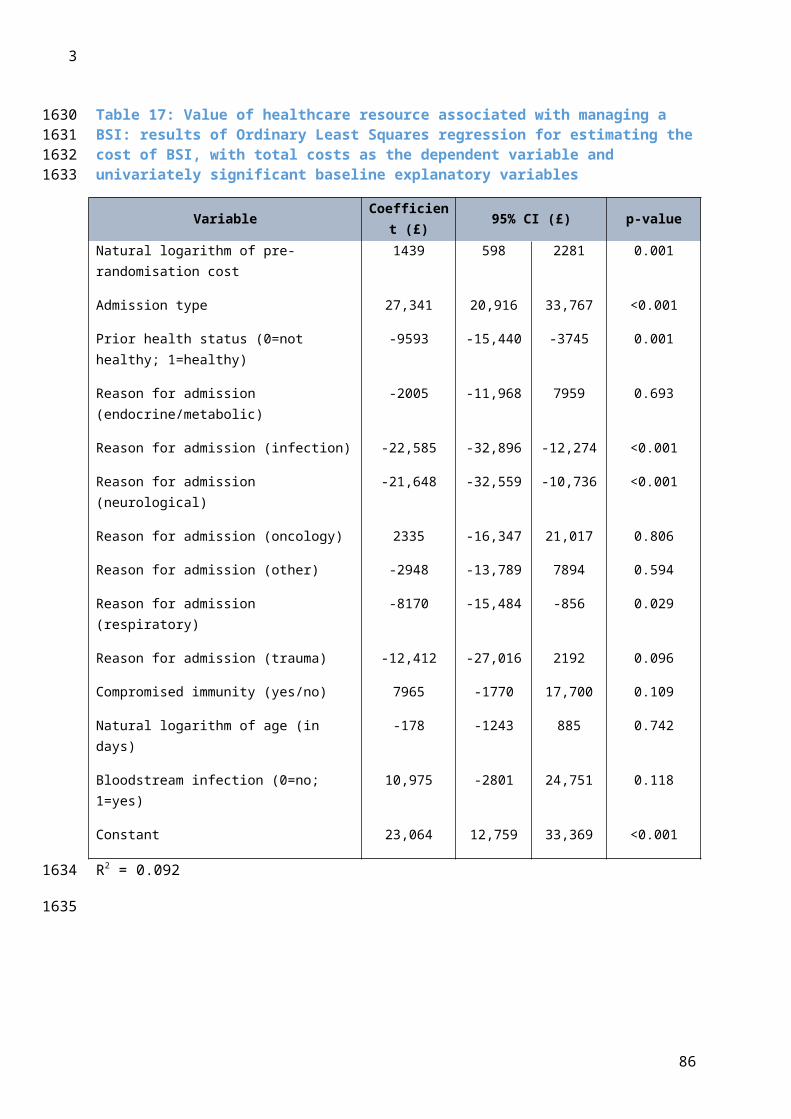
Table 17: Value of healthcare resource associated with managing a BSI: results of Ordinary Least Squares regression for estimating the cost of BSI, with total costs as the dependent variable and univariately significant baseline explanatory variables....................................................................................53
Table 18: Incremental Analysis of unadjusted costs (6 month timeframe and index hospitalisation)...54Table 19: Patients' length of stay for hospitalisation episode from randomisation by intervention group 54Table 20: Parameter estimates for cost-impact analysis and sensitivity analysis..................................66Table 21: Cost impacted analysis of managing BSIs occurring with standard versus antibiotic CVCs with best and
worst case scenarios* and hypothetical scenarios for a typical PICU with 350 admissions per year67
Unblinded 1 Unblinded 1 Unblinded 2 Primary outcome* Primary outcome* Primary outcome*Clinical indicators recorded and :- Clinical indicators recorded and :- Clinical indicators recorded and :- ≥ 1 blood culture sample taken: 213 ≥ 1 sample taken: 190 ≥ 1 sample taken: 190 No blood culture sample taken** 8 No blood culture sample taken** 6 No blood culture sample taken** 3
*based on clinically indicated blood culture sample taken >=48 hours after randomisation and <48 hours after CVC removal; ** used in sensitivity analysis
34
869
870
Figure 2 Number of children included in the primary outcome, the rate of BSI and catheter related BSI according to time since randomisation
Rand
omisa
tion
48 h
ours
afte
r ran
dom
isatio
n
CVC
rem
oval
48 h
afte
r CVC
rem
oval
Primary outcome of BSIn=40 n=2
Rate of BSI per 1000 CVC-daysn=10 n=40
Catheter-related BSI (CR-BSI)n=24 n=1
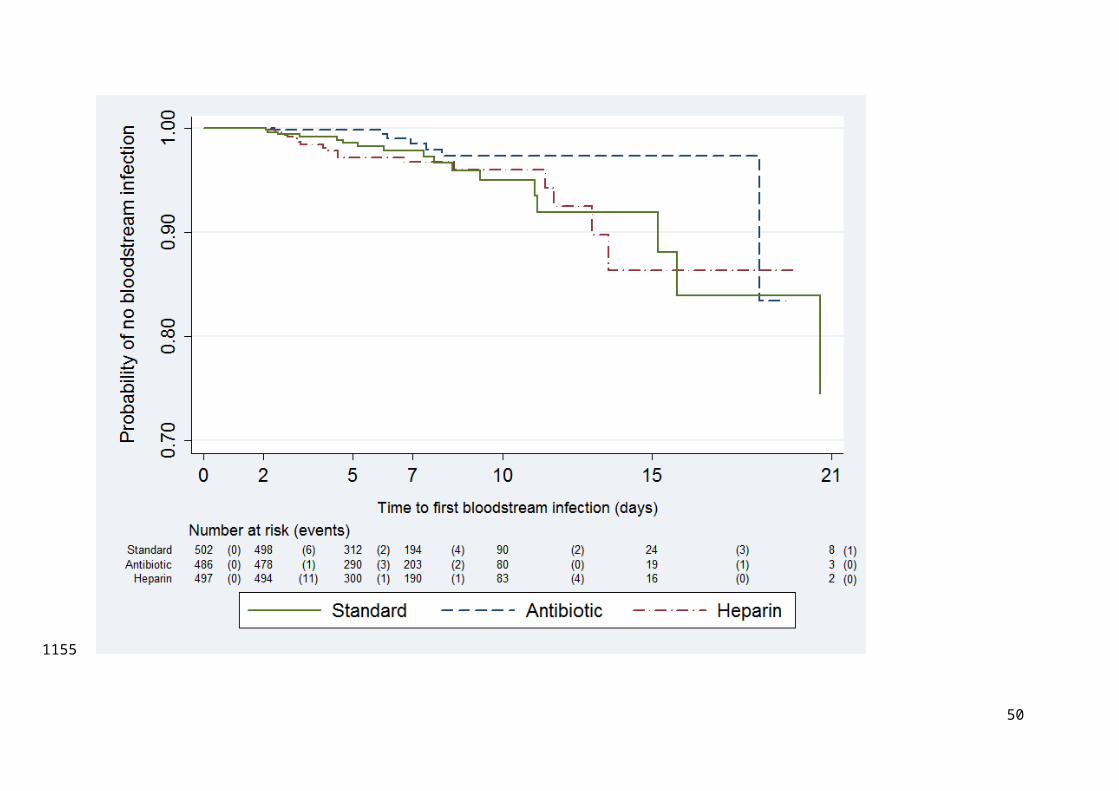
Figure 3: Kaplan-Meier curve for time to first BSI by CVC allocation
35
871
872
873
874
875
876
877
878
879
36
880
Table 1: Baseline characteristics and clinical condition before randomisation (n=number of participants by randomised CVC)
*CVCs were inserted by the retrieval team prior to transfer to PICU** ET tube, tracheotomy tube, intracranial pressure monitor, chest drain, peritoneal dialysis catheter
38
887888
889890
Table 3: Samples taken in primary outcome time window (n=number of participants by randomised CVC)
Standard (n=502) Antibiotic (n=486) Heparin (n=497)
n randomisedn samples
% n randomisedn samples
% n randomisedn samples
%
Samples clinically indicated and in the primary outcome time window
213 42.4 190 39.1 190 38.2328 269 326
Type of sample
Arterial49 9.8 39 8.0 41 8.255 44 55
Peripheral19 3.8 32 6.6 35 7.022 33 39
CVC161 32.1 129 26.5 136 27.4226 167 208
39
891892
Table 4: Primary outcome (absolute measures) and type of organism isolated, according to CVC allocation (values are n by randomised CVC (%) unless otherwise stated))
Standard Antibiotic Heparin
Intention to treat analyses N=502 % N=486 % N=497 %Bloodstream infection 18 3.59 7 1.44 17 3.42Median time to first BSI in days (IQR) 7.5 (4.5, 11.2) 6.9 (6.0, 8.0) 4.2 (3.1, 8.4)
* = groups add to more than total due to multiple types of organisms isolated on same occasion in some patients$ = includes 1 mixed BSI pathogen and skin organism$$ = includes skin bacteria
Table 5: Risk difference for first BSI and hazard ratio for time to first BSI according to CVC allocation (hazard ratios p<0.05 are in bold)
Risk difference (95% CI) Hazard ratio (95% CI) p-value
Primary analysis Any impregnated (n=983)vs standard (n=502) -1.14 (-3.04, 0.75) 0.71 (0.37, 1.34) 0.29
Suspected infection (18) No suspected infection (24) 0.99 0.40-2.43 0.98Hazard ratios p<0.05 are in bold; * participants with prospective consent were admitted electively and participants with deferred consent were admitted as an emergency.
Table 7: Competing risk analysis for primary outcome of time to first BSI
Outcome Hazard ratio (95% CI) Gray’s test p-value
Time to first BSI (hours) 0.71 (0.39, 1.31) 0.29
Time to death (hours) 1.08 (0.63, 1.85) 0.89
41
901
902903904
905
906
907
908
909
910
911
912
913
914
Table 8: Secondary outcomes (absolute measures) by CVC allocation (n is number of participants by randomised CVC who experienced the outcome)
Standard (n=502)
Antibiotic (n=486)
Heparin (n=497)
Primary analyses n % n % n %
Catheter-related BSI (CR-BSI) 12 2.4 3 0.6 10 2.0Rate of BSI per 1000 CVC days (95% CI) BSI/1000 days
8.2421/2.5
47
(4.7, 11.8)
3.308/2.41
8
(1.0, 5.6)
8.7821/2.3
91
(5.0, 12.6)
Composite measure of BSI 112 22.3 103 21.2 102 20.5
CVC thrombosis 125 24.9 126 25.9 105 21.1Median time to CVC removal in days (IQR) 4.28 (2.3,
7.0) 4.3 (2.1, 7.0) 4.20 (2.2,
7.0)Mortality by 30 days 42 8.4 39 8.0 28 5.6Median time to PICU discharge in days (IQR) 5.1 (2.8,
10.0) 4.4 (2.2, 9.3) 4.9 (2.3,
8.9)Median time to hospital discharge in days (IQR) 12.0 (6.4,
25.6) 12.0 (6.7, 22.7) 12.1 (6.4,
22.5)
42
915916
917
Table 9: Risk difference and/or hazard ratios for secondary outcomes according to CVC allocation (hazard ratios p<0.05 are in bold)
Primary analyses compared time to event for all secondary outcomes, except CR-BSI (^=risk ratio) and rate of BSI (*=rate ratio)
44
919920
Table 10: Safety analyses of CVC-related adverse events and mortality (n is number by type of received or if not inserted, type attempted to be inserted)
Standard (n=533) Antibiotic (n=451) Heparin (n=479) Total(n=1463)
within 72 hours prior to randomisation, numbers of devices in situ, intervention group, and
admission type (elective or emergency). Assumptions were necessary to account for missing data
with respect to some variables; patients were assumed to be healthy (n=1), not
immunocompromised (n=19) and no positive blood culture (n=5). Missing data for weight (n=2) were
imputed with the mean (11.95 kg). Missing reason for admission (n=20) were cross-checked against
PICANet, PAS and available HES data. All were correctly assigned as cardiovascular patients.
Independent variables were tested in univariate analyses for their association with total costs with
risk factors that were significant at the 5% level selected for the multivariable regression using a
stepwise approach. Given the non-normality of cost data, generalised linear models (GLMs) were
specified using a range of families and links. Assessment of goodness of fit using Akaike Information
Criterion (AIC) and the Modified Park’s test was inconclusive; but the best fitting link function,
52
1084
1085
1086
1087
1088
1089
1090
1091
1092
1093
1094
1095
1096
1097
1098
1099
1100
1101
1102
1103
1104
1105
1106
1107
1108
1109
1110
1111
1112
1113
1114
determined from the Pearson Correlation, Pregibon Link and the Modified Hosmer and Lemeshow
tests, was the identity link. While the underlying true distributions of costs are not normal, the
analysis depends only on sample means and variances. Based on the comparatively large sample size
the Central Limit Theorem was assumed to guarantee near-normality of sample means, and an OLS
regression was considered appropriate 73.
Bias-corrected confidence intervals for costs and BSI were estimated from bootstrapped data
generated using the recycled predictions method.74
Sensitivity analysis
The pre-specified time horizon for the base-case analysis, of 6 months, was selected to capture
longer term costs resulting from potential complications of BSI but was somewhat arbitrary.. The
sensitivity of total costs and the ICERs to the time horizon of analysis was therefore considered by
limiting costs to those incurred during the index hospitalisation (that is, excluding any subsequent
re-admissions that may have occurred during the 6-months), and by analysing their relationship with
time, from 1 month (when all BSI had occurred) to 6 months.
Value of healthcare resources associated with BSI
In an exploratory analysis, a variable representing the presence of a BSI was included in the cost
regression to estimate the value of the healthcare resources associated with managing a
bloodstream infection. To avoid collinearity, the variable representing intervention group was
omitted from this regression.
All analyses were performed using STATA Version 10, and the economic evaluation reported
according to the Consolidated Health Economic Evaluation Reporting Standards (CHEERS)
statement.75
ResultsResource use and total costs
Complete cost data were available for all patients. In the 6 months preceding randomisation, the
total costs (length of stay) of ICU/HDU admission were £6,026 (3.19 days) for the standard CVC
group, £5,188 (2.76 days) for the antibiotic CVC group and £6,616 (3.47 days) for the heparin CVC
group. . Mean, total costs were £15,588, £16,933 and £16,722, respectively, and did not differ with
respect to ICU/HDU (p=0.46) or total cost (p=0.71).
53
1115
1116
1117
1118
1119
1120
1121
1122
1123
1124
1125
1126
1127
1128
1129
1130
1131
1132
1133
1134
1135
1136
1137
1138
1139
1140
1141
1142
1143
1144
Patients randomised to antibiotic-impregnated CVC spent 10.8 days (95% CI, 9.3, 12.4) in PICU in the
6 months following randomisation, compared with 9.9 days (95% CI 8.6, 11.4) for those in the
heparin-bonded CVC group and 10.5 days (95% CI 9.2, 11.9) for standard CVC (Table 14). There were
no significant differences in lengths of stay between groups, either in PICU (p=0.70), HDU (p=0.43),
or ward (p=0.52). The total days of hospital stay in the 6 months after randomisation were 34.8 days
(95% CI 31.2, 38.5) for antibiotic CVC, 31.4 days (95%CI 28.2, 34.7) for heparin-bonded CVC and 31.7
(95% CI 28.8, 34.8) for the standard CVCs group. The 6 most significant HRGs (of 349 in total)
accounted for 50% of ward costs. These related to congenital or other cardiac surgery and lower
respiratory tract disorders.
Total and disaggregated costs are presented in Table 15. The mean 6-month costs were £44,503
(median £28,952; range £1,786, £360,983; 95% CI £40,619, £48,666) for standard CVCs, £45,663
(median £29,793; range £2,189, £442,365; 95% CI £41,647, £50,009) for antibiotic-impregnated
CVCs and £42,065 (median £27,621; range £2,638, £382,431; 95% CI £38,322, £46,110) for heparin
CVCs (Figure 5). These costs were not statistically significantly different among intervention groups
(p=0.46); or when disaggregated according to bundled costs (p=0.43) and unbundled costs (p=0.73).
Incremental costs
Mean, unadjusted costs over the 6-month timeframe were not significantly different by CVC, but
tended to be higher (by £1,160; 95% CI -£4,743, £6,962) for antibiotic compared with standard CVCs,
and tended to be lower (-£2,439; 95% CI -£8,164, £3,359) for heparin compared with standard CVCs.
Randomisation ensured that all variables tested for the cost regression were well balanced between
intervention groups. Only a small proportion (<10%) of the residual variability in total cost could be
explained by the significant independent predictor variables: natural logarithm (ln) of age (in days),
natural logarithm of 6-month pre-randomisation costs, health status before PICU admission, reason
for admission, whether immune compromised, and admission type (elective or emergency; Table
16). The adjusted incremental costs associated with the antibiotic and heparin CVC groups, in
relation to standard CVCs, were £1,220 (95% CI -£4,332, £6,773) and -£2,399 (95% CI -£7,914,
£3,120), respectively, resulting in small improvements in precision.
Value of healthcare resources associated with BSI
Over 6 months, patients who had experienced a BSI (n=42) experienced 6.5 more days (95% CI 1.4 to
11.6) in PICU than those with no BSI (n=1,443), and 15.1 additional total days (95% CI 4.0 to 26.2) of
hospitalisation. Unadjusted mean 6-month cost for patients with a BSI was £60,481 (n=42, 95% CI
£47,873, £73,809) and without was £43,578 (n=1,443, 95% CI £41,185, £45,970), a difference of
54
1145
1146
1147
1148
1149
1150
1151
1152
1153
1154
1155
1156
1157
1158
1159
1160
1161
1162
1163
1164
1165
1166
1167
1168
1169
1170
1171
1172
1173
1174
1175
1176
£17,263 (95% CI -£3,076, £31,450). The regression-derived adjusted difference in cost, representing
the value of the resources used to manage BSI, was £10,975 (95% CI -£2,801, £24,751) (Table 17).
Outcomes
Seven of 486 children randomised to antibiotic CVCs experienced a BSI, compared with 17/497 in the
heparin CVC group and 18/502 in the standard CVC group. A statistically significant absolute risk
difference was found only for antibiotic versus standard CVCs (-2.15%; 95% CI -4.09, -0.20).
Compared with standard CVCs, the unadjusted odds of acquiring a BSI with an antibiotic CVC was
0.39 (95% CI 0.16, 0.95, p=0.04) and 0.95 (95% CI 0.49, 1.87, p=0.89) for heparin CVCs.
Incremental and uncertainty analysis
As heparin CVCs were shown not to be clinically effective when compared to standard CVCs there is
no case for an incremental analysis: a clinically ineffective intervention cannot be cost-effective by
the same measure of BSI. The calculation of the incremental cost-effectiveness ratio was therefore
limited to the comparison of antibiotic and standard CVCs which resulted in an ICER of £54,057 per
BSI averted (Table 18).
The cost-effectiveness acceptability curve yielded the probabilities of antibiotic CVCs being cost-
effective at (arbitrary) thresholds of £10,000, £50,000 and £100,000 per BSI averted, as 0.38, 0.49
and 0.62, respectively (Figure 6). The probability of antibiotic CVCs dominating standard CVCs was
estimated as 0.35.
Sensitivity analysis
The mean number of days in hospital during the index hospitalisation was substantially shorter (e.g.
22.1 days for antibiotic CVCs) than during the 6 months from randomisation (e.g. 34.8 days for
antibiotic CVCs; see Tables 19 and 14). Considering only the index hospitalisation, total costs tended
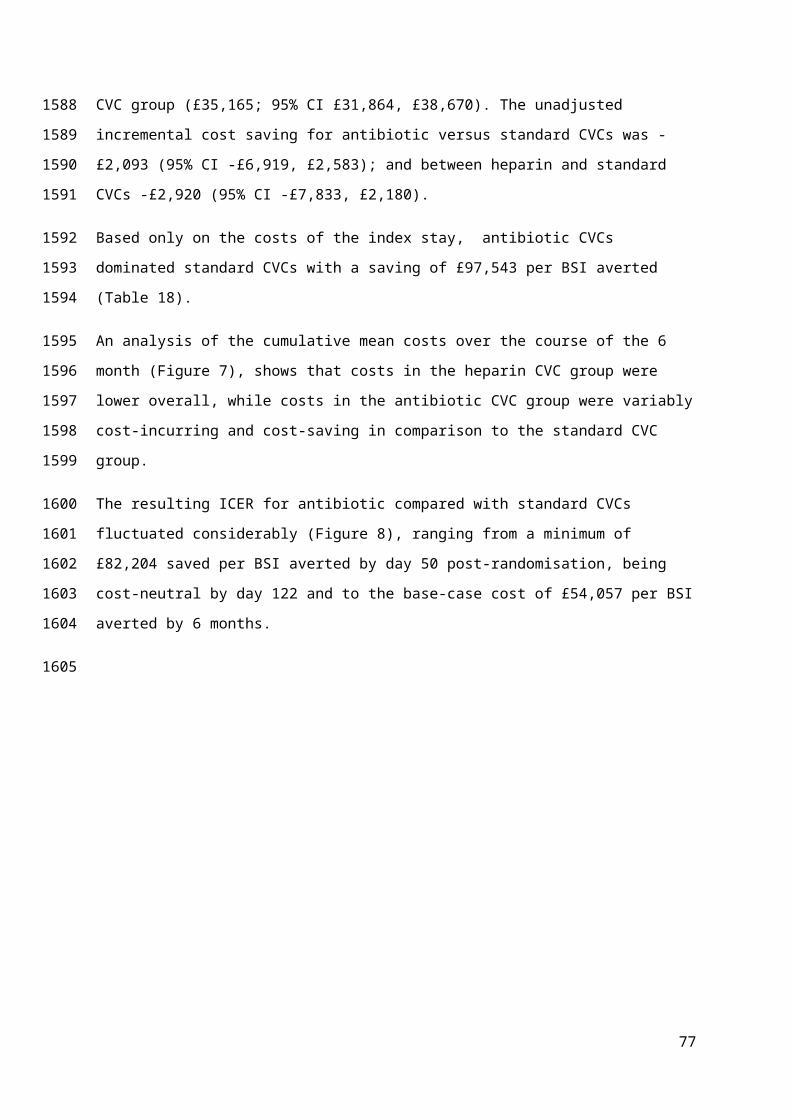
to be lower in the antibiotic CVC group (£33,073; 95% CI £30,047, £36,337) and in the heparin CVC
group (£32,245; 95% CI £29,013, £35,823) compared with the standard CVC group (£35,165; 95% CI
£31,864, £38,670). The unadjusted incremental cost saving for antibiotic versus standard CVCs was -
£2,093 (95% CI -£6,919, £2,583); and between heparin and standard CVCs -£2,920 (95% CI -£7,833,
£2,180).
Based only on the costs of the index stay, antibiotic CVCs dominated standard CVCs with a saving of
£97,543 per BSI averted (Table 18).
55
1177
1178
1179
1180
1181
1182
1183
1184
1185
1186
1187
1188
1189
1190
1191
1192
1193
1194
1195
1196
1197
1198
1199
1200
1201
1202
1203
1204
1205
An analysis of the cumulative mean costs over the course of the 6 month (Figure 7), shows that costs
in the heparin CVC group were lower overall, while costs in the antibiotic CVC group were variably
cost-incurring and cost-saving in comparison to the standard CVC group.
The resulting ICER for antibiotic compared with standard CVCs fluctuated considerably (Figure 8),
ranging from a minimum of £82,204 saved per BSI averted by day 50 post-randomisation, being cost-
neutral by day 122 and to the base-case cost of £54,057 per BSI averted by 6 months.
56
1206
1207
1208
1209
1210
1211
1212
Table 12: Unit cost for intensive care and high dependency care, based on HRGs from the National Schedule tariff (2012-13) HRG code
HRG name Primary description
Secondary description Cost per day
XB01Z
Paediatric Critical Care, Intensive Care, ECMO/ECLS
Highly specialised intensive care treatment e.g. by extra-corporeal membrane oxygenation (ECMO)
ECMO, VAD and other highly complex procedures
£4,391
XB02Z
Paediatric Critical Care, Intensive Care, Advanced Enhanced
Unstable multi-system failure with other complications
£2,409
XB03Z
Paediatric Critical Care, Intensive Care, Advanced
Intensive nursing supervision at all times, undergoing complex monitoring and/or therapeutic procedures, including advanced respiratory support
Invasive ventilation with multi-system failure
£2,017
XB04Z
Paediatric Critical Care, Intensive Care, Basic Enhanced
Intensive ventilation with more than one system failure
£2,110
XB05Z Paediatric Critical
Care, Intensive Care, Basic
Continuous nursing supervision
Invasive ventilation with single system failure or non-invasive ventilation with more than one system failure
£1,743
XB06Z
Paediatric Critical Care, High Dependency, Advanced
Require closer observation and monitoring than is usually available on an ordinary children’s ward, with higher than usual staffing levels
Non-invasive ventilation (e.g. CPAP and BIPAP by mask with IV drugs)
£1,335
XB07Z
Paediatric Critical Care, High Dependency
Close monitoring, oxygen by mask, no invasive ventilation
£886
XB08Z Paediatric Critical
Care, Transportation
Since paediatric critical care facilities are centralised in a small number of hospitals providing expert specialist care, specialist transport teams are required to deliver clinical management during transfer of patients
£2,799
XA01Z
Neonatal Critical Care, Intensive Care
Care provided for babies who are the most unwell or unstable and have the greatest needs in relation to staff skills and staff to
Baby receives any form of mechanical respiratory support via a tracheal tube and/or parenteral nutrition.
£1,118
57
12131214
patient ratios
58
1215
Table 13: Hospital ward bed-day rates as provided by hospital finance departments and adjusted for inflation (£ sterling, 2013)
Hospital HES hospital ID
Market Forces Factora
Ward Rateb
Birmingham Children's Hospital
RQ3 1.05 £290
Bristol Hospital for Sick Children
RA7 1.08 £366
Evelina Children's Hospital RJ1 1.28 £595c
Freeman Hospital RTD 1.04 £595c
Alder Hey RBS 1.04 £364d
Glenfield Hospital RWE 1.04 £751
Great Ormond Street Hospital RP4 1.29 £2,157
Leeds General Infirmary RR8 1.05 £542
Leicester Royal Infirmary RWE 1.04 £751
Queens Medical Centre RX1 1.04 £374
Royal Brompton Hospital RT3 1.25 £370
Royal Victoria Infirmary RTD 1.25 £342
Southampton General Hospital
RHM 1.09 £212
St Mary's RYJ 1.24 £394
aused with HRGs only; b ward rate excludes ICU or HDU costs; c mean of series of wards provided by all hospitals except Alder Hey d mean of series wards provided by hospital
59
12161217
121812191220
Table 14: Patients' lengths of stay and count of dominant HRGs relating to inpatient stays, from randomisation to 6 months (including readmissions), according to place and intensity of care and by intervention group
Antibiotic Heparin Standard
Unit Mean (median) 95% CI Mean
(median) 95% CI Mean (median) 95% CI
Days on ICU 10.79 (5.00)9.28, 12.48 9.91 (5.00)
8.57, 11.44
10.50 (5.00)
9.17, 11.93
Paediatric Critical Care, Intensive Care, ECMO/ECLS (XB01Z) 0.31 (0.00) 0.07, 0.72 0.39 (0.00) 0.09, 0.80 0.41 (0.00) 0.17, 0.72Paediatric Critical Care, Intensive Care, Advanced Enhanced (XB02Z) 0.16 (0.00) 0.09, 0.26 0.12 (0.00) 0.09, 0.15 0.16 (0.00) 0.10, 0.26Paediatric Critical Care, Intensive Care, Advanced (XB03Z) 0.77 (0.00) 0.51, 1.05 0.62 (0.00) 0.43, 0.83 0.65 (0.00) 0.46, 0.87Paediatric Critical Care, Intensive Care, Basic Enhanced (XB04Z) 2.30 (0.49) 1.92, 2.72 2.69 (0.78) 2.09, 3.44 2.76 (0.00) 2.14, 3.54Paediatric Critical Care, Intensive Care, Basic (XB05Z) 6.96 (2.00) 5.65, 8.45 5.63 (2.00) 4.75, 6.59 6.40 (2.95) 5.42, 7.47Neonatal Critical Care, Intensive Care (XA01C) 0.29 (0.00) 0.10, 0.55 0.46 (0.00) 0.13. 1.03 0.11 (0.00) 0.04, 0.20
Days on HDU 2.00 (0.59) 1.48, 2.62 1.60 (0.59) 1.28, 1.99 1.73 (0.00) 1.44, 2.05Paediatric Critical Care, High Dependency, Advanced (XB06Z) 1.28 (0.00) 0.94, 1.70 1.09 (0.00) 0.80, 1.45 1.22 (0.00) 0.98, 1.49Paediatric Critical Care, High Dependency (XB07Z) 0.72 (0.00) 0.42, 1.16 0.51 (0.00) 0.40, 0.64 0.51 (0.00) 0.40, 0.64
Days on ward 22.01 (9.13)19.26, 24.80
19.85 (9.00)
17.40, 22.40
19.48 (8.57)
17.12, 21.94
Total days in hospital34.80
(20.00)31.21, 38.48
31.36 (17.00)
28.18, 34.65
31.72 (17.97)
28.75, 34.81
Count of non-PICU/HDU inpatient HRGsComplex Congenital Surgery (EA24Z) 100 103 109Intermediate Congenital Surgery (EA25Z) 68 70 72Major Complex Congenital Surgery (EA23Z) 45 39 37Cardiac Conditions with complication and comorbidity (PA23A) 109 102 74Lower Respiratory Tract Disorders without acute bronchiolitis with length of stay ≥1 day with complication and comorbidity (PA14C) 95 78 105
60
12211222
Implantation of Prosthetic Heart or Ventricular Assist Device (EA43Z) 2 2 4Other inpatient HRGs 1103 1055 964
61
1223
Table 15: Disaggregated and total costs (£) by intervention group from randomisation to end of the six-month timeframe
a National Schedule of Reference Costs 2012-2013; bTop 6 (of 349) HRGs ranked by cost, together contributing 50% of overall inpatient cost, c2012-2013 National Tariff HRGs <1% taken from bed day rates; dCosts supplied by CVC provider (Cook Medical).
63
122512261227
Table 16: Adjusted, total (6-month) costs: results of Ordinary Least Squares regression of total costs based on significant baseline variables
Variable Coefficient (£) 95%CI (£) p-
valueNatural logarithm of pre-randomisation cost
1444 602 2287 <0.001
Admission type 27,423 20,993 33,853 <0.001Intervention group (antibiotic) 1221 -4332 6773 0.67Intervention group (heparin) -2399 -7917 3120 0.39Prior health status (0=not healthy; 1=healthy)
-9974 -15,807 -4140 <0.001
Reason for admission (endocrine/metabolic)
-1921 -11,889 8048 0.71
Reason for admission (infection) -22,300 -32,609 -11,992 <0.001Reason for admission (neurological) -21,854 -32,780 -10,927 <0.001Reason for admission (oncology) 2641 -16,052 21,333 0.78Reason for admission (other) -3510 -14,355 7335 0.53Reason for admission (respiratory) -8289 -15,609 -968 0.03Reason for admission (trauma) -12,144 -26,764 2477 0.1Compromised immunity (yes/no) 8476 -1246 18,198 0.09Natural logarithm of age in days -236 -1300 828 0.66Constant 24,086 13,255 34,916 <0.001
AIC = 24.25; BIC = 2.89x10¹²; R2 = 0.092
64
1
12281229
1230
1231
Table 17: Value of healthcare resource associated with managing a BSI: results of Ordinary Least Squares regression for estimating the cost of BSI, with total costs as the dependent variable and univariately significant baseline explanatory variables
Variable Coefficient (£) 95% CI (£) p-value
Natural logarithm of pre-randomisation cost
1439 598 2281 0.001
Admission type 27,341 20,916 33,767 <0.001
Prior health status (0=not healthy; 1=healthy)
-9593 -15,440 -3745 0.001
Reason for admission (endocrine/metabolic)
-2005 -11,968 7959 0.693
Reason for admission (infection) -22,585 -32,896 -12,274 <0.001
Reason for admission (neurological) -21,648 -32,559 -10,736 <0.001
Reason for admission (oncology) 2335 -16,347 21,017 0.806
Reason for admission (other) -2948 -13,789 7894 0.594
Reason for admission (respiratory) -8170 -15,484 -856 0.029
Reason for admission (trauma) -12,412 -27,016 2192 0.096
ICER (versus standard) -£95,473per BSI averted b -a -
aAs heparin CVC was not deemed to be clinically effective in reducing BSI rates, it cannot be cost-effective by the same outcome measureb Cost-saving
Table 19: Patients' length of stay for hospitalisation episode from randomisation by intervention group
Antibiotic Heparin Standard
Unit Mean 95% CI Mean 95% CI Mean 95% CIDays on ICU 9.31 8.09, 10.70 8.93 7.71, 10.32 9.79 8.60, 11.03
Days on HDU 1.70 1.25, 2.25 1.39 1.09, 1.76 1.51 1.24, 1.80
Days on ward 11.13 9.19, 13.18 10.32 8.59, 12.18 10.79 9.03, 12.70Total days in hospital 22.14 19.48, 24.89 20.65 18.27, 23.16 22.09 19.76, 24.51
66
3
1237
1238123912401241
12421243
1244
1245
Figure 4: Flow diagram of the methods employed for the economic evaluation.
67
4
1246
1247
12481249
Figure 5: Ranking of total, 6-month costs by intervention group, indicating patients who experienced a bloodstream infection.
68
5
12501251
1252
1253
1254
Figure 6: Cost-effectiveness acceptability curve based on a 6 month time horizon presenting the probability of antibiotic and standard CVCs being cost-effective for given values of ceiling ratio expressed as cost per bloodstream infection (BSI) averted
Figure 7: Relation between total costs (cumulative) and time since randomisation, according to intervention group
69
6
125512561257
1258
12591260
1261
1262
Figure 8: Relation between the ICER for antibiotic CVC versus standard CVC, and time since randomisation. Positive ICERs are cost-incurring, negative values represent incremental savings per BSI averted
-100,000
-80,000
-60,000
-40,000
-20,000
0
20,000
40,000
60,000
80,000
0 20 40 60 80 100 120 140 160 180 200
Incr
emen
tal C
ost E
ffecti
vene
ss R
atio
(£ p
er B
SI a
vert
ed)
Time from Randomisation (Days)
70
7
126312641265
1266
1267
1268
1269
1270
1271
1272
1273
1274
1275
1276
CHAPTER 5 GENERALISABILITY STUDY
Introduction
CATCH was the largest trial in PICU to date, recruiting 1485 children within 14 PICUs in 12 NHS Trusts
in England, corresponding to 5% of children admitted to all PICUs in England and Wales during the
trial period (2010-2012). However, if antibiotic-impregnated CVCs were adopted, it is likely that
these CVCs would be bulk-purchased and used for all children requiring CVCs in PICU, not just
children like those in the trial. Decisions on whether to purchase antibiotic-impregnated CVCs
therefore need to take into account the generalisability of benefits to all children who need a CVC
and the cost-impact of purchasing the more expensive impregnated CVCs.
In terms of generalisability, trial populations may have different characteristics and outcomes from
those who receive the intervention in practice, for a variety of reasons.76 For CATCH, there were two
specific reasons why those recruited might differ from those likely to receive impregnated CVCs
outside the trial setting. Firstly, children recruited to CATCH were expected to require a CVC for
three or more days, and would therefore have a higher risk of BSI than those staying less than three
days. Secondly, the introduction of CVC care bundles and on-going improvements in infection
control in recent years have been associated with rapidly decreasing rates of BSI over the past
decade, meaning that the background BSI rate may be lower now than it was at the start of the
trial.33, 34
In terms of budget-impact, impregnated CVCs are approximately twice as expensive as standard
CVCs. However, additional costs might be outweighed by the number of BSIs averted through using
the more effective CVCs and the associated reduction in the use of healthcare resources.
We determined the generalisability of the CATCH trial findings by estimating risk-adjusted trends in
BSI for children expected to require CVCs in PICU, based on a data linkage study including children
not participating in CATCH.77 We determined the budget- and cost-impacts of adopting antibiotic-
impregnated CVCs for all children required CVCs in PICU by synthesising the following evidence: i)
the estimated risk of BSI using standard CVCs (derived from the data linkage study); ii) the number of
BSI potentially averted by using antibiotic-impregnated CVCs (based on the relative treatment effect
in the trial); iii) the additional costs associated with purchasing impregnated CVCs for all children
expected to require a CVC (numbers of CVCs based on PICU survey data); and iv) the value of the
healthcare resources associated with each BSI (from the CATCH cost-effectiveness analysis).
71
8
1277
1278
1279
1280
1281
1282
1283
1284
1285
1286
1287
1288
1289
1290
1291
1292
1293
1294
1295
1296
1297
1298
1299
1300
1301
1302
1303
1304
1305
1306
Methods
Rate of BSI using standard CVCs
Data sources
There is no single dataset from which the rate of BSI in PICUs across the NHS can be estimated for
children requiring standard CVCs. Linkage between the national laboratory surveillance system
coordinated by Public Health England (LabBase2) 78 and data from the Paediatric Intensive Care Audit
Network (PICANet) 56 has provided an enhanced dataset from which to estimate the baseline rate of
BSI.
Details of the data linkage study have been published elsewhere.77 Briefly, a combination of
deterministic linkage and a method called prior-informed imputation was used to identify PICANet
admission records that had a corresponding record of BSI in LabBase2.79, 80 A set of deterministic
rules based on agreement between NHS number, hospital number, first name, surname, date of
birth and postcode were used to identify unequivocal links. For the remaining records, match
probabilities were calculated based on date of birth, Soundex code for surname, sex and location
(laboratory and hospital). Match probabilities were used to inform imputation of values for
uncertain links using prior-informed imputation.79, 80 Five imputed datasets were produced and
analysed separately, with results combined using Rubin’s rules.81
The resulting linked dataset captured approximately 71% of all children aged <16 years, admitted to
20 of the 25 PICUs in England and Wales between March 2003 and December 2012 and is broadly
representative of the whole PICU population.82 As some PICUs used impregnated CVCs for some
patients, we restricted the linked dataset to children expected to require a standard CVC in PICUs in
England. Types of CVCs used for emergency and elective admissions at each PICU were derived from
responses to a PICU practice survey sent to a designated consultant at each PICU in 2009. Where no
response was obtained or the PICU was not included in the survey, we assumed that standard CVCs
were used.
Identifying children with CVCs
CVC use is not routinely captured for all admissions in PICANet, so we identified admissions likely to
have a CVC using a statistical model. We estimated the probability of CVC use for all admissions
based on a subset of individual-level audit data where CVC used was recorded. Presence of a CVC
was recorded for 2488 admissions as part of two audits: Great Ormond Street Hospital (January
2006 - December 2010) and Cambridge Addenbrooke’s Hospital (July 2009 - December 2009). We
72
9
1307
1308
1309
1310
1311
1312
1313
1314
1315
1316
1317
1318
1319
1320
1321
1322
1323
1324
1325
1326
1327
1328
1329
1330
1331
1332
1333
1334
1335
1336
1337
used a multivariable logistic regression model to predict the probability of CVC use for all
admissions, based on potentially predictive variables recorded in PICANet (e.g. use of vasoactive
agents, length of stay and other clinical factors). The best-fitting predictive model was chosen based
on Bayesian Information Criterion (BIC).
The internal validity of the model was assessed using bootstrapping, accounting for any model over-
fitting due to developing and testing the model in the same dataset.83-85 The external validity was
assessed using aggregate data from a further two PICUs. We identified the subset of admissions
most likely to have required a CVC using a probability cut-off based on the Youden index.86 Full
details of the predictive model are provided in Appendix 3.1.
Estimated BSI rates were based on the subset of admissions identified by the predictive model as
most likely to have received standard CVCs.
Case definition
We estimated CVC days at risk of BSI by assuming that for children expected to require a CVC, bed-
days in PICU were equivalent to CVC-days, i.e. that CVCs were inserted at admission and removed at
discharge from PICU. We defined an episode of BSI as any positive blood culture isolated from a
blood sample taken from two days after admission to two days after discharge from PICU. Repeated
samples with positive cultures of the same organism within 14 days were treated as the same
episode.
Statistical analysis
Rates of BSI per 1000 CVC-days were modelled using multi-level Poisson regression. We accounted
for clustering of admissions within PICUs by including a random effect for PICU. Appropriateness of
the Poisson model was verified using a goodness-of-fit test based on the deviance statistic. For
comparisons between units and over time, rates were adjusted for risk-factors identified as being
significant (p<0.05). Likelihood-ratio tests were used to identify significant interactions between risk-
factors.
We compared BSI rates using standard CVCs for CATCH participants and non-participating
admissions expected to require a CVC, and BSI rates for admissions in the same PICUs but not
expected to require a CVC. For non-participating PICUs, the trial period was defined as the period
between December 2010 (when the first PICU began recruiting) and December 2012 (when the last
PICU stopped recruiting).
73
10
1338
1339
1340
1341
1342
1343
1344
1345
1346
1347
1348
1349
1350
1351
1352
1353
1354
1355
1356
1357
1358
1359
1360
1361
1362
1363
1364
1365
1366
1367
Number of BSI averted using antibiotic CVCs
We estimated the difference in the number of BSI if antibiotic CVCs were used in place of standard
CVCs. We asked PICUs to provide the percentage of emergency and elective admissions receiving
CVCs within a second PICU practice survey conducted in 2012.32 The number of admissions requiring
CVCs in all 23 PICUs in England was then estimated by applying these percentages to the number of
emergency and elective admissions within each PICU. The total number of CVC-days was estimated
by multiplying the number of CVCs required by the mean CVC-days for children expected to require
CVCs in PICANet.
We estimated the BSI rate using antibiotic CVCs in place of standard CVCs by applying the relative
treatment effect (rate-ratio) from the trial to the BSI rate using standard CVCs.
We assumed that the relative treatment effect would be the same regardless of the baseline rate of
BSI, i.e. that the effect would be the same for children who would have been ineligible for the trial
because they were expected to stay <3 days in PICU. We reasoned that the biological mechanism
through which impregnated CVCs work is the same for low and high-risk patients (impregnated CVCs
reduce the chance that bacteria track internally or externally along the CVC from the insertion site).
Randomised controlled trials of impregnated CVCs show similar results for long- and short-term
CVCs, suggesting that effect is not modified in groups with different baseline risk or length of stay.3 In
reality, 72% of children recruited in CATCH required a CVC for 3 or more days.
Budget-impact: additional costs of antibiotic CVCs
Antibiotic CVCs are more expensive than standard CVCs: £73 versus £42 for double lumen CVCs; £79
versus £43 for triple lumen CVCs. Total additional costs with antibiotic CVCs were calculated by
multiplying the number of CVCs required by the maximum additional cost per CVC, i.e. £36. We
assumed, conservatively, that any change in PICU length of stay, nursing or other resources would
not impact on hospital budgets. The budget-impact was based on the additional costs of antibiotic
CVCs only.
Cost-impact: value of resources associated with managing BSI
Assuming that any differences in costs between arms were due to differences in the number of BSI,
the cost-impact analysis utilised the estimated difference in the 6-month risk-adjusted costs
between patients who had a BSI versus those who did not (£10,975 per BSI; 95% CI -£2801 to
£24,751) (cost-effectiveness analysis, Table 17).
The total number of BSI potentially averted was estimated by applying the BSI rate assuming all
children in 2012 had used either standard or antibiotic CVCs. The cost-impact (total value of
74
11
1368
1369
1370
1371
1372
1373
1374
1375
1376
1377
1378
1379
1380
1381
1382
1383
1384
1385
1386
1387
1388
1389
1390
1391
1392
1393
1394
1395
1396
1397
1398
1399
resources associated with managing BSI with standard CVCs) was calculated by multiplying the costs
per BSI by the estimated number of BSI averted if antibiotic CVCs were used instead of standard
CVCs.
Sensitivity analysis
We estimated the budget- and cost-impacts based on best and worst case scenarios for the total
number of CVCs required and the excess number of BSIs with standard versus antibiotic CVCs. We
also performed probabilistic sensitivity analysis using Monte Carlo simulation to reflect uncertainty
in both costs and BSI. Values for each parameter were sampled from probability distributions based
on observed data and 5000 iterations were performed to provide a 95% uncertainty interval for the
cost-impact.87
Results
Rate of BSI using standard CVCs
Of the 2488 admissions in the CVC audit data, 1431 (58%) required a CVC. The best fitting prediction
model included length of stay, vasoactive agent, admission from ward, renal support and invasive
ventilation (see Appendix 3.3). With a probability cut-off of 0.57, the sensitivity of the predictive
model for capturing admissions requiring a CVC was 61%; specificity was 82%; positive predictive
value was 82% and negative predictive value was 61%. The predictive model identified 80% of the
CATCH admissions as requiring a CVC.
Survey responses for the type of CVCs used prior to CATCH were obtained for 18 of the 23 PICUs in
England (see Appendix 3.2). Only two PICUs reported not using standard CVCs for any admissions
(both used heparin CVCs). BSI rates were estimated based on linked data from the remaining 16
English PICUs.
Applying the predictive model to the 16 PICUs in the linked dataset identified a subset of 21,381
admissions most likely to have received standard CVCs between 2003-2012. Characteristics of these
admissions (based on PICANet data) are provided in Appendix 3.4. Risk-adjusted rates of BSI using
standard CVCs decreased steadily between 2003 and 2012, and were greater for CATCH PICUs (5.27;
95% CI 5.06-5.49 per 1000 CVC-days in 2012) compared with non-participating PICUs (2.09; 95% CI
1.60-2.58 in 2012; Figure 9). Of the subset of admissions predicted to receive a CVC in 2012,
103/3021 (3.4%) experienced BSI, corresponding to an overall BSI rate using standard CVCs of 4.58
(95% CI 4.42, 4.74) per 1000 CVC-days (Table 20). This was non-significantly lower than the rate
observed during the trial (8.24; 95% CI 4.7-11.8 per 1000 CVC days; Table 8), partially due to the
75
12
1400
1401
1402
1403
1404
1405
1406
1407
1408
1409
1410
1411
1412
1413
1414
1415
1416
1417
1418
1419
1420
1421
1422
1423
1424
1425
1426
1427
1428
1429
1430
inclusion of all children with CVCs (not just those requiring CVCs for 3 or more days). Further
explanation for this difference are potentially incomplete reporting of BSI to the national infection
surveillance system, use of bed days instead of CVC days in the estimated rate, or increased
frequency of sampling in trial PICUs during CATCH.
Number of BSI averted using antibiotic CVCs
Survey responses indicated that on average, 60% of emergency admissions and 50% of elective
admissions require CVCs (see Appendix 3.2). The estimated number of children using CVCs in 2012
was 8831, corresponding to a total of 85,971 CVC-days. The rate-ratio of BSI for impregnated versus
standard CVCs was estimated as 0.40 (95% CI 0.17, 0.97; Table 9) in the trial. The point estimate of
the number of BSI averted switching from standard to antibiotic CVCs for all children requiring CVCs
in 2012 was therefore 232, with best and worst case scenarios of 338 and 11 respectively (Table 21).
Budget-impact: additional costs of antibiotic CVCs
Based only on a CVC cost difference of £36, the additional cost of purchasing antibiotic CVCs for all
children in 2012 was 8831 x £36 = £317,916.
Cost-impact: value of additional costs associated with managing BSI
Based on each BSI being associated with a mean cost of £10,975 (95% CI -£2,801, £24,751; Table 17).
over 6 months, the value of resources made available in 2012 through averting BSI with standard
CVCs (i.e. the total costs of managing these BSIs) would have been 232 x £10,975 = £2,541,397, with
best and worst case scenarios of -£925,583 and £8,205,414 based on confidence intervals for both
estimates. The probabilistic sensitivity analysis provided a 95% uncertainty interval of -£66,544 to
£5,557,451 for total resources made available through averting BSI in 2012. There was a probability
of 0.90 that the values of resources made available would be more than the additional costs of
purchasing antibiotic CVCs (Figure 10).
The estimated cost-impact for a typical PICU with 350 admissions per year is shown for a range of
BSI rates in Table 21. Figure 11 shows that costs of purchasing antibiotic CVCs for all children who
require them will be less than costs of managing BSI with standard CVCs for PICUs with BSI rates
above 1.2 per 1000 bed-days. This break-even value is substantially lower than the BSI rate observed
in the standard arm of the trial (8.24; 95% CI 4.7-11.8 per 1000 bed days), or the linked dataset for
PICUs in England (4.58; 95% CI 4.42, 4.74).
76
13
1431
1432
1433
1434
1435
1436
1437
1438
1439
1440
1441
1442
1443
1444
1445
1446
1447
1448
1449
1450
1451
1452
1453
1454
1455
1456
1457
1458
1459
1460
Table 20: Parameter estimates for cost-impact analysis and sensitivity analysis Variable Base case Source Sensitivity
analysis
BSI rate using standard CVCs in 2012
4.58(95% CI 4.42-4.74)
3021 admissions in 15 PICUs:Subset of admissions identified as most likely to have received standard CVCs by applying predictive model to linked dataset. Admissions identified by survey responses as receiving non-standard (heparin or antibiotic) CVCs were excluded.
Random sample taken with replacement from linked dataset, for the number of admissions expected to require CVCs.
Rate ratio 0.40(95% CI 0.17-0.97)
Trial clinical effectiveness analyses (Table 9)
Ln* N (-0.913, 0.415)
Estimated BSI rate using antibiotic CVCs in 2012
1.83worst case = 4.29best case = 0.81
Rate-ratio from the CATCH trial applied to estimated BSI rate using standard CVCs for PICUs in England
Derived from i) BSI rate using standard CVCs and ii) rate ratio
Number of admissions requiring CVCs in 2012
8831
Average survey estimates for the percentage of emergency (60%) and elective (50%) admissions requiring CVCs, applied to all admissions in PICANet in 2012 (15,739 admissions in 23 PICUs).
Emergency: Beta(60,40)Elective:Beta(50,50)
Number of CVC days in 2012 85,971
Average CVC-days per admission in subset of admissions identified as most likely to have received standard CVCs by applying predictive model to linked dataset, multiplied by number of admissions requiring CVCs in 2012.
Random sample taken with replacement from linked dataset, for admissions expected to require CVCs.
Number of BSI averted in 2012 232
BSI rates applied to CVC-days for admissions requiring CVCs in 2012
Derived from i) number of admissions requiring CVCs in 2012 and ii) estimated BSI rate using antibiotic CVCs
Additional cost of antibiotic CVCs £36
Difference in costs between standard (£43) and antibiotic (£79) CVCs (conservative case assuming triple lumen
Table 21: Cost impacted analysis of managing BSIs occurring with standard versus antibiotic CVCs with best and worst case scenarios* and hypothetical scenarios for a typical PICU with 350 admissions per year
BSI per 1000 CVC-days using
standard
CVCs
Rate ratio
BSI per 1000 CVC-days using
standard CVCs
N BSI with
standard
CVCs
N BSI with
antibiotic CVCs
BSI averted **
Cost-impact
Lower limit:
Cost per BSI: -£2801
Base case:Cost per
BSI: £10,975
Upper limit:
Cost per BSI:
£24,751Base case 4.58 0.40 1.83 385.9 154.4
231.6 231.6 231.6-
£648,606£2,541,39
7£5,731,40
1Worst case 4.42 0.97 4.29 372.5 361.3 11.2 11.2 11.2
-£31,297 £122,631 £276,559Best case 4.74 0.17 0.81 399.4 67.9
331.5 331.5 331.5-
£928,583 £3,638,415£8,205,41
4Hypothetical scenarios based on a typical PICU with 350 admissions per year
81* Best and worst case scenarios assume a total of 8831 CVCs required in PICUs in England during 2012 (based on survey responses).
** Positive values indicate the value of resources made available through averting BSI
79
16
14691470
1471
Figure 9: Risk-adjusted rates in bloodstream infection for children expected to have central venous catheters based on linked PICANet-Labbase2 data for 16 PICUs in England; symbols=observed rates; lines=smoothed adjusted rates (log-scale)
34
510
15
Rat
e pe
r 100
0 be
d-da
ys
2003q12004q1
2005q12006q1
2007q12008q1
2009q12010q1
2011q12012q1
2013q1
Quarter-year of admission
CATCH PICUs Non-participating PICUs
80
CATCH recruitment
period
17
147214731474
1475
1476
1477
1478
1479
1480
1481
1482
1483
1484
1485
1486
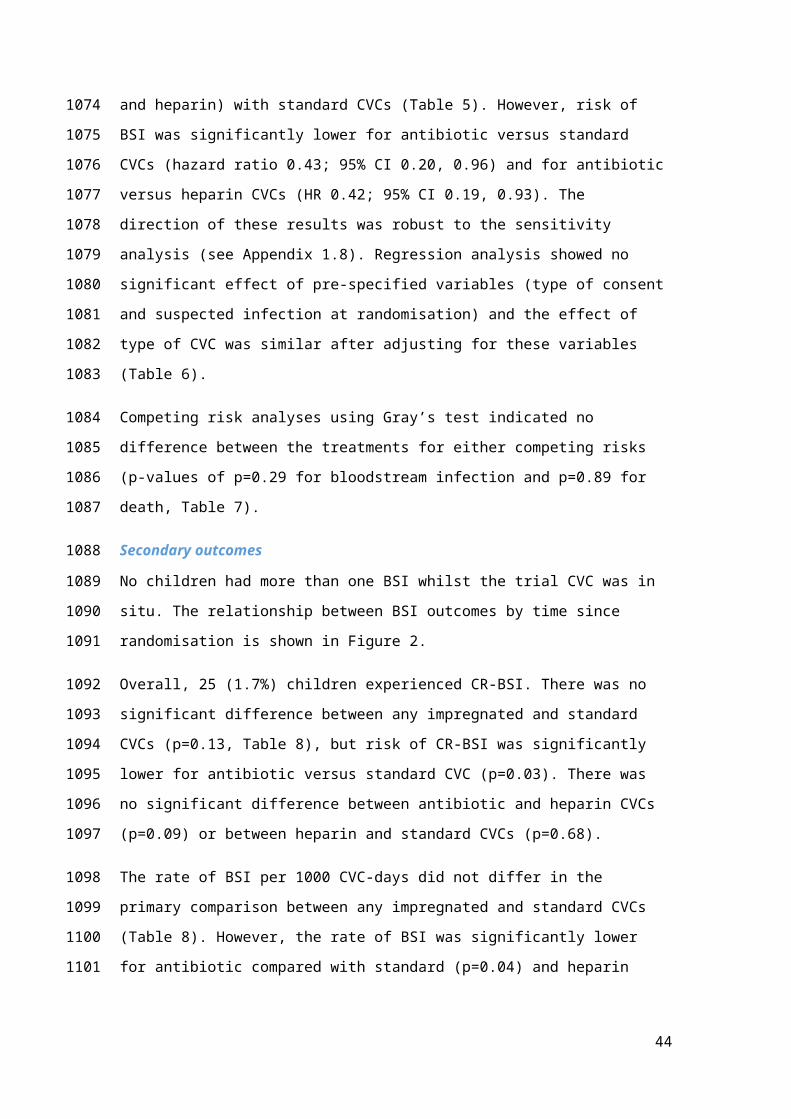
Figure 10: Probability distribution for the value of resources made available by averting BSI using antibiotic CVC in all PICUs in England during 2012, 90% of the distribution represented costs greater than the additional cost of purchasing antibiotic CVCs
1.0e
-04
2.0e
-04
Den
sity
-5000 0 5000 10000
Value of resources made available by averting BSI using antibiotic CVCs(£ thousands)
81
Additional cost of antibiotic CVCs
=£317,916
18
148714881489
1490
1491
1492
1493
1494
1495
1496
1497
1498
1499
1500
1501
1502
1503
1504
1505
Figure 11: Cost-impact: Number of BSI averted and value of resources made available using antibiotic in place of standard CVCs for a range of baseline rates, assuming each BSI is associated with a mean cost of £10,975
82
BSI rate using standard CVCs in all PICUs 2012
Break-even BSI rate: 1.2
19
1506
150715081509
1510
1511
1512
CHAPTER 6 DISCUSSION
Introduction
We aimed to inform NHS policy regarding impregnated CVCs for intensive care of children. In order
to address the question of whether impregnated CVCs should be adopted by PICUs in England and
Wales, we undertook a large pragmatic randomised controlled trial to determine the clinical
effectiveness and cost-effectiveness of impregnated versus standard CVCs. To determine the
implications of adopting impregnated CVCs for all children who need them, we conducted a
generalisability and cost-impact study, using linked data from two national sources.
Clinical effectiveness
The primary analysis showed no evidence of a statistically significant difference between time to first
BSI for any impregnated CVCs (antibiotic-impregnated or heparin-bonded combined) versus
standard CVCs. However, secondary analyses showed that antibiotic-impregnation reduced the risk
of BSI by 57% compared with standard CVCs, and by 58% compared with heparin-bonded CVCs.
Antibiotic-impregnated CVCs were associated with an absolute risk reduction of 2.15% compared
with standard CVCs, meaning 47 children would need to be treated with an antibiotic-impregnated
CVC instead of a standard CVC to prevent one case of BSI.
Our choice of any BSI as a clinically important primary outcome and a recognised quality indicator is
an important strength of our study, avoiding the biases inherent in measuring CR-BSI.3, 46, 88, 89 CR-BSI
requires positive cultures from the blood and catheter tip and is highly susceptible to bias, as the tip
can be easily contaminated during removal and residual antibiotic in the catheter tip may inhibit
culture in the laboratory.54, 88
A further strength of the study is the restriction to positive blood cultures that were clinically
indicated. This increased the clinical relevance of the primary outcome, but diminished the
sensitivity of the study to detect bacteraemia, as only 40% of children had a blood culture taken in
the relevant time window. A third strength is the representativeness of the study population in
terms of children admitted to the 14 largest PICUs (of 23) across the country. We were able to enrol
a similar proportion of emergency patients (two-thirds) as seen in practice, enabled by the inclusion
of retrieved children and the use of deferred consent.90
Potential limitations are firstly, the fact that clinicians inserting the CVCs could not be blinded to
allocation. However, we found no evidence of differential sampling by trial arm (Figure 1). The
83
20
1513
1514
1515
1516
1517
1518
1519
1520
1521
1522
1523
1524
1525
1526
1527
1528
1529
1530
1531
1532
1533
1534
1535
1536
1537
1538
1539
1540
1541
1542
number of children who received their allocated CVC was slightly higher for those in the standard
arm, probably reflecting the fact that standard CVCs were the default CVC used in many units.32
Secondly, due to the lower than expected BSI rate in the standard arm of the trial, we had limited
power to detect differences in the primary outcome comparing impregnated versus standard CVCs.
This choice of primary outcome was justified by the best available evidence to date – a systematic
review and meta-analysis of direct and indirect comparisons of different types of impregnated and
standard CVCs – which showed that heparin-bonded and antibiotic-impregnated CVCs resulted in
similar reductions in the risk of CR-BSI (70-80%).1Thirdly, resistance testing was not standardised
across sites. This reflects local laboratory administration and processing, which centralised testing of
all positive cultures could have mitigated. Where reported, resistance occurred in all trial arms,
predominantly in gram negative isolates, as expected. The low rates are consistent with previous
lack of evidence for the emergence of resistance.2
Few previous trials have reported the effectiveness of impregnated CVCs for any BSI.45 However, the
superiority of antibiotic-impregnated CVCs in children was consistent with the most recent
systematic review reporting a pooled odds ratio for CR-BSI of 0.18 (95% CI 0.08-0.34).1 Although our
finding of a clinically important reduction in any BSI with antibiotic-impregnated CVCs (HR 0.25;
95%CI: 0.07, 0.09; p=0.04) was based on a secondary comparison and should be viewed as
exploratory, this result does add important evidence of the overall effectiveness of antibiotic-
impregnated CVCs.
The finding that heparin CVCs were not effective for BSI or CR-BSI contradicts past evidence showing
a pooled odds ratio for CR-BSI given heparin-bonded versus standard CVCs of 0.20 (95% CI 0.06-
0.44).1 The difference in findings may reflect poor data quality in previous trials, highlighted by
systematic reviews.43-45 Only one of the three trials comparing heparin with standard CVCs reported
adequate concealment of randomisation, and this trial did not state whether clinicians were blinded
to the intervention.3 A further explanation for the discrepancy may be the low baseline event rate
observed in CATCH, which was conducted after implementation of CVC care bundles in PICUs to
improve aseptic procedures during CVC insertion and maintenance.32 It is conceivable that heparin
CVCs are most effective in the context of high rates of surface colonisation, as they prevent
thrombosis which aids organism adherence to the CVC. Finally, the pair-wise comparisons used to
determine the most effective type of impregnation were not adequately powered to detect the
anticipated small differences between antibiotic and heparin CVCs. However, our results suggest
that antibiotic-impregnated CVCs can achieve further reductions in BSI rates, over and above that
achieved by CVC care bundles.33, 34
84
21
1543
1544
1545
1546
1547
1548
1549
1550
1551
1552
1553
1554
1555
1556
1557
1558
1559
1560
1561
1562
1563
1564
1565
1566
1567
1568
1569
1570
1571
1572
1573
1574
1575
Cost-effectiveness
The incremental cost-effectiveness ratio of antibiotic-impregnated CVCs versus standard CVCs was
£54,057 per BSI averted over the 6 months after randomisation. Assuming the health impact of a BSI
is no greater (on average) than a reduction of one year of full health (i.e. one QALY), then at the
cost-effectiveness threshold of £30,000 per QALY, antibiotic CVC may not represent a cost-effective
alternative to standard CVCs in a PICU setting. However, there is considerable uncertainty
surrounding this estimate, which is driven mainly by the time horizon of analysis.
The sensitivity analysis in which costs were restricted to the index hospital stay resulted in antibiotic
CVCs dominating standard CVCs, with £97,543 saved for each BSI averted. Antibiotic CVCs therefore
appear highly cost-effective when considering events and cost accruing over comparable periods.
A secondary analysis of the CATCH trial indicated that heparin CVCs were not clinically effective with
a risk difference for first BSI of -0.17 (95% CI, -2.45, 2.12) versus standard CVCs. It follows, therefore,
that heparin CVCs cannot be cost effective by the same measure. Theoretically, a cost minimisation
analysis might apply, to assess whether heparin CVCs are less costly overall than standard CVCs.
However, heparin CVCs are more expensive than standard CVCs (in terms of unit prices), and as the
only difference among CVCs can be in BSI rates, any difference in total cost (which was not
statistically significant) was due to random variation. A CMA might therefore lead to an erroneous
conclusion that heparin CVCs are more cost-effective than standard CVCs.
Our economic evaluation benefits from being conducted alongside a pragmatic clinical trial which is
representative of current practice in the UK PICU setting. The evaluation utilises data from a
definitive and unbiased comparison of impregnated and standard CVCs, which was conducted
robustly according to accepted methods of trial-based economic evaluations.74 We used patient-
level HES data to reflect the reimbursement costs for hospitals and multiple data source to measure
hospital use in order to ensure that cost data were complete.
However, there are limitations which affect the strength of our findings. First, the CATCH trial was
not powered to determine cost differences between each of the three CVCs. As a consequence,
results are susceptible to random variation in costs between trial arms. While hypothesis testing may
be considered less relevant to decision making in the context of net benefits, the non-statistically
significant differences in costs between groups translated to uncertainty in the joint distribution of
costs and benefits such that in the base-case analysis, antibiotic CVCs had a probability of 0.35 of
dominating standard CVCs.91 Mean total costs associated with heparin CVCs were lower than both
antibiotic and standard CVCs despite their ineffectiveness in avoiding BSI when compared with
85
22
1576
1577
1578
1579
1580
1581
1582
1583
1584
1585
1586
1587
1588
1589
1590
1591
1592
1593
1594
1595
1596
1597
1598
1599
1600
1601
1602
1603
1604
1605
1606
1607
standard CVCs. Being a rare event, BSI costs were diluted in overall costs relating to the intensive
care of patients.
Second, the economic evaluation did not consider quality-adjusted life-year (QALY), which is the
standard metric for informing decisions on resource allocation. This was because estimation of
utilities in paediatric ICU populations is empirically and conceptually challenging,92, 93 and the main
long-term consequence of BSI, the long-term impact on neurological outcomes, is poorly measured
in children and was not measured in the trial. Short-term outcomes not considered in our economic
analysis include mortality, antibiotic resistance and other adverse events. However, antibiotic
resistance to minocycline or rifampicin did not differ by CVC allocation. There were no differences in
30-day mortality for antibiotic versus standard (HR 0.96; 95% CI 0.61, 1.51) or for heparin versus
standard CVC (HR 0.65; 95% CI 0.40, 1.07) and no differences in adverse events (Table 10).
Assumptions regarding the time horizon of analysis represent a third limitation. The base-case, 6-
month analysis was selected to include the costs of hospital readmissions in addition to the index
hospitalisation and transfers that may have occurred subsequently. This was intended to capture the
costs of managing any longer-term complications from BSI, but as the economic outcome was
chosen to align with the primary clinical outcome, the health impacts of these complications were
not included in the ICER. Consequently, as costs accrue over time with no corresponding change to
the number of BSI (these all occurred within 30 days), the ICER continued to increase over time.
Our findings are consistent with other studies in the estimation of the costs associated with the
management of BSI, however our ICER differs considerably, and is inconclusive with regards to
determining the cost-effectiveness of antibiotic CVCs. Published economic evaluations, including
those which adopted a lifetime horizon of analysis, suggest dominance of antibiotic-impregnated
CVCs over standard CVCs. One explanation for this discrepancy is in the methods of analysis. A
decision analytic model, based on a synthesis of data from various sources is fundamentally different
from a prospective RCT in which differences between intervention groups are less evident,
particularly in the context of rare events such as BSI. In the evaluation by Hockenhull et al. for
instance, the incremental cost saving of £138.20 per patient receiving an impregnated CVC was
calculated as the additional cost of the antibiotic CVC less the expected cost per patient of managing
excess BSI.29 The equivalent calculation based on CATCH data for antibiotic CVCs results in a value of
£200.08 saved for each antibiotic CVC used {= (£78.28 – £42.91) - £10,975 x 2.15%}. Extending this
further, to calculate the ICER, gives a value of £9,326 saved per BSI averted {= £200.08 / 2.15%},
which differs appreciably from our base-case result. However, by analysing the data as a cohort
86
23
1608
1609
1610
1611
1612
1613
1614
1615
1616
1617
1618
1619
1620
1621
1622
1623
1624
1625
1626
1627
1628
1629
1630
1631
1632
1633
1634
1635
1636
1637
1638
1639
study, separating the apparent costs of BSI from the total costs relating to each intervention group,
biases are likely to arise from assuming that the cost of managing BSIs is independent of CVC type.
In conclusion, the results of the cost-effectiveness analysis indicate a policy of replacing standard
CVCs with antibiotic-impregnated CVCs in paediatric ICUs will be more beneficial in terms of fewer
patients developing BSI. Given the low BSI rate, the variation in costs between arms and the
sensitivity of analyses to the specified time-horizon, there remains considerable uncertainty as to
whether use of antibiotic CVCs represents a cost-effective use of NHS resources.
Generalisability and cost-impact
We explored the generalisability of CATCH trial results and the cost-impact of changing practice in
PICUs across England based on the trial results. In terms of generalisability, observed rates of BSI
using standard CVCs declined steadily over the past decade, including the period when children were
enrolled into the CATCH trial.34, 94 In addition, children participating in CATCH had a higher risk of BSI
than all children receiving CVCs in practice, as they were expected to require a CVC for 3 or more
days. This means that children currently receiving CVCs in PICU are likely to have a lower BSI risk
than those participating in the trial. This was reflected in the higher rate of BSI observed in the
standard arm of the trial (8.24 per 1000 bed days) compared with linked administrative data from 16
PICUs in England for 2012 (4.58 per 1000 bed days, Figure 9).
In terms of budget-impact, antibiotic CVCs are more expensive than standard CVCs. If adopted in
PICU, antibiotic CVCs would likely be bulk-purchased for all children (including those with a lower
risk of BSI than those participating in the trial). By estimating the number of BSI potentially averted
using antibiotic CVCs for all children (including those with low risk of BSI), we showed that the
additional cost of purchasing antibiotic CVCs is less than the value of resources associated with
managing excess BSIs associated with using standard CVCs.A limitation of this study was that
estimated BSI rates using standard CVCs relied on a predictive model for identifying children most
likely to have required CVCs. Another limitation was the possible error in estimating CVC-days: we
assumed that for children in the linked dataset likely to have required CVCs, CVCs would remain in
place for the entire PICU stay. There is no clear direction of bias as we may have over- or under-
estimated CVC-days, but our assumptions are reasonable based on the subset of CATCH participants.
Finally, we relied on survey responses to estimate the number of CVCs required in PICU, but we
addressed this and uncertainty in other parameter estimate by performing sensitivity analyses.95, 96
The generalisability of RCT results can be assessed by accounting for differences in subgroup
treatment effects, e.g. by re-weighting treatment effects based on population distributions.97, 98 In
87
24
1640
1641
1642
1643
1644
1645
1646
1647
1648
1649
1650
1651
1652
1653
1654
1655
1656
1657
1658
1659
1660
1661
1662
1663
1664
1665
1666
1667
1668
1669
1670
1671
CATCH, the event rate was low and there was limited power to assess variation in the treatment
effect according to the duration of CVC. However, due to the nature of the intervention, we assumed
that the treatment effect would be constant across groups and would be the same in children who
were not enrolled into the trial, as there was no a priori reason for an interaction.
Our results suggest that the benefits of using impregnated CVCs apply even for PICUs with BSI rates
as low as 1.2 per 1000 CVC-days. These finding are consistent with systematic review evidence on
the cost-effectiveness of impregnated CVCs in adults, which indicates that implementation of
impregnated CVCs would be cost-effective for a range of relative risks and for baseline incidence of
CR-BSI as low as 0.2%.29 CATCH is the first trial to assess the effectiveness of antibiotic-impregnated
versus standard CVCs in children, and our results adds to strong evidence of effectiveness in adults.
Furthermore, as our cost estimates only consider use of hospital resources, the true cost of BSI and
the benefits of antibiotic CVCs may be even greater when longer term outcomes of BSI are taken
into account.
Other conclusions
Deferred consent
There is a growing recognition of the need for better evidence in paediatric settings, as evidence in
adults cannot always be safely extrapolated to children.99, 100 However, achieving informed consent in
emergency paediatric settings is complicated by the stressful situation and the need to avoid any
delay in treatment.55, 101 As CATCH was one of the first UK studies to use deferred consent in children,
there was a lack of evidence on which to make decisions about the design and conduct of this aspect
of the trial.102, 103 Our experience of deferred consent in CATCH could help to inform future studies.
In CATCH, deferred consent was obtained from 84% of families who were approached.61 The use of
deferred consent allowed us to recruit emergency admissions, reach the target sample size within
the available funding, and provide results that are convincing to clinicians working in the emergency
setting. Participation in CATCH after the intervention had taken place represented minimal burden to
children (use of data already collected and follow-up data collection only). However, a proportion of
parents chose not to consent, due to a perceived burden on the child. Ongoing in-depth research as
part of the CONNECT study may help to explain further the experiences and choices of parents of
children involved in CATCH.55, 104
One of the main concerns relating to deferred consent in CATCH was whether the decision to
consent was related to the child’s outcome. The ethics committee recommended not approaching
families whose child had been discharged or transferred before the original approach for consent
88
25
1672
1673
1674
1675
1676
1677
1678
1679
1680
1681
1682
1683
1684
1685
1686
1687
1688
1689
1690
1691
1692
1693
1694
1695
1696
1697
1698
1699
1700
1701
1702
1703
could be made. Inclusion rates were also lower in the group of children who died. Although there
were no deaths related to the type of CVC in CATCH, the low rate of consent for children who died
could bias the validity of comparisons between treatment arm and outcomes, including adverse
events. We propose that in future, ethics committees allow use of linked administrative records
without consent, where reasonable efforts to obtain consent have been made or are not feasible or
considered to be harmful.61
There is still uncertainty about the most appropriate ways to approach bereaved parents of children
randomised in an emergency.105 Our experience with CATCH highlights that further in-depth research
should be incorporated into design of emergency trials involving populations with high mortality
rates.106, 107
Co-enrolment
Another challenge to improving evidence in paediatric settings is the limited population of children
who can be recruited into trials. CATCH was the largest RCT conducted in paediatric intensive care to
date, and overlapped with the second largest RCT (the CHiP trial), which recruited 1369 children in
13 centres.108 Allowing co-enrolment into several trials at the same time can potentially enable
efficient recruitment of children and has been successful in particular settings, e.g. for evaluating
AIDS treatments.88, 90, 109, 110 Aside from statistical concerns, perceived burden to the child, ethics
requirements and stress of recruiting into multiple trials are barriers to co-enrolment.111-114
Of five PICUs with the opportunity to recruit simultaneously to both CATCH and CHiP, only two units
decided to allow co-enrolment. Of the remaining three units, one delayed recruitment of elective
patients for CATCH until CHiP had closed, resulting in a loss of six recruiting weeks. Reasons provided
for not allowing co-enrolment related to concerns about jeopardising recruitment targets for the
earlier trial, asking too much of parents due to overwhelming amounts of information for two trials,
and the stressful situation of intensive care.112
On the other hand, we found that parents were accepting of co-enrolment: recruitment rates at the
same PICU were similar whether parents were approached for a single study (78% for CATCH; 51%
for CHiP) or both studies (82% for CATCH; 51% for CHiP). Concerns of the PICUs were therefore not
supported by evidence on parental decisions.115, 116
Our experience with CATCH highlighted that co-enrolment can be successful and acceptable, but
that barriers to co-enrolment remain. Decisions on the appropriateness of co-enrolment need to
take into account potential impact on results, interaction between therapies, safety, and internal
89
26
1704
1705
1706
1707
1708
1709
1710
1711
1712
1713
1714
1715
1716
1717
1718
1719
1720
1721
1722
1723
1724
1725
1726
1727
1728
1729
1730
1731
1732
1733
1734
and external validity. Strategies that allow increasing research capacity whilst minimising burden on
patients and parents should continue to be developed.
Administrative / electronic healthcare data to support RCTs
This study provides a convincing example of how administrative and electronic healthcare data can
be used to support and enhance RCTs.117 It would not have been possible to provide such
comprehensive information relating to the use of impregnated CVCs without the use of
administrative data, which contributed to all three aspects of the study:
1) Clinical effectiveness: trial participant data were linked with i) mortality data from the Office
for National Statistics to allow evaluation of deaths within 30 days of randomisation; ii)
PICANet data 56 to ascertain the primary diagnosis at admission and the Paediatric Index of
Mortality score (PIM2).
2) Cost-effectiveness: Hospital Episode Statistics (HES) and PICANet data were used to estimate
hospital, ICU and HDU costs up to 6 months after randomisation.
3) Generalisability and cost-impact: PICANet data linked with national laboratory surveillance
data were used to estimate rates of BSI outside of the trial setting.
There are other areas in which administrative and electronic healthcare data could be used to
enhance and support RCTs.117 Firstly, in terms of capturing outcomes, we used administrative data
up to six months post-randomisation. Ongoing linkage with administrative data could be useful to
many RCTs for capturing further long-term outcomes and safety measures.118
Secondly, the sample size calculation in CATCH was based upon audit data from several PICUs prior
to the trial. If PICANet and infection surveillance data had been linked prior to the study, even more
accurate event rates, taking into account the context of decreasing BSI rates, could have been made.
Using administrative data to identify variation in care across services and to aid site selection will
lead to more well-designed trials that are likely to meet targets and provide evidence more quickly.
Thirdly, we used administrative data collected during the trial period to assess the generalisability of
trial participants and to identify the population for whom impregnated CVCs may be purchased. This
could be extended post-trial, by monitoring the scaling-up of effective interventions and for
continued study of the safety and efficacy of new medicines and devices.
Barriers to realising the full potential for integrating administrative data into RCTs include concerns
about data quality, regulatory compliance, and ethical issues relating to consent for data linkage.
Decisions on the appropriateness of using administrative data should be made on a trial-to-trial
90
27
1735
1736
1737
1738
1739
1740
1741
1742
1743
1744
1745
1746
1747
1748
1749
1750
1751
1752
1753
1754
1755
1756
1757
1758
1759
1760
1761
1762
1763
1764
1765
basis. However, administrative data provides an opportunity to efficiently investigate short and long-
term effectiveness in real healthcare setting, to assess the broader impact of treatments across the
NHS, and to provide evidence on interventions to help implement improved treatments quickly for
those who would benefit most. The potential to improve quality and decrease the burden and cost
of RCTs is particularly important for the paediatric setting.99, 119, 120
Implications for practice
Our findings establish the effectiveness of antibiotic-impregnated CVCs compared with standard
CVCs for use in children. For the first time, we directly demonstrate that antibiotic-impregnated
CVCs are effective compared with heparin-bonded CVCs in this population. Use of impregnated CVCs
for children admitted to PICUs could result in clinically important reductions in BSI rates. The
benefits of antibiotic-impregnated CVCs apply even for low BSI rates and outweigh the current price
differential between impregnated and standard CVCs. However, uncertainty remains as to whether
antibiotic-impregnated CVCs represent a cost-effective use of NHS resources; careful monitoring of
implementation would help to build up further evidence.
Recommendations for future research
Implementation strategies to promote adoption of impregnated CVCs across the NHS should be
developed and could be monitored through continued linkage of electronic healthcare data and
information on PICU practice. Such monitoring could allow routine feedback to PICUs and could be
enhanced by routine capture of CVC insertion and removal dates in hospital records.
We do not recommend any further trials of antibiotic-impregnated or heparin-bonded CVCs versus
standard CVCs for children or adults in intensive care. However, further trials could be justified to
determine whether antibiotic CVCs would be similarly effective in preterm neonates (for whom
smaller line sizes are required, with potentially different mechanisms for BSI) or in those with long-
term CVCs (to determine whether the effect of impregnation remains for longer periods). The NHS
should work with industry to evaluate different types of impregnation for specific patient groups.
Use of linked administrative data should be considered for future trials of interventions in contexts
where outcomes are likely to change substantially over the lifetime of the trial, and to monitor
implementation of effective interventions.117
91
28
1766
1767
1768
1769
1770
1771
1772
1773
1774
1775
1776
1777
1778
1779
1780
1781
1782
1783
1784
1785
1786
1787
1788
1789
1790
1791
1792
1793
1794
REFERENCES1. Wang, H., et al., Effectiveness of different central venous catheters for catheter-related
infections: a network meta-analysis. J Hosp Infect, 2010. 76(1): p. 1-11.2. Falagas, M.E., et al., Rifampicin-impregnated central venous catheters: a meta-analysis of
randomized controlled trials. J Antimicrob Chemoth, 2007. 59(3): p. 359-369.3. Gilbert, R. and M. Harden, Effectiveness of impregnated central venous catheters for
catheter related blood stream infection: a systematic review. Curr Opin Infect Dis, 2008. 21(3): p. 235-245.
4. O'Grady, N., et al., Guidelines for the prevention of intravascular catheter-related infections. Am Acad Pediatr Policy, 2002. 110(5): p. e51-e74.
5. Pellowe, C., et al., The epic project. Updating the evidence-base for national evidence-based guidelines for preventing healthcare-associated infections in NHS hospitals in England: a report with recommendations. J Hosp Infect, 2005. 5(6): p. 10.
6. Raad, I., H. Hanna, and D. Maki, Intravascular catheter-related infections: advances in diagnosis, prevention, and management. Lancet Infect Dis, 2007. 7(10): p. 645-657.
7. Costello, J., et al., Risk factors for central line-associated bloodstream infection in a pediatric cardiac intensive care unit. Pediatr Crit Care Med, 2009. 10(4): p. 453-9.
8. Mello, M., et al., Risk factors for healthcare-associated infection in pediatric intensive care units: a systematic review. Cadernos de Saúde Pública, 2009. 25: p. 373-391.
9. Milstone, A.M. and A. Sengupta, Do prolonged peripherally inserted central venous catheter dwell times increase the risk of bloodstream infection? Infect Control Hosp Epidemiol, 2010. 31(11): p. 1184-1187.
10. Niedner, M.F., et al., Epidemiology of central line-associated bloodstream infections in the pediatric intensive care unit. Infect Control Hosp Epidemiol, 2011. 32(12): p. 1200.
11. Wylie, M.C., et al., Risk factors for central line–associated bloodstream infection in pediatric intensive care units. Infect Control Hosp Epidemiol, 2010. 31(10): p. 1049-1056.
12. Bhutta, A., et al., Reduction of bloodstream infections associated with catheters in paediatric intensive care unit: stepwise approach. BMJ, 2007. 334(7589): p. 362-365.
13. Miller, M.R., et al., Decreasing PICU catheter-associated bloodstream infections: NACHRI's quality transformation efforts. Pediatrics, 2010. 125(2): p. 206-213.
14. Pronovost, P., et al., Sustaining reductions in catheter related bloodstream infections in Michigan intensive care units: observational study. BMJ, 2010. 340(feb04 1): p. c309.
15. Bion, J., et al., ‘Matching Michigan’: a 2-year stepped interventional programme to minimise central venous catheter-blood stream infections in intensive care units in England. BMJ Qual Saf, 2012. 22(2): p. 110-23.
16. Department of Health, Saving Lives: reducing infection, delivering clean and safe care. 2007, Department of Health, London
17. Jeong, I.S., et al., Effect of central line bundle on central line-associated bloodstream infections in intensive care units. Am J Infec Control, 2013. 41(8): p. 710-716.
18. Pronovost, P., et al., An intervention to decrease catheter-related bloodstream infections in the ICU. New Engl J Med, 2006. 355(26): p. 2725-2732.
19. Reddy, K.K., et al., Reducing central line-associated bloodstream infections in three ICUs at a tertiary care hospital in the United Arab Emirates. Jt Comm J Qual Patient Saf, 2014. 40(12).
20. Zuschneid, I., et al., Reducing central venous catheter-associated primary bloodstream infections in intensive care units is possible: data from the German nosocomial infection surveillance system. Infect Control Hosp Epidemiol, 2003. 24(7): p. 501-505.
21. Abou Elella, R., et al., Impact of bloodstream infection on the outcome of children undergoing cardiac surgery. Pediatr Cardiol, 2010. 31(4): p. 483-489.
22. Elward AM, et al., Attributable cost of nosocomial primary bloodstream infection in pediatric intensive care unit patients. Pediatrics, 2005. 115(4): p. 868-872.
23. Lakshmi, K.S., et al., Study of nosocomial primary bloodstream infections in a Pediatric Intensive Care Unit. J Trop Pediatr, 2007. 53(2): p. 87-92.
24. Yogaraj JS, Elward AM, and Fraser VJ, Rate, risk factors, and outcomes of nosocomial primary bloodstream infection in pediatric intensive care unit patients. Pediatrics, 2002. 110(3): p. 481-485.
25. Dominguez, T.E., R. Chalom, and A.T.J. Costarino, The impact of adverse patient occurrences on hospital costs in the pediatric intensive care unit. Crit Care Med, 2001. 29(1): p. 169-174.
26. Nowak, J.E., et al., Reducing catheter-associated bloodstream infections in the pediatric intensive care unit: Business case for quality improvement. Pediatr Crit Care Med, 2010. 11(5): p. 579-587.
27. Slonim, A.D., et al., The costs associated with nosocomial bloodstream infections in the pediatric intensive care unit. Pediatr Crit Care Med, 2001. 2(2): p. 170-174.
28. Health Protection Agency, English national point prevalence survey on healthcare-associated infections and antimicrobial use, 2011. 2012, www.gov.uk/government/publications/healthcare-associated-infections-hcai-point-prevalence-survey-england (Accessed 06/10/14).
29. Hockenhull, J., et al., The clinical effectiveness and cost-effectiveness of central venous catheters treated with anti-infective agents in preventing bloodstream infections: a systematic review and economic evaluation. Health Technol Asses, 2008. 12(12): p. 1-154.
30. Lai, N.M., et al., Catheter impregnation, coating or bonding for reducing central venous catheter-related infections in adults. Cochrane Database Syst Rev, 2013. 6: p. CD007878.
31. Gilbert R, et al., Impregnated central venous catheters should be readily used to reduce risk of bloodstream infection. BMJ, 2013. 347.
32. Harron, K., et al., Consistency between guidelines and reported practice for reducing the risk of catheter-related infection in British paediatric intensive care units. Intens Care Med, 2011. 37(10): p. 1641-1647.
33. Harron K, et al., Risk-adjusted monitoring of blood-stream infection in paediatric intensive care: a data linkage study. Intens Care Med, 2013. 39(6): p. 1080-1087.
34. Harron, K., et al., Monitoring quality of care through linkage of administrative data: national trends in bloodstream infection in UK paediatric intensive care units 2003-2012. Crit Care Med, 2015. 43(5): p. 1070-78.
35. Chatzinikolaou, I., et al., Antibiotic-coated hemodialysis catheters for the prevention of vascular catheter–related infections: a prospective, randomized study. Am J Med, 2003. 115(5): p. 352-357.
36. Cox, E.G., et al., A randomized, controlled trial of catheter-related infectious event rates using antibiotic-impregnated catheters versus conventional catheters in pediatric cardiovascular surgery patients. Pediatr Infect Dis J, 2012.
37. Darouiche, R.O., et al., Comparison of antimicrobial impregnation with tunneling of long-term central venous catheters: a randomized controlled trial. Ann Surg, 2005. 242(2): p. 193.
38. Hanna, H., et al., Long-term silicone central venous catheters impregnated with minocycline and rifampin decrease rates of catheter-related bloodstream infection in cancer patients: a prospective randomized clinical trial. J Clin Oncol, 2004. 22(15): p. 3163-3171.
39. León, C., et al., Benefits of minocycline and rifampin-impregnated central venous catheters. Intens Care Med, 2004. 30(10): p. 1891-1899.
40. Marik, P.E., et al., The ex vivo antimicrobial activity and colonization rate of two antimicrobial-bonded central venous catheters. Critic Care Med, 1999. 27(6): p. 1128-1131.
41. Raad, I., et al., Central venous catheters coated with minocycline and rifampin for the prevention of catheter-related colonization and bloodstream infectionsa randomized, double-blind trial. Ann Intern Med, 1997. 127(4): p. 267-274.
42. Yücel, N., et al., Reduced colonization and infection with miconazole–rifampicin modified central venous catheters: a randomized controlled clinical trial. J Antimicrob Chemoth, 2004. 54(6): p. 1109-1115.
43. Abdelkefi, A., et al., Use of heparin-coated central venous lines to prevent catheter-related bloodstream infection. J Support Oncol, 2007. 5(6): p. 273-278.
44. Appelgren, P., et al., Surface heparinization of central venous catheters reduces microbial colonization in vitro and in vivo: results from a prospective, randomized trial. Crit Care Med, 1996. 24(9): p. 1482-1489.
45. Pierce, C.M., A. Wade, and Q. Mok, Heparin-bonded central venous lines reduce thrombotic and infective complications in critically ill children. Intens Care Med, 2000. 26(7): p. 967-972.
46. Geffers, C., et al., The relationship between methodological trial quality and the effects of impregnated central venous catheters. Intens Care Med, 2003. 29(3): p. 403-409.
47. Niel-Weise, B., T. Stijnen, and P. Van den Broek, Anti-infective-treated central venous catheters for total parenteral nutrition or chemotherapy: a systematic review. J Hosp Infect, 2008. 69(2): p. 114-123.
48. Mok, Q. and R. Gilbert, Interventions to reduce central venous catheter-associated infections in children: which ones are beneficial? Intens Care Med, 2011. 37(4): p. 566-568.
49. Mermel, L., Prevention of intravascular catheter–related infections. Ann Intern Med, 2000. 132(5): p. 391-402.
50. Barnett, A.G., et al., Using a longitudinal model to estimate the effect of Methicillin-resistant Staphylococcus aureus infection on length of stay in an intensive care unit. Am J Epidemiol, 2009. 170(9): p. 1186-1194.
51. Graves, N., et al., Estimating the cost of health care-associated infections: mind your p's and q's. Clin Infect Dis, 2010. 50(7): p. 1017-1021.
52. Halton, K. and N. Graves, Economic evaluation and catheter-related bloodstream infections. Emerging infectious diseases, 2007. 13(6): p. 815-823.
53. Cook Incorporated, Cook Spectrum® Central Venous Catheter Minocycline/Rifampin ANtibiotic Impregnated Power Injectable. 2013.
54. Mermel, L.A., S.M. Stolz, and D.G. Maki, Surface antimicrobial activity of heparin-bonded and antiseptic-impregnated vascular catheters. J Infect Dis, 1993. 167(4): p. 920-924.
55. Woolfall, K., et al., How experience makes a difference: practitioners' views on the use of deferred consent in paediatric and neonatal emergency care trials. BMC Med Ethics, 2013. 14(1): p. 45.
56. Paediatric Intensive Care Audit Network: A Decade of Data 2014, Universities of Leeds and Leicester.
57. Slater, A., F. Shann, and G. Pearson, PIM2: a revised version of the Paediatric Index of Mortality. Intens Care Med, 2003. 29(2): p. 278-285.
58. SAS software Version 9.3, SAS Institute Inc. 2002-2010: Cary, NC, USA 59. Gray, R.J., A class of K-sample tests for comparing the cumulative incidence of a competing
risk. Ann Stat, 1988. 16(3): p. 1141-1154.60. R Core Team, R: A language and environment for statistical computing. R Foundation for
Statistical Computing, Vienna, Austria. ISBN 3-900051-07-0. 2013.61. Harron, K., et al., Deferred consent for randomized controlled trials in emergency care
settings Pediatrics, 2015. in press.62. Halton, K.A., et al., Cost effectiveness of antimicrobial catheters in the intensive care unit:
addressing uncertainty in the decision. Crit Care, 2009. 13(2): p. R35.63. Frank, U., et al., Cost-effectiveness of an antiseptic-impregnated central venous catheter in
64. Marciante, K.D., et al., Which antimicrobial impregnated central venous catheter should we use? Modeling the costs and outcomes of antimicrobial catheter use. Am J Infect Control, 2003. 31(1): p. 1-8.
65. Shorr, A.F., C.W. Humphreys, and D.L. Helman, New choices for central venous catheters: potential financial implications. Chest, 2003. 124(1): p. 275-84.
66. Veenstra, D.L., S. Saint, and S.D. Sullivan, Cost-effectiveness of antiseptic-impregnated central venous catheters for the prevention of catheter-related bloodstream infection. JAMA, 1999. 282(6): p. 554-60.
67. Goudie, A., et al., Attributable cost and length of stay for central line-associated bloodstream infections. Pediatrics, 2014. 133(6): p. e1525-32.
68. Wilson, M.Z., et al., Attributable costs of central line-associated bloodstream infections in a pediatric hematology/oncology population. Am J Infect Control, 2014. 42(11): p. 1157-60.
69. Health & Social Care Information Centre. Data Linkage & Extract Service [cited 2014 8th June]; Available from: http://www.hscic.gov.uk/dles.
70. National Schedule of Reference Costs 2012-13. [cited 2014 8th June]; Available from: https://www.gov.uk/government/publications/nhs-reference-costs-2012-to-2013.
71. 2012-2013, N.T. [cited 2014 8th June]; Available from: https://www.gov.uk/government/publications/confirmation-of-payment-by-results-pbr-arrangements-for-2012-13
72. Fenwick, E., K. Claxton, and M. Sculpher, Representing uncertainty: the role of cost-effectiveness acceptability curves. Health Econ, 2001. 10(8): p. 779-87.
73. Mihaylova, B., et al., Review of statistical methods for analysing healthcare resources and costs. Health Econ, 2011. 20(8): p. 897-916.
74. Glick HA, D.J., Sonnad AA, Polsky D, Economic evaluaton in clinical trials. 2007, Oxford: Oxford University Press
75. Husereau, D., et al., Consolidated Health Economic Evaluation Reporting Standards (CHEERS) statement BMJ, 2013. 346: p. f1049.
76. Braunholtz, D.A., S.J. Edwards, and R.J. Lilford, Are randomized clinical trials good for us (in the short term)? Evidence for a “trial effect”. J Clin Epidemiol, 2001. 54(3): p. 217-224.
77. Harron, K., et al., Linkage, evaluation and analysis of national electronic healthcare data: application to providing enhanced blood-stream infection surveillance in paediatric intensive care. PLoS One, 2013. 8(12): p. e85278.
78. Wilson J, et al., Trends among pathogens reported as causing bacteraemia in England, 2004–2008. Clin Microbiol Infect, 2011. 17(3): p. 451-8.
79. Goldstein, H., K. Harron, and A. Wade, The analysis of record-linked data using multiple imputation with data value priors. Stat Med, 2012. 31(28): p. 3481-93.
80. Harron, K., et al., Evaluating bias due to data linkage error in electronic healthcare records. BMC Med Res Methodol, 2014. 14(1): p. 36.
81. Rubin, D., Multiple imputation for nonresponse in surveys. 1987, New York: Wiley.82. Harron, K., Evaluating data linkage techniques for the analysis of bloodstream infection in
paediatric intensive care. 2014, University College London.83. Steyerberg, E.W., et al., Internal validation of predictive models: efficiency of some
procedures for logistic regression analysis. J Clin Epidemiol, 2001. 54(8): p. 774-781.84. Steyerberg, E.W., et al., Prognostic modeling with logistic regression analysis: in search of
a sensible strategy in small data sets. Med Decis Making, 2001. 21(1): p. 45-56.85. Harrell, F., K.L. Lee, and D.B. Mark, Tutorial in biostatistics multivariable prognostic
models: issues in developing models, evaluating assumptions and adequacy, and measuring and reducing errors. Stat Med, 1996. 15: p. 361-387.
86. Fluss, R., D. Faraggi, and B. Reiser, Estimation of the Youden Index and its associated cutoff point. Biom J, 2005. 47(4): p. 458-472.
87. O’Hagan, A., et al., Incorporation of uncertainty in health economic modelling studies. Pharmacoeconomics, 2005. 23(6): p. 529-536.
88. Angus, D.C., J.P. Mira, and J.L. Vincent, Improving clinical trials in the critically ill. Crit Care Med, 2010. 38(2): p. 527.
89. Schierholz, J., et al., The antimicrobial efficacy of a new central venous catheter with long-term broad-spectrum activity. J Antimicrob Chemoth, 2000. 46(1): p. 45-50.
90. Dondorp, A.M., et al., Artesunate versus quinine in the treatment of severe falciparum malaria in African children (AQUAMAT): an open-label, randomised trial. Lancet, 2010. 376(9753): p. 1647-1657.
91. Claxton, K., The irrelevance of inference: a decision-making approach to the stochastic evaluation of health care technologies. J Health Econ, 1999. 18(3): p. 341-64.
92. Kerren, R., Pati S, Feudtner C., The generation gap; difference between children and adults pertinent to economic evaluations of health interventions. Pharmacoeconomics, 2004. 22: p. 71-81.
93. Tarride JE, B.N., Bischof M, Hopkins RB, Goeree L, Campbell K, Xie F, O'Reilly D, Goeree R, A review of health utilities across conditions common in paediatric and adult populations. Health and Quality of Life Outcomes 2010. 8.
94. Harron, K., et al., Risk of bloodstream infection in children admitted to paediatric intensive care units in England and Wales following emergency inter-hospital transfer. Intens Care Med, 2014. (in press).
95. Briggs, A., Probabilistic analysis of cost-effectiveness models: statistical representation of parameter uncertainty. Value Health, 2005. 8(1): p. 1-2.
96. Claxton, K., et al., Probabilistic sensitivity analysis for NICE technology assessment: not an optional extra. Health Econ, 2005. 14(4): p. 339-347.
97. Cole, S.R. and E.A. Stuart, Generalizing evidence from randomized clinical trials to target populations: The ACTG 320 Trial. Am J Epidemiol, 2010. 172(1): p. 107-115.
98. Stuart, E.A., et al., The use of propensity scores to assess the generalizability of results from randomized trials. J R Stat Soc Ser A Stat Soc, 2011. 174(2): p. 369-386.
99. Junker, A. and T. Klassen, Improving standards for paediatric clinical trials. Paed Child Healt - Can, 2011. 16(9): p. 539.
100. Hartling, L., et al., StaR Child Health: Developing evidence-based guidance for the design, conduct, and reporting of pediatric trials. Pediatrics, 2012. 129(Supplement 3): p. S112-S117.
101. Gamble, C., et al., What parents of children who have received emergency care think about deferring consent in randomised trials of emergency treatments: postal survey. PLoS One, 2012. 7(5): p. e35982.
102. Molyneux, S., et al., ‘The Words Will Pass with the Blowing Wind’: Staff and parent views of the deferred consent process, with prior assent, used in an emergency fluids trial in two african hospitals. PLoS One, 2013. 8(2): p. e54894.
103. Brierley, J. and V. Larcher, Emergency research in children: options for ethical recruitment. J Med Ethics, 2011. 37(7): p. 429-432.
104. Woolfall, K., et al., Doing challenging research studies in a patient-centred way: a qualitative study to inform a randomised controlled trial in the paediatric emergency care setting. BMJ Open, 2014. 4(5).
105. Jansen, T., et al., Deferred consent in emergency intensive care research: what if the patient dies early? Use the data or not? Intens Care Med, 2007. 33(5): p. 894-900.
106. Davies, H., et al., Guide to the design and review of emergency research when it is proposed that consent and consultation be waived. Emerg Med J, 2014. 0: p. 1-2.
107. Maitland, K., et al., Use of deferred consent for severely ill children in a multi-centre phase III trial. Trials, 2011. 12(1): p. 90.
108. Macrae, D., et al., A randomized trial of hyperglycemic control in pediatric intensive care. New Engl J Med, 2014. 370(2): p. 107-118.
109. Ellenberg, S.S., D.M. Finkelstein, and D.A. Schoenfeld, Statistical issues arising in AIDS clinical trials. JAMA, 1992: p. 562-569.
110. Maitland, K., et al., Mortality after fluid bolus in African children with severe infection. New Engl J Med, 2011.
111. Cook, D.J., et al., Enrollment of intensive care unit patients into clinical studies: A trinational survey of researchers' experiences, beliefs, and practices*. Crit Care Med, 2008. 36(7): p. 2100.
112. Harron, K., et al., Making co-enrolment feasible for randomised controlled trials in Paediatric Intensive Care. PLoS One, 2012. 7(8): p. e41791.
113. Myles, P.S., et al., Ethical and scientific considerations for patient enrollment into concurrent clinical trials. Trials, 2014. 15(1): p. 470.
114. Shilling, V., et al., Communication about children's clinical trials as observed and experienced: qualitative study of parents and practitioners. PLoS One, 2011. 6(7): p. e21604.
115. Burgess, E., et al., Consent for clinical research in the neonatal intensive care unit: a retrospective survey and a prospective study. Arch Dis Child Fetal Neonatal Ed, 2003. 88(4): p. F280.
116. Morley, C., et al., What do parents think about enrolling their premature babies in several research studies? Arch Dis Child Fetal Neonatal Ed, 2005. 90(3): p. F225.
117. Harron K, Gamble C, and Gilbert R, E-health data to support and enhance randomised controlled trials in the UK. Clinical Trials, 2014. (online first).
118. Ford, I., et al., Long-term follow-up of the West of Scotland Coronary Prevention Study. New Engl J Med, 2007. 357(15): p. 1477-1486.
119. Rawlins, A new pathway for the regulation and governance of health research. The Academy of Medical Sciences, 2011. . Available: http://www.acmedsci.ac.uk/p47prid88.html. Accessed 15 June 2012.
120. Stephenson, T., The medicines for children agenda in the UK. Brit J Clin Pharmaco, 2006. 61(6): p. 716-719.