0 TRAINING REPORT ON QUALITY ASSURANCE AND DESIGNING OF SOLAR PHOTOVOLTAIC SYSTEMS Submitted by: JATIN B-TECH (3 RD YEAR) ELECTRONICS AND COMMUNICATION ENGINEERING (ECE) DELHI TECHNOLOGICAL UNIVERSITY (DTU) FORMERLY DELHI COLLEGE OF ENGINEERING
Transcript
0
TRAINING REPORT ON
QUALITY ASSURANCE AND
DESIGNING OF SOLAR
PHOTOVOLTAIC SYSTEMS
Submitted by:
JATIN
B-TECH (3RD YEAR)
ELECTRONICS AND
COMMUNICATION
ENGINEERING (ECE)
DELHI TECHNOLOGICAL
UNIVERSITY (DTU)
FORMERLY DELHI
COLLEGE OF
ENGINEERING
1
ABSTRACT
This training report is an extract of lessons learned during training at Solar Lighting Lab, The Energy and
Resources Institute [TERI]. The report aims at explaining the basics and details of the engineering
involved in Solar Photovoltaic Systems.
The training report describes the work flow that is followed to get the project and within the
departments to complete the job. It highlights the main components of the Solar Lighting Lab including
the IV characteristic Test, Battery Test and Designing of Solar Photovoltaic Systems.
2
Acknowledgement
I would like to thank The Energy and Resources Institute (TERI) for giving me this opportunity for
undergoing this Internship programme.
I place on record and warmly acknowledge the continuous encouragement, invaluable supervision, timely
suggestions and inspired guidance offered by Mr. Richie Brian Stephen, Research Associate, Center for
Distributed Generation (CDG), TERI, in bringing this project report to a successful completion.
I wish to express my deep sense of gratitude and respects to Mr. Arvind Sharma, Research Fellow,
CDG, TERI, for stimulating discussions and constant encouragement during the course.
Solar Energy ............................................................................................................................................ 6
The Sun .................................................................................................................................................... 7
Solar Radiation in Space ........................................................................................................................ 8
Solar Radiation Outside the Earth's Atmosphere................................................................................ 9
Solar Radiation at the Earth's Surface ............................................................................................... 10
Absorption in the Atmosphere ............................................................................................................. 11
Direct and Diffuse Radiation Due to Scattering of Incident Light ................................................... 11
Effect of clouds and other local variations in the atmosphere .......................................................... 12
Air Mass ................................................................................................................................................. 12
Comparision Of Different PV Technologies ....................................................................................... 12
I-V Characteristics of solar PV module .............................................................................................. 17
Test outcomes ........................................................................................................................................ 19
Battery Test ............................................................................................................................................... 25
Test outcomes ........................................................................................................................................ 28
Solar simulator ...................................................................................................................................... 33
Classification of Solar Simulators: .................................................................................................. 33
Types of lamps ................................................................................................................................... 34
Temperature Compensation: ........................................................................................................... 35
System description: ........................................................................................................................... 35
Effect of temperature ............................................................................................................................ 35
Effect of Irradiance ............................................................................................................................... 36
Procedure with a solar simulator ........................................................................................................ 37
Calculation of temperature coefficients .............................................................................................. 37
Test Outcomes ....................................................................................................................................... 38
Experimental Data ................................................................................................................................ 39
Designing of Solar PV System .................................................................................................................. 45
Basic Principles to Follow When Designing a Quality PV System ................................................... 45
Basic Steps to Follow When Installing a PV System .......................................................................... 45
5
SYSTEM DESIGN CONSIDERATIONS .......................................................................................... 45
Grid-Interactive Only (No Battery Backup)................................................................................... 45
Grid-Interactive With Battery Backup ........................................................................................... 46
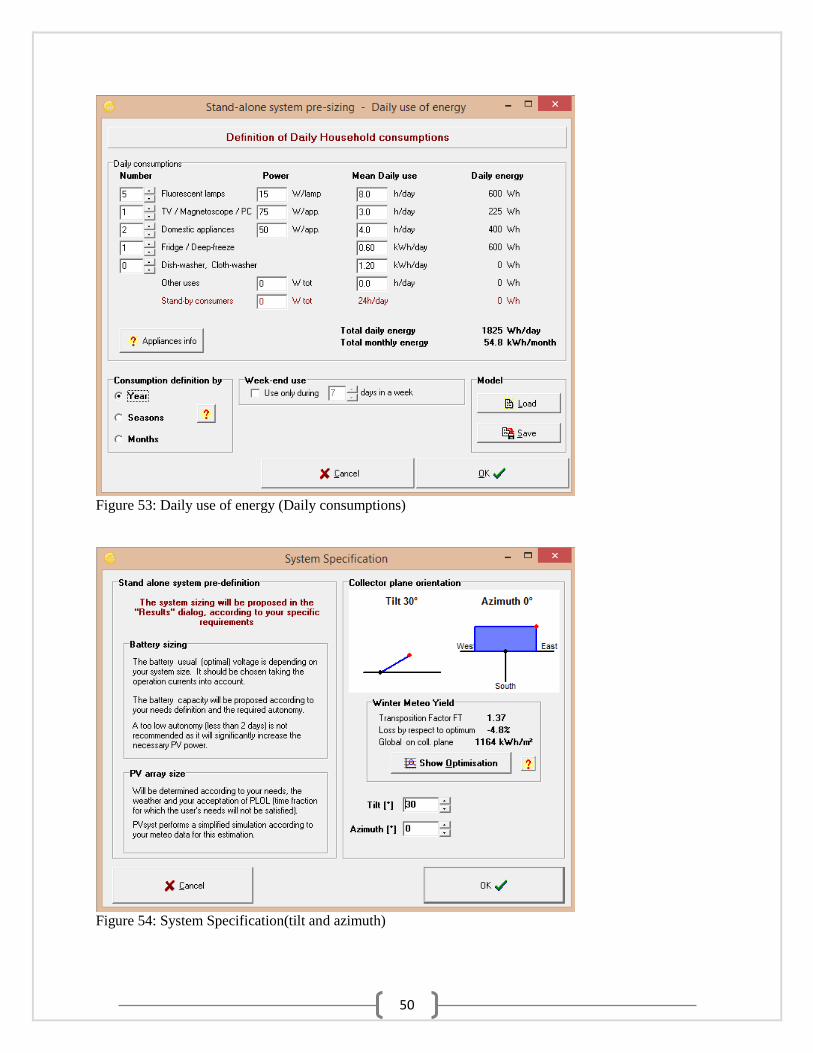
Designing using PVsyst (Photovoltaic Systems Software) ................................................................. 48
Effect of clouds and other local variations in the atmosphere The final effect of the atmosphere on incident solar radiation is due to local variations in the atmosphere.
Depending on the type of cloud cover, the incident power is severely reduced. An example of heavy cloud
cover is shown below.
Figure 6: [4]
Relative output current from a photovoltaic
array on a sunny and a cloudy winter's day in
Melbourne with an array tilt angle of 60°
Air Mass
The Air Mass is the path length which light takes through the atmosphere normalized to the shortest
possible path length (that is, when the sun is directly overhead). The Air Mass quantifies the reduction in
the power of light as it passes through the atmosphere and is absorbed by air and dust. The Air Mass is
defined as:
AM=1/cos(θ) where θ is the angle from the vertical (zenith angle). When
the sun is directly overhead, the Air Mass is 1.
Figure 7:
The air mass represents the proportion of
atmosphere that the light must pass through before
striking the Earth relative to its overhead path
length, and is equal to Y/X.
Comparision Of Different PV Technologies
There are a number of photovoltaic (PV) technologies available for converting sunlight into electrical
energy. For building applications, technologies that are commercially available are predominately silicon-
based and can be categorized as either crystalline silicon or thin film. Each has different operating
characteristics, conversion efficiencies and costs.
Conversion efficiency is an important PV characteristic commonly used to compare PV technologies.
Conversion efficiency provides a measure of how effectively a PV device converts sunlight into
electricity. Conversion efficiency is calculated as the ratio of the peak power produced by a PV device in
watts (W) to the power of the sunlight incident on that device in watts. Since the output of a PV device
depends on a number of variables such as the spectral distribution of the sunlight and cell temperature,
standard test conditions (STP) have been established for measuring PV conversion efficiency. PV
conversion efficiency is measured in a laboratory with the PV device at 25 C and using a light source with
an intensity of 1,000 watts per meter at the PV device and a spectral distribution that corresponds to air
mass (AM) 1.5 global standard.
PV conversion efficiency is reported for both cells and panels. The conversion efficiency is greater for
cells because of the inherent losses that result from assembling a number of cells into a panel. Since PV
panels are installed on buildings, the conversion efficiency of panels should be considered when
comparing PV technologies and not individual cell conversion efficiency.
Crystalline silicon PV
Crystalline silicon is the most common type of PV cell used in building applications today. Crystalline
silicon has a conversion efficiency that ranges between 10 and 13 percent. In general, crystalline silicon
PV panels are usually opaque and have either a dark blue or black antireflective coating. Some
manufacturers will provide crystalline silicon PV panels in custom colors, but there is usually a
minimum-order size, loss of efficiency, and price premium for this option. Additionally, crystalline
silicon PV panels can be built with space between individual cells to allow light to pass through the panel
for skylight and similar applications.
Crystalline PV cells can be further categorized as either monocrystalline cells or polycrystalline cells.
The difference is in the manufacturing process. Monocrystalline silicon is grown from a silicon seed and
results in a uniform crystalline structure. Polycrystalline silicon is produced from pouring molten silicon
into a mold. As a result, polycrystalline silicon PV cells do not have a uniform crystal structure and their
conversion efficiency is typically less than monocrystalline PV cells. However, the cost per square foot to
manufacture polycrystalline silicon PV is less than monocrystalline silicon PV, which can offset the
difference in conversion efficiency.
Thin-film PV
Thin-film PV cells are manufactured by depositing layers of semiconducting materials a few micrometers
thick on a substrate such as glass or stainless steel. Thin-film PV cells are categorized based on the type
of semiconducting material used. Amorphous silicon is the most common material used to produce thin
film PV cells today. Amorphous silicon has no crystalline structure and has a PV panel conversion
efficiency of between 5 and 8 percent. This conversion efficiency under STP is significantly less than
crystalline silicon PV, but continuing research and development is improving thin-film PV conversion
efficiency. In addition, thin-film PV conversion efficiency is better than crystalline silicon PV in low or
diffuse light making it more efficient on cloudy days. Thin-film PV is also better in very hot desert
regions because its cell temperature remains lower than crystalline silicon PV.
Even without significant improvements in conversion efficiency, thin-film PV has a number of
advantages over crystalline silicon PV that make it preferable for a number of building applications. Thin-
film PV is significantly less expensive to manufacture. Its PV cells require between 1 and 5 percent of the
materials and energy required to manufacture crystalline silicon PV cells. More important, the
manufacture of thin-film PV is much more automated and efficient than crystalline silicon PV. As a
result, its lower conversion efficiency is offset by its lower cost per square foot.
Thin-film PV is also much better suited for building integrated PV (BIPV) applications. Thin-film PV can
be deposited on vision glass and appear as an architectural tint as well as on spandrel glass, effectively
turning the entire building curtain wall into a power generator. It can also be integrated with roofing
materials on commercial flat roofs or shingles on sloped residential roofs.
14
Figure 8: Classification of Solar PV technologies
Figure 9: Space requirements of different PV modules
15
Performance parameters of solar PV module
There are various factors affecting the performance of solar PV module:
1. Mismatch effect
Mismatch losses are caused by the interconnection of solar cells or modules which do not
have identical properties or which experience different conditions from one another.
Mismatch losses are a serious problem in PV modules and arrays under some conditions
because the output of the entire PV module under worst case conditions is determined by the
solar cell with the lowest output.
Mismatch in PV modules occurs when the electrical parameters of one solar cell are
significantly altered from those of the remaining devices. The impact and power loss due to
mismatch depend on
–the operating point of the PV module;
–the circuit configuration; and
–the parameter (or parameters) which are different from the remainder of the solar cells.
2. Shading effect
Figure 10: Types of Shading
3. Temperature effect Solar PV module are sensitive to temperature. Increases in temperature reduce the band gap of a semiconductor, thereby effecting most of the semiconductor material parameters. The parameter most affected by an increase in temperature is the open-circuit voltage. Figure 11: Effect of Temperature on PV module
16
4. Irradiance effect
The light intensity incident on a solar PV module is directly proportional to the current.
Figure 12: Effect of Irradiance effect on PV module
5. Degradation and ageing
The performance of a PV module will decrease over time. The degradation rate is typically
higher in the first year upon initial exposure to light and then stabilizes.
Factors affecting the degree of degradation include the quality of materials used in
manufacture, the manufacturing process, the quality of assembly and packaging of the cells
into the module, as well as maintenance levels employed at the site.
The extent and nature of degradation varies among module technologies.
Amorphous silicon cells the degrade can cause reductions of 10-30% in the power output of
the module in the first six months of exposure to light.
6. Soiling
The accumulation of dust on the surface of a photovoltaic module decreases the radiation
reaching the solar cell and produces losses in the generated power.
The mean of the daily irradiation losses in a year caused by dust deposited on the surface of a
photovoltaic module is around 5%. After long periods without rain, daily irradiation losses
can be higher than 20%.
Figure 13: Effect of soiling on PV module
17
Outdoor photovoltaic module I-V characteristics test
Background
The purpose of the outdoor photovoltaic (PV) module I-V characteristics test is to validate the DUT
manufacturer’s PV module data (if available) and determine the PV module’s I-V characteristic curve
under standard test conditions (STC) and typical module operating temperatures (TMOT).
Solar LED lamp units are often powered by PV modules having a power range from approximately 0.3
watts (W) to 10 W. When selecting a measurement instrument, it is important to ensure that it is able to
make accurate measurements of modules in the desired size range. This is particularly important for
modules rated at less than 3,0 W since most measurement equipment is not designed for very small
modules.
The PV module may be measured with a solar simulator in accordance with standard IEC 60904-1 and
corrected for TMOT with standard IEC 60891. This is the preferred technique for characterizing PV
modules and laboratories with access to a solar simulator should use this procedure.
The test may also be performed with an instrument that is designed to make outdoor performance
measurements of small solar modules.
I-V Characteristics of solar PV module
The I-V curve of an illuminated PV module has the shape shown in figure below, as the voltage across the
measuring load is swept from zero to VOC.
Many performance parameters for the solar module can be determined from this data, such as Voc, Isc
and Pmp.
Figure 14: I-V Characteristics of solar PV module
Standard Test Condition (STC) creates uniform test condition which make it possible to
conduct uniform comparisons of photovoltaic (PV) modules by different manufacturers. This
condition defines performance at an solar radiation of 1000 W/m2, temperature 25°C and air
mass 1.5 G.
18
NOCT coefficient (Nominal Operating Cell Temperature) is usually specified by most of PV
module manufacturers, which is the temperature attained by the PV modules with standard
conditions defined as solar radiation at 800 W/m2, ambient temperature 20°C, wind velocity 1
m/s and open-circuit PV module.
Short-circuit current (Isc) is the current through the solar module when the voltage across the
solar module is zero (i.e., when the solar module is short circuited).
Open-circuit voltage (Voc) is the maximum voltage available from a solar cell, and this occurs
at zero current.
Figure 15: IV curve showing Isc and Voc
Maximum power point (Pmp or Pmax) provided by the PV module is achieved at a point on
the I-V curve, where the product Imp (or Imax) and Vmp (or Vmax) is maximum
Pmp = Imp x Vmp
Figure 16: IV curve showing maximum power point
19
Fill factor (FF) is also known as the curve factor, is a measure sharpness of the knee in an I-V
curve. It indicates how well a junction was made. The maximum value of the fill factor is 1.0,
which is not possible. Its maximum value in Silicon is 0.88.
Solar cell efficiency (ηec or ηeff) is the solar cell power conversion efficiency and may be given
as
where Imax and Vmax are the current and voltage for maximum power, corresponding to solar
ntensity I(t) and AC is the area of the solar cell.
Test outcomes
Table 2: Test outcomes of Outdoor photovoltaic module I-V characteristics test
Metric Reporting units Related aspects
Short-circuit current (Isc) at STC Amperes (A) These are the key
parameters describing
solar module
performance at
standard test
conditions (“STC” -
AM 1.5, 25 °C,
1000 W/m2) and
Normal operating cell
temperature
(“NOCT” - same as
STC except cell
temperature of 50 °C)
Open-circuit voltage (Voc) at STC Volts (V)
Maximum power point power (Pmpp) at STC Watts-peak (Wp)
Maximum power point current (Impp) at STC Amperes (A)
Maximum power point voltage (Vmpp) at STC Volts (V)
Short-circuit current (Isc,NOCT) at NOCT Amperes (A)
Open-circuit voltage (Voc,NOCT) at NOCT Volts (V)
Maximum power point power (Pmpp,NOCT) at
NOCT
Watts-peak (Wp)
Maximum power point current (Impp,NOCT) at
NOCT
Amperes (A)
Maximum power point voltage (Vmpp,NOCT) at
NOCT
Volts (V)
Temperature coefficient Per degree Celsius (1/°C)
STC I-V Curve dataset Volts (V), Amperes (A)
20
Procedure
The PV module is tested outdoors to obtain its characteristic I-V curve, from which the maximum power
(Pmpp), open-circuit voltage (Voc), and short-circuit current (Isc) can be determined.
Equipment requirements
a) Outdoor I-V curve analyser
b) Fast-response (i.e., silicon PV-based) pyranometer with less than 5 % error
c) Voltage meter or multimeter with a basic measurement uncertainty less than or equal to 0,5 % of
the measuring range
d) Surface-mounted thermocouple(s) and a thermocouple reader with a precision less than 2 °C
Test prerequisites
a) Constant atmospheric conditions (i.e., a clear, sunny day with no clouds)
b) Incident solar radiation between 850 W/m2 and 1 150 W/m2 and an ambient temperature between
15 °C and 35 °C
c) Air mass less than or equal to 2
d) If the PV module is amorphous silicon or otherwise may be subject to degradation (e.g., because
it is thin film or of unknown technology), it must sun-soak for 30 days prior to performing this
test
Apparatus
There should be an appropriate stand to hold the PV module and pyranometer in the same plane, directly
normal to the sun. The PV module should be placed as close as possible to the pyranometer to ensure that
each device “sees” the same sky view. A sighting tube with bracket can be used to ensure the stand is
directly normal to the sun.
1 Pyranometer
2 Board or other flat surface
3 Bracket
4 Sighting tube
θ 90°
Figure 17: Apparatus used for outdoor photovoltaic
Module IV characteristic test
21
Procedure
Determine the appropriate thermocouple mounting technique based on PV panel configuration. If the PV
module is separate from the lighting product or can be easily removed without damaging the active PV
material and the back of the PV module is accessible, use the back-mounted thermocouple procedure.
Otherwise, use the front-mounted thermocouple procedure.
Back-mounted thermocouple
a) Before the PV module is exposed to sunlight, do the following:
1) Cut the connector from the end of the PV module cable, leaving as much of the cable
connected to the PV module as possible, and strip the wire ends.
2) Connect a voltage meter or multimeter (DC voltage range) to the PV module.
3) Fix the thermocouple to the back of the PV module near the centre of the active area and affix
insulating material (e.g., foil-backed foam tape) over the thermocouple.
b) Expose the PV module to direct normal sunlight and immediately measure and record the open-
circuit voltage (Voc,1) and the PV module temperature (T1).
c) Leave the PV module in direct normal sunlight until thermal equilibrium is reached (i.e., the PV
module temperature is not changing by more than 1 °C/min).
d) Connect the PV module to the I-V curve analyser per the I-V curve analyser’s manufacturer’s
instructions.
e) Execute the I-V measurement per the I-V curve analyser’s manufacturer’s instructions and record
the PV module temperature (T) and incident solar radiation.
f) After the I-V curve measurement, measure and record the PV module temperature again (T2).
g) Measure the record the PV module’s open-circuit voltage at T2 (Voc,2) using the same instrument
that was used in step (a).
h) Connect the PV module to the lighting product and measure and record the typical operating
voltage (Vop) at the lighting product’s PV socket using a voltage meter or multimeter.
Generating an I-V Curve
Figure 18: generation of IV curve
22
Outdoor I-V Curve Tester
Figure 19: outdoor IV curve Tester Setup
Figure 20: IV curve generated by Tester
23
Calculations
a) Convert all of the current measurements to STC using the following formula:
GII
2
mmW 0001
where
I is the PV module’s current at STC, in amperes (A);
Im is the PV module’s measured current, in amperes (A);
G is the measured incident solar radiation during the I-V curve measurement, in watts per
square meter (W/m2).
b) Determine the temperature coefficient for the voltage (Tc,voc) using the following formula:
Tc,voc =Voc,1 -Voc,2( ) Voc,2
T1 -T2
where
Tc,voc is the PV module’s temperature coefficient for the voltage, per degree Celsius (1/°C);
Voc,1 is the PV module’s open-circuit voltage immediately after exposure to sunlight, in volts
(V);
Voc,2 is the PV module’s open-circuit voltage after the I-V measurement is taken, in volts (V);
T1 is the PV module’s temperature immediately before exposure to sunlight, in degrees
Celsius (°C);
T2 is the PV module’s temperature after the I-V curve measurement is taken, in degrees
Celsius (°C).
c) Convert all of the voltage measurements to STC using the following formula:
V =Vm ´ 1+Tc,voc ´ Tstc -T( )éë ùû
where
V is the PV module’s voltage at STC, in volts (V);
Vm is the PV module’s measured voltage, in volts (V);
Tc,voc is the PV module’s temperature coefficient for the voltage, per degree Celsius (1/°C);
Tstc is the temperature at STC, 25 °C;
T is the PV module’s temperature during the I-V curve measurement, in degrees
Celsius (°C).
d) The PV module’s short-circuit current at STC (Isc) is the current corresponding to 0 V on the
STC-adjusted I-V curve.
e) The PV module’s open-circuit voltage at STC (Voc) is the voltage corresponding to 0 A on the
STC-adjusted I-V curve.
24
f) Determine the PV module’s measured maximum power point power at STC (Pmpp) using the
following formula:
Pmpp = max I ´V( )
where
Pmpp is the PV module’s measured maximum power point power at STC, in watts-peak (Wp);
I is the PV module’s current at STC, in amperes (A);
V is the PV module’s voltage at STC, in volts (V).
g) The PV module’s maximum power point current at STC (Impp) is the current corresponding to
Pmpp on the STC-adjusted I-V curve.
h) The PV module’s maximum power point voltage at STC (Vmpp) is the voltage corresponding to
Pmpp on the STC-adjusted I-V curve.
25
Battery Test
Background
The battery test is used to determine a DUT’s actual battery capacity and storage efficiency. This
information is useful to determine if a battery is mislabelled or damaged. During the test the battery is
connected to a battery analyser, which performs charge-discharge cycles on the battery. The last charge-
discharge cycle data from the battery test is analysed to determine the actual battery capacity and battery
storage efficiency.
Purpose of the test and outputs
•Purpose: determine if battery is properly rated and determine battery efficiency
•Cycle batteries using specific procedures by chemistry
–SLA
–Li-ion
–LiFePO4
–NiMH/ NiCd
•Determine battery capacity and battery efficiency from final charge-discharge cycle data
Battery chemistries
Figure 21: different types of batteries
Nickel Cadmium (NiCd) — mature and well understood but relatively low in energy density. The NiCd
is used where long life, high discharge rate and economical price are important. Main applications are
two-way radios, biomedical equipment, professional video cameras and power tools. The NiCd contains
toxic metals and is not environmentally friendly.
Nickel-Metal Hydride (NiMH) — has a higher energy density compared to the NiCd at the expense of
reduced cycle life. NiMH contains no toxic metals.
Applications include mobile phones and laptop computers.
26
Lead Acid — most economical for larger power applications where weight is of little concern. The lead
acid battery is the preferred choice for hospital equipment, wheelchairs, emergency lighting and UPS
systems.
Lithium Ion (Li-ion) — fastest growing battery system. Li-ion is used where high-energy density and
light weight is of prime importance. The Li-ion is more expensive than other systems and must follow
strict guidelines to assure safety. Applications include notebook computers and cellular phones.
Lithium Ion Polymer (Li-ion polymer) — a potentially lower cost version of the Li-ion. This chemistry
is similar to the Li-ion in terms of energy density.
It enables very slim geometry and allows simplified packaging. Main applications are mobile phones.
Reusable Alkaline — replaces disposable household batteries; suitable for low-power applications. Its
limited cycle life is compensated by low self-discharge, making this battery ideal for portable
entertainment devices and flashlights.
Battery Chemistry Comparison
Table 3: comparison of different Battery Chemistries
C-Rate Terminology
C-rate: determines how quickly the battery is charged or discharged
The same C-rate can be written in many ways:
How can the C-rate be written for a 5Ah battery charged or discharged for 5 hours at 1A?
•C/X, where X = duration of charge or discharge (hours)
ex: C/5
•XC, where X = 1/duration of charge or discharge (hours)
ex: 0,2C
•X It A, where X = 1/duration of charge or discharge (hours)
ex: 0,2 It A
27
Battery Capacity Effected by C-Rate and Temperature
Required testing temperature: 20 °C ± 5 °C
Figure 22: Lead-Acid Battery Capacity VS Temperature
Recommended Battery Testing Details
Table 4: Recommended Testing details for different batteries
28
Test outcomes
Table 5: Test outcomes for Battery Test
Metric Reporting units Related aspects Note
Battery
capacity
(Cb)
Milliampere-hours
(mAh) at a
discharge current
(0,x It A)
This is a measure of the amount of
charge that can be stored in a battery,
which effects the run time of products.
--
Battery
storage
efficiency
(ηb)
Percentage (%) The input to battery circuit efficiency, or
generator-to-battery charging efficiency,
is a measure of how efficient the DUT
electronics are at feeding generated
energy into the battery.
At least two
complete charge-
discharge cycles are
required for the
calculation
Procedure
Sealed lead-acid battery test The DUT’s sealed lead-acid battery is cycled on a battery analyser and the data from the final charge-
discharge cycle is used to determine the DUT’s actual battery capacity and storage efficiency.
Equipment requirements Battery analyser with the voltage, current, and capacity measurement tolerances
± 1 % for voltage; ± 1 % for current; ± 1 % for capacity.
Test prerequisites The battery can be taken out of the lighting product for this test, if desired.
Procedure
a) Prime the battery using a charge rate of 0,1 It A, a discharge rate of 0,1 It A, and the
information in the battery cycling recommended practices.
Using the battery analyser, continuously cycle the battery until the maximum battery capacity
is reached (i.e., until the capacity improvement is less than or equal to 5 % over the previous
battery capacity).
b) Ensure the battery is charged using a charge rate of 0,1 It A and the information in the battery
cycling recommended practices. After charging, the battery shall be stored in an ambient
temperature of 20 °C ± 5 °C for not less than 1 h and not more than 4 h.
c) The battery shall be discharged at a rate of 0,1 It A, using the information in the battery
cycling recommended practices, and the battery capacity shall be measured.
d) Continue cycling the battery until the change in measured battery capacity between
subsequent cycles is less than or equal to 15 %, ensuring that the last two charge-discharge
cycles have identical charge and discharge rates.
e) If the battery will be stored after undergoing this test, charge the battery using a charge rate of
0,1 It A and the information in the battery cycling recommended practices.
29
Calculations
a) Determine the total energy input into the DUT’s battery during the final charge cycle (Ec) using
the following formula:
tIVE ccc
where
Ec is the energy entering the battery during the charge cycle, in watt-hours (Wh);
Vc is the voltage recorded during the charge cycle, in volts (V);
Ic is the current recorded during the charge cycle, in amperes (mA);
∆t is the time interval between subsequent data points, in hours (h).
b) Determine the total energy output from the DUT’s battery during the final discharge cycle using
the following formula:
tIVE ddd
where
Ed is the battery’s energy output during the discharge cycle, in watt-hours (Wh);
Vd is the voltage recorded during the discharge cycle, in volts (V);
Id is the current recorded during the discharge cycle, in amperes (mA);
∆t is the time interval between subsequent data points, in hours (h).
c) Determine the DUT’s battery capacity with data from the final discharge cycle using the
following formula:
tIC db
where
Cb is the measured battery capacity, in milliampere-hours (mAh);
Id is the current recorded during the discharge cycle, in amperes (mA);
∆t is the time interval between subsequent current data, in hours (h).
d) Determine the DUT’s battery efficiency using the following formula:
c
db
E
E
where
b is the battery storage efficiency;
Ed is the battery’s energy output during the discharge cycle, in watt-hours (Wh);
Ec is the energy input to the battery during the charge cycle, in watt-hours (Wh).
30
Battery Testing Operations
Figure 23: Flow Chart for Battery Testing Operations
Step 1 on Cadex
Figure 24: Step 1 on Cadex
31
Example for SLA battery
Figure 25: Example for SLA battery on Cadex for step 1
Step 2 on Cadex
C-code:
–Specify c-rates and other charging/discharging parameters
–Specific for each battery chemistry
Figure 26: C-code for SLA Battery
32
Step 3 on Cadex
Download Data as .csv File
Figure 27: Readings measured by Cadex during Battery Testing
33
Measurement Of Temperature Coefficients
Purpose
The purpose is to determine the temperature coefficient of current(α), voltage(β) peak power(δ) from
module measurements. The coefficients so determined are valid at the irradiance at which the
measurements were made.
Apparatus
The following apparatus is required to control and measure the test conditions:
a) A radiant source (natural sunlight or solar simulator,class B or better in accordance with IEC
60904-9) of the type to be used in subsequent tests;
b) A PV module having a known short circuit current versus irradiance characteristics determined
by calibrating against an absolute radiometer in accordance with IEC 60904-6;
c) Any equipment necessary to change the temperature of the test specimen over the range of
interest;
d) A suitable mount for supporting the test specimen and the reference device in the same plane
normal to the radiant beam;
e) A means for monitoring the temperature of the specimen and reference device to an accuracy of
±1 °C, and repeatability of ±0.5 °C;
f) Equipment for measuring the current of the test specimen and reference device toan accuracy of
±0.2 % of the reading;
g) Equipment for measuring the voltage of the test specimen and reference device toan accuracy of
±0.2 % of the reading;
Solar simulator
A solar simulator (also artificial sun) is a device that provides illumination approximating
natural sunlight. The purpose of the solar simulator is to provide a controllable indoor test facility under
laboratory conditions, used for the testing of solar cells, sun screen, plastics, and other materials and


![[DRAFT, PRE-FINAL OR FINAL] REPORT - OECD](https://static.documents.pub/doc/80x56/5ec770f8c7c9f9670a3f7375/-draft-pre-final-or-final-report-.jpg)


