Page 1
FINAL REPORT A COMPUTER SYSTEM FOR BRIDGE RATING AND FATIGUE LIFE ANALYSIS
Research Report No. 91-2
By
Ton-Lo Wang, Ph.D., P.E.
Principal Investigator
and
Ran Huang, Ph.D.
Research Associate
Department of Civil and Environmental Engineering
College of Engineering and Design
Florida International University
Miami, Florida
Highway Planning and Research Program
Project No. 0510523
Page 2
DISCLAIMER
"The opinions, findings and conclusions expresses in this publication
are those of the a u t ho r s and not necessarily those: of the Department
of Transportation or the U. S. Department of Transportation.
Prepared in cooperation with the State of Florida Department of
Transportation and the U.S. Department of Transportation."
ii
Page 3
ACKNOWLEDGMENTS
The authors wish to express their s incere appreciation to the Florida Department of
Transportation (FDOT) for funding this research. Special thanks are also extended to Dr.
Mohsen Shahawy, Chief Structural Analyst, Structures Research and Testing Center, FDOT for
his valuable advice; suggestions, and comments during the course of this study.
Also, the authors would like to express their thanks to student assistants Mr. Ghiath N.
Mansour and Mr. Juan C. Vallarino for their assistance in generating the Figures and Tables.
iii
Page 4
TABLE OF CONTENTS
Page
DISCLAIMER .....................................…………….....……………………………………… ii
ACKNOWLEDGMENTS ....................................…………………………………………… iii
LIST OF TABLES .......................................………………………………….. ……………. vi
LIST OF FIGURES ..............................…........... ………………………………………….. vii
CHAPTER I. INTRODUCTION: …...........................……………………………………….. 1
CHAPTER II. VEHICLE AND BRIDGE MODELS ....................………………………….. 3
2.1 Vehicle Models ..................................... ……………………………………… 3
2.2 Bridge Models ....................................…………….…………………………… 3
CHAPTER III. BRIDGE CAPACITY RATING .....................………………….…………... 9
3.1 Beam/Girder Bridge ...............................……………………………………….. 9
3.2 Longitudinal Concrete Deck/Slab Bridges ..................…………….….………. 17
3.3 Transverse Deck/Slab Bridges ............……………………………….………... 19
CHAPTER IV. FATIGUE LIFE ANALYSIS .......................……………………….……... 25
CHAPTER V. EXAMPLES ....................……………………………………….....……...... 28
5.1 Transverse Reinforced Concrete Deck.....................………………………….... 28
5.2 Transverse Treated Timber Deck .......................…………………………………32
5.3 Longitudinally Reinforced Concrete Slab .................……..……………………. 35
5.4 Timber Girder Bridge ...................…………………………………………….... 43
5.5 50-FT Simple Span Concrete Girder .......…..…………………………………... 45
5.6 25-FT Simple Span Steel Girder .........................……………………………….. 49
5.7 30-FT Simple Span Steel Noncomposite Beam Bridge ........…..……………..... 52
5.8 Three Continuous Span Nonuniform Section Steel Girders....………………..... 60
5.9 65-FT Simple Span Concrete T-Beam Bridge ........…..……………………........ 82
5.10 Three Continuous Span Composite Girder Bridge ........…..………………….... 86
CHAPTER VI. CONCLUSIONS AND RECOMMENDATIONS ......……………...…….... 98
APPENDIX A. USER'S MANUAL OF BRAF ..................………….....………………….. 100
A.1 General........................................………………………………………………. 100
iv
Page 5
A.2 How To Run The BRAF Program .........…...............………………………. 101
A.3 Preparation of Data File .............................……………………………... 102
APPENDIX B. USER'S MANUAL OF BRAF-P .....................………………………... 117
B.1 General.......................................……………………………………………. 117
B.2 How To Run BRAF-P .............................…………………………………... 117
REFERENCES......................................…………………………………………………. 119
v
Page 6
LIST OF TABLE Table page
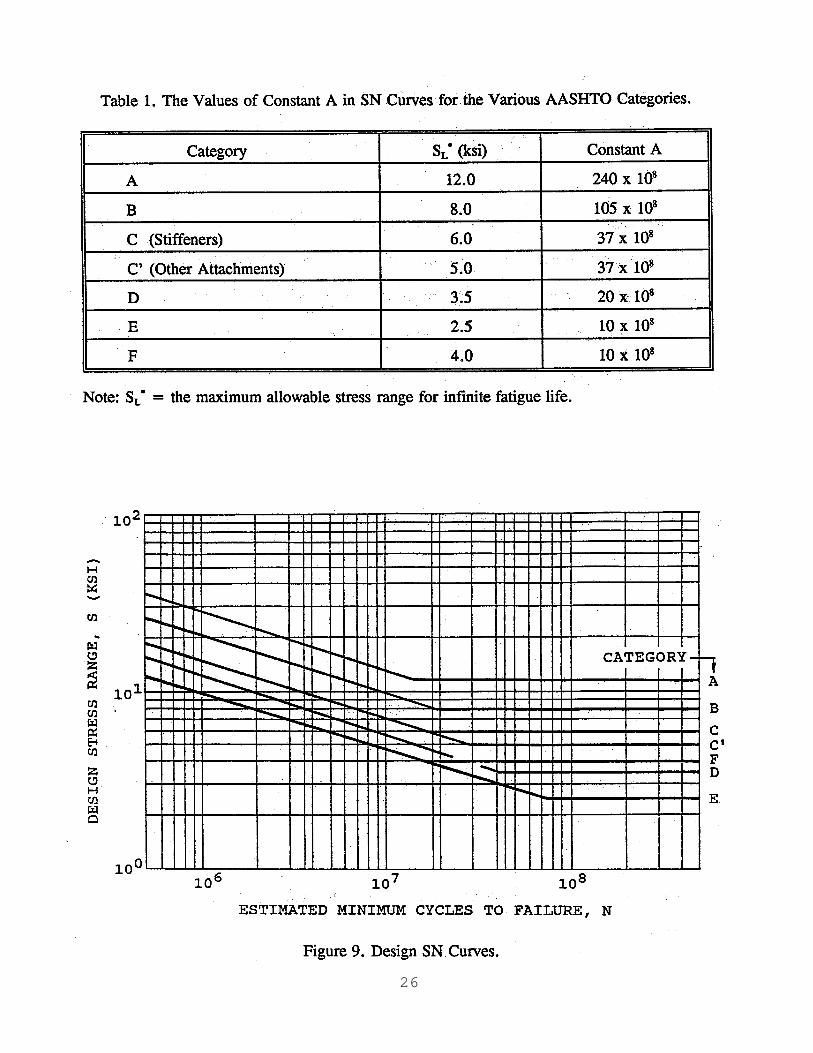
1 The Values of Constant A in SN Curves for the Various AASHTO Categories ........... 26
vi
Page 7
LIST OF FIGURES
Fig ure Page
1 AASHTO H: and HS Vehicle Loadings. .......................…………………………….. 4
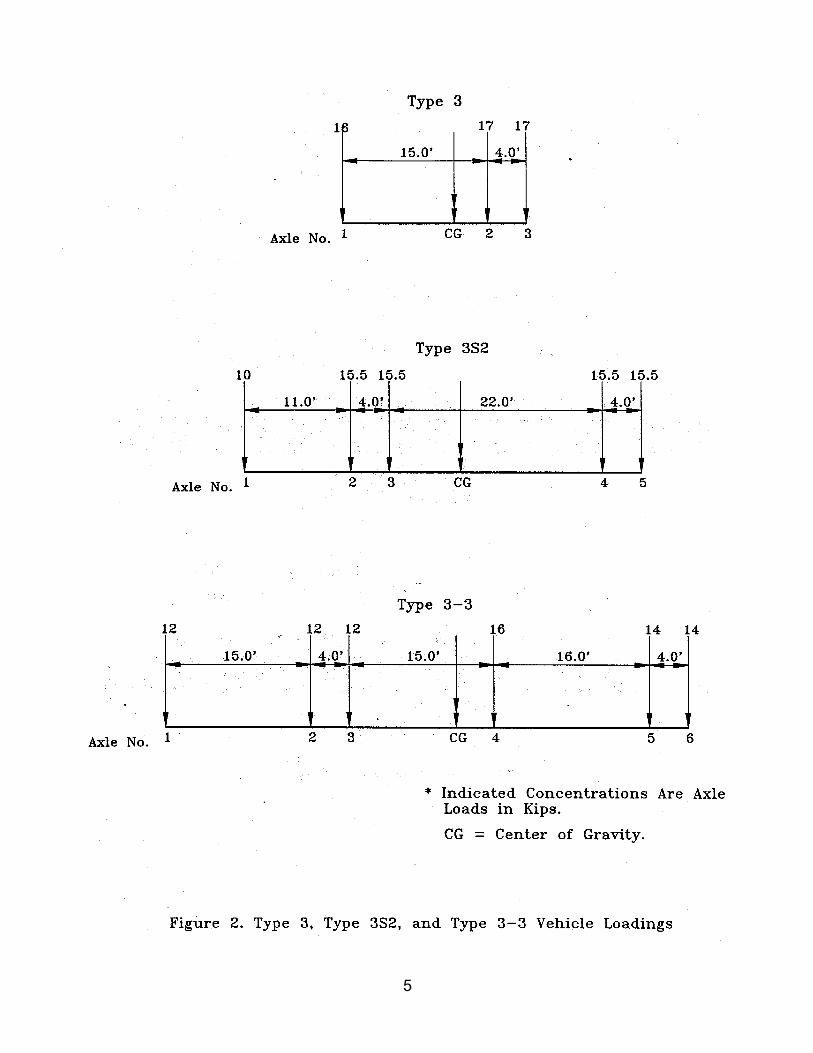
2 Type 3, Type 3S2, and Type 3-3 Vehicle Loadings ................…………………….... 5
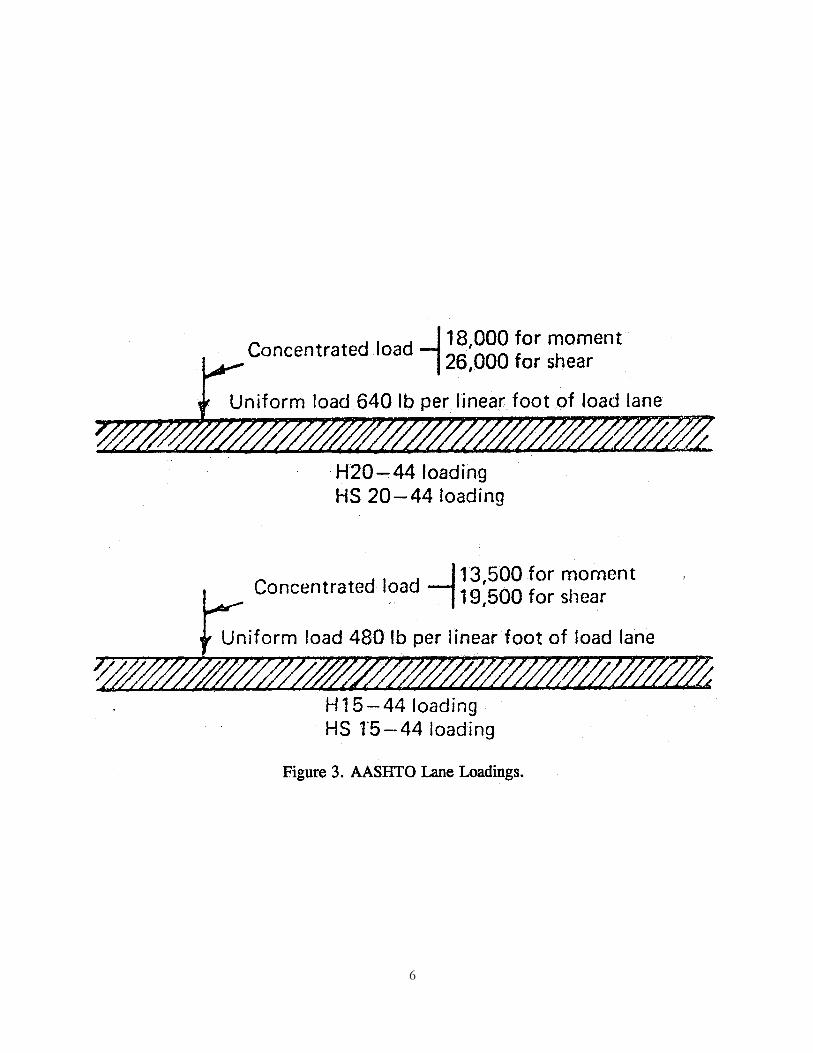
3 AASHTO Lane Loadings ....................................………………………………….. 6
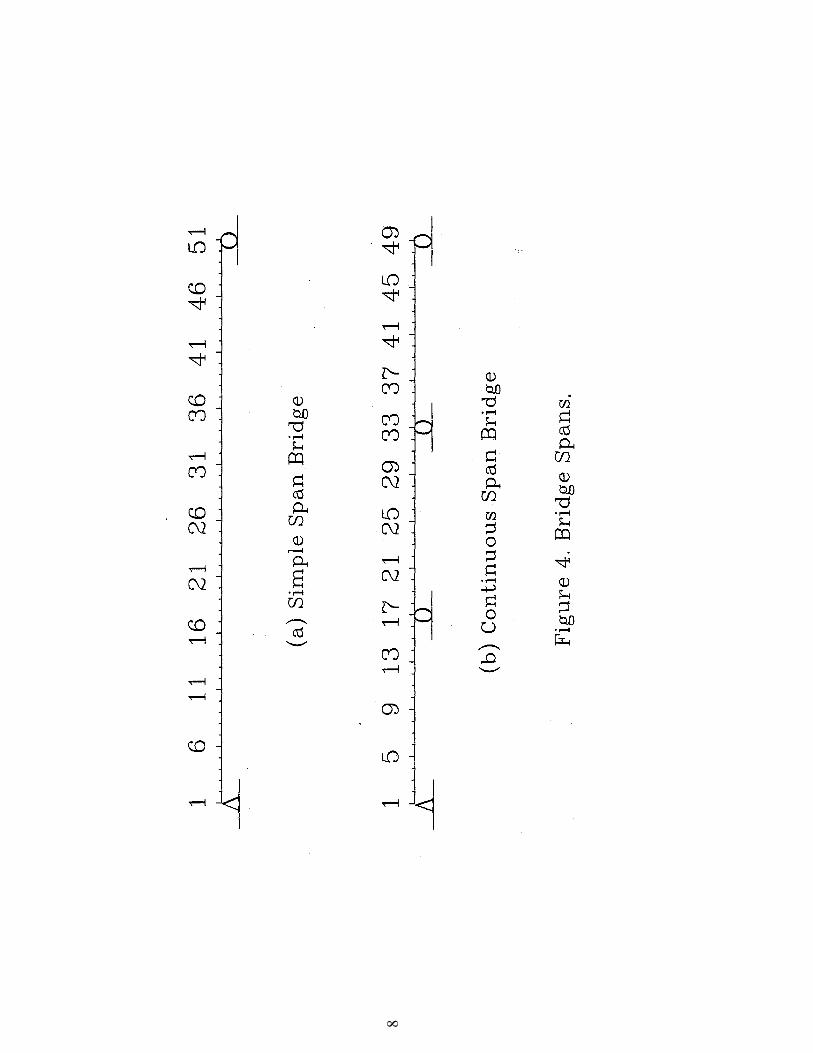
4 Bridge Spans.....….............................….…………………………………………….. 8
5 Typical Cross Sections of Reinforced Concrete Beam/Girder Bridges
for Positive Moments ............................…………………………………………….. 16
6 Typical Cross Sections of Reinforced Concrete Beam/Girder Bridges
for Negative Moments .........................……………………………………….............16
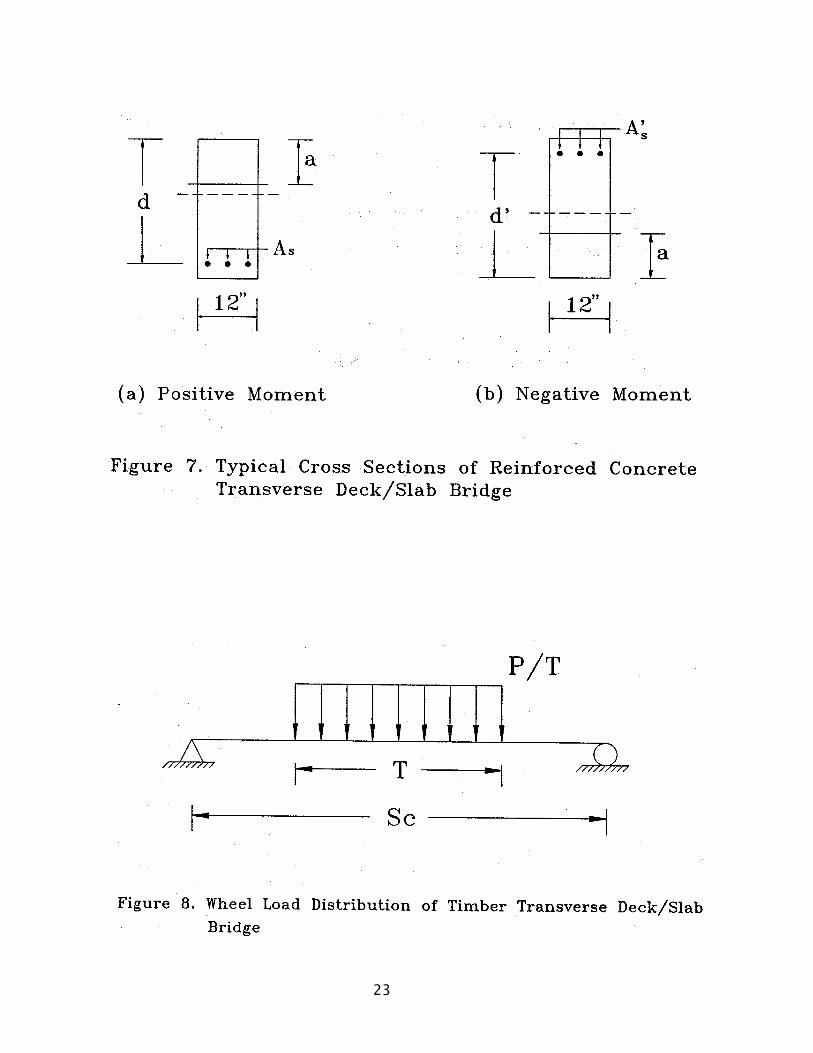
7 Typical Cross Sections of Reinforced Concrete Transverse Deck/Slab
Bridges....……………………………………………………….................................. 23
8 Wheel Load Distribution of Timber Transverse Deck/Slab Bridges.....…………….. 23
9 Design SN Curves………………………………………………………...................... 26
10 Roadway Section: T-beam Bridge ....................……………………………………... 29
11 Transverse Section of Treated Timber Deck....……………………………................ 33
12 Longitudinally Reinforced Slab Bridge: Plan and Elevation ........……..…………... 36
13 Typical Section: Longitudinally Reinforced Slab Bridge ..........………………....... 36
14 Cross Section of Simple Span Reinforced Concrete Beam Bridge: …………............46
15 Cross Section of Simple Span Steel Beam Bridge .........……………………………..53
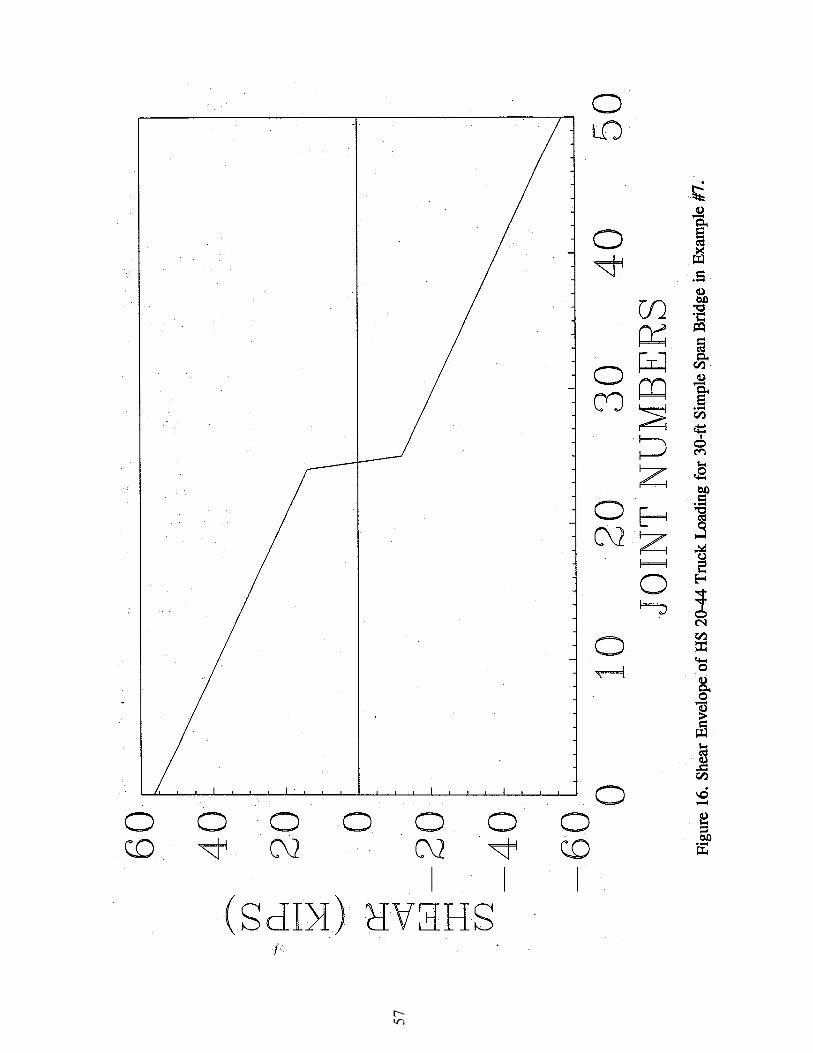
16 Shear Envelope of HS 20-44 Truck Loading for 30-ft Simple Span Bridge in Example
#7 ....................................……………………………………………..………………...... 57
Page 8
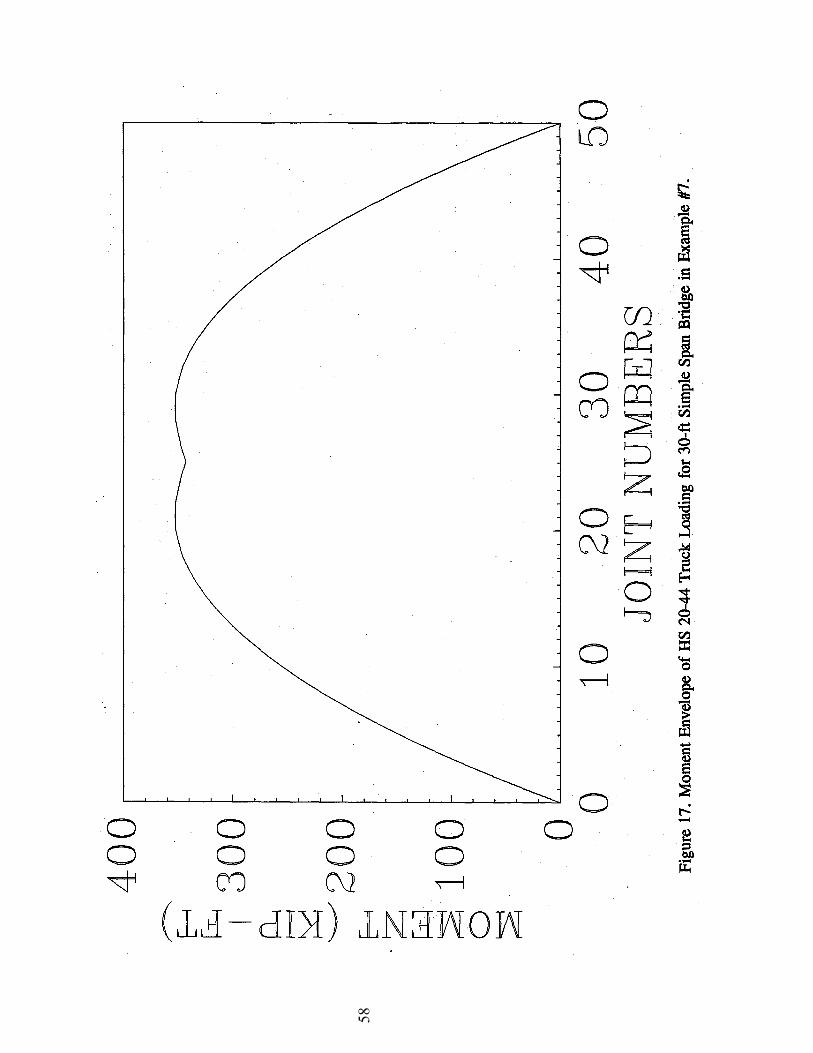
17 Moment Envelope of HS 20-44 Truck Loading for 30-ft Simple Span Bridge
in Example #7 ......................................…………………………………………….... 58
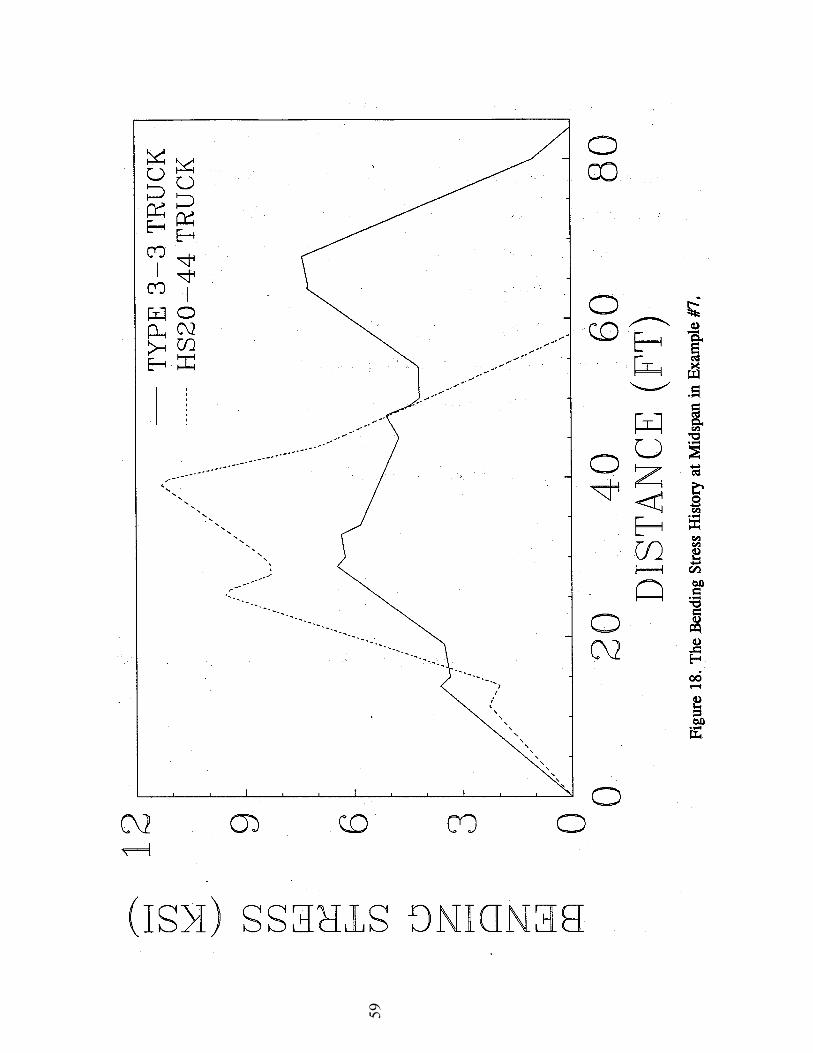
18 The Bending Stress History at Midspan in Example #7 .............…………..………... 59
vii
Page 9
19 Girder Spans of Continuous Bridge ..........................……………………………. 61
20 Cross Section of Continuous Steel Girder Bridge..................…………………… 61
21 Flange Plate Design for Continuous Steel Girder Bridge ............……………….. 61
22 Shear Influence Lines of Joints #l and #17 in Example #8 ....………………….... 70
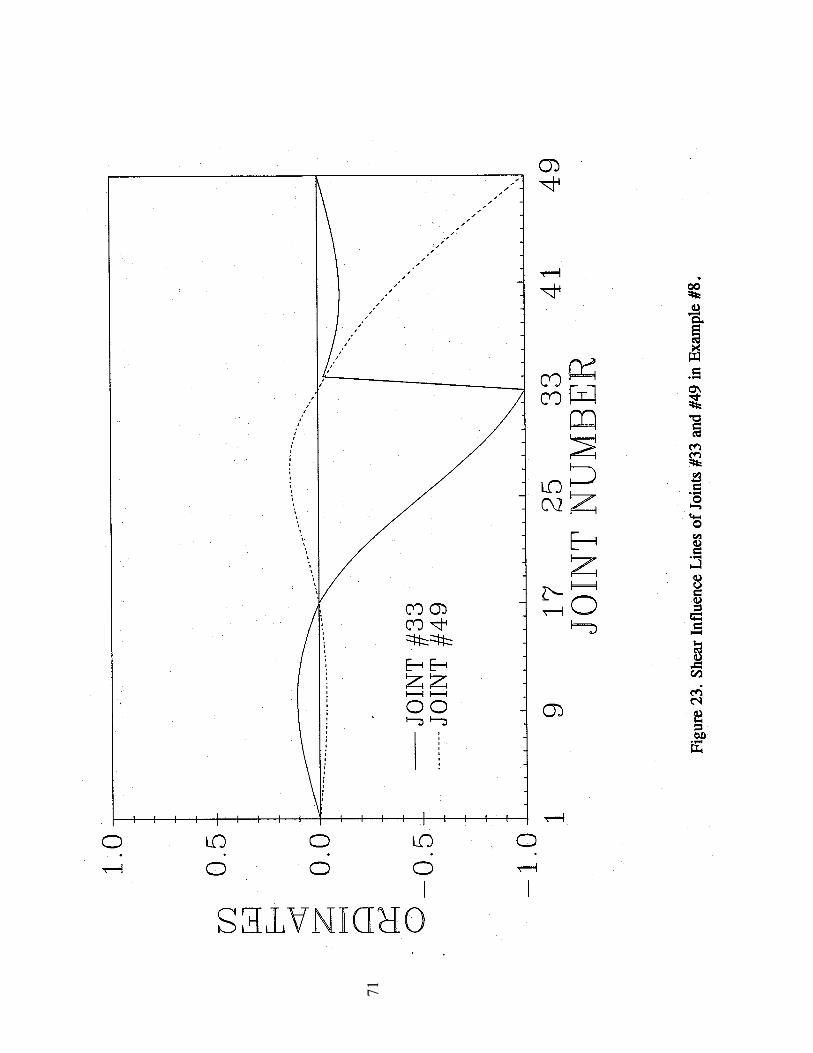
23 Shear Influence Lines of Joints: #33 and #49 in Example #8 ..........……………... 71
24 Moment Influence Lines of Joints #9, #17, #25, #33 and #41
in Example #8 .......................................………………………………….…………72
25 Shear Envelopes for Dead and Live Loads of HS 20-44 Truck
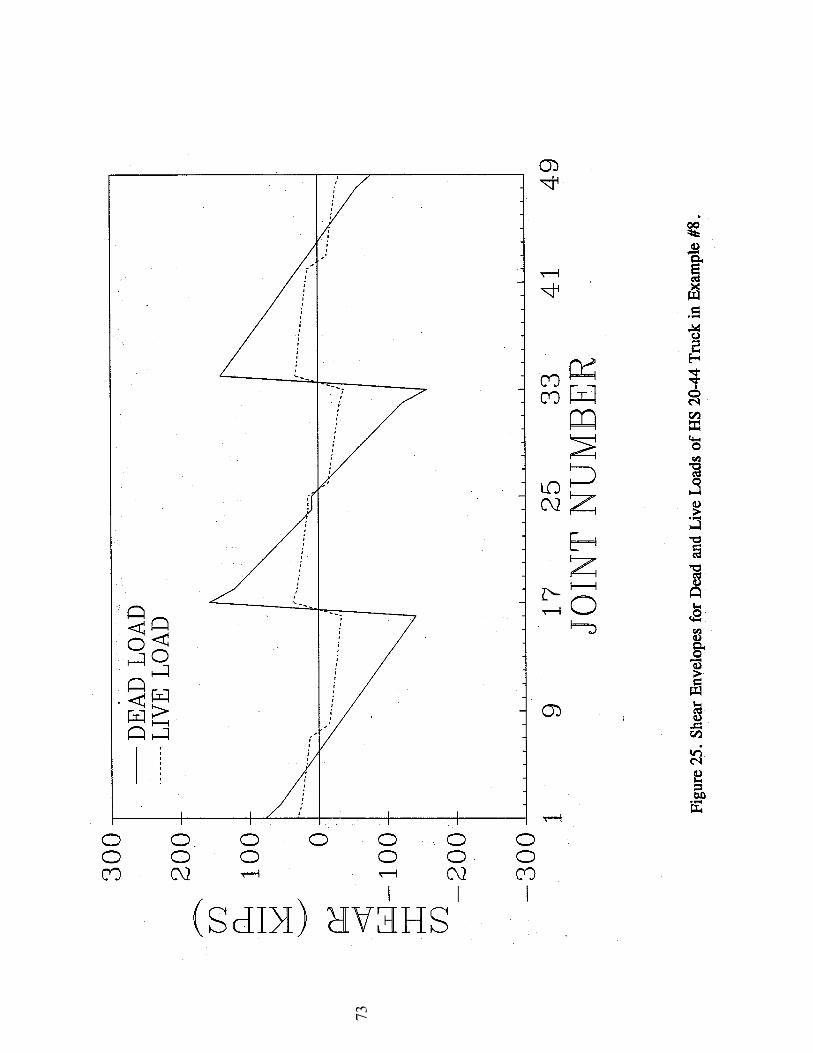
in Example #8 .......................................……………………………………….……73
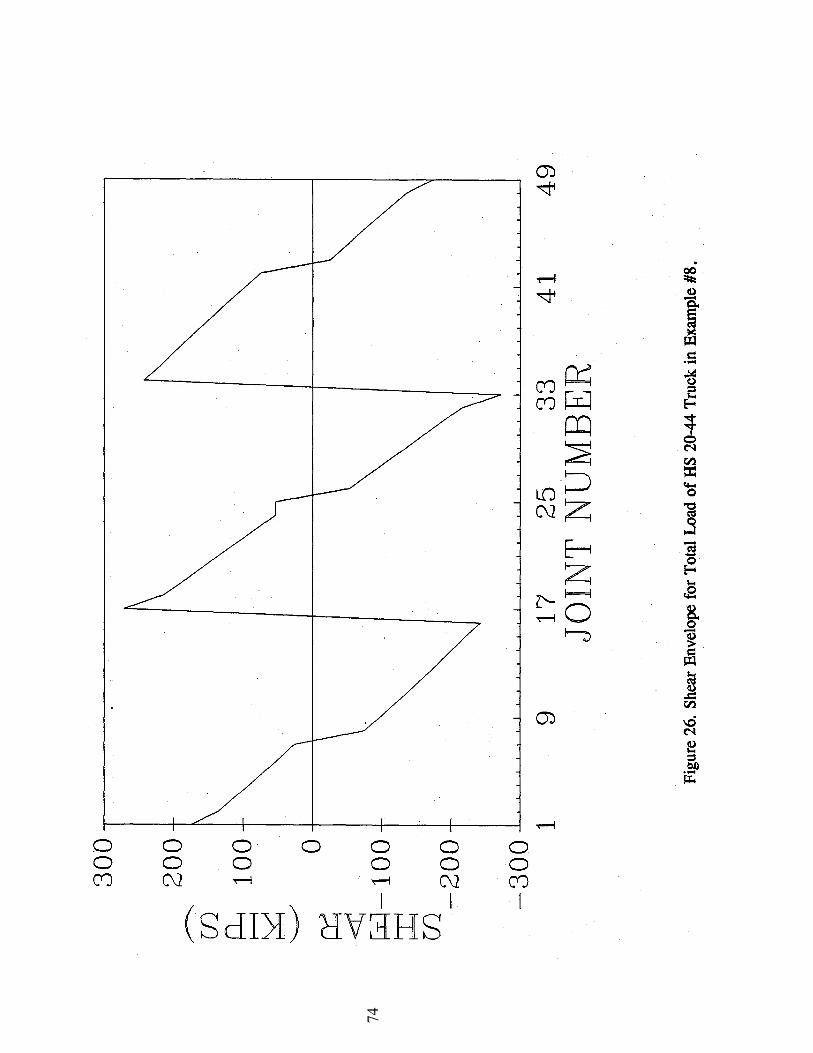
26 Shear Envelope for Total Load of HS 20-44 Truck in Example #8 .......…….……..74
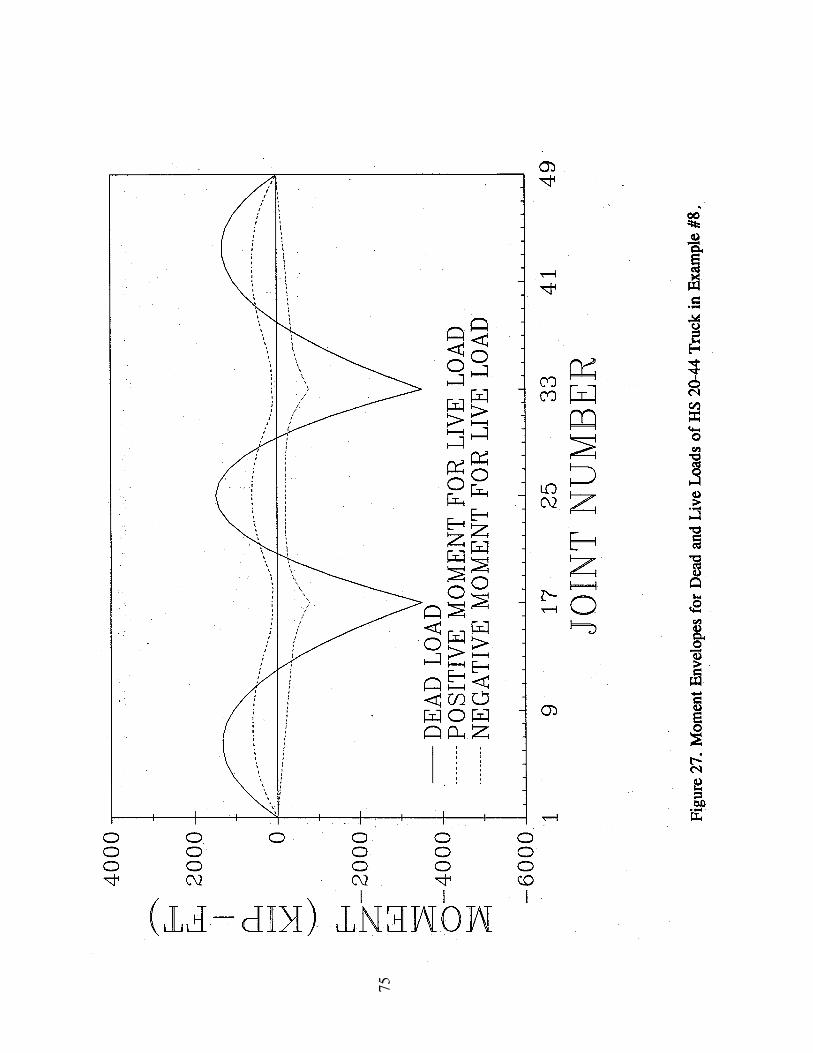
27 Moment Envelopes for Dead and Live Loads of HS 20-44 Truck
in Example #8.......................................……………………………………………..75
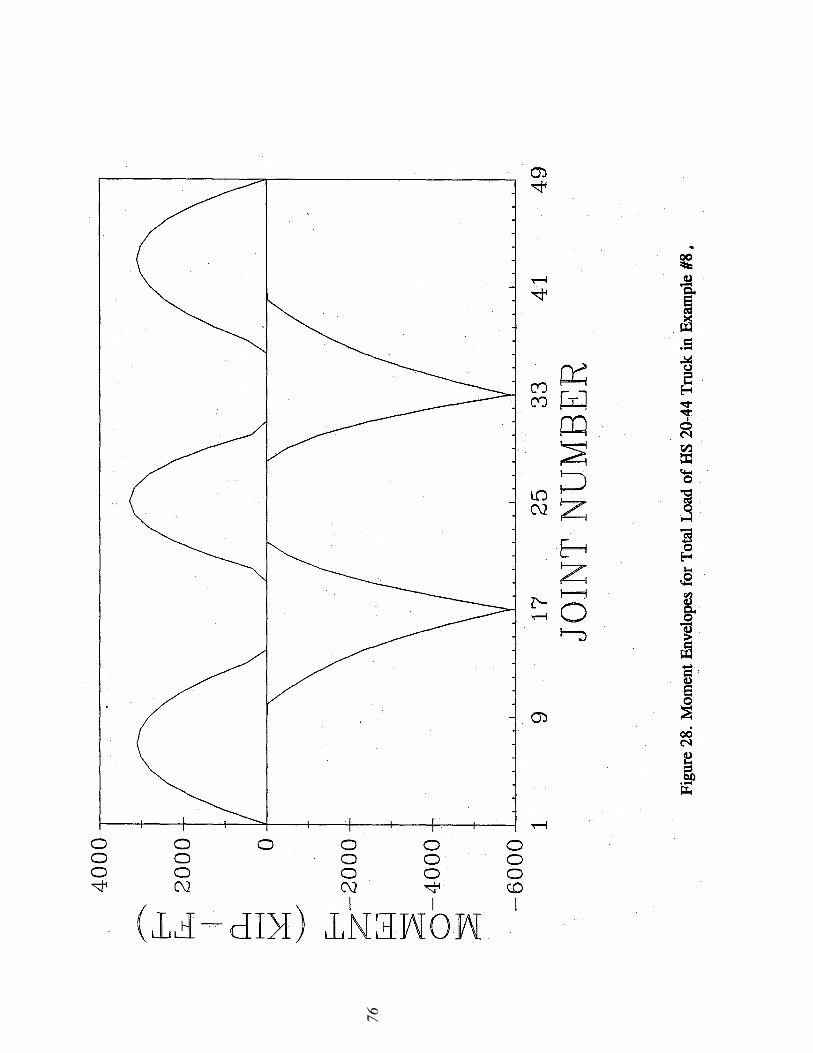
28 Moment Envelopes for Total Load of HS 20-44 Truck in Example #8 ....…………76
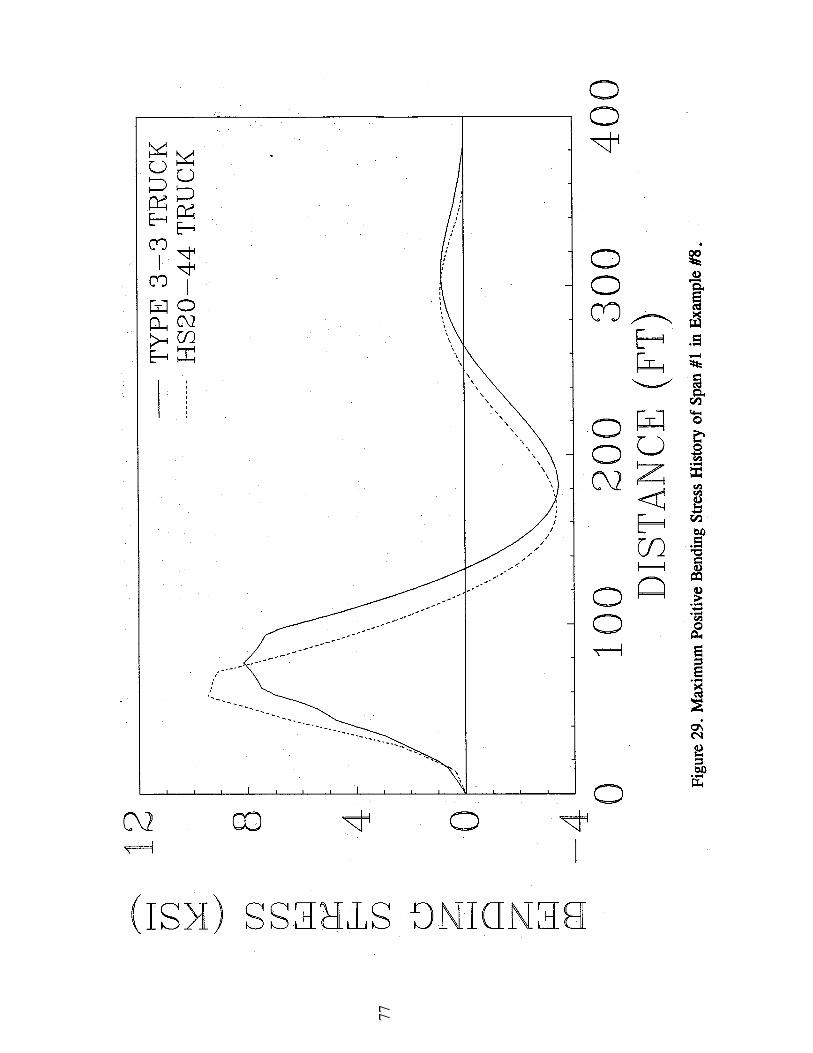
29 Maximum Positive Bending Stress History of Span #1 in Example #8 ....………..77
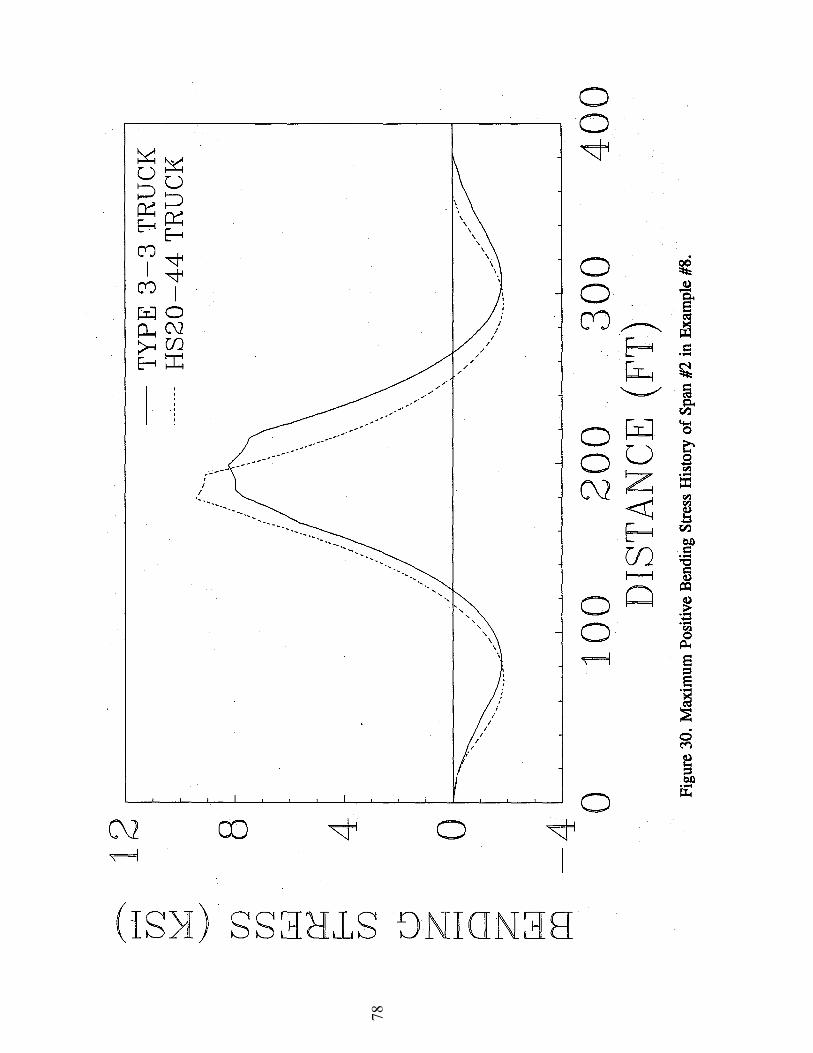
30 Maximum Positive Bending Stress History of Span #2 in Example #8 .....…………78
31 Maximum Positive Bending Stress History of Span #3 in Example #8 .....…………79
32 Negative Bending Stress History of Support #2 in Example #8 .........……………..80
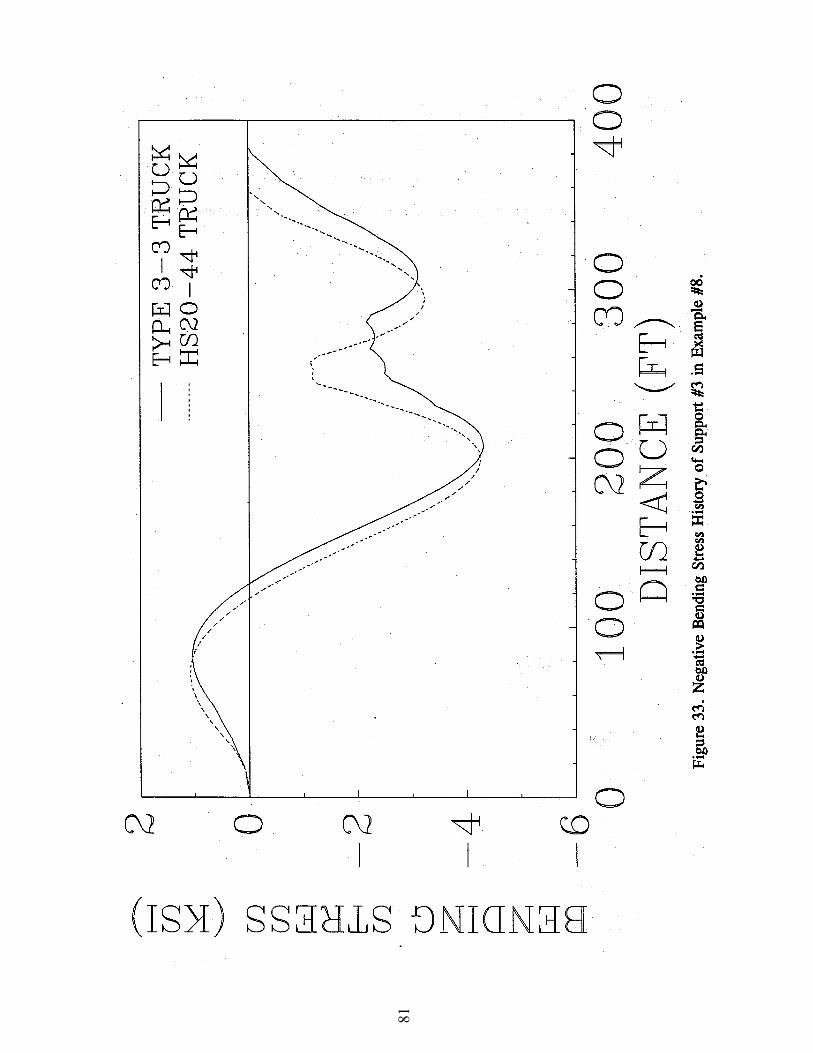
33 Negative Bending Stress History of Support #3 in Example #8 ..........…………….81
34 Plan and Elevation: T-beam Bridge...........................………………………………..83
35 Special Overload Vehicle .............................………………………………………83
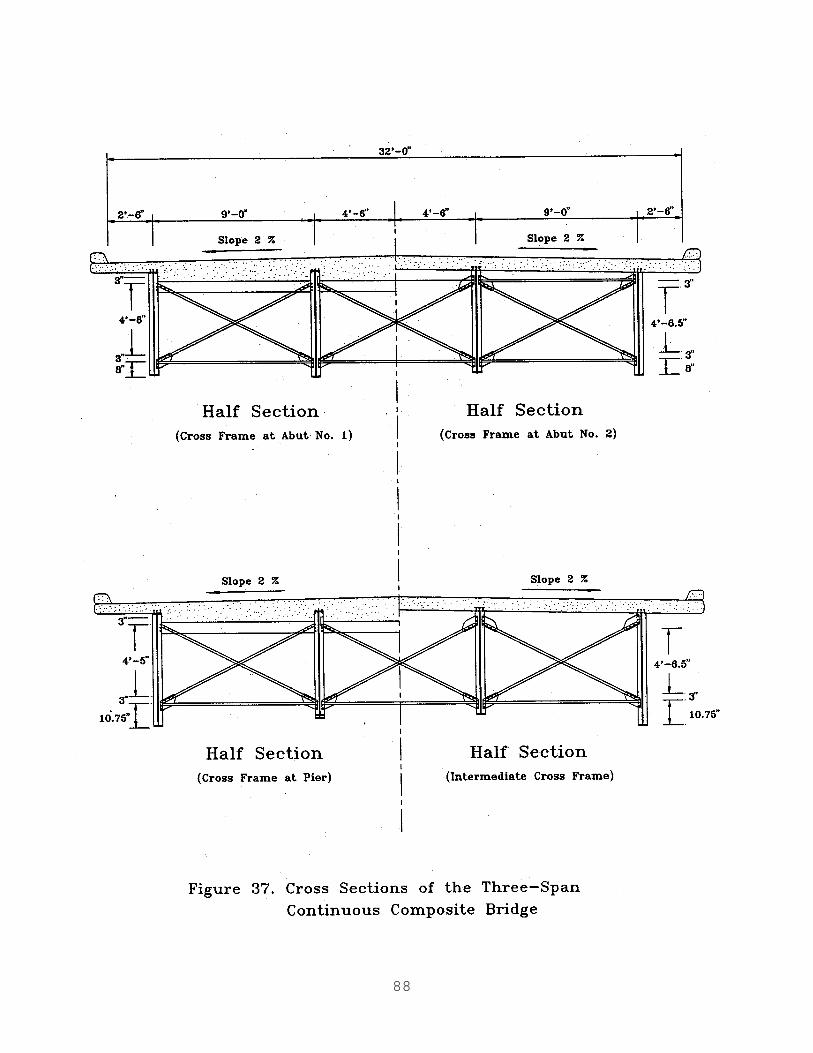
36 Framing Plan of the Three Span Continuous Composite Bridge .........…………….87
37 Cross Section of the Three Span Continuous Composite Bridge .........…………….88
viii
Page 10
CHAPTER I
INTRODUCTION
Bridge evaluation during the late 1970s revealed that roadways in the 50 states have just
over half a million bridges. Of these, nearly 105,000 of the nation's bridges were rated critically
deficient. The Federal Highway Administration (FHWA) survey shows that one highway bridge
out of every five in the United States is deficient and dangerous to use. It also shows that every
two days, on the average, a bridge will sag, buckle, or collapse [12,14]. The seriousness of these
hazards increases each year.
Many early bridges still exist throughout the whole country and are quite serviceable when
properly maintained. Thus, capacity rating and predicting the remaining service life of these
bridges are necessary in order to insure their safety for the traveling public and to protect their
initial investment.
Many of the structures that come under the bridge maintenance inspection problem are
complex and therefore difficult to analyze for safe load-carrying capacity. The proper computer
software could be a very useful aid in analyzing complex structures. Several computer-aided
analysis system, like Bridge and Analysis (BRASS) (System orientation manual) [11], Bridge
Analysis and Design (BRANDE) [7], and Overload Route Program (OVLOAD) [13], are
available as a tool in determining the safe load-carrying capacity of bridges. All of them provided
a computerized method of determining the Inventory and Operating Rating described in
AASHTO Manual for Maintenance Inspection of Bridges [7] or early editions.
10
Page 11
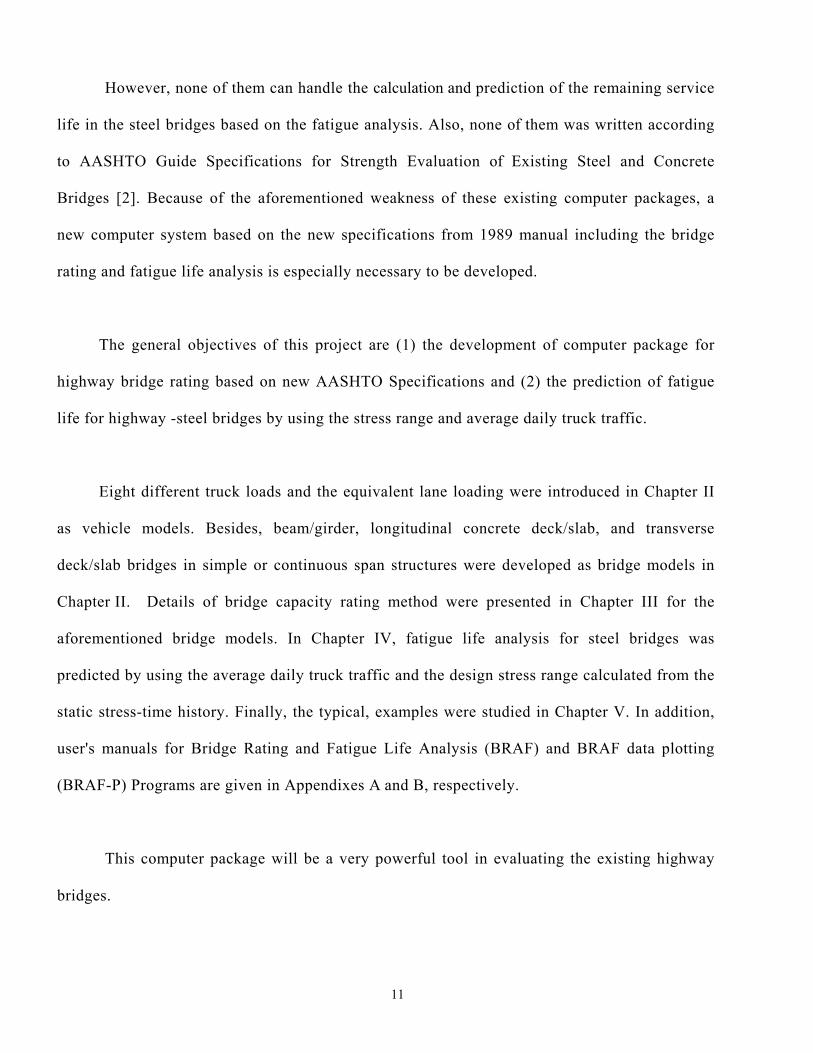
However, none of them can handle the calculation and prediction of the remaining service
life in the steel bridges based on the fatigue analysis. Also, none of them was written according
to AASHTO Guide Specifications for Strength Evaluation of Existing Steel and Concrete
Bridges [2]. Because of the aforementioned weakness of these existing computer packages, a
new computer system based on the new specifications from 1989 manual including the bridge
rating and fatigue life analysis is especially necessary to be developed.
The general objectives of this project are (1) the development of computer package for
highway bridge rating based on new AASHTO Specifications and (2) the prediction of fatigue
life for highway -steel bridges by using the stress range and average daily truck traffic.
Eight different truck loads and the equivalent lane loading were introduced in Chapter II
as vehicle models. Besides, beam/girder, longitudinal concrete deck/slab, and transverse
deck/slab bridges in simple or continuous span structures were developed as bridge models in
Chapter II. Details of bridge capacity rating method were presented in Chapter III for the
aforementioned bridge models. In Chapter IV, fatigue life analysis for steel bridges was
predicted by using the average daily truck traffic and the design stress range calculated from the
static stress-time history. Finally, the typical, examples were studied in Chapter V. In addition,
user's manuals for Bridge Rating and Fatigue Life Analysis (BRAF) and BRAF data plotting
(BRAF-P) Programs are given in Appendixes A and B, respectively.
This computer package will be a very powerful tool in evaluating the existing highway
bridges.
11
Page 12
CHAPTER II
VEHICLE AND BRIDGE MODELS
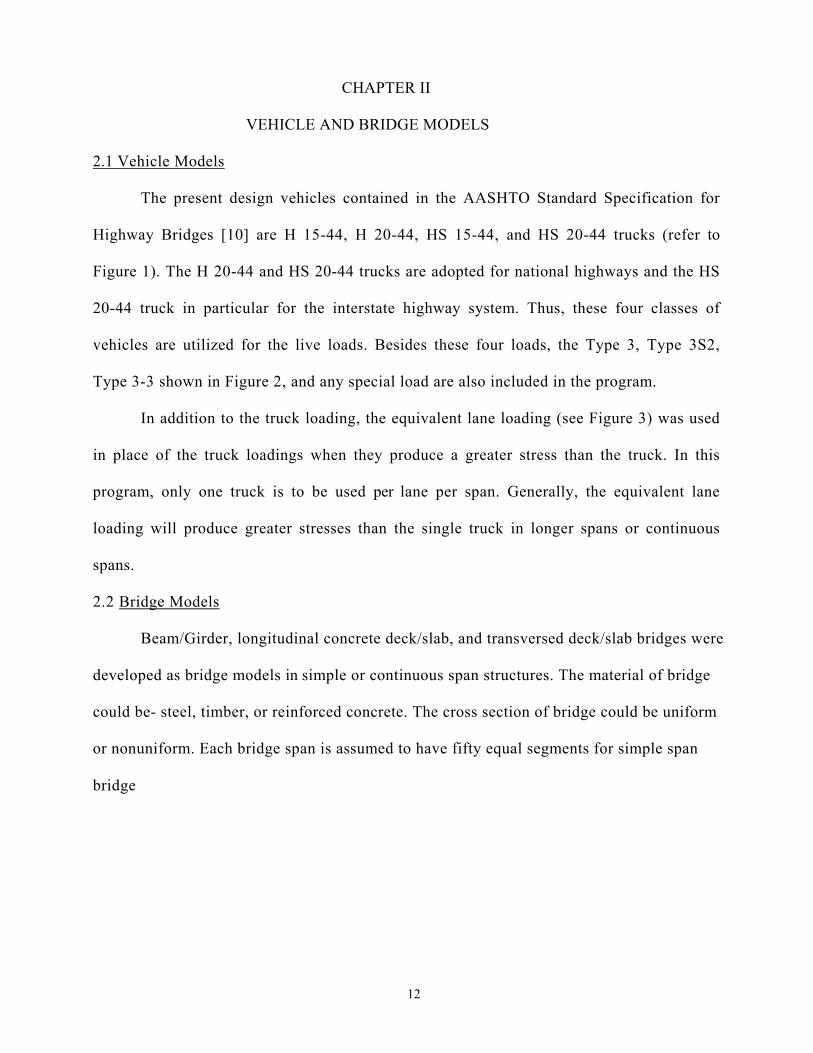
2.1 Vehicle Models
The present design vehicles contained in the AASHTO Standard Specification for
Highway Bridges [10] are H 15-44, H 20-44, HS 15-44, and HS 20-44 trucks (refer to
Figure 1). The H 20-44 and HS 20-44 trucks are adopted for national highways and the HS
20-44 truck in particular for the interstate highway system. Thus, these four classes of
vehicles are utilized for the live loads. Besides these four loads, the Type 3, Type 3S2,
Type 3-3 shown in Figure 2, and any special load are also included in the program.
In addition to the truck loading, the equivalent lane loading (see Figure 3) was used
in place of the truck loadings when they produce a greater stress than the truck. In this
program, only one truck is to be used per lane per span. Generally, the equivalent lane
loading will produce greater stresses than the single truck in longer spans or continuous
spans.
2.2 Bridge Models
Beam/Girder, longitudinal concrete deck/slab, and transversed deck/slab bridges were
developed as bridge models in simple or continuous span structures. The material of bridge
could be- steel, timber, or reinforced concrete. The cross section of bridge could be uniform
or nonuniform. Each bridge span is assumed to have fifty equal segments for simple span
bridge
12
Page 16
and sixteen equal segments for continuous span bridge (see Figure 4). Nodes are introduced at
the end of each segment. Each node is assigned three degrees of freedom, two translational and
one rotational. The moment and shear at each joint across the span can be found and analyzed.
Page 18
CHAPTER III
BRIDGE CAPACITY RATING
3.1 Beam/Girder Bridges
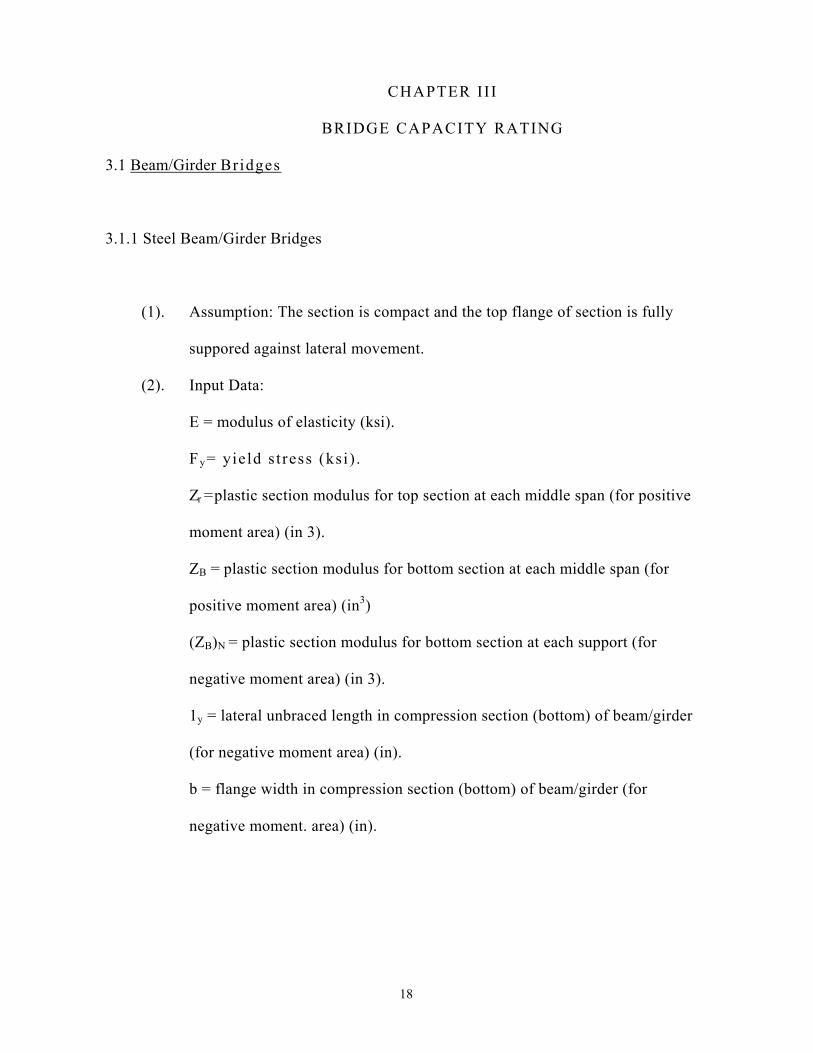
3.1.1 Steel Beam/Girder Bridges
(1). Assumption: The section is compact and the top flange of section is fully
suppored against lateral movement.
(2). Input Data:
E = modulus of elasticity (ksi).
Fy= yield s t ress (ksi ) .
Zr = plastic section modulus for top section at each middle span (for positive
moment area) (in 3).
ZB = plastic section modulus for bottom section at each middle span (for
positive moment area) (in3)
(ZB)N = plastic section modulus for bottom section at each support (for
negative moment area) (in 3).
1y = lateral unbraced length in compression section (bottom) of beam/girder
(for negative moment area) (in).
b = flange width in compression section (bottom) of beam/girder (for
negative moment. area) (in).
18
Page 19
d = depth of beam/girder (in).
tw = web thickness of beam/girder (in).
ry = radius of gyration with respect to y-y (transverse) axis (in).
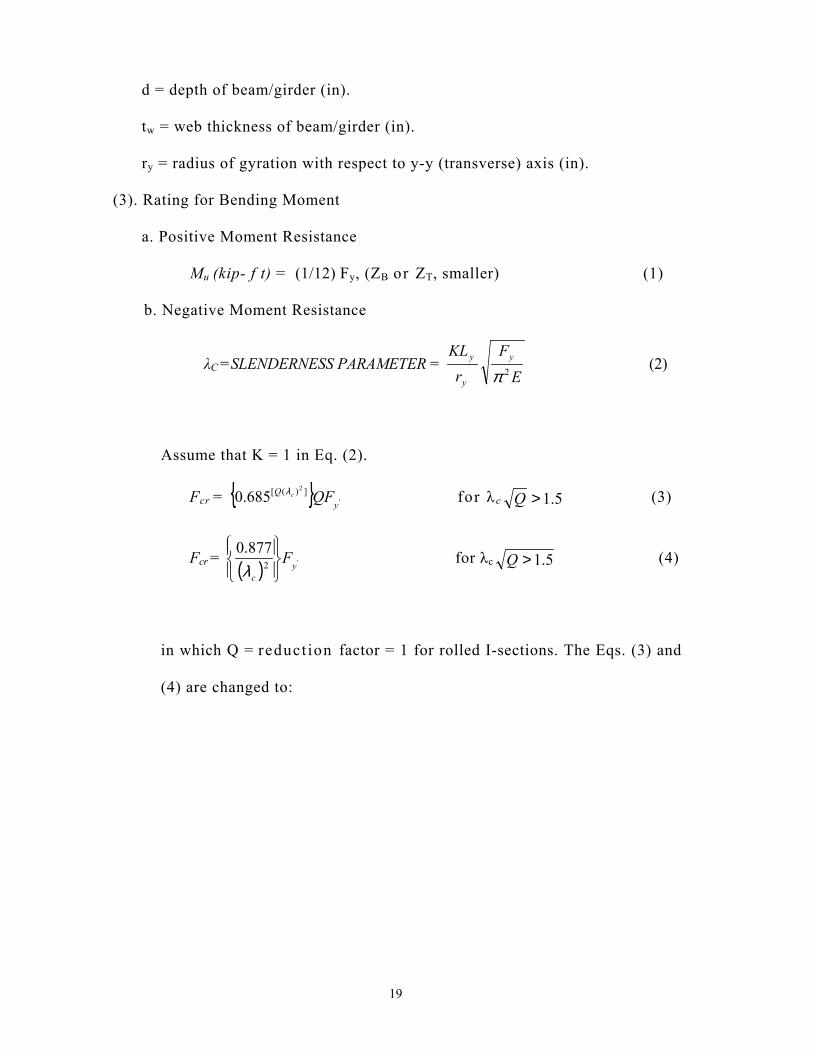
(3). Rating for Bending Moment
a. Positive Moment Resistance
Mu (kip- f t) = (1/12) Fy, (ZB or ZT, smaller) (1)
b. Negative Moment Resistance
λC =SLENDERNESS PARAMETER = E
Fr
KL y
y
y2π
(2)
Assume that K = 1 in Eq. (2).
Fcr = { } '
2 ])([685.0y
Q QFcλ for λ c 5.1>Q (3)
Fcr = ( ) '2
877.0y
c
F
λ for λc 5.1>Q (4)
in which Q = reduct ion factor = 1 for rolled I-sections. The Eqs. (3) and
(4) are changed to:
19
Page 20
( ){ } '
2 ][685.0ycr FF cλ= for λc 5.1≤ (5)
( ) '2
877.0y
ccr FF
=λ
for c 5.1>λ (6)
Mu(kip-ft) =
121 Fcr(ZB)N (7)
c. Rating Factor
( )IMMM
RFLL
DDu
+−Φ
=1λγ
(8)
in which Mu = resistance moment (kip-ft),
M D = dead load moment (kip-ft),
M D = live load moment (kip-ft),
Φ = resistance factor,
γ D = dead load factor,
γL = live load factor, and
I = impact factor.
(4). Rating for End Shear
20
Page 21
( )IVVV
RFLL
DDu
+−Φ
=1γγ
in which VL = shear resistance (kip) = 0.6Fydtw,
V D = dead load shear (kip), and,
V L = live load shear (kip).
Φ, γD , γL, and I have been defined in the above
section. 3.1.2 Reinforced Concrete Beam/Girder Bridges
(1). Rating for Positive Moment
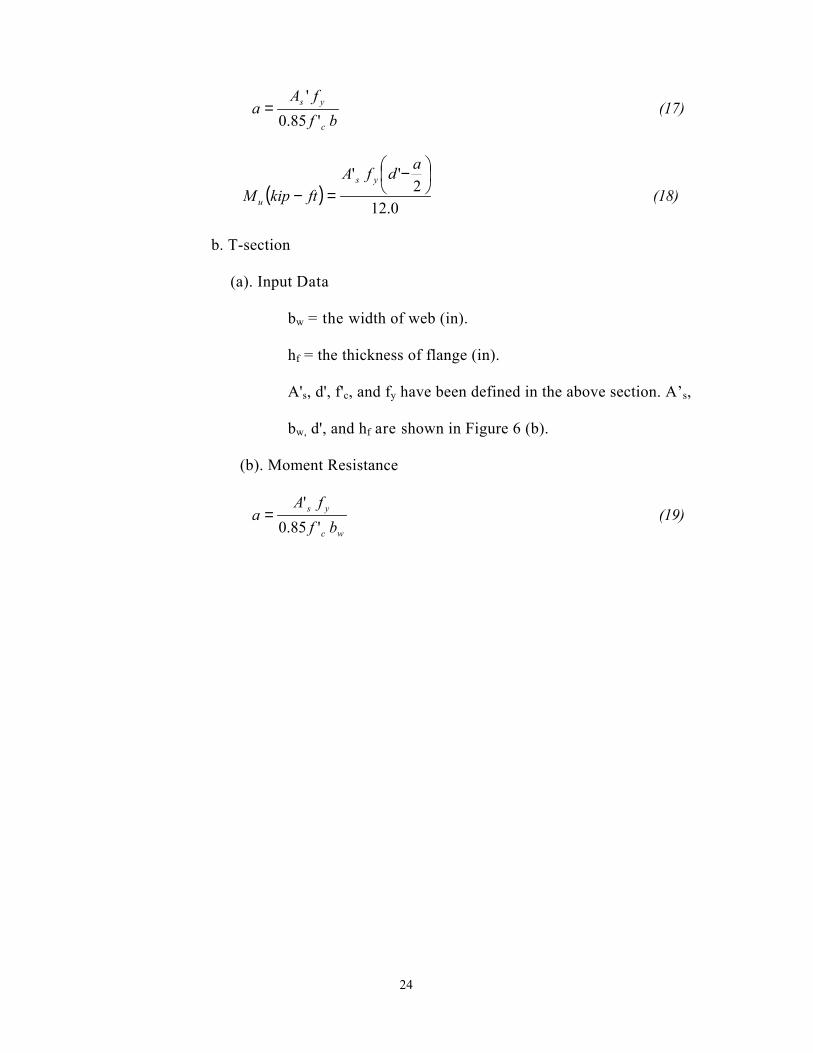
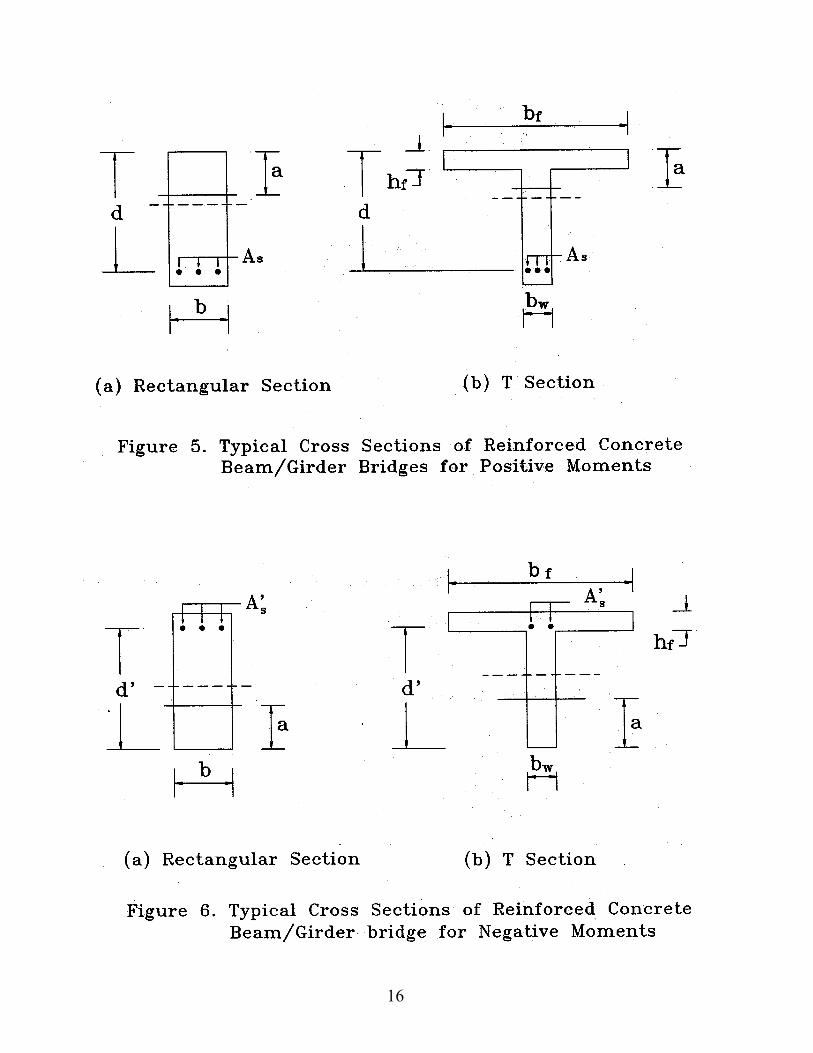
a. Rectangular Cross Section
(a). Input Data
b = the width of section (in).
d = the distance from the center of reinforcement to the top of section (in).
As = the cross section area of reinforcement (in).
f’c = the ultimate strength of concrete (ksi).
fy = the yield strength of reinforcement (ksi).
As, b, and d are shown in Figure 5(a).
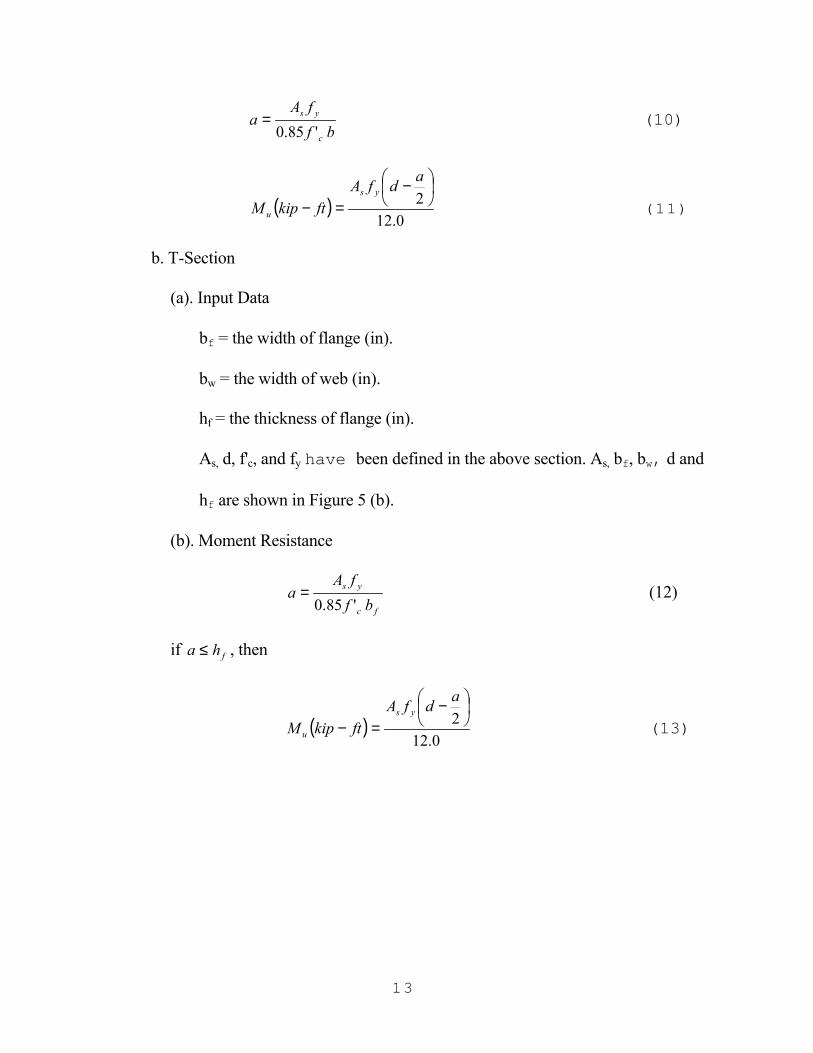
(b). Moment Resistance
21
Page 22
bffA
ac
ys
'85.0= (10)
( )0.12
2
−
=−
adfAftkipM
ys
u (11)
b. T-Section
(a). Input Data
bf = the width of flange (in).
bw = the width of web (in).
hf = the thickness of flange (in).
As, d, f'c, and fy have been defined in the above section. As, bf, bw, d and
hf are shown in Figure 5 (b).
(b). Moment Resistance
fc
ys
bffA
a'85.0
= (12)
if ha ≤ , then f
( )0.12
2
−
=−
adfAftkipM
ys
u (13)
13
Page 23
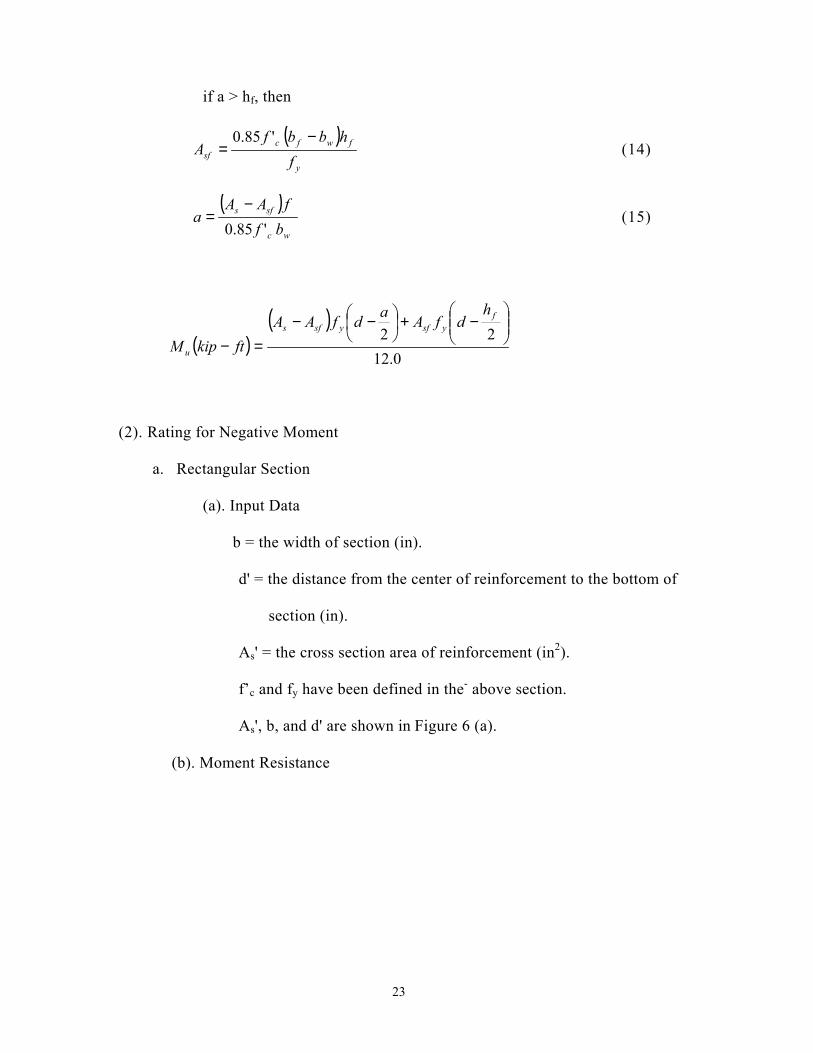
if a > hf, then
( )
y
fwfcsf f
hbbfA
−=
'85.0 (14)
( )
wc
sfs
bffAA
a'85.0
−= (15)
( )( )
0.1222
−+
−−
=−
fysfysfs
u
hdfAadfAA
ftkipM
(2). Rating for Negative Moment
a. Rectangular Section
(a). Input Data
b = the width of section (in).
d' = the distance from the center of reinforcement to the bottom of
section (in).
As' = the cross section area of reinforcement (in2).
f’c and fy have been defined in the- above section.
As', b, and d' are shown in Figure 6 (a).
(b). Moment Resistance
23
Page 24
bffA
ac
ys
'85.0'
= (17)
( )0.12
2''
−
=−
adfAftkipM
ys
u (18)
b. T-section
(a). Input Data
bw = the width of web (in).
hf = the thickness of flange (in).
A's, d', f'c, and fy have been defined in the above section. A’s,
bw, d', and hf are shown in Figure 6 (b).
(b). Moment Resistance
wc
ys
bffA
a'85.0
'= (19)
24
Page 26
( )0.12
2''
−
=−
adfAftkipM
ys
u ( 2 0 )
( 3 ) . Rating Factor
The equation of rating factor is shown in Eq. (8).
3.1.3 Timber Beam/Girder Bridges (Simple Bridges Only)
(1). Input Data
fb = allowable bending stress (ksi).
ST= section modulus for top section (in3).
SB = section modulus for bottom section (in).
(2). Moment Resistance
( ) bu fftkipM
=−121 ( S B o r S T , s m a l l e r ) (21)
(3). Rating Factor
The equation of rating factor is shown in Eq. (8).
3.2 Longitudinal Concrete Deck/Slab Bridges
3.2.1 Rating for Positive Moment
(1). Input Data
17
Page 27
As = the cross section area of reinforcement per 1 foot deck/slab (in2/ft).
d, f'c, and fy have been defined in the section of reinforced concrete beam/girder
bridges. As and d are shown in Figure 7 (a).
(2). Moment Resistance and Live Load Moment
0.12'85.0 c
ys
ffA
a = ( 2 3 )
ML = LIVE LOAD MOMENT = E
OMENTWHEELLOADM (24)
in which E = distribution width (ft) = 4 + 0.065 7' and S = effective span length (ft) ≤
3.2.2 Rating for Negative Moment
(1). Input Data
A’s = the cross section area of reinforcement per 1 foot deck/slab (in 2/ft).
d', f'c, and fy have been defined in the section of reinforced concrete beam/girder
bridges. A’s, and d' are shown in Figure 7 (b).
18
Page 28
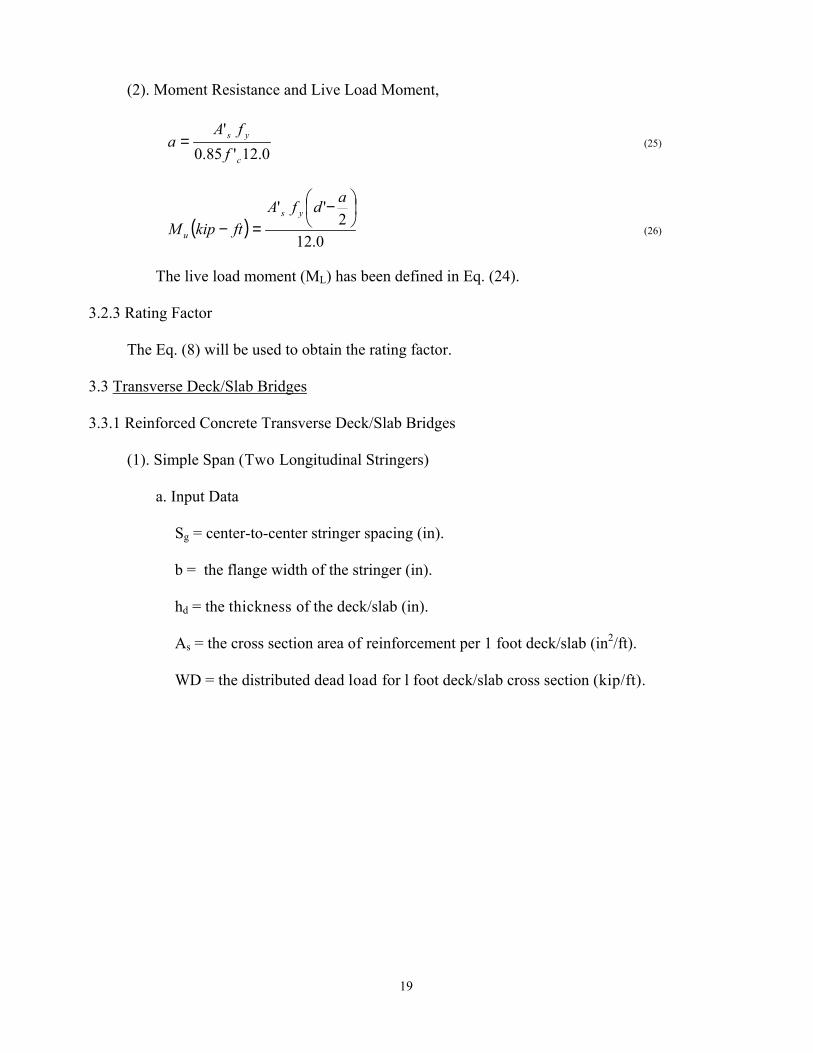
(2). Moment Resistance and Live Load Moment,
0.12'85.0
'
c
ys
ffA
a = (25)
( )0.12
2''
−
=−
adfAftkipM
ys
u (26)
The live load moment (ML) has been defined in Eq. (24).
3.2.3 Rating Factor
The Eq. (8) will be used to obtain the rating factor.
3.3 Transverse Deck/Slab Bridges
3.3.1 Reinforced Concrete Transverse Deck/Slab Bridges
(1). Simple Span (Two Longitudinal Stringers)
a. Input Data
Sg = center-to-center stringer spacing (in).
b = the flange width of the stringer (in).
hd = the thickness of the deck/slab (in).
As = the cross section area of reinforcement per 1 foot deck/slab (in2/ft).
WD = the distributed dead load for l foot deck/slab cross section (kip/ft).
19
Page 29
d, f'c, and fy, have been defined in the section of reinforced concrete beam/girder
bridges. As and d are shown in Figure 7 (a).
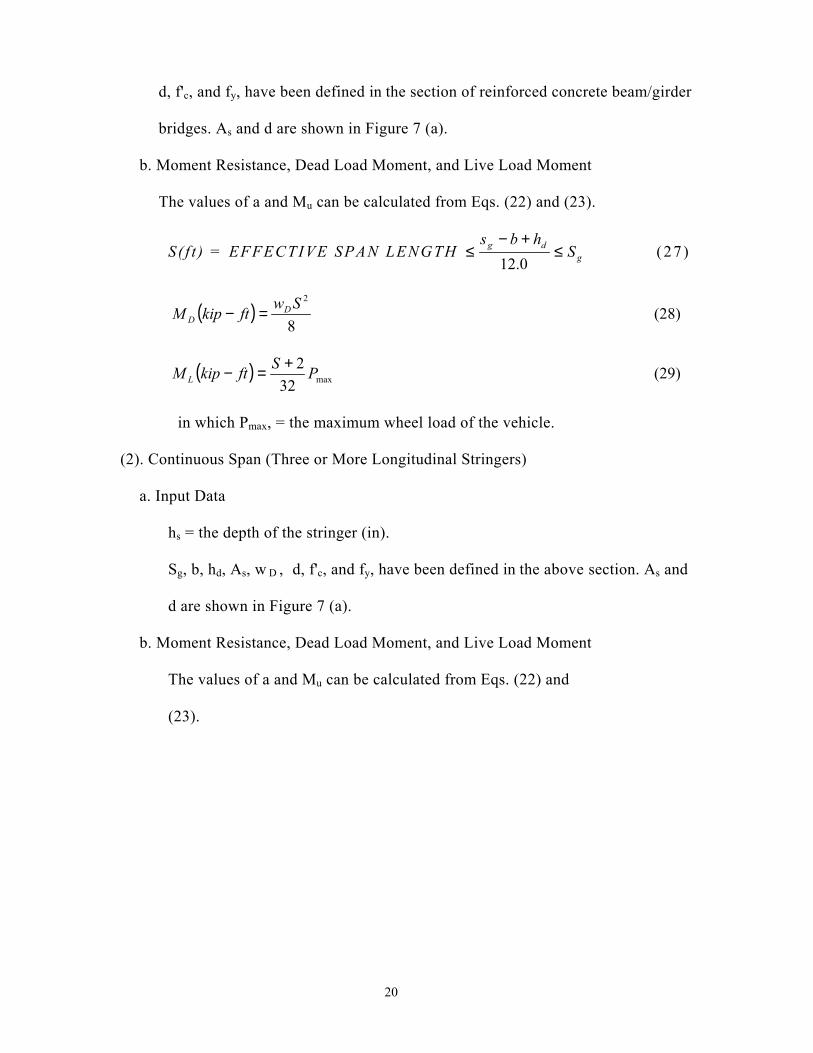
b. Moment Resistance, Dead Load Moment, and Live Load Moment
The values of a and Mu can be calculated from Eqs. (22) and (23).
S( f t ) = EFFECTIVE SPAN LENGTH gdg S
hbs≤
+−≤
0.12 (27)
( )8
2SwftkipM DD =− (28)
( ) max322 PSftkipM L
+=− (29)
in which Pmax, = the maximum wheel load of the vehicle.
(2). Continuous Span (Three or More Longitudinal Stringers)
a. Input Data
hs = the depth of the stringer (in).
Sg, b, hd, As, w D , d, f'c, and fy, have been defined in the above section. As and
d are shown in Figure 7 (a).
b. Moment Resistance, Dead Load Moment, and Live Load Moment
The values of a and Mu can be calculated from Eqs. (22) and
(23).
20
Page 30
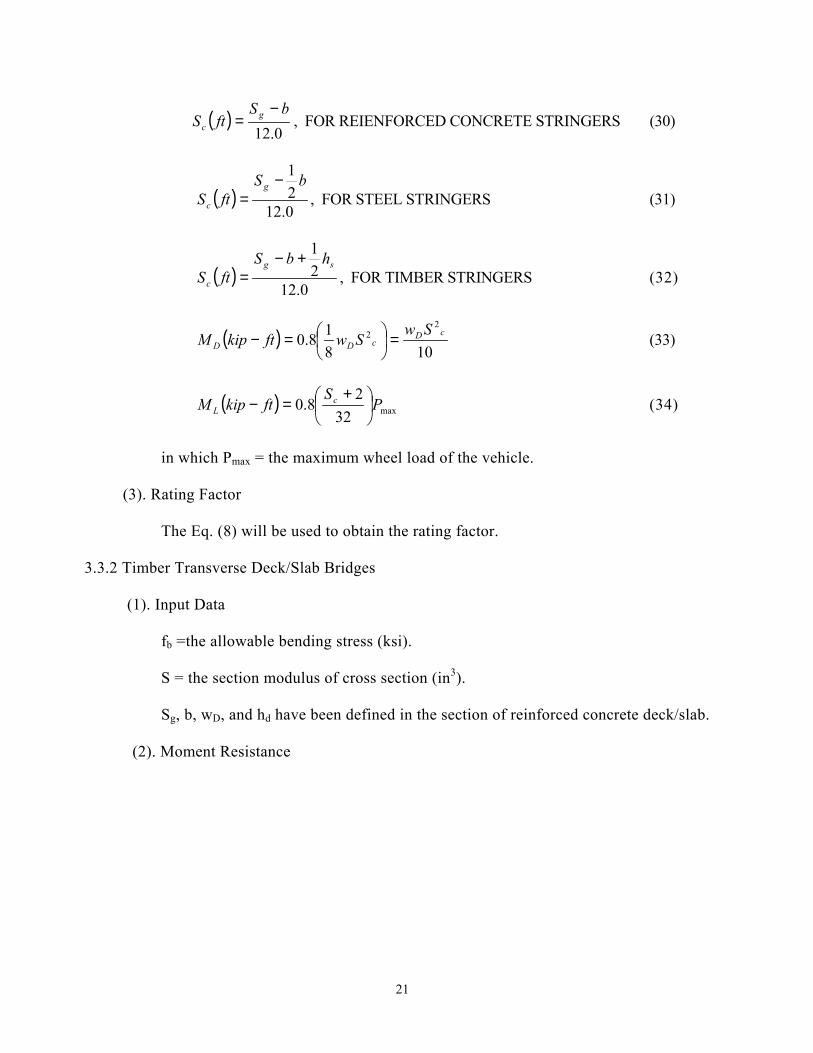
( )0.12bS
ftS gc
−= , FOR REIENFORCED CONCRETE STRINGERS (30)
( )0.1221 bS
ftSg
c
−= , FOR STEEL STRINGERS (31)
( )0.12
21
sg
c
hbSftS
+−= , FOR TIMBER STRINGERS (32)
( )108
18.02
2 cDcDD
SwSwftkipM =
=− (33)
( ) max322
8.0 PS
ftkipM cL
+
=− (34)
in which Pmax = the maximum wheel load of the vehicle.
(3). Rating Factor
The Eq. (8) will be used to obtain the rating factor.
3.3.2 Timber Transverse Deck/Slab Bridges
(1). Input Data
fb =the allowable bending stress (ksi).
S = the section modulus of cross section (in3).
Sg, b, wD, and hd have been defined in the section of reinforced concrete deck/slab.
(2). Moment Resistance
21
Page 31
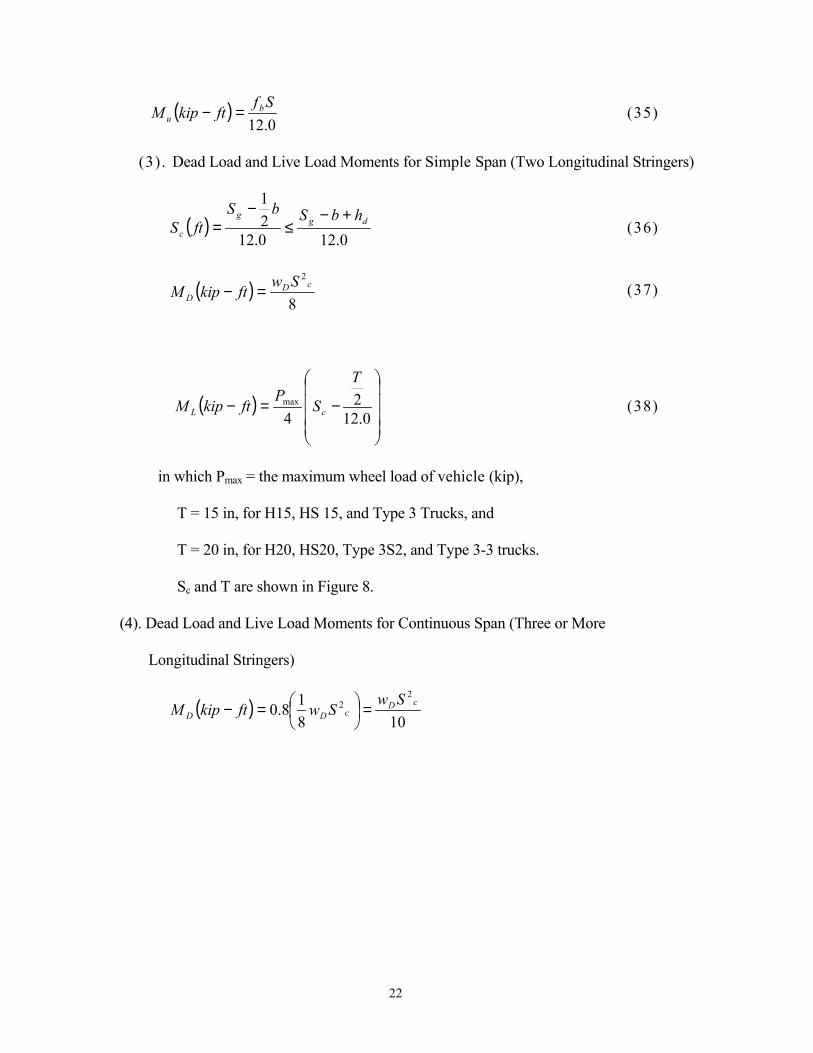
( )0.12Sf
ftkipM bu =− (35)
(3). Dead Load and Live Load Moments for Simple Span (Two Longitudinal Stringers)
( )0.120.12
21
dgg
c
hbSbSftS
+−≤
−= (36)
( )8
2cD
DSwftkipM =− (37)
( )
−=−0.12
24max
T
SP
ftkipM cL (38)
in which Pmax = the maximum wheel load of vehicle (kip),
T = 15 in, for H15, HS 15, and Type 3 Trucks, and
T = 20 in, for H20, HS20, Type 3S2, and Type 3-3 trucks.
Sc and T are shown in Figure 8.
(4). Dead Load and Live Load Moments for Continuous Span (Three or More
Longitudinal Stringers)
( )108
18.02
2 cDcDD
SwSwftkipM =
=−
22
Page 33
( )
−
=−
0.122
48.0 max
T
SP
ftkipM cL (40)
Sc, T, Pmax, and wD have been defined in the above section.
Sc and T are shown in Figure 8.
(5). Rating Factor
The Eq. (8) will be used to obtain the rating factor.
24
Page 34
CHAPTER IV
FATIGUE LIFE ANALYSIS
The fatigue life of a member depends upon its stress range (i.e., the algebraic
difference - between the, maximum and minimum stress), number of cycles and the method of
connection, as demonstrated by Fisher [1]. The design stress range can be calculated from the
stress history, caused by the passage of a single vehicle model across the bridge. It must also
include the effect of impact and load distribution on the bridges.
The fatigue life will be determined by using the method suggested by Schilling
and Klippstein [9]. This method is an extension of Fisher's research [1]. According to the
method, N, the number of cycles to fatigue failure is related to the equivalent stress range,
S, (ksi), by the following equation:
N = A / (Sc)m (41)
where m is the slope of SN curve, m = 3 is used in the suggested design method, and A is a
constant whose values for the various AASHTO categories are listed in the Table 1
(Schilling and Klippstein 1978). The design SN curves that were defined by the above
equation and Table 1 are shown in Figure 9.
Based on the cumulative damage law of Miner's theory [8], the equivalent stress
range Sc becomes
25
Page 36
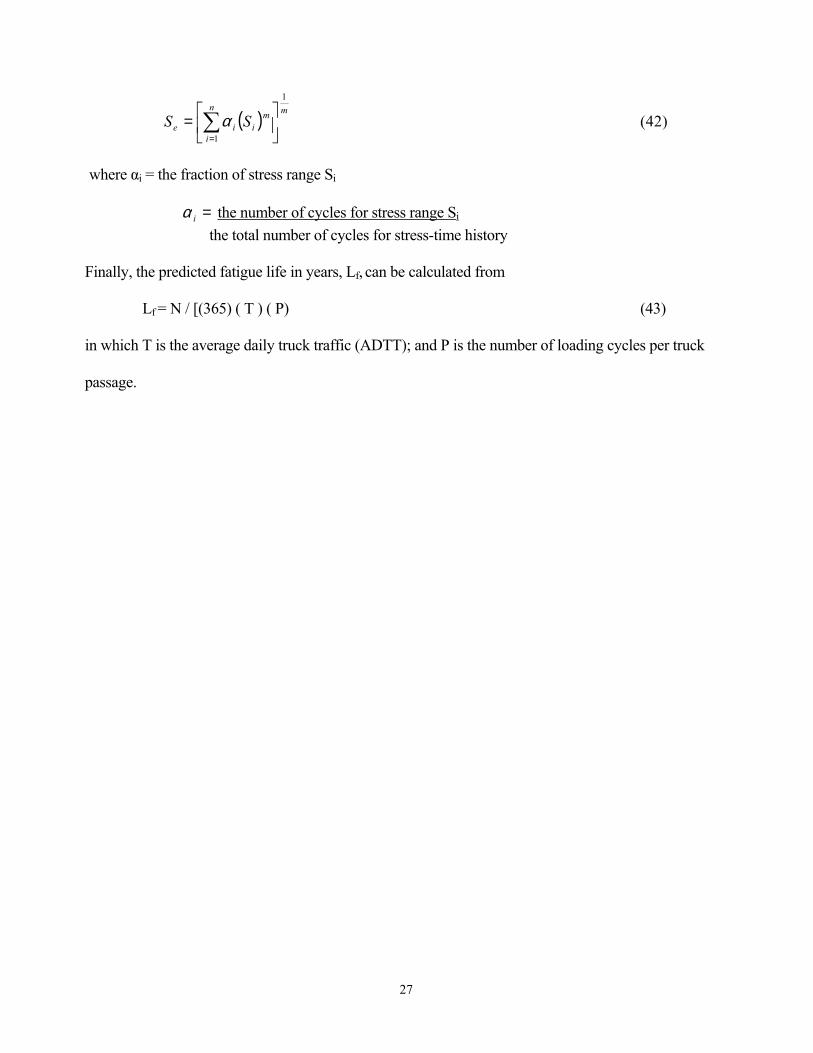
( ) mn
i
miie SS
1
1
= ∑=
α (42)
where αi = the fraction of stress range Si
=iα the number of cycles for stress range Si
the total number of cycles for stress-time history
Finally, the predicted fatigue life in years, Lf, can be calculated from
Lf = N / [(365) ( T ) ( P) (43)
in which T is the average daily truck traffic (ADTT); and P is the number of loading cycles per truck
passage.
27
Page 37
CHAPTER V
EXAMPLES
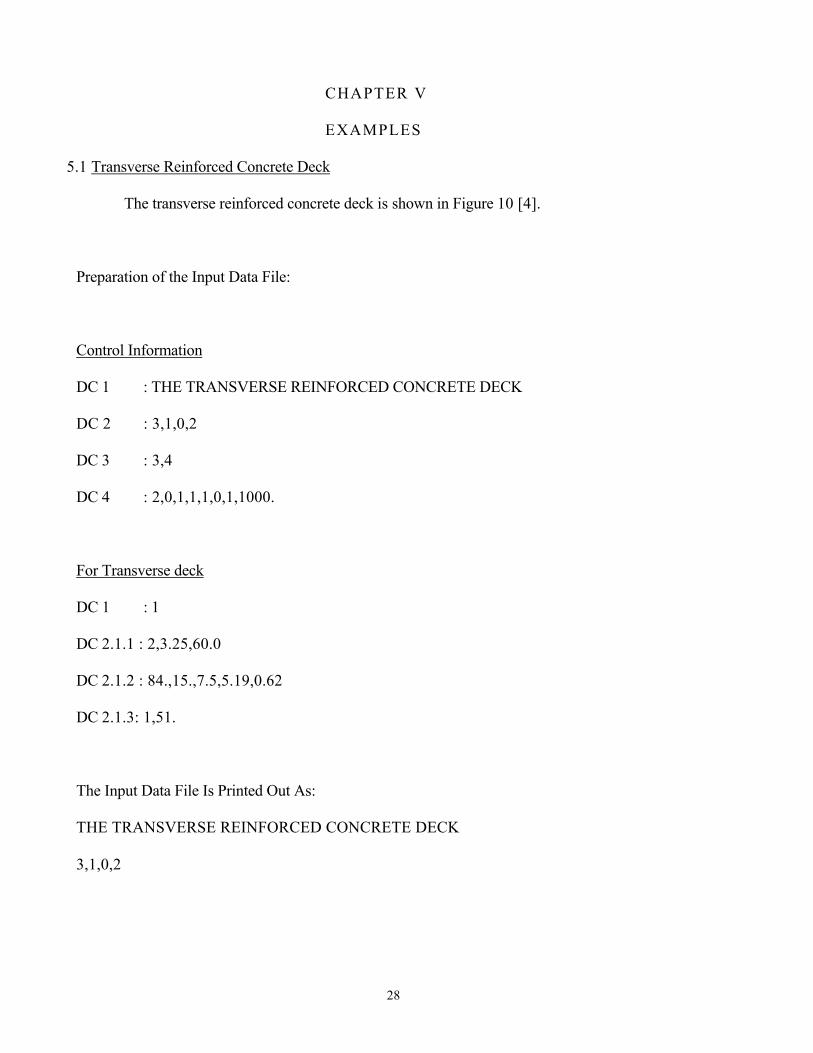
5.1 Transverse Reinforced Concrete Deck
The transverse reinforced concrete deck is shown in Figure 10 [4].
Preparation of the Input Data File:
Control Information
DC 1 : THE TRANSVERSE REINFORCED CONCRETE DECK
DC 2 : 3,1,0,2
DC 3 : 3,4
DC 4 : 2,0,1,1,1,0,1,1000.
For Transverse deck
DC 1 : 1
DC 2.1.1 : 2,3.25,60.0
DC 2.1.2 : 84.,15.,7.5,5.19,0.62
DC 2.1.3: 1,51.
The Input Data File Is Printed Out As:
THE TRANSVERSE REINFORCED CONCRETE DECK
3,1,0,2
28
Page 39
3,4 2,0,1,1,1,0,1,1000.0
1
2,3.25,60.0 84.0,15.0,7.5,5.19,0.62
1,51.0
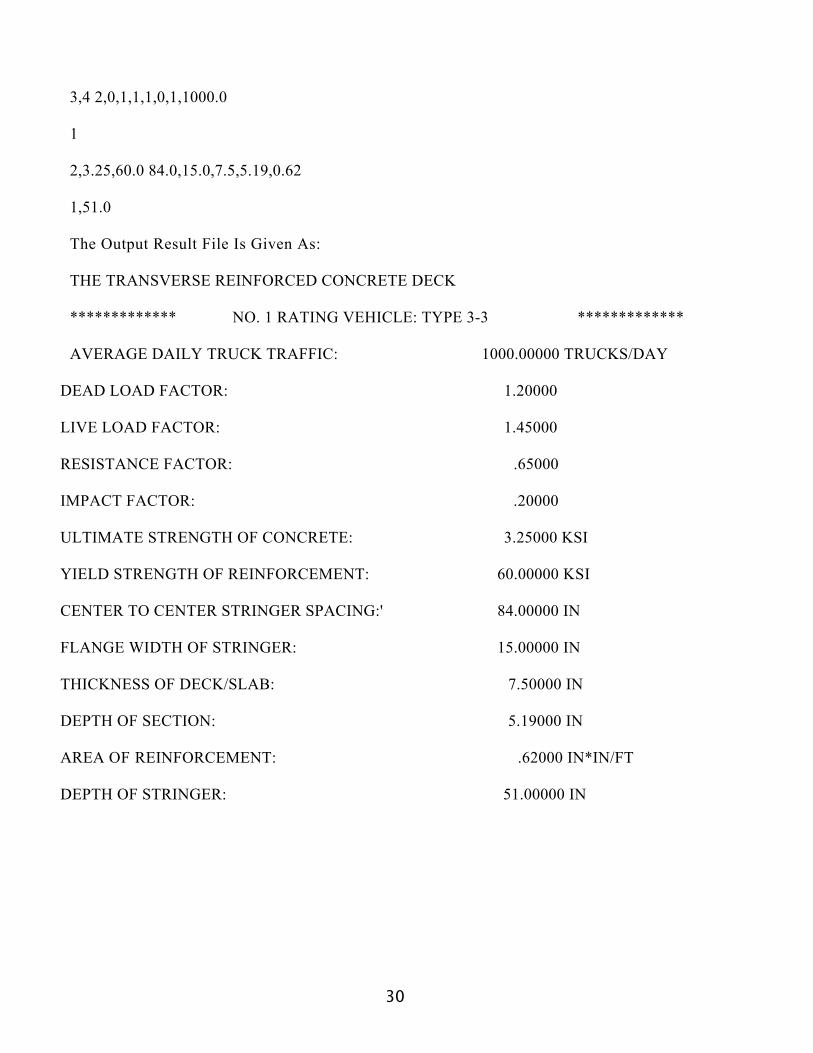
The Output Result File Is Given As:
THE TRANSVERSE REINFORCED CONCRETE DECK
************* NO. 1 RATING VEHICLE: TYPE 3-3 *************
AVERAGE DAILY TRUCK TRAFFIC: 1000.00000 TRUCKS/DAY
DEAD LOAD FACTOR: 1.20000
LIVE LOAD FACTOR: 1.45000
RESISTANCE FACTOR: .65000
IMPACT FACTOR: .20000
ULTIMATE STRENGTH OF CONCRETE: 3.25000 KSI
YIELD STRENGTH OF REINFORCEMENT: 60.00000 KSI
CENTER TO CENTER STRINGER SPACING:' 84.00000 IN
FLANGE WIDTH OF STRINGER: 15.00000 IN
THICKNESS OF DECK/SLAB: 7.50000 IN
DEPTH OF SECTION: 5.19000 IN
AREA OF REINFORCEMENT: .62000 IN*IN/FT
DEPTH OF STRINGER: 51.00000 IN
30
Page 40
************* NO. 2 RATING VEHICLE: HS20-44 *************
AVERAGE DAILY TRUCK TRAFFIC: 1000.00000 TRUCKS/DAY
THE RATING RESULT FOR TRANSVERSE DECK/SLAB BRIDGE
POSITIVE MOMENT
RATING VEHICLE RATING FACTOR
HS20-44 1.63
31
Page 41
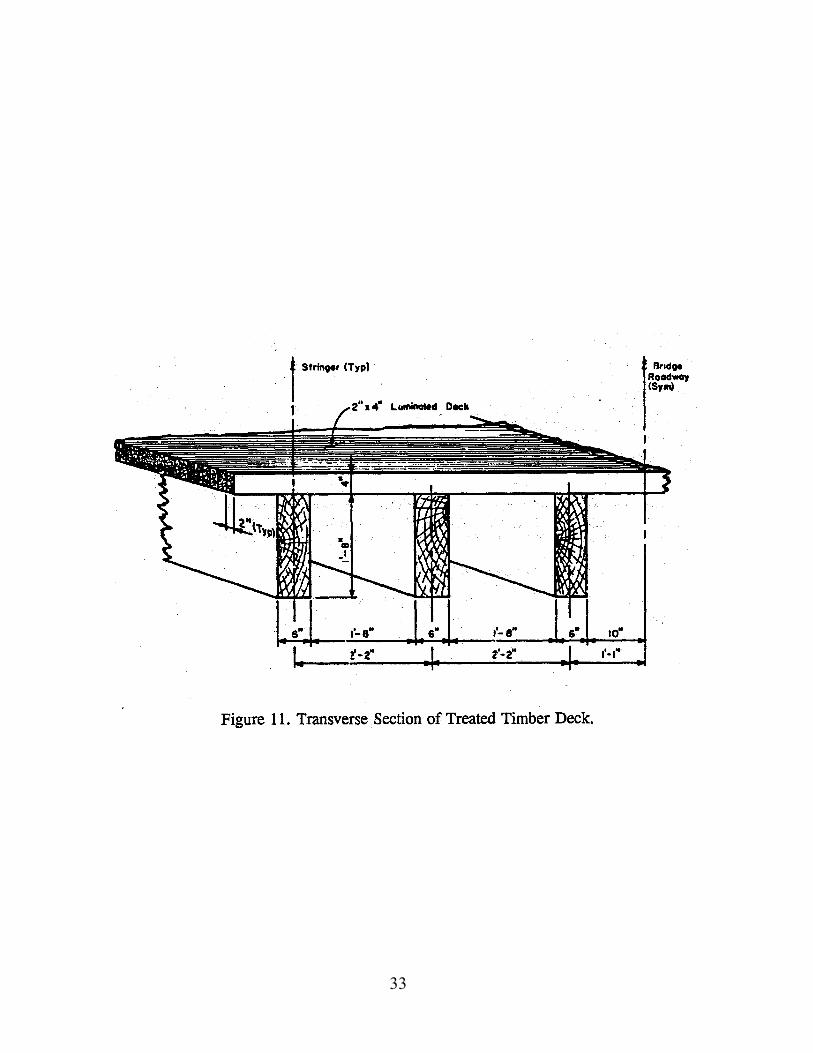
5 . 2 Transverse Treated Timber Deck
The sample problem for a Treated Timber Deck is the rating of a continuous 2 " x 4 "
laminated timber deck supported by 6 " x 2 0 " timber stringers, shown in Figure 11 [6]. The
stringer spacing is 2'-2". The rating load is one 12 kip wheel of an H-15 truck for which the
bridge was originally designed.
Preparation of the Input Data File:
Control Information
DC 1 : Continuous Transverse Laminated Timber Deck
DC 2 : 3 , 1 , 3 , 1
DC 3 : 7
DC 4 : 2 , 1 , 1 , 1 , 1 , 0 , 1 , 1 0 0 0 .
For Transverse deck
D C 1 : 2
DC 2 . 2 . 1 : 2 , 2 . 3 9 4
DC 2 . 2 . 2 : 2 6 . , 6 . , 4 . , 3 0 .
The Input Data File Is Printed Out As:
Continuous Transverse Laminated Timber Deck
3,1,3,1
7
2,1,1,1,1,0,1,1000.
2
2,2.394
26.,6.,4.,30.
3 2
Page 43
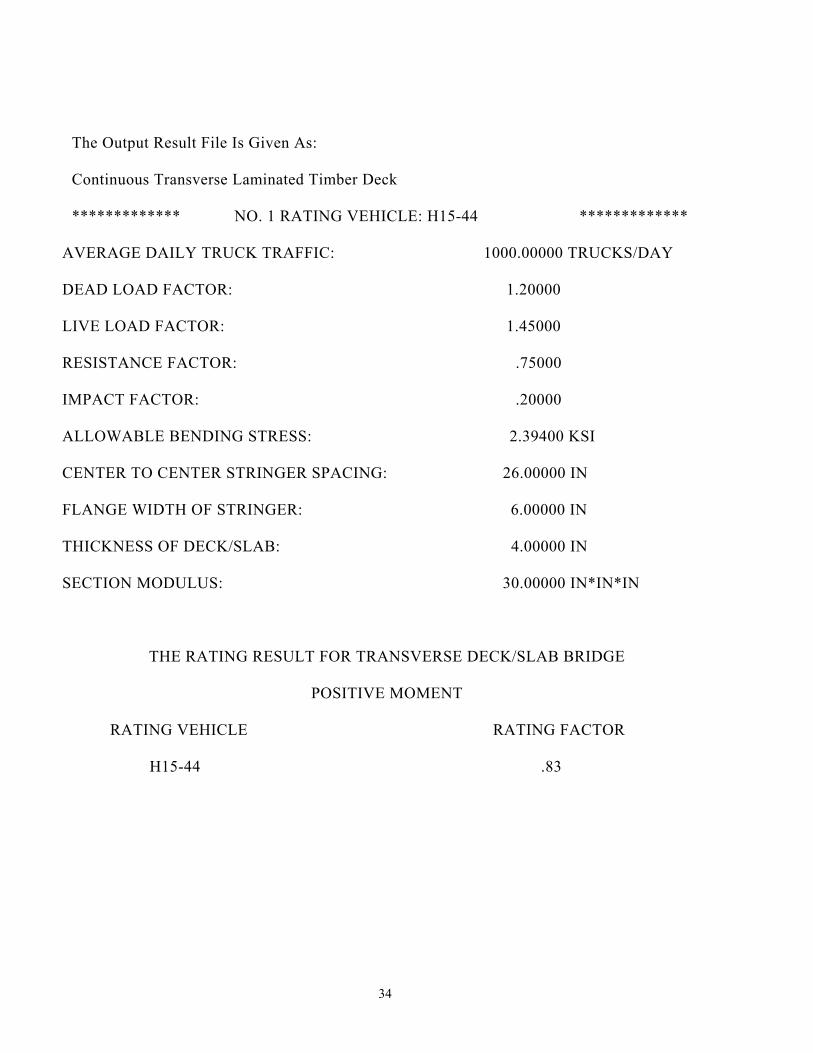
The Output Result File Is Given As:
Continuous Transverse Laminated Timber Deck
************* NO. 1 RATING VEHICLE: H15-44 *************
AVERAGE DAILY TRUCK TRAFFIC: 1000.00000 TRUCKS/DAY
DEAD LOAD FACTOR: 1.20000
LIVE LOAD FACTOR: 1.45000
RESISTANCE FACTOR: .75000
IMPACT FACTOR: .20000
ALLOWABLE BENDING STRESS: 2.39400 KSI
CENTER TO CENTER STRINGER SPACING: 26.00000 IN
FLANGE WIDTH OF STRINGER: 6.00000 IN
THICKNESS OF DECK/SLAB: 4.00000 IN
SECTION MODULUS: 30.00000 IN*IN*IN
THE RATING RESULT FOR TRANSVERSE DECK/SLAB BRIDGE
POSITIVE MOMENT
RATING VEHICLE RATING FACTOR
H15-44 .83
34
Page 44
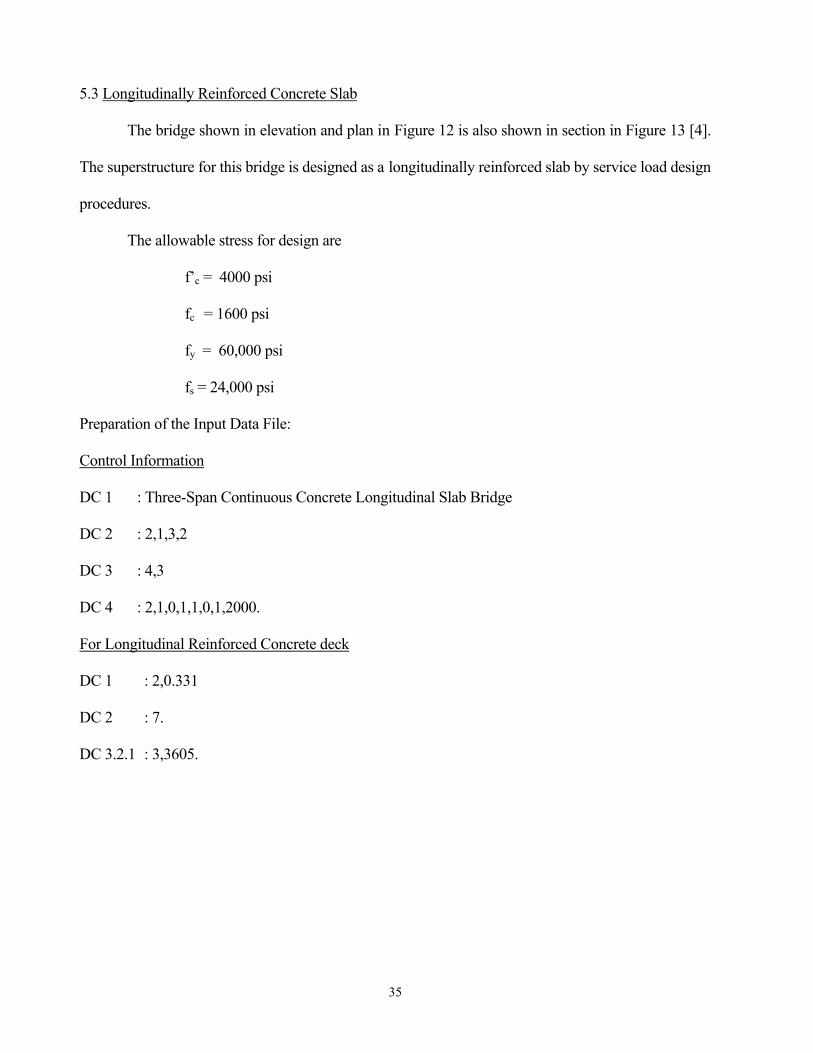
5.3 Longitudinally Reinforced Concrete Slab
The bridge shown in elevation and plan in Figure 12 is also shown in section in Figure 13 [4].
The superstructure for this bridge is designed as a longitudinally reinforced slab by service load design
procedures.
The allowable stress for design are
f’c = 4000 psi
fc = 1600 psi
fy = 60,000 psi
fs = 24,000 psi
Preparation of the Input Data File:
Control Information
DC 1 : Three-Span Continuous Concrete Longitudinal Slab Bridge
DC 2 : 2,1,3,2
DC 3 : 4,3
DC 4 : 2,1,0,1,1,0,1,2000.
For Longitudinal Reinforced Concrete deck
DC 1 : 2,0.331
DC 2 : 7.
DC 3.2.1 : 3,3605.
35
Page 46
DC 3.2.2 : 2.156,3589.,9348.
2:156,3589.,9348:
2.156,3589.,9348.
2.156,3589.,9348.
2.156,3589.,9348.
2.156,3589.,9348.
2.156,3589.,9348.
2.156,3589.,9348.
2.156,3589. 9348.
2.156,3589.,9348.
2.156,3589.,9348.
2.156,3589:,9348.
2.156,3589.,9348.
2.156,3589.,9348.
2.156,3589.,9348.
2.156,3589.,9348.
2.75,3589:,9348.
2.75,3589.,9348.
2:75,3589.,9348.
2.75,3589.,9348.
2.75,3589:,9348.
2.75,3589:,9348.
2.75,3589.,9348.
2.75,3589:,9348.
37
Page 47
2.75,3589.,9348.
2.75,3589.,9348.
2.75,3589.,9348.
2:75,3589.,9348.
2.75,3589.,9348.
2.75,3589:,9348.
2.75,3589.,9348.
2.75,3589.,9348.
2.156,3589.,9348.
2.156,3589.,9348.
2.156,3589.,9348.
2.156,3589.,9348.
2.156,3589.,9348.
2.156,3589.,9348.
2.156,3589.,9348.
2.156,3589.,9348.
2.156,3589.,9348.
2.156,3589.,9348.
2.156,3589.,9348.
2:156,3589.,9348.
2.156,3589.,9348.
2.156,3589.,9348.
2.156,3589.,9348.
2.156,3589.,9348.
38
Page 48
DC 4 . 4.,60.
DC 5.2.1 : 17.,17.,17.
DC 5.2.2 : 16.36,16.36
DC 5.2.3 : 1.35,1.35,1.35
DC 5.2.4 : 2.18,2.18
The Input Data File Is Printed Out As:
Three-Span: Continuous Concrete Longitudinal Slab Bridge
2,1,3,2
4,3 2,1,0,1,1,0,1,2000.
2,0.331
7. 3,3605.
2.156,3589.,9348.
2.156,3589.,9348.
2.156,3589.,9348.
2.156,3589.,9348.
2.156,3589.,9348.
2.156,3589.,9348.
2.156,3589.,9348.
2.156,3589,,9348.
2.156,3589.,9348.
2.156,3589.,9348.
2.156,3589.,9348.
2.156,3589.,9348.
39
Page 49
2.75,3589.,9348. 2.156,3589.,9348. 2.156,3589.,9348. 2.156,3589.,9348. 2.156,3589.,9348. 2.156,3589.,9348. 2.156,3589.,9348.. 2.156,3589.,9348. 2.156,3589.,9348. 2:156,3589.,9348. 2.156,3589.,9348. 2.156,3589.,9348. 2.156,3589.,9348. 2:156,3589.,9348. 2.156,3589.,9348. 2.156,3589-.,9348. 2.156,3589.,9348. 4.,60. 17.,17.,17. 16.36,16.36 1.35,1.35,1.35 2.18,2.18 The Output Result File Is Given As: Three-Span Continuous Concrete Longitudinal Slab Bridge * *********** NO. 1 RATING VEHICLE: HS20-44 ************* AVERAGE DAILY TRUCK TRAFFIC: 2000.00000 TRUCKS/DAY DEAD LOAD FACTOR: 1.20000 LIVE LOAD FACTOR: 1.45000 RESISTANCE FACTOR: .85000 IMPACT FACTOR: .20000 DEAD LOAD OF BRIDGE: .33100 K/FT DISTRIBUTION WIDTH: 7.00000' FT MODULUS OF ELASTICITY OF BRIDGE: 3605.00000 KSI ULTIMATE STRENGTH OF CONCRETE: 4.00000 KSI YIELD STRENGTH OF REINFORCEMENT: 60.00000 KSI SPAN DEPTH AREA OF REINFORCEMENT (IN) (IN*IN/FT) 1 17.00000 1.35000
2 17.00000 1.35000 3 17.00000 1.35000 SUPPORT DEPTH AREA OF REINFORCEMENT
(IN) (IN*IN/FT)
40
Page 50
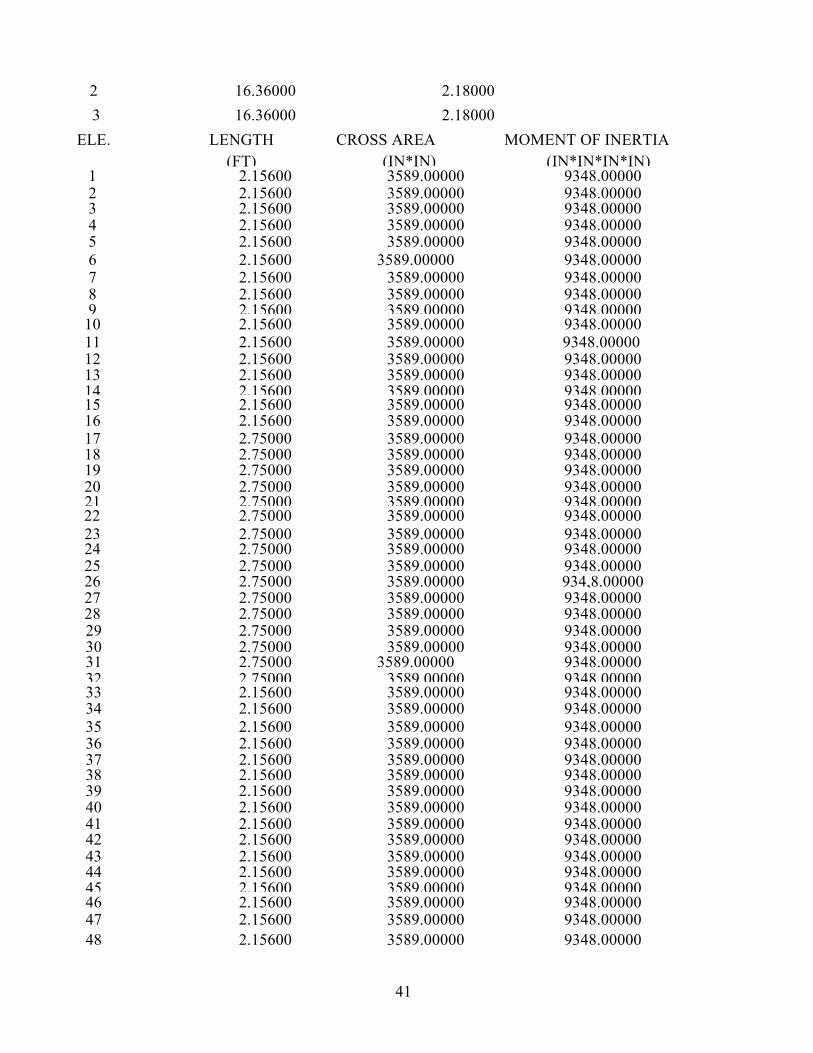
2 16.36000 2.18000 3 16.36000 2.18000 ELE. LENGTH CROSS AREA MOMENT OF INERTIA
(FT) (IN*IN) (IN*IN*IN*IN) 1 2.15600 3589.00000 9348.00000 2 2.15600 3589.00000 9348.00000 3 2.15600 3589.00000 9348.00000 4 2.15600 3589.00000 9348.00000 5 2.15600 3589.00000 9348.00000 6 2.15600 3589.00000 9348.00000 7 2.15600 3589.00000 9348.00000 8 2.15600 3589.00000 9348.00000 9 2.15600 3589.00000 9348.00000
10 2.15600 3589.00000 9348.00000 11 2.15600 3589.00000 9348.00000 12 2.15600 3589.00000 9348.00000 13 2.15600 3589.00000 9348.00000 14 2.15600 3589.00000 9348.0000015 2.15600 3589.00000 9348.00000 16 2.15600 3589.00000 9348.00000 17 2.75000 3589.00000 9348.00000 18 2.75000 3589.00000 9348.00000 19 2.75000 3589.00000 9348.00000 20 2.75000 3589.00000 9348.00000 21 2.75000 3589.00000 9348.00000
22 2.75000 3589.00000 9348.00000 23 2.75000 3589.00000 9348.00000 24 2.75000 3589.00000 9348.00000 25 2.75000 3589.00000 9348.00000 26 2.75000 3589.00000 934,8.00000 27 2.75000 3589.00000 9348.00000 28 2.75000 3589.00000 9348.00000 29 2.75000 3589.00000 9348.00000 30 2.75000 3589.00000 9348.00000 31 2.75000 3589.00000 9348.00000 32 2.75000 3589.00000 9348.0000033 2.15600 3589.00000 9348.00000 34 2.15600 3589.00000 9348.00000 35 2.15600 3589.00000 9348.00000 36 2.15600 3589.00000 9348.00000 37 2.15600 3589.00000 9348.00000 38 2.15600 3589.00000 9348.00000 39 2.15600 3589.00000 9348.00000 40 2.15600 3589.00000 9348.00000 41 2.15600 3589.00000 9348.00000 42 2.15600 3589.00000 9348.00000 43 2.15600 3589.00000 9348.00000 44 2.15600 3589.00000 9348.00000 45 2.15600 3589.00000 9348.0000046 2.15600 3589.00000 9348.00000 47 2.15600 3589.00000 9348.00000 48 2.15600 3589.00000 9348.00000
41
Page 51
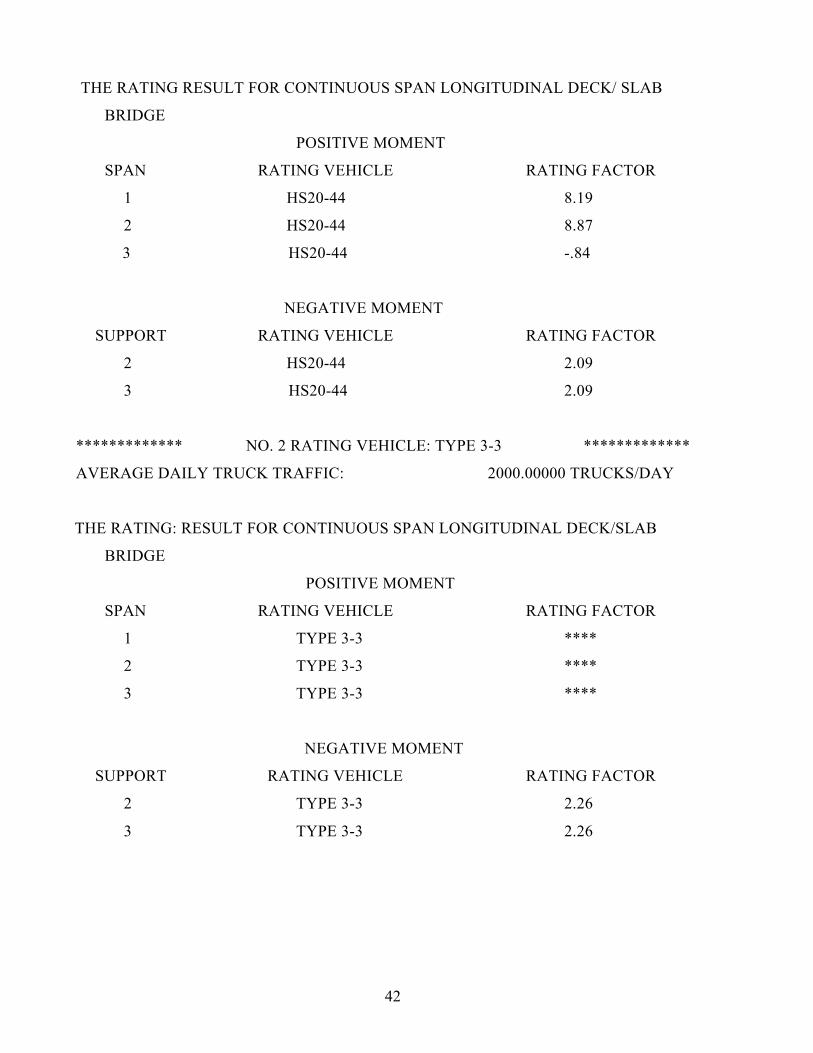
THE RATING RESULT FOR CONTINUOUS SPAN LONGITUDINAL DECK/ SLAB
BRIDGE
POSITIVE MOMENT
SPAN RATING VEHICLE RATING FACTOR
1 HS20-44 8.19
2 HS20-44 8.87
3 HS20-44 -.84
NEGATIVE MOMENT
SUPPORT RATING VEHICLE RATING FACTOR
2 HS20-44 2.09
3 HS20-44 2.09
************* NO. 2 RATING VEHICLE: TYPE 3-3 *************
AVERAGE DAILY TRUCK TRAFFIC: 2000.00000 TRUCKS/DAY
THE RATING: RESULT FOR CONTINUOUS SPAN LONGITUDINAL DECK/SLAB
BRIDGE
POSITIVE MOMENT
SPAN RATING VEHICLE RATING FACTOR
1 TYPE 3-3 ****
2 TYPE 3-3 ****
3 TYPE 3-3 ****
NEGATIVE MOMENT
SUPPORT RATING VEHICLE RATING FACTOR
2 TYPE 3-3 2.26
3 TYPE 3-3 2.26
42
Page 52
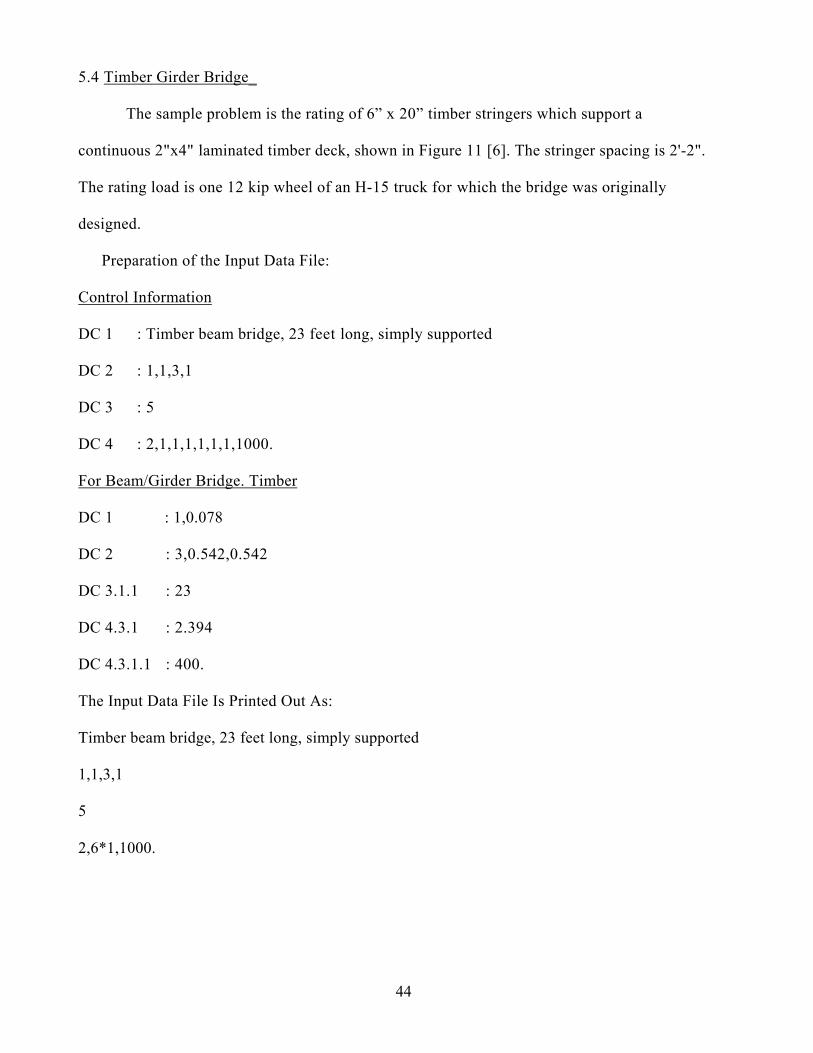
5.4 Timber Girder Bridge_
The sample problem is the rating of 6” x 20” timber stringers which support a
continuous 2"x4" laminated timber deck, shown in Figure 11 [6]. The stringer spacing is 2'-2".
The rating load is one 12 kip wheel of an H-15 truck for which the bridge was originally
designed.
Preparation of the Input Data File:
Control Information
DC 1 : Timber beam bridge, 23 feet long, simply supported
DC 2 : 1,1,3,1
DC 3 : 5
DC 4 : 2,1,1,1,1,1,1,1000.
For Beam/Girder Bridge. Timber
DC 1 : 1,0.078
DC 2 : 3,0.542,0.542
DC 3.1.1 : 23
DC 4.3.1 : 2.394
DC 4.3.1.1 : 400.
The Input Data File Is Printed Out As:
Timber beam bridge, 23 feet long, simply supported
1,1,3,1
5
2,6*1,1000.
44
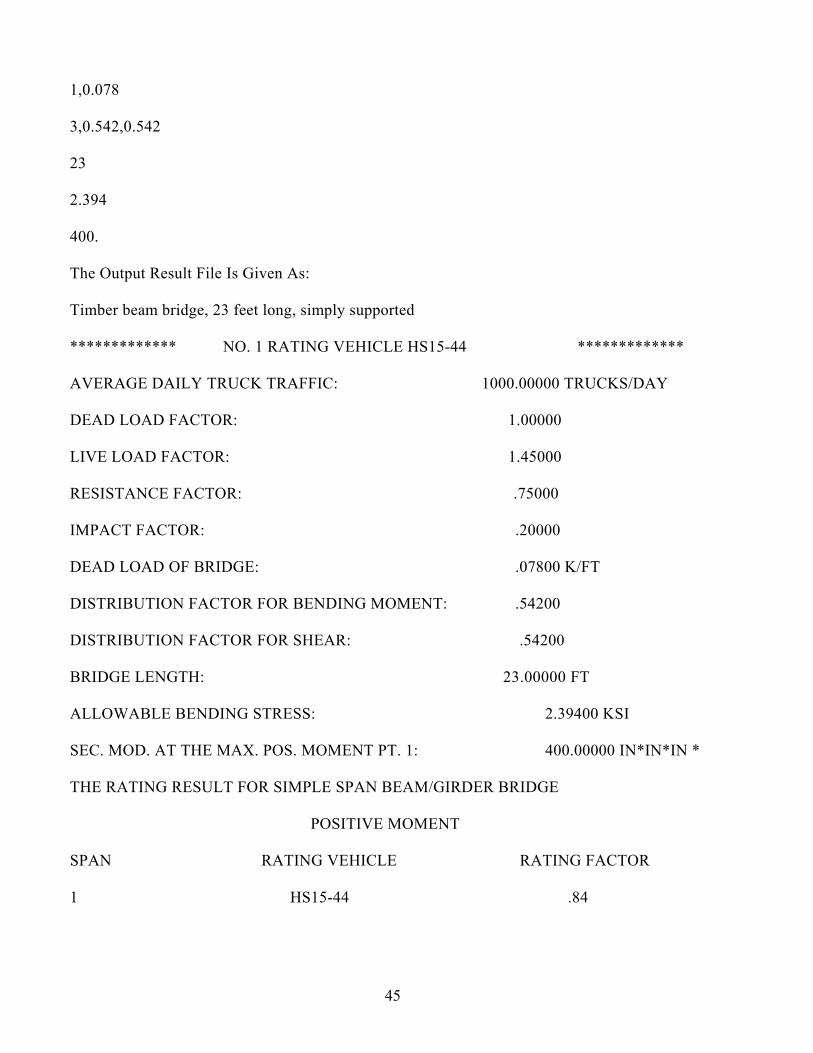
Page 53
1,0.078
3,0.542,0.542
23
2.394
400.
The Output Result File Is Given As:
Timber beam bridge, 23 feet long, simply supported
************* NO. 1 RATING VEHICLE HS15-44 *************
AVERAGE DAILY TRUCK TRAFFIC: 1000.00000 TRUCKS/DAY
DEAD LOAD FACTOR: 1.00000
LIVE LOAD FACTOR: 1.45000
RESISTANCE FACTOR: .75000
IMPACT FACTOR: .20000
DEAD LOAD OF BRIDGE: .07800 K/FT
DISTRIBUTION FACTOR FOR BENDING MOMENT: .54200
DISTRIBUTION FACTOR FOR SHEAR: .54200
BRIDGE LENGTH: 23.00000 FT
ALLOWABLE BENDING STRESS: 2.39400 KSI
SEC. MOD. AT THE MAX. POS. MOMENT PT. 1: 400.00000 IN*IN*IN *
THE RATING RESULT FOR SIMPLE SPAN BEAM/GIRDER BRIDGE
POSITIVE MOMENT
SPAN RATING VEHICLE RATING FACTOR
1 HS15-44 .84
45
Page 54
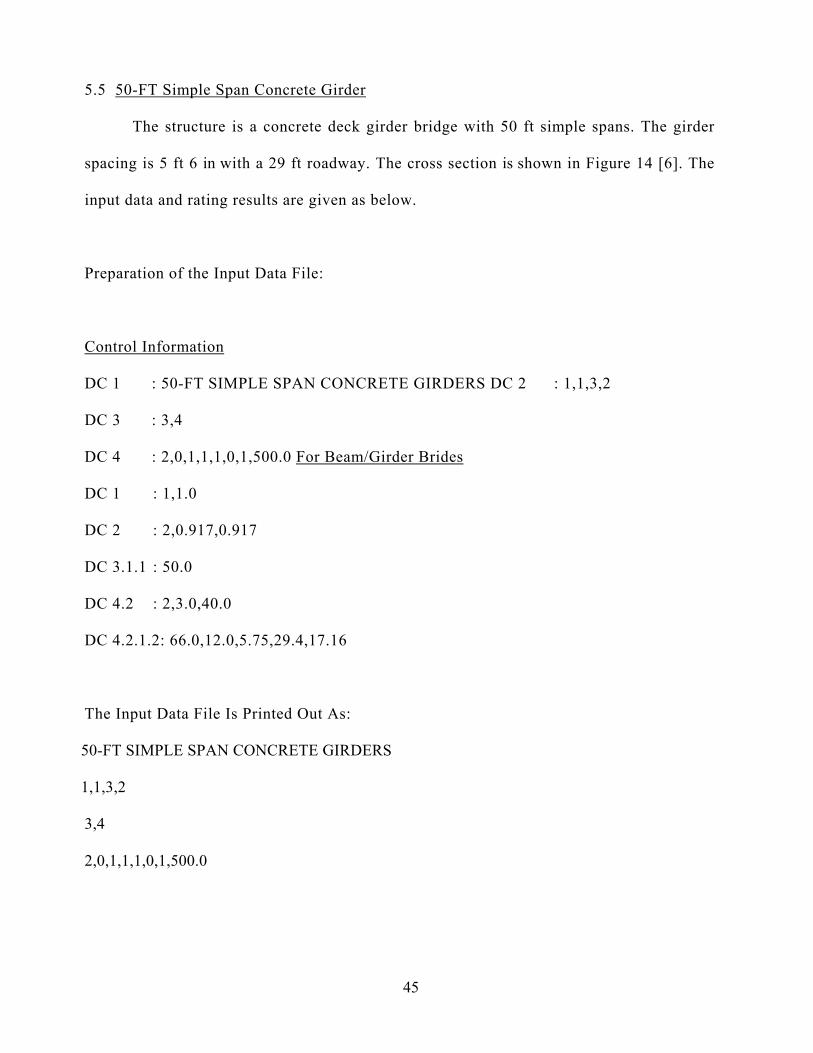
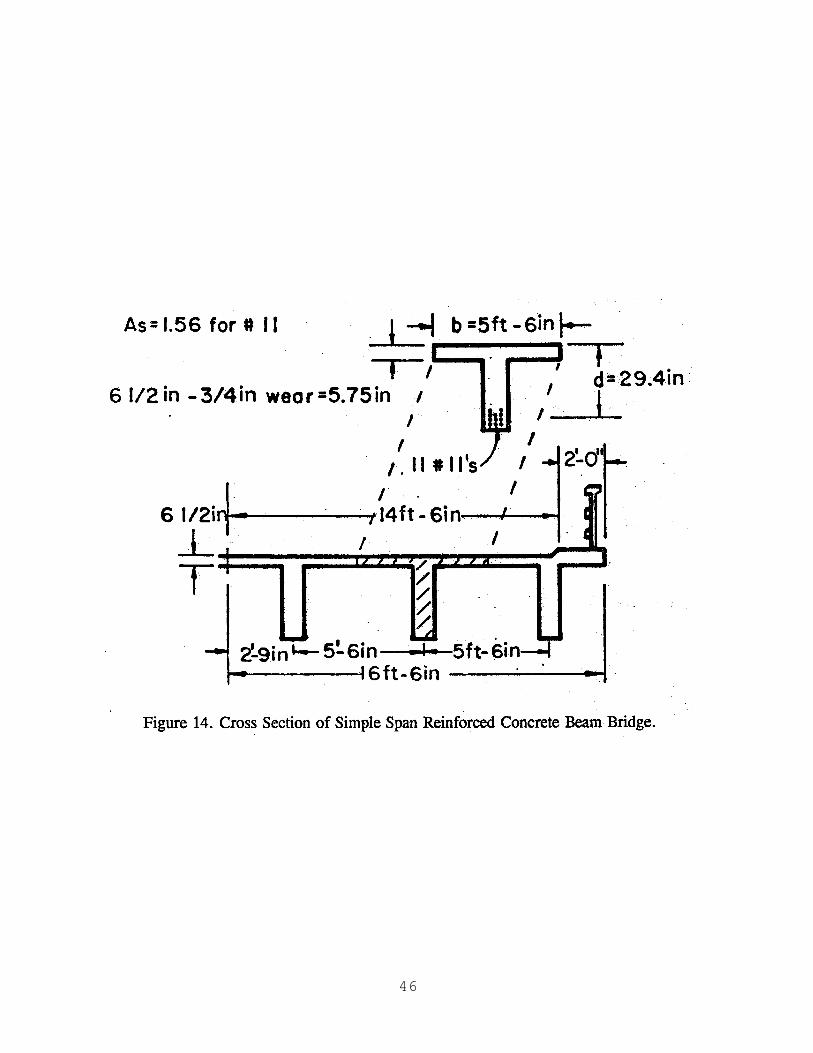
5.5 50-FT Simple Span Concrete Girder
The structure is a concrete deck girder bridge with 50 ft simple spans. The girder
spacing is 5 ft 6 in with a 29 ft roadway. The cross section is shown in Figure 14 [6]. The
input data and rating results are given as below.
Preparation of the Input Data File:
Control Information
DC 1 : 50-FT SIMPLE SPAN CONCRETE GIRDERS DC 2 : 1,1,3,2
DC 3 : 3,4
DC 4 : 2,0,1,1,1,0,1,500.0 For Beam/Girder Brides
DC 1 : 1,1.0
DC 2 : 2,0.917,0.917
DC 3.1.1 : 50.0
DC 4.2 : 2,3.0,40.0
DC 4.2.1.2: 66.0,12.0,5.75,29.4,17.16
The Input Data File Is Printed Out As:
50-FT SIMPLE SPAN CONCRETE GIRDERS
1,1,3,2
3,4
2,0,1,1,1,0,1,500.0
45
Page 56
1,1.0
2, 0.917, 0.917
50.0
2,3.0,40.0
66.0,12.0,5.75,29.4,17.16
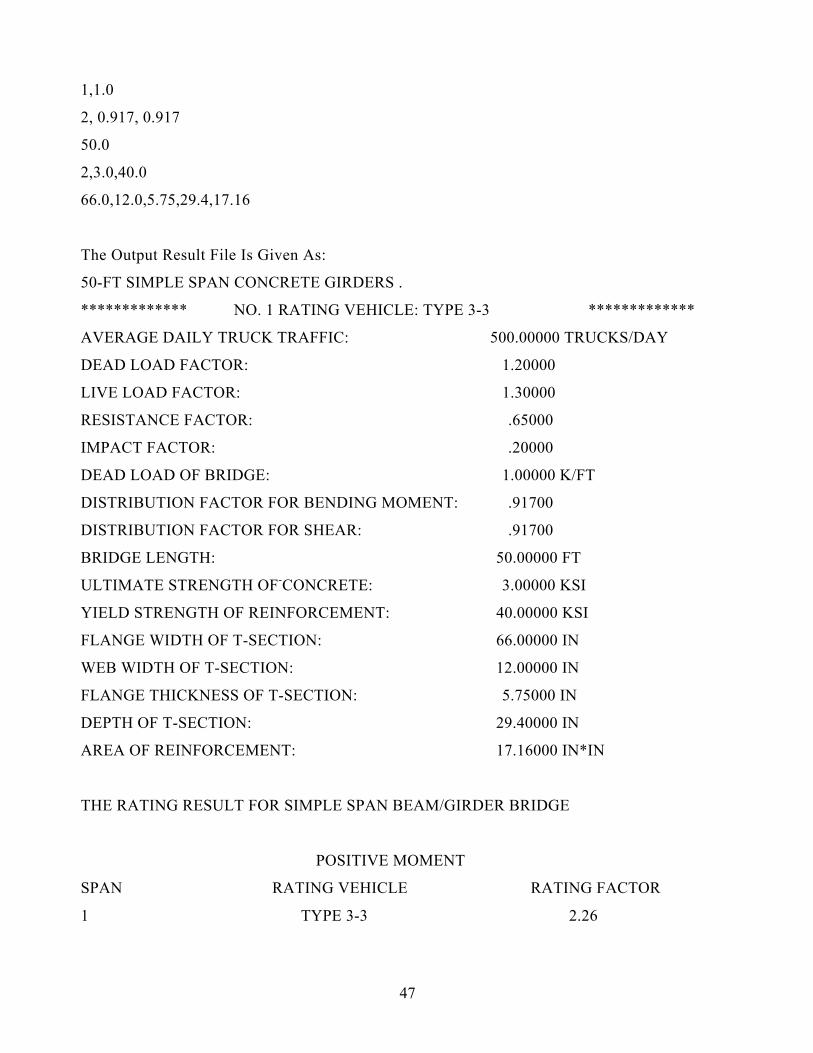
The Output Result File Is Given As:
50-FT SIMPLE SPAN CONCRETE GIRDERS .
************* NO. 1 RATING VEHICLE: TYPE 3-3 *************
AVERAGE DAILY TRUCK TRAFFIC: 500.00000 TRUCKS/DAY
DEAD LOAD FACTOR: 1.20000
LIVE LOAD FACTOR: 1.30000
RESISTANCE FACTOR: .65000
IMPACT FACTOR: .20000
DEAD LOAD OF BRIDGE: 1.00000 K/FT
DISTRIBUTION FACTOR FOR BENDING MOMENT: .91700
DISTRIBUTION FACTOR FOR SHEAR: .91700
BRIDGE LENGTH: 50.00000 FT
ULTIMATE STRENGTH OF-CONCRETE: 3.00000 KSI
YIELD STRENGTH OF REINFORCEMENT: 40.00000 KSI
FLANGE WIDTH OF T-SECTION: 66.00000 IN
WEB WIDTH OF T-SECTION: 12.00000 IN
FLANGE THICKNESS OF T-SECTION: 5.75000 IN
DEPTH OF T-SECTION: 29.40000 IN
AREA OF REINFORCEMENT: 17.16000 IN*IN
THE RATING RESULT FOR SIMPLE SPAN BEAM/GIRDER BRIDGE
POSITIVE MOMENT
SPAN RATING VEHICLE RATING FACTOR
1 TYPE 3-3 2.26
47
Page 57
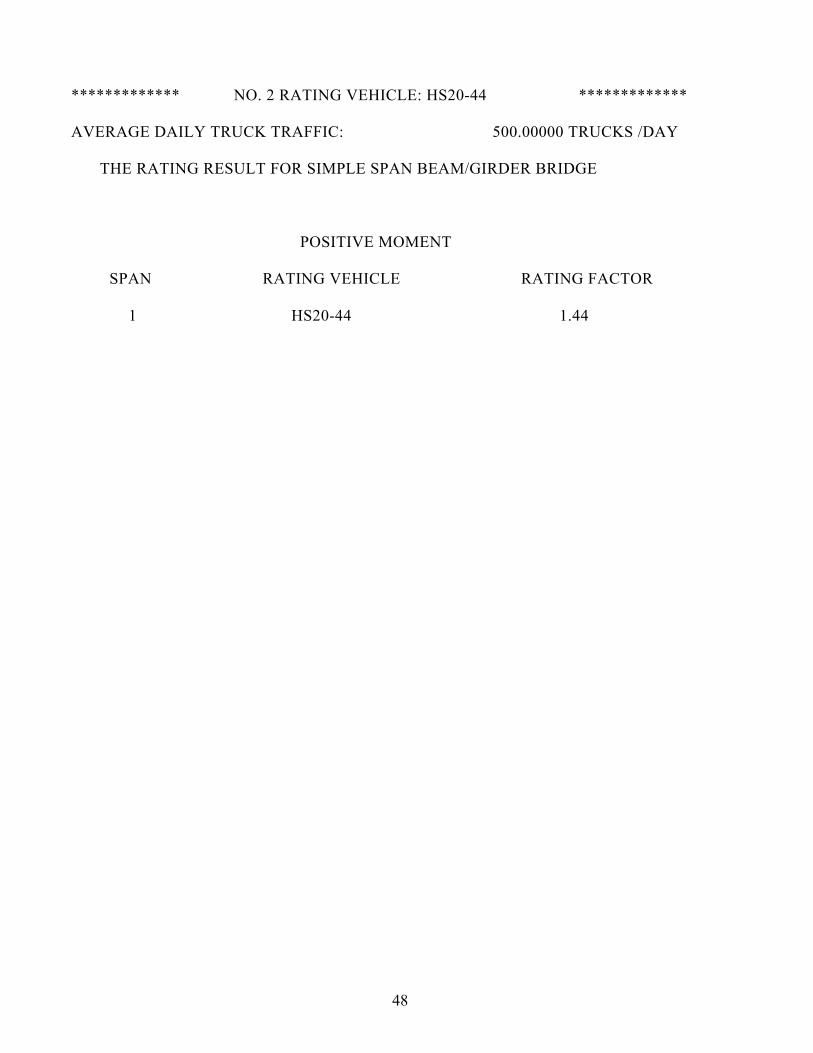
************* NO. 2 RATING VEHICLE: HS20-44 *************
AVERAGE DAILY TRUCK TRAFFIC: 500.00000 TRUCKS /DAY
THE RATING RESULT FOR SIMPLE SPAN BEAM/GIRDER BRIDGE
POSITIVE MOMENT
SPAN RATING VEHICLE RATING FACTOR
1 HS20-44 1.44
48
Page 58
5.6 25-FT Simple Span Steel Girder
A simple steel beam bridge with a concrete deck. The span is 25 ft. There are six W24x68
beams spaced at 7 ft 10 in [3]. The input data and rating results are given as below.
Preparation of the Input Data File:
Control Information
DC 1 : SIX W24X68 STEEL GIRDERS, 25-FT SIMPLE SPAN BRIDGE
DC 2 : 1,2,3,2
DC 3 : 3,4
DC 4 : 2,0,1,1,1,0,1,6000.0
For Beam/Girder Bridge
DC 1 : 1,1.5
DC 2 : 1,1.424,1.424
DC 3.1.1 : 25.0
DC 4.1 : 36.0
DC 4.1.1.1: 177.0,177.0,23.73,0.415
For Fatigue Analysis, only for steel bridges
DC 1 : 3
The Input Data File Is Printed Out As:
49 .
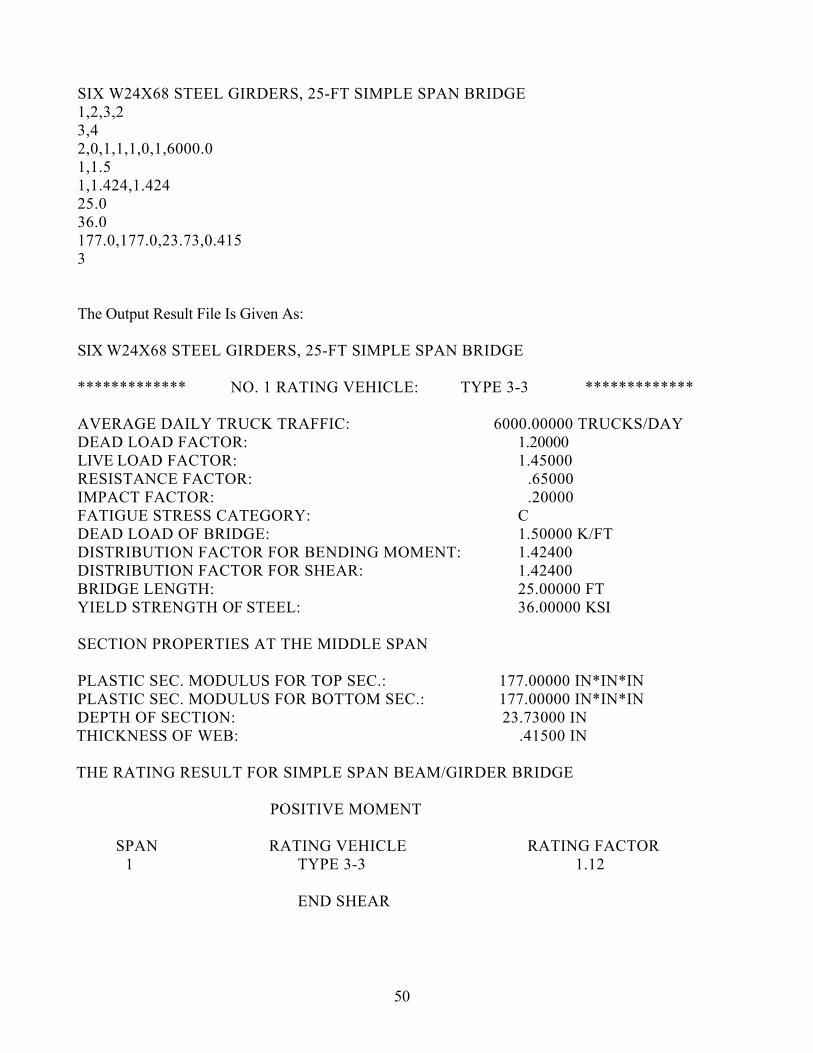
Page 59
SIX W24X68 STEEL GIRDERS, 25-FT SIMPLE SPAN BRIDGE 1,2,3,2 3,4 2,0,1,1,1,0,1,6000.0 1,1.5 1,1.424,1.424 25.0 36.0 177.0,177.0,23.73,0.415 3 The Output Result File Is Given As: SIX W24X68 STEEL GIRDERS, 25-FT SIMPLE SPAN BRIDGE ************* NO. 1 RATING VEHICLE: TYPE 3-3 ************* AVERAGE DAILY TRUCK TRAFFIC: 6000.00000 TRUCKS/DAY DEAD LOAD FACTOR: 1.20000 LIVE LOAD FACTOR: 1.45000 RESISTANCE FACTOR: .65000 IMPACT FACTOR: .20000 FATIGUE STRESS CATEGORY: C DEAD LOAD OF BRIDGE: 1.50000 K/FT DISTRIBUTION FACTOR FOR BENDING MOMENT: 1.42400 DISTRIBUTION FACTOR FOR SHEAR: 1.42400 BRIDGE LENGTH: 25.00000 FT YIELD STRENGTH OF STEEL: 36.00000 KSI SECTION PROPERTIES AT THE MIDDLE SPAN PLASTIC SEC. MODULUS FOR TOP SEC.: 177.00000 IN*IN*IN PLASTIC SEC. MODULUS FOR BOTTOM SEC.: 177.00000 IN*IN*IN DEPTH OF SECTION: 23.73000 IN THICKNESS OF WEB: .41500 IN THE RATING RESULT FOR SIMPLE SPAN BEAM/GIRDER BRIDGE
POSITIVE MOMENT
SPAN RATING VEHICLE RATING FACTOR 1 TYPE 3-3 1.12
END SHEAR
50
Page 60
SUPPORT RATING VEHICLE RATING FACTOR
1 TYPE 3-3 3.23
2 TYPE 3-3 3.23
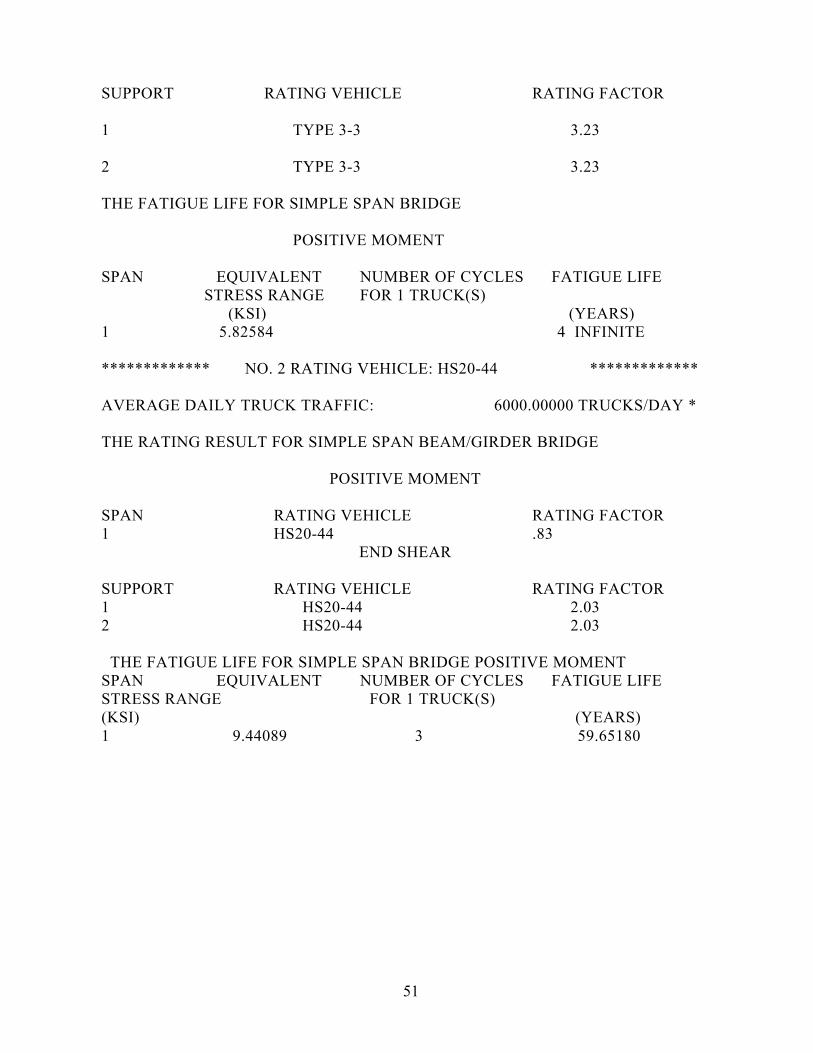
THE FATIGUE LIFE FOR SIMPLE SPAN BRIDGE
POSITIVE MOMENT
SPAN EQUIVALENT NUMBER OF CYCLES FATIGUE LIFE STRESS RANGE FOR 1 TRUCK(S) (KSI) (YEARS) 1 5.82584 4 INFINITE ************* NO. 2 RATING VEHICLE: HS20-44 *************
AVERAGE DAILY TRUCK TRAFFIC: 6000.00000 TRUCKS/DAY *
THE RATING RESULT FOR SIMPLE SPAN BEAM/GIRDER BRIDGE
POSITIVE MOMENT
SPAN RATING VEHICLE RATING FACTOR 1 HS20-44 .83
END SHEAR SUPPORT RATING VEHICLE RATING FACTOR 1 HS20-44 2.03 2 HS20-44 2.03 THE FATIGUE LIFE FOR SIMPLE SPAN BRIDGE POSITIVE MOMENT SPAN EQUIVALENT NUMBER OF CYCLES FATIGUE LIFE STRESS RANGE FOR 1 TRUCK(S) (KSI) (YEARS) 1 9.44089 3 59.65180
51
Page 61
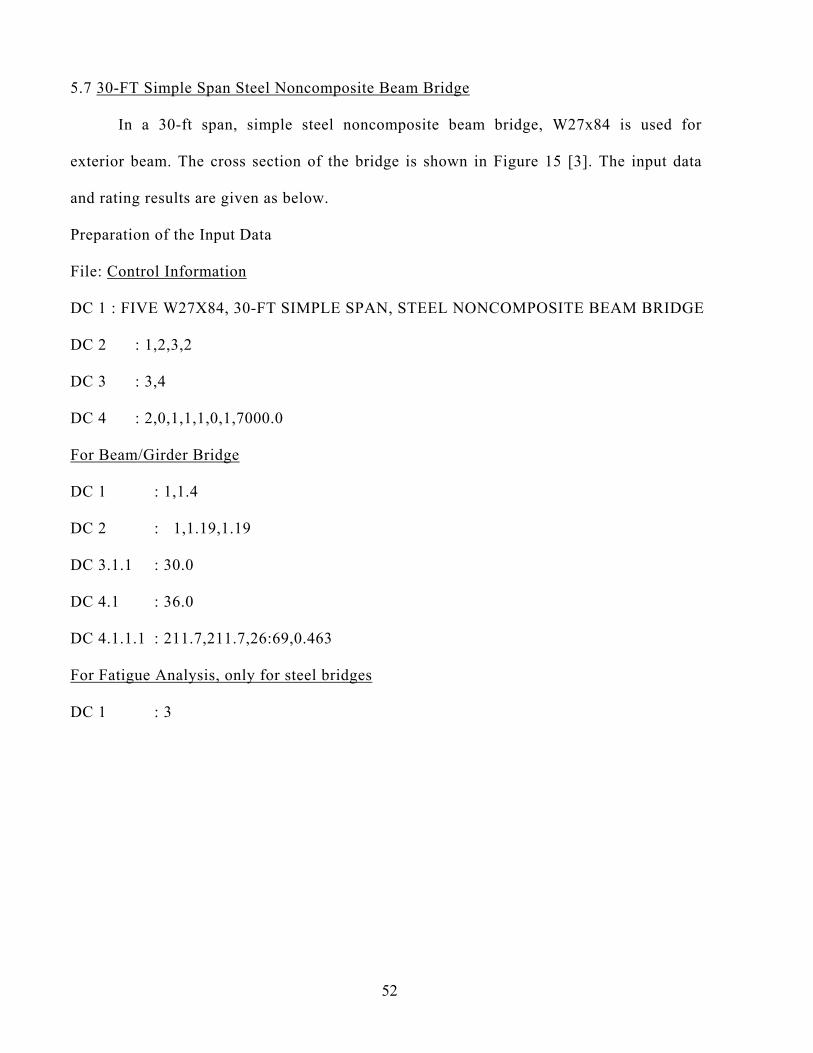
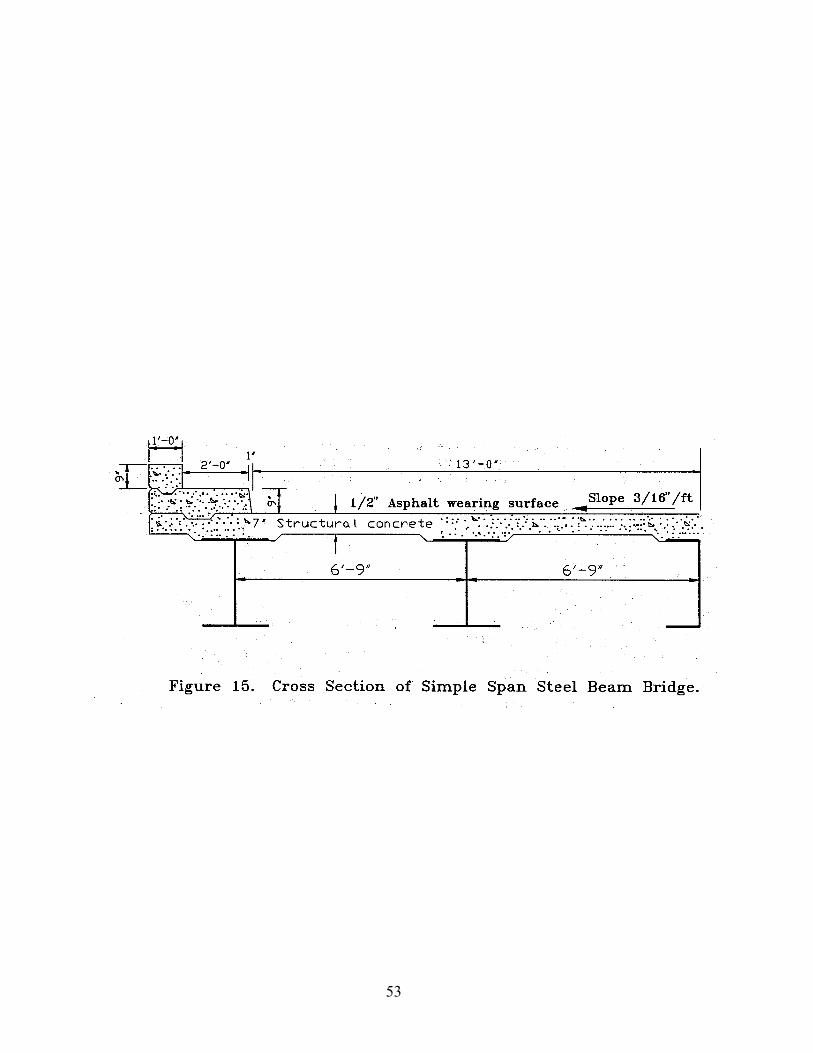
5.7 30-FT Simple Span Steel Noncomposite Beam Bridge
In a 30-ft span, simple steel noncomposite beam bridge, W27x84 is used for
exterior beam. The cross section of the bridge is shown in Figure 15 [3]. The input data
and rating results are given as below.
Preparation of the Input Data
File: Control Information
DC 1 : FIVE W27X84, 30-FT SIMPLE SPAN, STEEL NONCOMPOSITE BEAM BRIDGE
DC 2 : 1,2,3,2
DC 3 : 3,4
DC 4 : 2,0,1,1,1,0,1,7000.0
For Beam/Girder Bridge
DC 1 : 1,1.4
DC 2 : 1,1.19,1.19
DC 3.1.1 : 30.0
DC 4.1 : 36.0
DC 4.1.1.1 : 211.7,211.7,26:69,0.463
For Fatigue Analysis, only for steel bridges
DC 1 : 3
52
Page 63
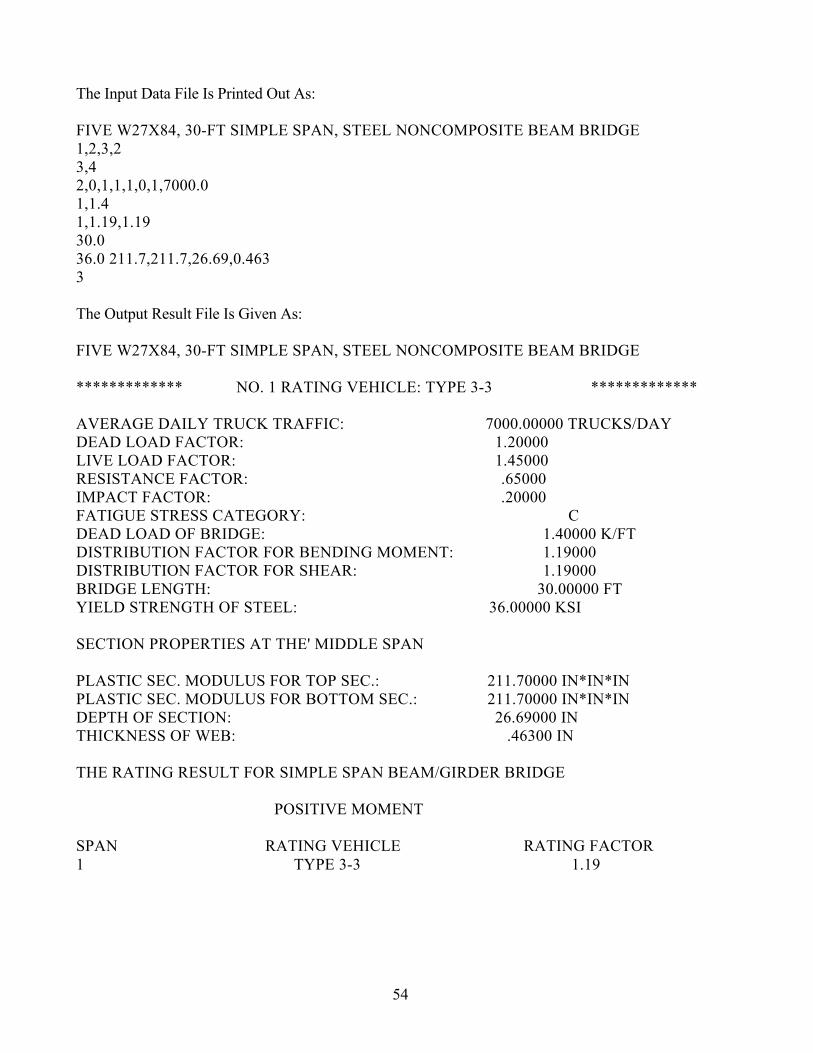
The Input Data File Is Printed Out As: FIVE W27X84, 30-FT SIMPLE SPAN, STEEL NONCOMPOSITE BEAM BRIDGE 1,2,3,2 3,4 2,0,1,1,1,0,1,7000.0 1,1.4 1,1.19,1.19 30.0 36.0 211.7,211.7,26.69,0.463 3 The Output Result File Is Given As: FIVE W27X84, 30-FT SIMPLE SPAN, STEEL NONCOMPOSITE BEAM BRIDGE ************* NO. 1 RATING VEHICLE: TYPE 3-3 ************* AVERAGE DAILY TRUCK TRAFFIC: 7000.00000 TRUCKS/DAY DEAD LOAD FACTOR: 1.20000 LIVE LOAD FACTOR: 1.45000 RESISTANCE FACTOR: .65000 IMPACT FACTOR: .20000 FATIGUE STRESS CATEGORY: C DEAD LOAD OF BRIDGE: 1.40000 K/FT DISTRIBUTION FACTOR FOR BENDING MOMENT: 1.19000 DISTRIBUTION FACTOR FOR SHEAR: 1.19000 BRIDGE LENGTH: 30.00000 FT YIELD STRENGTH OF STEEL: 36.00000 KSI SECTION PROPERTIES AT THE' MIDDLE SPAN PLASTIC SEC. MODULUS FOR TOP SEC.: 211.70000 IN*IN*IN PLASTIC SEC. MODULUS FOR BOTTOM SEC.: 211.70000 IN*IN*IN DEPTH OF SECTION: 26.69000 IN THICKNESS OF WEB: .46300 IN THE RATING RESULT FOR SIMPLE SPAN BEAM/GIRDER BRIDGE
POSITIVE MOMENT
SPAN RATING VEHICLE RATING FACTOR 1 TYPE 3-3 1.19
54
Page 64
END SHEAR
SUPPORT RATING VEHICLE RATING FACTOR
1 TYPE 3-3 4.55
2 TYPE 3-3 4.55
THE FATIGUE LIFE FOR SIMPLE SPAN BRIDGE
POSITIVE MOMENT
SPAN EQUIVALENT NUMBER OF CYCLES FATIGUE LIFE STRESS RANGE FOR 1 TRUCK (S) (KSI) (YEARS) 1 4.91588 4 INFINITE
************* NO. 2 RATING VEHICLE: HS20-44 *************
AVERAGE DAILY TRUCK TRAFFIC: 7000.00000 TRUCKS/DAY
THE RATING RESULT FOR SIMPLE SPAN BEAM/GIRDER BRIDGE
POSITIVE MOMENT
SPAN RATING VEHICLE RATING FACTOR 1
HS20-44 .80
END SHEAR
SUPPORT RATING VEHICLE RATING FACTOR
1 HS20-44 2.89
2 HS20-44 2.89
55
Page 65
THE FATIGUE LIFE FOR SIMPLE SPAN BRIDGE
POSITIVE MOMENT
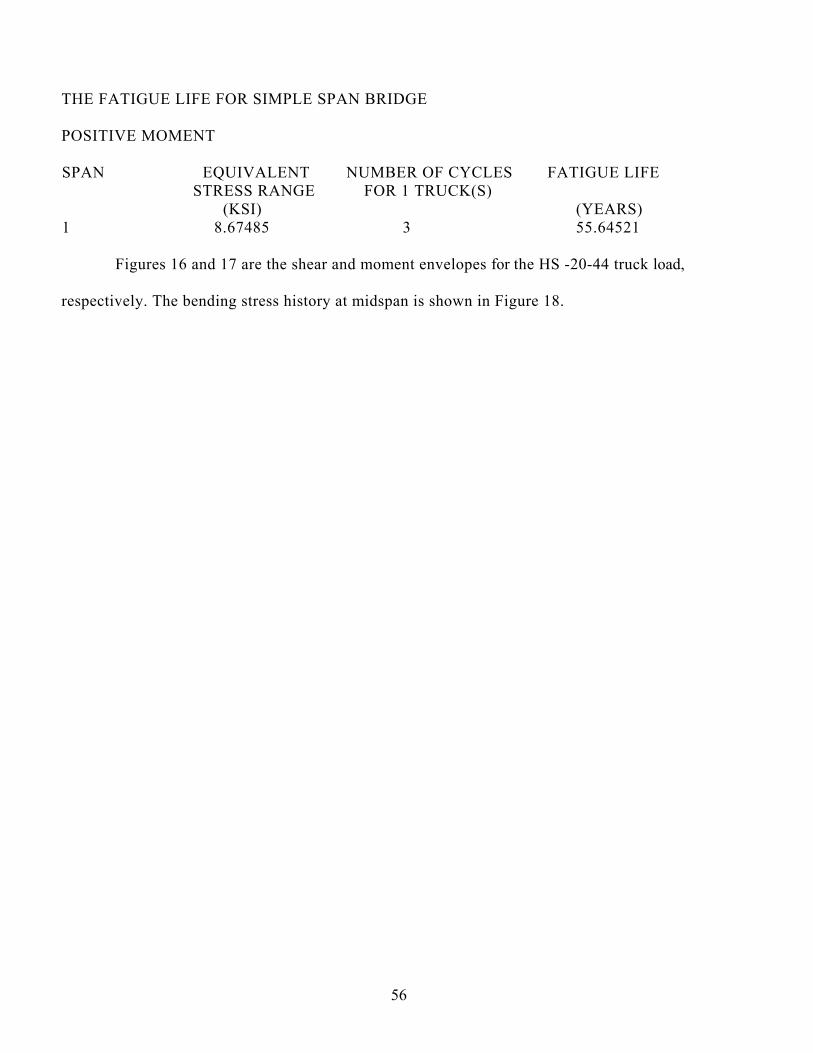
SPAN EQUIVALENT NUMBER OF CYCLES FATIGUE LIFE STRESS RANGE FOR 1 TRUCK(S) (KSI) (YEARS) 1 8.67485 3 55.64521 Figures 16 and 17 are the shear and moment envelopes for the HS -20-44 truck load,
respectively. The bending stress history at midspan is shown in Figure 18.
56
Page 69
5.8 Three Continuous Span Nonuniform Section Steel Girders
A three-span continuous bridge with spans of 99, 132, and 99ft. is studied [4]. The girder
spans, cross section, and flange plate design are shown in Figures 19, 20 and 21 respectively. The basic
data are given as below:
Live load: HS 20-44 truck
Dead load: 2.284 kips/ft
Distribution factor for moment and shear: 2.5, and
Modulus of elasticity of girder: 29x106 psi.
The input data and rating results are given as below.
Preparation of the Input Data File:
Control Information
DC 1 : THREE CONTINUOUS SPAN, NONUNIFORM SECTION STEEL GIRDERS
DC 2 : 1,2,3,2
DC 3 : 3,4
DC 4 : 2,0;1,1,1,0,1,5000.0
For Beam/Girder Bridge
DC 1 : 2,2.284
DC 2 : 1,2.5,2.5
DC 3.2.1 : 3,29000.0
60
Page 71
DC 3.2.2 : 6.1875,76.5,73765:0
6.1875,76.5,73765.0
6.1875,76.5,73765.0
6.1875,76.5,73765.0
6.1875,76.5,73765.0
6.1875,76.5,73765.0
6.1875,76.5,73765.0
6.1875,76.5,73765.0
6.1875,76.5,73765.0
6.1875,76.5,73765.0
6.1875,76.5,73765.0
6.1875,76.5,73765.0
6.1875,121.5,137652.0
6.1875,121.5,137652.0
6.1875,121.5,137652.0
6.1875,121.5,137652.0
8.25,121.5,137652.0
8.25,121.5,137652.0
8.25,790,77215.0
8.25,79.0,77215.0
8.25,79.0,77215.0
8.25,79.0,77215.0
8.25,79.0,77215.0
8.25,79.0,77215.0
62
Page 72
8.25,79.0,77215.0
8.25,79.0,77215.0
8.25,79.0,77215.0
8.25,79.0,77215.0
8.25,79.0,77215.0
8.25,79.0,772 15.0
8.25,121.5,137652.0
8.25,121.5,137652.0
6.1875,121.5,137652.0
6.1875,121.5,137652.0
6.1875,12 1.5,137652.0
6.1875,121.5,137652.0
6.1875,76.5,73765.0
6.1875,76.5,73765.0
6.1875,76.5,73765.0
6.1875,76.5,73765.0
6.1875,76.5,73765.0
6.1875,76.5,73765.0
6.1875,76.5,73765.0
6.1875,76.5,73765.0
6.1875,76.5,73765.0
6.1875,76.5,73765.0
6.1875,76.5,73765.0
6.1875,76.5,73765.0
63
Page 73
DC 4.1 : 36.0
DC 4.1.2.1 : 2225.44,2325.12,2225.44
DC 4.1.2.2 : 2225.44,2325.12,2225.44
DC 4.1.2.3 : 4030.88,4030.88
DC 4.1.2.4 : 198.0,198.0
DC 4.1.2.5 : 20.0,20.0
DC 4.1.2.6 : 74.25,76.5,76.5,74.25
DC 4.1.2.7 : 0.4375,0.4375,0.4375,0.4375
DC 4.1.2.8 : 4.969,4.969
For Fatigue Analysis only for steel bridges
DC 1 : 6
The Input Data File Is Printed Out As:
THREE CONTINUOUS SPAN, NONUNIFORM SECTION STEEL GIRDERS
1,2,3,2
3,4 2,0,1,1,1,0,1,5000.0
2,2.284
1,2.5,2.5 3,29000.0
6.1875,76.5,73765.0
6.1875,76.5,73765.0
6.1875,76.5,73765.0
6.1875,7645,73765.0
6.1875,76.5,73765.0
6.1875,76.5,73765.0
6.1875,76.5,73765.0
6.1875,76.5,73765:0
6.1875,76.5,73765.0
6.1875,76.5,73765.0
6.1875,76.5,73765.0
6.1875,76.5,73765.0
6.1875,121.5,137652.0
6.1875,121.5,137652.0
6.1875,121.5,137652.0
64
Page 74
6.1875,121.5,137652.0
8.25,121.5,137652.0
8.25,121.5,137652.0
8.25,79.0,77215.0
8.25,79.0,77215.0
8.25,79.0,77215.0
8.25,79.0,77215.0
8.25,79.0,77215.0
8.25,79.0,77215.0
8.25,79.0,77215:0
8.25,79.0,77215.0
8.25,79.0,77215.0
8.25, 79.0,77215.0
8.25,79.0,77215.0
8.25,79.0,77215.0
8.25,121.5,137652.0
8.25,121.5,137652.0
6.1875,121.5,137652.0
6.1875,121.5,137652.0
6.1875,121.5,137652.0
6.1875,121.5,137652.0
6.1875,76.5,73765.0
6.1875,76.5,73765.0
6.1875,76.5,73765.0
6.1875,76.5,73765.0
6.1875,76.5,73765.0
6.1875,76.5,73765.0
6.1875,76.5,73765.0
6.1875,76.5,73765.0
6.1875,76.5,73765.0
6.1875,76.5,73765.0
6.1875,76.5,73765.0
65
Page 75
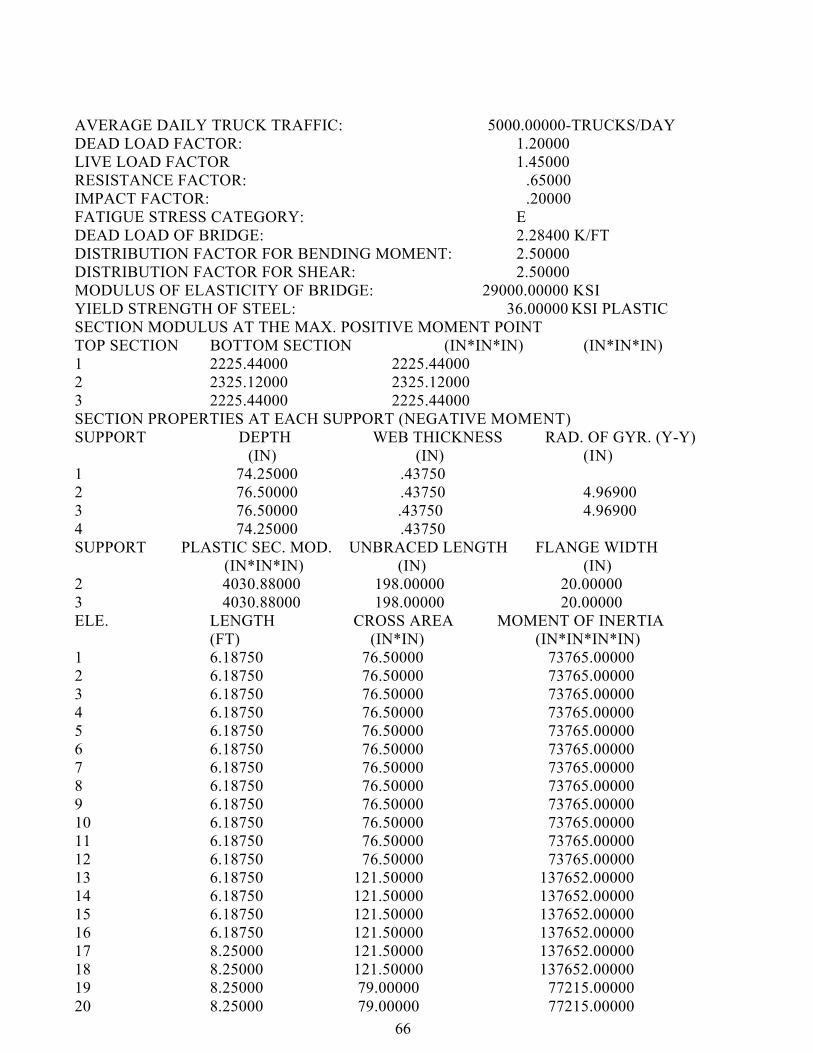
AVERAGE DAILY TRUCK TRAFFIC: 5000.00000-TRUCKS/DAY DEAD LOAD FACTOR: 1.20000 LIVE LOAD FACTOR 1.45000 RESISTANCE FACTOR: .65000 IMPACT FACTOR: .20000 FATIGUE STRESS CATEGORY: E DEAD LOAD OF BRIDGE: 2.28400 K/FT DISTRIBUTION FACTOR FOR BENDING MOMENT: 2.50000 DISTRIBUTION FACTOR FOR SHEAR: 2.50000 MODULUS OF ELASTICITY OF BRIDGE: 29000.00000 KSI YIELD STRENGTH OF STEEL: 36.00000 KSI PLASTIC SECTION MODULUS AT THE MAX. POSITIVE MOMENT POINT TOP SECTION BOTTOM SECTION (IN*IN*IN) (IN*IN*IN) 1 2225.44000 2225.44000 2 2325.12000 2325.12000 3 2225.44000 2225.44000 SECTION PROPERTIES AT EACH SUPPORT (NEGATIVE MOMENT) SUPPORT DEPTH WEB THICKNESS RAD. OF GYR. (Y-Y) (IN) (IN) (IN) 1 74.25000 .43750 2 76.50000 .43750 4.96900 3 76.50000 .43750 4.96900 4 74.25000 .43750 SUPPORT PLASTIC SEC. MOD. UNBRACED LENGTH FLANGE WIDTH (IN*IN*IN) (IN) (IN) 2 4030.88000 198.00000 20.00000 3 4030.88000 198.00000 20.00000 ELE. LENGTH CROSS AREA MOMENT OF INERTIA (FT) (IN*IN) (IN*IN*IN*IN) 1 6.18750 76.50000 73765.00000 2 6.18750 76.50000 73765.00000 3 6.18750 76.50000 73765.00000 4 6.18750 76.50000 73765.00000 5 6.18750 76.50000 73765.00000 6 6.18750 76.50000 73765.00000 7 6.18750 76.50000 73765.00000 8 6.18750 76.50000 73765.00000 9 6.18750 76.50000 73765.00000 10 6.18750 76.50000 73765.00000 11 6.18750 76.50000 73765.00000 12 6.18750 76.50000 73765.00000 13 6.18750 121.50000 137652.00000 14 6.18750 121.50000 137652.00000 15 6.18750 121.50000 137652.00000 16 6.18750 121.50000 137652.00000 17 8.25000 121.50000 137652.00000 18 8.25000 121.50000 137652.00000 19 8.25000 79.00000 77215.00000 20 8.25000 79.00000 77215.00000
66
Page 76
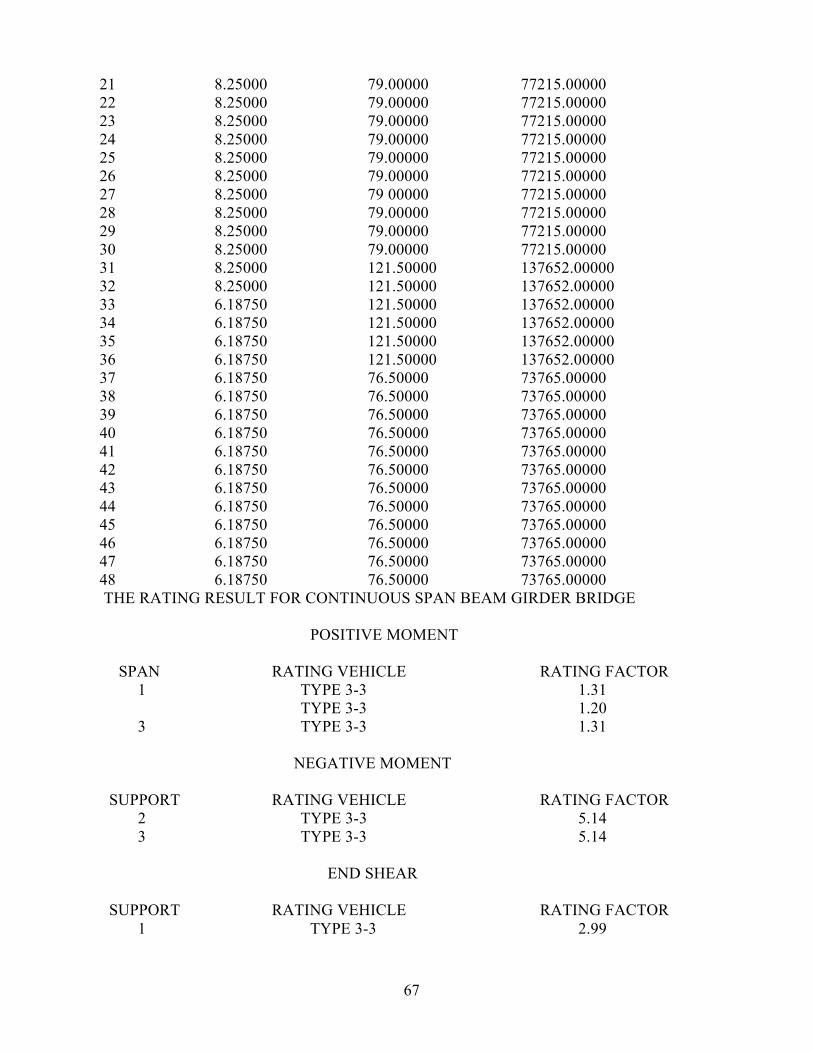
21 8.25000 79.00000 77215.00000 22 8.25000 79.00000 77215.00000 23 8.25000 79.00000 77215.00000 24 8.25000 79.00000 77215.00000 25 8.25000 79.00000 77215.00000 26 8.25000 79.00000 77215.00000 27 8.25000 79 00000 77215.00000 28 8.25000 79.00000 77215.00000 29 8.25000 79.00000 77215.00000 30 8.25000 79.00000 77215.00000 31 8.25000 121.50000 137652.00000 32 8.25000 121.50000 137652.00000 33 6.18750 121.50000 137652.00000 34 6.18750 121.50000 137652.00000 35 6.18750 121.50000 137652.00000 36 6.18750 121.50000 137652.00000 37 6.18750 76.50000 73765.00000 38 6.18750 76.50000 73765.00000 39 6.18750 76.50000 73765.00000 40 6.18750 76.50000 73765.00000 41 6.18750 76.50000 73765.00000 42 6.18750 76.50000 73765.00000 43 6.18750 76.50000 73765.00000 44 6.18750 76.50000 73765.00000 45 6.18750 76.50000 73765.00000 46 6.18750 76.50000 73765.00000 47 6.18750 76.50000 73765.00000 48 6.18750 76.50000 73765.00000 THE RATING RESULT FOR CONTINUOUS SPAN BEAM GIRDER BRIDGE
POSITIVE MOMENT
SPAN RATING VEHICLE RATING FACTOR 1 TYPE 3-3 1.31
TYPE 3-3 1.20 3 TYPE 3-3 1.31
NEGATIVE MOMENT
SUPPORT RATING VEHICLE RATING FACTOR 2 TYPE 3-3 5.14 3 TYPE 3-3 5.14
END SHEAR
SUPPORT RATING VEHICLE RATING FACTOR 1 TYPE 3-3 2.99
67
Page 77
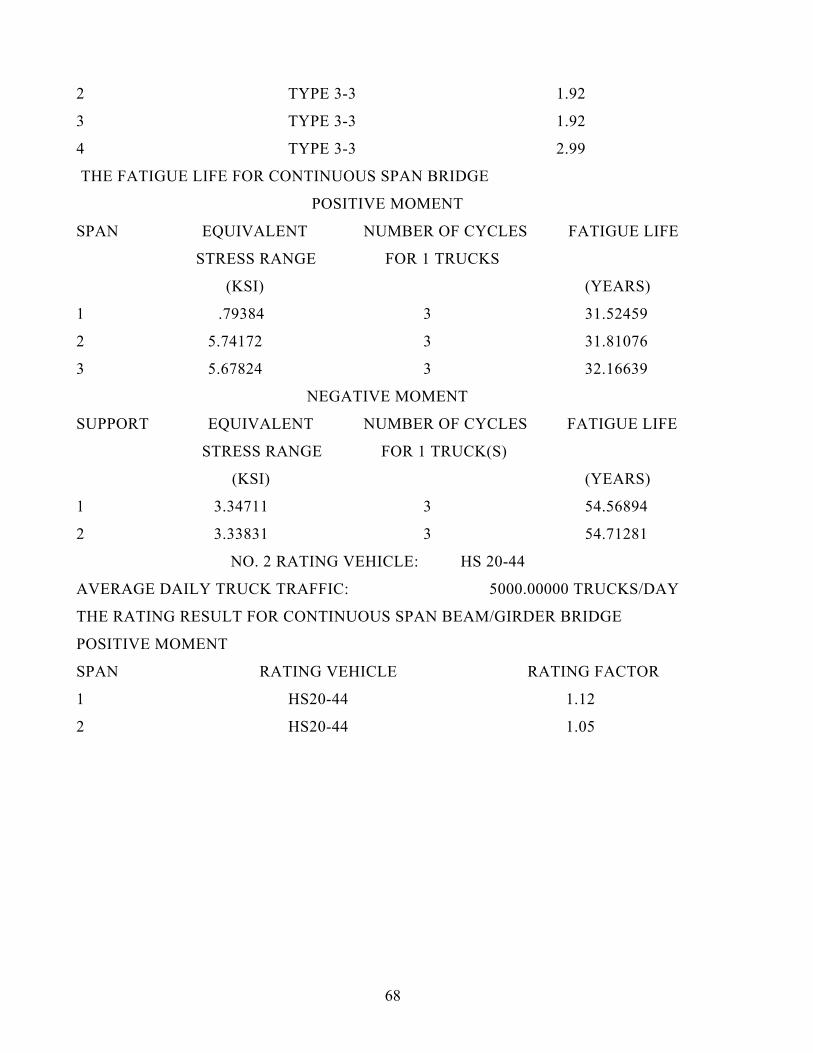
2 TYPE 3-3 1.92
3 TYPE 3-3 1.92
4 TYPE 3-3 2.99
THE FATIGUE LIFE FOR CONTINUOUS SPAN BRIDGE
POSITIVE MOMENT
SPAN EQUIVALENT NUMBER OF CYCLES FATIGUE LIFE
STRESS RANGE FOR 1 TRUCKS
(KSI) (YEARS)
1 .79384 3 31.52459
2 5.74172 3 31.81076
3 5.67824 3 32.16639
NEGATIVE MOMENT
SUPPORT EQUIVALENT NUMBER OF CYCLES FATIGUE LIFE
STRESS RANGE FOR 1 TRUCK(S)
(KSI) (YEARS)
1 3.34711 3 54.56894
2 3.33831 3 54.71281
NO. 2 RATING VEHICLE: HS 20-44
AVERAGE DAILY TRUCK TRAFFIC: 5000.00000 TRUCKS/DAY
THE RATING RESULT FOR CONTINUOUS SPAN BEAM/GIRDER BRIDGE
POSITIVE MOMENT
SPAN RATING VEHICLE RATING FACTOR
1 HS20-44 1.12
2 HS20-44 1.05
68
Page 78
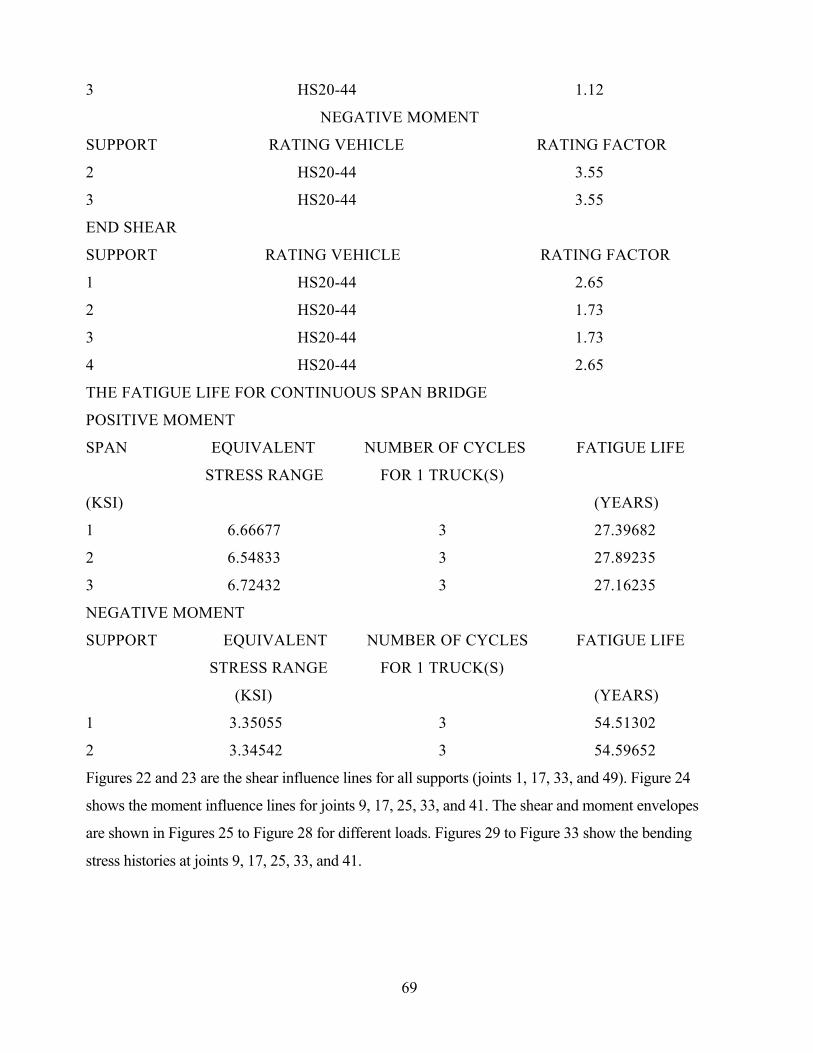
3 HS20-44 1.12
NEGATIVE MOMENT
SUPPORT RATING VEHICLE RATING FACTOR
2 HS20-44 3.55
3 HS20-44 3.55
END SHEAR
SUPPORT RATING VEHICLE RATING FACTOR
1 HS20-44 2.65
2 HS20-44 1.73
3 HS20-44 1.73
4 HS20-44 2.65
THE FATIGUE LIFE FOR CONTINUOUS SPAN BRIDGE
POSITIVE MOMENT
SPAN EQUIVALENT NUMBER OF CYCLES FATIGUE LIFE
STRESS RANGE FOR 1 TRUCK(S)
(KSI) (YEARS)
1 6.66677 3 27.39682
2 6.54833 3 27.89235
3 6.72432 3 27.16235
NEGATIVE MOMENT
SUPPORT EQUIVALENT NUMBER OF CYCLES FATIGUE LIFE
STRESS RANGE FOR 1 TRUCK(S)
(KSI) (YEARS)
1 3.35055 3 54.51302
2 3.34542 3 54.59652
Figures 22 and 23 are the shear influence lines for all supports (joints 1, 17, 33, and 49). Figure 24
shows the moment influence lines for joints 9, 17, 25, 33, and 41. The shear and moment envelopes
are shown in Figures 25 to Figure 28 for different loads. Figures 29 to Figure 33 show the bending
stress histories at joints 9, 17, 25, 33, and 41.
69
Page 91
5.9 65-FT Simple Span Concrete T-Beam Bridge
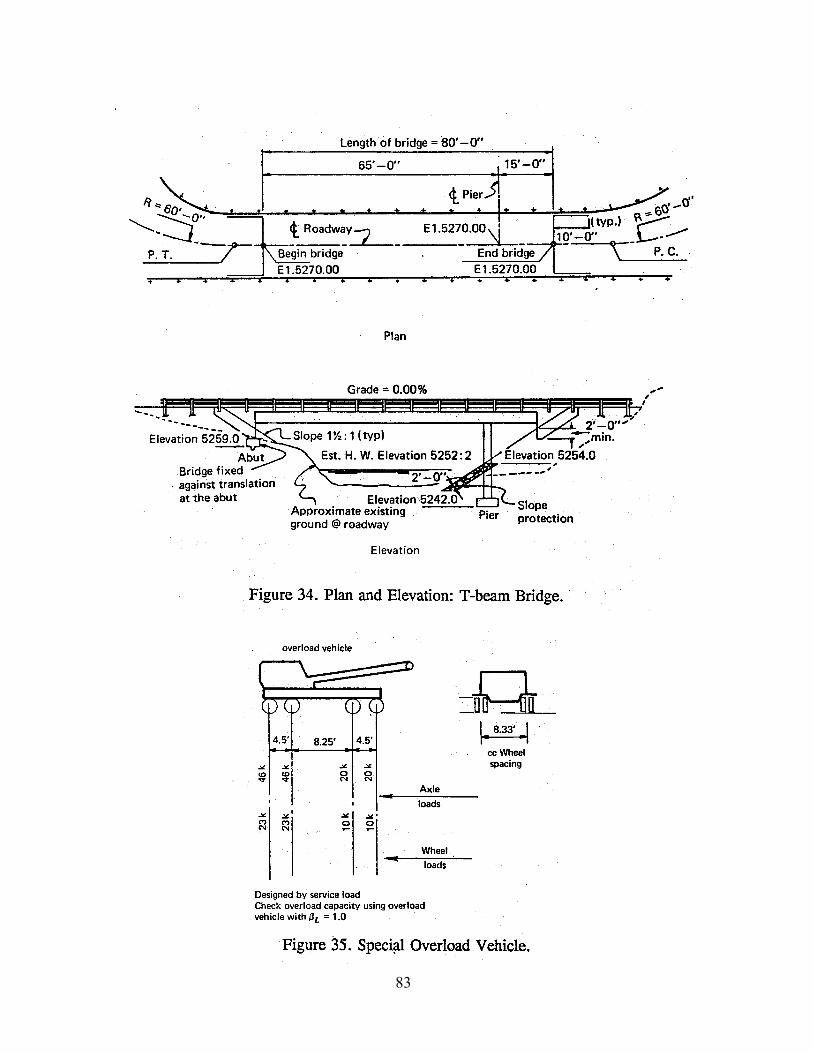
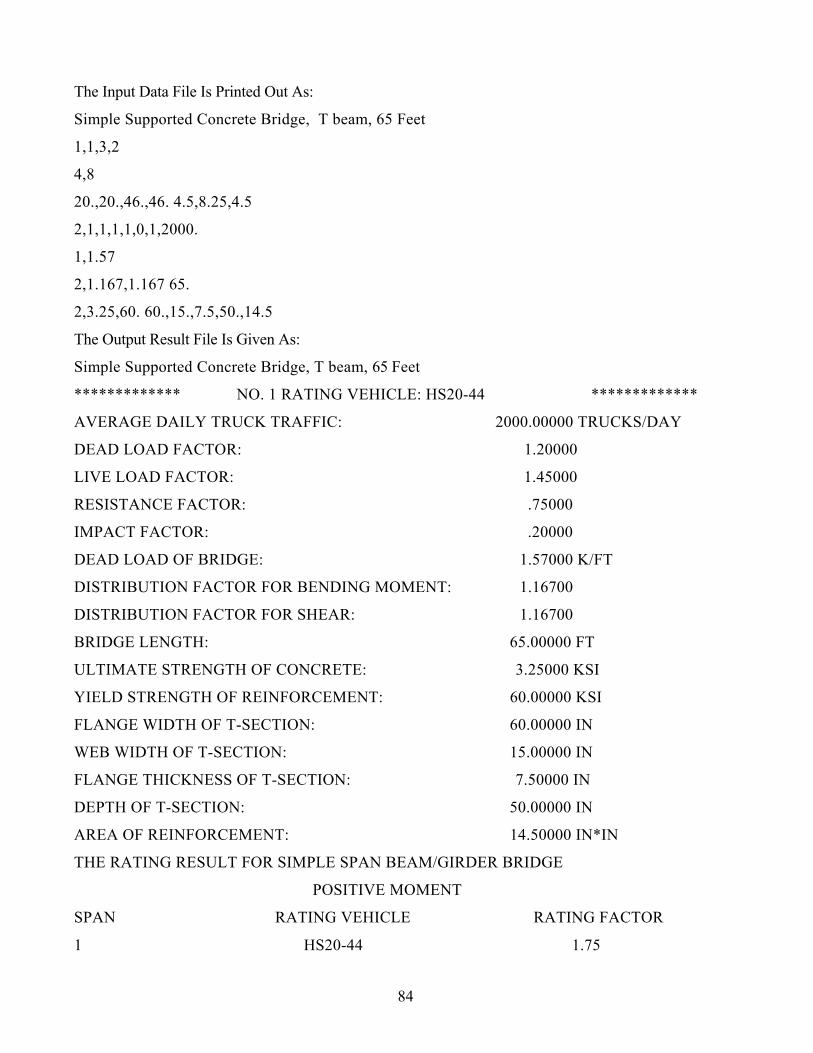
The T-beam superstructure for the bridge shown in Figures 10 and 34 is designed, by
service load design for an HS20-44 live load and checked for the overload vehicle shown
in Figure 33 [4]. The input data and rating results are given as below.
Preparation of the Input Data File:
Control Information
DC 1 : Simple Supported Concrete Bridge, T beam, 65 Feet
DC 2 : 1,1,3,2
DC 3 : 4,8
DC 3.1 : 4
DC 3.2 : 20.,20.,46.,46.
DC 3.3 : 4:5,8.25,4.5
DC 4 : 2,1,1,1,1,0,1,2000.
For Beam/Girder Bridge
DC 1 : 1,1.57
DC 2 : 2,1.167,1.167
DC 3.1.1 : 65.
DC 4.2 : 2,3.25,60.
DC 4.2.1.2 : 60.,15.,7.5,50,14.5
82
Page 93
The Input Data File Is Printed Out As:
Simple Supported Concrete Bridge, T beam, 65 Feet
1,1,3,2
4,8 20.,20.,46.,46. 4.5,8.25,4.5
2,1,1,1,1,0,1,2000.
1,1.57
2,1.167,1.167 65.
2,3.25,60. 60.,15.,7.5,50.,14.5
The Output Result File Is Given As:
Simple Supported Concrete Bridge, T beam, 65 Feet
************* NO. 1 RATING VEHICLE: HS20-44 *************
AVERAGE DAILY TRUCK TRAFFIC: 2000.00000 TRUCKS/DAY
DEAD LOAD FACTOR: 1.20000
LIVE LOAD FACTOR: 1.45000
RESISTANCE FACTOR: .75000
IMPACT FACTOR: .20000
DEAD LOAD OF BRIDGE: 1.57000 K/FT
DISTRIBUTION FACTOR FOR BENDING MOMENT: 1.16700
DISTRIBUTION FACTOR FOR SHEAR: 1.16700
BRIDGE LENGTH: 65.00000 FT
ULTIMATE STRENGTH OF CONCRETE: 3.25000 KSI
YIELD STRENGTH OF REINFORCEMENT: 60.00000 KSI
FLANGE WIDTH OF T-SECTION: 60.00000 IN
WEB WIDTH OF T-SECTION: 15.00000 IN
FLANGE THICKNESS OF T-SECTION: 7.50000 IN
DEPTH OF T-SECTION: 50.00000 IN
AREA OF REINFORCEMENT: 14.50000 IN*IN
THE RATING RESULT FOR SIMPLE SPAN BEAM/GIRDER BRIDGE
POSITIVE MOMENT
SPAN RATING VEHICLE RATING FACTOR
1 HS20-44 1.75
84
Page 94
************* NO. 2 RATING VEHICLE: SPECIAL LOAD *************
AVERAGE DAILY TRUCK TRAFFIC: 2000.00000 TRUCKS/DAY *
THE RATING RESULT FOR SIMPLE SPAN BEAM/GIRDER BRIDGE
POSITIVE MOMENT
SPAN RATING VEHICLE RATING FACTOR
1 SPECIAL LOAD .43
86
Page 95
5.10 Three Continuous Span Composite Girder Bridge
This sample problem is for the rating of a three span continuous composite, hybrid steel
structure. It is the bridge over the North, Platte River near Casper, Wyoming. The structure
has three spans, 95'-6", 124'-0", and 95'-6".[6] It is composite steel and concrete in the
positive moment regions and hybrid in the .negative moment regions. A wearing surface of
3 inches of asphalt has been placed on the structure which is a sustained dead load in the
composite sections. The modular ratio for a sustained dead load is 30 for the concrete used
in this structure.
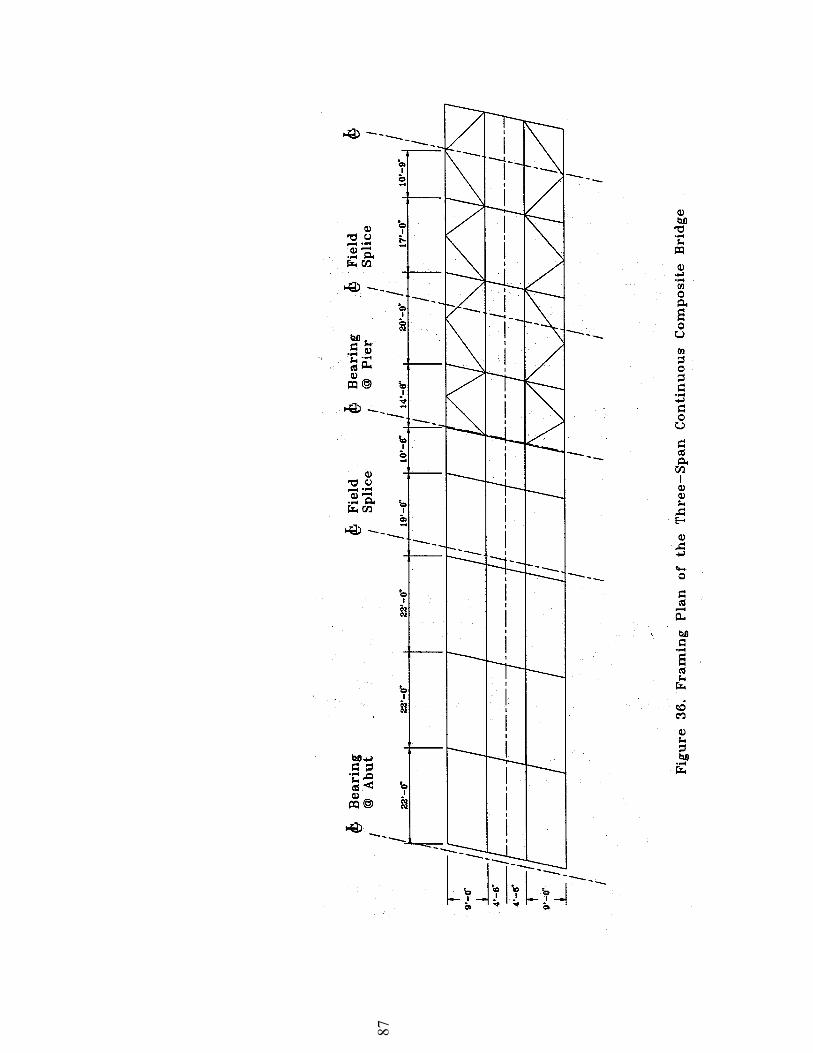
The framing plan and cross sections of the bridge are shown in Figures 35 and 36. The
calculated dead load of the bridge is equal to 1.267 K/ft. The live load trucks for live load
are HS 20-44, Type 3S2, and Type 3-3, respectively.
The input data and rating results are given as below.
Preparation of the Input Data File:
Control Information
DC 1 : Composite Steel Girder Bridge, Three Continuous Spans
DC 2 : 1,2,3,3
DC 3 : 472,1
DC 4 : 2,1,1,1,1,0,1,5000.
86
Page 98
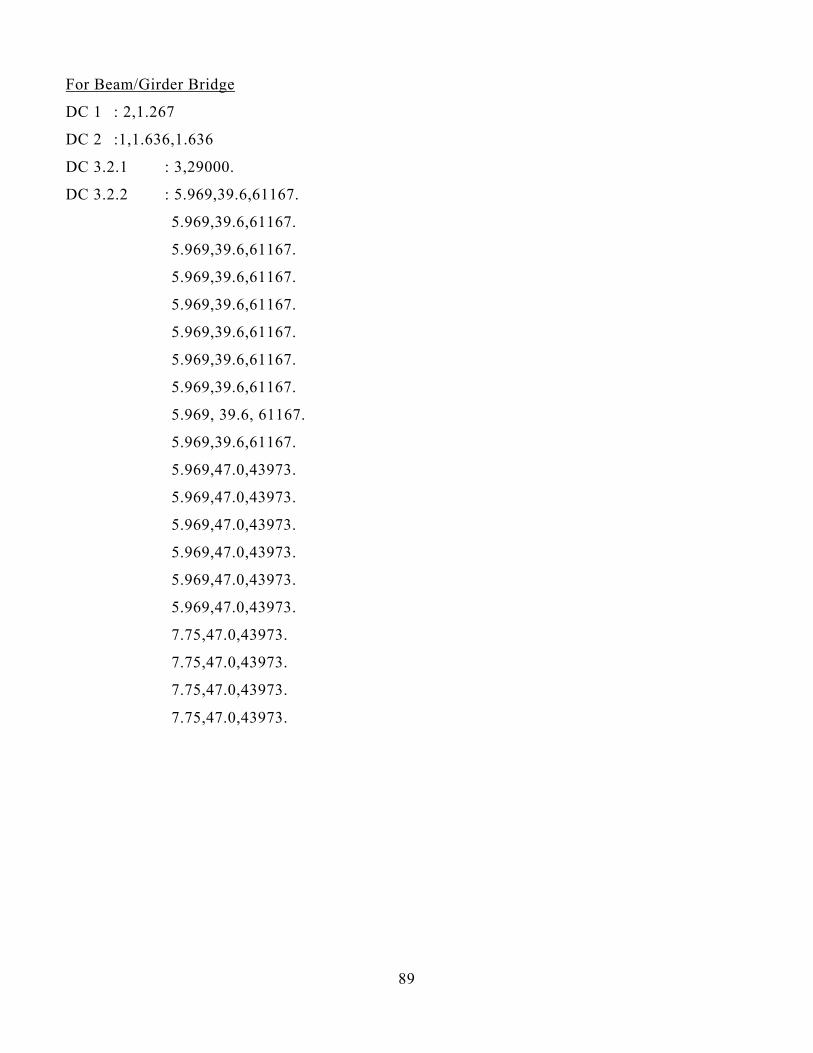
For Beam/Girder Bridge
DC 1 : 2,1.267
DC 2 :1,1.636,1.636
DC 3.2.1 : 3,29000.
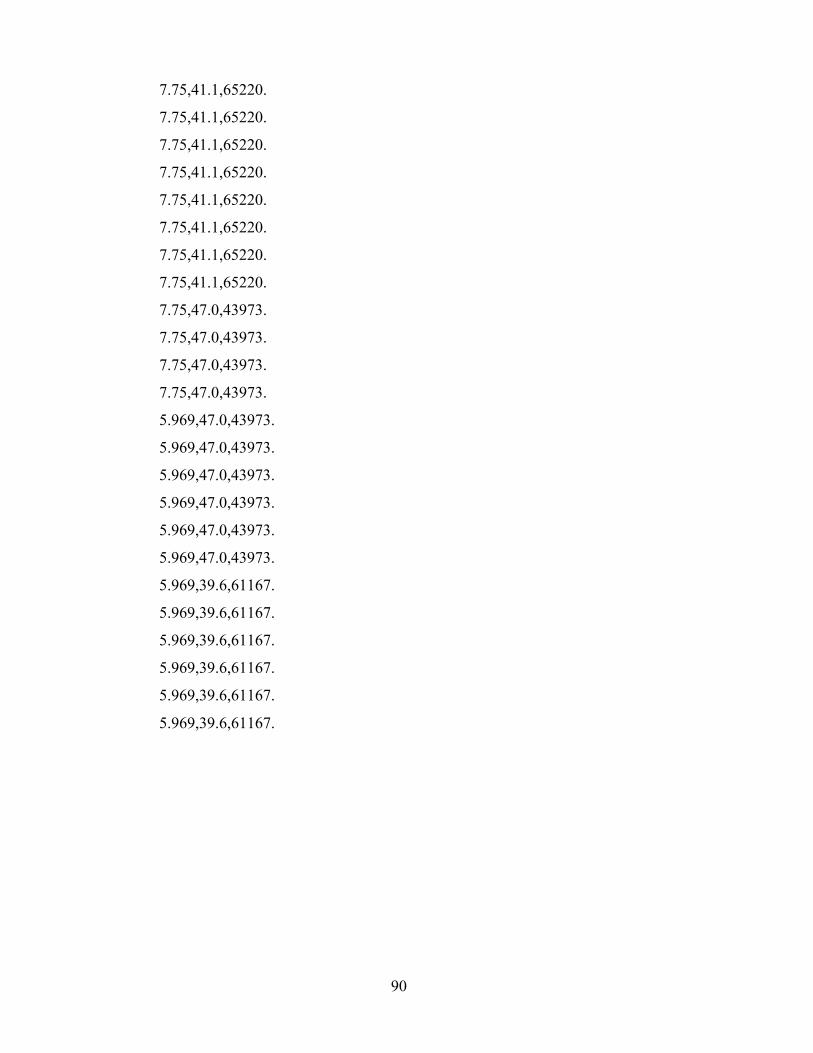
DC 3.2.2 : 5.969,39.6,61167.
5.969,39.6,61167.
5.969,39.6,61167.
5.969,39.6,61167.
5.969,39.6,61167.
5.969,39.6,61167.
5.969,39.6,61167.
5.969,39.6,61167.
5.969, 39.6, 61167.
5.969,39.6,61167.
5.969,47.0,43973.
5.969,47.0,43973.
5.969,47.0,43973.
5.969,47.0,43973.
5.969,47.0,43973.
5.969,47.0,43973.
7.75,47.0,43973.
7.75,47.0,43973.
7.75,47.0,43973.
7.75,47.0,43973.
89
Page 99
7.75,41.1,65220.
7.75,41.1,65220.
7.75,41.1,65220.
7.75,41.1,65220.
7.75,41.1,65220.
7.75,41.1,65220.
7.75,41.1,65220.
7.75,41.1,65220.
7.75,47.0,43973.
7.75,47.0,43973.
7.75,47.0,43973.
7.75,47.0,43973.
5.969,47.0,43973.
5.969,47.0,43973.
5.969,47.0,43973.
5.969,47.0,43973.
5.969,47.0,43973.
5.969,47.0,43973.
5.969,39.6,61167.
5.969,39.6,61167.
5.969,39.6,61167.
5.969,39.6,61167.
5.969,39.6,61167.
5.969,39.6,61167.
90
Page 100
5.969,39.6,61167.
5.969,39.6,61167.
5.969,39.6,61167.
5.969,39.6,61167.
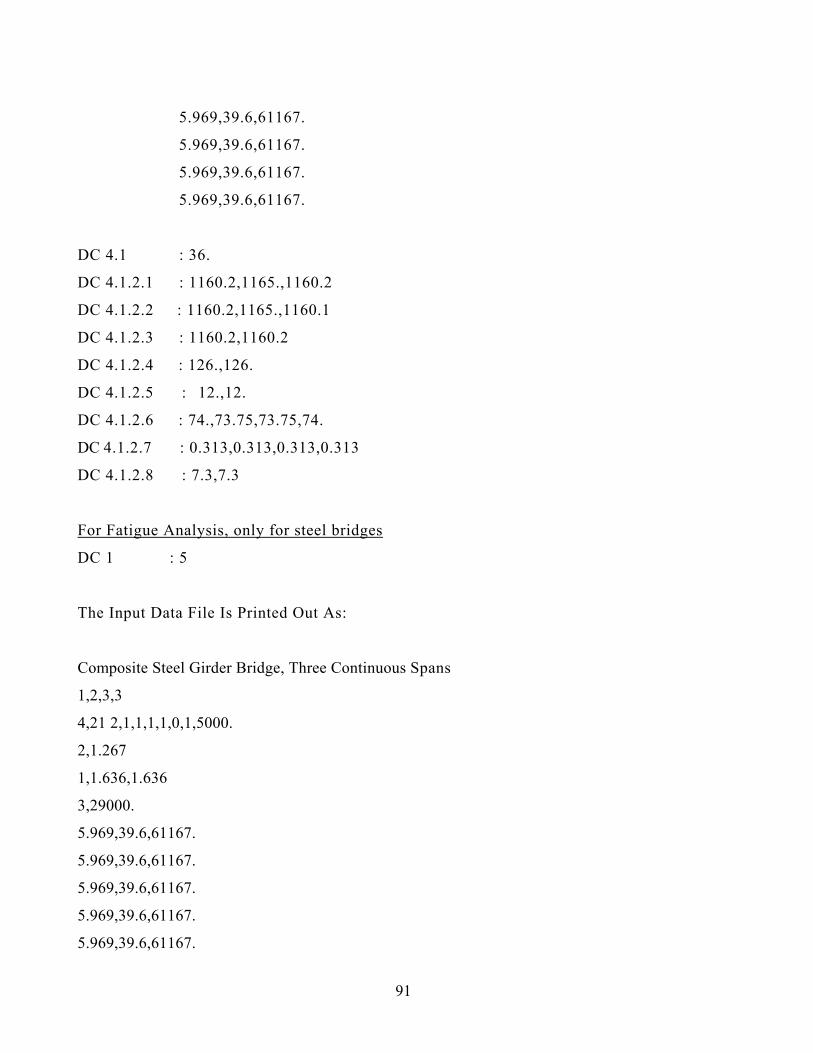
DC 4.1 : 36.
DC 4.1.2.1 : 1160.2,1165.,1160.2
DC 4.1.2.2 : 1160.2,1165.,1160.1
DC 4.1.2.3 : 1160.2,1160.2
DC 4.1.2.4 : 126.,126.
DC 4.1.2.5 : 12.,12.
DC 4.1.2.6 : 74.,73.75,73.75,74.
DC 4.1.2.7 : 0.313,0.313,0.313,0.313
DC 4.1.2.8 : 7.3,7.3
For Fatigue Analysis, only for steel bridges
DC 1 : 5
The Input Data File Is Printed Out As:
Composite Steel Girder Bridge, Three Continuous Spans
1,2,3,3
4,21 2,1,1,1,1,0,1,5000.
2,1.267
1,1.636,1.636
3,29000.
5.969,39.6,61167.
5.969,39.6,61167.
5.969,39.6,61167.
5.969,39.6,61167.
5.969,39.6,61167.
91
Page 101
5.969,39.6,61167. 5.969,39.6,61167. 5.969,39.6,61167. 5.969,39.6,61167. 5.969,39.6,61167. 5.969,47.0,43973. 5.969,47.0,43973. 5.969,47.0,43973. 5.969,47.0,43973. 5.969,47.0,43973. 5.969,47.0,43973. 7.75,47.0,43973. 7.75,47.0,43973. 7.75,47.0,43973. 7.75,47.0,43973. 7.75,41.1,65220. 7.75,41.1,65220. 7.75,41.1,65220. 7.75,41.1,65220. 7.75,41.1,65220. 7.75,41.1,65220. 7.75,41.1,65220. 7.75,41.1,65220. 7.75,47.0,43973. 7.75,47.0,43973. 7.75,47.0,43973. 7.75,47.0,43973. 5.969,47.0,43973. 5.969,47.0,43973. 5.969,47.0,43973. 5.969,47.0,43973. 5.969,47.0,43973. 5.969,47.0,43973. 5.969,39.6,61167. 5.969,39.6,61167. 5.969,39.6,61167. 5.969,39.6,61167. 5.969,39.6,61167. 5.969,39.6,61167. 5.969,39.6,61167. 5.969,39.6,61167. 5.969,39.6,61167. 5.969,39.6,61167. 36. 1160.2,1165,1160.2 1160.2,1165,1160.1 1160.2,1160.2 126.,12 6. 12.,12. 74.,73.75,73.75,74. 0.313,0.313,0.313,0.313 7.3,7.3 5
92
Page 102
The Output Result File Is Given As: Composite Steel Girder Bridge, Three Continuous Spans ************* NO. 1 RATING VEHICLE: TYPE 3S2 ************* AVERAGE DAILY TRUCK TRAFFIC: 5000.00000 TRUCKS/DAY DEAD LOAD FACTOR: 1.20000 LIVE LOAD FACTOR: 1.45000 RESISTANCE FACTOR: .75000 IMPACT FACTOR: .20000 FATIGUE STRESS CATEGORY: D. DEAD LOAD OF BRIDGE: 1.26700 K/FT DISTRIBUTION FACTOR' FOR BENDING MOMENT: 1.63660 DISTRIBUTION FACTOR FOR SHEAR: 1.63600 MODULUS OF ELASTICITY OF BRIDGE: 29000.00000 KSI YIELD STRENGTH OF STEEL: 36.00000 KSI PLASTIC SECTION MODULUS AT THE MAX. POSITIVE MOMENT POINT SPAN TOP SECTION BOTTOM SECTION (IN*IN*IN) (IN*IN*IN) 1 1160.20000 1160.20000 2 1165.00000 1165.00000 3 1160.20000 1160.10000 SECTION PROPERTIES AT EACH SUPPORT (NEGATIVE MOMENT) SUPPORT DEPTH WEB THICKNESS RAD. OF GYR. (Y-Y) (IN) (IN) (IN) 1 74.00000 .31300 2 73.75000 .31300 7.30000 3 73.75000 .31300 7.30000 4 74.00000 .31300 SUPPORT PLASTIC SEC. MOD. UNBRACED LENGTH FLANGE WIDTH (IN*IN*IN) (IN) (IN) 2 1160.20000 126.00000 12.00000 3 1160.20000 126.00000 12.00000 ELE. LENGTH CROSS AREA MOMENT OF INERTIA (FT) (IN*IN) (IN*IN*IN*IN) 1 5.96900 39.60000 61167.00000 2 5.96900 39.60000 61167.00000 3 5.96900 39.60000 61167.00000 4 5.96900 39.60000 61167.00000 5 5.96900 39.60000 61167.00000 6 5.96900 39.60000 61167.00000 7 5.96900 39.60000 61167.00000 8 5.96900 39.60000 61167.00000 9 5.96900 39.60000 61167.00000 10 5.96900 39.60000 61167.00000 11 5.96900 47.00000 43973.00000
93
Page 103
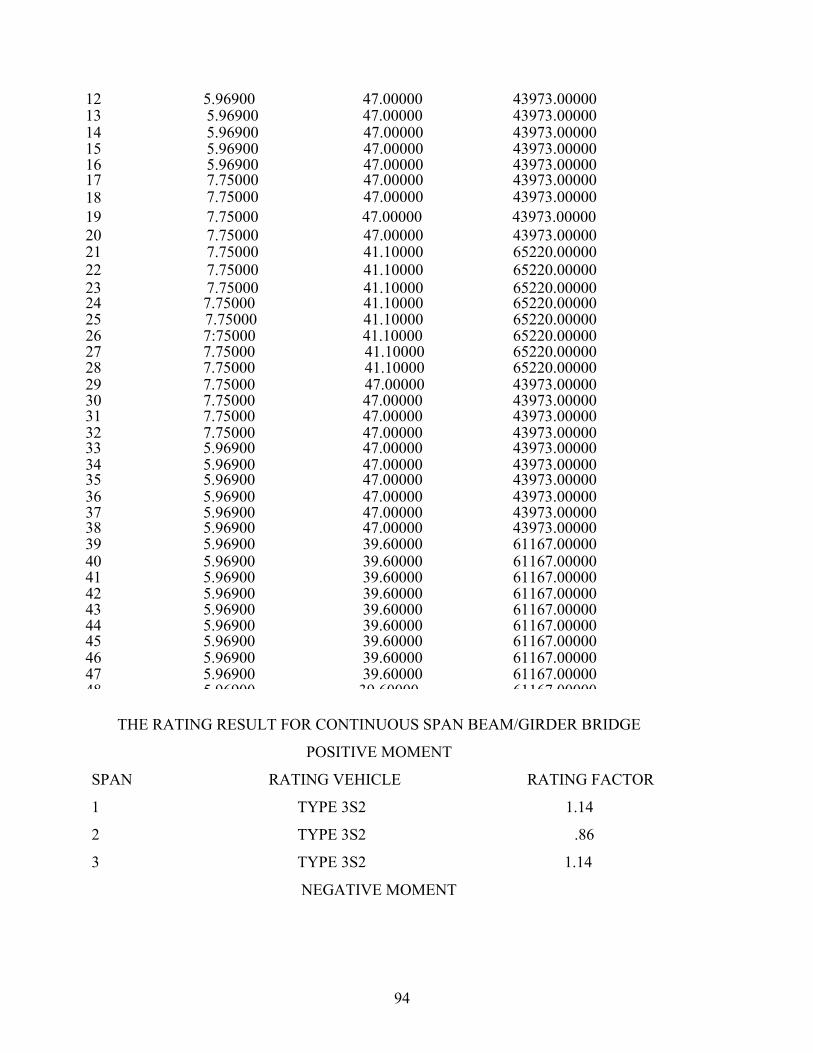
12 5.96900 47.00000 43973.00000 13 5.96900 47.00000 43973.00000 14 5.96900 47.00000 43973.00000 15 5.96900 47.00000 43973.00000 16 5.96900 47.00000 43973.00000 17 7.75000 47.00000 43973.00000 18 7.75000 47.00000 43973.00000 19 7.75000 47.00000 43973.00000 20 7.75000 47.00000 43973.00000 21 7.75000 41.10000 65220.00000 22 7.75000 41.10000 65220.00000 23 7.75000 41.10000 65220.00000 24 7.75000 41.10000 65220.00000 25 7.75000 41.10000 65220.00000 26 7:75000 41.10000 65220.00000 27 7.75000 41.10000 65220.00000 28 7.75000 41.10000 65220.00000 29 7.75000 47.00000 43973.00000 30 7.75000 47.00000 43973.00000 31 7.75000 47.00000 43973.00000 32 7.75000 47.00000 43973.00000 33 5.96900 47.00000 43973.00000 34 5.96900 47.00000 43973.00000 35 5.96900 47.00000 43973.00000 36 5.96900 47.00000 43973.00000 37 5.96900 47.00000 43973.00000 38 5.96900 47.00000 43973.00000 39 5.96900 39.60000 61167.00000 40 5.96900 39.60000 61167.00000 41 5.96900 39.60000 61167.00000 42 5.96900 39.60000 61167.00000 43 5.96900 39.60000 61167.00000 44 5.96900 39.60000 61167.00000 45 5.96900 39.60000 61167.00000 46 5.96900 39.60000 61167.00000 47 5.96900 39.60000 61167.00000 48 5 96900 39 60000 61167 00000
THE RATING RESULT FOR CONTINUOUS SPAN BEAM/GIRDER BRIDGE
POSITIVE MOMENT
SPAN RATING VEHICLE RATING FACTOR
1 TYPE 3S2 1.14
2 TYPE 3S2 .86
3 TYPE 3S2 1.14
NEGATIVE MOMENT
94
Page 104
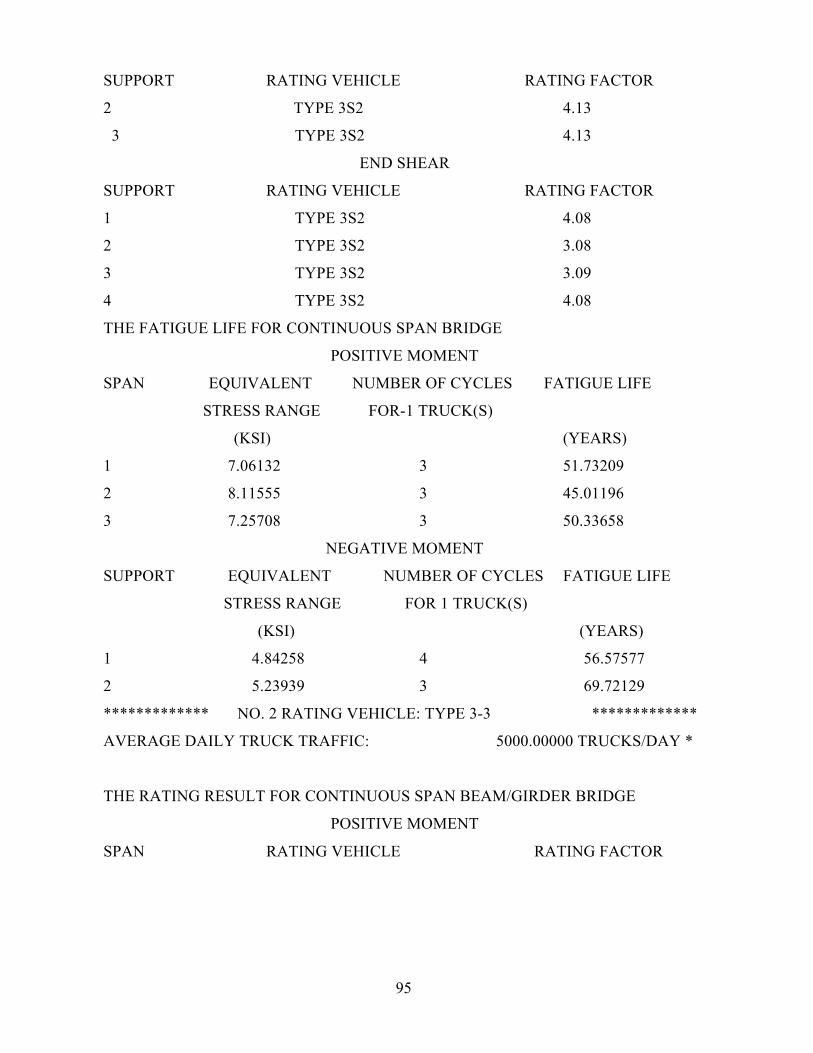
SUPPORT RATING VEHICLE RATING FACTOR
2 TYPE 3S2 4.13
3 TYPE 3S2 4.13
END SHEAR
SUPPORT RATING VEHICLE RATING FACTOR
1 TYPE 3S2 4.08
2 TYPE 3S2 3.08
3 TYPE 3S2 3.09
4 TYPE 3S2 4.08
THE FATIGUE LIFE FOR CONTINUOUS SPAN BRIDGE
POSITIVE MOMENT
SPAN EQUIVALENT NUMBER OF CYCLES FATIGUE LIFE
STRESS RANGE FOR-1 TRUCK(S)
(KSI) (YEARS)
1 7.06132 3 51.73209
2 8.11555 3 45.01196
3 7.25708 3 50.33658
NEGATIVE MOMENT
SUPPORT EQUIVALENT NUMBER OF CYCLES FATIGUE LIFE
STRESS RANGE FOR 1 TRUCK(S)
(KSI) (YEARS)
1 4.84258 4 56.57577
2 5.23939 3 69.72129
************* NO. 2 RATING VEHICLE: TYPE 3-3 *************
AVERAGE DAILY TRUCK TRAFFIC: 5000.00000 TRUCKS/DAY *
THE RATING RESULT FOR CONTINUOUS SPAN BEAM/GIRDER BRIDGE
POSITIVE MOMENT
SPAN RATING VEHICLE RATING FACTOR
95
Page 105
1 TYPE 3-3 1.15
2 TYPE 3-3 .85
3 TYPE 3-3 1.15
NEGATIVE MOMENT
SUPPORT RATING VEHICLE RATING FACTOR
2 TYPE 3-3 3.96
3 TYPE 3-3 3.96
END SHEAR
SUPPORT RATING VEHICLE RATING FACTOR
1 TYPE 3-3 4.01
2 TYPE 3-3 2.93
3 TYPE 3-3 2.94
4 TYPE 3-3 4.01
THE FATIGUE LIFE FOR CONTINUOUS SPAN BRIDGE
POSITIVE MOMENT
SPAN EQUIVALENT NUMBER OF CYCLES FATIGUE LIFE
STRESS RANGE FOR 1 TRUCK(S)
(KSI) (YEARS)
1 7.18952 3 50.80964
2 8.23030 3 44.38440
3 7.04648 3 51.84107
NEGATIVE MOMENT
SUPPORT EQUIVALENT NUMBER OF CYCLES FATIGUE LIFE
STRESS RANGE FOR 1 TRUCK(S)
(KSI) (YEARS)
1 5.51943 3 66.18383
2 5.50923 3 66.30636
************* NO. 3 RATING VEHICLE: HS20-44 *************
AVERAGE DAILY TRUCK TRAFFIC: 5000.00000 TRUCKS/DAY
96
Page 106
* THE RATING RESULT: FOR CONTINUOUS SPAN BEAM/GIRDER BRIDGE
POSITIVE MOMENT
SPAN RATING VEHICLE RATING FACTOR
1 HS20-44 .97
2 HS20-44 .75
3 HS20-44 .97
NEGATIVE MOMENT
SUPPORT RATING VEHICLE RATING FACTOR
2 HS20-44 2.71
3 HS20-44 2.71
END SHEAR
SUPPORT RATING VEHICLE RATING FACTOR
1 HS20-44 3.55
2 HS20-44 2.73
3 HS20-44 2.73
4 HS20-44 3.55
THE FATIGUE LIFE FOR CONTINUOUS SPAN BRIDGE POSITIVE MOMENT
SPAN EQUIVALENT NUMBER OF CYCLES FATIGUE LIFE
STRESS RANGE FOR 1 TRUCK(S)
(KSI) (YEARS)
1 8.38966 3 43.54133
2 9.32175 3 39.18757
3 8.47945 3 43.08026
NEGATIVE MOMENT
SUPPORT EQUIVALENT NUMBER OF CYCLES FATIGUE LIFE
STRESS RANGE FOR 1 TRUCK(S)
(KSI) (YEARS)
1 5.28868 4 51.80358
2 5.54794 3 65.84373
97
Page 107
CHAPTER VI
CONCLUSIONS AND RECOMMENDATIONS
This computer package can rate the bridge capacity in beam/girder, longitudinal
deck/slab, and transverse deck/slab bridges according to new AASHTO specifications [2].
In addition, it can predict the fatigue life of steel bridges based on the standard H or HS
truck loadings, Type 3, Type 3S2, and Type 3-3 truck loadings, and equivalent lane
loadings. Both simple and continuous span bridges were dealt with in the package. The
materials of the bridges can be steel, reinforced concrete, or timber. Either uniform or
nonuniform cross section of bridge can be utilized. The data obtained from output results
can be used to plot the diagrams of influence line and envelope for shear and moment by
using the special program BRAF-P contained in the package without any modification or
any plotting software. Also, the bending stress history of any critical joint can be plotted to
determine the equivalent stress range.
This package can run on IBM PC/XT, AT, or above computers, and compatibles. It can
also be used in the general main frame computers. The package, combining capacity rating
and prediction of the remaining service life of highway bridges, will provide the U.S.
industries a constructive tool in evaluating the numerous existing highway bridges.
Furthermore, it is applicable in bridge design course for educational purposes.
Finally, some suggestions could be made for this computer package in its further
improvement. First, more types of bridge, which can be rated by using the package, should
be included, such as box girder, prestressed concrete, slant-legged, and truss bridges, etc.
Second,
98
Page 108
in order to obtain more accurate and comprehensive results in bridge rating and fatigue life
analysis, a three-dimensional structural analysis should be carried out instead of a one dimensional
structural analysis in conjunction with the distribution of loads in the present package. Further
research is necessary in these areas. However, the computer system developed in this study would
be useful in highway bridge rating and fatigue life prediction.
99
Page 109
APPENDIX A
USER'S MANUAL OF BRAF PROGRAM
A.1 General
This program can be used to compute the rating factor based on the new AASHTO
specifications for deck, slab, beam, stringer, and girder members in highway bridges. This
program can also be used to compute the fatigue life for steel bridges. The types of bridges
are simple uniform beams or continuous beams.
The materials of each bridge member can be timber, reinforced concrete, or steel.
Single truck was used to determine the fatigue life. Following are the most significant
limitations of the program
Maximum number of nodes = 113
Maximum number of spans = 7
Maximum number of elements = 112
Maximum number of DOF's = 328
Highway Bridge Rating and Fatigue Program (BRAF) was developed in FORTRAN
Language and compiled by Microsoft FORTRAN Compiler 5.1. It can be run on IBM PC XT,
AT, or above computers, and compatible computers.
100
Page 110
The characteristics of the program are listed below:
a. All real variables = REAL*4.
b. Use graphic mode for screen printing.
c. Use input/output skill to reduce the size of the bridge stiffness matrix.
d. Store the bridge stiffness matrix in the disk in order to save computer memory storage
(unformatted data).
e. Define the number of joint from left support to right support in sequence.
f. In addition to the, input data file and the output data file, another four files are, opened to
print out or plot the bending stress history for maximum positive and negative, moment,
the shear influence lines, the moment influence lines, and the shear and moment envelopes
by using another program which will be described later.
A.2 How To Run BRAF Program
It is very simple to run BRAF program just by typing “BRAF’ and then names of the input
data file and the output data files from the keyboard in dialogue way. The names of six
input/output data files are recommended for ease of identification as follows:
BRAF.I**: Input data file
BRAF.O**: Output data file to store the results of the analysis
BRAF.P**: Output data file for plotting the bending stress histories
BRAF.S**: Output data file for plotting the shear influence lines
BRAF.M**: Output data file for plotting the moment influence lines
101
Page 111
BRAF.E**: Output data file for plotting the shear and moment envelopes
A.3 Preparation of Data File
The input data file (e.g., BRAF.I**) for abridge rating and fatigue life analysis should
be prepared before running BRAF program. All data for the analysis will be read from the
file in the sequential access method. The data will be described one Data Code (DC) after
another as below.
Part I: Control Information
Part II: For Girder Bridges
Part III: For longitudinal concrete deck (slab)
Part IV: For transverse deck (slab) bridges
Part V: Fatigue Analysis, only for steel bridges
Part I: Control Information
DC 1: TITLE
Any ASCII codes not exceeding 80 characters for the user's convenience in recording a
title of pertinent information about- this rating or/and fatigue analysis.
102
Page 112
DC 2: IGD, IRF, ME, NLOAD
IGD = Index of girder or deck bridges
1: For beam/girder bridges
2: For longitudinal concrete deck (slab)
3: For transverse deck (slab)
IRF = Index of rating and fatigue
1: For rating analysis only
2: For rating and fatigue analyses
IIE = Index for printing the shear and moment influence lines and/or envelopes
1: For printing influence lines
2: For printing envelopes
3: For printing both influence lines and envelopes
0: For no printing influence lines and envelopes
NLOAD = Number of rating vehicle load types
DC 3: (ITRUCK(I), I=1, NLOAD)
ITRUCK = Index of truck loading
1: For Type 3
2: For Type 3S2
3: For Type 3-3
4: For HS20-44
103
Page 113
5: For HS 15-44
6: For H20-44
7: For H15-44
8: For special load
DC 3.1: NA(8), only for special load, i.e., ITRUCK(I)=8
NA(8) = Number of the axles. The maximum number of the axles is 10.
DC 3.2: (SPTL(I), I=1, NA(8)), only for ITRUCK(I)=8
SPTL(1) = Axle Loads.
DC 3.3: (SPTLS(I), I=1, (NA(8)-1)), only for ITRUCK(I)=8
SPTLS(I) = Spacing between the axles.
DC 4: IMP, IRED, IDET, INSP, MAINT, IDLF, ITRA, ADTT
IMP = Index of impact factor
1: For good and fair condition
2: For poor condition
3: For critical condition
IRED = Index of redundancy
0: For non-redundancy
1: For redundancy
104
Page 114
IDET = Index of deterioration
0: For no deterioration
1: For some deterioration
2: For heavy deterioration
INSP = Index of inspection
1: For estimated inspection
2: For careful inspection
MAINT = Type of maintenance
1: For intermittent maintenance
2: For vigorous maintenance
IDLF = Index of dead load factor
0: For nominal thickness of deck (exclude the overlay thickness)
1: For actual thickness of deck (include the overlay thickness)
ITRA = Index of traffic condition
1: For reasonable enforcement and apparent control of overloads
2: For significant sources of overloads without effective enforcement
ADTT = Average daily truck traffic
105
Page 115
Part II: For Girder Bridges. i.e., IGD=1
DC 1: IB, UW
IB = Index of bridge
1: For simply supported bridges
2: For continuous bridges
UM = Average unit weight of beam (kip/ft)
DC 2: IG, DISM, DISV
IG = Index of girder materials
1: For steel
2: For reinforced concrete
3: For timber
DISM = Distribution factor for moment
DISV = Distribution factor for shear
DC 3.1:1: BL, only for simple supported bridges, i.e., IB=1
BL = Bridge length for simple supported bridge (ft)
DC 3.2.1: NS, E, only for continuous beam bridges, i.e., IB=2
NS = Number of spans
106
Page 116
E = Modulus of elasticity (ksi)
DC 3.2.2: (XLEN(I), XAREA(n, ZZIM, I=1, NE), only for IB=2
XLEN(I) = Element length (ft)
XAREA(I) = Cross section area of element (in2)
ZZI(I) = Cross section moment of inertia of element (in4)
NE = (Number of spans) * 16
DC 4.1: FYl, only for steel girders, i.e., IG = 1
FY1 = Fy, yield stress (ksi)
DC 4.1.1.1: PSMT1(1), PSMB1(1), DDl(1), TW(1), only, for simple supported bridges, i.e.,
IB = l
PSMT1(1) = Plastic section modulus for top section (in)
PSMB1(1) = Plastic section modulus for bottom; section (in)
DDl(1) = Depth of beam (in)
TW(1) = tw, web thickness of beam (in)
DC 4.1.2.1: (PSMT1(1), I=1, NS), only for continuous beam bridges, i.e., IB = 2
PSMTl(I) = Plastic section modulus for top section at each middle span (for positive moment area)
(in3)
DC 4.1.2:2: (PSMB1(I), 1=1, NS), only for IB=2
PSMB1(1) = Plastic section modulus for bottom section at each middle span (for positive
107
Page 117
moment) (in3)
DC 4.1.2.3: (PSMNl(I),I=1, (NS-1)), only for IB=2
PSMNl(I) = Plastic section modulus for bottom section at each support (for negative
moment area) (in)
DC 4.1.2.4: (AL(I), I=1, (NS-1)), only for IB=2
AL(I) = Lateral unbraced length in compression side of beam (for negative moment
area) (in)
DC 4.1.2.5: (BBI(I), I=1, (NS-1)), only for IB = 2
BBl(1) = Flange width in compression section (bottom) of beam/girder (for negative
moment area) (in)
DC 4.1.2:6: (DD1(I), I=1, (NS+1)), only for IB = 2
DD1(I) = Depth of beam at each support (in)
DC 4.1.2.7: (TW(I), I=1, (NS+1)), only for IB = 2
TW(I) -- Web thickness of beam at each support (in)
DC 4.1.2.8: (RY(I), I=1, (NS-1)), only for IB = 2
RY(I) = Radius of gyration with respect to Y-Y (transverse) axis (in)
DC 4.2: IS, FC2, FY2 only for concrete girders, i.e., IG=2
108
Page 118
IS = Index of section
1: For rectangular section
2: For T section
FC2 = fc', ultimate concrete compressive strength (ksi)
FY2 = fy, yield strength of reinforcement (ksi)
DC 4.2.1.1: BB2(1), DD2(1), AS(1), only for simply supported beam and rectangular
section, i.e., IB=1 and IS =1
BB2(1) = Width of rectangular cross section (in)
DD2(1) = d, depth of T section (positive, moment) (in)
AS(1) = As, the area of reinforcement (positive moment) (in2)
DC 4.2.1.2: BF(1), BW(1), HF(1), DD2(1), AS(1), only for simply supported beam and T-section,
i.e., IB=1 and. IS=2
BF(1) = Bf, flange width of T cross section (in)
BW(l) = bw, web width of cross section (in)
HF(1) = hf, thickness of flange of T cross section (in)
DD2(1) = d, depth of T section (positive moment) (in)
AS(1) = As, the area of reinforcement (positive moment) (in2)
DC 4.2.2.1.1: (BB2(I), I=1, NS), only for continuous beam and rectangular section, i.e., IB=2 and
IS=1
BB2(I) = Width of rectangular, cross, section for, each span (in)
109
Page 119
DC 4.2.2.1.2: (DD2(I), I=1, NS), only for IB=2 and IS=1
DD2(I) = d, depth of T section for each span (positive moment) (in)
DC 4.2.2.1.3: (DDN(I), I=1, (NS-1)), only for IB=2 and IS=1
DDN(I) = d', the distance from the center of reinforcement to the bottom of section for each
intermediate support (negative moment) (in)
DC 4.2.2:1.4: (AS(I) I=1, NS), only for IB=2 and IS=1
AS (I) = As, the area of T section at each middle span (positive moment) (in2)
DC 4.2.2.1.5: (ASN(I), I=1, (NS-1)), only for IB=2 and IS=1
ASN(I) = As', the cross sectional area of reinforcement at each intermediate supports (negative
moment) (in2)
DC 4.2:2:2.1: (BF(I), I=1, NS), only for continuous beam and T-section, i.e., IB=2
and IS=2
BF(I) = Bf, flange width of T cross section for each span (in)
DC 4.2.2.2.2: (BW(I), I=1, NS), only, for IB = 2 and IS=2
BW(I) = bw, web width of T cross section for each span (in)
DC 4:2.2.2.3: (HF(I), I=1, NS), only for IB=2 and IS=2
HF(I) = hf, thickness of-flange of T cross section for each span (in)
110
Page 120
DC 4.2.2.2.4: DD2(I), only for IB=2 and IS=2
DD2(I) = d, depth of T section for each span (positive moment) (in)
DC 4.2.2.2:5: (DDN(I), I=1, (NS-1)) only for IB=2 and;IS=2 ,
DDN(I) = d', the distance from the center of reinforcement to the bottom of T section for each
intermediate support (negative moment) (in)
DC 4.2.2.2.6: (AS(I), I=1, NS), only for IB=2 and IS=2
AS(I) = As, the area of T section for each span (positive moment) (in2)
DC 4.2.2.2.7: (ASN(I), I=1, (NS-1)), only for IB:=2 and IS=2
ASN(I) = As', the cross sectional area of reinforcement at each intermediate support (negative
moment) (in)
DC 4.3.1: FB, only for timber girder, i.e., IG=3
FB = fb, allowable bending stress (ksi)
DC 4.3.2.1.1: SM3(1), only for timber and simple girder, i.e., IG=3 and IB=1
SM3(1) = Section modulus of timber girder (positive moment) (in3)
DC 4.3.2.2.1: (SM3(I), I=1, NS), only for timber and continuous; girder, IG=3 and IB =2
SM3(I) = Section modulus of timber girder for each span (positive moment) (in3)
DC 4.3.2.2.2: (SMN3(I), I=1, NS), only for IG=3 and IB=2
111
Page 121
SMN3(I) = Section modulus of timber girder for each span (positive moment) (in3)
Part III: For longitudinal concrete deck (slab): i.e., IGD=2
DC 1: IB, UW
IB = Index of bridge
1: For simple bridges
2: For continuous beam bridges
UM = Average unit weight of beam (k/ft)
DC 2: DW
DW = Distribution width (ft)
DC 3.1.1: BL, only for simply supported bridges, i.e., IB=1
BL = Bridge length for simple bridge (ft)
DC 3.2.1: NS, E, only for continuous beam bridges, i.e., IB=2
NS = Number of spans
E = Modulus of elasticity (ksi)
DC 3.2.2: (XLEN(I), XAREA(I), ZZI(I), I=1, NE) only for IB=2
112
Page 122
XLEN(I) = Element length (ft)
XAREAM = Cross section area of element (in2)
ZZI(I) = Cross section moment of inertia of element (in4)
NE = (Number of spans) * 16
DC 4: FC6, FY6
FC6 = fc', ultimate concrete compressive strength (ksi)
FY6 = fy, yield strength of reinforcement (ksi)
DC 5.1.1: DD6(1), AS(6), only for simple bridges, i.e., IB=1
DD6(1) = d, the distance from the center of reinforcement to the bottom of section (in)
AS(6) = As, the area of reinforcement for each span (positive moment) (in2)
DC 5.2.1: (DD6(I), I=1 NS), only for continuous bridges, i.e., IB=2
DD6(I) = d, the distance from the center of reinforcement to the top of section (in)
DC 5.2.2: (DDN6(1), 1=1, (NS-1)), only for IB=2
DDN6(I) = d', the distance from the center of reinforcement to the bottom of section at each
intermediate support (negative moment) (in)
DC 5.2:3: (AS(I), 1=1, NS), only for IB=.2
AS(I) = As, the area of reinforcement for each span (positive moment) (in2)
113
Page 123
DC 5.2.4: (ASN(I), I=1, (NS-1)), only for IB=2
ASN(I) = As', the area of reinforcement at each intermediate support (negative moment) (in 2)
Part IV: For transverse deck (slab) bridges: i.e., IGD=3
DC 1: IDM
IDM = Index of transverse deck materials
1: For concrete
2: For timber
DC 2.1.1: ID, FC4, FY4, only for concrete deck (slab), i.e., IDM=1
ID = Index of transverse deck
1: For simple span
2: For continuous
FC4 = fc', the ultimate strength of concrete (ksi)
FY4 = fy, the yield strength of reinforcement (ksi)
DC 2.1.2: SG4, BB4, HD4, DD4, AS4, only for concrete deck
SG4 = Center to Center stringer spacing (transverse concrete deck)
BB4 = Flange width of stringer (transverse concrete deck)
114
Page 124
HD4 = Thickness of deck (transverse- concrete deck)
DD4 = Depth of deck (transverse concrete deck)
AS4 = The area of reinforcement per one feet (transverse concrete deck)
DC 2.1.3: ISM, HS, only for concrete deck
ISM = Index of stringer materials
1: For reinforced concrete
2: For steel
3: For timber
HS = Depth of stringer (transverse concrete deck) (in)
DC 2.2.1: ID, FB5, only for timber slab, i.e., IDM=2
ID = Index of transverse deck
1: For simple span
2: For continuous
FB5 = fb, the yield stress of timber (ksi)
DC 2.2.2: SG5, BB5, HD5, SS, only for timber slab
SG5 = Center to Center stringer spacing (transverse timber deck) (in)
BB5 = flange width of stringer (transverse timber deck) (in)
HD5 = Thickness of deck (transverse timber deck) (in)
115
Page 125
SS = Section modulus of cross section (in3)
Part V: For Fatigue Analysis, only for steel bridges
DC 1: IC
IC = Index of fatigue category
1: For category A
2: For category B
3: For category C (Stiffeners)
4: For category C` (Other Attachments)
5: For category D
6: For category E
7: For category F
125
Page 126
APPENDIX B
USER'S MANUAL OF BRAF-P PROGRAM
B.1 General
This program (BRAF-P) was developed for processing the four output data files (BRAF.P**,
BRAF.S**, BRAF.M**, and BRAF.E**), which were produced after running BRAF to make a
bridge rating and fatigue life analysis. The bending stress histories, shear influence lines, moment
influence lines, and the shear and moment envelopes can be plotted, individually. The BRAF-P
program was written in Microsoft FORTRAN language, Version 5.1 and can run on IBM PC/XT, AT
and above computers, or compatible computers.
B.2 How To Run BRAF-P Program
The BRAF-P program is run on a computer in dialogue way. When you run BRAF-P, a
menu will be displayed on the screen and a choice should be made for the type of figure you are
interested in. The user needs to input the data required for plotting the figure, i.e., answer the question
on display. The input data in dialogue are very simple. They are, for example, the number of the
loading, the number of joints you are interested in, the number of the figure in accordance with the
numbering of the figures in your report, and the name of the related data file which was produced
after running the BRAF-P program, etc.
117
Page 127
After inputting all the data for the plotting, the figure will be displayed on screen and can be
copied to a printer in graphics mode by pressing the PRINT SCREEN Key on the keyboard. If
you are not interested in the figure, you can return to the menu by simply pressing the ENTER
Key and then start a new job or quit the program.
118
Page 128
REFERENCES
1. Fisher, J. W., Guide to 1974 AASHTO Fatigue Specifications, American Institute of Steel
Construction, New York, N.Y., 1977.
2. Guide Specifications for Strength Evaluation of Existing Steel and Concrete Bridges, American
Association of State Highway and Transportation Officials, Washington, D.C., 1989
3. Heins, C. P. and Firmage, D. A., Design of Modern Steel Highway Bridges, John Wiley &
Sons, Inc., New York, N.Y., 1979.
4. Heins, C.P. and Lawrie R. A., Design of Modern Concrete Highway Bridges, John Wiley &
Sons, Inc., New York, N.Y., 1984.
5. Interim Specifications-Bridges, American Association of State Highway and Transportation
Officials, Washington, D.C., 1987.
6. Johnston R.R., Day R.H., and Glandt D.A., "Bridge Rating and Analysis Structural
System (BRASS)", Volume II, Example Problems, Wyoming State Highway Department,
Cheyenne, 1973.
7. McCarthy, W. C., "Elastic-Plastic Analysis of Stringer-Diaphragm Systems." Master's Thesis,
New Mexico State University, 1976.
8. Miner, M. A., "Cumulative Damage in Fatigue." Journal of Applied Mechanics, ASME, VOL.
12., 1945.
9. Schilling, -C. G., and Klippstein, K. H., "New Method of Fatigue Design of Bridges." Journal of
the Structural Division, ASCE, Vol. 104, No. ST3, 425-438, 1978.
10. Standard Specifications for Highway Bridges, 14th Ed., American Association of State Highway
and Transportation Officials,-Washington, D.C., 1989.
11. System Orientation Manual for Load Rating of Bridge Structures, Wyoming Highway
Department, Bridge Division, Laramie, Wyoming, 1973.
12. "Weak Bridges: Growing Hazard on the Highways", U.S. News and World Report, January 9,
1978.
13. White, K. R. and Minor, J., "Evaluation of Bridge Overloads." Transportation Division, ASCE,
January, 1979.
14. White, K. R., Minor, J., Derucher, K. N., and Heins Jr., C.P., Bridge Maintenance Inspection and
Evaluation, Marcel Dekker, Inc., New York, N.Y., 1981.
128