Seeding the College Dream Final Report: An EvaluaƟon of the Child Support for College Asset-Building IniaƟve December 2013 The University of Texas at AusƟn Lyndon B. Johnson School of Public Affairs
Transcript
Seeding the College Dream
Final Report: An Evalua on of the Child Support for College Asset-Building Inia ve
December 2013
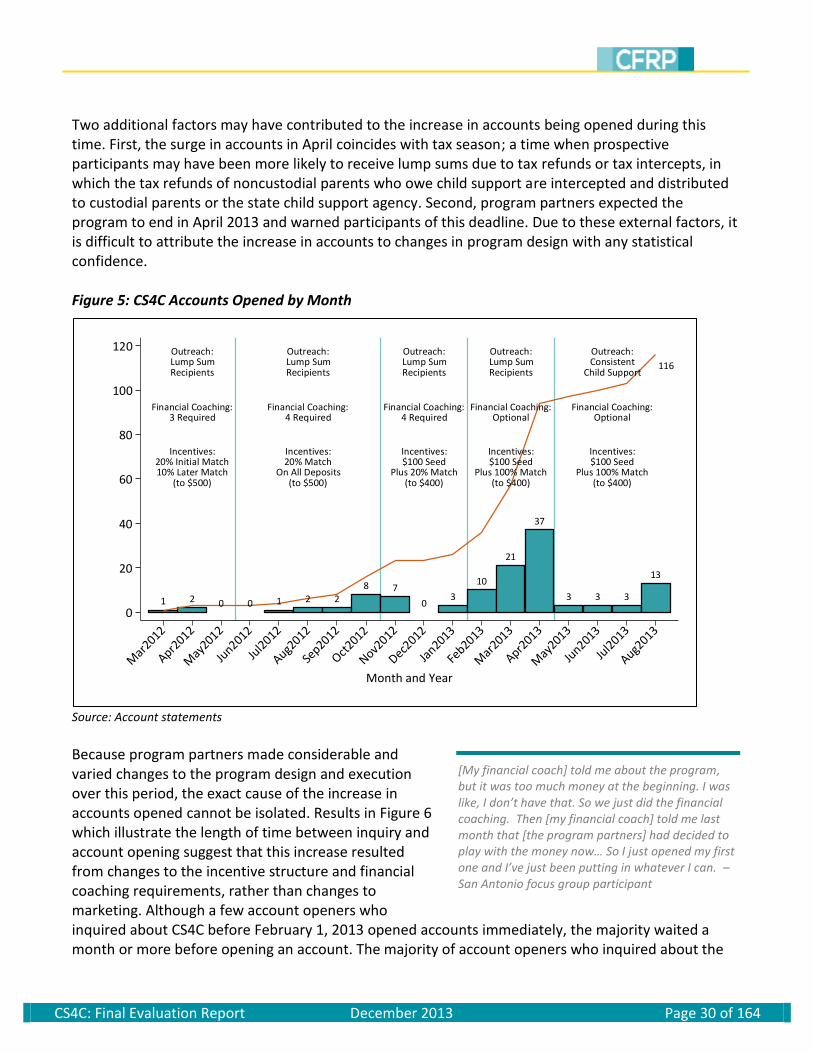
The University of Texas at Aus nLyndon B. Johnson School of Public Affairs
Final Report: An Evaluation of the Child Support for College Asset-Building Initiative
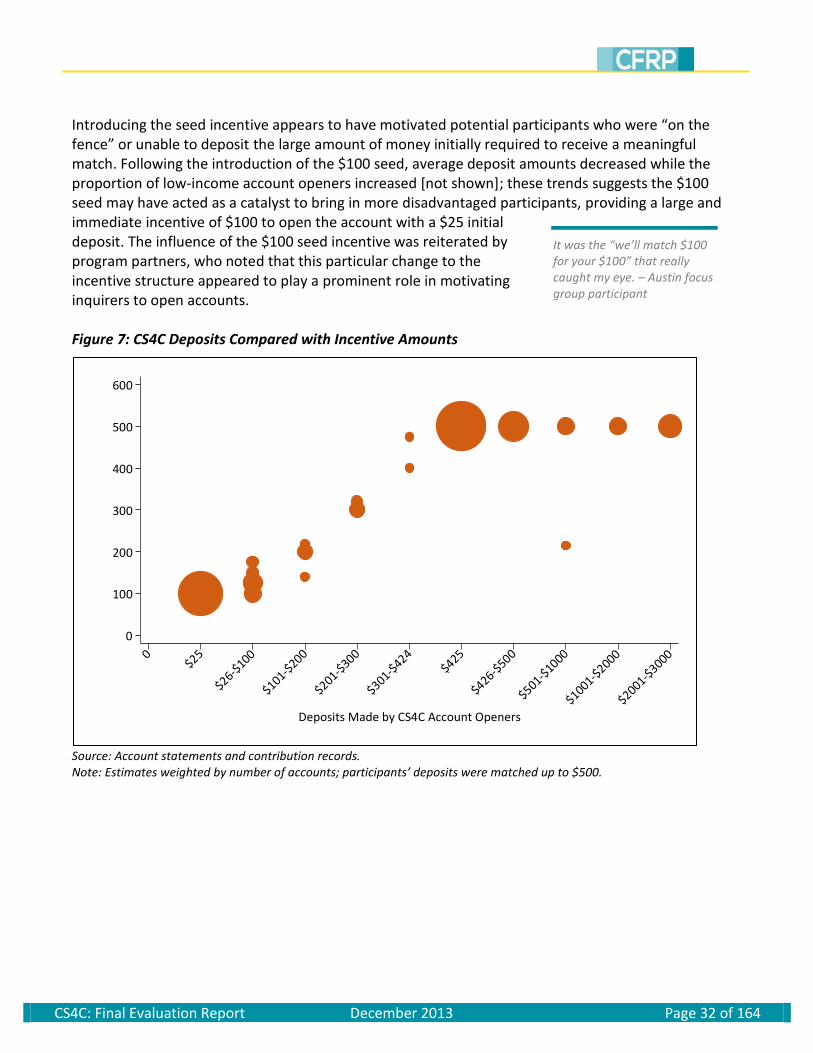
CS4C: Final Evaluation Report December 2013 Page 2 of 164
EXECUTIVE SUMMARY
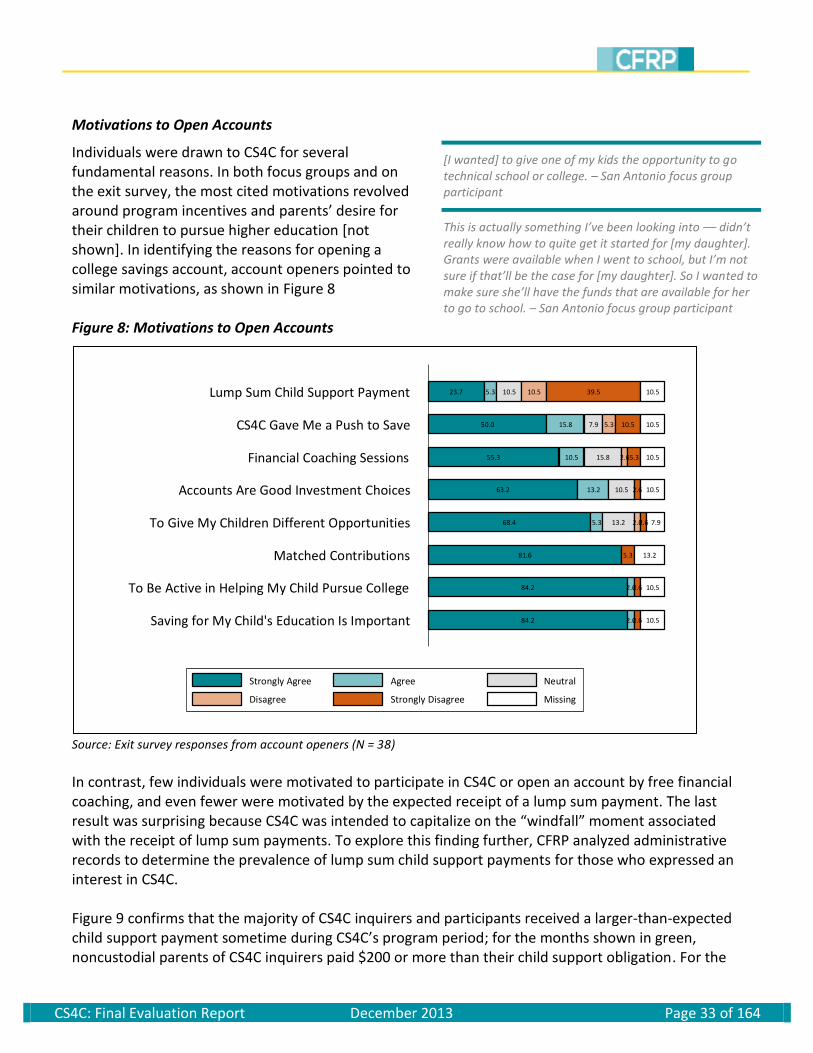
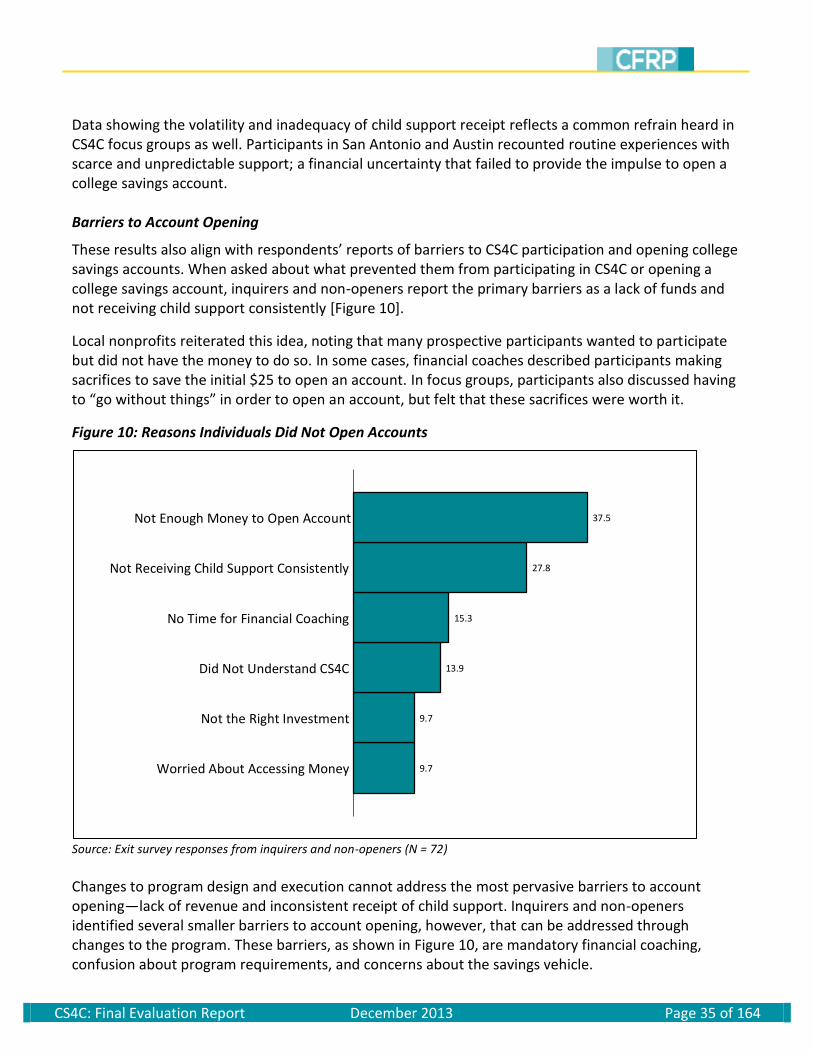
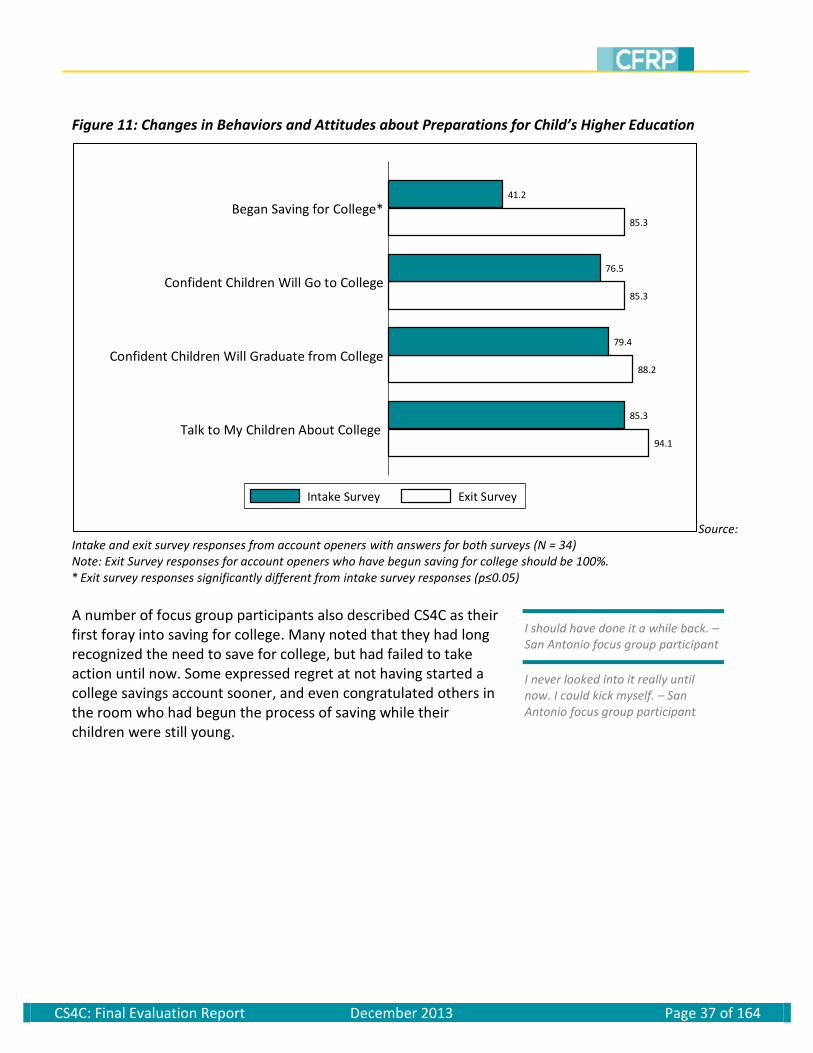
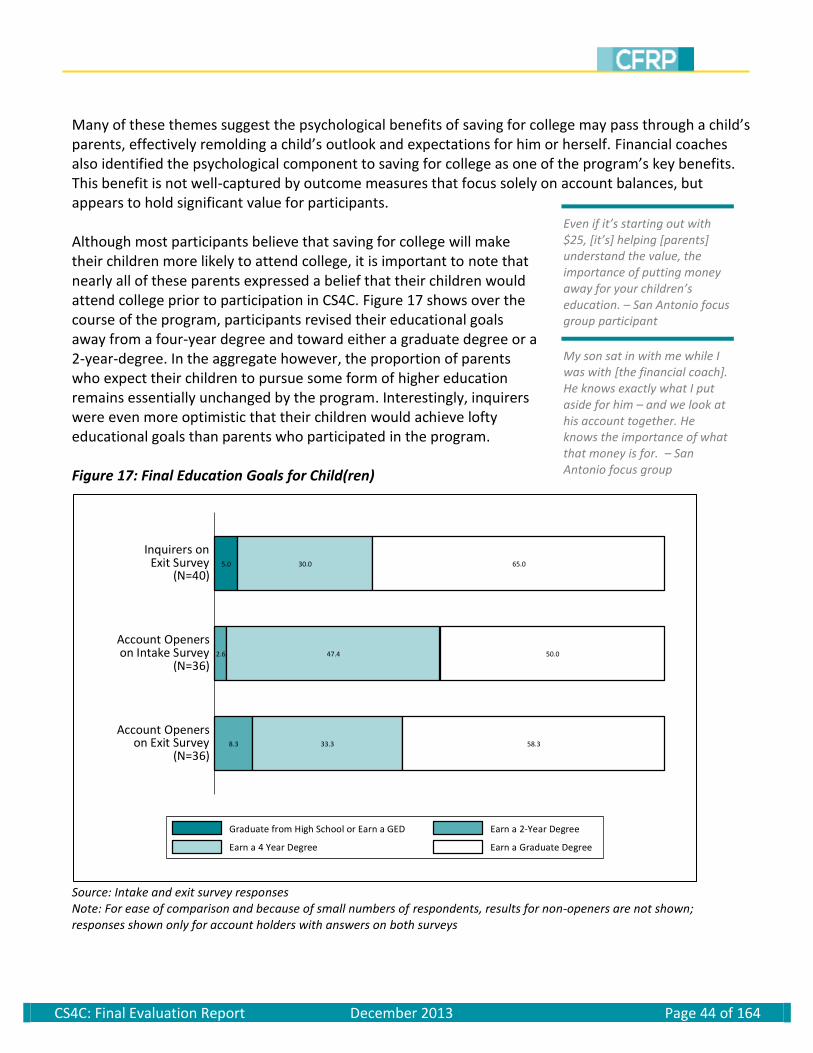
The importance of a college education has risen dramatically in recent decades. Individuals with a college degree have higher paying jobs, increased career flexibility, and are less likely to be unemployed; meanwhile, broad shifts in the U.S. economy continue to trim the number of jobs available to those without a college degree, further amplifying the significance of higher education. Though many parents recognize the importance of sending their children to college, financing a college education has also become increasingly difficult. Tuition costs continue to climb, raising the barrier to entry and saddling many low- and middle-income students with substantial student loan debt. This report presents evaluation outcomes from the Child Support for College (CS4C) pilot program, an innovative collaboration between public and private entities developed to promote college savings and attendance among those in the Texas child support system through incentivized college savings accounts. Throughout the 18-month pilot, CS4C encountered a number of successes and challenges. Though the program struggled to attract the interest of potential participants, over one-third of individuals who inquired about the program received at least one financial coaching session, and two-thirds of these individuals opened college savings accounts. Over the course of the pilot, significant changes were made to the incentive structure and participation requirements. These changes resulted in considerable increases in the number of account openings, as well as a reduced lag between inquiry and account opening. For many of those who opened accounts, CS4C also marked the beginning of college savings, a process which research indicates may carry important psychological benefits for account openers who now believe their child will go to college – a vital element to college success. Participants were motivated to participate in CS4C primarily by a desire for their children to pursue higher education and a commitment to helping their children achieve this goal; in addition, participants cited the importance of CS4C savings incentives as a catalyst in their decision to open an account. Participants were not significantly motivated, however, by the receipt of a lump sum child support payment as originally hypothesized. In fact, participants who failed to open accounts often cited inconsistent child support and insufficient money as substantial barriers to participation, and those who opened accounts tended to have higher income and education than those who did not. The CS4C program also revealed several programmatic lessons that will advance the field of asset building as a strategy for college savings. For example, through the pilot, program partners learned the limits to the guidance that financial coaches can provide clients, leading to a push for new policies around financial coaching. Moreover, CS4C revealed the importance of carefully aligning the program design with the core principles of asset building. Although the program aligned with the basic tenets of asset building in many respects, CS4C also inadvertently incorporated adverse incentive structures and a number of barriers to account opening. As these barriers were removed, more accounts were opened. Finally, this pilot highlights the need to ensure consistency between program goals and the existing goals of participating institutions to facilitate long-term sustainability.
CS4C: Final Evaluation Report December 2013 Page 3 of 164
Introduction
In recent decades, college has become increasingly important to earnings potential, upward mobility, and a host of positive life outcomes. At the same time, college has also become increasingly expensive, fueling a rapid escalation in student loan debt and borrower default rates. These developments have significantly raised the barrier to entry for many low- to middle-income students, prompting a national conversation around alternative methods of bringing a college education within reach of today’s low-income families. Alongside these trends, the U.S. Department of Health and Human Services (HHS) developed the ASSET Initiative to integrate financial education and asset-building strategies into the core functions of partner agencies and organizations—a measure aimed at strengthening the long-term financial stability of low-income families, including their ability to save for post-secondary education. This initiative gave rise to several demonstration waiver projects funded by the Office of Child Support Enforcement (OCSE); as part of one of these projects, the Child Support for College (CS4C) pilot program is an innovative collaboration between state-level partners, local nonprofits, private entities, and the Texas Office of the Attorney General, Child Support Division (OAG). The CS4C program applies the incentives of asset building to lump sum transfers within the child support population, a largely untapped intersection that helps marry the twin goals of boosting college savings and promoting educational advancement and self-sufficiency among a traditionally lower-income population. Because the program has little precedent, program partners contracted with the Child and Family Research Partnership (CFRP) at The University of Texas at Austin to evaluate the influence of the program on a range of outcomes related to college savings and financial literacy. This report presents research findings from the 18-month pilot of CS4C, and addresses four overarching questions in connection with the goals of the program: 1) Who participated in CS4C?, 2) What were the motivations and barriers to program participation?, 3) What are the benefits to participating in CS4C?, and 4) What lessons can be learned from the program design and implementation? In addition, CFRP addresses several related topics, including the development of CS4C’s program and incentive structures, how these structures appeared to impact account opening and savings outcomes, characteristics of participants at various program stages, whether the program is associated with increases in financial literacy, whether participants made progress toward meeting their financial goals, and lessons for program replication on a larger scale. PRIMARY FINDINGS
Overall, the CS4C program was successful in many respects. Of the 298 individuals who inquired about the program, one-third (99) received at least one financial coaching session, and nearly two-thirds of those receiving financial coaching (63) opened college savings accounts. Moreover, CS4C marked the beginning of college savings for most account openers. Although the dollar amount that many families deposited was relatively low, the mere act of opening an account generated psychological benefits for many account openers who now believe their child will go to college and have made a financial commitment, however small, toward realizing that goal. The psychological impact of saving for college is underlined by prior research, which suggests that the act
CS4C: Final Evaluation Report December 2013 Page 4 of 164
of setting aside designated college savings—even in very small amounts—yields a belief in the attainability of college and is linked to significantly higher rates of enrollment and graduation. The CS4C program also revealed several programmatic lessons learned that will advance the field of asset building as a strategy for college savings. For example, through the pilot, program partners learned the limits to the guidance that financial coaches can provide clients, and this knowledge has led to a push for new policies for financial coaches. Moreover, CS4C revealed the importance of carefully aligning the program design with the core principles of asset building. Although the program aligned with the basic tenets of asset building in many respects, CS4C also inadvertently incorporated adverse incentive structures and a number of barriers to account opening. As these barriers were removed, more accounts were opened. Finally, this pilot highlights the need to ensure consistency between program goals and the existing goals of participating institutions to facilitate long-term sustainability. OUTLINE
The remainder of this report is organized as follows. First, we highlight several relevant trends in the domain of higher education, including changes in tuition costs, savings behavior, student loan debt, and borrower default rates. The subsequent section explores the use of asset-building strategies as an additional option for promoting college savings among low-income savers, with particular emphasis on the proliferation of college savings incentives by state-level policymakers and organizations. In the following section, we discuss the theoretical motivations behind CS4C, including the impetus to capitalize on lump sum transfers within the child support population as a point of intervention for promoting college savings. We also outline the program’s basic elements, including program partners, program stages, how the program evolved over time, and the evaluation strategy employed by CFRP. The subsequent section presents findings of the evaluation, followed by a discussion of lessons learned and relevant considerations for the broader work of asset-building policy.
Background
COLLEGE IS IMPORTANT
College has become increasingly vital to individual earnings potential, social mobility, and a wide range of life outcomes. In 2002, individuals with a bachelor’s degree earned an average of 75 percent more than those with a high school diploma over the course of their lifetimes. By 2011, that premium had grown to 84 percent, or a full $1 million difference in lifetime earnings.1 Other studies suggest this growing gap in earnings is accompanied by a host of other benefits, including lower levels of unemployment, improved access to health insurance and pension benefits, higher job satisfaction, healthier lifestyles, and increased civic participation.2 Structural changes in the economy also highlight the growing importance of a college degree. In 2010, workers with at least some postsecondary education and training held 59 percent of U.S. jobs.3 By 2020, these workers will hold 65 percent of jobs, leaving an increasingly narrow share of employment for those with a high school diploma or less.4
CS4C: Final Evaluation Report December 2013 Page 5 of 164
DISPARITIES IN COLLEGE ENROLLMENT AND COMPLETION
Despite the growing importance of college, only 41 percent of all 18- to 24-year-olds were enrolled in postsecondary education in 2012.5 Moreover, these rates are not uniform across demographic groups; minority and low-income youth enroll in college at significantly lower rates than their white and high-income counterparts. The racial gap in college enrollment between white and black students, as well as between white and Hispanic students, has been well-documented throughout the literature.6 Despite the decades-long persistence of these racial disparities, recent trends suggest the racial gap in enrollment may be narrowing. Among 18- to 24-year-olds in 2012, 42.1 percent of white youth, 35.8 percent of black youth, and 37.5 percent of Hispanic youth were enrolled in college. This 5-6 point discrepancy is an improvement over previous years when the racial gap in college enrollment stood at 12-18 percentage points7; still, these numbers obscure two related trends that suggest racial disparities in higher education are yet to be solved. One such trend is the enduring discrepancy between the types of institutions where white and minority students enroll. Minority enrollment continues to be concentrated in the lower tiers of postsecondary education, at two-year community colleges and technical schools, rather than four-year institutions.8 Moreover, even where minority groups do attend four-year institutions, they are less likely to graduate. Among full-time students enrolled at four-year institutions, minority students lag behind whites in bachelor’s degree attainment by a margin of roughly 20 percentage points—a gap that has persisted for over two decades.9 Many of the racial inequities in college enrollment are mirrored in comparisons of enrollment by income level. Studies focused on enrollment rates at four-year institutions, for example, show the gap in college enrollment by income group is widening as low-income students forgo bachelors programs in favor of more affordable two-year colleges.10 Low-income high school graduates are also less likely to immediately enroll in college than their high-income counterparts, a gap that has exceeded 20 percentage points since at least 1972.11 Recent developments, however, show signs of improvement; the gap in immediate college enrollment rates between youth in the top and bottom income quintiles contracted from 41 percentage points in 1995 to 25 percentage points in 2008.12 Yet even where low-income students enroll, they continue to graduate at only half the rate of their high-income counterparts—a stubborn rift in college completion that continues to grow.13 Theories vary on the mechanisms underlying these persistent gaps; one early theory, that these gaps can be explained by differing levels of educational preparation, appears incomplete. Prior literature shows that accounting for students’ cognitive abilities and academic achievement in estimates of college enrollment rates lessens, but does not eliminate, the gap in college entry between top and bottom income quartiles.14 As a result, several researchers have identified the expense of college as one substantial barrier to minority and low-income students’ enrollment—an expense that has risen substantially in recent decades.15
CS4C: Final Evaluation Report December 2013 Page 6 of 164
COLLEGE IS EXPENSIVE
Since 1978, college tuition and fees have increased by 1,120 percent, more than four times the rate of the consumer price index.16 Perhaps not surprisingly, this surge in cost has disproportionately impacted low-income families; in the early 1970s, a family in the lowest income quintile would have to contribute 42 percent of their income to pay for the cost of a public four-year institution. By the 2000s, that family would need to contribute 60 percent of their income for the same degree. In contrast, the amount that a family in the highest income quintile would need to contribute increased by just 1 percentage point, from 5 to 6 percent.17 Though tuition costs in Texas are still relatively affordable by national standards, they too have been on the rise. For the 2012-2013 school year, the average published tuition and fees at Texas four-year public institutions was $8,354, fully 18 percent higher than five years before.18 The acceleration was similar at public two-year institutions, which climbed 17 percent to an average cost of $2,131 for the 2012-2013 school year.19 PARENTS WANT TO SAVE BUT MANY DO NOT
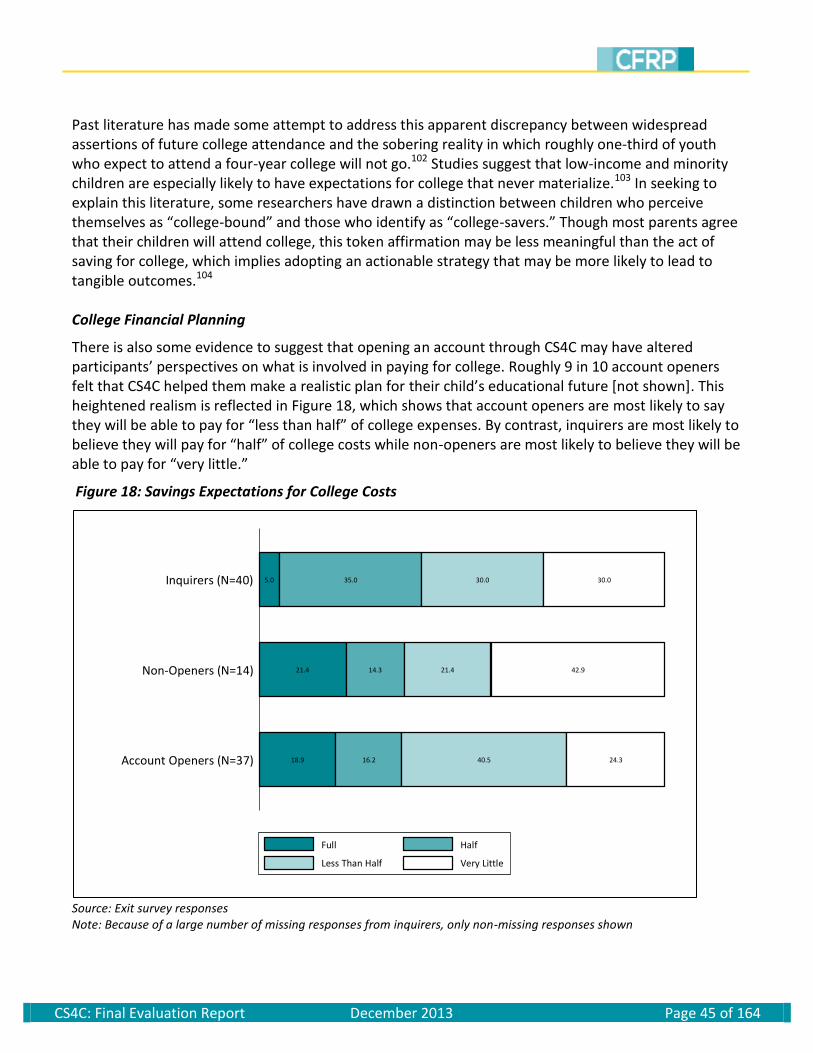
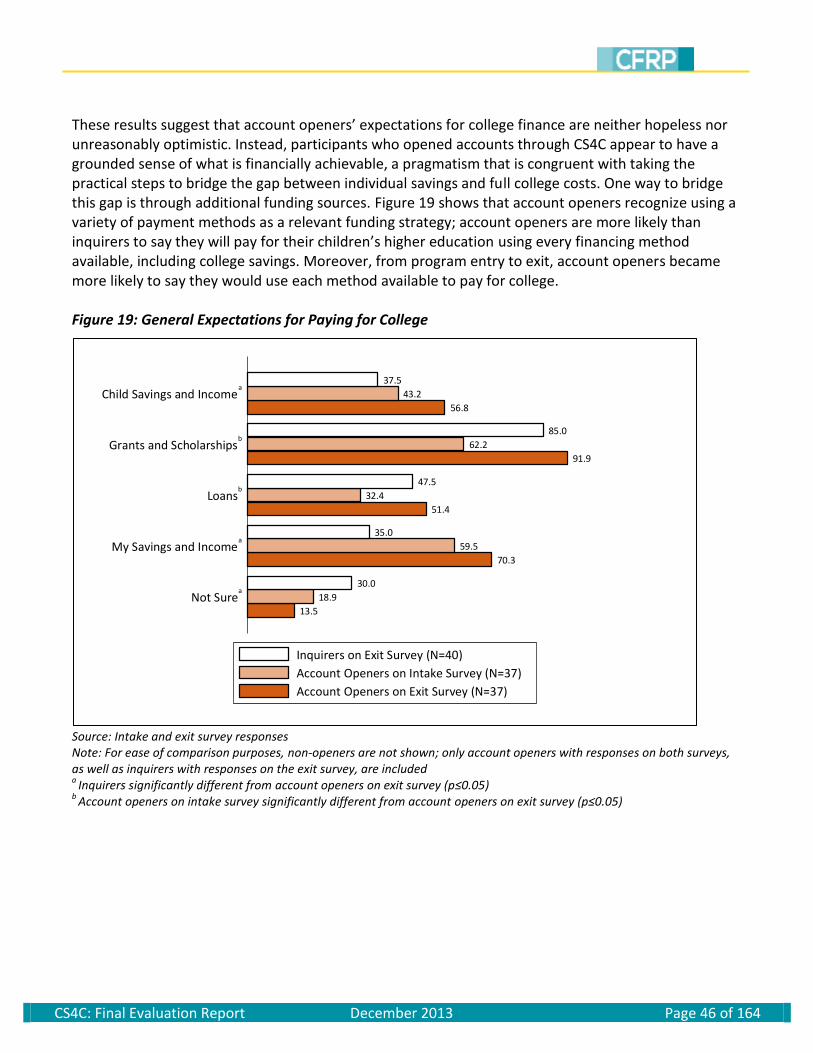
Despite the rising costs, most parents still believe in the importance of college. Overall, more than 8 in 10 parents agree that college is an investment in their child’s future, that college is part of the American dream, and that a college degree is more important now than it used to be.20 These attitudes are especially common among low-income parents. Households making less than $35,000 per year are consistently more likely than wealthier households to strongly agree on questions related to the importance of college.21 Low-income parents also cite saving for college as their number one savings priority,22 and are more likely than any other income group to say they would be willing to stretch themselves financially to obtain the best opportunity for their child’s future.23 In spite of these laudable goals, only 37 percent of low-income families have started saving for their child’s education.24 In 2012, these families saved 6 percent of their incomes, double the proportion saved by middle- and high-income families. Still, projections show this is not likely to be enough. On average, low-income parents expect to pay 22 percent of total college costs from their own savings and income (not including the student’s savings and income). This expectation is remarkably close to reality; low-income parents currently pay 21 percent of total college costs from their own savings and income.25 At a four-year public college this expected cost would translate to a total of $30,586, yet based on current savings habits, low-income parents are projected to save less than one-third of that amount ($9,432).26 These projected shortfalls are not unique to low-income parents. Despite rising tuition costs, the percentage of parents saving for their child’s college education slipped from 60 percent in 2010, to 50 percent in 2012.27 Only one-third of parents have a plan to pay for college, and when asked to describe their feelings on the subject, many parents report feeling overwhelmed, frustrated, scared, or that they do not like thinking about it at all.28 Among low-income parents not saving for college, 7 in 10 cite not having enough money as a major (55%) or minor (15%) reason. And half of these parents report an expectation that their child will qualify for enough in scholarships and financial aid to cover the costs.29
CS4C: Final Evaluation Report December 2013 Page 7 of 164
Unfortunately however, scholarship and aid receipt may not bridge this savings gap for many parents. Though roughly 6 in 10 students received some type of scholarship or grant in academic year 2011-12, those grants covered an average of just 29 percent of total college costs.30 Low-income students tend to receive higher grant awards than their wealthier peers; during the 2007-2008 school year nearly 9 out of 10 full-time dependent students with parental incomes under $40,000 received an average grant amount of $8,600 compared to $4,900 for the student population at large.31 Though hugely beneficial to grant recipients, these amounts are unlikely to cover college costs by themselves. In fact, according to some estimates, only 0.3 percent of students enrolled full time at four-year colleges receive enough money from grants (including federal, state, institutional, and private) to cover the full cost of attendance.32 TRENDS IN STUDENT LOAN DEBT AND BORROWER DEFAULT RATES
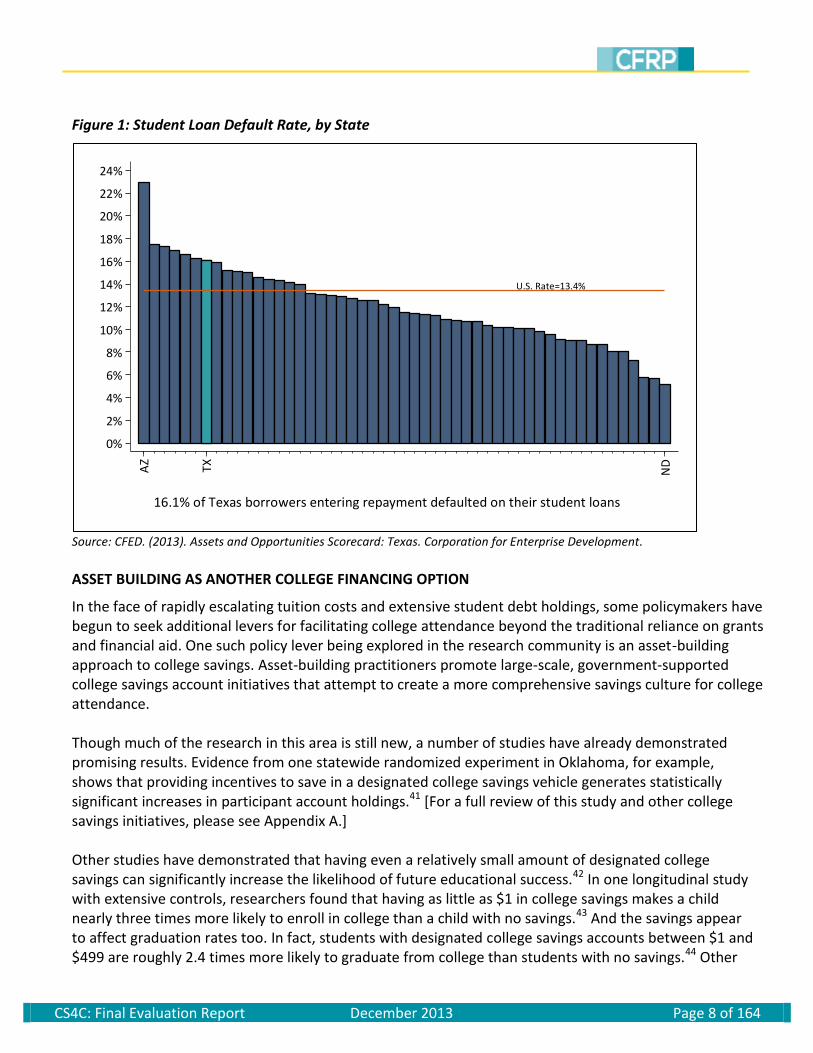
For students who have not amassed enough in savings and grants, loans increasingly make up the difference. Nationally, 67 percent of bachelor’s degree recipients used student loans to pay for their education.33 In 2005, the average U.S. student loan debt totaled $17,233. By 2012, that number had climbed to $27,253—an increase of 58 percent in just seven years.34 Naturally, the increase in debt has been paralleled by a rise in the delinquency rate on student loans, which rose almost 22 percent between 2007 and 2012.35 Today, nearly 1 in 7 borrowers defaults on his or her student loans.36 Trends in Texas have followed a similar pattern. Roughly 56 percent of Texas college graduates carry student loan debt, with the average liability totaling $22,140.37 To pay off this debt under the standard repayment plan, an individual would need to make monthly payments of $254.79 over 10 years for a total of $30,574.54 (including interest). a38 Graduates on a monthly repayment plan who fail to make a loan repayment for 270 days go into default.39 With a 16.1 percent borrower default rate, Texas ranks 45th in the U.S. on student loan defaults [Figure 1].40
a Calculation assumes borrower has an unsubsidized federal loan with an interest rate of 6.8%. For a subsidized loan with an
interest rate of 3.4%, monthly payments would be slightly lower at $217.90 over 10 years for a total of $26,147.72.
CS4C: Final Evaluation Report December 2013 Page 8 of 164
Figure 1: Student Loan Default Rate, by State
Source: CFED. (2013). Assets and Opportunities Scorecard: Texas. Corporation for Enterprise Development.
ASSET BUILDING AS ANOTHER COLLEGE FINANCING OPTION
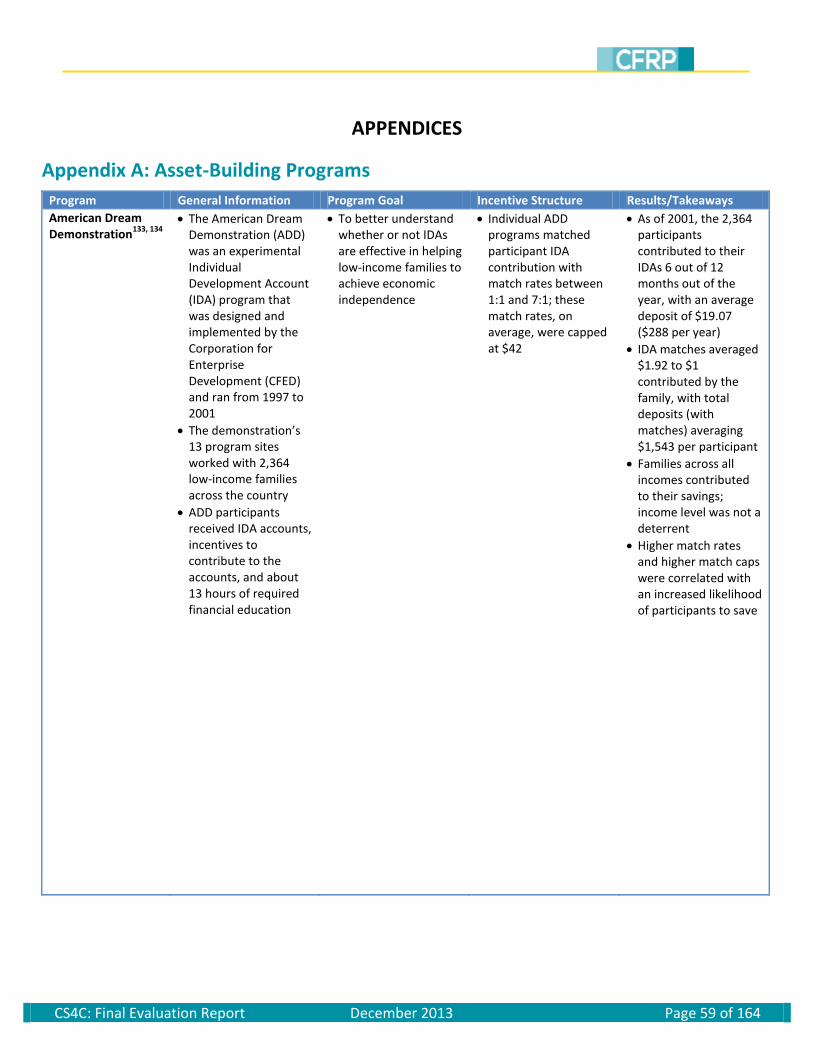
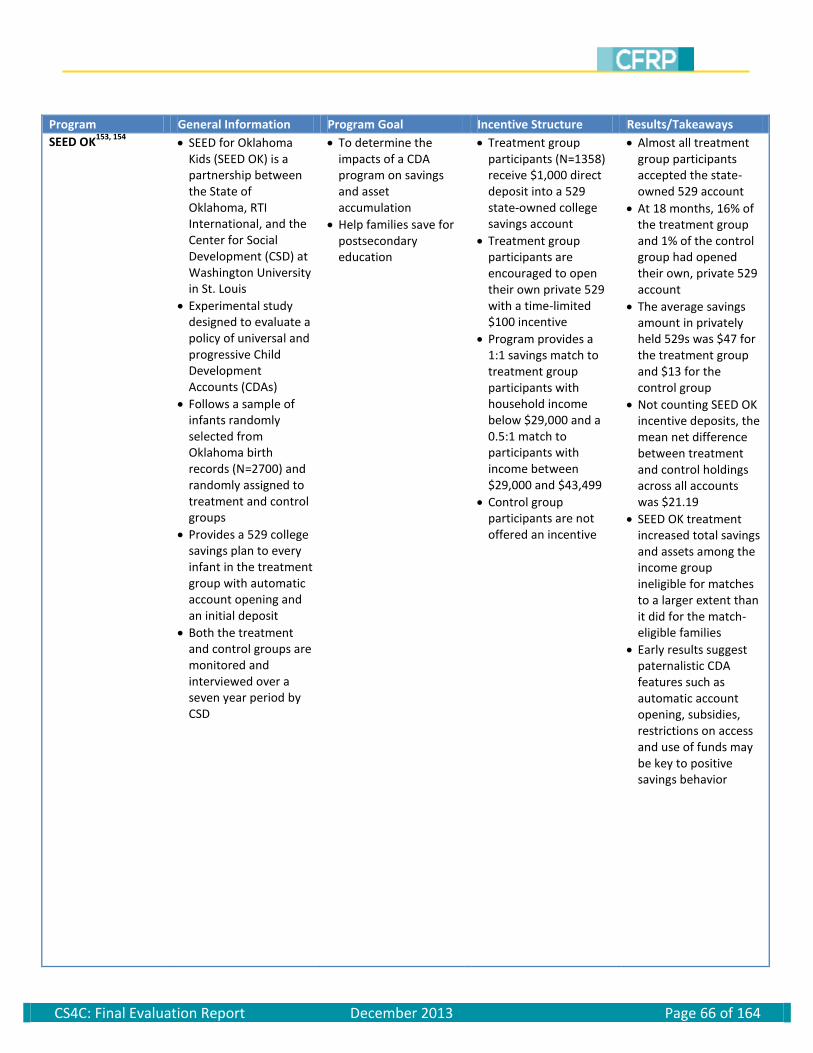
In the face of rapidly escalating tuition costs and extensive student debt holdings, some policymakers have begun to seek additional levers for facilitating college attendance beyond the traditional reliance on grants and financial aid. One such policy lever being explored in the research community is an asset-building approach to college savings. Asset-building practitioners promote large-scale, government-supported college savings account initiatives that attempt to create a more comprehensive savings culture for college attendance. Though much of the research in this area is still new, a number of studies have already demonstrated promising results. Evidence from one statewide randomized experiment in Oklahoma, for example, shows that providing incentives to save in a designated college savings vehicle generates statistically significant increases in participant account holdings.41 [For a full review of this study and other college savings initiatives, please see Appendix A.] Other studies have demonstrated that having even a relatively small amount of designated college savings can significantly increase the likelihood of future educational success.42 In one longitudinal study with extensive controls, researchers found that having as little as $1 in college savings makes a child nearly three times more likely to enroll in college than a child with no savings.43 And the savings appear to affect graduation rates too. In fact, students with designated college savings accounts between $1 and $499 are roughly 2.4 times more likely to graduate from college than students with no savings.44 Other
U.S. Rate=13.4%
0%
2%
4%
6%
8%
10%
12%
14%
16%
18%
20%
22%
24%
AZ
TX
ND
16.1% of Texas borrowers entering repayment defaulted on their student loans
CS4C: Final Evaluation Report December 2013 Page 9 of 164
studies have found that among young people who expect to graduate from a four-year college, those who have designated college savings account are approximately three times more likely to attend than those with no account when controlling for a range of demographic, socioeconomic, and academic characteristics.45 Much of the research in this area suggests the link between college savings and college attendance may be largely psychological—that the simple act of having a designated college savings account changes how students think about college. Researchers call this a shift in the student’s “college-bound identity.”46 By actualizing the intention for children to go to college, designated college savings accounts may yield not only superior educational outcomes, but also a more lasting range of collateral benefits traditionally associated with higher education. These early studies suggest that developing programs to encourage college savings may bring about a joint set of consequences. In the most immediate sense, college savings programs may act as a lever for increasing the dollar amount of individuals’ college savings, thereby providing a valuable addition to the mix of college financing options. What is more, such programs also appear to generate a psychological impact that seeds a belief in the attainability of a college degree. Importantly, this psychological impact seems to operate largely independently of the size of individual account holdings, implying that college savings accounts may carry inherent value in and of themselves. COLLEGE SAVINGS INCENTIVES
Motivated by this line of research, many states and organizations have begun to explore the use of college savings incentives as a means of boosting families’ financial capacity to send their children to college. In 2013, Texas was one of fifteen states offering financial incentives to save in a 529 college savings plan. Though some of these states offer tax credits based on a percentage of 529 contributions, the vast majority operate a matching grant or scholarship program.47 Matching programs tend to be structured such that families under a given income threshold are matched on contributions into 529 savings accounts at a specified rate, subject to an annual match limit (e.g. $500) and up to a lifetime maximum (e.g. $2,500), or for a maximum number of years (e.g. 5 years). Examples of states with variations on this design are Arkansas, Colorado, Kansas, Missouri, Nevada, North Dakota, Rhode Island, Utah, and West Virginia. A number of states also include a variable match rate tied to household income level. Arkansas and Rhode Island, for example, match 2:1 for low-income savers and 1:1 for middle-income savers.48 In Texas, matching grants are administered by the Texas Match the Promise Foundation, a 501(c)(3) public charity established by the Texas Comptroller to direct the Texas Save and Match program.49 In 2007, the Texas Legislature created the Save and Match program under HB 3900 with the aim of incentivizing college saving through matched purchases of prepaid college tuition units. The program was officially launched in September 2012, and now provides matching scholarships to participants in the Texas Tuition Promise Fund (TTPF) who meet certain eligibility requirements and have been selected through a competitive application process. To be eligible, students must be in grades 5 through 9, have family incomes below $100,000, have a Promise Fund account, and meet a $100 contribution requirement.50 Each year, matching scholarships are provided to the top 150 applicants based on a scoring of career essays, grade averages, income levels, and the number of dependents claimed by the
CS4C: Final Evaluation Report December 2013 Page 10 of 164
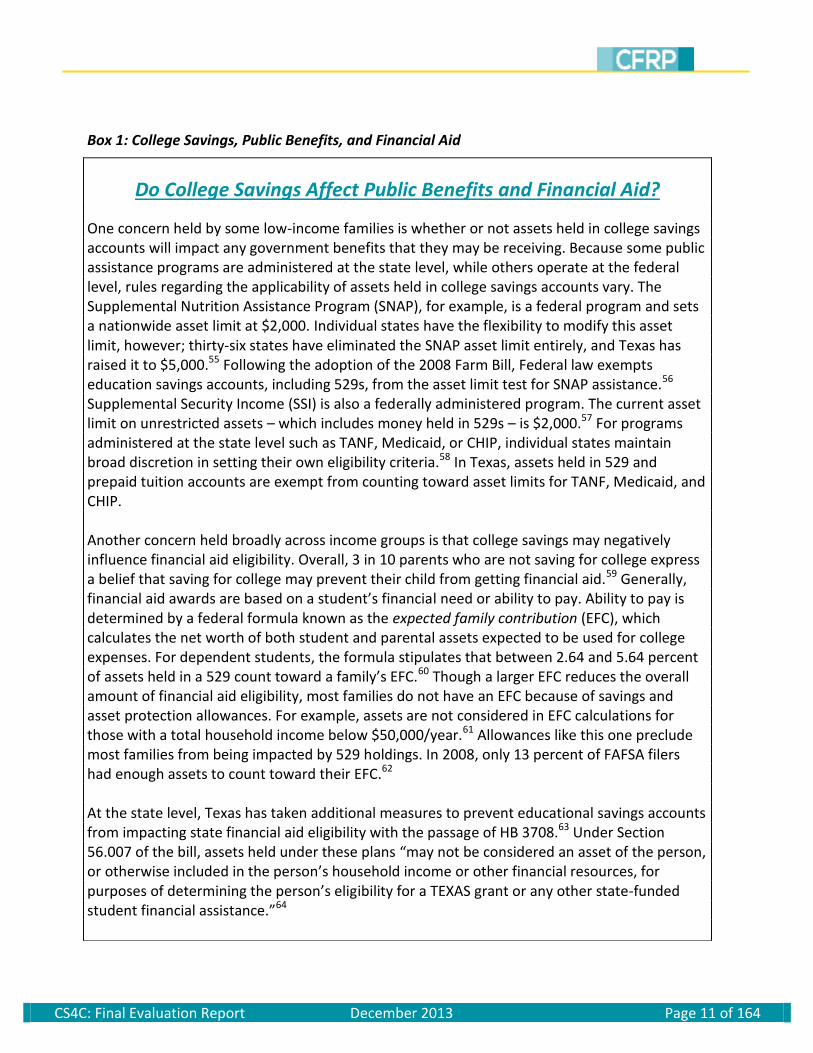
student’s parents. Funded primarily by individual contributions, these scholarships match up to $500 of participant tuition unit purchases with the same number and type of tuition unit. In addition, the top five applicants each year are awarded a one-time scholarship worth $2,000 of current tuition units.51 Because the Save and Match program is very new, participant data, savings rates, and other evaluation outcomes are not yet available. Prior to the launch of the Save and Match program, enrollment in TTPF accounts had been steadily declining for four years.52 Though more than 30,000 prepaid tuition plans were opened between 2008 and March of 2012, only 6 percent of these enrollees came from households with below median incomes ($50,000). Families with household incomes over $100,000 were four times more likely to enroll in a prepaid fund than families earning less than this amount. Moreover, recent declines in enrollment have been most pronounced among families with household incomes below $75,000, as well as African American and Hispanic families.53 Beyond creating the Save and Match program, the Texas legislature has taken one other important step toward reversing the trend of declining college enrollment, especially among disadvantaged groups. In 2011, Texas passed HB 3708 exempting college savings accounts from asset limit tests in determining eligibility for public assistance or state financial aid.54 For additional information on how college savings accounts impact public benefits and financial aid in Texas, see Box 1.
CS4C: Final Evaluation Report December 2013 Page 11 of 164
Box 1: College Savings, Public Benefits, and Financial Aid
Do College Savings Affect Public Benefits and Financial Aid?
One concern held by some low-income families is whether or not assets held in college savings accounts will impact any government benefits that they may be receiving. Because some public assistance programs are administered at the state level, while others operate at the federal level, rules regarding the applicability of assets held in college savings accounts vary. The Supplemental Nutrition Assistance Program (SNAP), for example, is a federal program and sets a nationwide asset limit at $2,000. Individual states have the flexibility to modify this asset limit, however; thirty-six states have eliminated the SNAP asset limit entirely, and Texas has raised it to $5,000.55 Following the adoption of the 2008 Farm Bill, Federal law exempts education savings accounts, including 529s, from the asset limit test for SNAP assistance.56 Supplemental Security Income (SSI) is also a federally administered program. The current asset limit on unrestricted assets – which includes money held in 529s – is $2,000.57 For programs administered at the state level such as TANF, Medicaid, or CHIP, individual states maintain broad discretion in setting their own eligibility criteria.58 In Texas, assets held in 529 and prepaid tuition accounts are exempt from counting toward asset limits for TANF, Medicaid, and CHIP. Another concern held broadly across income groups is that college savings may negatively influence financial aid eligibility. Overall, 3 in 10 parents who are not saving for college express a belief that saving for college may prevent their child from getting financial aid.59 Generally, financial aid awards are based on a student’s financial need or ability to pay. Ability to pay is determined by a federal formula known as the expected family contribution (EFC), which calculates the net worth of both student and parental assets expected to be used for college expenses. For dependent students, the formula stipulates that between 2.64 and 5.64 percent of assets held in a 529 count toward a family’s EFC.60 Though a larger EFC reduces the overall amount of financial aid eligibility, most families do not have an EFC because of savings and asset protection allowances. For example, assets are not considered in EFC calculations for those with a total household income below $50,000/year.61 Allowances like this one preclude most families from being impacted by 529 holdings. In 2008, only 13 percent of FAFSA filers had enough assets to count toward their EFC.62 At the state level, Texas has taken additional measures to prevent educational savings accounts from impacting state financial aid eligibility with the passage of HB 3708.63 Under Section 56.007 of the bill, assets held under these plans “may not be considered an asset of the person, or otherwise included in the person’s household income or other financial resources, for purposes of determining the person’s eligibility for a TEXAS grant or any other state-funded student financial assistance.”64
CS4C: Final Evaluation Report December 2013 Page 12 of 164
CHALLENGES TO COLLEGE SAVINGS INCENTIVES
Despite growing interest in asset-building policy and a handful of promising studies, the field of asset building has occasionally struggled to generate the desired outcomes in practice. There is inconclusive evidence, for example, that asset-building programs actually increase savings among target populations.65 Though some matched savings programs have demonstrated substantive increases in enrollment and contributions among low-income individuals, others have yielded mostly insignificant effects on assets, net worth, or poverty rates.66 Many other asset-building programs have been ill-suited to evaluation, lacking the resources or capacity to conduct large-scale experiments with control groups and longitudinal data collection.67 In cases where rigorous evaluation has been possible, the impact of asset-building programs aimed at incentivizing college savings have also been somewhat underwhelming—especially among those with the lowest incomes. SEED OK, the matched college savings program in Oklahoma with perhaps the most rigorous evaluation to date, has shown substantial success with automatic enrollment, but only limited success in increasing private account openings or generating meaningful differences in deposit amounts.68 A partial explanation for the limited success of some matched college savings programs may lie in the imperfect marriage between asset building and 529 college savings accounts. Indeed, the potential success of asset-building strategies paired with 529 college savings accounts may be attenuated by the 529 vehicle itself, which is not widely used by families saving for college—especially low-income families who tend to save through general savings accounts or CDs.69 A recent report from the GAO reveals that in 2010, less than 3 percent of U.S. families were saving in a 529 plan.70 Even among those with major educational expenses on the horizon, only 7 percent reported saving in a 529 plan.71 Moreover, families who do use 529s are disproportionately high-income; data from the GAO reveal that families using 529 plans have approximately 25 times the median financial assets of those not using 529 plans.72 One reason for this imbalance is the plan’s features; studies show the tax benefits of 529s accrue predominantly to high-income earners, and give disproportionate advantage to those in the top income brackets when considered alongside potential reductions in financial aid eligibility.73 Furthermore, even where asset-building strategies succeed in increasing the asset holdings of low-income families, there may also be drawbacks. Though asset accumulation has been linked to a number of positive outcomes in social and economic wellbeing, scholars of asset building caution that especially under weak economic conditions, asset holding by low-income individuals may be detrimental given the potential for risky investments, low or negative appreciation of assets, constrained mobility, neglect of current needs, a lack of savings to weather crises, and higher levels of stress associated with maintaining assets.74
CS4C: Final Evaluation Report December 2013 Page 13 of 164
BEST PRINCIPLES OF ASSET BUILDING
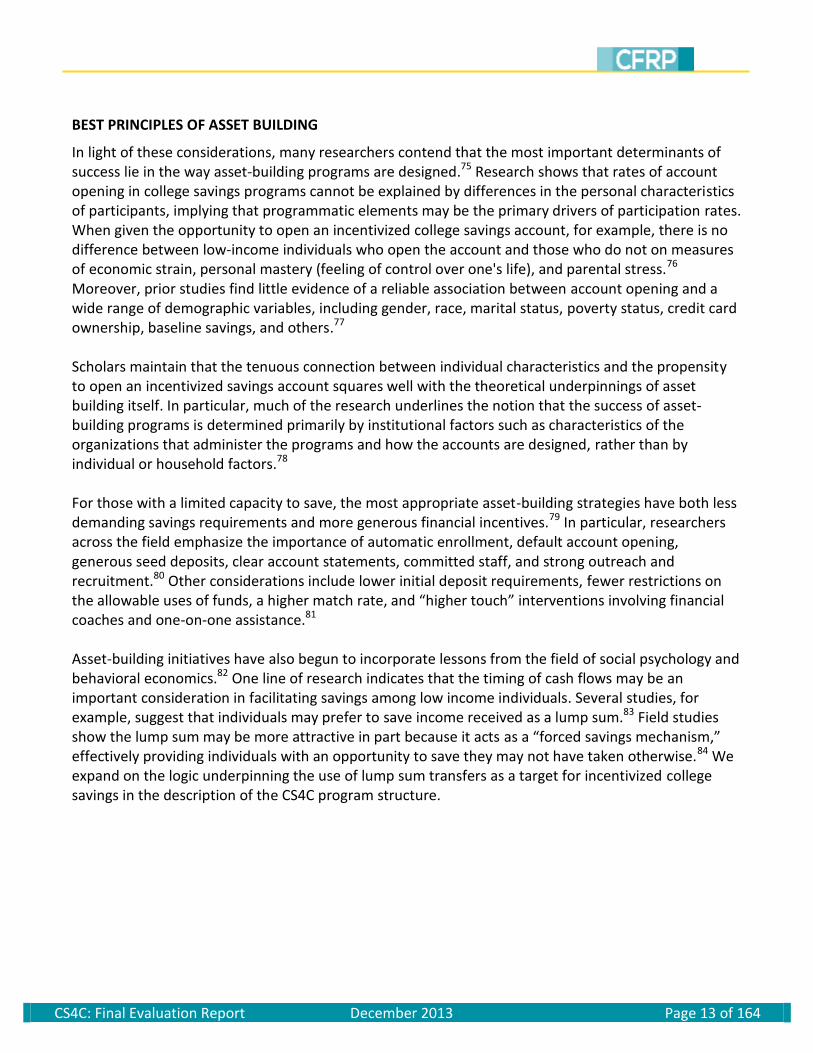
In light of these considerations, many researchers contend that the most important determinants of success lie in the way asset-building programs are designed.75 Research shows that rates of account opening in college savings programs cannot be explained by differences in the personal characteristics of participants, implying that programmatic elements may be the primary drivers of participation rates. When given the opportunity to open an incentivized college savings account, for example, there is no difference between low-income individuals who open the account and those who do not on measures of economic strain, personal mastery (feeling of control over one's life), and parental stress.76 Moreover, prior studies find little evidence of a reliable association between account opening and a wide range of demographic variables, including gender, race, marital status, poverty status, credit card ownership, baseline savings, and others.77 Scholars maintain that the tenuous connection between individual characteristics and the propensity to open an incentivized savings account squares well with the theoretical underpinnings of asset building itself. In particular, much of the research underlines the notion that the success of asset-building programs is determined primarily by institutional factors such as characteristics of the organizations that administer the programs and how the accounts are designed, rather than by individual or household factors.78 For those with a limited capacity to save, the most appropriate asset-building strategies have both less demanding savings requirements and more generous financial incentives.79 In particular, researchers across the field emphasize the importance of automatic enrollment, default account opening, generous seed deposits, clear account statements, committed staff, and strong outreach and recruitment.80 Other considerations include lower initial deposit requirements, fewer restrictions on the allowable uses of funds, a higher match rate, and “higher touch” interventions involving financial coaches and one-on-one assistance.81 Asset-building initiatives have also begun to incorporate lessons from the field of social psychology and behavioral economics.82 One line of research indicates that the timing of cash flows may be an important consideration in facilitating savings among low income individuals. Several studies, for example, suggest that individuals may prefer to save income received as a lump sum.83 Field studies show the lump sum may be more attractive in part because it acts as a “forced savings mechanism,” effectively providing individuals with an opportunity to save they may not have taken otherwise.84 We expand on the logic underpinning the use of lump sum transfers as a target for incentivized college savings in the description of the CS4C program structure.
CS4C: Final Evaluation Report December 2013 Page 14 of 164
College Savings Incentives and the Child Support System
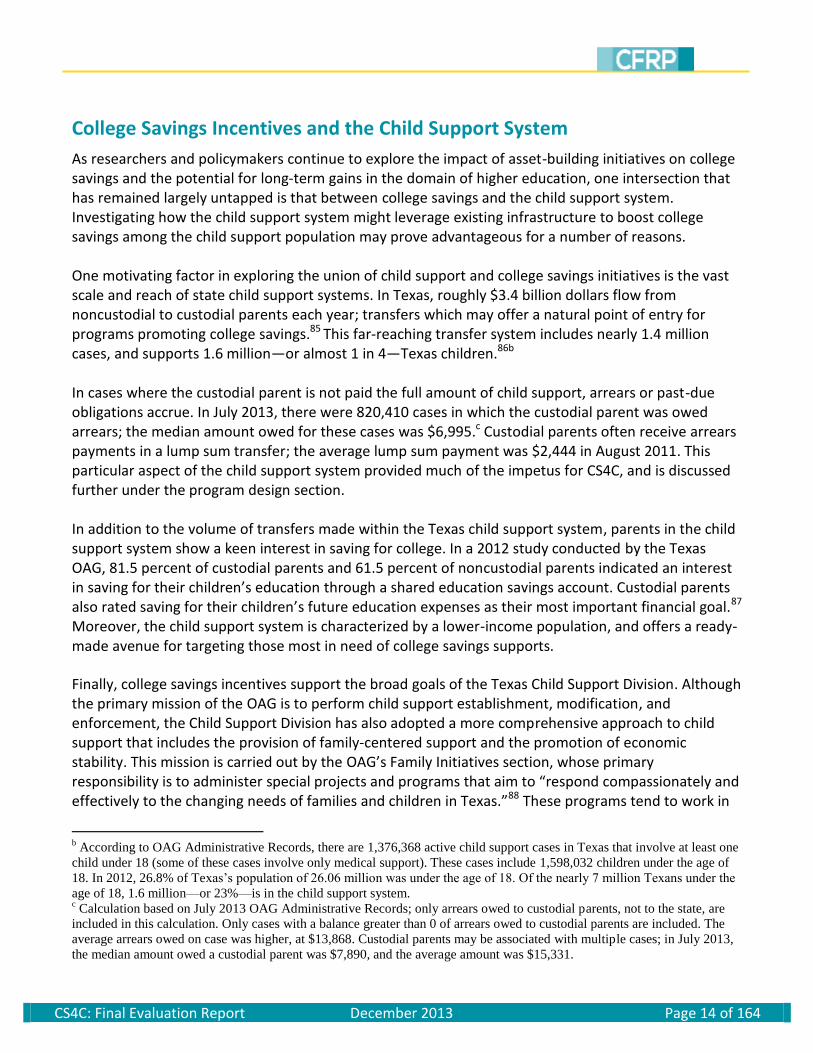
As researchers and policymakers continue to explore the impact of asset-building initiatives on college savings and the potential for long-term gains in the domain of higher education, one intersection that has remained largely untapped is that between college savings and the child support system. Investigating how the child support system might leverage existing infrastructure to boost college savings among the child support population may prove advantageous for a number of reasons. One motivating factor in exploring the union of child support and college savings initiatives is the vast scale and reach of state child support systems. In Texas, roughly $3.4 billion dollars flow from noncustodial to custodial parents each year; transfers which may offer a natural point of entry for programs promoting college savings.85 This far-reaching transfer system includes nearly 1.4 million cases, and supports 1.6 million—or almost 1 in 4—Texas children.86b In cases where the custodial parent is not paid the full amount of child support, arrears or past-due obligations accrue. In July 2013, there were 820,410 cases in which the custodial parent was owed arrears; the median amount owed for these cases was $6,995.c Custodial parents often receive arrears payments in a lump sum transfer; the average lump sum payment was $2,444 in August 2011. This particular aspect of the child support system provided much of the impetus for CS4C, and is discussed further under the program design section. In addition to the volume of transfers made within the Texas child support system, parents in the child support system show a keen interest in saving for college. In a 2012 study conducted by the Texas OAG, 81.5 percent of custodial parents and 61.5 percent of noncustodial parents indicated an interest in saving for their children’s education through a shared education savings account. Custodial parents also rated saving for their children’s future education expenses as their most important financial goal.87 Moreover, the child support system is characterized by a lower-income population, and offers a ready-made avenue for targeting those most in need of college savings supports.
Finally, college savings incentives support the broad goals of the Texas Child Support Division. Although the primary mission of the OAG is to perform child support establishment, modification, and enforcement, the Child Support Division has also adopted a more comprehensive approach to child support that includes the provision of family-centered support and the promotion of economic stability. This mission is carried out by the OAG’s Family Initiatives section, whose primary responsibility is to administer special projects and programs that aim to “respond compassionately and effectively to the changing needs of families and children in Texas.”88 These programs tend to work in
b According to OAG Administrative Records, there are 1,376,368 active child support cases in Texas that involve at least one
child under 18 (some of these cases involve only medical support). These cases include 1,598,032 children under the age of
18. In 2012, 26.8% of Texas’s population of 26.06 million was under the age of 18. Of the nearly 7 million Texans under the
age of 18, 1.6 million—or 23%—is in the child support system. c Calculation based on July 2013 OAG Administrative Records; only arrears owed to custodial parents, not to the state, are
included in this calculation. Only cases with a balance greater than 0 of arrears owed to custodial parents are included. The
average arrears owed on case was higher, at $13,868. Custodial parents may be associated with multiple cases; in July 2013,
the median amount owed a custodial parent was $7,890, and the average amount was $15,331.
CS4C: Final Evaluation Report December 2013 Page 15 of 164
collaboration with community and faith-based organizations, courts, schools, and other public agencies to promote and encourage stable family formation. The Family Initiatives section also acts as the administrator of the Building Assets for Fathers and Families (BAFF) grant, a federally-funded initiative aimed at strengthening families’ long-term financial stability through asset-building services.89 Helping to set families on a trajectory towards college completion aligns well with the goals of the BAFF initiative, as well as the broader work of the OAG’s Family Initiatives section. Despite the potential for collaboration between the child support system and asset-building initiatives, the two areas have little history of partnership. Child Support for College represents one of the first programs to marry these ideas with the purpose of cultivating college savings among the child support population. Because the program has little precedent, CS4C has met with both successes and challenges in each phase of its execution. This report details some of the program’s core achievements and shortcomings. We conclude with a synthesis of lessons learned and offer considerations for the broader work of asset-building research.
CS4C Program Design
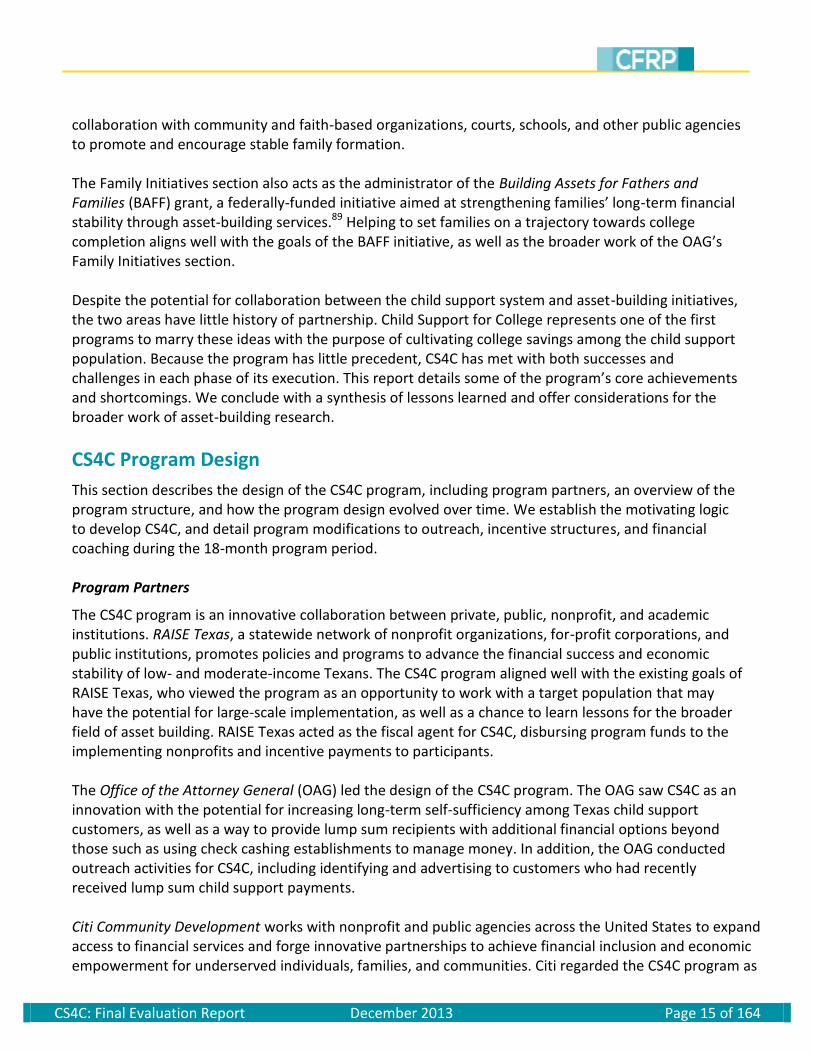
This section describes the design of the CS4C program, including program partners, an overview of the program structure, and how the program design evolved over time. We establish the motivating logic to develop CS4C, and detail program modifications to outreach, incentive structures, and financial coaching during the 18-month program period. Program Partners
The CS4C program is an innovative collaboration between private, public, nonprofit, and academic institutions. RAISE Texas, a statewide network of nonprofit organizations, for-profit corporations, and public institutions, promotes policies and programs to advance the financial success and economic stability of low- and moderate-income Texans. The CS4C program aligned well with the existing goals of RAISE Texas, who viewed the program as an opportunity to work with a target population that may have the potential for large-scale implementation, as well as a chance to learn lessons for the broader field of asset building. RAISE Texas acted as the fiscal agent for CS4C, disbursing program funds to the implementing nonprofits and incentive payments to participants. The Office of the Attorney General (OAG) led the design of the CS4C program. The OAG saw CS4C as an innovation with the potential for increasing long-term self-sufficiency among Texas child support customers, as well as a way to provide lump sum recipients with additional financial options beyond those such as using check cashing establishments to manage money. In addition, the OAG conducted outreach activities for CS4C, including identifying and advertising to customers who had recently received lump sum child support payments. Citi Community Development works with nonprofit and public agencies across the United States to expand access to financial services and forge innovative partnerships to achieve financial inclusion and economic empowerment for underserved individuals, families, and communities. Citi regarded the CS4C program as
CS4C: Final Evaluation Report December 2013 Page 16 of 164
an opportunity to foster an original idea that could yield large-scale benefits for Texas families. As one of the more innovative pilots in the field of asset building, CS4C also aligned with Citi’s investment in promoting children’s savings accounts and college success among the economically disadvantaged. Citi played an integral role in the early conceptualization of CS4C, and provided funding for the program in hopes that, if successful, it might be taken to scale. Three local nonprofits implemented the pilot program. The Brazos Valley Affordable Housing Corporation provides first time homebuyer seminars, credit counseling, and other housing assistance to families in the Brazos Valley, including Bryan-College Station, TX and surrounding counties. Brazos Valley provided an opportunity to pilot the program in a rural location, an important consideration for program partners who sought to take the program to scale in the future. United Way of San Antonio and Bexar County focuses on improving early care and education for children and provides a free tax preparation program for low- to moderate-income families. In Austin, TX Foundation Communities provides support services to low-income families, including affordable housing, adult education, financial coaching, and tax services. Foundation Communities also administers a number of programs intended to improve college access, making CS4C particularly well-aligned with the existing mission and goals of the organization. Program Structure
The CS4C program provided matched contributions and financial coaching services to encourage college savings among eligible parents in the child support system. Many of the program’s core elements were modeled on the basic principles of asset building, including the provision of a savings match, which has been linked to increased participation rates—especially among low-income individuals;90 financial coaching services, which research shows are a valuable tool in helping people to save;91 a focus on leveraging lump sum income, which has been linked to increased odds of saving;92 and the use of statewide college savings vehicles, a common feature of other college savings programs due to their institutional structure and restrictions on access and use of funds.93 In an effort to generate college savings among a broad-based, low-income population, CS4C leveraged a unique element of the child support system as its core innovation. Instead of tapping into savers’ existing income streams, the CS4C program attempted to capitalize on an existing structural component of the child support system—lump sum payments—to promote the accumulation of assets among child support customers. Lump sum payments occur when a noncustodial parent makes a large arrears, or “catch-up,” payment to the child support system which is passed through to the custodial parent. Program partners hypothesized that the sudden windfall provided by a lump sum payment would present an opportunity to encourage college savings among child support customers—a notion supported by prior literature suggesting that the marginal propensity to save from a lump sum payment is greater than that of regular income.94 This concept stems from research showing that individuals have separate mental accounts, and are more likely to build assets from money they view as “wealth” than current income;95 since an unexpected influx of cash is likely to be viewed as “irregular” income, it is less likely to be pre-assigned to future expenditures and more likely to be earmarked for savings.96 Other research shows that when low-income individuals receive a sudden windfall of cash, they benefit from a brief mental reprieve or “reset” moment during which their attention may shift from the routine
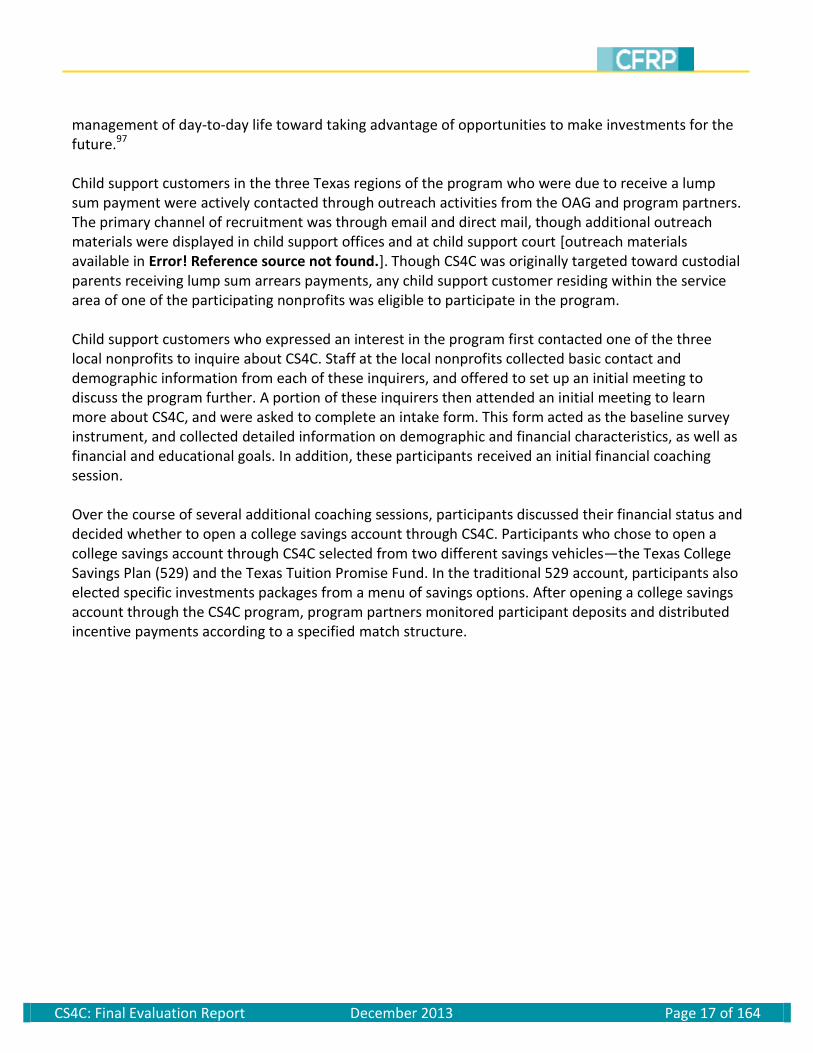
CS4C: Final Evaluation Report December 2013 Page 17 of 164
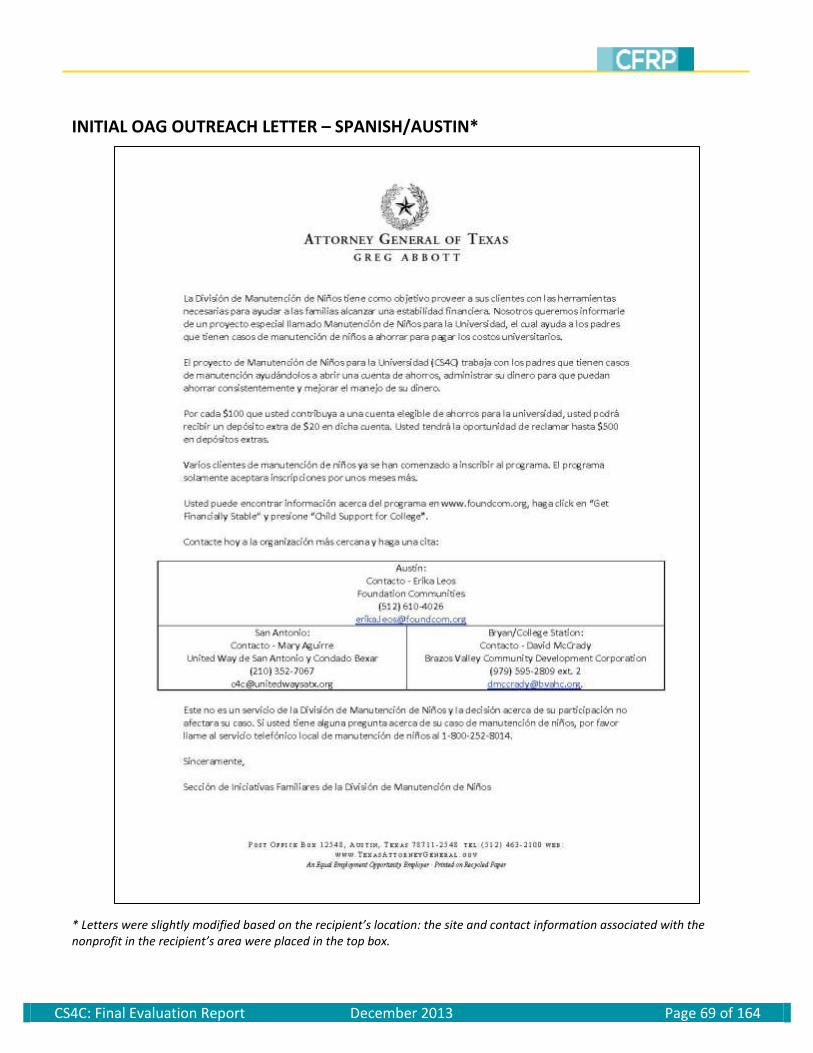
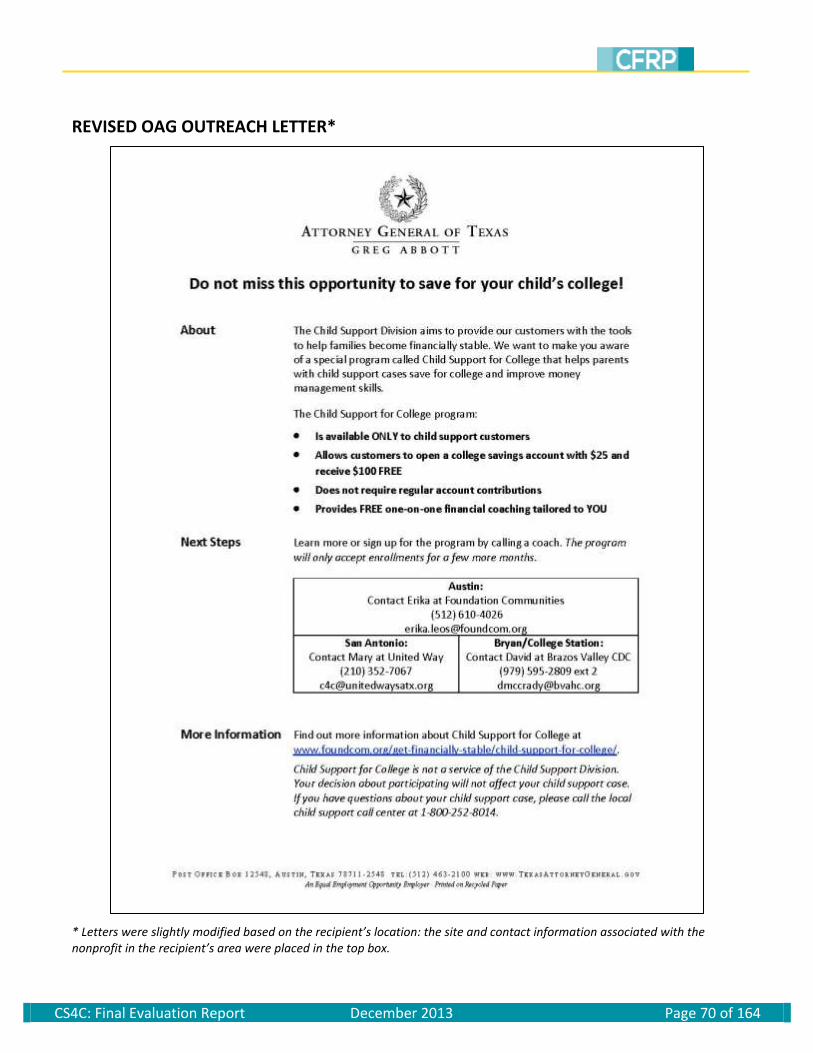
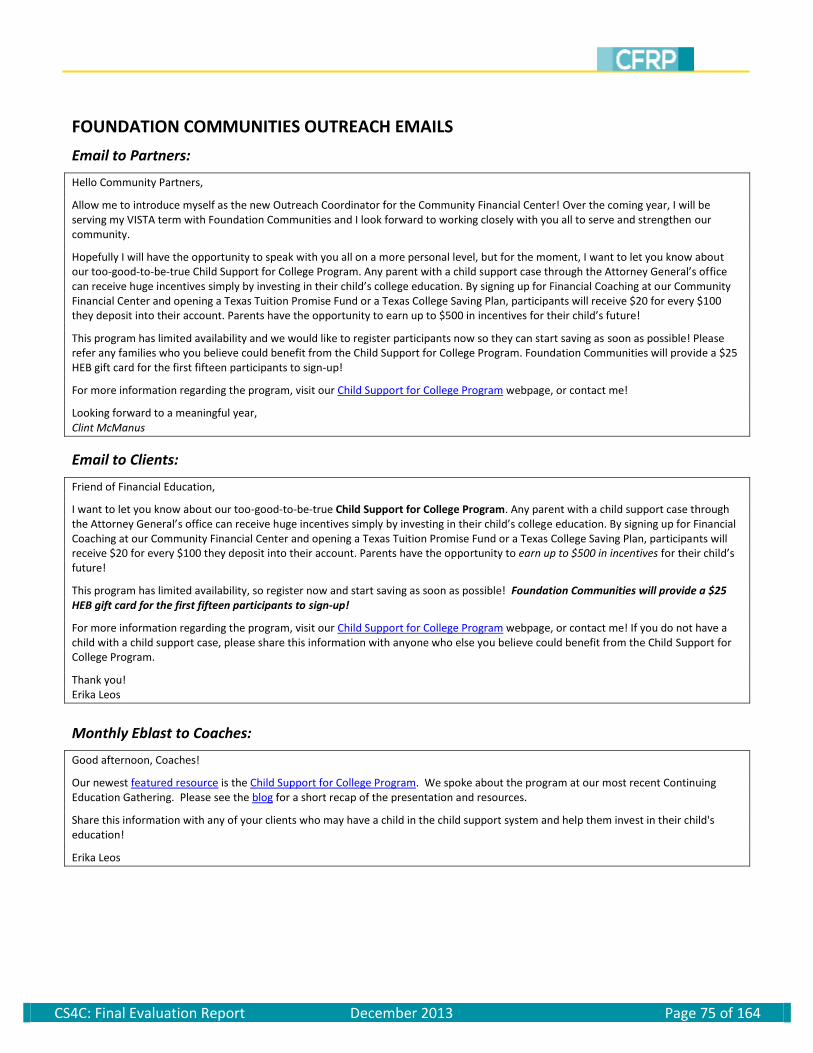
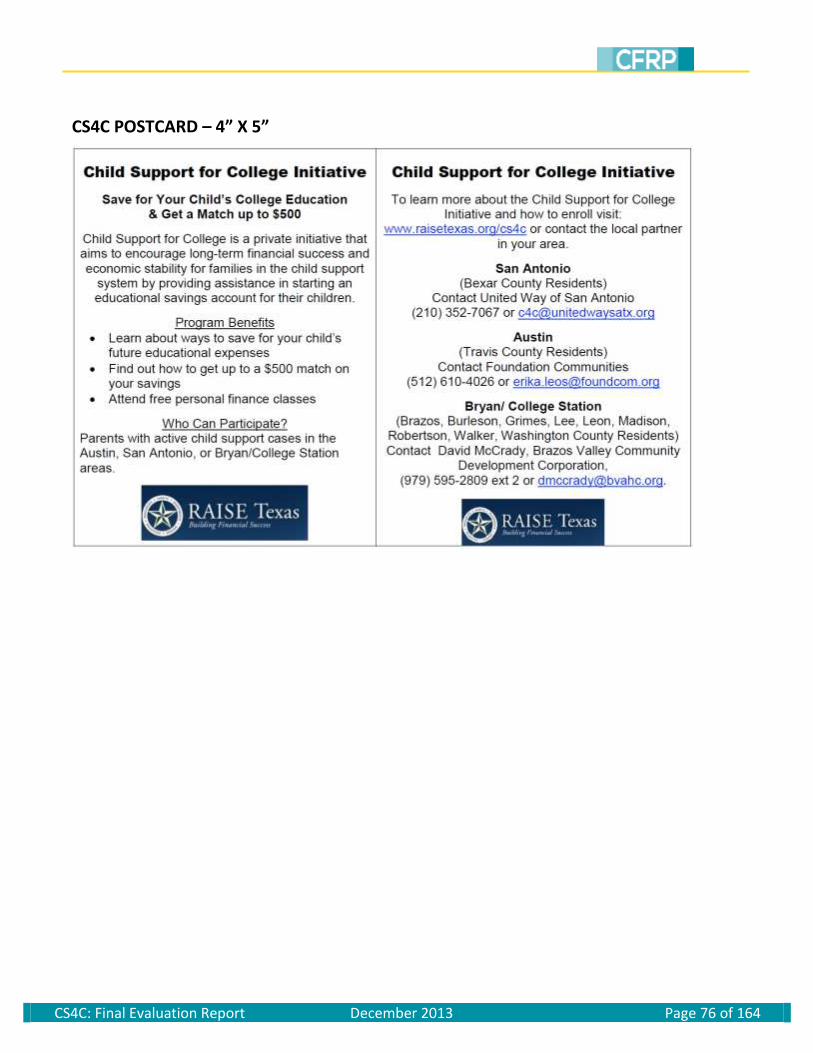
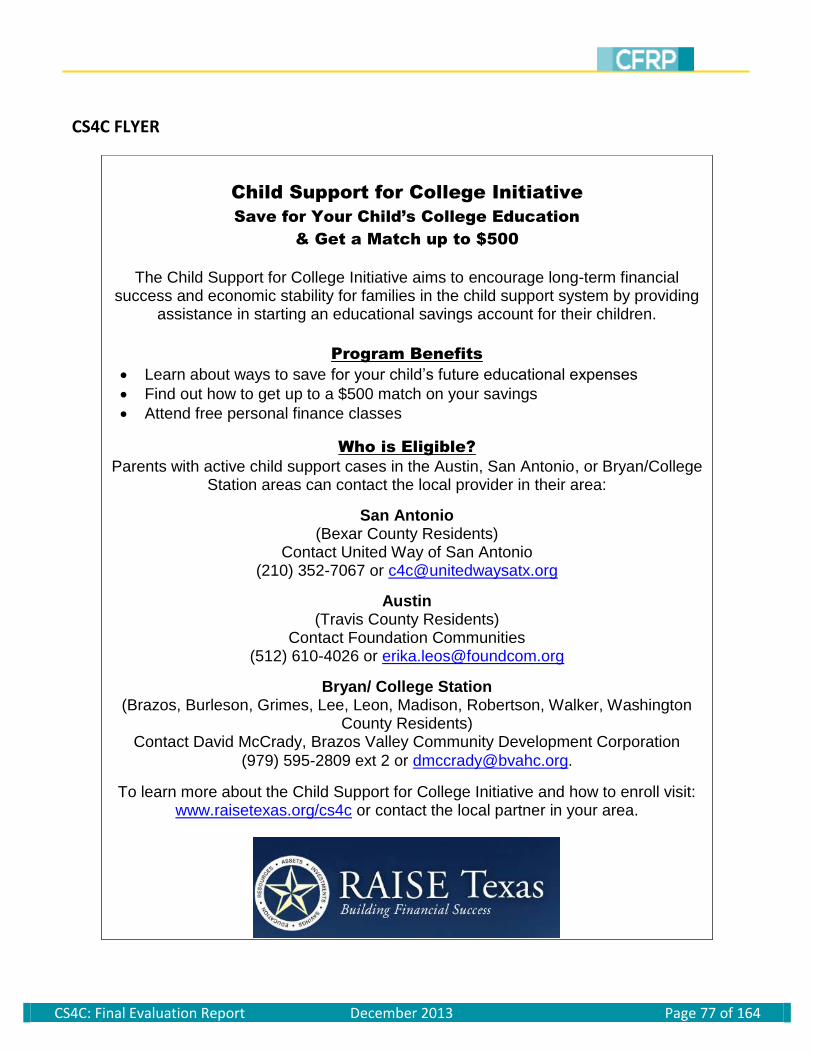
management of day-to-day life toward taking advantage of opportunities to make investments for the future.97 Child support customers in the three Texas regions of the program who were due to receive a lump sum payment were actively contacted through outreach activities from the OAG and program partners. The primary channel of recruitment was through email and direct mail, though additional outreach materials were displayed in child support offices and at child support court [outreach materials available in Error! Reference source not found.]. Though CS4C was originally targeted toward custodial parents receiving lump sum arrears payments, any child support customer residing within the service area of one of the participating nonprofits was eligible to participate in the program. Child support customers who expressed an interest in the program first contacted one of the three local nonprofits to inquire about CS4C. Staff at the local nonprofits collected basic contact and demographic information from each of these inquirers, and offered to set up an initial meeting to discuss the program further. A portion of these inquirers then attended an initial meeting to learn more about CS4C, and were asked to complete an intake form. This form acted as the baseline survey instrument, and collected detailed information on demographic and financial characteristics, as well as financial and educational goals. In addition, these participants received an initial financial coaching session. Over the course of several additional coaching sessions, participants discussed their financial status and decided whether to open a college savings account through CS4C. Participants who chose to open a college savings account through CS4C selected from two different savings vehicles—the Texas College Savings Plan (529) and the Texas Tuition Promise Fund. In the traditional 529 account, participants also elected specific investments packages from a menu of savings options. After opening a college savings account through the CS4C program, program partners monitored participant deposits and distributed incentive payments according to a specified match structure.
CS4C: Final Evaluation Report December 2013 Page 18 of 164
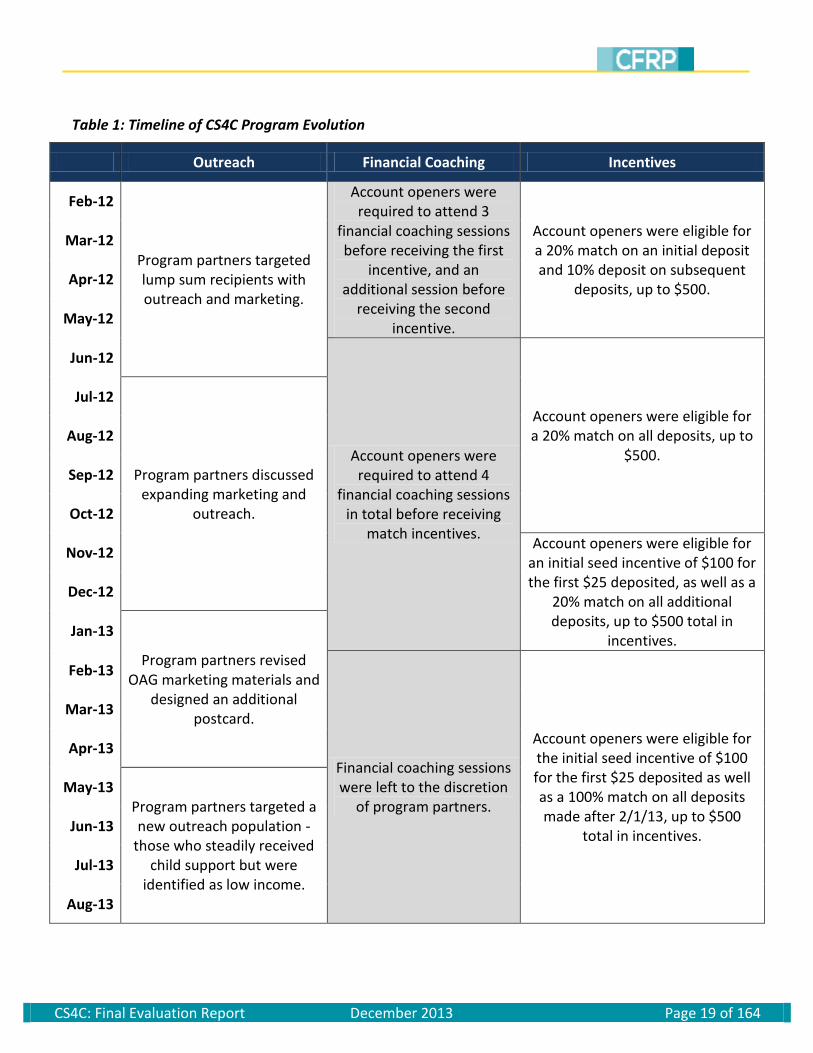
Evolution of Program Design: Outreach, Incentives, and Financial Coaching
Given the innovative nature of the CS4C program, program administrators had little in the way of a road map for the optimal program design and implementation strategy. In addition, the program was launched quickly before all logistical decisions could be settled. Though the original program structure was designed with the core principles of asset building in mind, CS4C also inadvertently incorporated adverse incentive structures and a number of barriers to participation. As the program went into effect, program partners learned what was most effective and modified the program accordingly. This section provides an overview of changes in the outreach, financial coaching, and incentive structures of the CS4C program. Table 1 outlines the evolution of the program from program launch in February 2012 to program close in August 2013. At the outset of the program, direct outreach focused on families who were receiving lump sum payments under the presumption that the unexpected windfall of cash would provide an opportunity to save for college. Lump sum recipients who enrolled in the program received a 20 percent match on an initial deposit after six months and three financial coaching sessions. Participants could receive an additional 10 percent match on subsequent deposits following a fourth financial coaching session. In May of 2012, the match rate was changed to a constant 20 percent on all deposits and participants were required to attend a total of four financial coaching sessions before receiving match incentives. This modification was made in response to the tendency of participants to delay their initial deposits in order to save more and maximize the initial match. This delay was believed to decrease the number of people opening accounts. By standardizing the match, program partners hoped to eliminate the incentive to delay and increase the number of accounts. During this time, program partners also began to discuss expanding outreach beyond lump sum recipients. In November 2012, an additional incentive was added to encourage account opening among prospective participants. Participants opening an account with a $25 deposit were provided with an initial seed incentive of $100. All deposits were also matched at the existing 20 percent match rate once participants had completed four financial coaching sessions. In January 2013, program partners revised the marketing materials and designed an additional postcard in an effort to boost enrollment. February 2013 saw the greatest modifications to the CS4C program. Two companion changes were made, one intended to boost incentives and the other intended to reduce barriers. The match rate was raised to 100 percent on all deposits, and financial coaching requirements were waived. Participants seeking to open accounts were no longer required to complete four financial coaching sessions; however, financial coaching services were still provided on a voluntary basis. Finally, in April of 2013 the CS4C program altered its outreach. The new marketing strategy targeted a different population of child support recipients – those who were identified as low income families steadily receiving child support. The program concluded at the end of August 2013.
CS4C: Final Evaluation Report December 2013 Page 19 of 164
Table 1: Timeline of CS4C Program Evolution
Outreach Financial Coaching Incentives
Feb-12
Program partners targeted lump sum recipients with outreach and marketing.
Account openers were required to attend 3
financial coaching sessions before receiving the first
incentive, and an additional session before
receiving the second incentive.
Account openers were eligible for a 20% match on an initial deposit and 10% deposit on subsequent
deposits, up to $500.
Mar-12
Apr-12
May-12
Jun-12
Account openers were required to attend 4
financial coaching sessions in total before receiving
match incentives.
Account openers were eligible for a 20% match on all deposits, up to
$500.
Jul-12
Program partners discussed expanding marketing and
outreach.
Aug-12
Sep-12
Oct-12
Nov-12 Account openers were eligible for
an initial seed incentive of $100 for the first $25 deposited, as well as a
20% match on all additional deposits, up to $500 total in
incentives.
Dec-12
Jan-13
Program partners revised OAG marketing materials and
designed an additional postcard.
Feb-13
Financial coaching sessions were left to the discretion
of program partners.
Account openers were eligible for the initial seed incentive of $100 for the first $25 deposited as well as a 100% match on all deposits made after 2/1/13, up to $500
total in incentives.
Mar-13
Apr-13
May-13 Program partners targeted a new outreach population -
those who steadily received child support but were
identified as low income.
Jun-13
Jul-13
Aug-13
CS4C: Final Evaluation Report December 2013 Page 20 of 164
Evaluation Strategy
The evaluation of the CS4C program relies on a mixed methods approach, integrating both quantitative and qualitative analyses throughout the evaluation process. The use of multiple evaluation strategies helps to contextualize elements of the program that may not be well-suited to quantitative or qualitative data alone. In particular, the relatively small number of participants and numerous changes made to the program introduce challenges to statistical analyses. In these cases, qualitative data supplement the discussion and provide a more comprehensive understanding of program dynamics. This evaluation seeks to address three broad research questions: 1) Who participated in CS4C?, 2) What were the motivations and barriers to program participation?, and 3) What are the benefits to participating in CS4C? Each of these research topics is discussed in the findings section. In addition, this evaluation aims to identify relevant programmatic lessons in the areas of program design and implementation, which are detailed in the policy considerations section. DATA COLLECTION
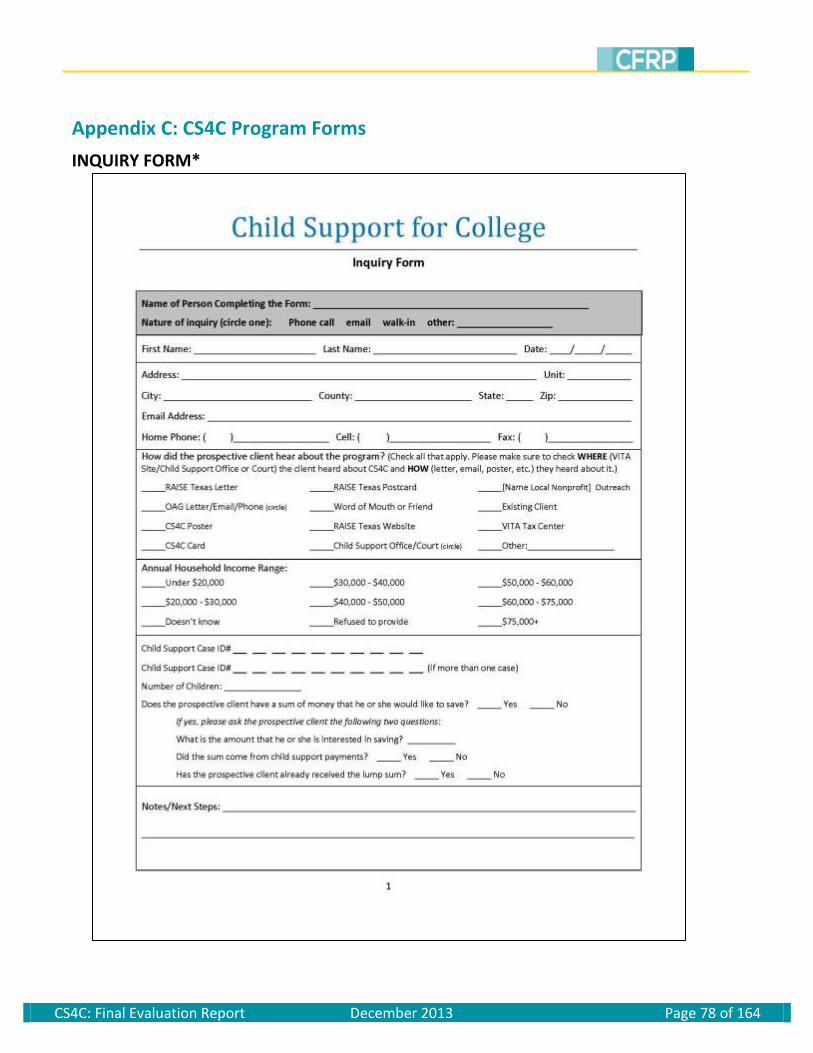
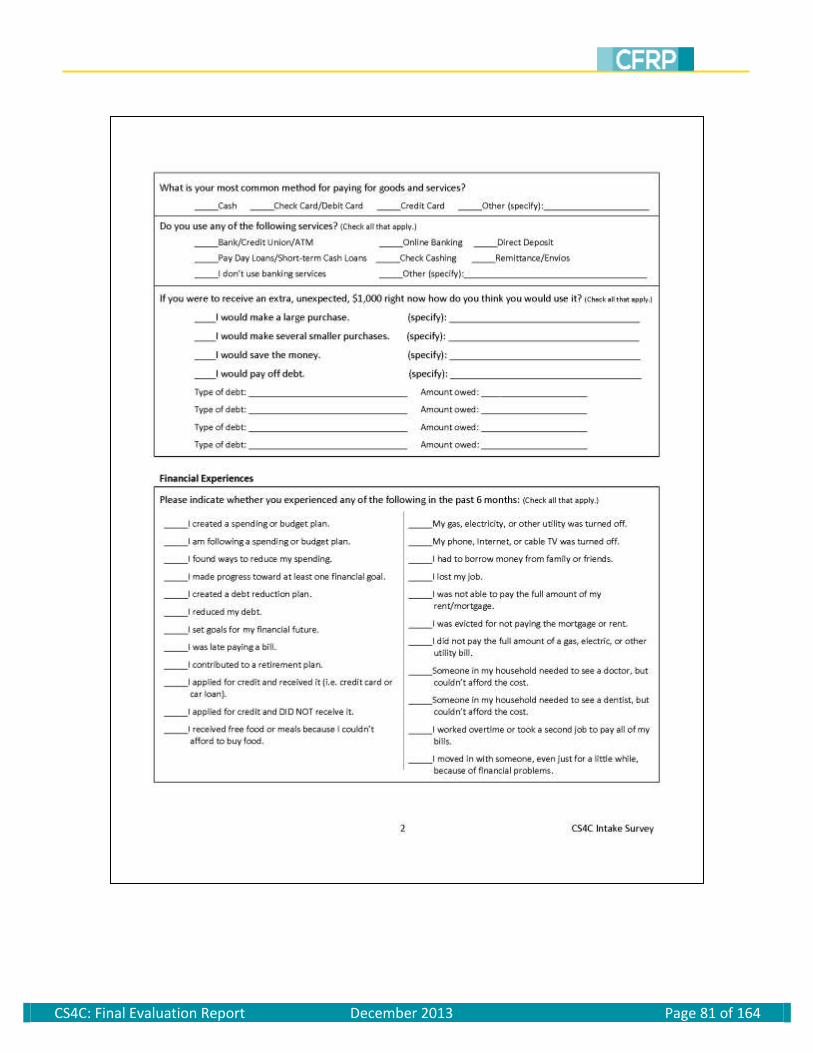
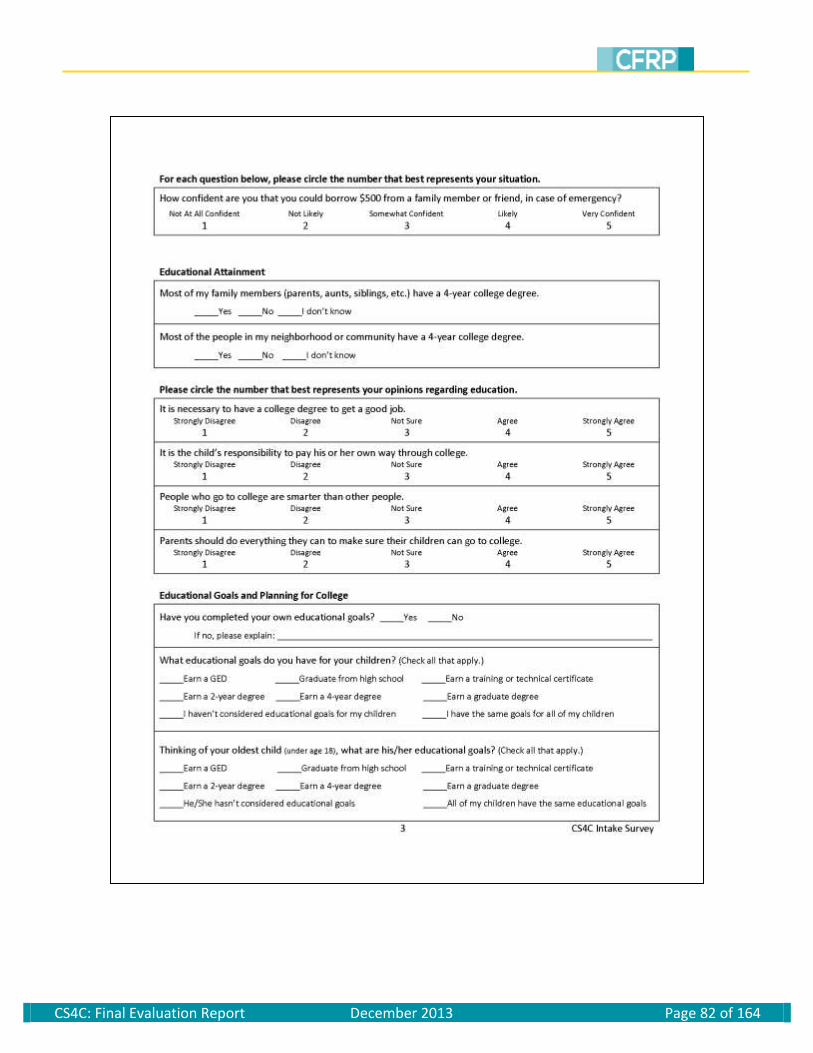
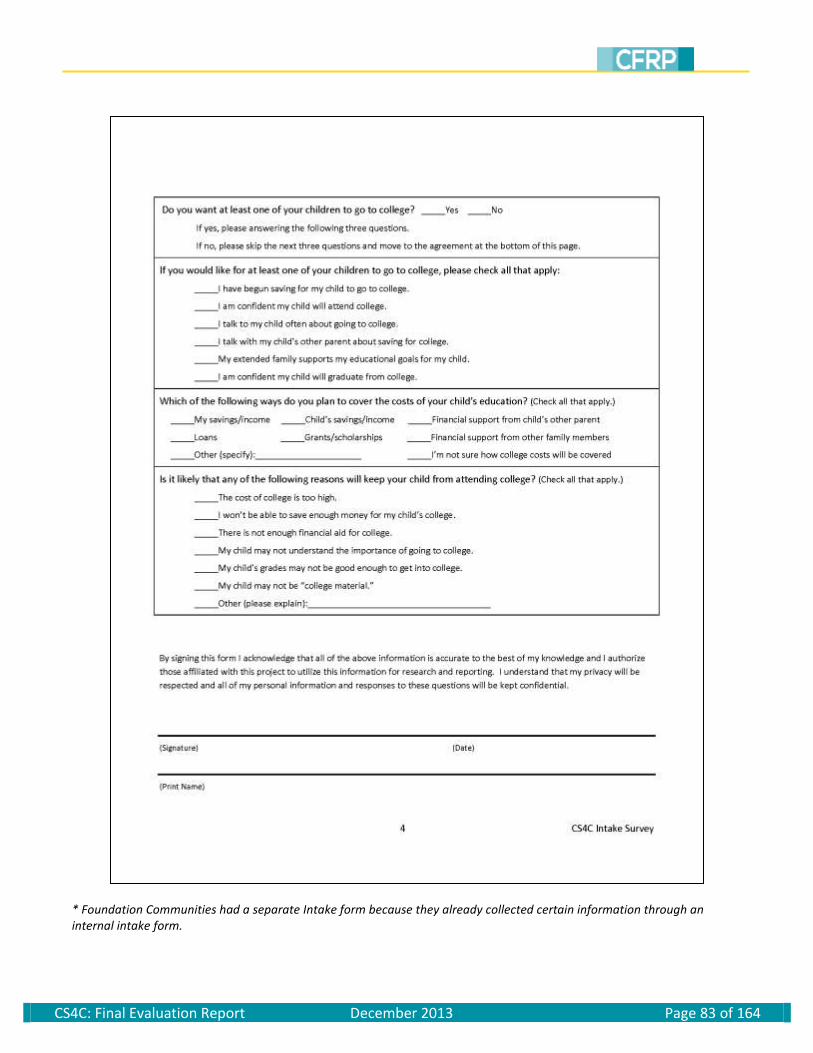
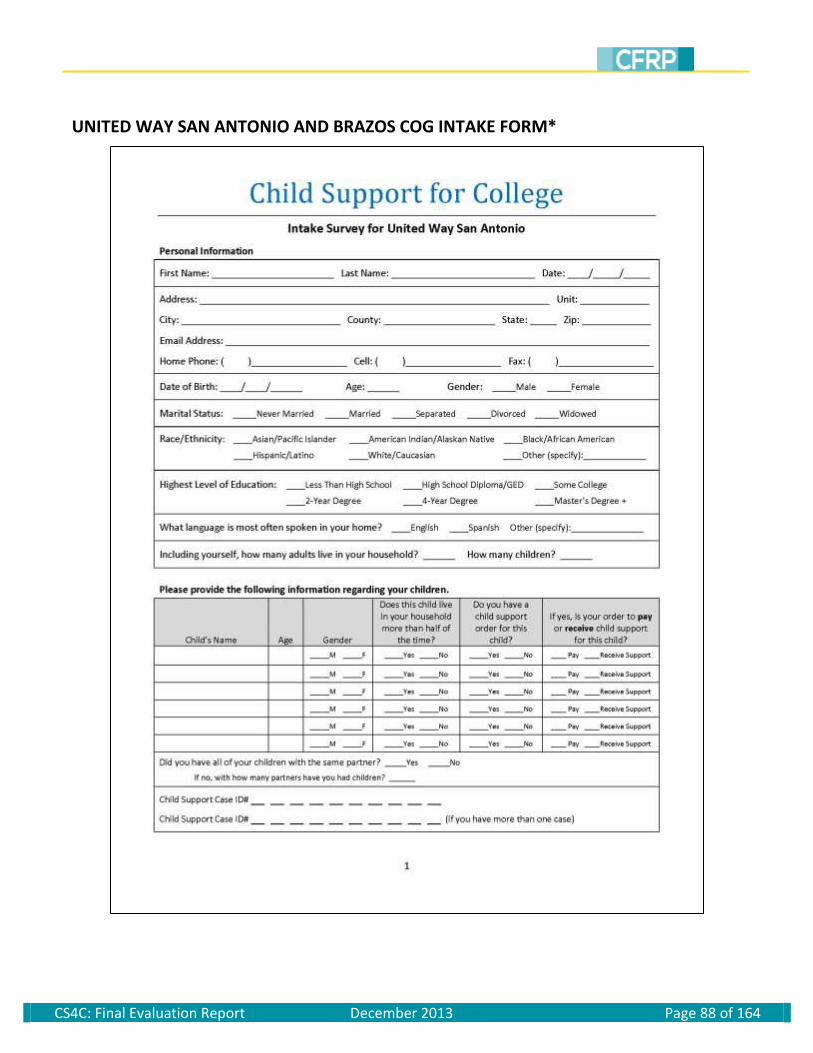
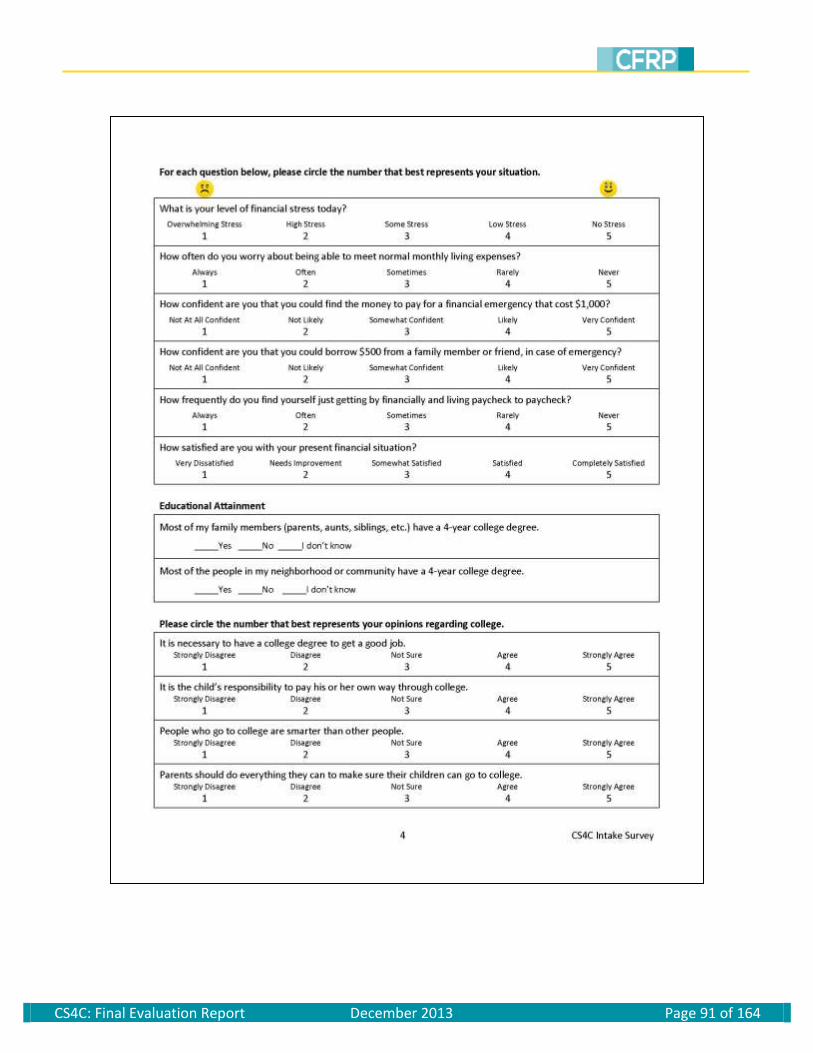
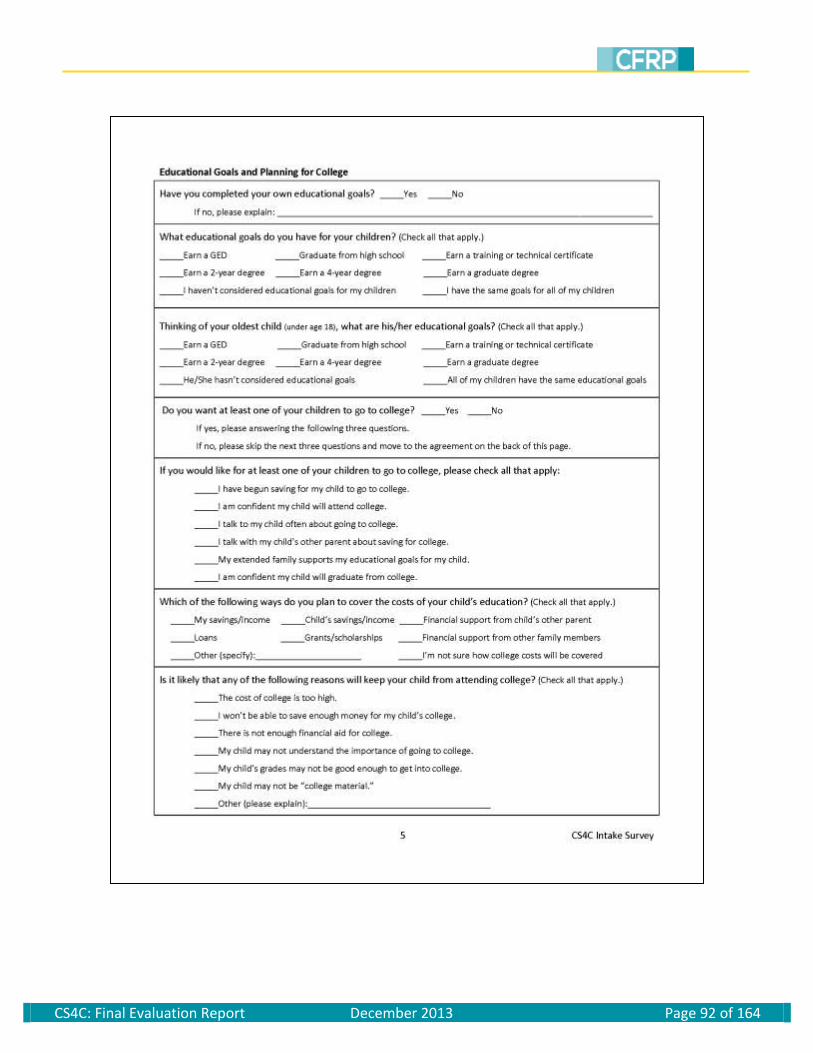
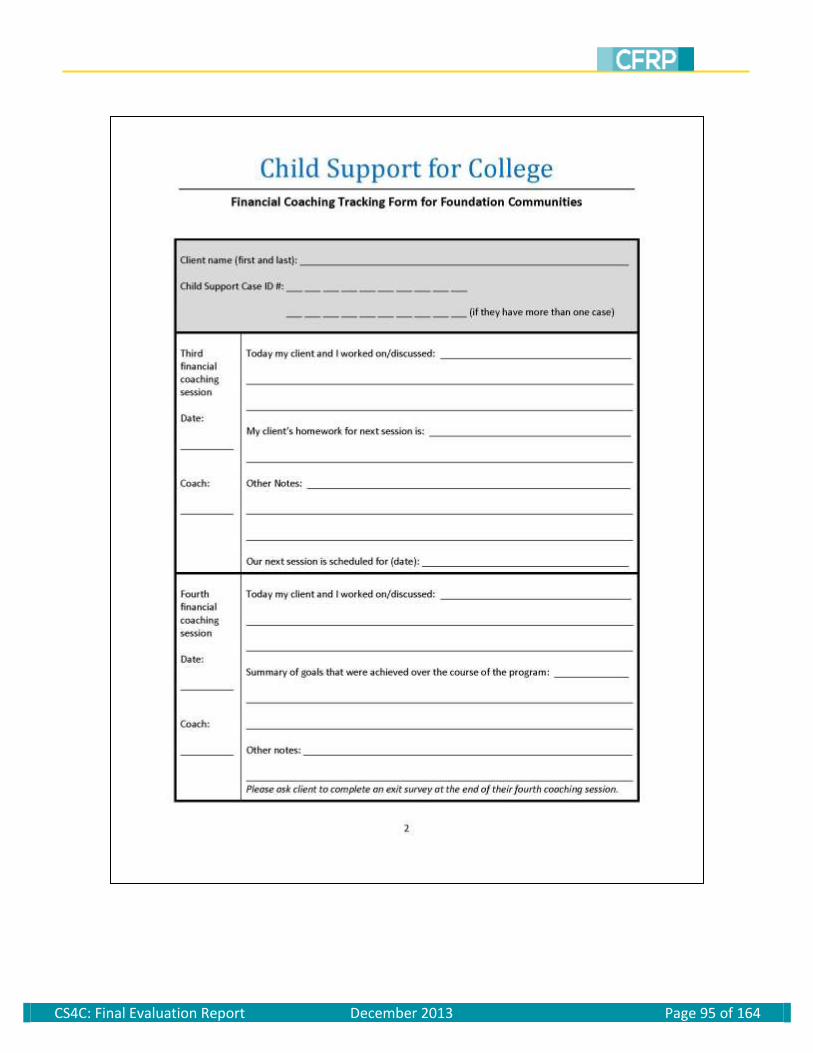
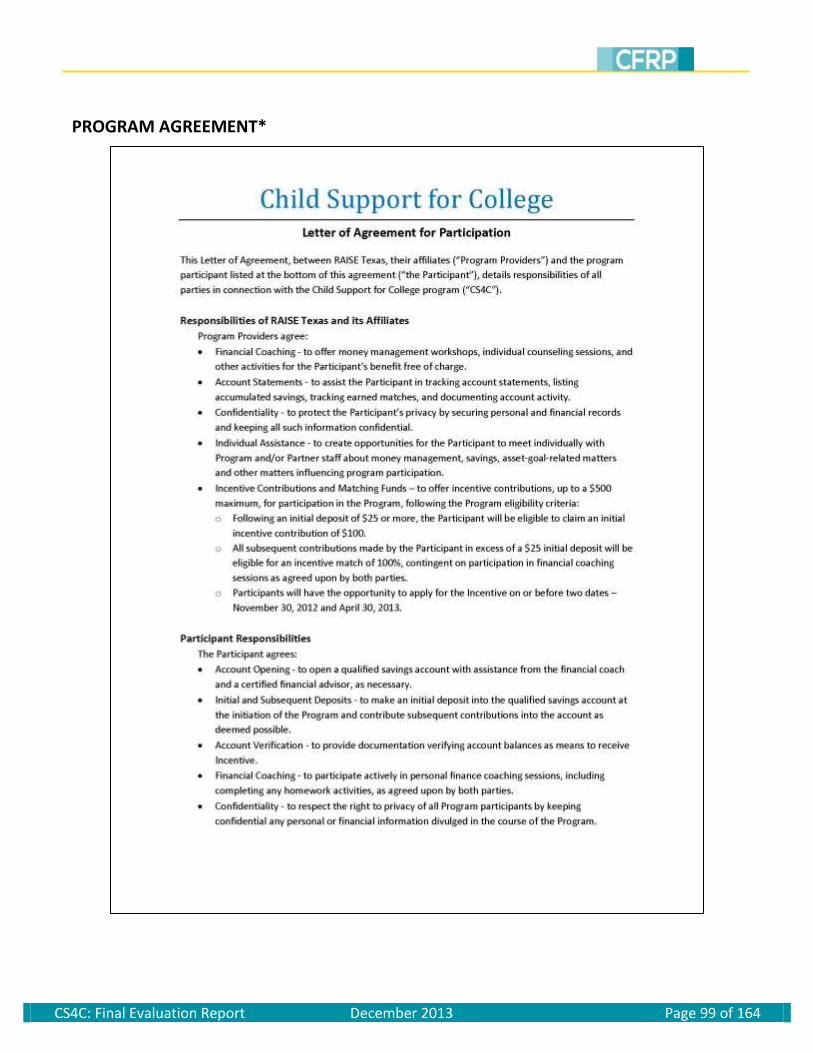
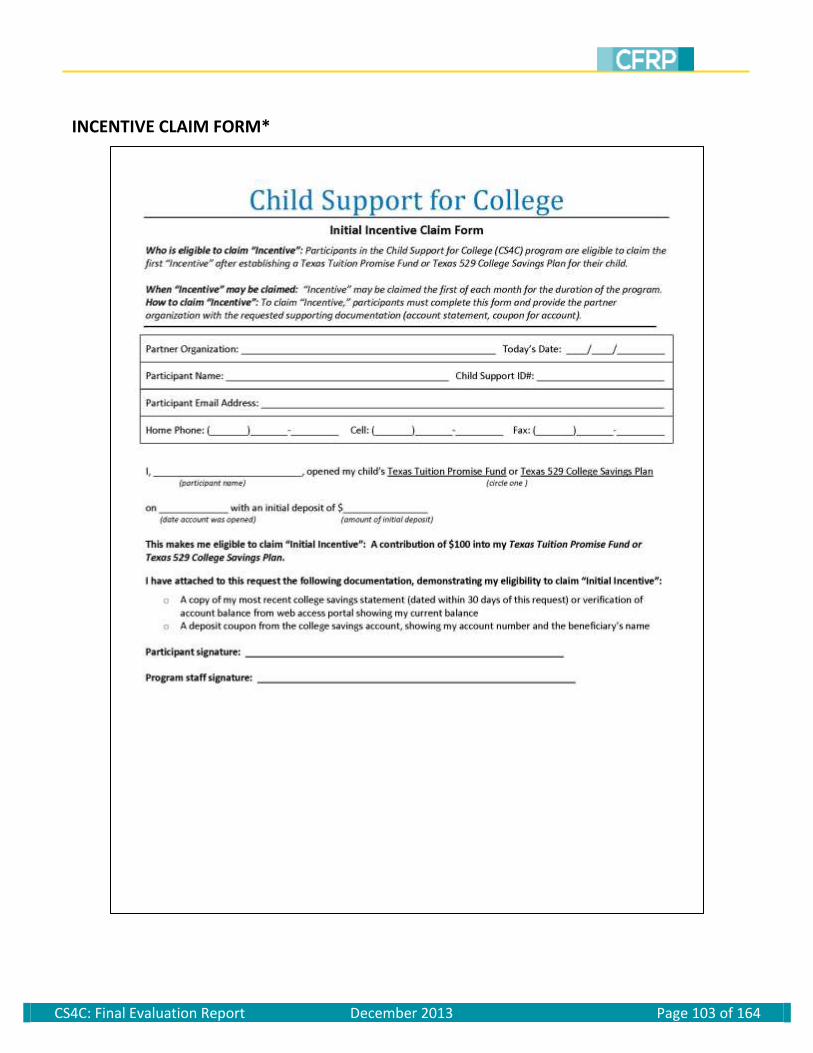
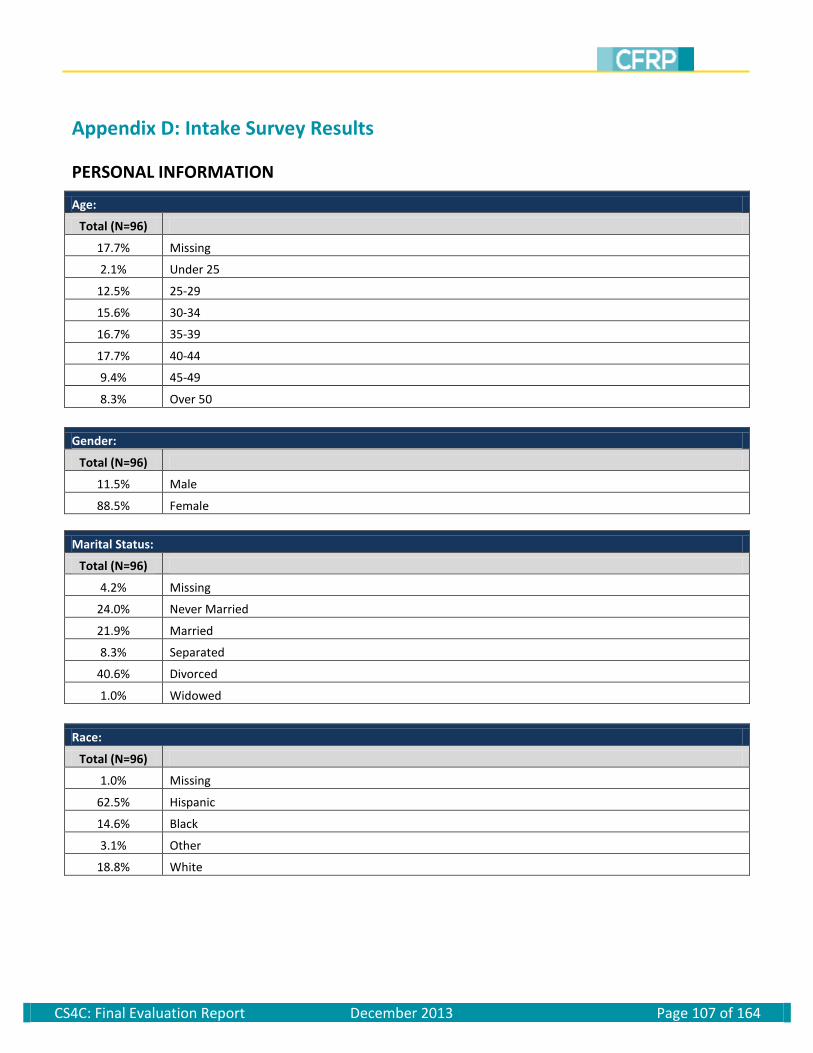
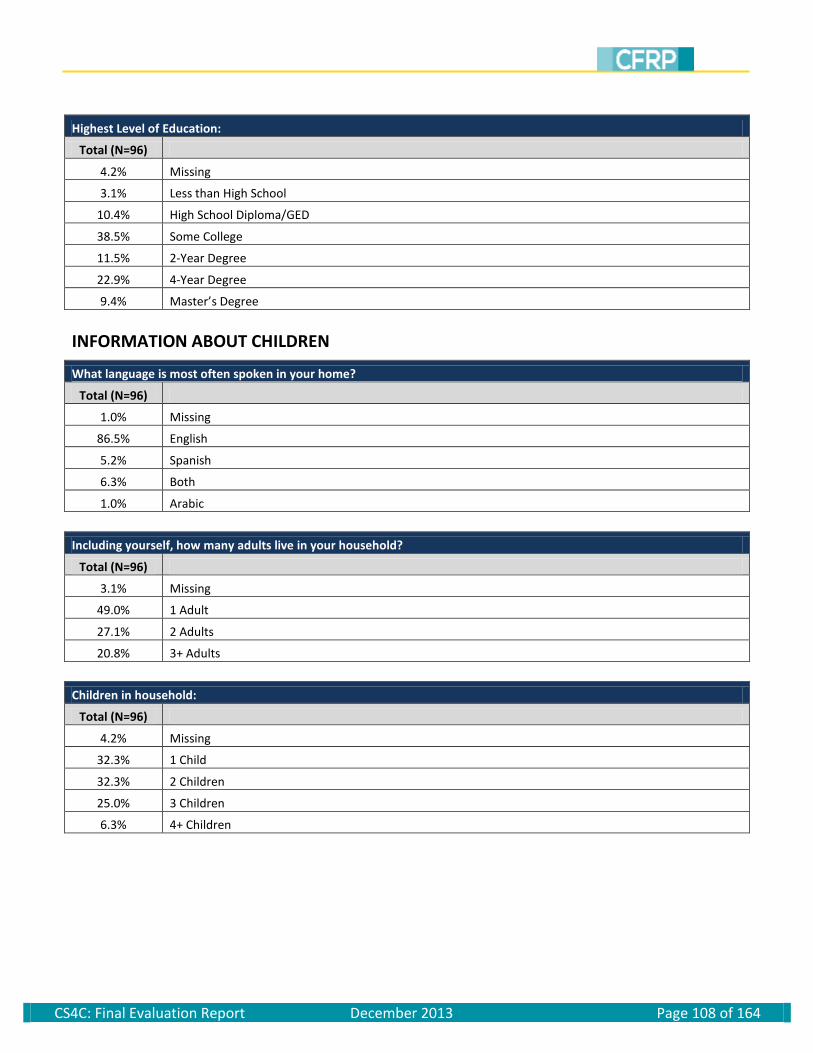
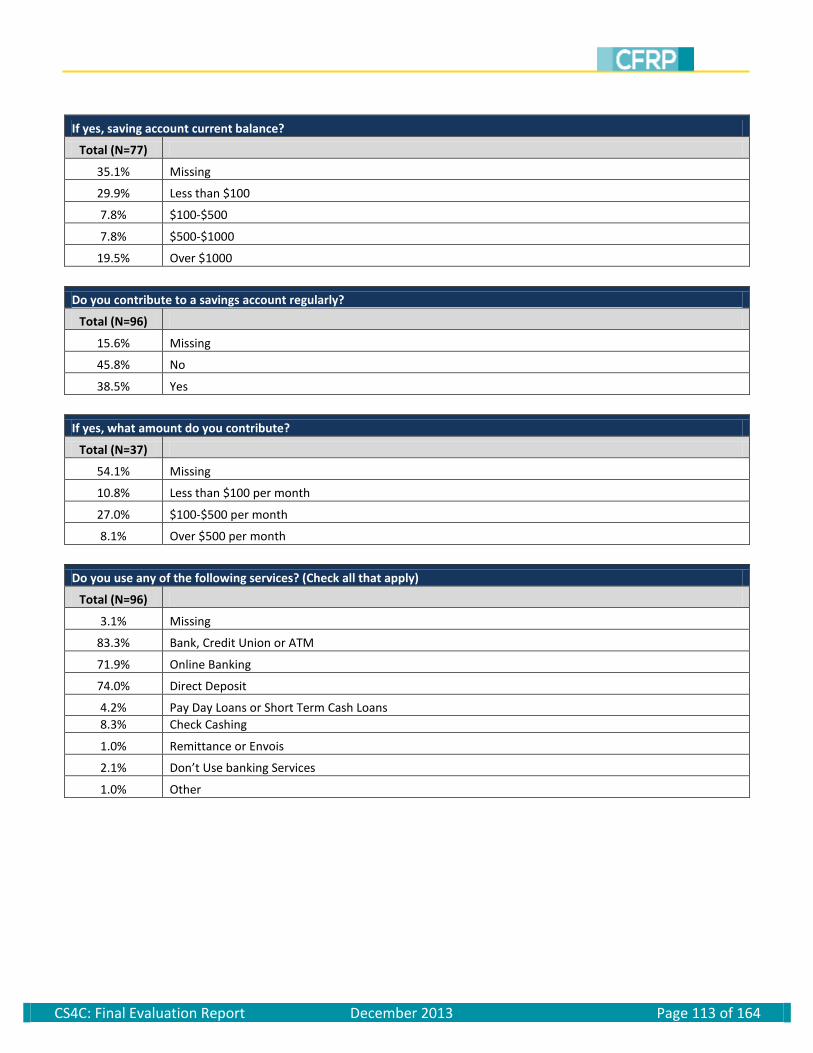
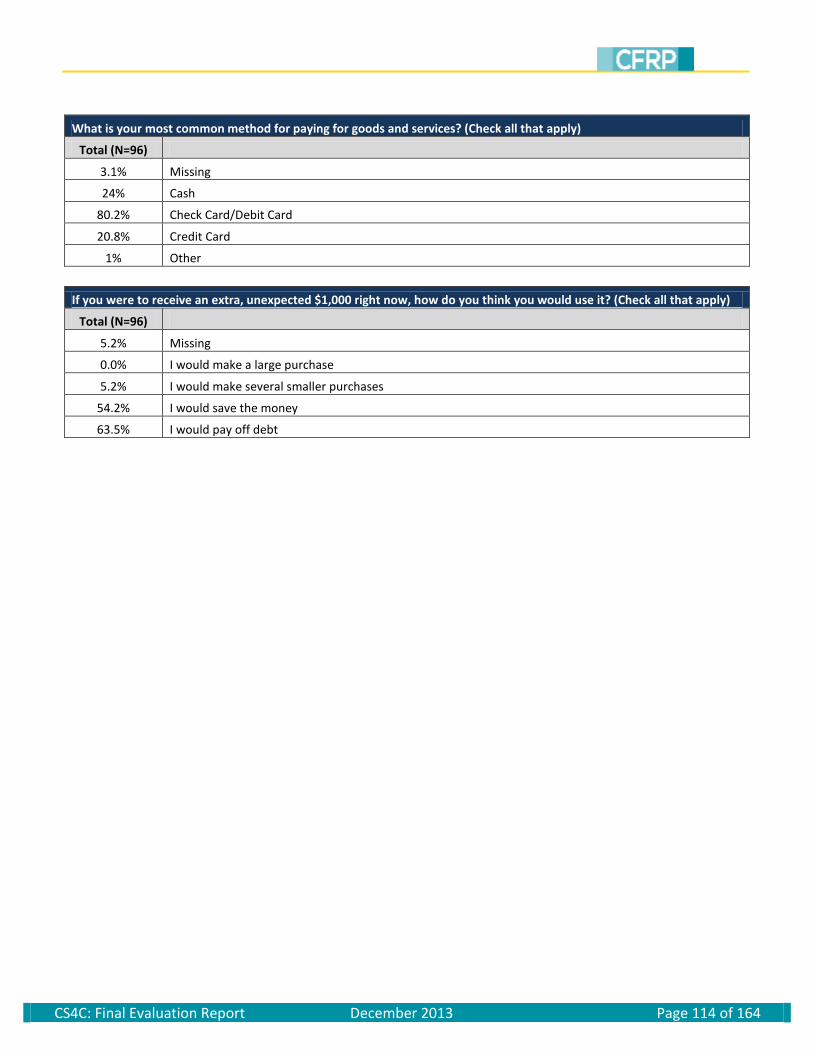
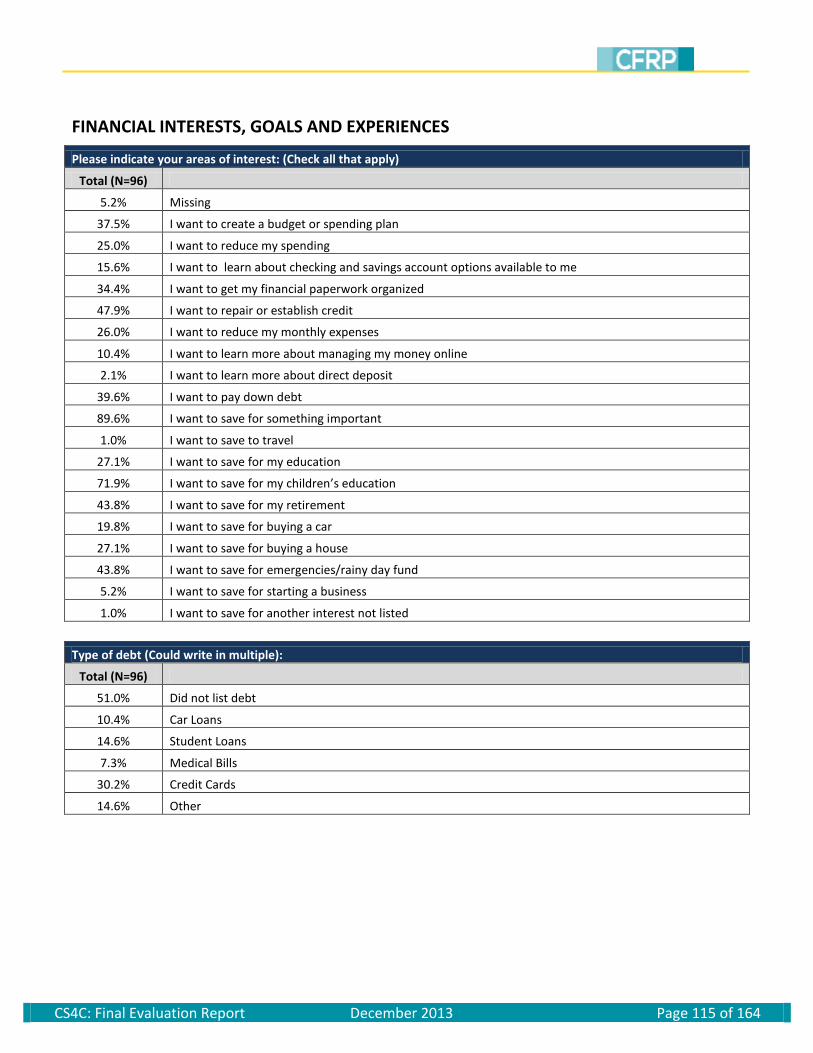
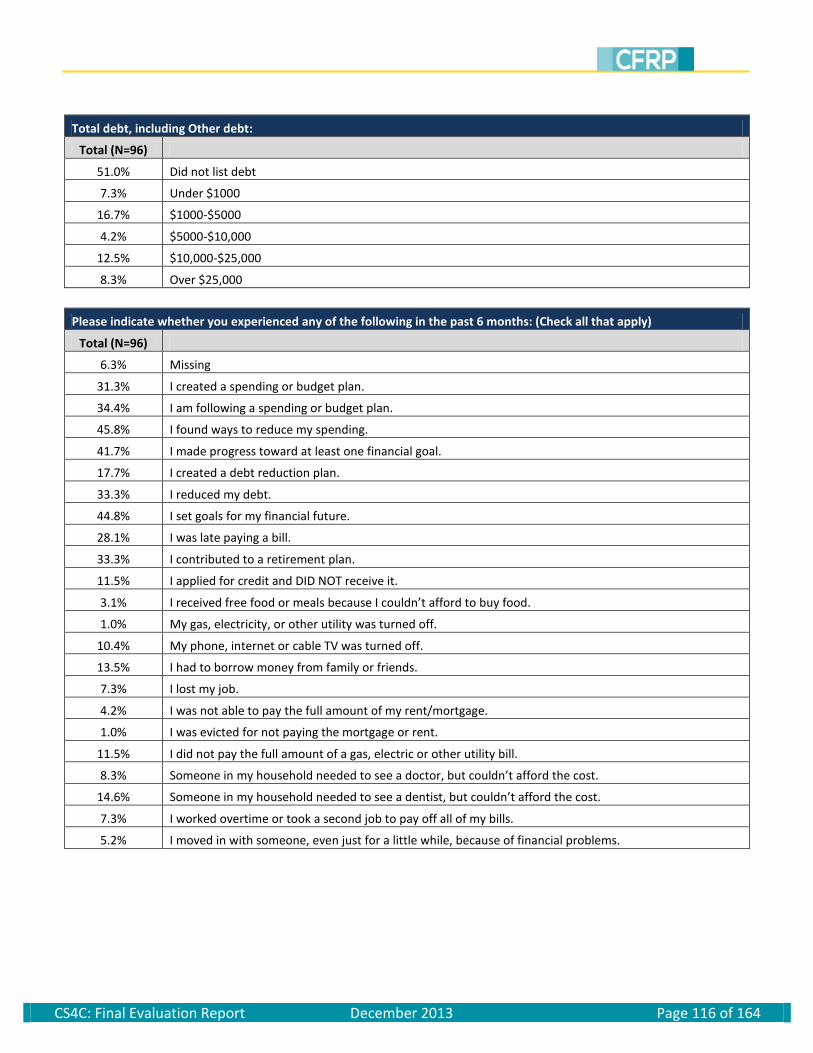
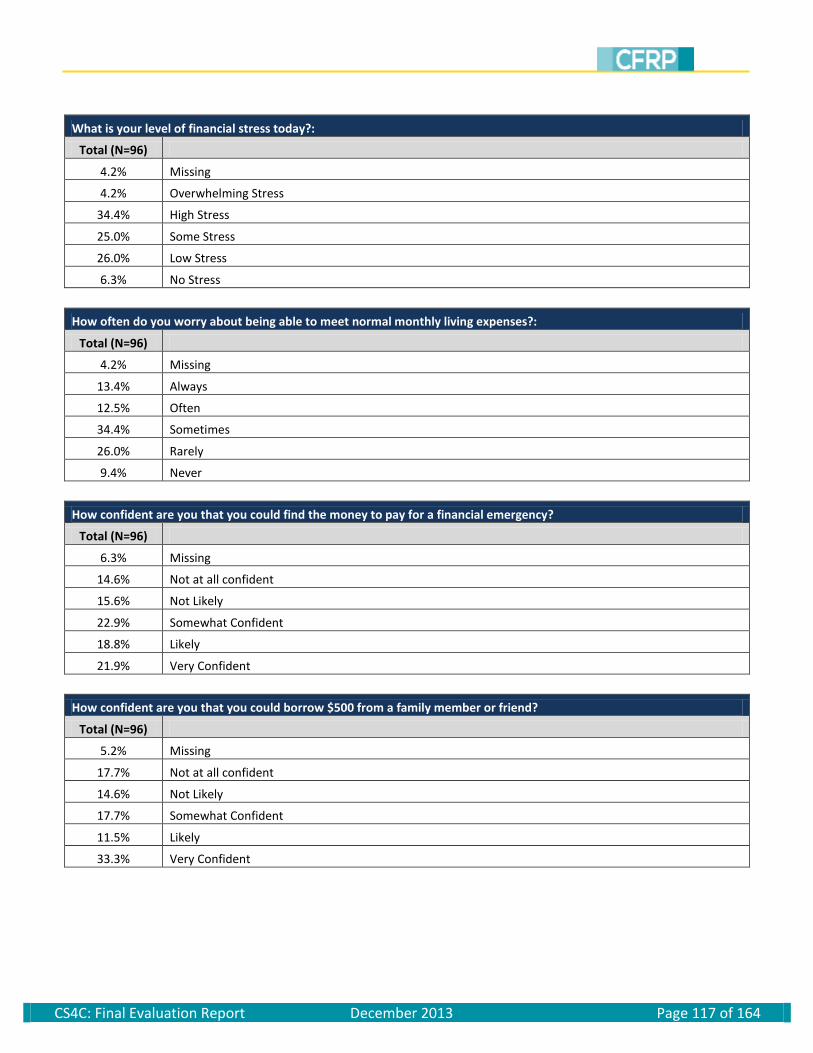
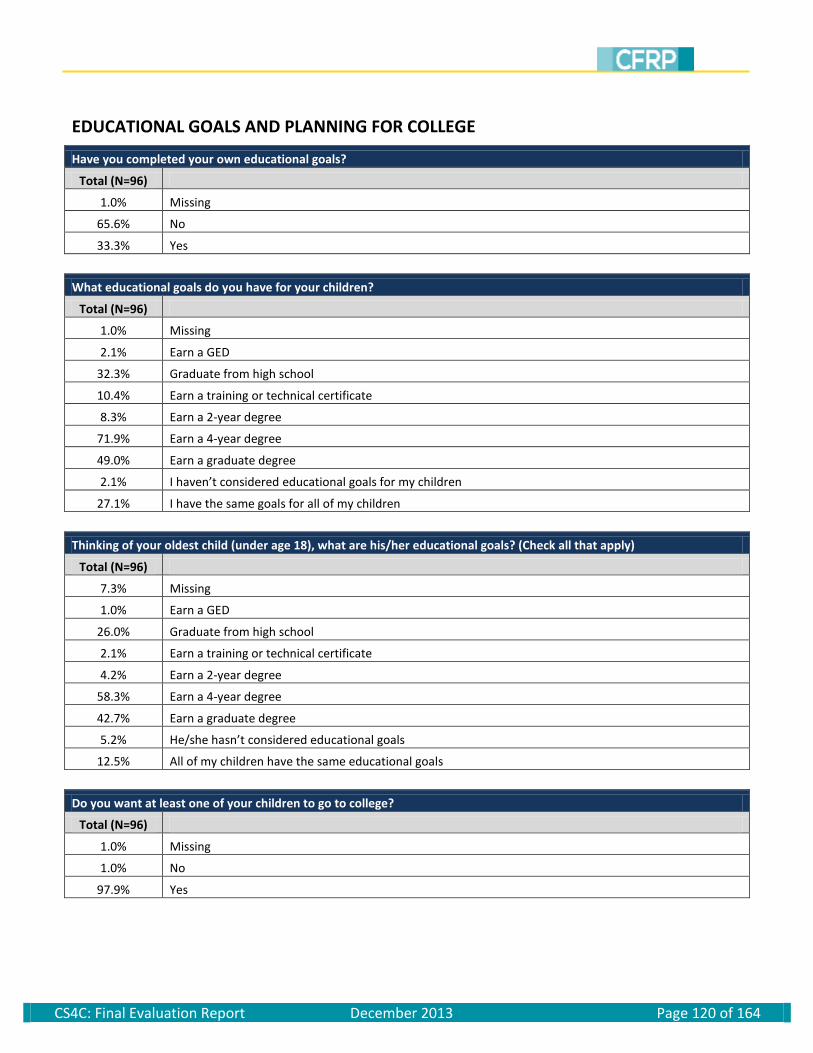
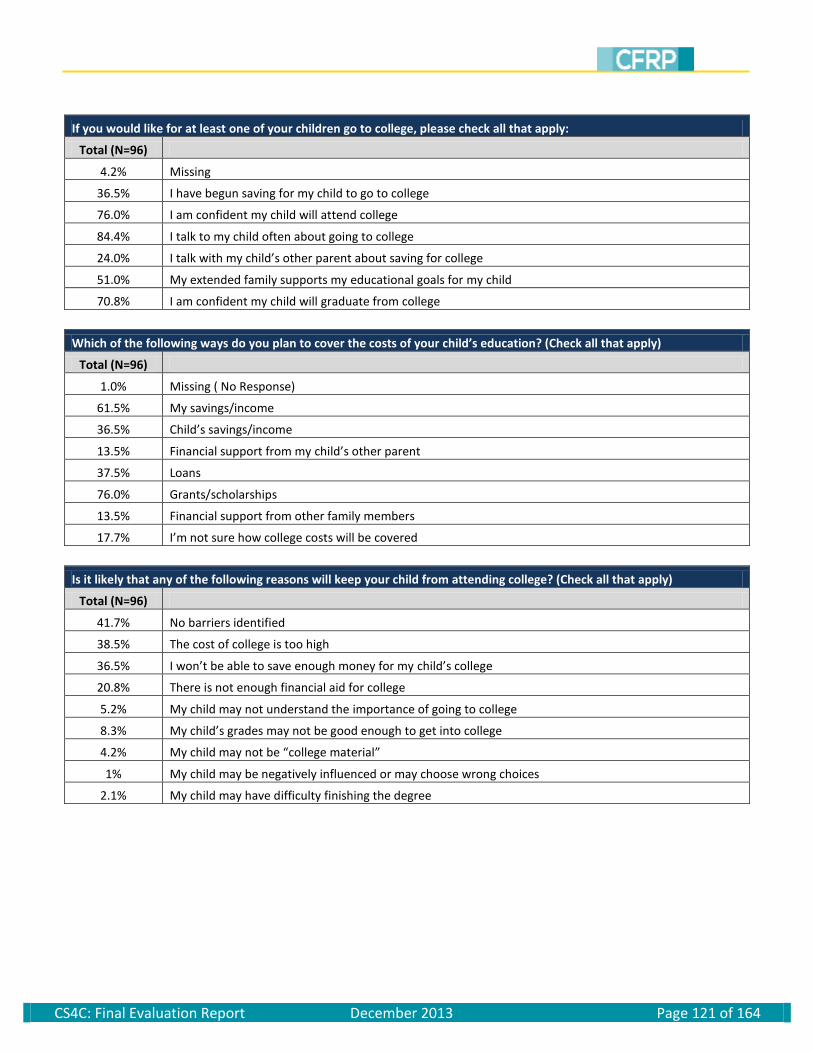
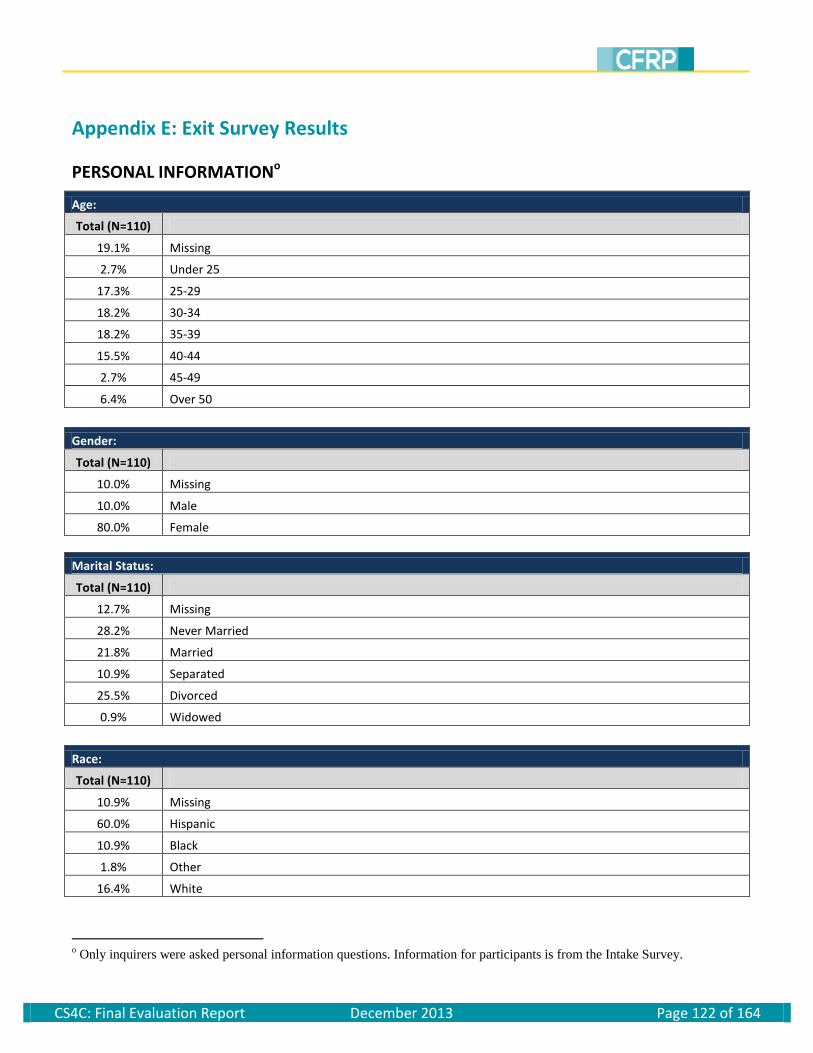
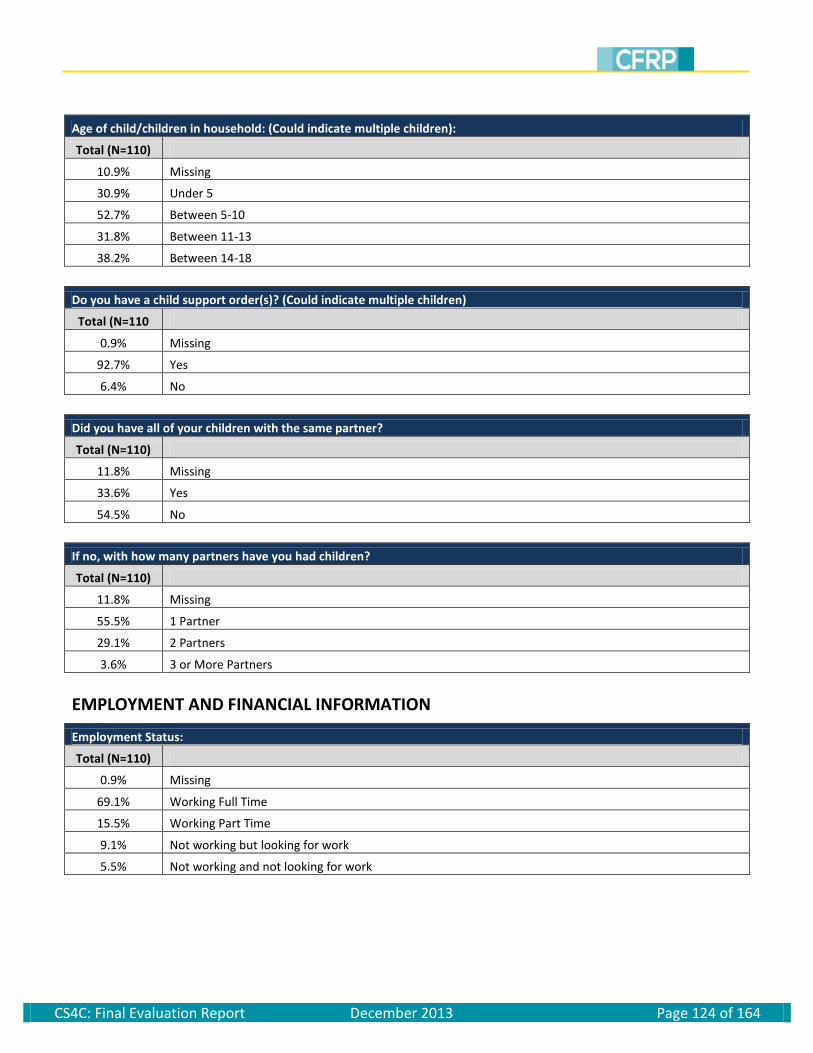
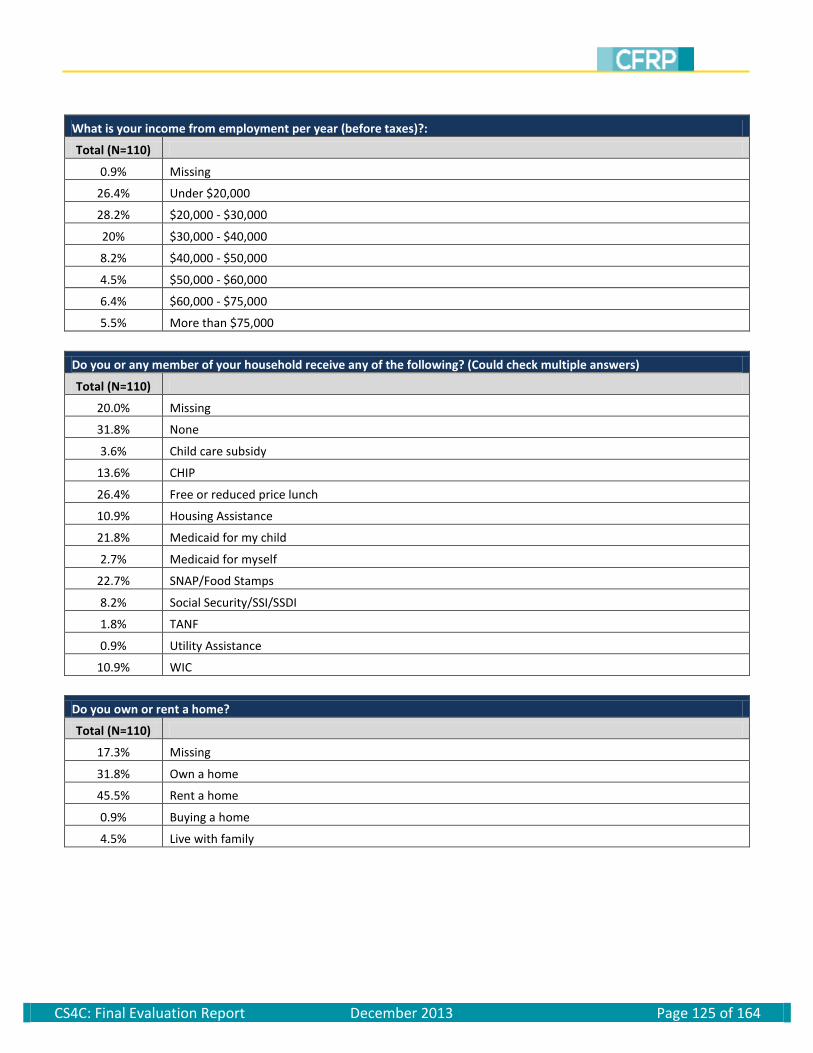
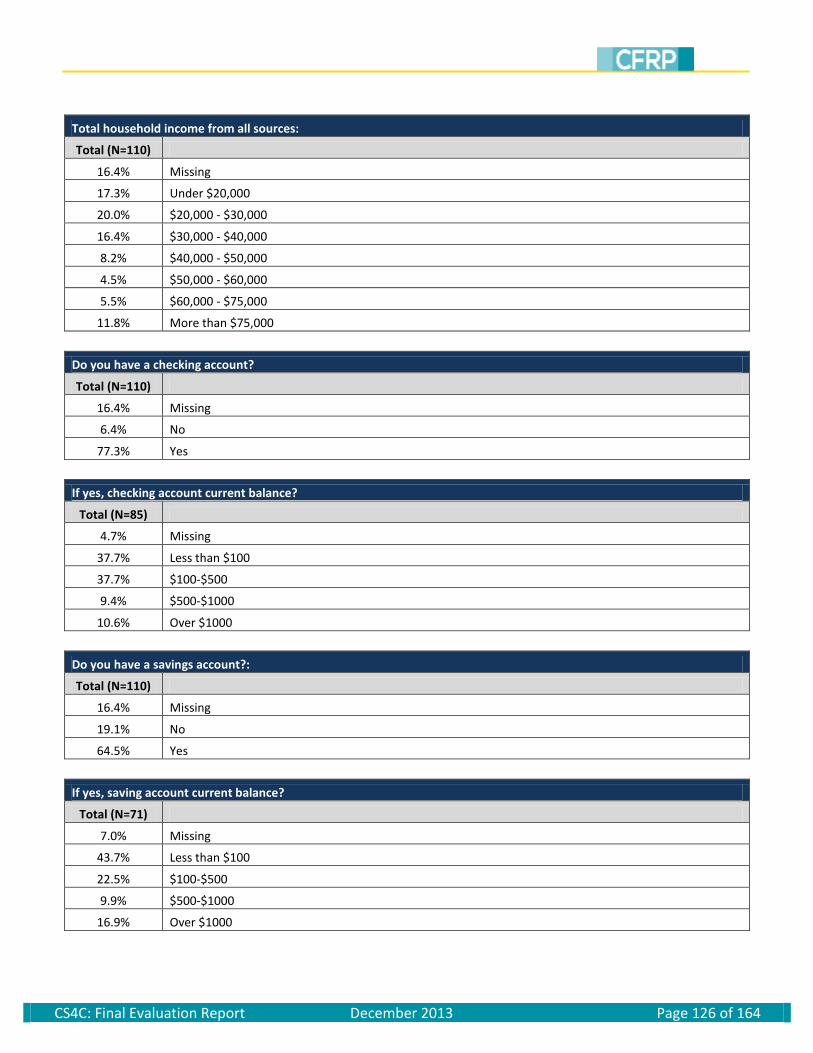
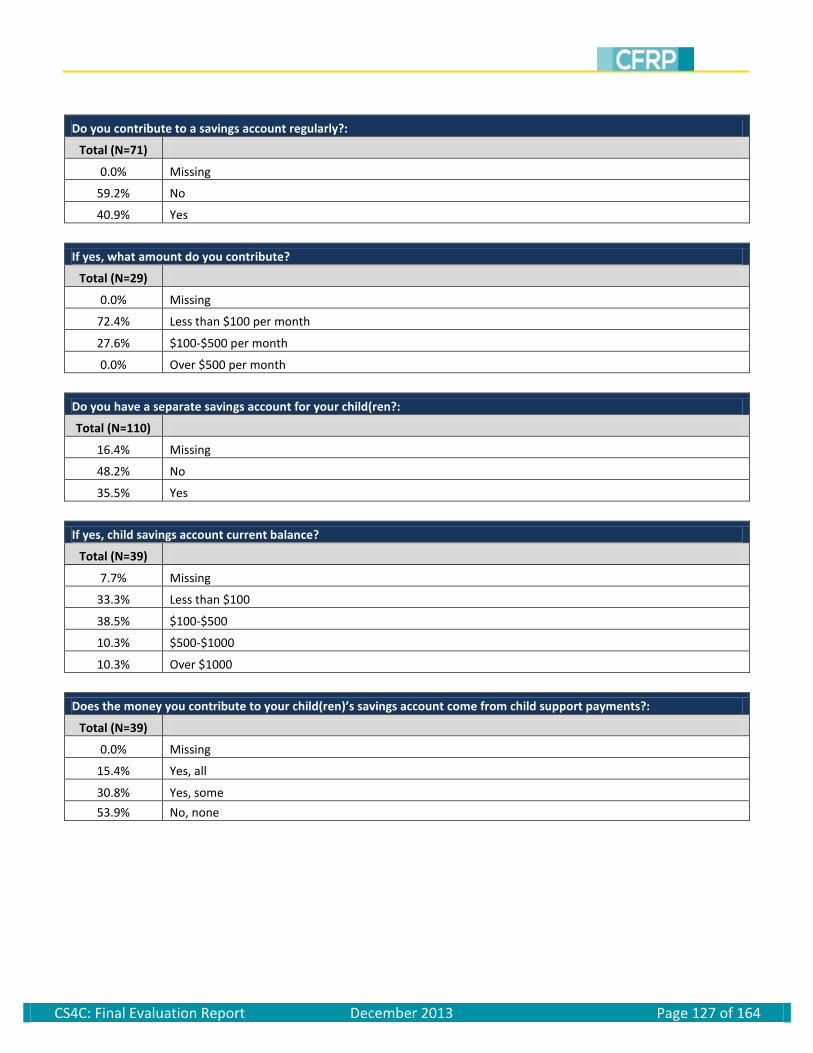
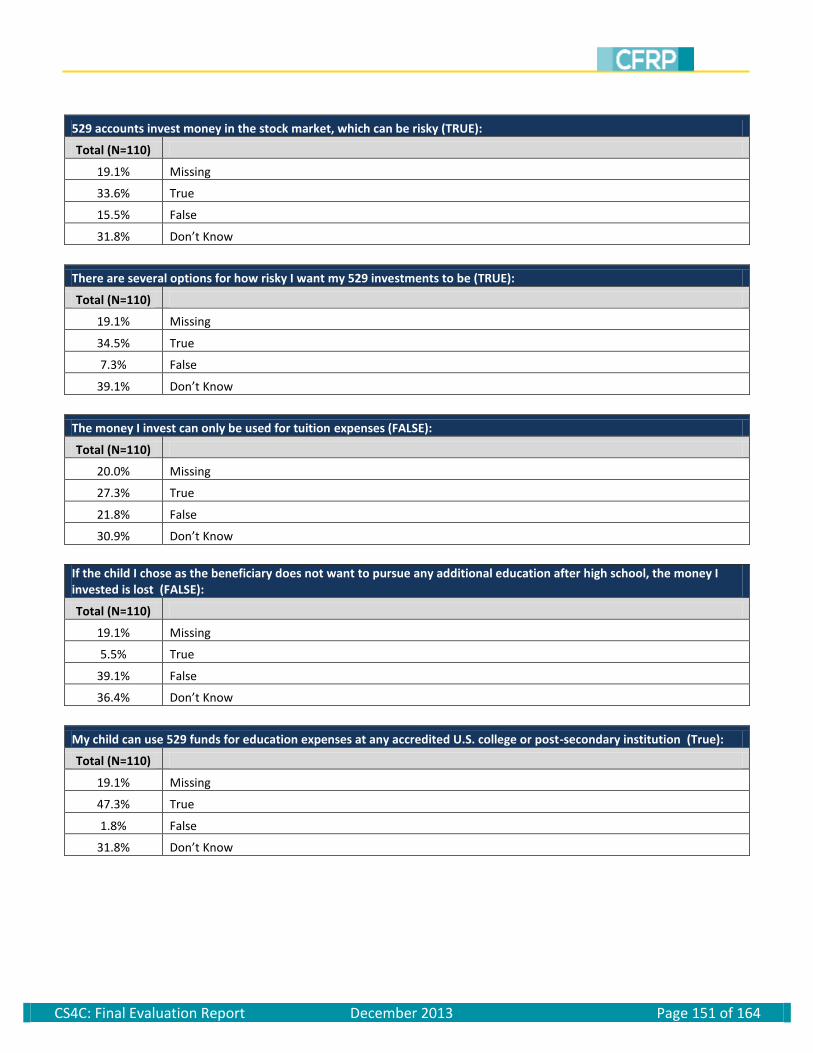
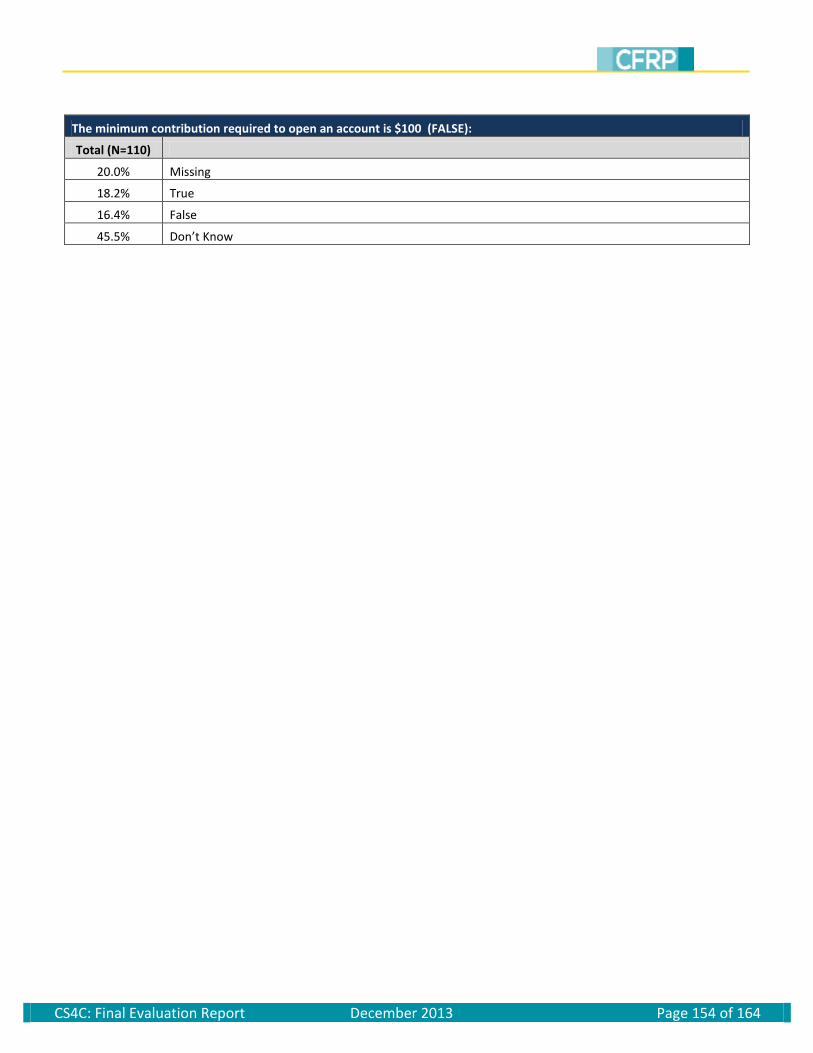
To evaluate CS4C, CFRP collected data from a variety of sources. Program forms completed by the local nonprofits made up one of the largest sources of information. These forms include an inquiry form, which program partners completed for every inquiry made about CS4C; a financial coaching form, which financial coaches completed following every coaching session; and several forms related to the incentive claim process [program forms available in Appendix C]. Additionally, CFRP received account statements from account openers as part of the incentive claim process.d To collect more detailed information about inquirers, non-openers, and account openers, CFRP fielded two larger surveys for CS4C. First, CFRP asked program participants to complete intake surveys during their first financial coaching session; out of 99 participants, 96 began intake surveys. This survey collected detailed demographic and financial characteristics, as well as participants’ financial and educational goals [full results available in Appendix D]. Second, CFRP conducted an online exit survey of all CS4C inquirers, non-openers, and account openers in June 2013, to which 110 individuals responded [full results available in Appendix E]. Of the 110 respondents, at the time of the exit survey, 57 were individuals who inquired about CS4C (inquirers). Another 15 individuals had met with a representative from the local nonprofit but did not open an account (non-openers). Finally, 38 individuals had opened an account with CS4C (account openers).e CFRP also used information collected by program partners and on surveys to match inquirers and participants with administrative data from the OAG. CFRP was able to match 215 (out of 298) inquirers and participants to active child support cases. These case records provide detailed information on child
d It is important to note that participants were not required to submit “final” account statements to program evaluators. As a
result, CFRP does not have access to final account balances for participants who received the maximum match and may have
continued to make deposits thereafter. Reported deposits are unlikely to reflect all participant contributions into college
savings accounts during the pilot. e After taking the exit survey, one inquirer and one non-opener went on to become account openers.
CS4C: Final Evaluation Report December 2013 Page 21 of 164
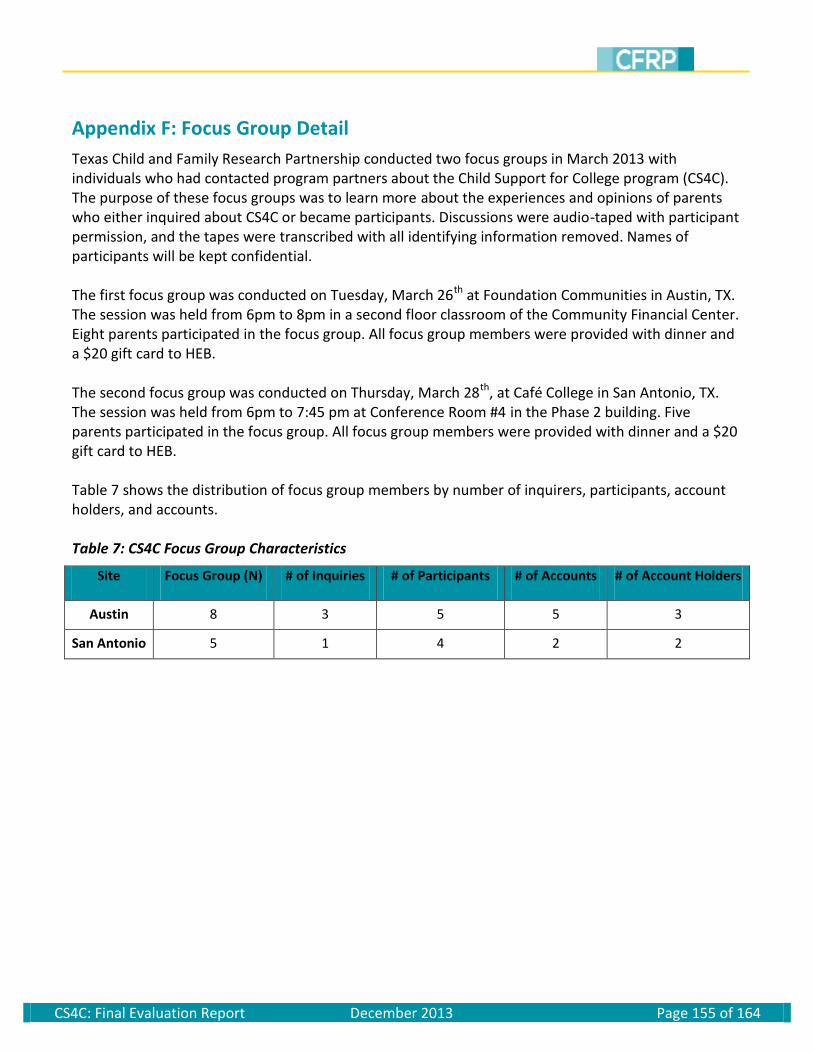
support payment histories. Additionally, the OAG provided CFRP with marketing records on all individuals contacted throughout the course of the program. To supplement information from quantitative data sources, CFRP also conducted two focus groups in Austin and San Antonio during March 2013. Individuals who had contacted local nonprofits about CS4C were invited to participate: eight parents participated in the Austin focus group, and five parents participated in the San Antonio focus group. Focus group results were transcribed and coded for recurring themes. [For more information on CS4C focus groups, please see Appendix F.] In addition, CFRP gathered programmatic information from interviews and meetings with program partners. The perspectives collected from these sources offer additional context for helping to understand many of the program’s dynamics, and help to inform recommendations made at the end of the report. DATA ANALYSIS
As noted previously, CS4C experienced a quick launch. Because not all decisions about the program design had been settled, program partners made numerous revisions to the structure of the program as the pilot progressed, in part due to results from CFRP’s implementation evaluation. Importantly, program partners often made multiple modifications to the program structure simultaneously, increasing the difficulty of linking subsequent outcomes to any single program modification. Under these circumstances, the CS4C pilot had no uniform treatment, and no impact evaluation of the program was possible. To compare differences between inquirers, non-openers, and account openers, CFRP uses results from inquiry forms, intake surveys, and exit surveys to construct as large of a sample as possible from each of these groups. Binomial tests, appropriate with smaller sample sizes, are used to determine whether these groups differ statistically on various demographic characteristics. Although CFRP has mostly complete demographic results from non-openers and account openers, some inquirers provided very little information to local nonprofits, and only one-quarter of inquirers participated in the exit survey. The potential for systematic differences between inquirers who participated in the exit survey and those who did not introduces the possibility of selection bias into inquirers’ exit survey data; however, this survey also provides the most detailed portrait of this group available. To determine the motivations and barriers to program participation, CFRP presents descriptive results of exit survey data, as well as calculations of inquiry, participation, and account opening rates over time. Combined with data from focus groups, these results provide compelling evidence on the reasons inquirers chose to participate in CS4C, or were unable or unwilling to participate. Because of the small number of inquirers, non-openers, and account openers, as well as multiple incidences of item non-response on both the intake and exit surveys, CFRP did not exclude respondents with incomplete surveys.
CS4C: Final Evaluation Report December 2013 Page 22 of 164
Finally, to examine the benefits of program participation, CFRP cites descriptive analyses from intake and exit surveys; again, because of the small number of inquirers, non-openers, and account openers, along with multiple incidences of item non-response on both surveys, CFRP includes all survey respondents. In addition, CFRP conducts several pre-post binomial tests on intake and exit survey results for account openers, i.e. those who were exposed to the “treatment” of opening a college savings account through CS4C; only account openers completing both an intake survey and exit survey, as well as completing the same questions on both surveys, are included in these analyses. Throughout this section, CFRP also relies on focus group results to supplement the discussion of benefits accrued through program participation.
CS4C Program Findings
This section presents evaluation findings from the CS4C program. We begin by introducing output data from the pilot, including the number of accounts opened, participant account holdings, and CS4C incentive payments. The subsequent section then explores the demographic characteristics of account openers, non-openers, and inquirers, noting a number of socioeconomic differences between groups. Following these descriptive analyses, we trace trends in rates of inquiry and account opening, and examine the motivations and barriers to program participation. This section also considers how changes to the program may have altered rates of account opening. In the final section, we examine the benefits to participation in CS4C. Beyond evaluation outcomes, CS4C also yielded a number of programmatic lessons, including the need to set clear and specific goals at program launch; to understand barriers to program success; to align with the best principles of asset building; and, to integrate program goals with existing goals of stakeholders. Programmatic lessons are discussed further in the policy considerations section. CS4C PROGRAM OUTPUTS
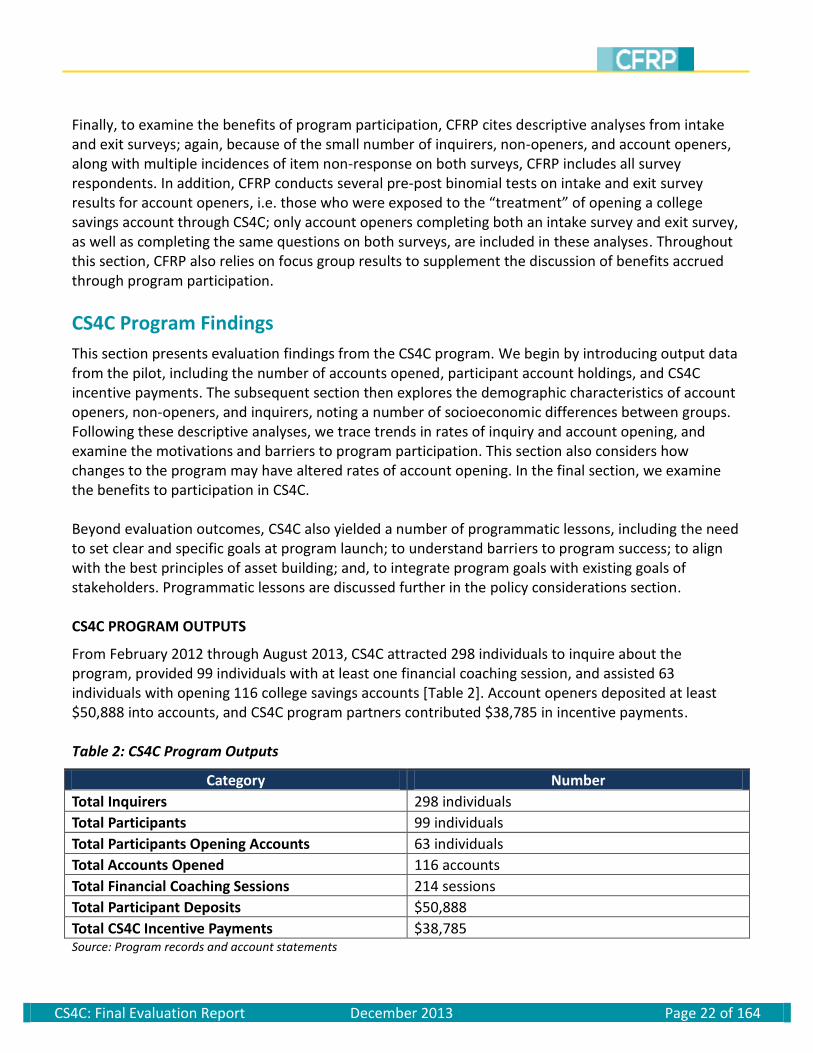
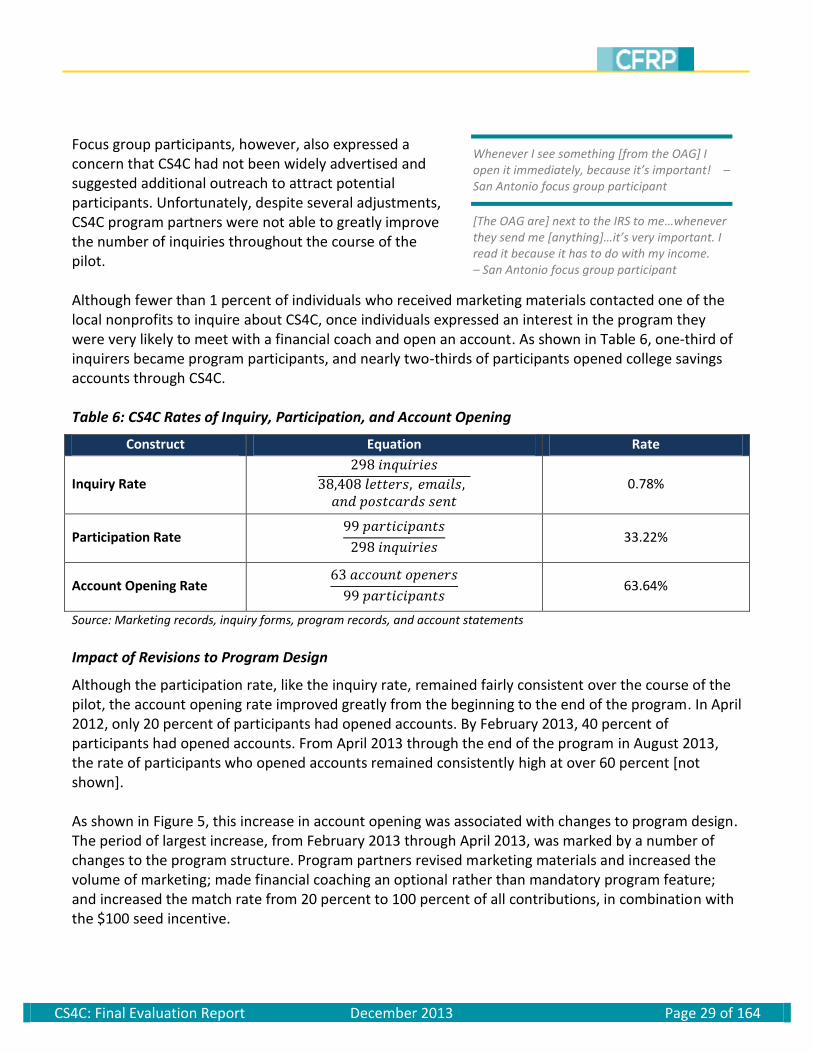
From February 2012 through August 2013, CS4C attracted 298 individuals to inquire about the program, provided 99 individuals with at least one financial coaching session, and assisted 63 individuals with opening 116 college savings accounts [Table 2]. Account openers deposited at least $50,888 into accounts, and CS4C program partners contributed $38,785 in incentive payments. Table 2: CS4C Program Outputs
Category Number
Total Inquirers 298 individuals
Total Participants 99 individuals
Total Participants Opening Accounts 63 individuals
Total Accounts Opened 116 accounts
Total Financial Coaching Sessions 214 sessions
Total Participant Deposits $50,888
Total CS4C Incentive Payments $38,785 Source: Program records and account statements
CS4C: Final Evaluation Report December 2013 Page 23 of 164
Table 3 presents information on the amount of money contributed to participant accounts. Though the average initial deposit was $224, most participants deposited substantially less than this amount when opening an account through CS4C. In fact, the median initial deposit was just $25, the minimum amount required to open an account.f The median amount of total deposits made by participants was $425, the amount needed to maximize the savings matched incentives under the final program design. Exactly one quarter of accounts received deposits totaling more than $425, with some participants, especially those opening accounts early in the program, depositing substantially more than this amount. Nearly half of accounts (47 percent), however, received less than $425 in deposits, and nearly a quarter of accounts (24 percent) only received $25 in deposits. Table 3: CS4C Account Data
Final Account Balances $773.04 $925 $125 $3500 $89,673 Source: Account statements and contribution records Note: Initial deposits based on first known deposit from participant.
Because the CS4C program did not track participant deposits once account openers achieved the maximum match, it is difficult to know the amount participant deposited to their accounts after meeting this maximum. Exit survey results suggest most participants plan to continue making regular deposits to their accounts. The CS4C program itself distributed an average of $334 in incentives to each account, though slightly more than half of accounts (52 percent) received a total of $500 in incentives—the maximum savings match. Another quarter of accounts (26%) received exactly $100 in incentives, indicating that participants only received the initial seed incentive. The other quarter of accounts received incentive amounts varying between $105 and $495. These results suggest that participants were very responsive to match limits: half contributed enough to receive the $500 match. Nearly one-quarter of participants, however, deposited only enough to receive the seed incentive. These participants may have been less responsive to the match limit because they did not have enough funds to deposit more than $25.
fThroughout this section, CFRP discusses participant deposits into accounts. Participants could open multiple accounts (one
for each child), and many of them took advantage of this policy. However, all discussion should be interpreted as happening
at the account-level.
CS4C: Final Evaluation Report December 2013 Page 24 of 164
DEMOGRAPHIC CHARACTERISTICS
Table 4 below presents demographic characteristics of inquirers, non-openers, and account openers. These three groups are markedly similar on some demographic characteristics, but differ substantially on others. Members of all three groups are likely to be female and Hispanic; approximately 9 out of 10 are female, and nearly two-thirds are Hispanic. Account openers are slightly less likely to be Hispanic, though this difference does not reach statistical significance. Account openers differ greatly from both inquirers and non-openers on several demographic and socioeconomic characteristics, however. Account openers are significantly less likely than non-openers to be married, and significantly more likely than both inquirers and non-openers to be divorced. In fact, account openers are roughly twice as likely to be divorced as those who only inquired about CS4C. Table 4: Selected Demographic Characteristics
Inquirers Non-Openers Account Openers Total
N=45 N=30 N=57 N=132
Gender
Male 6.7% 10.0% 10.5% 9.1%
Female 93.3% 90.0% 89.5% 90.9%
Race
Hispanic 66.7% 70.0% 57.9% 66.7%
Black 13.3% 10.0% 17.5% 13.3%
Other 0.0% 3.3% 3.5% 0.0%
White 20.0% 16.7% 21.1% 20.0%
Marital Status
Never Married 31.1%b 13.3%a 31.6% 27.3%
Married 28.9% 36.7%a 17.5% 25.8%
Separated 13.3%a 16.7%a 3.5% 9.8%
Divorced 24.4%a 33.3%a 47.4% 36.4%
Widowed 2.2% 0.0% 0.0% 0.8%
Education Level
Less than High School 11.1%a 10.0%a
0.0% 6.1%
High School Diploma/GED 17.8% 16.7% 8.8% 13.6%
Some College 37.8% 46.7% 36.8% 39.4%
2-Year Degree 13.3% 6.7% 14.0% 12.1%
4-Year Degree or More 20.0%a 20.0%a
40.4% 28.8%
Completed Your Own Education Goals
No 82.2%a 80.0%a
56.1% 70.5%
Yes 17.8%a 20.0%a
43.9% 29.5% Source: CS4C intake and exit survey results a
Significantly different from account openers (p≤0.05) b
Significantly different from non-openers (p≤0.05)
CS4C: Final Evaluation Report December 2013 Page 25 of 164
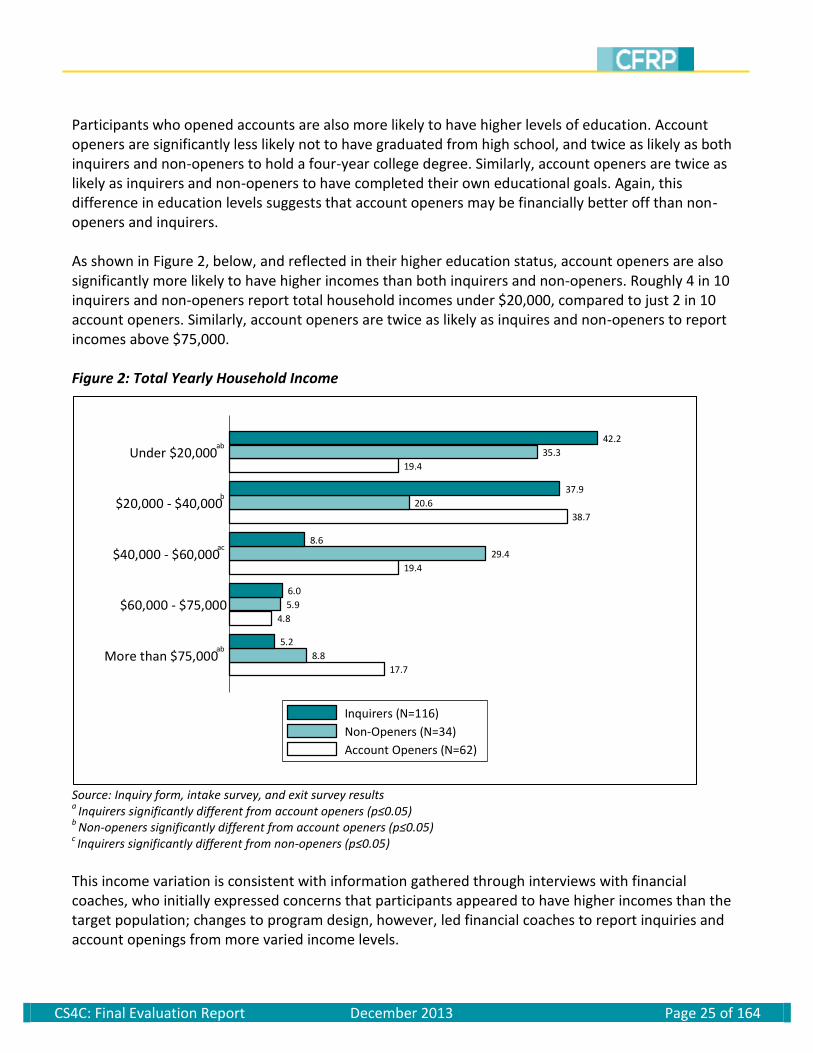
Participants who opened accounts are also more likely to have higher levels of education. Account openers are significantly less likely not to have graduated from high school, and twice as likely as both inquirers and non-openers to hold a four-year college degree. Similarly, account openers are twice as likely as inquirers and non-openers to have completed their own educational goals. Again, this difference in education levels suggests that account openers may be financially better off than non-openers and inquirers. As shown in Figure 2, below, and reflected in their higher education status, account openers are also significantly more likely to have higher incomes than both inquirers and non-openers. Roughly 4 in 10 inquirers and non-openers report total household incomes under $20,000, compared to just 2 in 10 account openers. Similarly, account openers are twice as likely as inquires and non-openers to report incomes above $75,000. Figure 2: Total Yearly Household Income
Source: Inquiry form, intake survey, and exit survey results a
Inquirers significantly different from account openers (p≤0.05) b
Non-openers significantly different from account openers (p≤0.05) c Inquirers significantly different from non-openers (p≤0.05)
This income variation is consistent with information gathered through interviews with financial coaches, who initially expressed concerns that participants appeared to have higher incomes than the target population; changes to program design, however, led financial coaches to report inquiries and account openings from more varied income levels.
17.7
8.8
5.2
4.8
5.9
6.0
19.4
29.4
8.6
38.7
20.6
37.9
19.4
35.3
42.2
More than $75,000ab
$60,000 - $75,000
$40,000 - $60,000ac
$20,000 - $40,000b
Under $20,000ab
Inquirers (N=116)
Non-Openers (N=34)
Account Openers (N=62)
CS4C: Final Evaluation Report December 2013 Page 26 of 164
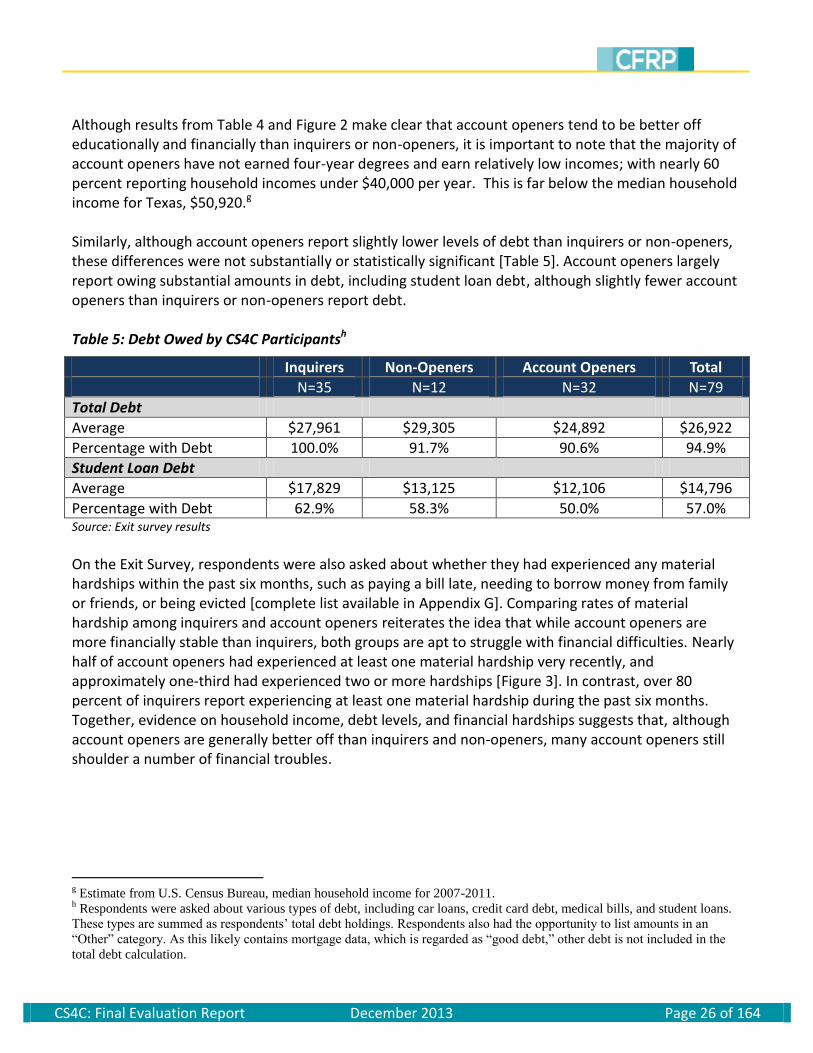
Although results from Table 4 and Figure 2 make clear that account openers tend to be better off educationally and financially than inquirers or non-openers, it is important to note that the majority of account openers have not earned four-year degrees and earn relatively low incomes; with nearly 60 percent reporting household incomes under $40,000 per year. This is far below the median household income for Texas, $50,920.g Similarly, although account openers report slightly lower levels of debt than inquirers or non-openers, these differences were not substantially or statistically significant [Table 5]. Account openers largely report owing substantial amounts in debt, including student loan debt, although slightly fewer account openers than inquirers or non-openers report debt. Table 5: Debt Owed by CS4C Participantsh
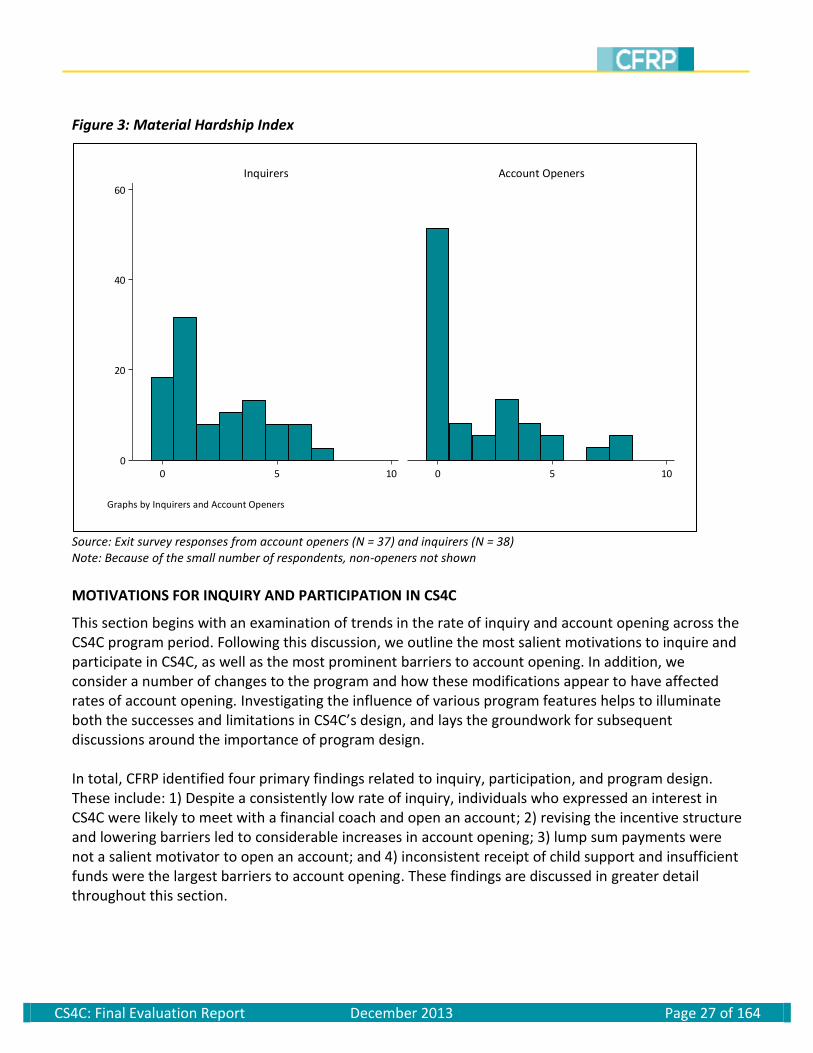
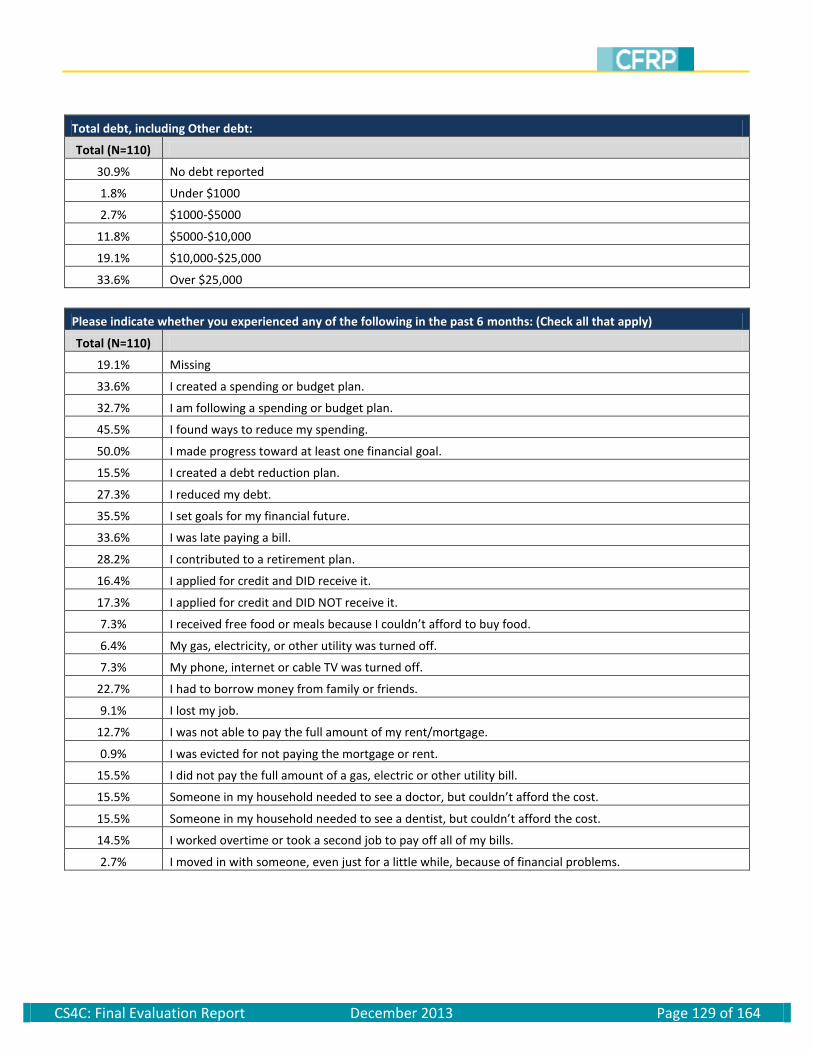
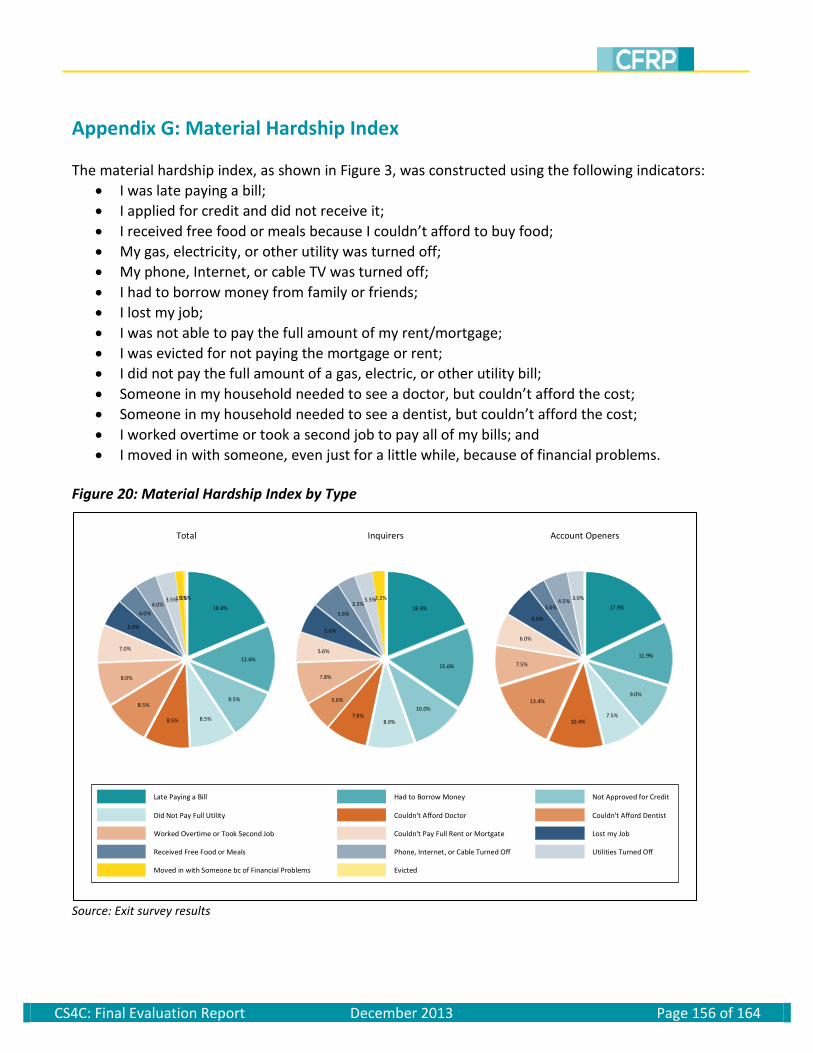
On the Exit Survey, respondents were also asked about whether they had experienced any material hardships within the past six months, such as paying a bill late, needing to borrow money from family or friends, or being evicted [complete list available in Appendix G]. Comparing rates of material hardship among inquirers and account openers reiterates the idea that while account openers are more financially stable than inquirers, both groups are apt to struggle with financial difficulties. Nearly half of account openers had experienced at least one material hardship very recently, and approximately one-third had experienced two or more hardships [Figure 3]. In contrast, over 80 percent of inquirers report experiencing at least one material hardship during the past six months. Together, evidence on household income, debt levels, and financial hardships suggests that, although account openers are generally better off than inquirers and non-openers, many account openers still shoulder a number of financial troubles.
g Estimate from U.S. Census Bureau, median household income for 2007-2011.
h Respondents were asked about various types of debt, including car loans, credit card debt, medical bills, and student loans.
These types are summed as respondents’ total debt holdings. Respondents also had the opportunity to list amounts in an
“Other” category. As this likely contains mortgage data, which is regarded as “good debt,” other debt is not included in the
total debt calculation.
CS4C: Final Evaluation Report December 2013 Page 27 of 164
Figure 3: Material Hardship Index
Source: Exit survey responses from account openers (N = 37) and inquirers (N = 38) Note: Because of the small number of respondents, non-openers not shown
MOTIVATIONS FOR INQUIRY AND PARTICIPATION IN CS4C
This section begins with an examination of trends in the rate of inquiry and account opening across the CS4C program period. Following this discussion, we outline the most salient motivations to inquire and participate in CS4C, as well as the most prominent barriers to account opening. In addition, we consider a number of changes to the program and how these modifications appear to have affected rates of account opening. Investigating the influence of various program features helps to illuminate both the successes and limitations in CS4C’s design, and lays the groundwork for subsequent discussions around the importance of program design. In total, CFRP identified four primary findings related to inquiry, participation, and program design. These include: 1) Despite a consistently low rate of inquiry, individuals who expressed an interest in CS4C were likely to meet with a financial coach and open an account; 2) revising the incentive structure and lowering barriers led to considerable increases in account opening; 3) lump sum payments were not a salient motivator to open an account; and 4) inconsistent receipt of child support and insufficient funds were the largest barriers to account opening. These findings are discussed in greater detail throughout this section.
0
20
40
60
0 5 10 0 5 10
Inquirers Account Openers
Pe
rce
nt
Graphs by Inquirers and Account Openers
CS4C: Final Evaluation Report December 2013 Page 28 of 164
Inquiry, Intake, and Account Opening Rates
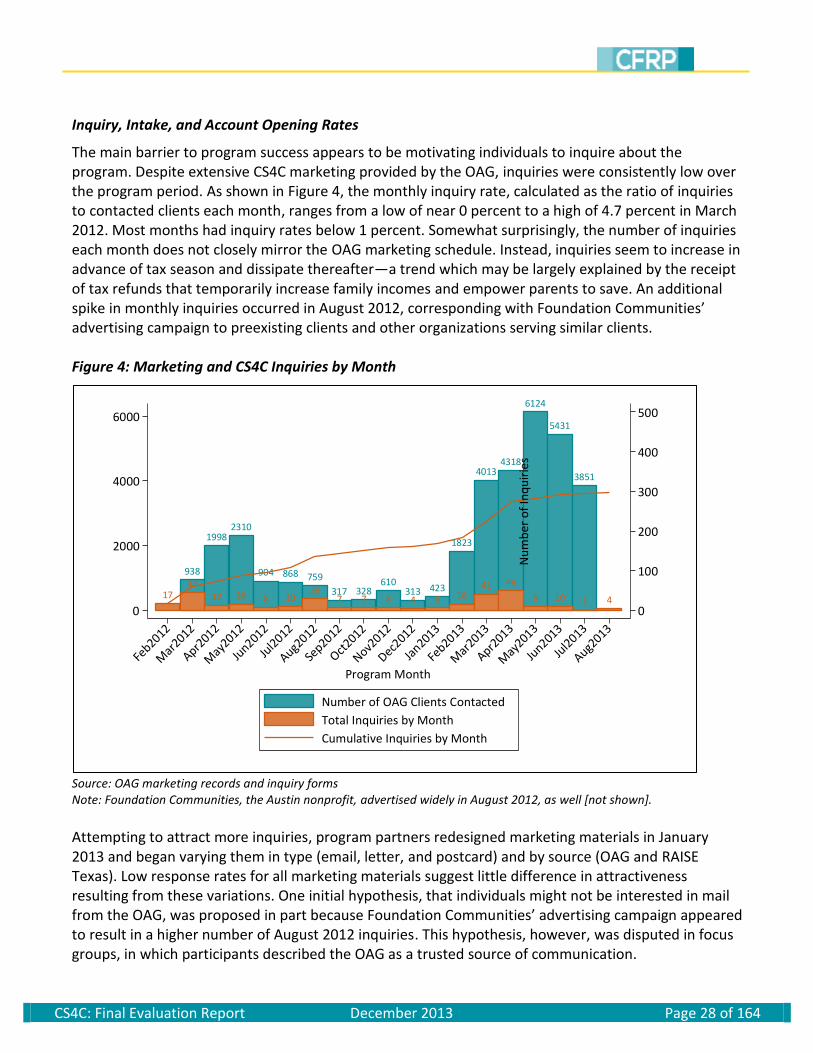
The main barrier to program success appears to be motivating individuals to inquire about the program. Despite extensive CS4C marketing provided by the OAG, inquiries were consistently low over the program period. As shown in Figure 4, the monthly inquiry rate, calculated as the ratio of inquiries to contacted clients each month, ranges from a low of near 0 percent to a high of 4.7 percent in March 2012. Most months had inquiry rates below 1 percent. Somewhat surprisingly, the number of inquiries each month does not closely mirror the OAG marketing schedule. Instead, inquiries seem to increase in advance of tax season and dissipate thereafter—a trend which may be largely explained by the receipt of tax refunds that temporarily increase family incomes and empower parents to save. An additional spike in monthly inquiries occurred in August 2012, corresponding with Foundation Communities’ advertising campaign to preexisting clients and other organizations serving similar clients. Figure 4: Marketing and CS4C Inquiries by Month
Source: OAG marketing records and inquiry forms Note: Foundation Communities, the Austin nonprofit, advertised widely in August 2012, as well [not shown].
Attempting to attract more inquiries, program partners redesigned marketing materials in January 2013 and began varying them in type (email, letter, and postcard) and by source (OAG and RAISE Texas). Low response rates for all marketing materials suggest little difference in attractiveness resulting from these variations. One initial hypothesis, that individuals might not be interested in mail from the OAG, was proposed in part because Foundation Communities’ advertising campaign appeared to result in a higher number of August 2012 inquiries. This hypothesis, however, was disputed in focus groups, in which participants described the OAG as a trusted source of communication.
938
19982310
904 868 759
317 328610
313 423
1823
40134318
6124
5431
3851
1744
12 16 8 1029
7 7 8 4 6 1641 49
9 10 1 40
100
200
300
400
500
Nu
mb
er
of
Inq
uir
ies
0
2000
4000
6000
Nu
mb
er
of
OA
G C
lien
ts C
on
tact
ed
Feb2012
Mar
2012
Apr2012
May
2012
Jun2012
Jul2
012
Aug2012
Sep2012
Oct2012
Nov2012
Dec2012
Jan2013
Feb2013
Mar
2013
Apr2013
May
2013
Jun2013
Jul2
013
Aug2013
Program Month
Number of OAG Clients Contacted
Total Inquiries by Month
Cumulative Inquiries by Month
CS4C: Final Evaluation Report December 2013 Page 29 of 164
Whenever I see something [from the OAG] I open it immediately, because it’s important! – San Antonio focus group participant
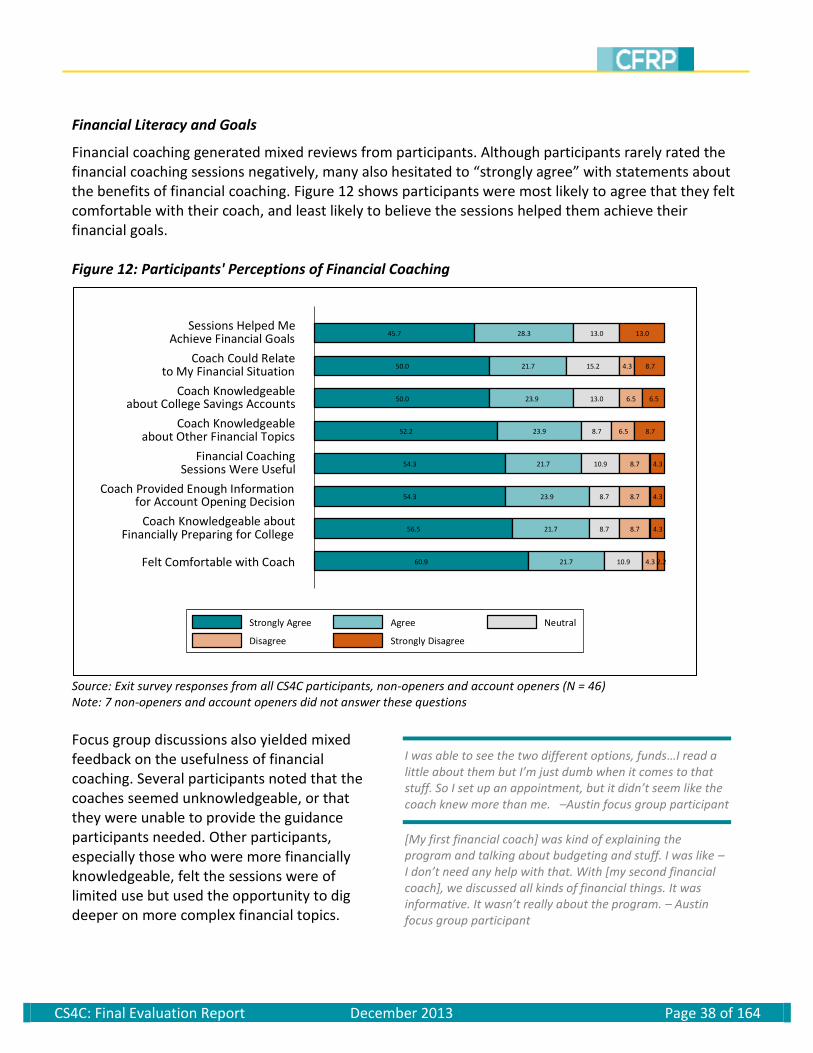
[The OAG are] next to the IRS to me…whenever they send me [anything]…it’s very important. I read it because it has to do with my income. – San Antonio focus group participant
Focus group participants, however, also expressed a concern that CS4C had not been widely advertised and suggested additional outreach to attract potential participants. Unfortunately, despite several adjustments, CS4C program partners were not able to greatly improve the number of inquiries throughout the course of the pilot. Although fewer than 1 percent of individuals who received marketing materials contacted one of the local nonprofits to inquire about CS4C, once individuals expressed an interest in the program they were very likely to meet with a financial coach and open an account. As shown in Table 6, one-third of inquirers became program participants, and nearly two-thirds of participants opened college savings accounts through CS4C. Table 6: CS4C Rates of Inquiry, Participation, and Account Opening
Construct Equation Rate
Inquiry Rate
0.78%
Participation Rate
33.22%
Account Opening Rate
63.64%
Source: Marketing records, inquiry forms, program records, and account statements
Impact of Revisions to Program Design
Although the participation rate, like the inquiry rate, remained fairly consistent over the course of the pilot, the account opening rate improved greatly from the beginning to the end of the program. In April 2012, only 20 percent of participants had opened accounts. By February 2013, 40 percent of participants had opened accounts. From April 2013 through the end of the program in August 2013, the rate of participants who opened accounts remained consistently high at over 60 percent [not shown]. As shown in Figure 5, this increase in account opening was associated with changes to program design. The period of largest increase, from February 2013 through April 2013, was marked by a number of changes to the program structure. Program partners revised marketing materials and increased the volume of marketing; made financial coaching an optional rather than mandatory program feature; and increased the match rate from 20 percent to 100 percent of all contributions, in combination with the $100 seed incentive.
CS4C: Final Evaluation Report December 2013 Page 30 of 164
Two additional factors may have contributed to the increase in accounts being opened during this time. First, the surge in accounts in April coincides with tax season; a time when prospective participants may have been more likely to receive lump sums due to tax refunds or tax intercepts, in which the tax refunds of noncustodial parents who owe child support are intercepted and distributed to custodial parents or the state child support agency. Second, program partners expected the program to end in April 2013 and warned participants of this deadline. Due to these external factors, it is difficult to attribute the increase in accounts to changes in program design with any statistical confidence. Figure 5: CS4C Accounts Opened by Month
Source: Account statements
Because program partners made considerable and varied changes to the program design and execution over this period, the exact cause of the increase in accounts opened cannot be isolated. Results in Figure 6 which illustrate the length of time between inquiry and account opening suggest that this increase resulted from changes to the incentive structure and financial coaching requirements, rather than changes to marketing. Although a few account openers who inquired about CS4C before February 1, 2013 opened accounts immediately, the majority waited a month or more before opening an account. The majority of account openers who inquired about the
116
1 2 0 0 1 2 2
8 7
03
10
21
37
3 3 3
13
Outreach:Lump SumRecipients
Financial Coaching:3 Required
Incentives:20% Initial Match10% Later Match
(to $500)
Outreach:Lump SumRecipients
Financial Coaching:4 Required
Incentives:20% Match
On All Deposits(to $500)
Outreach:Lump SumRecipients
Financial Coaching:4 Required
Incentives:$100 Seed
Plus 20% Match(to $400)
Outreach:Lump SumRecipients
Financial Coaching:Optional
Incentives:$100 Seed
Plus 100% Match(to $400)
Outreach:Consistent
Child Support
Financial Coaching:Optional
Incentives:$100 Seed
Plus 100% Match(to $400)
0
20
40
60
80
100
120
To
tal A
cco
un
ts
Mar
2012
Apr2012
May
2012
Jun2012
Jul2
012
Aug2012
Sep2012
Oct2012
Nov2012
Dec2012
Jan2013
Feb2013
Mar
2013
Apr2013
May
2013
Jun2013
Jul2
013
Aug2013
Month and Year
[My financial coach] told me about the program, but it was too much money at the beginning. I was like, I don’t have that. So we just did the financial coaching. Then [my financial coach] told me last month that [the program partners] had decided to play with the money now… So I just opened my first one and I’ve just been putting in whatever I can. – San Antonio focus group participant
CS4C: Final Evaluation Report December 2013 Page 31 of 164
I wouldn’t have done it without that little incentive. I’ve been able to save up a lot. You think you can’t do it – but I’ve done it. – Austin focus group participant
program after February 1, 2013 opened an account within a few days of inquiry. These results suggest that account opening became more attractive after February 1, 2013. Focus group discussions corroborate these findings. In both Austin and San Antonio, participants contended that changes to the incentive structure played a significant role in motivating them to open accounts. Figure 6: Time Between Inquiry and Account Opening
Source: Inquiry forms and account statements Note: Weighted by number of accounts opened
CFRP also examined the relative frequency of total deposits made by CS4C account openers in an effort to understand how revisions to the incentive structure may have affected deposit amounts.i Figure 7 shows that participants were most likely to deposit the amount necessary to receive the maximum match of $500 ($425). The next largest group of participants, however, only deposited $25 into their accounts, enough to receive the $100 seed incentive.
i As noted previously, account openers were not required to submit final deposit amounts to CFRP. As a result, reported
deposits are unlikely to reflect total participant contributions into college savings accounts since individual contributions
made after reaching the maximum match are not tracked by the program.
0
100
200
300
400
Len
gth
Be
twe
en
Inq
uir
y an
d A
cco
un
t O
pe
nin
g in
Day
s
01feb2012
01mar
2012
01apr2
012
01may
2012
01jun2012
01jul2
012
01aug2
012
01sep2012
01oct2012
01nov2012
01dec2012
01jan2013
01feb2013
01mar
2013
01apr2
013
01may
2013
01jun2013
01jul2
013
01aug2
013
01sep2013
Inquiry Dates
CS4C: Final Evaluation Report December 2013 Page 32 of 164
It was the “we’ll match $100 for your $100” that really caught my eye. – Austin focus group participant
Introducing the seed incentive appears to have motivated potential participants who were “on the fence” or unable to deposit the large amount of money initially required to receive a meaningful match. Following the introduction of the $100 seed, average deposit amounts decreased while the proportion of low-income account openers increased [not shown]; these trends suggests the $100 seed may have acted as a catalyst to bring in more disadvantaged participants, providing a large and immediate incentive of $100 to open the account with a $25 initial deposit. The influence of the $100 seed incentive was reiterated by program partners, who noted that this particular change to the incentive structure appeared to play a prominent role in motivating inquirers to open accounts. Figure 7: CS4C Deposits Compared with Incentive Amounts
Source: Account statements and contribution records. Note: Estimates weighted by number of accounts; participants’ deposits were matched up to $500.
0
100
200
300
400
500
600
CS4
C In
cen
tive
s P
rovi
de
d b
y P
rogr
am
0$25
$26-$100
$101-$200
$201-$300
$301-$424
$425
$426-$500
$501-$1000
$1001-$2000
$2001-$3000
Deposits Made by CS4C Account Openers
CS4C: Final Evaluation Report December 2013 Page 33 of 164
Motivations to Open Accounts
Individuals were drawn to CS4C for several fundamental reasons. In both focus groups and on the exit survey, the most cited motivations revolved around program incentives and parents’ desire for their children to pursue higher education [not shown]. In identifying the reasons for opening a college savings account, account openers pointed to similar motivations, as shown in Figure 8 Figure 8: Motivations to Open Accounts
Source: Exit survey responses from account openers (N = 38)
In contrast, few individuals were motivated to participate in CS4C or open an account by free financial coaching, and even fewer were motivated by the expected receipt of a lump sum payment. The last result was surprising because CS4C was intended to capitalize on the “windfall” moment associated with the receipt of lump sum payments. To explore this finding further, CFRP analyzed administrative records to determine the prevalence of lump sum child support payments for those who expressed an interest in CS4C. Figure 9 confirms that the majority of CS4C inquirers and participants received a larger-than-expected child support payment sometime during CS4C’s program period; for the months shown in green, noncustodial parents of CS4C inquirers paid $200 or more than their child support obligation. For the
84.2 2.62.6 10.5
84.2 2.62.6 10.5
81.6 5.3 13.2
68.4 5.3 13.2 2.62.6 7.9
63.2 13.2 10.5 2.6 10.5
55.3 10.5 15.8 2.65.3 10.5
50.0 15.8 7.9 5.3 10.5 10.5
23.7 5.3 10.5 10.5 39.5 10.5
Saving for My Child's Education Is Important
To Be Active in Helping My Child Pursue College
Matched Contributions
To Give My Children Different Opportunities
Accounts Are Good Investment Choices
Financial Coaching Sessions
CS4C Gave Me a Push to Save
Lump Sum Child Support Payment
Strongly Agree Agree Neutral
Disagree Strongly Disagree Missing
[I wanted] to give one of my kids the opportunity to go technical school or college. – San Antonio focus group participant
This is actually something I’ve been looking into –– didn’t really know how to quite get it started for [my daughter]. Grants were available when I went to school, but I’m not sure if that’ll be the case for [my daughter]. So I wanted to make sure she’ll have the funds that are available for her to go to school. – San Antonio focus group participant
CS4C: Final Evaluation Report December 2013 Page 34 of 164
majority of months, however, most individuals received less than the full amount of their expected payment, as shown in orange. For a plurality of CS4C inquirers and participants, the default state is one of inconsistent child support. Only 6 percent received either more than or exactly the amount of their child support obligation for all 19 months; over twice as many, 13 percent, received less than their full child support obligation for all 19 months. Interestingly, many individuals had both green and orange months, meaning noncustodial parents paid $200 or more than their obligation at least one month but less than their obligation other months. Figure 9: Receipt of Child Support Obligation over CS4C Time Periodjk
Source: Texas child support records on all inquirers and participants (N = 215) Note: From February 2012 through August 2013; each bar represents an inquirer or participant
Moreover, even when custodial parents do receive more than their expected payment, the amount is rarely the “windfall” that program partners predicted. As shown in Figure 9, CS4C inquirers are more apt to receive arrears payments of less than $200 than they are to receive large lump sums.
j An NCP paying the approximate obligation paid from $0-$199 towards the child support obligation that month.
k Child support administrative data contains records on monthly obligations of noncustodial parents (NCPs), as well as
information on the total amount paid per month. For this graph, obligations include child support, child support arrears,
medical support, and medical support arrears monthly obligations. One limitation is that child support records do not list
obligations in terms of what is owed monthly to custodial parents, although payments are split between custodial parents and
the state. Therefore, some custodial parents may not be expecting the full obligation.
123456789
10111213141516171819
Nu
mb
er
of
Mo
nth
s (f
rom
2/1
2 t
hro
ugh
8/1
3)
CS4C Inquirers (Each Bar Represents an Individual)
NCP Paid $200 More Than Obligation NCP Paid Approximate Obligation
NCP Paid Less Than Obligation
CS4C: Final Evaluation Report December 2013 Page 35 of 164
Data showing the volatility and inadequacy of child support receipt reflects a common refrain heard in CS4C focus groups as well. Participants in San Antonio and Austin recounted routine experiences with scarce and unpredictable support; a financial uncertainty that failed to provide the impulse to open a college savings account. Barriers to Account Opening
These results also align with respondents’ reports of barriers to CS4C participation and opening college savings accounts. When asked about what prevented them from participating in CS4C or opening a college savings account, inquirers and non-openers report the primary barriers as a lack of funds and not receiving child support consistently [Figure 10].
Local nonprofits reiterated this idea, noting that many prospective participants wanted to participate but did not have the money to do so. In some cases, financial coaches described participants making sacrifices to save the initial $25 to open an account. In focus groups, participants also discussed having to “go without things” in order to open an account, but felt that these sacrifices were worth it.
Figure 10: Reasons Individuals Did Not Open Accounts
Source: Exit survey responses from inquirers and non-openers (N = 72)
Changes to program design and execution cannot address the most pervasive barriers to account opening—lack of revenue and inconsistent receipt of child support. Inquirers and non-openers identified several smaller barriers to account opening, however, that can be addressed through changes to the program. These barriers, as shown in Figure 10, are mandatory financial coaching, confusion about program requirements, and concerns about the savings vehicle.
9.7
9.7
13.9
15.3
27.8
37.5
Worried About Accessing Money
Not the Right Investment
Did Not Understand CS4C
No Time for Financial Coaching
Not Receiving Child Support Consistently
Not Enough Money to Open Account
CS4C: Final Evaluation Report December 2013 Page 36 of 164
Focus group discussions also exposed concerns about CS4C investment options and savings vehicles. The question of whether the 529 plan was a good investment choice was compounded by confusion about how college savings accounts work. In Austin, focus group participants appeared to have conflicting information about the impact of 529 holdings on taxes, financial aid, and scholarships, prompting some participants to begin looking up information on their phones.
Though concerns over the savings vehicle appeared to be troublesome for some focus group participants, others expressed enthusiasm about specific features of the 529 plan. Several focus group participants in San Antonio, for example, noted the advantages of saving in a vehicle with restrictions on access and usage.
BENEFITS OF PARTICIPATION
CFRP examined four potential benefits of the CS4C program, including: 1) changes in the proportion of participants saving for college, 2) changes in financial literacy and goals, 3) psychological benefits associated with saving for college, and 4) college financial planning. This section uses intake and exit survey data, as well as qualitative data collected through focus groups, to consider whether participants derived benefits from the CS4C program in each of these areas. Saving for College
One of the primary goals of CS4C was to help parents initiate the process of saving for college. Comparisons between participant responses on the intake and exit surveys show that CS4C significantly increased the number of account openers who are actively saving for their children’s college education. As shown in Figure 11, over twice as many account openers report saving for college after participating in CS4C.
When I went to talk to the [financial coaches], they didn’t have a lot of information. I was wondering: was it a good investment or was it a good investment to do something else, like gold or silver? What if they don’t go to school there? There were too many restrictions. – Austin focus group participant
I signed up and I put $100 in and then stopped because I'm afraid that that's going to go against her as far as getting scholarships. – Austin focus group participant
[I opened the account] because I wasn’t saving any money for my son’s education to begin with….I thought I’ve got to do something. – San Antonio focus group participant
Financially, one of my issues is I’ll put money into savings but then I eventually end up going into it. This is different than just putting money in my savings account – this is specifically for her education and I know I’m not going to touch it. I think it’s more productive for me to do it this way. – San Antonio focus group participant
The penalty thing is just awesome. – San Antonio focus group participant
CS4C: Final Evaluation Report December 2013 Page 37 of 164
Figure 11: Changes in Behaviors and Attitudes about Preparations for Child’s Higher Education
Source: Intake and exit survey responses from account openers with answers for both surveys (N = 34) Note: Exit Survey responses for account openers who have begun saving for college should be 100%. *
Exit survey responses significantly different from intake survey responses (p≤0.05)
A number of focus group participants also described CS4C as their first foray into saving for college. Many noted that they had long recognized the need to save for college, but had failed to take action until now. Some expressed regret at not having started a college savings account sooner, and even congratulated others in the room who had begun the process of saving while their children were still young.
94.1
85.3
88.2
79.4
85.3
76.5
85.3
41.2
Talk to My Children About College
Confident Children Will Graduate from College
Confident Children Will Go to College
Began Saving for College*
Intake Survey Exit Survey
I should have done it a while back. – San Antonio focus group participant
I never looked into it really until now. I could kick myself. – San Antonio focus group participant
CS4C: Final Evaluation Report December 2013 Page 38 of 164
Financial Literacy and Goals
Financial coaching generated mixed reviews from participants. Although participants rarely rated the financial coaching sessions negatively, many also hesitated to “strongly agree” with statements about the benefits of financial coaching. Figure 12 shows participants were most likely to agree that they felt comfortable with their coach, and least likely to believe the sessions helped them achieve their financial goals. Figure 12: Participants' Perceptions of Financial Coaching
Source: Exit survey responses from all CS4C participants, non-openers and account openers (N = 46) Note: 7 non-openers and account openers did not answer these questions
Focus group discussions also yielded mixed feedback on the usefulness of financial coaching. Several participants noted that the coaches seemed unknowledgeable, or that they were unable to provide the guidance participants needed. Other participants, especially those who were more financially knowledgeable, felt the sessions were of limited use but used the opportunity to dig deeper on more complex financial topics.
60.9 21.7 10.9 4.3 2.2
56.5 21.7 8.7 8.7 4.3
54.3 23.9 8.7 8.7 4.3
54.3 21.7 10.9 8.7 4.3
52.2 23.9 8.7 6.5 8.7
50.0 23.9 13.0 6.5 6.5
50.0 21.7 15.2 4.3 8.7
45.7 28.3 13.0 13.0
Felt Comfortable with Coach
Coach Knowledgeable aboutFinancially Preparing for College
I was able to see the two different options, funds…I read a little about them but I’m just dumb when it comes to that stuff. So I set up an appointment, but it didn’t seem like the coach knew more than me. –Austin focus group participant
[My first financial coach] was kind of explaining the program and talking about budgeting and stuff. I was like – I don’t need any help with that. With [my second financial coach], we discussed all kinds of financial things. It was informative. It wasn’t really about the program. – Austin focus group participant
CS4C: Final Evaluation Report December 2013 Page 39 of 164
One of the biggest incentives is—for someone like myself who doesn’t know a lot about the funds—we look at these funds and are like ‘we need to go a financial advisor like Morgan Stanley or someone. But then when you approach those places you feel like you can’t just have $25 to open. I need knowledge and I need help because I don’t know what to do. A lot of times it’s very intimidating and it stops us in the tracks of doing anything. But when something like this became available…one-on-one, everything explained. It was easier than you anticipated it to be. You didn’t feel the pressure of coming up with $1000. – San Antonio focus group participant
Other focus group participants, particularly those in San Antonio, saw financial coaching as a valuable and influential part of the program. Several participants noted that financial coaching was instrumental in motivating them to participate, as well as helping them to understand the program.
Another common sentiment in the San Antonio focus group was the importance of having a financial coach you could feel comfortable with. Participants expressed an appreciation for the financial coach’s “caring” and non-judgmental outlook, which many saw as a key element in their decision to participate. From a programmatic perspective, there is also some evidence to suggest financial coaching was of varying use to participants. Program partners initially required account openers to complete four financial coaching sessions to receive matched incentives; during this period, some participants went on to receive as many as 6 sessions, which suggests that these participants viewed financial coaching as a program benefit instead of merely a requirement. Once program partners made financial coaching requirements optional, however, many account openers completed only one financial coaching session, which suggests that some participants viewed financial coaching only as a program requirement, not a benefit.
CS4C: Final Evaluation Report December 2013 Page 40 of 164
Participants also reported few changes in financial behaviors. Although program partners had hoped that financial coaching, combined with the focus on opening college savings accounts, would inspire individuals to open bank accounts or begin saving for other purposes, participants did not report such changes [Figure 13]. Most participants held bank accounts at program entry, and the proportion of participants contributing regularly to a savings account declined from program entry to program exit. Figure 13: Bank Status
Source: Intake and exit survey responses from participants with answers on both surveys, (N = 50) *
Exit survey responses significantly different from intake survey responses (p≤0.05)
Financial coaching may have increased participants’ knowledge of college savings accounts, however. To explore this possibility, CFRP designed two quizzes to test participants’ understanding of the Texas College Savings Plan (529) and the Texas Tuition Promise Fund (TTPF). These short quizzes were administered in the exit survey to account openers, non-openers, and inquirers. Figure 14 and Figure 15 show account openers are consistently more knowledgeable than inquirers and non-openers on questions related to specific features of the two college savings accounts. Though this difference might be attributed to knowledge gained through the program’s financial coaching sessions, it is also possible that the difference is due to selection—that is, a pre-existing difference in financial knowledge between those chose to open accounts and those who did not. Because the intake survey did not include similar questions about college savings accounts, it is difficult to know whether account-openers’ financial literacy improved from program entry to program exit or whether they simply had stronger understandings of college savings accounts to begin with. Given the profound difference in account knowledge between those who opened accounts and those who did not,
40.0
48.0
86.0
84.0
100.0
96.0
Saves Regularly
Owns Savings Account
Owns Checking Account
Intake Survey Exit Survey
CS4C: Final Evaluation Report December 2013 Page 41 of 164
however, it is reasonable to conclude that account openers may have achieved nontrivial gains in financial literacy from program participation. Figure 14: Questions about Texas College Savings Accounts
Source: Exit survey responses for all inquirers, non-openers, and account openers answering all questions Note: Percent of respondents answering correctly, with correct answers shown; non-openers shown for comparison purposes only *
Responses from inquirers significantly different from responses from account openers (p≤0.05)
32.433.3
16.7
81.158.3
38.9
48.616.7
5.6
48.625.0
5.6
75.766.7
19.4
75.725.0
19.4
73.016.716.7
75.758.3
38.9
For financial aid eligibility, an accountis counted as a parent asset. (TRUE)*
My child can use funds for educationat any accredited U.S. college. (TRUE)*
The minimum contribution requiredto open an account is $100. (FALSE)*
The money I invest can only beused for tuition expenses. (FALSE)*
The money is lost if my child doesnot pursue higher education. (FALSE)*
There are several options for how riskyI want my investments to be. (TRUE)*
These accounts invest money in thestock market, which can be risky. (TRUE)*
These accounts offer a tax-advantagedway to save for higher education. (TRUE)*
CS4C: Final Evaluation Report December 2013 Page 42 of 164
Figure 15: Questions about Texas Tuition Promise Fund Accounts
Source: Exit survey responses for all inquirers, non-openers, and account openers answering all questions Note: Percent of respondents answering correctly, with correct answers shown; non-openers shown for comparison purposes only *
Responses from inquirers significantly different from responses from account openers (p≤0.05)
Psychological Benefits to Saving for College
A number of recent studies have identified a psychological link between saving for college and future educational outcomes, even when only small amounts of money are saved.98 In one longitudinal study with extensive controls, children with low levels of designated college savings are significantly more likely to enroll in and graduate from college than children without savings.99 Researchers theorize this difference in educational outcomes is attributable to a psychological shift in the child’s concept of self. Drawing on identity-based motivation (IBM) theory, scholars contend that having designated college savings leads savers to adopt a “college-bound identity” in which the concept of college is seen not only as attainable, but as a presumed destination.100 Other experimental studies have shown that when students believe that paying for college is achievable, they increase the amount of time they plan to spend on homework and report higher grade expectations.101 In short, having assets set aside for college appears to affect a child’s outlook, expectations, and behavior related to future educational achievement.
67.641.7
36.1
29.725.0
5.6
40.525.0
16.7
70.325.0
36.1
62.241.7
30.6
32.48.3
16.7
51.433.3
11.1
Even if tuition rises significantly,prepaid units are locked in. (TRUE)*
I can enroll in the Texas Tuition PromiseFund at any time in the year. (FALSE)*
My child can apply credits at anout-of-state or private college. (TRUE)*
The TTPF allows account holders toprepay for tuition and fees. (TRUE)*
The TTPF offers a tax-advantagedway to save for higher ed. (TRUE)*
The money I invest cannot be used forroom and board or books. (TRUE)*
The money is lost if my child does notpursue higher education. (FALSE)*
CS4C: Final Evaluation Report December 2013 Page 43 of 164
Results from the CS4C pilot reinforce these findings. Data collected through exit surveys and focus groups demonstrate that parents believe their investment in college savings accounts, even if only a small amount, will greatly improve their children’s opportunities for higher education. Figure 16 shows account openers’ perceptions of future educational outcomes after participating in the CS4C program. Nearly 90 percent of account openers agreed that saving for college would help their children meet educational goals. Over three quarters of account openers agreed that having a college savings account will motivate their children to try harder in school and to pursue higher education; similar numbers felt opening the account will increase their child’s chances of going to college. Finally, the vast majority of account openers plan to continue making deposits into their college savings accounts opened through CS4C. Figure 16: Perceptions of Future Educational Outcomes
Source: Exit survey responses from account openers (N = 38)
The perception that having a college savings account will improve children’s opportunities for higher education was reinforced through focus groups and feedback from financial coaches at the local nonprofits. Parents repeatedly described how having a college savings account made them feel proud to be taking an active role in bettering their child’s future prospects.
63.2 13.2 7.9 2.6 5.3 7.9
63.2 13.2 21.1 2.6
60.5 13.2 21.1 2.62.6
57.9 15.8 10.5 2.6 5.3 7.9
81.6 5.3 5.3 5.3 2.6
I plan on making regulardeposits into the account
An account will motivate mychild to pursue higher education
An account will motivate mychild to try harder in school
Opening this account increased thechance my child will go to college
Saving for college will help mychild meet educational goals
Strongly Agree Agree Neutral
Disagree Strongly Disagree Missing
At first, I was hesitant to encourage these single moms to open college savings accounts given their overall financial picture. However, I soon discovered the enormous (emotional not necessarily rational) value in these moms having “something” set aside for college –even if barely enough to buy a textbook or two. – Austin Financial Coach
[CS4C helps me] to give my son the opportunity to get his foot in the door and make better choices than I did. – Austin focus group participant
This will increase the likelihood my kids will go to college. – Austin focus group participant
CS4C: Final Evaluation Report December 2013 Page 44 of 164
Many of these themes suggest the psychological benefits of saving for college may pass through a child’s parents, effectively remolding a child’s outlook and expectations for him or herself. Financial coaches also identified the psychological component to saving for college as one of the program’s key benefits. This benefit is not well-captured by outcome measures that focus solely on account balances, but appears to hold significant value for participants. Although most participants believe that saving for college will make their children more likely to attend college, it is important to note that nearly all of these parents expressed a belief that their children would attend college prior to participation in CS4C. Figure 17 shows over the course of the program, participants revised their educational goals away from a four-year degree and toward either a graduate degree or a 2-year-degree. In the aggregate however, the proportion of parents who expect their children to pursue some form of higher education remains essentially unchanged by the program. Interestingly, inquirers were even more optimistic that their children would achieve lofty educational goals than parents who participated in the program. Figure 17: Final Education Goals for Child(ren)
Source: Intake and exit survey responses Note: For ease of comparison and because of small numbers of respondents, results for non-openers are not shown; responses shown only for account holders with answers on both surveys
8.3 33.3 58.3
2.6 47.4 50.0
5.0 30.0 65.0
Account Openerson Exit Survey
(N=36)
Account Openerson Intake Survey
(N=36)
Inquirers onExit Survey
(N=40)
Graduate from High School or Earn a GED Earn a 2-Year Degree
Earn a 4 Year Degree Earn a Graduate Degree
Even if it’s starting out with $25, [it’s] helping [parents] understand the value, the importance of putting money away for your children’s education. – San Antonio focus group participant
My son sat in with me while I was with [the financial coach]. He knows exactly what I put aside for him – and we look at his account together. He knows the importance of what that money is for. – San Antonio focus group participant
CS4C: Final Evaluation Report December 2013 Page 45 of 164
Past literature has made some attempt to address this apparent discrepancy between widespread assertions of future college attendance and the sobering reality in which roughly one-third of youth who expect to attend a four-year college will not go.102 Studies suggest that low-income and minority children are especially likely to have expectations for college that never materialize.103 In seeking to explain this literature, some researchers have drawn a distinction between children who perceive themselves as “college-bound” and those who identify as “college-savers.” Though most parents agree that their children will attend college, this token affirmation may be less meaningful than the act of saving for college, which implies adopting an actionable strategy that may be more likely to lead to tangible outcomes.104 College Financial Planning
There is also some evidence to suggest that opening an account through CS4C may have altered participants’ perspectives on what is involved in paying for college. Roughly 9 in 10 account openers felt that CS4C helped them make a realistic plan for their child’s educational future [not shown]. This heightened realism is reflected in Figure 18, which shows that account openers are most likely to say they will be able to pay for “less than half” of college expenses. By contrast, inquirers are most likely to believe they will pay for “half” of college costs while non-openers are most likely to believe they will be able to pay for “very little.”
Figure 18: Savings Expectations for College Costs
Source: Exit survey responses Note: Because of a large number of missing responses from inquirers, only non-missing responses shown
18.9 16.2 40.5 24.3
21.4 14.3 21.4 42.9
5.0 35.0 30.0 30.0
Account Openers (N=37)
Non-Openers (N=14)
Inquirers (N=40)
Full Half
Less Than Half Very Little
CS4C: Final Evaluation Report December 2013 Page 46 of 164
These results suggest that account openers’ expectations for college finance are neither hopeless nor unreasonably optimistic. Instead, participants who opened accounts through CS4C appear to have a grounded sense of what is financially achievable, a pragmatism that is congruent with taking the practical steps to bridge the gap between individual savings and full college costs. One way to bridge this gap is through additional funding sources. Figure 19 shows that account openers recognize using a variety of payment methods as a relevant funding strategy; account openers are more likely than inquirers to say they will pay for their children’s higher education using every financing method available, including college savings. Moreover, from program entry to exit, account openers became more likely to say they would use each method available to pay for college. Figure 19: General Expectations for Paying for College
Source: Intake and exit survey responses Note: For ease of comparison purposes, non-openers are not shown; only account openers with responses on both surveys, as well as inquirers with responses on the exit survey, are included a
Inquirers significantly different from account openers on exit survey (p≤0.05) b
Account openers on intake survey significantly different from account openers on exit survey (p≤0.05)
13.5
18.9
30.0
70.3
59.5
35.0
51.4
32.4
47.5
91.9
62.2
85.0
56.8
43.2
37.5
Not Surea
My Savings and Incomea
Loansb
Grants and Scholarshipsb
Child Savings and Incomea
Inquirers on Exit Survey (N=40)
Account Openers on Intake Survey (N=37)
Account Openers on Exit Survey (N=37)
CS4C: Final Evaluation Report December 2013 Page 47 of 164
Discussion
The results presented in the prior section highlight key findings with regard to who participated in the CS4C pilot program, as well as the motivations, barriers, and benefits to participation. We found that account openers were largely mothers with somewhat higher levels of income and education; those who opened accounts were also apt to receive child support more regularly than inquirers who did not open accounts. Importantly, the CS4C program was the first opportunity for many account openers to begin saving for their children’s college. Through participation in the program, many account openers now firmly believe their child will go to college—an outlook that helps form an actionable identity linked to increased odds of college enrollment and graduation. This section of the report discusses lessons learned from various stages of the CS4C pilot—from outreach and inquiry, to program participation and account opening. The following section then draws on discussion findings and lessons learned throughout the pilot to identify relevant policy considerations OUTREACH TO INQUIRY
Consistent with outcomes seen in other asset-building initiatives, results from the CS4C program highlight the difficulty in generating initial inquiries from a large, low-income population. Only a small proportion of those who received CS4C promotional materials inquired about the program, and increases in marketing did not necessarily correspond with increases in inquiries. Common challenges to recruitment may have been further exacerbated by program-specific constraints on advertising. The lack of an official partnership between the OAG and Citi, for example, prevented joint publicity and marketing through press releases or special events. Moreover, the OAG was unable to share the contact information of child support clients, effectively restricting outreach efforts to those that could be conducted by the OAG itself. Under these limitations, CS4C marketing was conducted primarily by direct mail. The low rate of inquiry in CS4C aligns with past studies on the efficacy of mass mailings, which show that interactive recruitment channels (telephone, interpersonal communication) are significantly more effective than passive recruitment strategies (mass media, direct mail).105 Though rates of inquiry may have been higher under an interactive recruitment strategy employing phone and interpersonal contactl—an undertaking that lay beyond the capacity of the OAG, there were also marked benefits to anchoring the program within a public agency. CS4C benefitted greatly from a well-defined target population replete with client contact information and detailed child support payment histories—valuable data no other entity could provide.
l In the beginning of the program, the OAG did conduct outreach by telephone, making a total of 186 phone calls to lump
sum recipients; however, this level of outreach was unable to be sustained throughout the life of the program and recruitment
efforts turned to email, direct mail, and posted notices only. In addition, the OAG attempted to increase outreach by asking
child support judges and court officials to participate in the recruitment campaign by informing child support clients of the
program. This approach, however, failed to inspire much action and was eventually set aside.
CS4C: Final Evaluation Report December 2013 Page 48 of 164
Moreover, individuals expressed a trust and attention to communications from the OAG. Custodial parents appeared to hold a particularly positive view of the OAG in this regard, and expressed appreciation for being targeted in a positive way. Using a trusted source of information likely buoyed the program’s credibility; however, it is difficult to determine whether the OAG namesake ultimately increased inquiries or participation. Another factor impacting the success of outreach efforts may have been an incongruity between the goals of the program and the existing mission and goals of the nonprofits themselves. Two of the three nonprofits had not offered similar services in the past, giving them little ability to mobilize previous clientele. Foundation Communities, the only nonprofit offering similar services in the past, did appear to have some success in tapping existing pools of clients. INQUIRY TO PARTICIPATION
Once individuals expressed an interest in CS4C, however, enrollment rates were high. One-third of inquirers became participants, and two-thirds of participants opened accounts. Though most individuals who inquired about CS4C were driven by a desire to send their children to college, account openings were markedly higher among those with higher incomes and lower levels of financial stress. Moreover, account openings increased under program structures with higher incentives and lower barriers to participation. Three program elements seem particularly salient in this regard. First, evidence from focus groups and account openings suggest the introduction of $100 seed incentive may have created a tangible and proximate incentive that proved more motivating than a percentage match on initial deposits. Second, increasing the match rate from 20 percent to 100 percent provided additional motivation for account openings. Finally, waiving the financial coaching requirement eliminated a barrier to account opening, thereby sustaining participant momentum in the early stages of inquiry. The notion that financial coaching requirements may have acted as more of a barrier than an incentive is reiterated in data collected through exit surveys. Among those who opened an account, financial coaching was not a significant motivator to do so. Among those who failed to open an account, a lack of time for the required financial coaching emerged as one of the top three reasons for not doing so. The program decision to recast financial coaching as an elective rather than mandatory service reflected a conscious tradeoff among two desired alternatives; substituting an increase in accounts for fewer gains in financial literacy. Though the many program changes introduced difficulty to the evaluation process, the flexibility of program partners also allowed the program to undergo a continuous improvement process, evolving as program partners learned what was most effective along the way. From the early months of the program to the final months before program close, the number of account openings increased while the length of time between inquiry and account opening narrowed. This positive shift in outcomes can be attributed almost entirely to changes in the program design. These findings are consistent with previous research on the importance of program design, and in particular, the influence of incentives and barriers. Numerous studies in the field of behavioral economics underline the notion that specific
CS4C: Final Evaluation Report December 2013 Page 49 of 164
design elements—especially those that capitalize on individuals’ tendency toward inertia by facilitating ease of participation—are paramount to generating desired savings outcomes.106 Despite a number of improvements to the design of CS4C however, partners could not address three institutional barriers to enrollment that may have hampered account opening throughout the length of the pilot. The first was a barrier to outreach, which significantly circumscribed the type and amount of recruitment that was possible (discussed above). The second was a set of legal restrictions on the type of assistance financial coaches can and cannot provide. Given the complex nature of college savings accounts and investment options, many participants needed assistance in navigating the menu of options. Even though coaches in Brazos Valley and San Antonio could not provide financial advice, there is some qualitative evidence to suggest that coaches who were able to simultaneously educate, support, and establish trust with clients were as effective in facilitating account openings as those coaches who were able to provide financial advice. A third institutional barrier to enrollment may have stemmed from the design of the savings accounts themselves. Among individuals who did not open an account, confusion about the program and a resistance to the types of savings vehicles offered figured prominently on the list on reasons for non-participation. Prior literature has also noted a general lack of familiarity with 529 accounts, especially among low-income savers. Only 13 percent of low-income parents without a 529 have heard of them, and parents report not using 529s primarily because they prefer to save for college a different way, don’t have enough money, or don’t know enough about them.107 One of the more salient findings of the CS4C pilot is that lump sum child support payments did not provide the expected “windfall” scenario for custodial parents. Few account openers indicated that the receipt of a lump sum child support payment motivated them to open an account, and many did not recall receiving a lump sum to begin with. Moreover, most lump sum recipients collected substantially lower amounts than program partners had originally expected. Though average lump payments are high—$2,444 in August 2011—the vast majority of lump sum recipients do not receive more than several hundred dollars in a typical lump sum.108 This amount failed to provide the psychological “windfall” the program was designed to capitalize on. Not only did the lump sum fail to provide adequate motivation, it may have also acted as an inadvertent barrier to participation. Most non-openers pointed to a lack of consistent child support as a primary reason for not opening an account. A lack of consistent support is, of course, the flipside of a lump sum payment. Child support customers who receive lump sum payments are, by definition, also those who receive inadequate and unreliable support. As a result, many lump sum recipients may need to use the extra money received through arrears to cover expenses not met during previous months, leaving them unable to save. Focus group participants echoed this point, noting that child support clients receiving consistent support may be more apt to open an account due to greater financial stability than those who receive support erratically. The initial CS4C program design failed to recognize this dynamic, and in the last several months revised the marketing strategy to target recipients of consistent support.
CS4C: Final Evaluation Report December 2013 Page 50 of 164
Finally, many potential participants indicated that they did not open accounts due to insufficient money. National estimates suggests that, for many families in the child support system, child support income makes up a substantial portion of family income. For custodial families below the federal poverty level that receive child support, child support makes up 40 percent of family income. For those below 50 percent of federal poverty, child support makes up 63 percent of income.109 Many of these families may not be in a position to set aside the amount required to open a college savings account, nor is it clear that doing so would be in their best financial interest. PARTICIPATION TO COLLEGE SAVINGS
One of the principal successes of the CS4C program is that it initiated the process of saving for college for the vast majority of parents who opened accounts. Most parents who enrolled and opened an account through CS4C were not saving for college previously. This outcome is consistent with one of the program’s primary goals, and may carry other attendant benefits for account holders. Among these benefits is the heightened potential for long-term educational gains as a result of the psychological impacts of account holding. Indeed, a primary lesson to emerge from the CS4C initiative is that the emotional benefits of participation may be parallel if not paramount to the financial benefits. In both survey responses and focus groups, participants repeatedly alluded to a shift in outlook that transformed the idea of college into something that was not only attainable, but probable. Many parents described a long-held desire to save for their child’s education and wished they had begun the process earlier. For most account openers, CS4C ignited this latent goal, giving them the “push” they needed to begin saving. Participants repeatedly expressed a pride in taking an active role to give their children an opportunity they themselves did not have, and the vast majority indicated that opening an account through CS4C increased their child’s chances of going to college. The psychological shift that accompanies saving for college is supported by other emerging research, with one study linking small-dollar college savings to dramatic increases in the likelihood of both college enrollment and graduation.110 These outcomes are well-suited to the theoretical framework of identity-based motivation (IBM) theory; in the case of college savings, researchers contend that the act of saving for higher education may ignite actionable identities that lead savers to adopt a future-oriented “college-bound identity” in which the concept of college is seen not only as attainable, but as a presumed destination.111 Findings like these imply that nominal account holdings may be secondary to the potential of programs like CS4C to place children on a track where college is viewed as a realistic and achievable goal. Participation in CS4C may have also altered participants’ perceptions of what is involved in paying for college. Nearly all account openers felt that CS4C helped them make a realistic plan for their child’s future education, a realism that was reflected in both their expectations of paying for college as well as levels of financial stress. Though nearly all parents expressed a desire for their children to attend college, those who opened accounts were more likely to make sober predictions about the proportion of college costs they expect to cover. Compared to other groups, account openers were also more likely to indicate that they would use nearly every financing option available to pay for their children’s college, including their own savings, their child’s savings (529), loans, grants and scholarships [Figure 19]. In short, CS4C participants who opened accounts for their children appear to have a practical
CS4C: Final Evaluation Report December 2013 Page 51 of 164
understanding that paying for college will require multiple funding streams. Interestingly, confronting the daunting realities of college finance may have also had the unintended consequence of increasing financial stress among some account openers. Comparisons between baseline and exit surveys suggest some participants may have experienced increases in financial stress over the course of the pilot, though it is difficult to know whether this shift is a result of the program or of other external factors such as job loss [not shown]. Two expected benefits of the program—increases in financial literacy and reduced exposure to negative financial events—failed to materialize as anticipated. On the whole, financial coaching services yielded mixed reviews from participants. Though exit survey responses paint a generally positive perception of financial coaching, participants’ positive appraisals were far from universal and many seemed to give the sessions a lukewarm review. Focus group discussions reiterated these diverging impressions, with some participants noting the value of financial coaching and others viewing the sessions as unhelpful or even an inconvenience. The variation in perceptions may have hinged on participants’ prior financial knowledge, as well as the characteristics of the financial coaches themselves. Participants in San Antonio, for example, appeared to have a particularly high opinion of the financial coach spearheading the program in their city. Though some participants may have achieved a better understanding of financial topics through the sessions, few altered their financial behavior as a result. Participants’ bank status did not markedly change, and exposure to negative financial events was not reduced through participation in the program. Finally, though account openers appear to be more financially literate than inquirers and non-openers on topics related to college savings vehicles, it is difficult to know whether this difference is a result of financial coaching or a pre-existing difference in financial knowledge. An important caveat to the findings around financial coaching is that many financial coaches in the CS4C program were significantly limited by the type of assistance they could provide to prospective participants. Shortly after program launch, CS4C program partners learned that the Texas Securities Act regulates not only the types of securities offered in Texas, but also the organizations and individuals who sell securities and provide advice. Regulations prohibit financial coaches who are not registered with the State Securities Board from providing guidance or financial advice. 112 Because uncertified financial coaches were only able to provide fact-based information on multiple savings options, they were unable to steer prospective participants toward opening 529 accounts or provide investment advice on the complex menu of investment options. 113 Financial coaches at Foundation Communities in Austin were registered with the State Securities Board, and therefore able to provide more dedicated financial advice; however, coaches in San Antonio and Brazos Valley were unable to offer this type of personalized counsel. These limitations may help to partially explain why financial coaching services appear to have had an ambiguous and varied impact on program participants.
CS4C: Final Evaluation Report December 2013 Page 52 of 164
Policy Considerations
As the first pilot program to capitalize on the intersection of child support, asset building, and college savings, the CS4C initiative learned as much from its challenges as it did from its successes. The lessons to emerge from CS4C hold insight not only for innovative programs aimed at expanding opportunities for those in the child support population, but for the asset-building community at large. This section summarizes the most significant programmatic themes and lessons to emerge from the CS4C evaluation. SET CLEAR PROGRAM GOALS
As a pilot program, CS4C aimed to learn broadly whether asset-building strategies to promote college savings among the child support population would be successful. At the outset, program partners identified a range of program goals, from learning how to best deliver the program to increasing financial literacy to helping families attend college. More precise goals are needed in a full-scale implementation: for example, does the program aim to have participants open college savings accounts, gain financial literacy, or save enough to make a dent in college expenses? Program design will differ, depending on the desired goal. UNDERSTAND PROGRAMMATIC CONSTRAINTS
The CS4C program encountered a number of obstacles throughout the development of the program that hindered the optimal program design. Among the programmatic limitations were 1) marketing constraints born of the public-private partnership, 2) regulatory constraints on the ability for financial coaches to provide advice or steer participants toward certain savings vehicles, and 3) logistical constraints on the ability to integrate a direct deposit option into the program. Though program partners were aware of certain design constraints during program development, other restrictions were discovered only after program launch, prompting program partners to adapt the program model and expectations accordingly. ALIGN WITH BEST PRINCIPLES OF ASSET BUILDING
Although the CS4C program was designed to incorporate the basic tenets of asset building—including matched contributions and financial coaching services—the early program design overlooked arduous incentive structures and other barriers to participation that may have hindered account openings. Low match rates, protracted incentive payment schedules, heavy financial coaching requirements, cumbersome paperwork, and confusing or opaque financial products are among the design elements which may have negatively impacted take-up rates. As program partners enhanced the incentive structure and eliminated barriers, account openings increased. Because many changes to the CS4C program occurred simultaneously, it is difficult to isolate the effect on enrollment from any one change. Still, results of the CS4C program seem to indicate that reducing strenuous participation requirements may matter as much as increasing incentives. These findings are consistent with research in the field of behavioral economics, which points to the importance of simplicity and ease in facilitating program participation.
CS4C: Final Evaluation Report December 2013 Page 53 of 164
Options for Automatic Enrollment and Automatic Deduction
As noted previously, extant literature supports the idea that reducing barriers is critical to program success. National studies show that low-income families have an especially strong will to save for college, yet many struggle to do so.114 In considering ways to encourage savings among this population, some researchers have floated a model of college savings that would allow for regular contributions similar to the 401K model designed for retirement savings.115 Research in the field of behavioral economics demonstrates that automatic enrollment in such accounts dramatically alters savings behavior, significantly enhancing participation and influencing contribution rates.116 The underlying logic is that the same inertia which leads people to delay savings can be a powerful force if inverted to establish saving as a default rather than elective action. The concept transfers to 529s as well, where results from the SEED OK demonstration show near universal adoption of 529s under an automatic enrollment structure.117 Automatic deductions show promise as well. When asked whether they would invest in a 529 plan with an automatic payroll deduction if their employer offered one, two-thirds of low-income parents (<$35,000) in a national survey indicated that they would be likely to do so.118 Integrating these concepts into the child support system, policymakers could consider developing a default option that automatically establishes a college savings account alongside the opening of a child support order. Under a default option, a small percentage contribution—5 percent or 10 percent, for example—could be apportioned from regular child support payments into a designated college savings account. Assuming an annual rate of return around 7 percent, an individual contributing 10 percent of the median child support order in Texas ($305) would accumulate $9,841 over a 15 year period.m If tuition costs in Texas continue to rise at the same rate experienced in the last five years, the average cost of two semesters a public two-year institution in 15 years would be $3,413, or $6,826 for a two-year degree—well under the projected account balance.n Incorporating a college savings program into the child support system may be beneficial for other reasons as well. Contention between custodial and noncustodial parents over the use of child support payments would likely be softened by the understanding that a given proportion of payments is being invested for the child’s future—a design beneficial to both parents. Such a program may even be expected to increase compliance with child support obligations. Under current OAG operations, a program of this design is not possible due to logistical and institutional barriers that prevent dispersal of child support payments to different locations (i.e. child support payments cannot be divided and sent to both the custodial parent and a college savings account).
m $305 was the median monthly child support obligation in Texas for active cases with at least one dependent under 18 for
July 2013, according to OAG Administrative Records. This calculation includes all cases with monthly child support and
child support arrears obligations greater than 0 but excludes medical support and medical support arrears obligations.
Estimates do not account for increases in this obligation due to inflation or changes in income in an effort to keep the model
as simple and conservative as possible. n Estimates derived using the 2012/2013 tuition cost for two semesters at a public two-year institution ($2131), and assumed
17% increase in tuition cost every 5 years over 15 years.
CS4C: Final Evaluation Report December 2013 Page 54 of 164
Options for Savings Vehicles
Results from the CS4C evaluation also suggest that confusion over program details and investment options, and a general wariness of the 529 plan’s impact on public benefits and other college financing options, may have acted as barriers to participation. These findings expose a weakness that may be equal parts educational and programmatic. Without a default investment option in the state 529 plan and under legal restrictions barring financial coaches from offering advice, many CS4C participants were left to navigate the complex menu of investment options on their own. Given the potential for discouragement among prospective account holders, other policy researchers in Texas recommend streamlining the college savings enrollment process, creating a default option for the state-run 529 plan, and enabling certified financial coaches to provide enrollment assistance in order to expand college savings enrollment.119 Beyond providing additional assistance to prospective account holders, college savings programs might consider incorporating additional savings vehicles for risk-averse savers. Research shows that low-income savers report being most likely to use a 529 if it includes a guaranteed interest rate.120 Other studies have shown that uncertainty appears to play a large role in the considerations of low-income individuals, who are considerably more likely to be risk-averse than their wealthy counterparts.121 These considerations were echoed in interviews with local nonprofits, who noted that account openers were most likely to select less risky investment options such as money market portfolios or age-based accounts that reduce risk as the child ages. Though low-risk options in the 529 plan, such as the U.S. Government Money Market Portfolio, seek to preserve the principal investment, these portfolios are also likely to generate minimal growth—an inherent tradeoff between investment risk and return. To expand on options at the low end of the risk-return spectrum, college savings programs could consider integrating U.S. Savings Bonds as a straightforward, low-risk investment choice within the asset-building framework. The Series EE Savings Bond and I Savings Bond are government-backed bonds that offer a tax-advantaged way to save and pay for qualified educational expenses. In addition, the bonds offer both variable and fixed rate options that guarantee positive returns for risk-averse savers.122 These savings vehicles also bear close resemblance to a certificate of deposit or money market account, the preferred savings vehicle currently used by low-income families saving for college.123 Options for Financial Coaching
Similar programs should consider ways to innovate around the financial coaching component of asset building. Though CS4C program partners designed financial coaching as a core program benefit, results suggest that for some it may have acted as more of a barrier to entry. One way to eliminate this hurdle while maintaining an integrated financial literacy component would be to introduce an incentive contribution for participating in financial coaching. Removing the financial coaching requirement would boost enrollment numbers, while building an incentive structure into the completion of various financial coaching modules would expand financial knowledge among those already in the program. The idea to recast financial coaching as an incentivized elective service was suggested by staff at the implementing nonprofits, as well as by CS4C focus group participants.
CS4C: Final Evaluation Report December 2013 Page 55 of 164
Options for Program Targeting
The CS4C program initially targeted outreach efforts at lump sum child support recipients only. One of the more pronounced findings of the CS4C pilot, however, is that lump sum receipt was not a clear motivator in participants’ decision to open an account. Instead, results point to the importance of having a constant flow of income for saving. Asset-building programs seeking to build the financial capacity of parents in the child support system should target the broadest set of parents possible, unless resource constraints or specific goals of the agency justify a narrow incentive structure (such as arrears reduction). In general, custodial parents receiving consistent support have greater financial stability and may be the more likely to save. Options for Low-Income Families
Perhaps the largest barrier to program participation lies outside the scope of CS4C and available program modifications. More than any other reason, those who failed to open accounts through CS4C listed insufficient money as the primary reason. Poverty may be one of the more underrated barriers to success for asset-building programs seeking to build a ladder to the middle-class. Until broader work is done to alleviate the breadth and depth of U.S. poverty, asset-building programs targeted at the poor will have their potential for success severely curtailed. INTEGRATE WITH GOALS OF STAKEHOLDERS
A comprehensive review of asset-building initiatives across the U.S. notes that asset-building strategies which are unable to make specific contributions to the existing goals of a particular stakeholder or program will be unlikely to succeed at scale.124 The CS4C program was well-aligned with the existing goals of RAISE Texas, Citi, as well as some of the local nonprofits. Additionally, the program was congruent with the goals of the Child Support Division, including objectives laid out under the BAFF initiative to strengthen Texas families’ long-term financial stability; CS4C was not well-aligned, however, with the federal performance measures used to evaluate and determine incentive payments to the Child Support Division of the OAG. Therefore long-term participation by this integral partner could prove difficult.
Considerations for Improved Integration
One approach to pairing the goals of the program with existing goals of the OAG while simultaneously addressing challenges to operations and design would be to institutionalize a college savings program within the OAG. Integrating a college savings program into the Child Support System would reduce obstacles to participation, facilitate logistics, increase outreach, and cement the integrity of the program. Perhaps most importantly, however, an integrated approach would allow for consistency between program goals and OAG performance measures—a key to long-term success. A collaborative effort between Kansas Child Support Services and the Kansas State Treasurer offers an example of this integrated approach. Launched in June 2013, the Kansas Child Support Savings Initiative is an arrears forgiveness program tied to the State’s 529 college savings account. After meeting current support obligations plus $1 towards arrears, NCPs can receive $2 in state-owed debt forgiveness for every $1 deposited into a child savings account.125 The effort is highly integrated into the state government, with information-sharing across multiple agencies. In addition, because the
CS4C: Final Evaluation Report December 2013 Page 56 of 164
State of Kansas acts as the account holder and the child as the beneficiary, only the child may access the account for college or post-secondary costs. Moreover, both parents can contribute to the account and monthly statements are sent to both the CP and NCP permitting a degree of transparency and shared interest between parents.126 The Kansas program offers an innovative model in part because of the tangible benefit to all interested parties, including Kansas Child Support Services, custodial and noncustodial parents, and beneficiary children. Custodial parents benefit from the precondition that current support be met prior to state-owed debt forgiveness. Noncustodial parents benefit from a 2-to-1 debt reduction schedule, and both parents benefit from the initiation of a college savings account for their child. Child Support Services benefits from increased compliance and collections on arrears among NCPs whose payments may have otherwise remained elusive. Finally, the program improves economic stability among families and opens the door to future educational and economic opportunities for Kansas children in the child support system. Programs which are capable of aligning benefits with both participants and the goals of managing institutions are far more likely to be sustainable in the long-term, a notion that is consistent with comprehensive field scans of asset-building initiatives in the U.S. 127 Considerations for Staffing and Outreach
Program models similar to CS4C require strong leadership of the type that may be most feasible through an institutionalized structure. Although a number of individuals involved in program execution assumed expanded roles in an effort to facilitate successful operation, the particular management structure employed by CS4C would not be a feasible model if taken to scale. At the ground level, staff at the participating nonprofits act as a critical ingredient to program success. Permanent staff who are able to gain trust and build a relationship with prospective participants are likely to be more successful in enrolling and encouraging contributions. In fielding participant interest, program staff must capitalize on the momentum of prospective participants and engage them immediately. Integration into the child support system would also address several structural challenges that impede program operations. In this pilot initiative, the burden of recruitment fell to the state agency with little support from outside agents or partners. This model required intense commitment from the state agency without the requisite internal structures or capacity to sustain such high levels of support. If this program were made permanent, the OAG would likely need to build the internal capacity to conduct recruitment activities while contracting directly with service providers for account management, thus streamlining program execution and expanding participation. Moreover, lessons from other programs suggest that integrating program recruitment into institutional structures can improve recruitment numbers. The KIPP College Account Program (KCA), a financial literacy and incentive-based college savings program, has yielded impressive enrollment rates in KIPP schools—a success owing in large part to the frequent contact and close relationships between teachers and families.128 Throughout the CS4C pilot, the OAG did not have the capacity to utilize child support staff or court officials to conduct personalized outreach through phone or interpersonal communication.129 A fully integrated program could leverage these lines of communication, which are likely to prove more effective than printed outreach materials distributed through mail or in child support offices. In addition, prior research also shows that Texas families are most likely to hear about
CS4C: Final Evaluation Report December 2013 Page 57 of 164
prepaid college tuition plans through “word of mouth”; referrals from professional financial advisers account for only 4 percent of enrollments. These findings suggest that programs aimed at boosting college savings may need time to spread through the community organically through social contacts, and that expectations of rapid take-up within the population may be unrealistic.130 RECOGNIZE NONFINANCIAL SUCCESSES
Few parents were driven to participate in CS4C because they believe they will be able to save enough to cover the full cost of their children’s education. More often, parents voiced their motivation through themes of opportunity and hope, of wanting something better for their children. Findings from the CS4C initiative reiterate the importance of accounting for these psychological benefits to participation in college savings programs, namely in light of the potential for psychological shifts to impact future outcomes. Though it is difficult to speculate what proportion of CS4C families will achieve the savings necessary for full tuition coverage, many account openers indicated the process of saving itself was enough to make them feel as if they were on track to achieve their goal of sending their children to college. Emerging research suggests this future-oriented “feeling” may carry considerable influence in determining subsequent educational outcomes, primarily by way of transforming savers’ attitudes about the attainability of college. 131 Over the long-term, the true measure of success for CS4C may not be whether nominal account holdings reach some specified level, but whether the program facilitates college attendance for some portion of children who otherwise would not have attended. The potential for this prospect is well supported by past studies, and implies that to ignore the long-term, derivative benefits of saving for college—even when nominal savings amounts are low—would be a disservice to the potential of programs like CS4C, SEED OK, or Kansas’s 529 Child Savings Account Program.
CS4C: Final Evaluation Report December 2013 Page 58 of 164
Conclusion
For many low- to middle-income families, the gap between college aspirations and college attendance is widening. Rising tuition costs have landed many in debt, while effectively barring others from attending altogether. The CS4C program was developed to help bridge this divide between families’ aspirations for higher education and their capacity to attend, offering an innovative approach to building college savings among those in the Texas child support system. Throughout the 18-month pilot, CS4C encountered a number of successes and challenges. From the outset, CS4C struggled to attract the interest of potential participants. Once individuals inquired about the program, however, rates of participation and account opening were high. Over the course of the pilot, significant changes were made to the incentive structure and participation requirements. These changes resulted in considerable increases in the number of account openings, as well as a reduced lag between inquiry and account opening. Motivation to open an account through CS4C appeared to stem from parents’ desires for their children to pursue higher education and a commitment to helping their children achieve this goal; in addition, participants cited the importance of CS4C savings incentives as a catalyst in their decision to open an account. Participants were not significantly motivated, however, by the receipt of a lump sum child support payment as originally hypothesized. In fact, participants who failed to open accounts often cited inconsistent child support and insufficient money as substantial barriers to participation. In general, account openers were more likely to have higher incomes and higher education than participants who did not open an account. For most participants who opened accounts through CS4C, the program initiated the process of saving for college. This process appears to carry important psychological benefits, as demonstrated through survey responses and focus group discussions. Moreover, the psychological benefits of saving for college are consistent with other research suggesting the act of saving leads to an actionable identity that may strengthen a child’s chances of attending and graduating from college.132 Results from the CS4C program also reinforce prior research findings on the importance of program design, especially with regard to aligning the incentive structure and participation requirements with the core principles of asset building. Future college savings programs should take care to ensure that participation is as simple and painless as possible. Incentive structures which are straightforward and include a seed incentive may generate increased account openings, especially among lower-income individuals. Also, prospective participants with consistent income streams may be more suited to save than those with volatile income. Financial coaching, a program element which yields more benefits to some than others, should be incentivized rather than mandated. Finally, to facilitate long-term sustainability, future programs should make efforts to ensure consistency between program goals and the goals of participating institutions.
CS4C: Final Evaluation Report December 2013 Page 59 of 164
APPENDICES
Appendix A: Asset-Building Programs
Program General Information Program Goal Incentive Structure Results/Takeaways
American Dream Demonstration
133, 134
The American Dream Demonstration (ADD) was an experimental Individual Development Account (IDA) program that was designed and implemented by the Corporation for Enterprise Development (CFED) and ran from 1997 to 2001
The demonstration’s 13 program sites worked with 2,364 low-income families across the country
ADD participants received IDA accounts, incentives to contribute to the accounts, and about 13 hours of required financial education
To better understand whether or not IDAs are effective in helping low-income families to achieve economic independence
Individual ADD programs matched participant IDA contribution with match rates between 1:1 and 7:1; these match rates, on average, were capped at $42
As of 2001, the 2,364 participants contributed to their IDAs 6 out of 12 months out of the year, with an average deposit of $19.07 ($288 per year)
IDA matches averaged $1.92 to $1 contributed by the family, with total deposits (with matches) averaging $1,543 per participant
Families across all incomes contributed to their savings; income level was not a deterrent
Higher match rates and higher match caps were correlated with an increased likelihood of participants to save
CS4C: Final Evaluation Report December 2013 Page 60 of 164
Program General Information Program Goal Incentive Structure Results/Takeaways Gaining Early Awareness and Readiness for Undergraduate Programs (GEAR UP)
135, 136, 137, 138, 139
The GEAR UP College Savings Account Research Demonstration Project is an $8.7 million grant program funded by the U.S. Department of Education
GEAR UP, which began in 2009, offers six-year grants to states and organizations who work with low-income families; in 2012, GEAR UP granted 132 awards to states and partnerships
Works with grantees to offer 10,000 low-income middle and high school students college savings accounts and financial counseling
To increase the number of low-income students who are prepared to enter and succeed in college
For each participant, GEAR UP grantees open a college savings account with a $200 seed
Grantees provided a 1:1 match on contributions up to $300 each year for up to four years
Participating students could enter college with up to $1,160 in savings
In 2012, GEAR UP served 647,772 low-income students nationwide
Some states have observed positive results for GEAR UP participants. For example, Washington State GEAR UP students exhibited better outcomes for college enrollment, persistence, and degree attainment compared to other low-income students in their state
CS4C: Final Evaluation Report December 2013 Page 61 of 164
Program General Information Program Goal Incentive Structure Results/Takeaways
Harold Alfond College Challenge
140,
141
The Harold Alfond College Challenge is a statewide scholarship, established in 2009 by Harold Alfond, a prominent Maine business owner
Guarantees every child born in Maine a $500 grant, upon opening a 529 account before the child’s first birthday; Maine’s 529 program is called NextGen
Parents choose an investment plan for their child’s NextGen account as part of enrollment process
To enroll all Maine babies in a college savings program
To encourage parents to maintain continued contributions to the college savings accounts
To encourage parents to prepare their children for higher education
Each NextGen account receives a $500 seed from the Alfond Fund
In the program’s first year, it enrolled 2,100 babies in the program out of the 13,000 babies born in Maine each year
The enrollment rate was 16% in the program’s first year; the national newborn 529 enrollment rate is less than 5%
Of the 14,000 babies whose families have opened NextGen accounts for them as part of the program, 25% have made subsequent contributions to the account
Barriers to the program may include a lack of financial sophistication (i.e., having financial investments, having no financial advisor) and lower education levels
142
CS4C: Final Evaluation Report December 2013 Page 62 of 164
Program General Information Program Goal Incentive Structure Results/Takeaways I Can Save (ICS)
143,
144, 145
I Can Save was funded by the Center for Social Development (CSD), F.B. Heron Foundation, Lumina Foundation for Education, and University of Missouri Research Board
Was a small scale, four year demonstration project in St. Louis, Missouri from 2003-2007 that was part of the larger SEED demonstration
Provided students in the program with a college savings accounts with an initial deposit from the SEED demonstration
Offered financial literacy classes for participating children and their families
Encouraged students and parents to roll the CDA account over to a 529 College Savings Account at the end of the four years
SEED aims to help families become financially capable and secure; reduce debt and the reliance on credit
ICS aimed to produce a model of school-based financial education and college savings to increase children’s understanding of personal finance and increase their aspirations for higher education
ICS provided participating students with a with a college savings account containing a $500 initial deposit
Provided a 1:1 match of up to $1,500 of contributions to the account over 4 years
Students who attended afterschool I Can Save Club meetings received $1 each week, which was matched by I Can Save
Financial coaching sessions and workshops were offered to parents, with an incentive deposit to encourage attendance of the sessions
I Can Save served 73 kindergarten and first grade students at a low-income elementary school
Participants saved, on average, $1,376 over four years
67% of students attended the weekly after school meetings
70% of parents attended at least one coaching session; 10% attended 10 or more sessions
70% of the accounts were voluntarily rolled over to MO$T Accounts, Missouri’s College 529 Account Program; parents were encouraged to continue contributing
Families had higher levels of participation at the beginning and end of the program and are responsive to the $500 incentive
An evaluation of ICS by Washington University in St. Louis suggests that ICS may help students and parents develop the tradition of saving as a way to reach long-term goals
CS4C: Final Evaluation Report December 2013 Page 63 of 164
Program General Information Program Goal Incentive Structure Results/Takeaways
Kansas Child Support Savings Initiative
146
A partnership between the Kansas Department for Children and the Kansas State Treasurer’s Office that began in June 2013
The initiative is an arrears forgiveness program for non-custodial parents (NCPs) in the child support system
Participants create 529 accounts with arrear-reducing incentive to contribute to the accounts
Participants must meet current child support obligations to be eligible for program incentives
To encourage NCPs to save for their children’s college and comply with their current child support obligations, while reducing the arrears they owe to the state
NCPs receive a $2 reduction in their arrears from the State of Kansas for every $1 contributed to their child’s 529 account
As of September 2013, participants have earned $2,340 in state arrear reductions
Kindergarten to College (K2C)
147,148
Founded in 2010, K2C is the first publicly funded, universal children’s college savings account program in the United States
Beginning in the fall of 2012, every kindergartener entering a San Francisco Unified School District (SFUSD) school had a college savings account opened for them at Citibank
To accompany K2C’s efforts, financial subjects have been incorporated into SFUSD K-12 curriculum
To ensure that every child in San Francisco can save for post-secondary education
To increase children’s likelihood of attending college
To reduce to exclusion of low-income and minority families from asset-building products
To increase the children’s and families’ financial literacy
To promote private financial investments in San Francisco families
A student’s college savings account includes a $50 initial deposit from the City and County of San Francisco
Children enrolled in the National Student Lunch Program receive an additional $50 deposit
Families receive a 1:1 match on initial contributions up to $100
Families who sign up for a monthly auto-deposit into their college savings accounts receive an additional $100 incentive
As of March 2013, the program had over 8,300 savers from 72 elementary schools
K2C families have saved more than $215,000 in student college savings accounts
CS4C: Final Evaluation Report December 2013 Page 64 of 164
Program General Information Program Goal Incentive Structure Results/Takeaways
The Mississippi College Savings Account Program (MS CSA)
149, 150
MS CSA is a partnership between the Center for Community and Economic Development at Delta State University (CCED), the Mississippi Community Financial Access Coalition (MCFAC), and the Corporation for Enterprise Development (CFED)
Since 2011, serves families of children enrolled in six early childhood development centers in three Mississippi cities
Enrolls children in college savings accounts and provides incentives for the growth of the accounts
Provides participating children with at least five hours of financial education
Offers parents access to 8-10 hours of financial literacy classes
To increase the availability and effectiveness of college savings accounts as asset-building tools;
To increase children’s aspirations to attend college; and
To improve educational outcomes for low-income and minority children in the state of Mississippi
Participants receive a seed deposit of $50 when they open a restricted-use, deposit-only college savings account
As of July 2013, 647 families have opened accounts
CS4C: Final Evaluation Report December 2013 Page 65 of 164
Program General Information Program Goal Incentive Structure Results/Takeaways Saving for Education, Entrepreneurship, and Downpayment (SEED) Demonstration
151, 152
The SEED initiative was a ten-year asset-building program demonstration that started in 2003 and was implemented by 12 nonprofit community partner sites across the U.S.
Community partners offered participants access to individual college savings accounts, incentives for continued contribution to the accounts, and, often, financial education for parents and children
10 community partners chose to offer their participants 529 accounts; 2 offered their participants statement savings accounts
Nearly half of the families who participated in SEED were below the federal poverty line; 41% of SEED families received SNAP
To discover what outcomes would result from 1) giving families of low-income children savings accounts that contained a seed deposit and 2) providing these families with age-appropriate financial literacy education
SEED programs provided families with three types of incentives: 1) savings accounts containing a seed, usually of about $500; 2) a 1:1 match on contributions to the account, usually up to $1000; and 3) “benchmark” payments for completing predetermined activities, such as financial education
SEED program participants could receive up to $2,000 in incentives
Incentive amounts and structures varied by state
Over 1,300 college savings accounts were opened, nationwide, through SEED programs
Families of all income levels have saved an average of $30 per quarter; average total accumulation was $1,500, including incentives
Participating families, no matter their income level, contributed to the SEED account
Initial reports indicate that the CDAs had a positive financial and emotional impact on families
CS4C: Final Evaluation Report December 2013 Page 66 of 164
Program General Information Program Goal Incentive Structure Results/Takeaways
SEED OK153, 154
SEED for Oklahoma Kids (SEED OK) is a partnership between the State of Oklahoma, RTI International, and the Center for Social Development (CSD) at Washington University in St. Louis
Experimental study designed to evaluate a policy of universal and progressive Child Development Accounts (CDAs)
Follows a sample of infants randomly selected from Oklahoma birth records (N=2700) and randomly assigned to treatment and control groups
Provides a 529 college savings plan to every infant in the treatment group with automatic account opening and an initial deposit
Both the treatment and control groups are monitored and interviewed over a seven year period by CSD
To determine the impacts of a CDA program on savings and asset accumulation
Help families save for postsecondary education
Treatment group participants (N=1358) receive $1,000 direct deposit into a 529 state-owned college savings account
Treatment group participants are encouraged to open their own private 529 with a time-limited $100 incentive
Program provides a 1:1 savings match to treatment group participants with household income below $29,000 and a 0.5:1 match to participants with income between $29,000 and $43,499
Control group participants are not offered an incentive
Almost all treatment group participants accepted the state-owned 529 account
At 18 months, 16% of the treatment group and 1% of the control group had opened their own, private 529 account
The average savings amount in privately held 529s was $47 for the treatment group and $13 for the control group
Not counting SEED OK incentive deposits, the mean net difference between treatment and control holdings across all accounts was $21.19
SEED OK treatment increased total savings and assets among the income group ineligible for matches to a larger extent than it did for the match-eligible families
Early results suggest paternalistic CDA features such as automatic account opening, subsidies, restrictions on access and use of funds may be key to positive savings behavior
CS4C: Final Evaluation Report December 2013 Page 67 of 164
Program General Information Program Goal Incentive Structure Results/Takeaways UNCF College Account Program (UCAP)-KIPP College Account Program (KCA)
155
The KIPP College Account program is a partnership between UNCF (United Negro College Fund), KIPP (Knowledge Is Power Program), and CFED (Corporation for Enterprise Development)
Launched in 2010, the program serves students attending 29 KIPP middle and high schools in Washington, D.C., Chicago, New York, the San Francisco Bay Area, and Houston
UCAP offers matched college savings accounts, merit-based college scholarships, financial literacy education and college readiness training
To increase the percentage of low-income students graduating from college
To help students from low-income families attend and persist through college by empowering them to overcome academic and financial obstacles
Participant savings accounts are opened with a $100 seed deposit
Participants receive a 1:1 match on deposits up to a $250 annual limit
KCA offers competitive college scholarships of up to $12,500 over five years for eligible high school seniors
The KIPP College Account Program has enrolled over 5,000 students since its inception
CS4C: Final Evaluation Report December 2013 Page 68 of 164
Appendix B: CS4C Outreach Materials
INITIAL OAG OUTREACH LETTER – ENGLISH/AUSTIN*
CS4C: Final Evaluation Report December 2013 Page 69 of 164
INITIAL OAG OUTREACH LETTER – SPANISH/AUSTIN*
* Letters were slightly modified based on the recipient’s location: the site and contact information associated with the nonprofit in the recipient’s area were placed in the top box.
CS4C: Final Evaluation Report December 2013 Page 70 of 164
REVISED OAG OUTREACH LETTER*
* Letters were slightly modified based on the recipient’s location: the site and contact information associated with the nonprofit in the recipient’s area were placed in the top box.
CS4C: Final Evaluation Report December 2013 Page 71 of 164
RAISE TEXAS OUTREACH LETTER*
*This letter was meant to be nearly identical to the Revised OAG Letter.
CS4C: Final Evaluation Report December 2013 Page 72 of 164
RAISE TEXAS POSTCARD - AUSTIN
CS4C: Final Evaluation Report December 2013 Page 73 of 164
RAISE TEXAS POSTCARD – SAN ANTONIO
CS4C: Final Evaluation Report December 2013 Page 74 of 164
RAISE TEXAS POSTCARD – BRYAN/COLLEGE STATION
CS4C: Final Evaluation Report December 2013 Page 75 of 164
FOUNDATION COMMUNITIES OUTREACH EMAILS
Email to Partners:
Hello Community Partners,
Allow me to introduce myself as the new Outreach Coordinator for the Community Financial Center! Over the coming year, I will be serving my VISTA term with Foundation Communities and I look forward to working closely with you all to serve and strengthen our community.
Hopefully I will have the opportunity to speak with you all on a more personal level, but for the moment, I want to let you know about our too-good-to-be-true Child Support for College Program. Any parent with a child support case through the Attorney General’s office can receive huge incentives simply by investing in their child’s college education. By signing up for Financial Coaching at our Community Financial Center and opening a Texas Tuition Promise Fund or a Texas College Saving Plan, participants will receive $20 for every $100 they deposit into their account. Parents have the opportunity to earn up to $500 in incentives for their child’s future!
This program has limited availability and we would like to register participants now so they can start saving as soon as possible! Please refer any families who you believe could benefit from the Child Support for College Program. Foundation Communities will provide a $25 HEB gift card for the first fifteen participants to sign-up!
For more information regarding the program, visit our Child Support for College Program webpage, or contact me!
Looking forward to a meaningful year, Clint McManus
Email to Clients:
Friend of Financial Education,
I want to let you know about our too-good-to-be-true Child Support for College Program. Any parent with a child support case through the Attorney General’s office can receive huge incentives simply by investing in their child’s college education. By signing up for Financial Coaching at our Community Financial Center and opening a Texas Tuition Promise Fund or a Texas College Saving Plan, participants will receive $20 for every $100 they deposit into their account. Parents have the opportunity to earn up to $500 in incentives for their child’s future!
This program has limited availability, so register now and start saving as soon as possible! Foundation Communities will provide a $25 HEB gift card for the first fifteen participants to sign-up!
For more information regarding the program, visit our Child Support for College Program webpage, or contact me! If you do not have a child with a child support case, please share this information with anyone who else you believe could benefit from the Child Support for College Program.
Thank you! Erika Leos
Monthly Eblast to Coaches:
Good afternoon, Coaches!
Our newest featured resource is the Child Support for College Program. We spoke about the program at our most recent Continuing Education Gathering. Please see the blog for a short recap of the presentation and resources.
Share this information with any of your clients who may have a child in the child support system and help them invest in their child's education!
CS4C: Final Evaluation Report December 2013 Page 76 of 164
CS4C POSTCARD – 4” X 5”
CS4C: Final Evaluation Report December 2013 Page 77 of 164
CS4C FLYER
Child Support for College Initiative
Save for Your Child’s College Education
& Get a Match up to $500
The Child Support for College Initiative aims to encourage long-term financial success and economic stability for families in the child support system by providing
assistance in starting an educational savings account for their children.
Program Benefits
Learn about ways to save for your child’s future educational expenses
Find out how to get up to a $500 match on your savings
Attend free personal finance classes
Who is Eligible?
Parents with active child support cases in the Austin, San Antonio, or Bryan/College Station areas can contact the local provider in their area:
San Antonio (Bexar County Residents)
Contact United Way of San Antonio (210) 352-7067 or [email protected]
To learn more about the Child Support for College Initiative and how to enroll visit: www.raisetexas.org/cs4c or contact the local partner in your area.
CS4C: Final Evaluation Report December 2013 Page 78 of 164
Appendix C: CS4C Program Forms
INQUIRY FORM*
CS4C: Final Evaluation Report December 2013 Page 79 of 164
* This is the final Inquiry form, which was revised to reflect alterations to marketing.
CS4C: Final Evaluation Report December 2013 Page 80 of 164
FOUNDATION COMMUNITIES INTAKE FORM*
CS4C: Final Evaluation Report December 2013 Page 81 of 164
CS4C: Final Evaluation Report December 2013 Page 82 of 164
CS4C: Final Evaluation Report December 2013 Page 83 of 164
* Foundation Communities had a separate Intake form because they already collected certain information through an internal intake form.
CS4C: Final Evaluation Report December 2013 Page 84 of 164
FOUNDATION COMMUNITIES INTERNAL INTAKE FORM
CS4C: Final Evaluation Report December 2013 Page 85 of 164
CS4C: Final Evaluation Report December 2013 Page 86 of 164
CS4C: Final Evaluation Report December 2013 Page 87 of 164
CS4C: Final Evaluation Report December 2013 Page 88 of 164
UNITED WAY SAN ANTONIO AND BRAZOS COG INTAKE FORM*
CS4C: Final Evaluation Report December 2013 Page 89 of 164
CS4C: Final Evaluation Report December 2013 Page 90 of 164
CS4C: Final Evaluation Report December 2013 Page 91 of 164
CS4C: Final Evaluation Report December 2013 Page 92 of 164
CS4C: Final Evaluation Report December 2013 Page 93 of 164
* This Intake Form is for United Way San Antonio; it is identical to the form for Brazos Valley COG.
CS4C: Final Evaluation Report December 2013 Page 94 of 164
FINANCIAL COACHING TRACKING FORM*
CS4C: Final Evaluation Report December 2013 Page 95 of 164
CS4C: Final Evaluation Report December 2013 Page 96 of 164
* This Financial Coaching Form is for Foundation Communities; it is identical to the forms for the United Way San Antonio and Brazos Valley COG.
CS4C: Final Evaluation Report December 2013 Page 97 of 164
BUDGET WORKSHEET*
CS4C: Final Evaluation Report December 2013 Page 98 of 164
* This Budget Worksheet is for Foundation Communities; it is identical to the forms for the United Way San Antonio and Brazos Valley COG.
CS4C: Final Evaluation Report December 2013 Page 99 of 164
PROGRAM AGREEMENT*
CS4C: Final Evaluation Report December 2013 Page 100 of 164
* This is the final Program Agreement form, which was revised throughout the pilot.
CS4C: Final Evaluation Report December 2013 Page 101 of 164
ACCOUNT TRACKING FORM*
CS4C: Final Evaluation Report December 2013 Page 102 of 164
* This Account Tracking Form is for Foundation Communities; it is identical to the forms for the United Way San Antonio and Brazos Valley COG.
CS4C: Final Evaluation Report December 2013 Page 103 of 164
INCENTIVE CLAIM FORM*
CS4C: Final Evaluation Report December 2013 Page 104 of 164
* This is the final iteration of the Incentive Claim form, which was revised throughout the pilot to reflect program changes.
CS4C: Final Evaluation Report December 2013 Page 105 of 164
CS4C CHECKLIST*
CS4C: Final Evaluation Report December 2013 Page 106 of 164
* This CS4C Checklist is for Foundation Communities; it is identical to the forms for the United Way San Antonio and Brazos Valley COG.
CS4C: Final Evaluation Report December 2013 Page 107 of 164
Appendix D: Intake Survey Results
PERSONAL INFORMATION
Age:
Total (N=96)
17.7% Missing
2.1% Under 25
12.5% 25-29
15.6% 30-34
16.7% 35-39
17.7% 40-44
9.4% 45-49
8.3% Over 50
Gender:
Total (N=96)
11.5% Male
88.5% Female
Marital Status:
Total (N=96)
4.2% Missing
24.0% Never Married
21.9% Married
8.3% Separated
40.6% Divorced
1.0% Widowed
Race:
Total (N=96)
1.0% Missing
62.5% Hispanic
14.6% Black
3.1% Other
18.8% White
CS4C: Final Evaluation Report December 2013 Page 108 of 164
Highest Level of Education:
Total (N=96)
4.2% Missing
3.1% Less than High School
10.4% High School Diploma/GED
38.5% Some College
11.5% 2-Year Degree
22.9% 4-Year Degree
9.4% Master’s Degree
INFORMATION ABOUT CHILDREN
What language is most often spoken in your home?
Total (N=96)
1.0% Missing
86.5% English
5.2% Spanish
6.3% Both
1.0% Arabic
Including yourself, how many adults live in your household?
Total (N=96)
3.1% Missing
49.0% 1 Adult
27.1% 2 Adults
20.8% 3+ Adults
Children in household:
Total (N=96)
4.2% Missing
32.3% 1 Child
32.3% 2 Children
25.0% 3 Children
6.3% 4+ Children
CS4C: Final Evaluation Report December 2013 Page 109 of 164
Age of child/children in household: (Could indicate multiple children):
Total (N=96)
2.1% Missing
19.8% Under 5
39.6% Between 5-10
29.1% Between 11-13
46.9% Between 14-18
15.6% 18+
Do you have a child support order(s)?: (Could indicate multiple children)
Total (N=96)
2.1% Missing
97.9% Yes
0.0% No
Indicated child support order on one child but not all children:
Total (N=96)
2.1% Missing
20.8% Yes
77.1% No
Do you receive child support?
Total (N=96)
2.1% Missing
93.8% Yes
4.2% No
Do you pay child support?
Total (N=96)
2.1% Missing
1.0% Yes
96.9% No
Did you have all of your children with the same partner?
Total (N=96)
11.5% Missing
58.3% Yes
30.2% No
CS4C: Final Evaluation Report December 2013 Page 110 of 164
If no, with how many partners have you had children?
Total (N=96)
13.5% Missing
58.3% 1 Partner
27.1% 2 Partners
1.0% 3 Partners
EMPLOYMENT AND FINANCIAL INFORMATION
Employment Status:
Total (N=96)
2.1% Missing
64.6% Working Full Time
15.6% Working Part Time
10.4% Not working but looking for work
7.3% Not working and not looking for work
If working, how many hours per week?
Total (N=77)
16.9% Missing
23.4% Less than 40 hours per week
59.7% 40 or more hours per week
If working, how long have you been at your current employer?
Total (N=79)
9.1% Missing
16.9% Less than 1 year
28.6% Between 1-3 years
11.7% Between 3-5 years
33.8% More than 5 years
CS4C: Final Evaluation Report December 2013 Page 111 of 164
What is your income from employment per year (before taxes)?
Total (N=96)
11.5% Missing
35.4% Under $20,000
7.3% $20,000 - $30,000
19.8% $30,000 - $40,000
11.5% $40,000 - $50,000
11.5% $50,000 - $60,000
1.0% $60,000 - $75,000
2.1% More than $75,000
If not working, how long have you been out of work?
Total (N=17)
23.5% Missing
17.7% 1-3 months
17.7% 3-6 months
41.2% More than 6 months
Do you or any member of your household receive any of the following? (Could check multiple answers)
Total (N=96)
1.0% Missing
56.3% None
1.0% Child care subsidy
12.5% CHIP
10.4% Free or reduced price lunch
4.2% Housing Assistance
26.1% Medicaid (Undefined)
18.8% SNAP/Food Stamps
2.1% Social Security/SSI/SSDI
0.0% TANF
1.0% Utility Assistance
3.1% WIC
CS4C: Final Evaluation Report December 2013 Page 112 of 164
Do you own or rent a home?
Total (N=96)
2.1% Missing
50.0% Own a home
40.6% Rent a home
2.1% Buying a home
5.2% Live with family
Total household income from all sources:
Total (N=96)
16.7% Missing
17.7% Under $20,000
14.6% $20,000 - $30,000
14.6% $30,000 - $40,000
14.6% $40,000 - $50,000
6.3% $50,000 - $60,000
5.2% $60,000 - $75,000
10.4% More than $75,000
Do you have a checking account?
Total (N=96)
4.2% Missing
7.3% No
88.5% Yes
If yes, checking account current balance?
Total (N=85)
70.6% Missing
7.1% Less than $100
12.9% $100-$500
2.4% $500-$1000
7.1% Over $1000
Do you have a savings account?
Total (N=96)
4.2% Missing
15.6% No
80.2% Yes
CS4C: Final Evaluation Report December 2013 Page 113 of 164
If yes, saving account current balance?
Total (N=77)
35.1% Missing
29.9% Less than $100
7.8% $100-$500
7.8% $500-$1000
19.5% Over $1000
Do you contribute to a savings account regularly?
Total (N=96)
15.6% Missing
45.8% No
38.5% Yes
If yes, what amount do you contribute?
Total (N=37)
54.1% Missing
10.8% Less than $100 per month
27.0% $100-$500 per month
8.1% Over $500 per month
Do you use any of the following services? (Check all that apply)
Total (N=96)
3.1% Missing
83.3% Bank, Credit Union or ATM
71.9% Online Banking
74.0% Direct Deposit
4.2% Pay Day Loans or Short Term Cash Loans
8.3% Check Cashing
1.0% Remittance or Envois
2.1% Don’t Use banking Services
1.0% Other
CS4C: Final Evaluation Report December 2013 Page 114 of 164
What is your most common method for paying for goods and services? (Check all that apply)
Total (N=96)
3.1% Missing
24% Cash
80.2% Check Card/Debit Card
20.8% Credit Card
1% Other
If you were to receive an extra, unexpected $1,000 right now, how do you think you would use it? (Check all that apply)
Total (N=96)
5.2% Missing
0.0% I would make a large purchase
5.2% I would make several smaller purchases
54.2% I would save the money
63.5% I would pay off debt
CS4C: Final Evaluation Report December 2013 Page 115 of 164
FINANCIAL INTERESTS, GOALS AND EXPERIENCES
Please indicate your areas of interest: (Check all that apply)
Total (N=96)
5.2% Missing
37.5% I want to create a budget or spending plan
25.0% I want to reduce my spending
15.6% I want to learn about checking and savings account options available to me
34.4% I want to get my financial paperwork organized
47.9% I want to repair or establish credit
26.0% I want to reduce my monthly expenses
10.4% I want to learn more about managing my money online
2.1% I want to learn more about direct deposit
39.6% I want to pay down debt
89.6% I want to save for something important
1.0% I want to save to travel
27.1% I want to save for my education
71.9% I want to save for my children’s education
43.8% I want to save for my retirement
19.8% I want to save for buying a car
27.1% I want to save for buying a house
43.8% I want to save for emergencies/rainy day fund
5.2% I want to save for starting a business
1.0% I want to save for another interest not listed
Type of debt (Could write in multiple):
Total (N=96)
51.0% Did not list debt
10.4% Car Loans
14.6% Student Loans
7.3% Medical Bills
30.2% Credit Cards
14.6% Other
CS4C: Final Evaluation Report December 2013 Page 116 of 164
Total debt, including Other debt:
Total (N=96)
51.0% Did not list debt
7.3% Under $1000
16.7% $1000-$5000
4.2% $5000-$10,000
12.5% $10,000-$25,000
8.3% Over $25,000
Please indicate whether you experienced any of the following in the past 6 months: (Check all that apply)
Total (N=96)
6.3% Missing
31.3% I created a spending or budget plan.
34.4% I am following a spending or budget plan.
45.8% I found ways to reduce my spending.
41.7% I made progress toward at least one financial goal.
17.7% I created a debt reduction plan.
33.3% I reduced my debt.
44.8% I set goals for my financial future.
28.1% I was late paying a bill.
33.3% I contributed to a retirement plan.
11.5% I applied for credit and DID NOT receive it.
3.1% I received free food or meals because I couldn’t afford to buy food.
1.0% My gas, electricity, or other utility was turned off.
10.4% My phone, internet or cable TV was turned off.
13.5% I had to borrow money from family or friends.
7.3% I lost my job.
4.2% I was not able to pay the full amount of my rent/mortgage.
1.0% I was evicted for not paying the mortgage or rent.
11.5% I did not pay the full amount of a gas, electric or other utility bill.
8.3% Someone in my household needed to see a doctor, but couldn’t afford the cost.
14.6% Someone in my household needed to see a dentist, but couldn’t afford the cost.
7.3% I worked overtime or took a second job to pay off all of my bills.
5.2% I moved in with someone, even just for a little while, because of financial problems.
CS4C: Final Evaluation Report December 2013 Page 117 of 164
What is your level of financial stress today?:
Total (N=96)
4.2% Missing
4.2% Overwhelming Stress
34.4% High Stress
25.0% Some Stress
26.0% Low Stress
6.3% No Stress
How often do you worry about being able to meet normal monthly living expenses?:
Total (N=96)
4.2% Missing
13.4% Always
12.5% Often
34.4% Sometimes
26.0% Rarely
9.4% Never
How confident are you that you could find the money to pay for a financial emergency?
Total (N=96)
6.3% Missing
14.6% Not at all confident
15.6% Not Likely
22.9% Somewhat Confident
18.8% Likely
21.9% Very Confident
How confident are you that you could borrow $500 from a family member or friend?
Total (N=96)
5.2% Missing
17.7% Not at all confident
14.6% Not Likely
17.7% Somewhat Confident
11.5% Likely
33.3% Very Confident
CS4C: Final Evaluation Report December 2013 Page 118 of 164
How frequently do you find yourself just getting by financially?:
Total (N=96)
5.2% Missing
16.7% Always
20.8% Often
34.4% Sometimes
13.5% Rarely
9.4% Never
How satisfied are you with your present financial situation?
Total (N=96)
5.2% Missing
10.4% Very Disappointed
34.4% Needs improvement
34.4% Somewhat satisfied
13.5% Satisfied
2.1% Completely satisfied
EDUCATIONAL ATTAINMENT
Most of my family members (parents, aunts, siblings, etc) have a 4-year college degree.
Total (N=96)
1.0% Missing
21.9% Yes
74.0% No
3.1% Don’t Know
Most of the people in my neighborhood have a 4-year college degree.
Total (N=96)
1.0% Missing
22.9% Yes
25.0% No
51.0% Don’t Know
CS4C: Final Evaluation Report December 2013 Page 119 of 164
It is necessary to have a college degree to get a good job.
Total (N=96)
1.0% Missing
7.3% Strongly Disagree
10.4% Disagree
4.2% Neutral
35.4% Agree
41.7% Strongly Agree
Is it the child’s responsibility to pay his or her own way through college.
Total (N=96)
1.0% Missing
19.8% Strongly Disagree
45.8% Disagree
24.0% Neutral
8.3% Agree
1.0% Strongly Agree
People who go to college are smarter than other people.
Total (N=96)
1.0% Missing
21.9% Strongly Disagree
37.5% Disagree
12.5% Neutral
20.8% Agree
6.3% Strongly Agree
Parents should do everything they can to make sure their children go to college.
Total (N=96)
2.1% Missing
4.2% Strongly Disagree
5.2% Disagree
0.0% Neutral
20.8% Agree
67.7% Strongly Agree
CS4C: Final Evaluation Report December 2013 Page 120 of 164
EDUCATIONAL GOALS AND PLANNING FOR COLLEGE
Have you completed your own educational goals?
Total (N=96)
1.0% Missing
65.6% No
33.3% Yes
What educational goals do you have for your children?
Total (N=96)
1.0% Missing
2.1% Earn a GED
32.3% Graduate from high school
10.4% Earn a training or technical certificate
8.3% Earn a 2-year degree
71.9% Earn a 4-year degree
49.0% Earn a graduate degree
2.1% I haven’t considered educational goals for my children
27.1% I have the same goals for all of my children
Thinking of your oldest child (under age 18), what are his/her educational goals? (Check all that apply)
Total (N=96)
7.3% Missing
1.0% Earn a GED
26.0% Graduate from high school
2.1% Earn a training or technical certificate
4.2% Earn a 2-year degree
58.3% Earn a 4-year degree
42.7% Earn a graduate degree
5.2% He/she hasn’t considered educational goals
12.5% All of my children have the same educational goals
Do you want at least one of your children to go to college?
Total (N=96)
1.0% Missing
1.0% No
97.9% Yes
CS4C: Final Evaluation Report December 2013 Page 121 of 164
If you would like for at least one of your children go to college, please check all that apply:
Total (N=96)
4.2% Missing
36.5% I have begun saving for my child to go to college
76.0% I am confident my child will attend college
84.4% I talk to my child often about going to college
24.0% I talk with my child’s other parent about saving for college
51.0% My extended family supports my educational goals for my child
70.8% I am confident my child will graduate from college
Which of the following ways do you plan to cover the costs of your child’s education? (Check all that apply)
Total (N=96)
1.0% Missing ( No Response)
61.5% My savings/income
36.5% Child’s savings/income
13.5% Financial support from my child’s other parent
37.5% Loans
76.0% Grants/scholarships
13.5% Financial support from other family members
17.7% I’m not sure how college costs will be covered
Is it likely that any of the following reasons will keep your child from attending college? (Check all that apply)
Total (N=96)
41.7% No barriers identified
38.5% The cost of college is too high
36.5% I won’t be able to save enough money for my child’s college
20.8% There is not enough financial aid for college
5.2% My child may not understand the importance of going to college
8.3% My child’s grades may not be good enough to get into college
4.2% My child may not be “college material”
1% My child may be negatively influenced or may choose wrong choices
2.1% My child may have difficulty finishing the degree
CS4C: Final Evaluation Report December 2013 Page 122 of 164
Appendix E: Exit Survey Results
PERSONAL INFORMATIONo
Age:
Total (N=110)
19.1% Missing
2.7% Under 25
17.3% 25-29
18.2% 30-34
18.2% 35-39
15.5% 40-44
2.7% 45-49
6.4% Over 50
Gender:
Total (N=110)
10.0% Missing
10.0% Male
80.0% Female
Marital Status:
Total (N=110)
12.7% Missing
28.2% Never Married
21.8% Married
10.9% Separated
25.5% Divorced
0.9% Widowed
Race:
Total (N=110)
10.9% Missing
60.0% Hispanic
10.9% Black
1.8% Other
16.4% White
o Only inquirers were asked personal information questions. Information for participants is from the Intake Survey.
CS4C: Final Evaluation Report December 2013 Page 123 of 164
Highest Level of Education:
Total (N=110)
10.0% Missing
5.5% Less than High School
9.1% High School Diploma/GED
37.3% Some College
12.7% 2-Year Degree
18.2% 4-Year Degree
7.3% Master’s Degree
INFORMATION ABOUT CHILDREN
What language is most often spoken in your home?
Total (N=110)
10% Missing
81.8% English
2.7% Spanish
5.5% Both
Including yourself, how many adults live in your household?
Total (N=110)
10.9% Missing
44.6% 1 Adult
30.9% 2 Adults
13.6% 3+ Adults
Children in household:
Total (N=110)
10.9% Missing
0.9% 0 Children
31.8% 1 Child
25.5% 2 Children
21.8% 3 Children
9.1% 4+ Children
CS4C: Final Evaluation Report December 2013 Page 124 of 164
Age of child/children in household: (Could indicate multiple children):
Total (N=110)
10.9% Missing
30.9% Under 5
52.7% Between 5-10
31.8% Between 11-13
38.2% Between 14-18
Do you have a child support order(s)? (Could indicate multiple children)
Total (N=110
0.9% Missing
92.7% Yes
6.4% No
Did you have all of your children with the same partner?
Total (N=110)
11.8% Missing
33.6% Yes
54.5% No
If no, with how many partners have you had children?
Total (N=110)
11.8% Missing
55.5% 1 Partner
29.1% 2 Partners
3.6% 3 or More Partners
EMPLOYMENT AND FINANCIAL INFORMATION
Employment Status:
Total (N=110)
0.9% Missing
69.1% Working Full Time
15.5% Working Part Time
9.1% Not working but looking for work
5.5% Not working and not looking for work
CS4C: Final Evaluation Report December 2013 Page 125 of 164
What is your income from employment per year (before taxes)?:
Total (N=110)
0.9% Missing
26.4% Under $20,000
28.2% $20,000 - $30,000
20% $30,000 - $40,000
8.2% $40,000 - $50,000
4.5% $50,000 - $60,000
6.4% $60,000 - $75,000
5.5% More than $75,000
Do you or any member of your household receive any of the following? (Could check multiple answers)
Total (N=110)
20.0% Missing
31.8% None
3.6% Child care subsidy
13.6% CHIP
26.4% Free or reduced price lunch
10.9% Housing Assistance
21.8% Medicaid for my child
2.7% Medicaid for myself
22.7% SNAP/Food Stamps
8.2% Social Security/SSI/SSDI
1.8% TANF
0.9% Utility Assistance
10.9% WIC
Do you own or rent a home?
Total (N=110)
17.3% Missing
31.8% Own a home
45.5% Rent a home
0.9% Buying a home
4.5% Live with family
CS4C: Final Evaluation Report December 2013 Page 126 of 164
Total household income from all sources:
Total (N=110)
16.4% Missing
17.3% Under $20,000
20.0% $20,000 - $30,000
16.4% $30,000 - $40,000
8.2% $40,000 - $50,000
4.5% $50,000 - $60,000
5.5% $60,000 - $75,000
11.8% More than $75,000
Do you have a checking account?
Total (N=110)
16.4% Missing
6.4% No
77.3% Yes
If yes, checking account current balance?
Total (N=85)
4.7% Missing
37.7% Less than $100
37.7% $100-$500
9.4% $500-$1000
10.6% Over $1000
Do you have a savings account?:
Total (N=110)
16.4% Missing
19.1% No
64.5% Yes
If yes, saving account current balance?
Total (N=71)
7.0% Missing
43.7% Less than $100
22.5% $100-$500
9.9% $500-$1000
16.9% Over $1000
CS4C: Final Evaluation Report December 2013 Page 127 of 164
Do you contribute to a savings account regularly?:
Total (N=71)
0.0% Missing
59.2% No
40.9% Yes
If yes, what amount do you contribute?
Total (N=29)
0.0% Missing
72.4% Less than $100 per month
27.6% $100-$500 per month
0.0% Over $500 per month
Do you have a separate savings account for your child(ren?:
Total (N=110)
16.4% Missing
48.2% No
35.5% Yes
If yes, child savings account current balance?
Total (N=39)
7.7% Missing
33.3% Less than $100
38.5% $100-$500
10.3% $500-$1000
10.3% Over $1000
Does the money you contribute to your child(ren)’s savings account come from child support payments?:
Total (N=39)
0.0% Missing
15.4% Yes, all
30.8% Yes, some
53.9% No, none
CS4C: Final Evaluation Report December 2013 Page 128 of 164
Do you use any of the following services? (Check all that apply)
Total (N=110)
16.4% Missing
63.6% Bank, Credit Union or ATM
60.9% Online Banking
65.5% Direct Deposit
5.5% Pay Day Loans or Short Term Cash Loans
4.5% Check Cashing
0.9% Remittance or Envois
7.3% Don’t Use banking Services
0.9% Other
What is your most common method for paying for goods and services?
Total (N=110)
16.4% Missing
11.8% Cash
64.5% Check Card/Debit Card
7.3% Credit Card
If you were to receive an extra, unexpected $1,000 right now, how do you think you would use it? (Check all that apply)
Total (N=110)
17.3% Missing
0.9% I would make a large purchase
7.3% I would make several smaller purchases
47.3% I would save the money
52.7% I would pay off debt
FINANCIAL INTERESTS, GOALS AND EXPERIENCES
Type of debt (Could write in multiple):
Total (N=110)
30.9% No debt reported
40.9% Car loans
40.9% Student loans
30.0% Medical bills
50.9% Credit cards
20.9% Other
CS4C: Final Evaluation Report December 2013 Page 129 of 164
Total debt, including Other debt:
Total (N=110)
30.9% No debt reported
1.8% Under $1000
2.7% $1000-$5000
11.8% $5000-$10,000
19.1% $10,000-$25,000
33.6% Over $25,000
Please indicate whether you experienced any of the following in the past 6 months: (Check all that apply)
Total (N=110)
19.1% Missing
33.6% I created a spending or budget plan.
32.7% I am following a spending or budget plan.
45.5% I found ways to reduce my spending.
50.0% I made progress toward at least one financial goal.
15.5% I created a debt reduction plan.
27.3% I reduced my debt.
35.5% I set goals for my financial future.
33.6% I was late paying a bill.
28.2% I contributed to a retirement plan.
16.4% I applied for credit and DID receive it.
17.3% I applied for credit and DID NOT receive it.
7.3% I received free food or meals because I couldn’t afford to buy food.
6.4% My gas, electricity, or other utility was turned off.
7.3% My phone, internet or cable TV was turned off.
22.7% I had to borrow money from family or friends.
9.1% I lost my job.
12.7% I was not able to pay the full amount of my rent/mortgage.
0.9% I was evicted for not paying the mortgage or rent.
15.5% I did not pay the full amount of a gas, electric or other utility bill.
15.5% Someone in my household needed to see a doctor, but couldn’t afford the cost.
15.5% Someone in my household needed to see a dentist, but couldn’t afford the cost.
14.5% I worked overtime or took a second job to pay off all of my bills.
2.7% I moved in with someone, even just for a little while, because of financial problems.
CS4C: Final Evaluation Report December 2013 Page 130 of 164
What is your level of financial stress today?
Total (N=110)
17.3% Missing
13.6% Overwhelming Stress
20.9% High Stress
35.5% Some Stress
10.9% Low Stress
1.8% No Stress
How often do you worry about being able to meet normal monthly living expenses?
Total (N=110)
17.3% Missing
19.1% Always
20.9% Often
26.4% Sometimes
11.8% Rarely
4.5% Never
How confident are you that you could find the money to pay for a financial emergency?
Total (N=110)
17.3% Missing
20.9% Not at all confident
22.7% Not Likely
17.3% Somewhat Confident
8.2% Likely
13.6% Very Confident
How confident are you that you could borrow $500 from a family member or friend?
Total (N=110)
18.2% Missing
23.6% Not at all confident
11.8% Not Likely
21.8% Somewhat Confident
8.2% Likely
16.4% Very Confident
CS4C: Final Evaluation Report December 2013 Page 131 of 164
How frequently do you find yourself just getting by financially?:
Total (N=110)
17.3% Missing
33.6% Always
20% Often
18.2% Sometimes
7.3% Rarely
3.6% Never
How satisfied are you with your present financial situation?
Total (N=110)
18.2% Missing
29.1% Very Disappointed
30% Needs improvement
16.4% Somewhat satisfied
4.5% Satisfied
1.8% Completely satisfied
EDUCATIONAL ATTAINMENT
Most of my family members (parents, aunts, siblings, etc) have a 4-year college degree.
Total (N=110)
10.0% Missing
15..5% Yes
71.8% No
2.7% Don’t Know
Most of the people in my neighborhood have a 4-year college degree.
Total (N=110)
10.0% Missing
14.5% Yes
32.7% No
42.7% Don’t Know
CS4C: Final Evaluation Report December 2013 Page 132 of 164
It is necessary to have a college degree to get a good job.
Total (N=110)
18.2% Missing
4.5% Strongly Disagree
2.7% Disagree
6.4% Neutral
17.3% Agree
50.9% Strongly Agree
Is it the child’s responsibility to pay his or her own way through college.
Total (N=110)
18.2% Missing
29.1% Strongly Disagree
20% Disagree
23.6% Neutral
3.6% Agree
5.5% Strongly Agree
People who go to college are smarter than other people.
Total (N=110)
18.2% Missing
29.1% Strongly Disagree
9.1% Disagree
24.5% Neutral
10% Agree
9.1% Strongly Agree
Parents should do everything they can to make sure their children go to college.
Total (N=110)
18.2% Missing
1.8% Strongly Disagree
0.9% Disagree
5.5% Neutral
12.7% Agree
60.9% Strongly Agree
CS4C: Final Evaluation Report December 2013 Page 133 of 164
EDUCATIONAL GOALS AND PLANNING FOR COLLEGE
Have you completed your own educational goals?
Total (N=110)
10.0% Missing
65.5% No
24.5% Yes
What educational goals do you have for your children?
Total (N=110)
18.2% Missing
2.7% Earn a GED
39.1% Graduate from high school
11.8% Earn a training or technical certificate
17.3% Earn a 2-year degree
51.8% Earn a 4-year degree
50.0% Earn a graduate degree
0.9% I haven’t considered educational goals for my children
21.8% I have the same goals for all of my children
Do you want at least one of your children to go to college?
Total (N=110)
17.3% Missing
82.7% Yes
If you would like for at least one of your children go to college, please check all that apply:
Total (N=110)
18.2% Missing
43.6% I have begun saving for my child to go to college.
63.6% I am confident my child will attend college.
71.8% I talk to my child often about going to college.
20.9% I talk with my child’s other parent about saving for college.
45.5% My extended family supports my educational goals for my child.
63.6% I am confident my child will graduate from college.
CS4C: Final Evaluation Report December 2013 Page 134 of 164
Which of the following ways do you plan to cover the costs of your child’s education? (Check all that apply)
Total (N=110)
17.3% Missing
44.5% My savings/income
37.3% Child’s savings/income
18.2% Financial support from my child’s other parent
41.8% Loans
72.7% Grants/scholarships
16.4% Financial support from other family members
17.3% I’m not sure how college costs will be covered
What portion of college costs do you expect to cover with savings? (Check all that apply)
Total (N=110)
17.3% Missing
10.9% Full
20.0% Half
27.3% Less than half
24.5% Very little
Is it likely that any of the following reasons will keep your child from attending college? (Check all that apply)
Total (N=110)
17.3% Missing
40.0% The cost of college is too high.
35.5% I won’t be able to save enough money for my child’s college.
27.3% There is not enough financial aid for college.
10.9% My child may not understand the importance of going to college.
10.9% My child’s grades may not be good enough to get into college.
5.5% Personal Reasons
0.9% My child may be negatively influenced or may choose wrong choices.
19.1% No barriers identified.
Saving for college will help my child(ren) meet their educational goals: (Indicate your level of agreement)
Total (N=110)
18.2% Missing
0.0% Strongly Disagree
3.6% Disagree
8.2% Neutral
10.9% Agree
59.1% Strongly Agree
CS4C: Final Evaluation Report December 2013 Page 135 of 164
A college savings account will motivate my child(ren) to try harder in school: (Indicate your level of agreement)
Total (N=110)
19.1% Missing
0.9% Strongly Disagree
6.4% Disagree
16.4% Neutral
12.5% Agree
42.7% Strongly Agree
A college savings account will motivate my child(ren) to pursue education beyond high school: (Indicate your level of agreement)
Total (N=110)
20.0% Missing (Skip)
0.0% Strongly Disagree
3.6% Disagree
14.5% Neutral
16.4% Agree
45.5% Strongly Agree
EXPERIENCE WITH CS4C MARKETING
How did you hear about the Child Support for College program? (Please check all that apply)
Total (N=110)
0.0% Missing (No Response)
21.8% A letter from the Office of the Attorney General
21.8% An email from the Office of the Attorney General
4.6% A phone call from the Office of the Attorney General
0.9% A letter from RAISE Texas
10.0% A postcard from RAISE Texas
20.9% An email from an organization in your town
4.6% A phone call from an organization in your town
15.5% A poster or flyer in the child support office
6.4% A friend or relative
1.8% VITA Tax Center (self-reported)
3.6% Other (self-reported)
3.6% I don’t remember
CS4C: Final Evaluation Report December 2013 Page 136 of 164
Please indicate how much you agree with the following statement: The original information I received about Child Support for College gave me an accurate understanding of the program.
Total (N=110)
0.9% Missing (No Response)
24.6% Strongly Agree
41.8% Agree
16.4% Neutral
10.9% Disagree
1.8% Strongly Disagree
3.6% I don’t remember the information I received
What prompted you to initially inquire about the Child Support for College program? (Please check all that apply)
Total (N=110)
0.0% Missing (No Response)
50.0% I have been meaning to start a college savings account for my child(ren)
2.7% I was expecting a larger than normal child support payment
57.3% I liked the idea of having my contributions to a college savings account matched by the program
57.3% I really want my child(ren) to attend college
14.6% I wanted to receive free financial coaching
3.6% My finances allow me to save now
5.5% I thought I might learn more about the child support system
39.1% It offered an opportunity obtain money for my child(ren)’s education
EXPERIENCE WITH CS4C LOCAL ORGANIZATION
Please select your area and corresponding community organization:
Total (N=110)
0.0% Missing (No Response)
46.4% Foundation Communities (Austin)
3.6% Brazos Valley Community Development Corporation (Bryan/College Station)
50.0% United Way of San Antonio and Bexar County (San Antonio)
Have you gone to your local organization for any services, besides Child Support for College, in the past two years?
Total (N=110)
1.8% Missing (No Response)
71.8% No
26.4% Yes
CS4C: Final Evaluation Report December 2013 Page 137 of 164
Have any of your friends or relatives gone to your local organization for services, besides Child Support for College, in the past two years?
Total (N=110)
0.0% Missing (No Response)
72.7% No
27.3% Yes
Overall, what type of reputation does your local organization have in your community?
Total (N=110)
0.0% Missing (No Response)
40.9% Very good
30.0% Good
6.4% Neutral
0.9% Negative
21.8% I don’t know
CS4C: Final Evaluation Report December 2013 Page 138 of 164
REASONS FOR NON-PARTICIPATION OR ACCOUNT OPENINGp
Why didn’t you want to participate or open an account with CS4C? (Please check all that apply)
Total (N=72)
8.3% Missing
13.9% I did not understand how CS4C worked
2.8% When I learned more about CS4C, I decided it wasn’t for me
0.0% I don’t have a child who wants to attend college
1.4% I don’t have a child support case
4.2% I thought CS4C would give my child(ren) a scholarship without any contribution from me
2.8% I thought CS4C sounded too good to be true and might be a scam
6.9% The CS4C process was too complex for me to participate
15.3% I don’t have time for financial coaching
2.8% The person I spoke to/my financial coach discouraged me from participating
1.4% The person I spoke to/my financial coach did not seem knowledgeable about saving for college
9.7% I wasn’t sure a college savings account was the right investment for me
37.5% I don’t have enough money to open a college savings account
27.8% I’m not receiving child support consistently enough to open a college savings account
9.7% I was worried that I would not be able to access the money I deposited into a college savings account
4.2% I was afraid a college savings account would hurt my government benefits
5.6% I thought opening a college savings account would hurt my child(ren)’s chances of getting a scholarship or financial aid
1.4% The college savings account were too confusing
1.4% The college savings accounts were difficult to open
1.4% I wanted to save in the TTPF but could not enroll because the deadline had passed
8.3% I chose to pay down debt instead of saving right now
4.2% I would rather save on my own
1.4% I lost my job
2.8% I did not receive the larger-than-expected (lump sum) child support payment I was expecting
6.9% I missed the deadline/was too late (self-report)
2.8% I missed or couldn’t schedule a meeting (self-report)
1.4% I already have a college savings account (self-report)
p This section includes results only for individuals who administrative records indicate did not open accounts. Results for
both inquirers and participants who did not open accounts (non-openers) are combined.
CS4C: Final Evaluation Report December 2013 Page 139 of 164
A college savings account with $500 already in it: (Indicate much more likely you would be to open an account)
Total (N=72)
8.3% Missing
4.2% Not at all
0.0% Somewhat
6.9% Likely
9.7% More likely
70.8% Much more likely
Access to your account at a local bank: (Indicate much more likely you would be to open an account)
Total (N=72)
13.9% Missing
8.3% Not at all
1.4% Somewhat
15.3% Likely
12.5% More likely
48.6% Much more likely
Ability to withdraw money in the case of an emergency: (Indicate much more likely you would be to open an account)
Total (N=72)
13.9% Missing
12.5% Not at all
5.6% Somewhat
11.1% Likely
11.1% More likely
45.8% Much more likely
A direct deposit from your child support payment: (Indicate much more likely you would be to open an account)
Total (N=72)
12.5% Missing
8.3% Not at all
6.9% Somewhat
12.5% Likely
9.7% More likely
50.0% Much more likely
CS4C: Final Evaluation Report December 2013 Page 140 of 164
The opportunity to establish an account when the child support order is established: (Indicate much more likely you would be to open an account)
Total (N=72)
20.8% Missing
15.3% Not at all
6.9% Somewhat
13.9% Likely
12.5% More likely
30.6% Much more likely
More information about college savings: (Indicate much more likely you would be to open an account)
Total (N=72)
15.3% Missing
9.7% Not at all
5.6% Somewhat
12.5% Likely
8.3% More likely
48.6% Much more likely
Access to additional financial coaching (in the future) to help you with the account: (Indicate much more likely you would be to open an account)
Total (N=72)
15.3% Missing
13.9% Not at all
4.2% Somewhat
15.3% Likely
8.3% More likely
43.1% Much more likely
CS4C: Final Evaluation Report December 2013 Page 141 of 164
EXPERIENCE WITH CS4C FINANCIAL COACHINGq
How many financial coaching sessions have you attended?
Total (N=53)
13.2% Missing
32.1% 1 session
15.1% 2 sessions
7.6% 3 sessions
13.2% 4 sessions
18.9% 5 or more sessions
The financial coaching sessions were useful: (Indicate your level of agreement)
Total (N=53)
13.2% Missing
3.8% Strongly Disagree
7.5% Disagree
9.4% Neutral
18.9% Agree
47.2% Strongly Agree
My financial coach was knowledgeable about how to financially prepare for college: (Indicate your level of agreement)
Total (N=53)
13.2% Missing
3.8% Strongly Disagree
7.5% Disagree
7.5% Neutral
18.9% Agree
49.1% Strongly Agree
q This section includes results only for individuals who administrative records indicate completed at least one financial
coaching session prior to survey completion. Respondents were asked to identify themselves as participants, but, because
their identification did not always match administrative records, this question is not shown or used.
CS4C: Final Evaluation Report December 2013 Page 142 of 164
My financial coach was knowledgeable about different types of college savings accounts (Indicate your level of agreement)
Total (N=53)
13.2% Missing
5.7% Strongly Disagree
5.7% Disagree
11.3% Neutral
20.8% Agree
43.4% Strongly Agree
My financial coach provided enough information to help me make a decision about opening a college savings account: (Indicate your level of agreement)
Total (N=53)
13.2% Missing
3.8% Strongly Disagree
7.5% Disagree
7.5% Neutral
20.8% Agree
47.2% Strongly Agree
My financial coach was knowledgeable about other financial topics.: (Indicate your level of agreement)
Total (N=53)
13.2% Missing
7.5% Strongly Disagree
5.7% Disagree
7.5% Neutral
20.8% Agree
45.3% Strongly Agree
I felt comfortable with my financial coach: (Indicate your level of agreement)
Total (N=53)
13.2% Missing
1.9% Strongly Disagree
3.8% Disagree
9.4% Neutral
18.9% Agree
52.8% Strongly Agree
CS4C: Final Evaluation Report December 2013 Page 143 of 164
I felt like my financial coach can relate to my financial situation: (Indicate your level of agreement)
Total (N=53)
13.2% Missing
7.5% Strongly Disagree
3.8% Disagree
13.2% Neutral
18.9% Agree
43.4% Strongly Agree
The sessions helped me achieve my financial goals: (Indicate your level of agreement)
Total (N=53)
13.2% Missing
11.3% Strongly Disagree
0.0% Disagree
11.3% Neutral
24.5% Agree
39.6% Strongly Agree
Indicate whether or not the financial coaching has helped you with any of the topics below:
Total (N=53)
15.1% Missing
49.1% Get my financial paperwork organized
52.8% Create a budget or spending plan
47.2% Reduce my spending
43.4% Learn about checking and savings account options available to me
35.9% Repair or establish credit
45.3% Reduce my monthly expenses
41.5% Learn more about managing my money online
26.4% Learn more about direct deposit
37.7% Pay down debt
26.4% Refinance loans or debt
60.4% Save for something important
CS4C: Final Evaluation Report December 2013 Page 144 of 164
For what did the financial coaching sessions help you to save?
Total (N=53)
39.6% Missing
3.8% Financial coaching helped me save for my education
43.4% Financial coaching helped me save for children’s education
3.8% Financial coaching helped me save for retirement
0.0% Financial coaching helped me save for buying a car
7.6% Financial coaching helped me save for buying a house
11.3% Financial coaching helped me save for emergencies/rainy day fund
1.9% Financial coaching helped me save for starting a business
Do you plan to complete more financial coaching sessions before 8/31/2013?
Total (N=53)
13.2% Missing
18.9% Yes
30.2% No
37.7% Don’t Know
EXPERIENCE WITH CS4C ACCOUNT OPENINGr
How are you related to the child(ren) you opened accounts for through CS4C? (Please check all that apply)
Total (N=38)
7.9% Missing
84.2% Parent
0.0% Stepparent
7.9% Grandparent
2.6% Conservator
What type of college savings account did you open with CS4C?
Total (N=38)
7.9% Missing
89.5% Texas College Savings (529) Account
0.0% Texas Tuition Promise Fund Account
2.6% Not Sure
r This section includes results only for individuals who administrative records indicate opened an account prior to survey
completion. Respondents were asked to identify themselves as account openers, but, because their identification did not
always match administrative records, this question is not shown or used.
CS4C: Final Evaluation Report December 2013 Page 145 of 164
Why did you choose your account type?
Total (N=38)
10.5% Missing
71.1% After researching the different account types, I felt that that account was the best fit for me
15.8% My financial coach recommended the account
0.0% I felt the Texas College Savings (529) account was too risky
0.0% The Texas College Savings (529) account was too confusing
7.9% Enrollment for the Texas Tuition Promise Fund was closed
13.2% The Texas Tuition Promise Fund was too confusing
Opening a college savings account is a chance for me to give my child(ren) opportunities I did not have: (Indicate your level of agreement)
Total (N=38)
7.9% Missing
2.6% Strongly Disagree
2.6% Disagree
13.2% Neutral
5.3% Agree
68.4% Strongly Agree
I felt that putting away money for my child(rens) education was important: (Indicate your level of agreement)
Total (N=38)
10.5% Missing
2.6% Strongly Disagree
0.0% Disagree
0.0% Neutral
2.6% Agree
84.2% Strongly Agree
I want to take an active role in helping my child(ren) pursue higher education: (Indicate your level of agreement)
Total (N=38)
10.5% Missing
2.6% Strongly Disagree
0.0% Disagree
0.0% Neutral
2.6% Agree
84.2% Strongly Agree
CS4C: Final Evaluation Report December 2013 Page 146 of 164
The matched contributions motivated me to open an account: (Indicate your level of agreement)
Total (N=38)
13.2% Missing
5.3% Strongly Disagree
0.0% Disagree
0.0% Neutral
0.0% Agree
81.6% Strongly Agree
The financial coaching sessions motivated me to open an account: (Indicate your level of agreement)
Total (N=38)
10.5% Missing
5.3% Strongly Disagree
2.6% Disagree
15.8% Neutral
10.5% Agree
55.3% Strongly Agree
Receiving a larger than expected (lump sum) child support payment motivated me to open an account: (Indicate your level of agreement)
Total (N=38)
10.5% Missing
39.5% Strongly Disagree
10.5% Disagree
10.5% Neutral
5.3% Agree
23.7% Strongly Agree
I had been wanting to start saving for my child(ren)’s education, but I just needed a “push”: (Indicate your level of agreement)
Total (N=38)
10.5% Missing
10.5% Strongly Disagree
5.3% Disagree
7.9% Neutral
15.8% Agree
50.0% Strongly Agree
CS4C: Final Evaluation Report December 2013 Page 147 of 164
I felt saving through one of these accounts was a good investment choice: (Indicate your level of agreement)
Total (N=38)
10.5% Missing
2.6% Strongly Disagree
0.0% Disagree
10.5% Neutral
13.2% Agree
63.2% Strongly Agree
I regularly access statements about the account balances for my college savings account(s): (Indicate your level of agreement)
Total (N=38)
7.9% Missing
5.3% Strongly Disagree
7.9% Disagree
15.8% Neutral
18.4% Agree
44.7% Strongly Agree
I can see all incentives contributes from CS4C on my account statements: (Indicate your level of agreement)
Total (N=38)
7.9% Missing
7.9% Strongly Disagree
7.9% Disagree
13.2% Neutral
15.8% Agree
47.4% Strongly Agree
The process for receiving incentive payments was simple: (Indicate your level of agreement)
Total (N=38)
10.5% Missing
5.3% Strongly Disagree
5.3% Disagree
18.4% Neutral
7.9% Agree
52.6% Strongly Agree
CS4C: Final Evaluation Report December 2013 Page 148 of 164
I regularly discuss the college savings account(s) I opened through CS4C with my child(ren): (Indicate your level of agreement)
Total (N=38)
7.9% Missing
7.9% Strongly Disagree
7.9% Disagree
23.7% Neutral
23.7% Agree
28.9% Strongly Agree
I regularly discuss the college savings account(s) I opened through CS4C with the other parent or parents of my child(ren): (Indicate your level of agreement)
Total (N=38)
7.9% Missing
21.1% Strongly Disagree
7.9% Disagree
15.8% Neutral
15.8% Agree
31.6% Strongly Agree
In the future, I plan on making regular deposits into the college savings account: (Indicate your level of agreement)
Total (N=38)
7.9% Missing
5.3% Strongly Disagree
2.6% Disagree
7.9% Neutral
13.2% Agree
63.2% Strongly Agree
Opening this account has increased my child(ren)’s chances of going to college: (Indicate your level of agreement)
Total (N=38)
7.9% Missing
5.3% Strongly Disagree
2.6% Disagree
10.5% Neutral
15.8% Agree
57.9% Strongly Agree
CS4C: Final Evaluation Report December 2013 Page 149 of 164
OVERALL EXPERIENCE WITH CS4Cs
The CS4C program helped me make a realistic plan for my child(ren)’s future education: (Indicate your level of agreement)
Total (N=53)
13.2% Missing
3.8% Strongly Disagree
7.5% Disagree
9.4% Neutral
20.8% Agree
45.3% Strongly Agree
Financial coaching gave me a better understanding of the costs of college or other higher education: (Indicate your level of agreement)
Total (N=53)
13.2% Missing
7.5% Strongly Disagree
9.4% Disagree
18.9% Neutral
17.0% Agree
34.0% Strongly Agree
Financial coaching gave me a better understanding of how to save for college: (Indicate your level of agreement)
Total (N=53)
13.2% Missing
7.5% Strongly Disagree
11.3% Disagree
13.2% Neutral
13.2% Agree
41.5% Strongly Agree
s This section includes results only for individuals who administrative records indicate completed at least one financial
coaching session prior to survey completion. Respondents were asked to identify themselves as participants, but, because
their identification did not always match administrative records, this question is not shown or used.
CS4C: Final Evaluation Report December 2013 Page 150 of 164
The CS4C program helped me realize the importance of saving: (Indicate your level of agreement)
Total (N=53)
15.1% Missing
7.5% Strongly Disagree
9.4% Disagree
7.5% Neutral
24.5% Agree
35.8% Strongly Agree
CS4C gave me a “push” to save for my child(ren)’s future education: (Indicate your level of agreement)
Total (N=53)
13.2% Missing
9.4% Strongly Disagree
5.7% Disagree
7.5% Neutral
17.0% Agree
47.2% Strongly Agree
I wish I had begun a program like CS4 when my child(ren) were younger: (Indicate your level of agreement)
Total (N=53)
13.2% Missing
7.5% Strongly Disagree
5.7% Disagree
9.4% Neutral
15.1% Agree
49.1% Strongly Agree
CS4C CLIENT KNOWLEDGE ABOUT COLLEGE SAVINGS ACCOUNTS
529 Accounts offer a tax-advantaged way to save for higher education (TRUE):
Total (N=110)
18.2% Missing
46.4% True
1.8% False
33.6% Don’t Know
CS4C: Final Evaluation Report December 2013 Page 151 of 164
529 accounts invest money in the stock market, which can be risky (TRUE):
Total (N=110)
19.1% Missing
33.6% True
15.5% False
31.8% Don’t Know
There are several options for how risky I want my 529 investments to be (TRUE):
Total (N=110)
19.1% Missing
34.5% True
7.3% False
39.1% Don’t Know
The money I invest can only be used for tuition expenses (FALSE):
Total (N=110)
20.0% Missing
27.3% True
21.8% False
30.9% Don’t Know
If the child I chose as the beneficiary does not want to pursue any additional education after high school, the money I invested is lost (FALSE):
Total (N=110)
19.1% Missing
5.5% True
39.1% False
36.4% Don’t Know
My child can use 529 funds for education expenses at any accredited U.S. college or post-secondary institution (True):
Total (N=110)
19.1% Missing
47.3% True
1.8% False
31.8% Don’t Know
CS4C: Final Evaluation Report December 2013 Page 152 of 164
The minimum contribution required to open an account is $100 (FALSE):
Total (N=110)
19.1% Missing
28.2% True
20.0% False
32.7% Don’t Know
In calculations for financial aid eligibility, a 529 is counted as a parent asset (TRUE):
Total (N=110)
19.1% Missing
20.0% True
9.1% False
51.8% Don’t Know
Having money in a 529 account could impact the benefits someone receives from TANF, Medicaid, or SNAP (food stamps) (FALSE):
Total (N=110)
19.1% Missing
9.1% True
21.8% False
50.0% Don’t Know
The Texas Tuition Promise Fund offers a tax-advantaged way to save for higher education (TRUE):
Total (N=110)
19.1% Missing
37.3% True
1.8% False
41.8% Don’t Know
The Texas Tuition Promise Fund allows account holders to prepay for tuition and required fees (TRUE):
Total (N=110)
20.0% Missing
39.1% True
2.7% False
38.2% Don’t Know
CS4C: Final Evaluation Report December 2013 Page 153 of 164
Even if tuition at a Texas public college or university rises significantly, prepaid tuition units will have “locked in” tuition for my child (TRUE):
Total (N=110)
19.1% Missing
39.1% True
1.8% False
40.0% Don’t Know
I can enroll in the Texas Tuition Promise Fund at any time during the year (FALSE):
Total (N=110)
20.0% Missing
13.6% True
14.5% False
51.8% Don’t Know
The money I invest cannot be used for room and board or books (TRUE):
Total (N=110)
21.8% Missing
17.3% True
8.2% False
52.7% Don’t Know
If the child I chose as the beneficiary does not want to pursue education after high school, the money I invested is lost (FALSE):
Total (N=110)
20.0% Missing
8.2% True
24.5% False
47.3% Don’t Know
If my child chooses to attend an out-of-state or private college, I can apply the Transfer Value of tuition units purchased towards tuition and fees (TRUE):
Total (N=110)
20.0% Missing
21.8% True
4.5% False
53.6% Don’t Know
CS4C: Final Evaluation Report December 2013 Page 154 of 164
The minimum contribution required to open an account is $100 (FALSE):
Total (N=110)
20.0% Missing
18.2% True
16.4% False
45.5% Don’t Know
CS4C: Final Evaluation Report December 2013 Page 155 of 164
Appendix F: Focus Group Detail
Texas Child and Family Research Partnership conducted two focus groups in March 2013 with individuals who had contacted program partners about the Child Support for College program (CS4C). The purpose of these focus groups was to learn more about the experiences and opinions of parents who either inquired about CS4C or became participants. Discussions were audio-taped with participant permission, and the tapes were transcribed with all identifying information removed. Names of participants will be kept confidential. The first focus group was conducted on Tuesday, March 26th at Foundation Communities in Austin, TX. The session was held from 6pm to 8pm in a second floor classroom of the Community Financial Center. Eight parents participated in the focus group. All focus group members were provided with dinner and a $20 gift card to HEB. The second focus group was conducted on Thursday, March 28th, at Café College in San Antonio, TX. The session was held from 6pm to 7:45 pm at Conference Room #4 in the Phase 2 building. Five parents participated in the focus group. All focus group members were provided with dinner and a $20 gift card to HEB. Table 7 shows the distribution of focus group members by number of inquirers, participants, account holders, and accounts. Table 7: CS4C Focus Group Characteristics
Site Focus Group (N) # of Inquiries # of Participants # of Accounts # of Account Holders
Austin 8 3 5 5 3
San Antonio 5 1 4 2 2
CS4C: Final Evaluation Report December 2013 Page 156 of 164
Appendix G: Material Hardship Index The material hardship index, as shown in Figure 3, was constructed using the following indicators:
I was late paying a bill;
I applied for credit and did not receive it;
I received free food or meals because I couldn’t afford to buy food;
My gas, electricity, or other utility was turned off;
My phone, Internet, or cable TV was turned off;
I had to borrow money from family or friends;
I lost my job;
I was not able to pay the full amount of my rent/mortgage;
I was evicted for not paying the mortgage or rent;
I did not pay the full amount of a gas, electric, or other utility bill;
Someone in my household needed to see a doctor, but couldn’t afford the cost;
Someone in my household needed to see a dentist, but couldn’t afford the cost;
I worked overtime or took a second job to pay all of my bills; and
I moved in with someone, even just for a little while, because of financial problems. Figure 20: Material Hardship Index by Type
Source: Exit survey results
18.6%
12.6%
9.5%
8.5%8.5%
8.5%
8.0%
7.0%
5.0%
4.0%
4.0%3.5%1.5%0.5%
Total
18.9%
15.6%
10.0%
8.9%7.8%
5.6%
7.8%
5.6%
5.6%
5.6%
3.3%3.3%2.2%
Inquirers
17.9%
11.9%
9.0%
7.5%10.4%
13.4%
7.5%
6.0%
6.0%
3.0%4.5%
3.0%
Account Openers
Late Paying a Bill Had to Borrow Money Not Approved for Credit
Did Not Pay Full Utility Couldn't Afford Doctor Couldn't Afford Dentist
Worked Overtime or Took Second Job Couldn't Pay Full Rent or Mortgate Lost my Job
Received Free Food or Meals Phone, Internet, or Cable Turned Off Utilities Turned Off
Moved in with Someone bc of Financial Problems Evicted
CS4C: Final Evaluation Report December 2013 Page 157 of 164
ENDNOTES
1 Carnevale, Anthony P., Stephen J. Rose and Ban Cheah. (2011, August 5). The College Payoff: Education, Occupations,
Lifetime Earnings. The Georgetown University Center on Education and the Workforce. Retrieved from http://www9.georgetown.edu/grad/gppi/hpi/cew/pdfs/collegepayoff-complete.pdf 2 Baum, Sandy, Jennifer Ma, and Kathleen Payea. (2010). Education Pays 2010: The Benefits of Higher Education for
Individuals and Society. College Board, Trends in Higher Education Series. Retrieved from http://trends.collegeboard.org/sites/default/files/education-pays-2010-full-report.pdf 3 Carnevale, Anthony P., Nicole Smith, and Jeff Strohl. (2013). Recovery: Job Growth and Education Requirements through
2020. Georgetown University. Georgetown Public Policy Institute. Center on Education and Workforce. 4 Ibid.
5 US Department of Commerce, Census Bureau, Current Population Survey (CPS), School Enrollment. October, 1967 through
2012. 6 Hauser, R. M. (1993). Trends in college entry among Whites, Blacks, and Hispanics. In Studies of supply and demand in
higher education (pp. 61-120). University of Chicago Press; Kane, T. J. (2004). College-going and inequality. Social inequality, 319-354; Cameron, S. V., & Heckman, J. J. (2001). The dynamics of educational attainment for Black, Hispanic, and White males. Journal of Political Economy, 109(3), 455-499. 7 US Department of Commerce, Census Bureau, Current Population Survey (CPS), School Enrollment. October, 1967 through
2012. 8 Fry, Richard. (2010). Minorities and the Recession-Era College Enrollment Boom. Pew Research. Social and Demographic
Trends. Retrieved from http://www.pewsocialtrends.org/2010/06/16/minorities-and-the-recession-era-college-enrollment-boom/ 9 U.S. Department of Education. (2012, August). Higher Education: Gaps in Access and Persistence Study. National Center
for Education Statistics.NCES 2012-046. Retrieved from http://nces.ed.gov/pubs2012/2012046.pdf; JBHE. (2013, October). The Persisting Racial Gap in College Student Graduation Rates. The Journal of Blacks in Higher Education. Racial Gap. Retrieved from http://www.jbhe.com/2013/10/the-persisting-racial-gap-in-college-student-graduation-rates/ 10
Bailey, M. J., & Dynarski, S. M. (2011). Gains and gaps: Changing inequality in US college entry and completion (No. w17633). National Bureau of Economic Research.; High School Benchmarks Report (2013). Naitonal College Progression Rates. National Student Clearinghouse Research Center. 11
Aud, S., Hussar, W., Planty, M., Snyder, T., Bianco, K., Fox, M. A., & Drake, L. (2010). The Condition of Education 2010. NCES 2010-028. National Center for Education Statistics. 12
Aud, S., Hussar, W., Planty, M., Snyder, T., Bianco, K., Fox, M. A., & Drake, L. (2010). The Condition of Education 2010. NCES 2010-028. National Center for Education Statistics. 13
Bailey, M. J., & Dynarski, S. M. (2011). Gains and gaps: Changing inequality in US college entry and completion (No. w17633). National Bureau of Economic Research. 14
Bailey, M. J., & Dynarski, S. M. (2011). Gains and gaps: Changing inequality in US college entry and completion (No. w17633). National Bureau of Economic Research; The role of savings and wealth in reducing “wilt” between expectations and college attendance. Journal of Children and Poverty, 17 (2), 165–185 15
ACSFA (2006). Mortgaging our future: How financial barriers to college undercut America's global competitiveness. Advisory Committee on Student Financial Assistance, Washington, DC (2006); Elliott, W., & Beverly, S. (2011); Haveman, R. H., & Smeeding, T. M. (2006). The role of higher education in social mobility. The Future of Children, 16(2), 125-150. 16
Jamrisko, Michelle and Ilan Kolet. (2012, August 15). Cost of College Degree in U.S. Soars 12 Fold: Chart of the Day. Bloomberg. Retrieved from http://www.bloomberg.com/news/2012-08-15/cost-of-college-degree-in-u-s-soars-12-fold-chart-of-the-day.html 17
College Board. (2001). Trends in college pricing. Retrieved from http://trends.collegeboard.org/sites/default/files/CP_2001.pdf 18
College Board. (2013). Average Published Tuition and Fees by State, 2004-05 Through 2012-13. College Board, Trends in Higher Education, Table 5. Retrieved from http://trends.collegeboard.org/college-pricing/figures-tables/state-tuition-and-fees-state-and-sector-over-time
Sallie Mae. (2013). How America Saves for College 2013. A National Study by Sallie Mae and Ipsos Public Affairs. Retrieved from https://www.salliemae.com/assets/core/how-America-Saves/HowAmericaSaves_Report2013.pdf 21
Ibid. 22
Sallie Mae. (2010). How America Saves for College 2010. A National Study by Sallie Mae and Gallup. Retrieved from https://www.salliemae.com/assets/Core/how-America-saves/how_america_saves_100410_final3.pdf 23
Sallie Mae. (2013). 24
Ibid. 25
Ibid. 26
Ibid. 27
Ibid. 28
Ibid. 29
Ibid. 30
Sallie Mae. (2012). How America Pays for College 2012. A national study by Sallie Mae and Ipsos. Retrieved from https://www.salliemae.com/assets/Core/how-America-pays/HowAmericaPays2012.pdf 31
Wei, C.C., Berkner, L., He, S., Lew, S., Cominole, M., and Siegel, P. (2009). 2007–08 National Postsecondary Student Aid Study (NPSAS:08): Student Financial Aid Estimates for 2007–08: First Look (NCES 2009-166). National Center for Education Statistics, Institute of Education Sciences, U.S. Department of Education. Washington, DC. http://nces.ed.gov/pubs2009/2009166.pdf 32
Huh, Christina. “Excerpt: Secrets to Winning a Scholarship.” American Public Media, Marketplace Big Book, April 15, 2011. 33
United States. Consumer Financial Protection Bureau. (2013). Paying for College. Student Loans: Choosing a loan that's right for you. Consumer Financial Protection Bureau. Retrieved from http://www.consumerfinance.gov/paying-for-college/choose-a-student-loan/#o1 34
Fico. (2013, January 30). FICO Labs: U.S. Student Loan Delinquencies Climbing Fast, Showing No Signs of Slowing” FICO, News Release. Retrieved from http://www.fico.com/en/Company/News/Pages/01-29-2013-FICO-Labs-US-Student-Loan-Delinquencies-Climbing-Fast-Showing-No-Signs-of-Slowing.aspx 35
Ibid. 36
Brooks, Jennifer and Kasey Wiedrich. (2013, January). Assets & Opportunity SCORECARD: Living on the Edge: Financial Insecurity and Policies to Rebuild Prosperity in America. CFED. Retrieved from http://assetsandopportunity.org/assets/pdf/2013_Scorecard_Report.pdfhttp://assetsandopportunity.org/assets/pdf/2013_Scorecard_Report.pdf 37
CFED. (2013). Assets and Opportunities Scorecard: Texas. CFED. Retrieved from http://scorecard.assetsandopportunity.org/2013/state/tx 38
U.S. Department of Education. (2013) Repayment Comparison Calculator. Federal Student Aid. Retrieved from http://studentaid.ed.gov/repay-loans/understand/plans/standard/comparison-calculator 39
U.S. Department of Education. (2013) Understanding Default. Federal Student Aid. Retrieved from http://studentaid.ed.gov/repay-loans/default#what-is-default 40
Ibid. 41
Nam, Y., Kim, Y., Clancy, M., Zager, R., & Sherraden, M. (2013). Do Child Development Accounts promote account holding, saving, and asset accumulation for children's future? Evidence from a statewide randomized experiment. Journal of Policy Analysis and Management, 32(1), 6-33. 42
Elliott, W. (2013). Small-dollar children's savings accounts and children's college outcomes. Children and Youth Services Review, 35(3), 572-585.; Elliott, W., & Beverly, S. (2011). Staying on course: The effects of savings and assets on the college progress of young adults. American Journal of Education, 117(3), 343-374.; Elliott III, W., & Beverly, S. G. (2011). The role of savings and wealth in reducing ‘wilt’between expectations and college attendance. Journal of Children and Poverty, 17(2), 165-185. 43
Elliott, W. (2013). Small-dollar children's savings accounts and children's college outcomes. Children and Youth Services Review, 35(3), 572-585.
CS4C: Final Evaluation Report December 2013 Page 159 of 164
44
Elliott, W. (2013). 45
Elliott III, W., & Beverly, S. G. (2011). The role of savings and wealth in reducing ‘wilt’between expectations and college attendance. Journal of Children and Poverty, 17(2), 165-185. 46
Ibid.; Elliott, William. (2013). Are All Types of College Financial Aid Created Equal? St. Louis Fed. Bridges. Winter 2012-2013 47
CFED. (2013). Resource Guide: College Savings Incentives. CFED, Assets and Opportunity Scorecard. Retrieved from http://cfed.org/assets/scorecard/2013/rg_CollegeSavingsIncentives2013.pdf 48
Ibid. 49
Texas Comptroller of Public Accounts. (2013, October). About Us. Texas Match the Promise Foundation. Retrieved from http://www.matchthepromise.org/ 50
Texas Comptroller of Public Accounts (2013, October). Eligibility and Selection Criteria. Texas Match the Promise Foundation. Retrieved from: http://www.matchthepromise.org/ 51
Texas Comptroller of Public Accounts. (2013, October). Scholarships and Grants. Texas Match the Promise Foundation. Retrieved from: http://www.matchthepromise.org/ 52
Center for Public Policy Priorities. (2012, October). Dollar for Dollar: Incentives and Innovations to Boost Savings in Texas. CPPP. Retrieved from http://opportunitytexas.org/images/stories/dollar_for_dollar.pdf 53
Center for Public Policy Priorities. (2012, October). Dollar for Dollar: Incentives and Innovations to Boost Savings in Texas. CPPP. Retrieved from http://opportunitytexas.org/images/stories/dollar_for_dollar.pdf 54
Center for Public Policy Priorities. (2012, May). The Cost of College: How Texas Students and Families are Financing College Education. CPPP. Retrieved from http://library.cppp.org/files/2/2012_05_JO_Cost_Of_College.pdf 55
CFED. (2013). Resource Guide: College Savings Incentives. CFED, Assets and Opportunity Scorecard. Retrieved from http://cfed.org/assets/scorecard/2013/rg_CollegeSavingsIncentives2013.pdf 56
Obrien, Rourke. (2009, November). 529s and Public Assistance: Asset Limits as a Barrier to College Savings. New America Foundation. Retrieved from http://newamerica.net/publications/policy/529s_and_public_assistance 57
Obrien, Rourke. (2009, November). 529s and Public Assistance: Asset Limits as a Barrier to College Savings. New America Foundation. Retrieved from http://newamerica.net/publications/policy/529s_and_public_assistance 58
CFED. (2013). Resource Guide: Lifting Asset Limits in Public Benefit Programs. CFED, Assets and Opportunities Scorecard. Retrieved from http://cfed.org/assets/scorecard/2013/rg_AssetLimits_2013.pdf 59
Sallie Mae. (2013). 60
United States Government Accountability Office. (2012, December). Higher Education: A Small Percentage of Families Save in 529 Plans. Report to the Chairman, Committee on Finance, U.S. Senate. GAO. Retrieved from http://www.gao.gov/assets/660/650759.pdf 61
U.S. Department of Education. (2012). The EFC Formula, 2011-2012. Federal Student Aid. IFAP. EFC Formula Guide. 62
United States Government Accountability Office. (2012, December). Higher Education: A Small Percentage of Families Save in 529 Plans. Report to the Chairman, Committee on Finance, U.S. Senate. GAO. Retrieved from http://www.gao.gov/assets/660/650759.pdf 63
Texas House Bill 3708. Relating to measures regarding high school completion and enrollment in higher education. Sec. 56.007. EXCLUSION OF ASSETS IN PREPAID TUITION PROGRAMS AND HIGHER EDUCATION SAVINGS PLANS. Signed June 2011. 64
Texas House Bill 3708. Relating to measures regarding high school completion and enrollment in higher education. Sec. 56.007. EXCLUSION OF ASSETS IN PREPAID TUITION PROGRAMS AND HIGHER EDUCATION SAVINGS PLANS. Signed June 2011. 65
Nam, Y., Kim, Y., Clancy, M., Zager, R., & Sherraden, M. (2013). Do Child Development Accounts promote account holding, saving, and asset accumulation for children's future? Evidence from a statewide randomized experiment. Journal of Policy Analysis and Management, 32(1), 6-33. 66
Duflo, E., Gale, W., Liebman, J., Orszag, P., & Saez, E. (2006). Saving incentives for low-and middle-income families: Evidence from a field experiment with H&R Block. The Quarterly Journal of Economics, 121(4), 1311-1346.; Mills, G., Gale, W. G., Patterson, R., Engelhardt, G. V., Eriksen, M. D., & Apostolov, E. (2008). Effects of individual development accounts on
CS4C: Final Evaluation Report December 2013 Page 160 of 164
asset purchases and saving behavior: Evidence from a controlled experiment. Journal of Public Economics, 92(5), 1509-1530. 67
Santiago, A. M. (2011). Asset Building and Low-Income Families, by McKernan, SM., & Sherraden, M.(Eds.) (2008). Asset Building and Low-Income Families. Washington, DC: Urban Institute Press. ISBN: 978-0-87766-754-3, 284 pp. Journal of Community Practice, 19(4), 468-472. 68
Nam, Y., Kim, Y., Clancy, M., Zager, R., & Sherraden, M. (2013). Do Child Development Accounts promote account holding, saving, and asset accumulation for children's future? Evidence from a statewide randomized experiment. Journal of Policy Analysis and Management, 32(1), 6-33. 69
Dynarski, S. M. (2004). Who benefits from the education saving incentives? Income, educational expectations, and the value of the 529 and Coverdell (No. w10470). National Bureau of Economic Research.; Sallie Mae. (2013). 70
Government Accountability Office. Higher Education: A Small Percentage of Families Save in 529 Plans. Report to the Chairman, Committee on Finance, U.S. Senate. GAO-13-64. December 2012. 71
Ibid. 72
United States Government Accountability Office. (2012, December). Higher Education: A Small Percentage of Families Save in 529 Plans. Report to the Chairman, Committee on Finance, U.S. Senate. GAO. Retrieved from http://www.gao.gov/assets/660/650759.pdf 73
Dynarski, S. M. (2004). Tax policy and education policy: Collision or coordination? A case study of the 529 and Coverdell saving incentives (No. w10357). National Bureau of Economic Research. 74
Santiago, A. M. (2011). Asset Building and Low-Income Families, by McKernan, SM., & Sherraden, M.(Eds.) (2008). Asset Building and Low-Income Families. Washington, DC: Urban Institute Press. ISBN: 978-0-87766-754-3, 284 pp. Journal of Community Practice, 19(4), 468-472. 75
Okech, D., Little, T. D., Shanks, T. R. W., & Adams, D. (2011). Parental Self-Efficacy and Joining a Savings Program for Children’s Education. Research on Social Work Practice, 21(4), 442-451.; Duflo, E., Gale, W., Liebman, J., Orszag, P., & Saez, E. (2006). Saving incentives for low-and middle-income families: Evidence from a field experiment with H&R Block. The Quarterly Journal of Economics, 121(4), 1311-1346.; Beverly, S. G., Sherraden, M., Zhan, M., Shanks, T.R., Nam, Y., & Cramer, R. (2008). Determinants of asset building. St. Louis, MO: Center for Social Development, Washington University.; Nam, Y., Kim, Y., Clancy, M., Zager, R., & Sherraden, M. (2013). Do Child Development Accounts promote account holding, saving, and asset accumulation for children's future? Evidence from a statewide randomized experiment. Journal of Policy Analysis and Management, 32(1), 6-33. 76
Okech, D., Little, T. D., Shanks, T. R. W., & Adams, D. (2011). Parental Self-Efficacy and Joining a Savings Program for Children’s Education. Research on Social Work Practice, 21(4), 442-451. 77
Okech, D., Little, T. D., Shanks, T. R. W., & Adams, D. (2011). Parental Self-Efficacy and Joining a Savings Program for Children’s Education. Research on Social Work Practice, 21(4), 442-451. 78
Sherraden, M., Scanlon, E., Adams, D., Beverly, S.G., & Schreiner, M. (2005). Inclusion in asset building: Directions for theory and research. In M. Sherraden (Ed.), Inclusion in the American dream: Assets, poverty, and public policy (pp. 360-392). New York, NY: Oxford University Press.; Okech, D., Little, T. D., Shanks, T. R. W., & Adams, D. (2011). Parental Self-Efficacy and Joining a Savings Program for Children’s Education. Research on Social Work Practice, 21(4), 442-451. 79
Golden, Olivia, Pamela Loprest, and Gregory Mills. (2012). Economic Security for Extremely Vulnerable Families: Themes and Options for Workforce Development and Asset Strategies. Urban Institute. 80
Okech, D., Little, T. D., Shanks, T. R. W., & Adams, D. (2011). Parental Self-Efficacy and Joining a Savings Program for Children’s Education. Research on Social Work Practice, 21(4), 442-451. 81
Golden, Olivia, Pamela Loprest, and Gregory Mills. (2012). Economic Security for Extremely Vulnerable Families: Themes and Options for Workforce Development and Asset Strategies. Urban Institute. 82
Hernandez, M. (2011). Applying behavioral research to asset-building initiatives: Lessons from a year of experimentation. CFED. Retrieved from http://cfed.org/assets/pdfs/Applying_Behavioral_Research_to_Asset_Building_Initiatives.pdf 83
Congdon, William J., Jeffrey R. Kling, and Sendhil Mullainathan. (2011). Policy and Choice: Public Finance through the Lens of Behavioral Economics. Brookings Institution Press, Washington D.C. 84
Congdon, William J., Jeffrey R. Kling, and Sendhil Mullainathan. (2011). Policy and Choice: Public Finance through the Lens of Behavioral Economics. Brookings Institution Press, Washington D.C.
CS4C: Final Evaluation Report December 2013 Page 161 of 164
85
Office of the Attorney General. (2013). Child Support and Financial Stability. Urban Fathers Asset Building Demonstration. Attorney General of Texas. Powerpoint presentation by Chris Giangreco, Program Specialist, Family Initiatives, Child Support Division. 86
The Office of the Attorney General of Texas. (2013). Administrative Records. [Data file]. Analysis by CFRP.; U.S. Census Bureau. (2012) State and County QuickFacts. Texas. Retrieved from: http://quickfacts.census.gov/qfd/states/48000.html 87
Center for Public Policy Priorities. (2012, October). Dollar for Dollar: Incentives and Innovations to Boost Savings in Texas. CPPP. Retrieved from http://opportunitytexas.org/images/stories/dollar_for_dollar.pdf 88
The Attorney General of Texas. (2013). Child Support Division. Family Initiatives. Web. Retrieved April 26, 2013. https://www.oag.state.tx.us/cs/ofi/ 89
The Attorney General of Texas. (2013). Child Support Division. Family Initiatives. Web. Retrieved April 26, 2013. https://www.oag.state.tx.us/cs/ofi/ 90
Choi, J. J., Laibson, D., & Madrian, B. C. (2004). Plan design and 401 (k) savings outcomes (No. w10486). National Bureau of Economic Research.; Huberman, G., Iyengar, S. S., & Jiang, W. (2007). Defined contribution pension plans: determinants of participation and contributions rates. Journal of Financial Services Research, 31(1), 1-32. 91
Mahon, C. (2010, September). Financial empowerment centers. Presented at the Financial Coaching: Models, Research and Strategies Conference, Washington, DC. 92
Beverly, S. G., McBride, A. M., & Schreiner, M. (2003). A framework of asset-accumulation stages and strategies. Journal of Family and Economic Issues, 24(2), 143-156. 93
Nam, Y., Kim, Y., Clancy, M., Zager, R., & Sherraden, M. (2013). Do Child Development Accounts promote account holding, saving, and asset accumulation for children's future? Evidence from a statewide randomized experiment. Journal of Policy Analysis and Management, 32(1), 6-33. 94
Romich, J. L., & Weisner, T. (2000). How families view and use the EITC: Advance payment versus lump sum delivery. National Tax Journal, 53(4; PART 2), 1245-1262. 95
Ibid. 96
Beverly, S. G., McBride, A. M., & Schreiner, M. (2003). A framework of asset-accumulation stages and strategies. Journal of Family and Economic Issues, 24(2), 143-156. 97
Gennetian, L., Mullainathan, S. and Shafir, E. (forthcoming). Economic instability, mental resources and poverty traps. In E. Shafir (Ed.), The behavioral foundations of policy. New Jersey: Princeton University. 98
Elliott, W., Choi, E. H., Destin, M., & Kim, K. H. (2011). The age old question, which comes first? A simultaneous test of children's savings and children's college-bound identity. Children and Youth Services Review, 33(7), 1101-1111.; Elliott, W. (2013). Small-dollar children's savings accounts and children's college outcomes. Children and Youth Services Review, 35(3), 572-585.; Zhan, M. (2006). Assets, parental expectations and involvement, and children’s educational performance. Children and Youth Services Review, 28(8), 961-975.; Zhan, M., & Sherraden, M. (2003, June ). Assets, expectations, and educational achievement in female-headed households. Social Service Review, 77(2), 191-211. 99
Elliott, W. (2013). 100
Elliott, W. (2013); Oyserman, D., & Destin, M. (2010). Identity-based motivation: Implications for intervention. The Counseling Psychologist, 38(7), 1001-1043. 101
Destin, M., & Oyserman, D. (2009). From assets to school outcomes: How finances shape children’s perceived possibilities and intentions. Psychological Science, 20(4), 414-418. 102
Elliott III, W., & Beverly, S. G. (2011). The role of savings and wealth in reducing ‘wilt’between expectations and college attendance. Journal of Children and Poverty, 17(2), 165-185. 103
Elliott, W., and S. Beverly. (2011). Staying on course: The effects of assets and savings on the college progress of young adults. American Journal of Education, 117 (3), 343–374.; Elliott, W., and S. Beverly. (2011). The role of savings and wealth in reducing “wilt” between expectations and college attendance. Journal of Children and Poverty, 17 (2), 165–185.; Schneider, B., and D. Stevenson. (1999). The ambitious generation: America's teenagers, motivated but directionless. Yale University Press, New Haven, CT.; Trusty, J. (2000). High educational expectations and low achievement: Stability of educational goals across adolescence. Journal of Educational Research, 93, 356–395. 104
CS4C: Final Evaluation Report December 2013 Page 162 of 164
105
McDonald, P. W. (1999). Population-based recruitment for quit-smoking programs: an analytic review of communication variables. Preventive medicine, 28(6), 545-557. 106
Madrian, B. C., & Shea, D. F. (2001). The power of suggestion: Inertia in 401 (k) participation and savings behavior. The Quarterly Journal of Economics, 116(4), 1149-1187.; Thaler, R. H., & Benartzi, S. (2004). Save more tomorrow™: Using behavioral economics to increase employee saving. Journal of political Economy, 112(S1), S164-S187. 107
Ibid. 108
Internal Meeting Notes, (2012, April 26). 109
Golden, Olivia, Pamela Loprest, and Gregory Mills. (2012). Economic Security for Extremely Vulnerable Families: Themes and Options for Workforce Development and Asset Strategies. Urban Institute. 110
Elliott, W. (2013). Small-dollar children's savings accounts and children's college outcomes. Children and Youth Services Review, 35(3), 572-585. 111
Elliott, W. (2013). 112
Texas Securities Act of 2011. Section 12A. Registration of Persons Selling Securities of Rendering Investment Advice. Retrieved in October 2012 from http://www.ssb.state.tx.us/Texas_Securities_Act_and_Board_Rules/The_Texas_Securities_Act_06-17-2011.php#SEC12. 113
Texas Securities Act of 2011. Section 12A. Registration of Persons Selling Securities of Rendering Investment Advice. Retrieved in October 2012 from http://www.ssb.state.tx.us/Texas_Securities_Act_and_Board_Rules/The_Texas_Securities_Act_06-17-2011.php#SEC12. 114
Sallie Mae. (2010). 115
Sallie Mae. (2010). 116
Madrian, B. C., & Shea, D. F. (2001). The power of suggestion: Inertia in 401 (k) participation and savings behavior. The Quarterly Journal of Economics, 116(4), 1149-1187.; Thaler, R. H., & Benartzi, S. (2004). Save more tomorrow™: Using behavioral economics to increase employee saving. Journal of political Economy, 112(S1), S164-S187. 117
Nam, Y., Kim, Y., Clancy, M., Zager, R., & Sherraden, M. (2013). Do Child Development Accounts promote account holding, saving, and asset accumulation for children's future? Evidence from a statewide randomized experiment. Journal of Policy Analysis and Management, 32(1), 6-33. 118
Sallie Mae. (2013). 119
Center for Public Policy Priorities. (2012, October). Dollar for Dollar: Incentives and Innovations to Boost Savings in Texas. CPPP. 120
Sallie Mae. (2013). 121
Riley Jr, W. B., & Chow, K. V. (1992). Asset allocation and individual risk aversion. Financial Analysts Journal, 32-37. 122
U.S. Department of the Treasury. Bureau of the Public Debt. (2013). Treasury Securities and Programs. I Savings Bonds. Treasury Direct. Retrieved from http://www.treasurydirect.gov/indiv/products/prod_ibonds_glance.htm; U.S. Department of the Treasury. Bureau of the Public Debt. (2013). Treasury Securities and Programs. EE Savings Bonds. Treasury Direct. Retrieved from http://www.treasurydirect.gov/indiv/research/indepth/ebonds/res_e_bonds.htm 123
Sallie Mae. (2013). 124
CFED. (2013). Family Strengthening Through Integration and Scaling of Asset-Building Strategies: The ASSET Initiative Partnership Environmental Field Scan Report. Prepared for the U.S. Department of Health and Human Services, Administration for Children and Families, Office of Community Services. http://www.acf.hhs.gov/sites/default/files/ocs/aip_field_scan_report_public_version.pdf 125
State of Kansas. (2013). The 529 Child Savings Account Program. An Inter-Agency Collaboration: Kansas Child Support Services and State Treasurer's Office. Powerpoint presentation by Melissa Johnson, Deputy Director of Kansas Child Support Services and Nancy Thoma Groetken, OCSE Regional Program Manager. 126
State of Kansas. (2013). The 529 Child Savings Account Program. An Inter-Agency Collaboration: Kansas Child Support Services and State Treasurer's Office. Powerpoint presentation by Melissa Johnson, Deputy Director of Kansas Child Support Services and Nancy Thoma Groetken, OCSE Regional Program Manager. 127
CFED. (2013). Family Strengthening Through Integration and Scaling of Asset-Building Strategies: The ASSET Initiative Partnership Environmental Field Scan Report. Prepared for the U.S. Department of Health and Human Services,
CS4C: Final Evaluation Report December 2013 Page 163 of 164
Administration for Children and Families, Office of Community Services. http://www.acf.hhs.gov/sites/default/files/ocs/aip_field_scan_report_public_version.pdf 128
Tivol, L. (2012, October 30). Corporation for Enterprise Development. [Telephone Interview.] 129
Giangreco, C. (2012, November 20). Office of the Attorney General. [Telephone Interview.] 130
Center for Public Policy Priorities. (2012, October). Dollar for Dollar: Incentives and Innovations to Boost Savings in Texas. CPPP. 131
Elliott, W., Choi, E. H., Destin, M., & Kim, K. H. (2011). The age old question, which comes first? A simultaneous test of children's savings and children's college-bound identity. Children and Youth Services Review, 33(7), 1101-1111.; Elliott, W. (2013). Small-dollar children's savings accounts and children's college outcomes. Children and Youth Services Review, 35(3), 572-585.; Zhan, M. (2006). Assets, parental expectations and involvement, and children’s educational performance. Children and Youth Services Review, 28(8), 961-975.; Zhan, M., & Sherraden, M. (2003, June ). Assets, expectations, and educational achievement in female-headed households. Social Service Review, 77(2), 191-211. 132
Elliott, W., Choi, E. H., Destin, M., & Kim, K. H. (2011). The age old question, which comes first? A simultaneous test of children's savings and children's college-bound identity. Children and Youth Services Review, 33(7), 1101-1111.; Elliott, W. (2013). Small-dollar children's savings accounts and children's college outcomes. Children and Youth Services Review, 35(3), 572-585.; Zhan, M. (2006). Assets, parental expectations and involvement, and children’s educational performance. Children and Youth Services Review, 28(8), 961-975.; Zhan, M., & Sherraden, M. (2003, June ). Assets, expectations, and educational achievement in female-headed households. Social Service Review, 77(2), 191-211. 133 Mills, G., Patterson, R., Orr, L., & DeMarco. (2004). Evaluation of the American Dream Demonstration: Final Evaluation
Report. The Ford Foundation and Charles Stewart Mott Foundation 134
Schreiner, Mark, Margaret Clancy, and Michael Sherraden. (2002). Final Report: Saving Performance in the American Dream Demonstration: A National Demonstration of Individual Development Accounts. Center for Social Development, Washington University in St. Louis. 135
Education Department Releases Proposal to Help Thousands of Disadvantaged Students Access College Through Savings Accounts. (2012, May 31). U.S. Department of Education. Retrieved from http://www.ed.gov/news/press-releases/education-department-releases-proposal-help-thousands-disadvantaged-students-acc 136
GEAR UP Advances College Affordability with College Savings Accounts for 10,000 High School Students. (2012, June 13). EDgov Blog. Retreived from http://www.ed.gov/blog/2012/06/gear-up-advances-college-affordability-with-college-savings-accounts-for-10000-high-school-students/ 137
Final Priorities; Gaining Early Awareness and Readiness for Undergraduate Programs (GEAR UP)-College Savings Account Research Demonstration Project. (2103, January 23). Federal Register. Retrieved from https://www.federalregister.gov/articles/2013/01/23/2013-01125/final-priorities-gaining-early-awareness-and-readiness-for-undergraduate-programs-gear-up-college 138
Cramer, Reid. "Large-Scale College Savings Account Demonstration Announced." Weblog post. The Ladder: A Blog from New America's Asset Building Program. 6 June 2012. http://assets.newamerica.net/blogposts/2012/large_scale_college_savings_account_demonstration_announced-68257 139
GEAR UP Coordinator Manual – Year 3. GEAR UP Washington State. http://www.gearup.wa.gov/files/YEAR%203%20Coordinator%20Manual.pdf 140
Harold Alfond College Challenge. FDIC. Retrieved from http://www.fdic.gov/about/comein/college.pdf 141
Harold Alfond College Challenge. Harold Alfond Foundation History of Grants. Retrieved from http://www.haroldalfondfoundation.org/history.htm 142
Huang, J., Beverly, S., Clancy, M., Lassar, T., & Sherraden, M. (2011). Early Enrollment in a Statewide Child Development Account Program. St. Louis, MO: Washington University in St. Louis Center for Social Devlopment. 143
Elliott, W., Sherraden, M. S., Johnson, L., & Guo, B. (2009). Young children's perceptions of college and saving: Potential role of Child Development Accounts (CSD Working Paper 09-53). St. Louis, MO: Washington University, Center for Social Development. http://csd.wustl.edu/Publications/Documents/WP09-53.pdf 144
Sherraden, M.S., Johnson, L., Elliott, W. III, Porterfield, S., & Rainford, W. (2007). School-based children's saving accounts for college: The I Can Save program. Children and Youth Services Review, 29, 294-312.
CS4C: Final Evaluation Report December 2013 Page 164 of 164
145
Johnson, E., & Sherraden, M.S. (2007). From financial literacy to financial capability among youth. Journal of Sociology and Social Welfare 34(3), 119-145. 146
State of Kansas. (2013). The 529 Child Savings Account Program. An Inter-Agency Collaboration: Kansas Child Support Services and State Treasurer's Office. Powerpoint presentation by Melissa Johnson, Deputy Director of Kansas Child Support Services and Nancy Thoma Groetken, OCSE Regional Program Manager. 147
Phillips, L., & Stuhldreher, A. (2011). Kindergarten to College (K2C): A First-in-the-Nation Initiative to Set All Kindergartners on the Path to College. New America Foundation. http://sfofe.org/wp-content/uploads/2011/10/K2C-Case-Study-Final.pdf 148
Kindergarten to College. San Francisco Office of Financial Empowerment. http://sfofe.org/programs/k-to-c 149
Mississippi College Savings Account Program Launch (2011, September 8). CFED The Inclusive Economy Blog. Retrieved November 8, 2013, from http://cfed.org/blog/inclusiveeconomy/mississippi_college_savings_account_program_launch/ 150
Mississippi College Savings Account Initiative - Delta State University. Center for Community and Economic Development. Retrieved from http://www.deltastate.edu/academics/graduate-and-continuing-studies/center-for-community-economic-development/mississippi-college-savings-account-initiative/ 151
The SEED Initiative. CFED The Inclusive Economy Blog. Retrieved from http://cfed.org/programs/csa/program_models/seed/index.html 152
Adams, D., Boshara, R., Clancy, M., Cramer, R., Friedman, B., Howard, R., … Zager, R. (2010). Lessons from SEED, a national demonstration of child development accounts. 153
Sherraden, Michael, and Margaret Clancy (2008). SEED for Oklahoma Kids: Demonstrating Child Development Accounts for All Newborns. Washington University in St. Louis, Center for Social Development. 154
Nam, Y., Kim, Y., Clancy, M., Zager, R., & Sherraden, M. (2013). Do Child Development Accounts promote account holding, saving, and asset accumulation for children's future? Evidence from a statewide randomized experiment. Journal of Policy Analysis and Management, 32(1), 6-33. 155
"UNCF College Account Program." UNCF : Advocacy. UNCF. http://www.uncf.org/sites/advocacy/si.UNCF.CollegeAccountProgram.htm