52
1 Final Report: APMP.EM-S7 APMP Supplementary Comparison of Capacitance at 100 pF H. L. Johnson National Measurement Institute, Australia February 08
1
Final Report:
APMP.EM-S7 APMP Supplementary Comparison of Capacitance at 100 pF
H. L. Johnson National Measurement Institute, Australia
February 08

2
Contents
1 Introduction ...................................................................................................................................4
2 Participants and organisation of the comparison ......................................................................5
2.1 List of participants .....................................................................................................5 2.2 Comparison schedule .................................................................................................5 2.3 Organisation of the comparison .................................................................................5 2.4 Unexpected incidents .................................................................................................6
3 Travelling standard and measurement instructions..................................................................7
3.1 Description of the standards.......................................................................................7 3.2 Quantities to be measured and conditions of measurements .....................................7 3.3 Measurement instructions ..........................................................................................7 3.4 Deviations from the protocol .....................................................................................7
4 Methods of measurement .............................................................................................................8
5 Measurements of the pilot laboratory .........................................................................................9
5.1 Sensitivity of the travelling standards........................................................................9 5.2 Stability of the travelling standards ...........................................................................9 5.3 Calculation of reference values................................................................................10
6 Measurement results ...................................................................................................................12
6.1 Normalisation of results ...........................................................................................12 6.2 Results of the participating institutes.......................................................................12 6.3 Calculation of the reference value and its uncertainty.............................................13 6.4 Degrees of equivalence with respect to the comparison value ................................13
7 Withdrawals or changes of results.............................................................................................15
8 Requests for follow up bilateral comparisons ..........................................................................15
9 Summary and conclusions ..........................................................................................................15
10 Appendices ...................................................................................................................................16
Appendix A: Methods of measurement .............................................................................16 A.1 Method of measurement: CMS, Taiwan ..................................................................16 A.2 Method of measurement: KIM-LIPI, Indonesia ......................................................16 A.3 Method of measurement: KRISS, Korea .................................................................17 A.4 Method of measurement: NIM, China .....................................................................18 A.5 Method of measurement: NIMT, Thailand ..............................................................18 A.6 Method of measurement: NMI, Australia ................................................................19 A.7 Method of measurement: NMIJ/AIST, Japan ..........................................................19 A.8 Method of measurement: NMISA, South Africa .....................................................19 A.9 Method of measurement: NPL, India.......................................................................20 A.10 Method of measurement: SCL, Hong Kong ............................................................20 A.11 Method of measurement: SIRIM, Malaysia.............................................................20 A.12 Method of measurement: SPRING, Singapore ........................................................21 A.13 Method of measurement: VNIIM, Russia................................................................21 Appendix B: Uncertainty statements .................................................................................23 B.1 Uncertainty statement: CMS, Taiwan......................................................................23
3
B.2 Uncertainty statement: KIM-LIPI, Indonesia ..........................................................23 B.3 Uncertainty statement: KRISS, Korea .....................................................................24 B.4 Uncertainty statement: NIM, China.........................................................................24 B.5 Uncertainty statement: NIMT, Thailand..................................................................25 B.6 Uncertainty statement: NMI, Australia....................................................................26 B.7 Uncertainty statement: NMIJ/AIST, Japan..............................................................27 B.8 Uncertainty statement: NMISA, South Africa.........................................................27 B.9 Uncertainty statement: NPL, India ..........................................................................28 B.10 Uncertainty statement: SCL, Hong Kong ................................................................29 B.11 Uncertainty statement: SIRIM, Malaysia ................................................................29 B.12 Uncertainty statement: SPRING, Singapore............................................................30 B.13 Uncertainty statement: VNIIM, Russia....................................................................30 Appendix C: Optional measurements: Dissipation factor .................................................31 Appendix D: References ....................................................................................................31 Appendix E: Comparison protocol ....................................................................................32
Figures
Figure 5-1 Repeated measurements of the pilot laboratory at a measurement frequency of 1592 Hz
and measuring voltage of 10 Vrms. ...........................................................................................10
Figure 6-1 Degrees of equivalence di of the participating institutes with respect to the comparison reference value. ..........................................................................................................................14
Tables
Table 2-1 List of participants. ..............................................................................................................5
Table 2-2 Comparison schedule...........................................................................................................6
Table 4-1 Participants’ method of measurement and traceability. ......................................................8
Table 5-1 Values required for calculation of reference values. ........................................................11
Table 6-1 Summary of results of participating institutes...................................................................12
Table 6-2 Degrees of equivalence of the participating institutes relative to the comparison reference value. ..........................................................................................................................14

4
1 Introduction A key comparison of capacitance at 10 pF and a supplementary comparison of capacitance at 100 pF have been conducted between participating APMP member laboratories. The aim of these comparisons is to provide participating laboratories with the opportunity to compare national standards of capacitance within the region, and to support participants’ entries in Appendix C of the Mutual Recognition Arrangement [1]. Results of the supplementary comparison are reported here. Results of the key comparison are reported separately.
The Andeen-Hagerling AH11A fused-silica capacitance standards used in this comparison were kindly supplied by the National Metrology Institute of Japan, AIST.
The assistance of the support group (Dr. Sze Wey Chua, SPRING Singapore, Dr Rae Duk Lee, KRISS Korea and Mr Andrew Corney, MSL New Zealand) is gratefully acknowledged.

5
2 Participants and organisation of the comparison
2.1 List of participants Thirteen laboratories participated in the comparison, as listed in Table 2-1.
Organisation Acronym State or Economy
1 Center for Measurement Standards CMS Taiwan 2 Pusat Penelitian Kalibrasi Instrumentasi Metrologi - LIPI KIM-LIPI Indonesia 3 Korea Research Institute of Standards and Science KRISS Korea 4 National Institute of Metrology NIM China 5 National Institute of Metrology (Thailand) NIMT Thailand 6 National Measurement Institute of Australia1 NMIA Australia 7 National Metrology Institute of Japan, AIST NMIJ/AIST Japan 8 National Metrology Institute of South Africa2 NMISA South Africa 9 National Physical Laboratory NPLI India
10 Standards and Calibration Laboratory SCL Hong Kong 11 Standards and Industrial Research Institute of Malaysia SIRIM Malaysia 12 Standards, Productivity and Innovation Board, Singapore SPRING Singapore 13 D. I. Mendeleyev Institute for Metrology VNIIM Russia
Table 2-1 List of participants.
2.2 Comparison schedule The comparison schedule is given in Table 2-2.
2.3 Organisation of the comparison The comparison schedule was initially organised in four consecutive loops (Loops 1 to 4) with between two and four participants in each loop. The artefacts returned to the pilot laboratory, NMIA, for measurement at the conclusion of each loop. Due to concerns about the behaviour of the 10 pF artefact during Loop 1, an additional loop was organised (Loop 5) to allow Loop 1 participants to repeat their measurements of the 10 pF artefact and, optionally, of the 100 pF artefact. Where participants made two measurements of the 100 pF artefact, they were asked to indicate which results was to be reported in the comparison report.
A total of four weeks was scheduled for each participant. Generally participants had at least two weeks and usually three weeks in which to make their measurements, depending on the time taken to clear the artefacts through the customs service in their country and allow the artefacts to settle in their laboratory.
The artefacts were transported in an aluminium case by air using an ATA Carnet for customs clearance where possible. A shock monitor was attached to the outside of the transport case and to the back panel of the artefact enclosure.
1 Formerly National Measurement Laboratory, CSIRO (CSIRO-NML) 2 Formerly National Measurement Laboratory, CSIR (CSIR-NML)

6
Loop No. Participant Standards in laboratory
From: To:
Mean measurement date(s)
Comments
- NMIA 28 Apr 2003 05 Jan 2004 14 Jun 2003 10 Sep 2003 16 Dec 2003
Initial characterisation of standards.
1 NMIJ/AIST 16 Jan 2004 06 Feb 2004 27 Jan 2004
1 KRISS 17 Feb 2004 04 Mar 2004 27 Feb 2004 (10 pF) 23 Feb 2004 (100 pF)
Observed step change of 0.2 μF/F in value of 100 pF on 26 Feb 2006.
1 SPRING 10 Mar 2004 05 Apr 2004 26 Mar 2004(a) 28 Mar 2004(b)
(a) 1000 Hz (b) 1592 Hz
1 CMS 09 Apr 2004 06 May 2004 26 Apr 2004
1 NMIA 10 May 2004 01 Jul 2004 18 May 2004 20 Jun 2004
Second set of measurements taken as change indrift rate of 10 pF capacitor suspected.
2 NPLI 10 Jul 2004 28 Jul 2004 19 Jul 2004 2 NIMT 10 Aug 2004 23 Aug 2004 16 Aug 2004 2 NMISA 03 Sep 2004 21 Sep 2004 17 Sep 2004 2 NMIA 27 Sep 2004 25 Oct 2004 6 Oct 2004 3 SIRIM 27 Oct 2004 15 Nov 2004 12 Nov 2004
3 SCL 20 Nov 2004 11 Dec 2004 28 Nov 2004 (10 pF) 27 Nov 2004 (100 pF)
3 KIM-LIPI 28 Dec 2004 10 Jan 2005 4 Jan 2005
3 NMIA 20 Jan 2005 7 Mar 2005 03 Feb 2005 26 Feb 2005
4 NIM 14 Mar 2005 05 Apr 2005 29 Mar 2005 4 VNIIM 03 Jun 2005 Sep 2005 18 Aug 2005
4 NMIA 16 Sep 2005 19 Jan 2006 07 Oct 2005 12 Jan 2006
Standards measured at conclusion of Loop 4 and at start of Loop 5.
5 KRISS 02 Feb 2006 21 Feb 2006 11 Feb 2006 5 SPRING 24 Feb 2006 17 Mar 2006 11 Mar 2006 5 NMIJ/AIST 26 Mar 2006 14 Apr 2006 4 Apr 2006 5 CMS 19 Apr 2006 15 May 2006 8 May 2006 5 NMIA 22 May 2006 27 May 2006
Table 2-2 Comparison schedule
2.4 Unexpected incidents A number of unexpected incidents occurred during the course of the comparison:
• Non-steady behaviour of 10 pF artefact necessitating repetition of Loop 1. Note that the 100 pF artefact did not show any significant deviations from a steady linear drift rate during the whole of the comparison.
• A four month delay to the comparison schedule occurred in Loop 4 during the measurement period assigned to VNIIM. This was in addition to the extra four weeks that was allowed for customs clearance in and out of Russia.
• The shock monitor attached to the outside of the transport case was activated during shipment from KRISS to SPRING in Loop 5. The shock monitor attached to the back panel of the artefact enclosure was not activated. No damage to the artefacts or changes in behaviour of the artefacts was noted.

7
3 Travelling standard and measurement instructions
3.1 Description of the standards The travelling standard was a 100 pF Andeen-Hagerling AH11A fused silica capacitance standard mounted in a AH1100 capacitance standard frame. A second Andeen-Hagerling AH11A fused silica capacitance standard mounted in the same AH1100 capacitance standard frame was used for the key comparison at 10 pF (reported separately). The AH1100 frame is a standard-width bench-top or rack-mountable frame. The AH11A capacitance standard includes a temperature-controlled oven that is powered via the AH1100 frame. The frame also monitors internal power voltages and temperatures.
The capacitor is fitted with BNC co-axial terminations. Co-axial measuring leads with BNC to MUSA connectors were supplied with the capacitor, together with MUSA-GR874 adapters and MUSA-BNC adapters.
3.2 Quantities to be measured and conditions of measurements The measured quantity was the capacitance of the capacitor at the terminals on the AH1100 frame. The preferred measuring voltage was 100 V(rms). The preferred measurement frequency was 1592 Hz (ω = 104 rad·s-1). Measurements at a frequency of 1000 Hz were permitted instead of, or as well as, 1592 Hz. Measurement of the dissipation factor was optional.
The comparison measurand mn is defined as the nth comparison measurement of the fractional difference of the measured capacitance, Cn, from the nominal value of the capacitor, C, calculated as:
1−=CCm n
n . (1)
The subscript n denoting the measurement number should not be confused with the subscript i, which is introduced in Section 6.4 and denotes the participating laboratory.
Participants were asked to report the drift and chassis temperature readings for each capacitor, and the ambient temperature, for monitoring purposes.
3.3 Measurement instructions The AH 1100/11A Operation and Maintenance Manual was included with the shipment of the travelling standards. The comparison protocol encouraged participants to leave the standards to stabilise for two to three days before measurement.
3.4 Deviations from the protocol There were no deviations from the protocol.
8
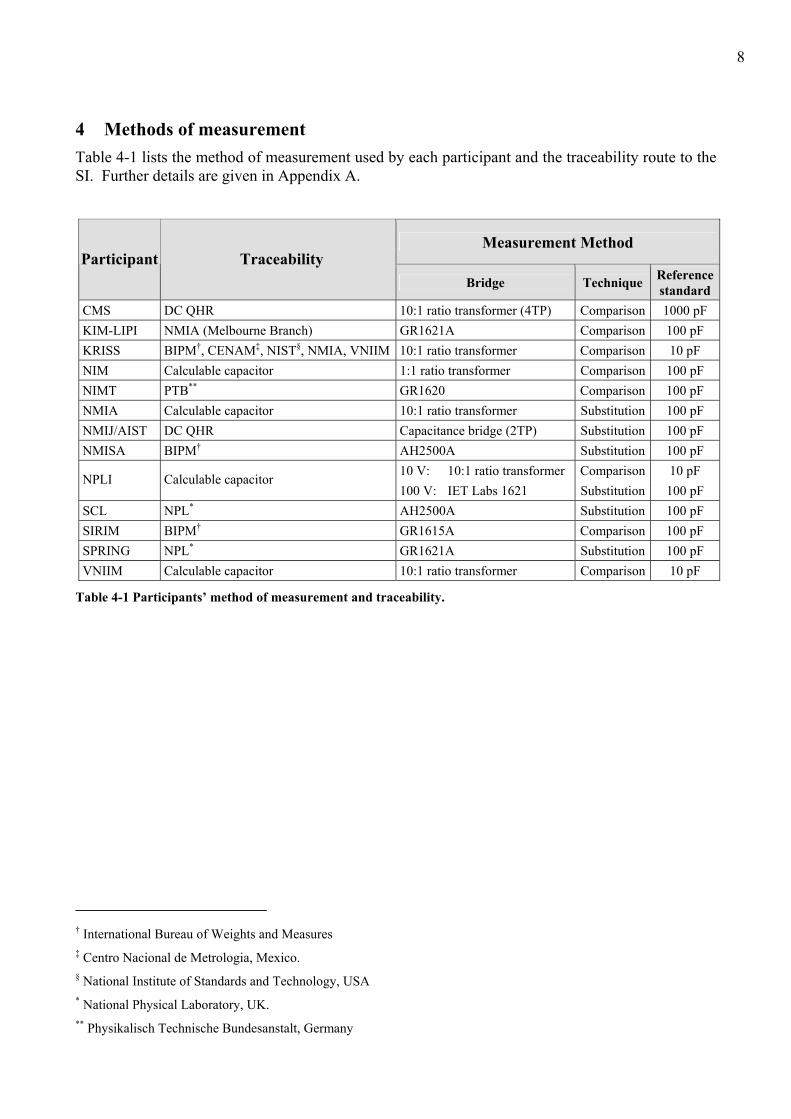
4 Methods of measurement Table 4-1 lists the method of measurement used by each participant and the traceability route to the SI. Further details are given in Appendix A.
Measurement Method Participant Traceability
Bridge Technique Reference standard
CMS DC QHR 10:1 ratio transformer (4TP) Comparison 1000 pF KIM-LIPI NMIA (Melbourne Branch) GR1621A Comparison 100 pF KRISS BIPM†, CENAM‡, NIST§, NMIA, VNIIM 10:1 ratio transformer Comparison 10 pF NIM Calculable capacitor 1:1 ratio transformer Comparison 100 pF NIMT PTB** GR1620 Comparison 100 pF NMIA Calculable capacitor 10:1 ratio transformer Substitution 100 pF NMIJ/AIST DC QHR Capacitance bridge (2TP) Substitution 100 pF NMISA BIPM† AH2500A Substitution 100 pF
10 V: 10:1 ratio transformer Comparison 10 pF NPLI Calculable capacitor 100 V: IET Labs 1621 Substitution 100 pF
SCL NPL* AH2500A Substitution 100 pF SIRIM BIPM† GR1615A Comparison 100 pF SPRING NPL* GR1621A Substitution 100 pF VNIIM Calculable capacitor 10:1 ratio transformer Comparison 10 pF
Table 4-1 Participants’ method of measurement and traceability.
† International Bureau of Weights and Measures ‡ Centro Nacional de Metrologia, Mexico. § National Institute of Standards and Technology, USA * National Physical Laboratory, UK. ** Physikalisch Technische Bundesanstalt, Germany
9
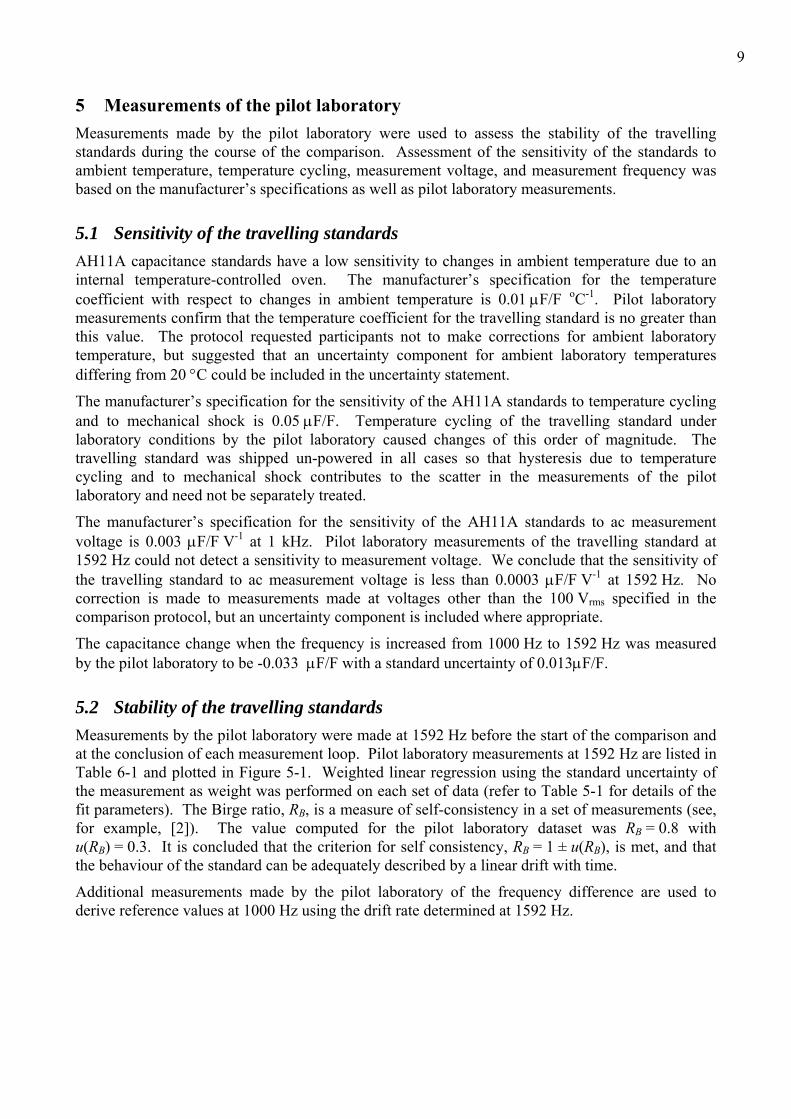
5 Measurements of the pilot laboratory Measurements made by the pilot laboratory were used to assess the stability of the travelling standards during the course of the comparison. Assessment of the sensitivity of the standards to ambient temperature, temperature cycling, measurement voltage, and measurement frequency was based on the manufacturer’s specifications as well as pilot laboratory measurements.
5.1 Sensitivity of the travelling standards AH11A capacitance standards have a low sensitivity to changes in ambient temperature due to an internal temperature-controlled oven. The manufacturer’s specification for the temperature coefficient with respect to changes in ambient temperature is 0.01 μF/F oC-1. Pilot laboratory measurements confirm that the temperature coefficient for the travelling standard is no greater than this value. The protocol requested participants not to make corrections for ambient laboratory temperature, but suggested that an uncertainty component for ambient laboratory temperatures differing from 20 °C could be included in the uncertainty statement.
The manufacturer’s specification for the sensitivity of the AH11A standards to temperature cycling and to mechanical shock is 0.05 μF/F. Temperature cycling of the travelling standard under laboratory conditions by the pilot laboratory caused changes of this order of magnitude. The travelling standard was shipped un-powered in all cases so that hysteresis due to temperature cycling and to mechanical shock contributes to the scatter in the measurements of the pilot laboratory and need not be separately treated.
The manufacturer’s specification for the sensitivity of the AH11A standards to ac measurement voltage is 0.003 μF/F V-1 at 1 kHz. Pilot laboratory measurements of the travelling standard at 1592 Hz could not detect a sensitivity to measurement voltage. We conclude that the sensitivity of the travelling standard to ac measurement voltage is less than 0.0003 μF/F V-1 at 1592 Hz. No correction is made to measurements made at voltages other than the 100 Vrms specified in the comparison protocol, but an uncertainty component is included where appropriate.
The capacitance change when the frequency is increased from 1000 Hz to 1592 Hz was measured by the pilot laboratory to be -0.033 μF/F with a standard uncertainty of 0.013μF/F.
5.2 Stability of the travelling standards Measurements by the pilot laboratory were made at 1592 Hz before the start of the comparison and at the conclusion of each measurement loop. Pilot laboratory measurements at 1592 Hz are listed in Table 6-1 and plotted in Figure 5-1. Weighted linear regression using the standard uncertainty of the measurement as weight was performed on each set of data (refer to Table 5-1 for details of the fit parameters). The Birge ratio, RB, is a measure of self-consistency in a set of measurements (see, for example, [2]). The value computed for the pilot laboratory dataset was RB = 0.8 with u(RB) = 0.3. It is concluded that the criterion for self consistency, RB = 1 ± u(RB), is met, and that the behaviour of the standard can be adequately described by a linear drift with time.
Additional measurements made by the pilot laboratory of the frequency difference are used to derive reference values at 1000 Hz using the drift rate determined at 1592 Hz.

10
400 600 800 1000 1200 1400
0.2
0.3
0.4
0.5
0.6
0.7
0.8
mN
MIA
(μF/
F)
Day Number (1 January 2003 = Day 1)
Figure 5-1 Repeated measurements of the pilot laboratory at a measurement frequency of 1592 Hz and measuring voltage of 10 Vrms. Uncertainty bars represent expanded uncertainty. Solid line: line of best fit (weighted linear regression), dashed lines: prediction bands (expanded uncertainty of predicted values).
5.3 Calculation of reference values The predicted or reference value, pn, for each capacitor at the time of the nth measurement is calculated as:
( ) 43100015921592
210 aaataap nfnn ++++= −
− (2)
where a0 and a1 are determined from the weighted linear regression described in Section 5.2, a2 is related to the frequency coefficient of capacitance, a3 is the correction to ambient temperature of 20 oC, a4 is the correction to a measurement voltage of 100 Vrms, tn is the time of the nth measurement and fn is the measurement frequency (in Hz) for the nth measurement. Note that a3 and a4 are taken to be zero. The uncertainty in the reference value is calculated as:
( ) ( ) ( ) ( ) ( ) ( )2100015921592
222
102
12
022 ,cov2 −
−⋅++⋅⋅+⋅+= nfnnn austaatauaupu
( ) ( ) ( )210100100
42
32
−−⋅++ PLVauau (3)
where ( )10 ,cov aa is the mutual covariance of a0 and a1, s2 is the unbiased estimate of the population variance σ2 of the residuals of the weighted linear regression, VPL is the rms measurement voltage of the pilot laboratory and the uncertainties u(tn) and u(fn) are assumed to be negligible. Note that the first four terms of (3) are derived from the linear fit to the pilot laboratory measurements and terms five and seven relate to the frequency and voltage coefficients respectively. Term 6 is the uncertainty in realising an ambient temperature of 20 oC in the pilot laboratory measurements.
The number of degrees of freedom for the reference value is calculated as:
11
( ) ( )( ) ( ) ( )( ) ( ) ( )
( )( )
( )( ) ( )
( )4
4
10100100
44
3
34
2
4
100015921592
2422
102
12
02
2,cov2
4
aau
aau
aau
lstaatauau
nn PLVnf
nn
pupννν
ν−
−−− ⋅⋅
−+⋅⋅+⋅+ +++
= (4)
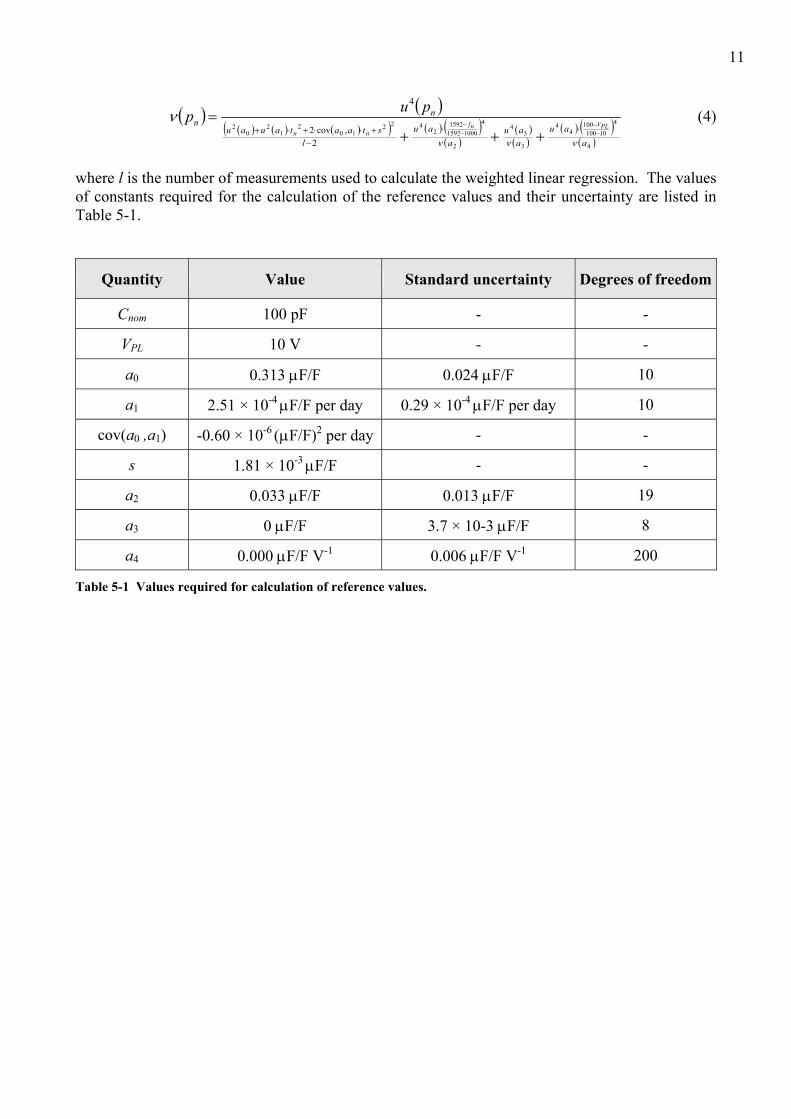
where l is the number of measurements used to calculate the weighted linear regression. The values of constants required for the calculation of the reference values and their uncertainty are listed in Table 5-1.
Quantity Value Standard uncertainty Degrees of freedom
Cnom 100 pF - -
VPL 10 V - -
a0 0.313 μF/F 0.024 μF/F 10
a1 2.51 × 10⁻⁴ μF/F per day 0.29 × 10⁻⁴ μF/F per day 10
cov(a0 ,a1) -0.60 × 10⁻⁶ (μF/F)2 per day - -
s 1.81 × 10⁻³ μF/F - -
a2 0.033 μF/F 0.013 μF/F 19
a3 0 μF/F 3.7 × 10⁻³ μF/F 8
a4 0.000 μF/F V-1 0.006 μF/F V-1 200
Table 5-1 Values required for calculation of reference values.

12
6 Measurement results
6.1 Normalisation of results Participants’ measurements were treated to account for the effect of drift and measurement conditions by subtracting the reference value for the artefact at the time of the nth measurement from the measured value mn to give a corrected measurement value xn, that is
nnn pmx −= (5)
The uncertainty in the corrected measurement value u(xn) and the associated number of degrees of freedom ν(xn) are calculated in accordance with the ISO “Guide to the expression of uncertainty in measurement, 1st ed.”.
6.2 Results of the participating institutes
n Participant Date f Vrms mn u(mn) ν(mn) pn u(pn) ν(pn) xn u(xn) ν(xn)
dd/mm/yy (Hz) (V) (μF/F) (μF/F) (μF/F) (μF/F) (μF/F) (μF/F) 1 NMIA 15/06/03 1592 10 0.330 0.038 12 0.355 0.020 12 -0.025 0.043 18 2 NMIA 10/09/03 1592 10 0.360 0.036 10 0.377 0.018 13 -0.017 0.040 15 3 NMIA 16/12/03 1592 10 0.460 0.037 11 0.401 0.016 13 0.059 0.040 15 4 NMIJ/AIST 27/01/04 1592 100 0.426 0.036 2277 0.412 0.016 14 0.014 0.039 474 5 NMIA 18/05/04 1592 10 0.410 0.036 11 0.440 0.014 15 -0.030 0.039 14 6 NMIA 20/06/04 1592 10 0.430 0.037 11 0.448 0.013 16 -0.018 0.039 14 7 NPLI 19/07/04 1000 100 -1.370 1.100 988 0.489 0.018 35 -1.859 1.100 989 8 NPLI 19/07/04 1592 100 -0.670 1.050 840 0.456 0.013 16 -1.126 1.050 840 9 NPLI 19/07/04 1000 10 -1.320 0.400 514 0.489 0.018 35 -1.809 0.400 516
10 NPLI 19/07/04 1592 10 -0.680 0.400 1028 0.456 0.013 16 -1.136 0.400 1030 11 NIMT 16/08/04 1000 100 1.300 0.860 168 0.496 0.018 35 0.804 0.860 168 12 NMISA 17/09/04 1000 10 0.510 0.053 4.7×10⁹ 0.504 0.018 36 0.006 0.056 3320 13 NMIA 06/10/04 1592 10 0.500 0.035 9 0.475 0.012 17 0.025 0.037 11 14 SIRIM 08/11/04 1000 10 1.500 0.853 139 0.517 0.018 36 0.983 0.853 139 15 SCL 27/11/04 1000 7.5 2.000 2.1 223 0.521 0.018 36 1.479 2.100 223 16 KIM-LIPI 04/01/05 1592 100 0.500 5.99 2.6×10⁷ 0.498 0.012 17 0.002 5.990 2.6×10⁷
17 NMIA 03/02/05 1592 10 0.500 0.035 9 0.506 0.012 17 -0.006 0.037 11 18 NMIA 26/02/05 1592 10 0.510 0.035 9 0.511 0.012 17 -0.001 0.037 11 19 NIM 29/03/05 1592 10 0.573 0.11 1×10⁹ 0.519 0.012 17 0.054 0.111 1×10⁵ 20 VNIIM 18/08/05 1000 9.85 0.370 0.198 39 0.588 0.019 33 -0.218 0.199 40 21 NMIA 07/10/05 1592 10 0.580 0.035 9 0.567 0.014 15 0.013 0.038 12 22 NMIA 12/01/06 1592 10 0.640 0.036 10 0.592 0.016 13 0.048 0.039 14 23 KRISS 11/02/06 1000 10 0.490 0.106 16 0.632 0.021 27 -0.142 0.108 17 24 KRISS 11/02/06 1592 10 0.470 0.109 17 0.599 0.017 13 -0.129 0.110 18 25 SPRING 11/03/06 1000 10 1.100 0.54 1.9×10⁸ 0.639 0.022 26 0.461 0.540 9.6×10⁶ 26 SPRING 11/03/06 1592 10 1.100 0.54 1.2×10⁸ 0.606 0.017 13 0.494 0.540 1.1×10⁸ 27 CMS 08/05/06 1592 60 0.780 0.08 3.9×10⁵ 0.621 0.019 12 0.159 0.082 4744 28 NMIA 27/05/06 1592 10 0.620 0.035 9 0.626 0.019 12 -0.006 0.040 14 29 NMIA 16/08/06 1592 10 0.600 0.037 11 0.646 0.021 12 -0.046 0.042 17
Table 6-1 Summary of results of participating institutes. See text for definition of symbols.
13
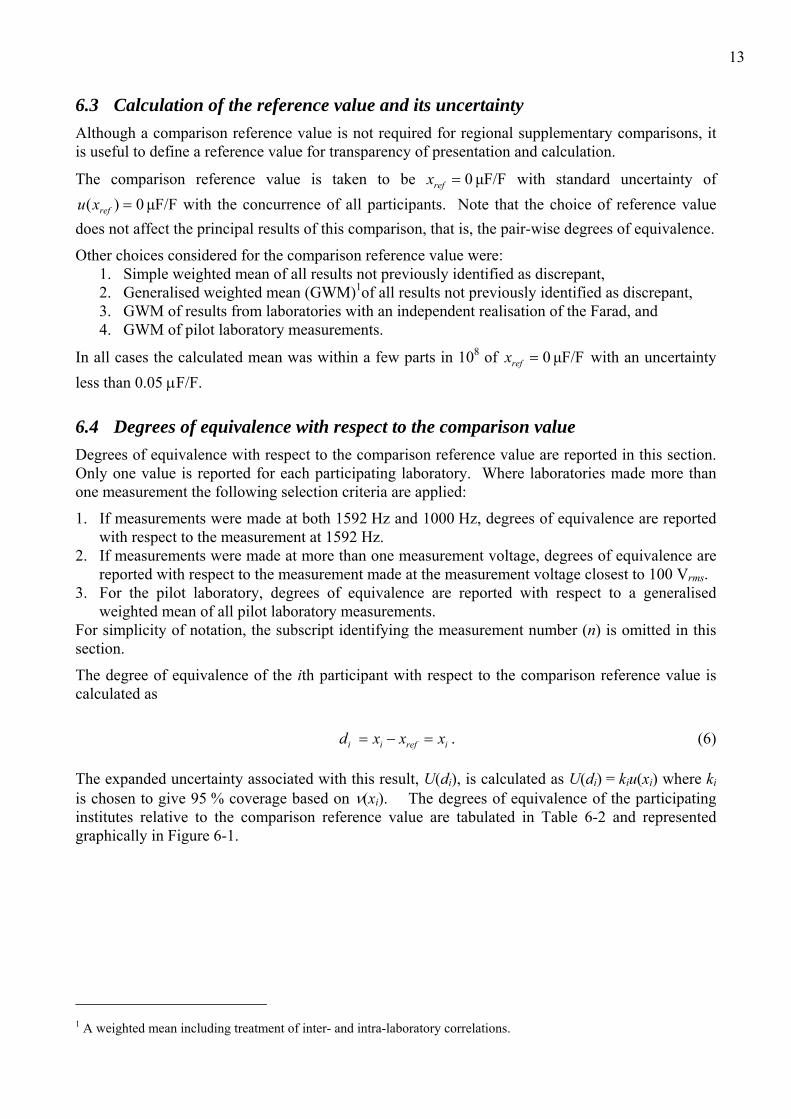
6.3 Calculation of the reference value and its uncertainty Although a comparison reference value is not required for regional supplementary comparisons, it is useful to define a reference value for transparency of presentation and calculation.
The comparison reference value is taken to be μF/F 0=refx with standard uncertainty of μF/F 0)( =refxu with the concurrence of all participants. Note that the choice of reference value
does not affect the principal results of this comparison, that is, the pair-wise degrees of equivalence.
Other choices considered for the comparison reference value were: 1. Simple weighted mean of all results not previously identified as discrepant, 2. Generalised weighted mean (GWM)1of all results not previously identified as discrepant, 3. GWM of results from laboratories with an independent realisation of the Farad, and 4. GWM of pilot laboratory measurements.
In all cases the calculated mean was within a few parts in 108 of μF/F 0=refx with an uncertainty less than 0.05 μF/F.
6.4 Degrees of equivalence with respect to the comparison value Degrees of equivalence with respect to the comparison reference value are reported in this section. Only one value is reported for each participating laboratory. Where laboratories made more than one measurement the following selection criteria are applied:
1. If measurements were made at both 1592 Hz and 1000 Hz, degrees of equivalence are reported with respect to the measurement at 1592 Hz.
2. If measurements were made at more than one measurement voltage, degrees of equivalence are reported with respect to the measurement made at the measurement voltage closest to 100 Vrms.
3. For the pilot laboratory, degrees of equivalence are reported with respect to a generalised weighted mean of all pilot laboratory measurements.
For simplicity of notation, the subscript identifying the measurement number (n) is omitted in this section.
The degree of equivalence of the ith participant with respect to the comparison reference value is calculated as
irefii xxxd =−= . (6)
The expanded uncertainty associated with this result, U(di), is calculated as U(di) = kiu(xi) where ki is chosen to give 95 % coverage based on ν(xi). The degrees of equivalence of the participating institutes relative to the comparison reference value are tabulated in Table 6-2 and represented graphically in Figure 6-1.
1 A weighted mean including treatment of inter- and intra-laboratory correlations.

14
Participant di
(μF/F) U(di)
(μF/F) CMS 0.159 0.161 KIM-LIPI 0.002 11.740 KRISS -0.129 0.232 NIM 0.054 0.217 NIMT* 0.804 1.698 NMIA 0.002 0.037 NMIJ/AIST 0.014 0.077 NMISA * 0.006 0.110 NPLI -1.126 2.061 SCL* 1.479 4.139 SIRIM* 0.983 1.687 SPRING 0.494 1.059 VNIIM* -0.218 0.402
Table 6-2 Degrees of equivalence of the participating institutes relative to the comparison reference value. *Measurements made at a frequency of 1000 Hz (all other measurements at 1592 Hz).
CM
S
KIM
-LIP
I
KRIS
S
NIM
NIM
T
NM
IA
NM
IJ/A
IST
NM
ISA
NPL
I
SCL
SIR
IM
SPR
ING
VNIIM
-4
-3
-2
-1
0
1
2
3
4
d i (μF/
F)
1000Hz 1592Hz
Figure 6-1 Degrees of equivalence di of the participating institutes with respect to the comparison reference value. Uncertainty bars represent the expanded uncertainty U(di ).
15
7 Withdrawals or changes of results The Measurement Standards Laboratory, Industrial Research Limited, New Zealand were unable to measure the capacitance standards due to unexpected circumstances and withdrew from the comparison before their scheduled measurements.
8 Requests for follow up bilateral comparisons MSL, New Zealand and NPL, India have indicated that they may wish to participate in bilateral comparisons in the future.
9 Summary and conclusions A supplementary comparison of capacitance at 100 pF has been conducted between participating APMP member laboratories. There is good agreement between participating laboratories in the region for this quantity. It is expected that this comparison will be able to provide support for participants’ entries in Appendix C of the Mutual Recognition Arrangement.

16
10 Appendices
Appendix A: Methods of measurement Details of the method of measurement and traceability to the SI, as reported by participants, are reproduced below. Note that information relating to the key comparison APMP.EM-K4.1, conducted at the same time as APMP.EM-S7, is included in some cases as the protocol did not require participants to describe their method of measurement separately.
A.1 Method of measurement: CMS, Taiwan The comparison artefacts, 10 pF and 100 pF capacitors, are compared to 1000 pF reference standards individually by the 10:1 four terminal-pair (4TP) coaxial transformer bridge. The 1000 pF reference standard is GR1404A air standard capacitor which is traceable to DC quantum Hall resistance of CMS through ac resistance standards by using the quadrature bridge.
Figure A - 1 CMS Traceability to the SI.
A.2 Method of measurement: KIM-LIPI, Indonesia Facilities:
-Standard Capacitor GR-1404B (100pF): as reference.
-Capacitance Measurement System GR-1621: as comparator.
dc QHR
ac/dc 1 kΩ
DCC bridge
10:1 ac R bridge
ac 10 kΩ
ac 100 kΩ
ac 100 kΩ × 100 kΩ
1:1 ac R bridge
10:1 ac R bridge
1:1 C bridge
quadrature bridge
1 nF
10:1 C bridge
100 pF
10:1 C bridge
10 pF
1 nF × 1 nF

17
-Thermo-Hygrometer Corona GL-89.
Methodology:
-Artefact (10pF & 100pF) was compared to reference capacitor (100pF), and used Capacitance Measurement System GR-1621 with ratio 1:1 and 1:10.
-Measurement or comparison was repeated 10 times.
-Capacitor or room temperature was measured during artefact measurements.
A.3 Method of measurement: KRISS, Korea For the key and supplementary comparisons, a 10:1 ratio transformer bridge (see Figure A - 2) developed by a joint work between NMIA and KRISS was used.
Figure A - 2 KRISS 10:1 ratio transformer bridge
For the 10 pF (*) capacitor, it was measured by a substitution method between a 10 pF Zerodur standard capacitor and the 10 pF A/H capacitor, Cx(10 pF)*. And for 100 pF A/H capacitor (**), it was measured by 10:1 comparison method after disconnecting the Cx (10 pF)* .
As a calculable cross capacitor and toroidal cross capacitors have been developed at KRISS and are under analytical evaluation, the KRISS national standard of capacitance has been maintained using a 10 pF Zerodur capacitor developed in 1985 by a joint work between NMIA and KRISS. Since 1987, some of bilateral comparisons between NMIA and KRISS were carried out. In 1996 the value of standard was corrected by an inter-comparison among NMIA, KRISS and VNIIM. Continuously, this standard value has been traced through a comparison between BIPM and KRISS using a KLR standard capacitor developed at KRISS. After that, since 2002, not only a Zerodur capacitor but also a group of KLR capacitors are maintained as capacitance standard of KRISS.
18
Recently a bilateral comparison between KRISS and CENAM was carried out by using A/H capacitors, and then the results have been re-confirmed through calibration at BIPM for the same capacitors.
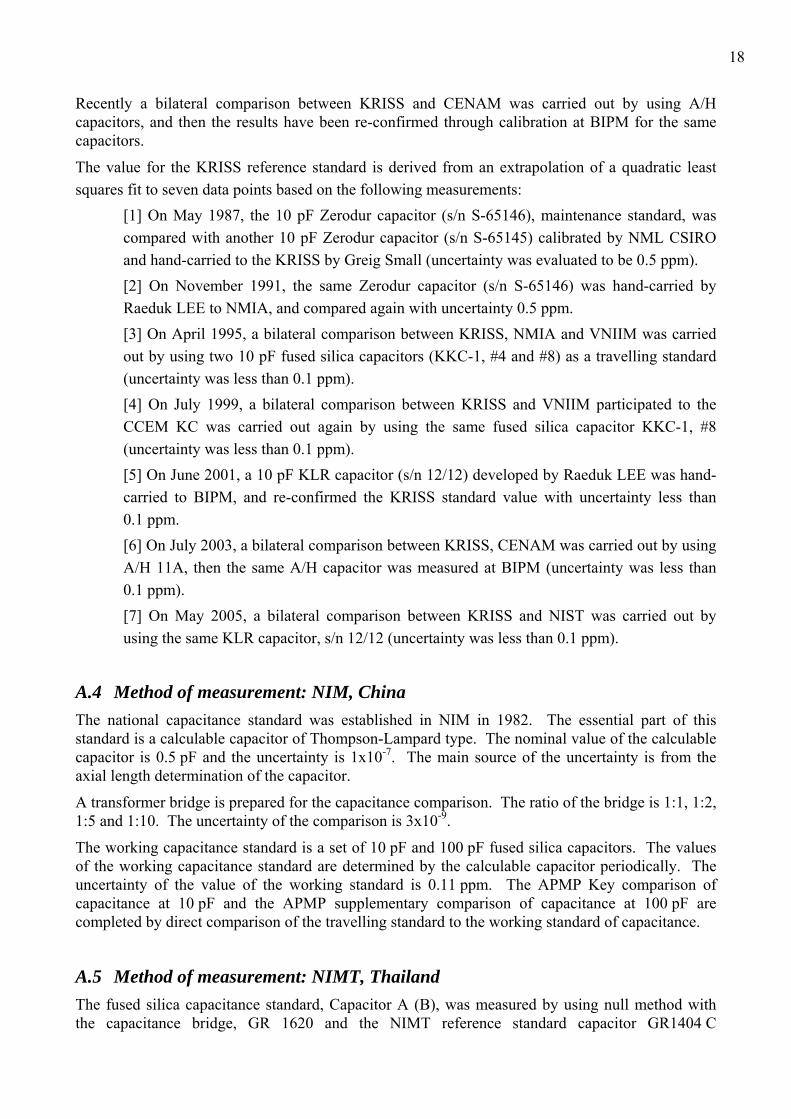
The value for the KRISS reference standard is derived from an extrapolation of a quadratic least squares fit to seven data points based on the following measurements:
[1] On May 1987, the 10 pF Zerodur capacitor (s/n S-65146), maintenance standard, was compared with another 10 pF Zerodur capacitor (s/n S-65145) calibrated by NML CSIRO and hand-carried to the KRISS by Greig Small (uncertainty was evaluated to be 0.5 ppm). [2] On November 1991, the same Zerodur capacitor (s/n S-65146) was hand-carried by Raeduk LEE to NMIA, and compared again with uncertainty 0.5 ppm. [3] On April 1995, a bilateral comparison between KRISS, NMIA and VNIIM was carried out by using two 10 pF fused silica capacitors (KKC-1, #4 and #8) as a travelling standard (uncertainty was less than 0.1 ppm). [4] On July 1999, a bilateral comparison between KRISS and VNIIM participated to the CCEM KC was carried out again by using the same fused silica capacitor KKC-1, #8 (uncertainty was less than 0.1 ppm). [5] On June 2001, a 10 pF KLR capacitor (s/n 12/12) developed by Raeduk LEE was hand-carried to BIPM, and re-confirmed the KRISS standard value with uncertainty less than 0.1 ppm. [6] On July 2003, a bilateral comparison between KRISS, CENAM was carried out by using A/H 11A, then the same A/H capacitor was measured at BIPM (uncertainty was less than 0.1 ppm). [7] On May 2005, a bilateral comparison between KRISS and NIST was carried out by using the same KLR capacitor, s/n 12/12 (uncertainty was less than 0.1 ppm).
A.4 Method of measurement: NIM, China The national capacitance standard was established in NIM in 1982. The essential part of this standard is a calculable capacitor of Thompson-Lampard type. The nominal value of the calculable capacitor is 0.5 pF and the uncertainty is 1x10⁻⁷. The main source of the uncertainty is from the axial length determination of the capacitor.
A transformer bridge is prepared for the capacitance comparison. The ratio of the bridge is 1:1, 1:2, 1:5 and 1:10. The uncertainty of the comparison is 3x10⁻⁹.
The working capacitance standard is a set of 10 pF and 100 pF fused silica capacitors. The values of the working capacitance standard are determined by the calculable capacitor periodically. The uncertainty of the value of the working standard is 0.11 ppm. The APMP Key comparison of capacitance at 10 pF and the APMP supplementary comparison of capacitance at 100 pF are completed by direct comparison of the travelling standard to the working standard of capacitance.
A.5 Method of measurement: NIMT, Thailand The fused silica capacitance standard, Capacitor A (B), was measured by using null method with the capacitance bridge, GR 1620 and the NIMT reference standard capacitor GR1404 C
19
(GR1404 B). At balance, the value of the said capacitance is the value of the reference standard capacitor multiplied by the bridge ratio.
The measurement is traceable to the Physikalisch-Technische Bundesanstalt (PTB), Germany through PTB Certificate No. 2339 PTB 03, 2338 PTB 03 and 2337 PTB 03.
A.6 Method of measurement: NMI, Australia The NMIA derives its capacitance standard from a Thompson-Lampard calculable capacitor [3-6] traceable to the SI via NMIA’s length standard.
The Calculable Capacitor ( 61 pF) is used to measure three 6
1 pF fixed capacitors by substitution on a transformer ratio bridge.
These three measured capacitors are then connected in parallel to constitute a reference capacitor of nominal value 0.5 pF, that is used on the NMIA 10:1 Transformer Ratio Bridge to measure 5 pF, then 50 pF, reference capacitors.
The measurement sequence linking the 50 pF reference capacitor to the Calculable Capacitor was performed at 1592 Hz within 10 days of each of the reported measurements. The history of the reference capacitor was used to interpolate (or in limited cases, extrapolate) its value, to obtain a value at the time of the reported measurements.
At the time of each independent measurement of the comparison artefacts, the 50 pF reference capacitor (50I) is compared with another 50 pF capacitor (50P) to obtain a 100 pF working standard (50I + 50P)
The comparison artefact, a 100 pF A-H capacitor, is compared with the 100 pF working standard on the same NMI 10:1 Transformer Ratio Bridge by substitution. The known frequency coefficient of the reference capacitor 50I is used to calculate a value for the working standard for measurements at 1000 Hz.
A.7 Method of measurement: NMIJ/AIST, Japan The capacitance is traceable to the QHR, the value of which was determined based on the latest value of the von Klitzing constant having an uncertainty with respect to the SI.
By using the four terminal-pair resistance bridge, the two terminal-pair quadrature bridge, the two terminal-pair capacitance bridge and the ac/dc calculable resistor, the capacitance was derived from the Quantized Hall Resistance (QHR).
A.8 Method of measurement: NMISA, South Africa The intercomparison artefacts, a 10 pF AH11A Fused Silica Standard and a 100 pF AH11A Fused Silica Standard were compared to standards of the same type and nominal value, as listed in Table A - 1, by direct substitution using an Andeen-Hagerling 2500 A Ultraprecision Capacitance Bridge, at 1 kHz. The voltages applied to the capacitor by this bridge are not specified, but are limited to about 15 V at 10 pF and 7,5 V at 100 pF. The capacitance was evaluated for a measuring voltage of 10 V by including the uncertainty due to the voltage coefficient of the capacitors. The environmental temperature of the laboratory was 24 °C during the comparison measurements. The capacitance was evaluated for a nominal temperature of 20 °C, by including the uncertainty due to the temperature coefficients of the capacitors. For the evaluations at 100 V, corrections for the values of the capacitors cannot be made, since the actual voltage coefficients of the capacitors are

20
not known. Therefore we included only an extra uncertainty component based on the manufacturer’s specifications for the voltage coefficients of the capacitors.
Description Make & Model Serial / ID Number 10 pF Fused Silica Standard Andeen-Hagerling, AH11A 01286 100 pF Fused Silica Standard Andeen-Hagerling, AH11A 01287 Ultraprecision Capacitance Bridge Andeen-Hagerling, AH 2500 A 000 640 Low Noise Coaxial Cable Andeen-Hagerling, DCOAX CRN-0241/1
Table A - 1 NMISA reference standards and equipment used.
A.9 Method of measurement: NPL, India The values of two 10 pF capacitors (one GenRad GR1404-C and one Andeen-Hagerling AH-11A) were derived from the calculable capacitor. Two 100 pF capacitors were measured against these two 10 pF capacitors using a 10:1 bridge and a direct comparison method.
The 10 pF comparison artefact was compared against the two 10 pF capacitors in turn using the 10:1 bridge and a 1:1 substitution method.
At 10 V, the 100 pF comparison artefact was measured against one of the 10 pF capacitors using the 10:1 bridge and a direct comparison method.
At 100 V, the 100 pF comparison artefact was measured against one of the 100 pF capacitors using an IET Labs1621 bridge.
A.10 Method of measurement: SCL, Hong Kong The capacitance of the test capacitors was determined at 1 kHz by substitution method. The laboratory’s reference standard capacitors were first measured using an Andeen-Hagerling capacitance bridge model AH 2500A. The test capacitors were then measured using the same bridge. The difference between the two readings was used, together with the known values of the reference standard capacitors, to calculate the values of the test capacitors.
The two reference standard capacitors (10 pF and 100 pF) were calibrated by NPL, UK for traceability to SI.
A.11 Method of measurement: SIRIM, Malaysia The 10 pF capacitor was measured by comparison against the 10 pF reference capacitor maintained by the National Metrology Laboratory, Malaysia, at a frequency of 1000 Hz and a voltage of 100 V using the GR 1615A capacitance bridge. See Error! Reference source not found.. The 100 pF capacitor was measured by comparison against the 100 pF reference capacitor maintained by the National Metrology Laboratory, Malaysia, at a frequency of 1000 Hz and a voltage of 10 V using the GR 1615A capacitance bridge. See Figure A - 3.

21
Figure A - 3: SIRIM GR 1615A Bridge configuration for 100 pF measurement at 10 V.
A.12 Method of measurement: SPRING, Singapore A GenRad (GR) 1621A Precision Capacitance Bridge was used for the measurements of 10 pF and 100 pF travelling capacitance standards at 1 kHz and 1.592 kHz. The GR bridge was used with an external thermostatted fused silica dielectric capacitance standard as a reference capacitor. For the comparison, a substitution method of measurement was used to compare the travelling standards against similar capacitance reference standards, using the GR’s external reference capacitor as a ‘dummy’ standard. The capacitance reference standards have been calibrated with traceability to the unit of capacitance maintained by groups of capacitance standards at 10 pF and 100 pF.
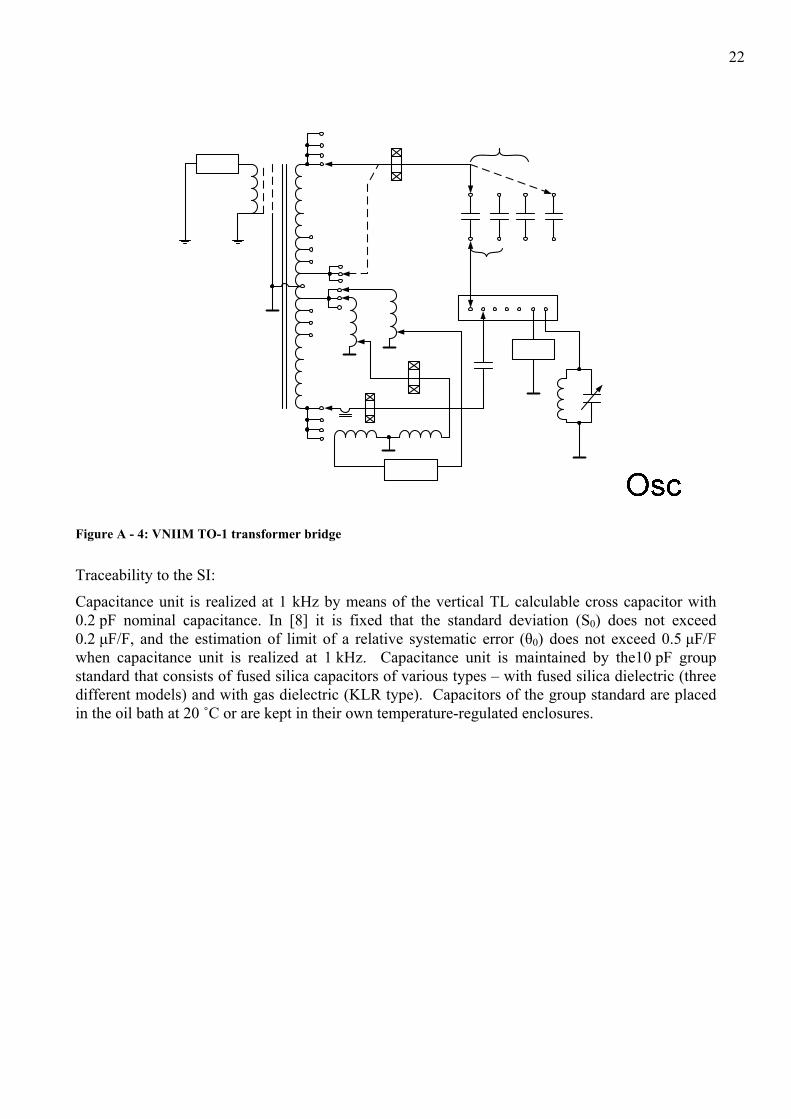
A.13 Method of measurement: VNIIM, Russia Тhe TО-1 transformer bridge which is a part of the secondary standard of capacitance was used to measure 10 and 100 pF capacitors (simplified circuit diagram is shown in Figure A - 4). Ratio windings of this bridge are executed as copper straps located side by side (the design is similar to that described in [7]) so that the output impedance does not exceed 0.030 Ω at 1 kHz. The bridge can be balanced by adjustment of two six-decade IVDs whose outputs are connected in series with the quadrature circuit and the injection transformer.
The 10 pF AH capacitor is measured by means of substitution method with use of 10 pF capacitors from the group standard that maintains the national unit of capacitance.
The 100 pF capacitor is measured using 1/10 ratio of the bridge and the capacitors that are specified above. The 1/10 ratio is calibrated by comparison with the self-calibrated ТМК bridge which is a part of the state primary standard of capacitance [8].
22
Figure A - 4: VNIIM TО-1 transformer bridge
Traceability to the SI:
Capacitance unit is realized at 1 kHz by means of the vertical TL calculable cross capacitor with 0.2 pF nominal capacitance. In [8] it is fixed that the standard deviation (S0) does not exceed 0.2 μF/F, and the estimation of limit of a relative systematic error (θ0) does not exceed 0.5 μF/F when capacitance unit is realized at 1 kHz. Capacitance unit is maintained by the10 pF group standard that consists of fused silica capacitors of various types – with fused silica dielectric (three different models) and with gas dielectric (KLR type). Capacitors of the group standard are placed in the oil bath at 20 ˚С or are kept in their own temperature-regulated enclosures.

23
Appendix B: Uncertainty statements
B.1 Uncertainty statement: CMS, Taiwan
APMP.EM-S7 (100 pF) Quantity Estimate Unit Standard
uncertainty Unit Effective
DOF Sensitivity coefficient
Unit Contribution to rel. std. unc.
(μF/F)
1. Realisation of SI farad Transfer of DC QHR to 100 kΩ 100 kΩ 0.067 μΩ/Ω ∞ 1 0.067
2. 100 kΩ to 1 nF Frequency 0.01 μF/F ∞ 1 0.010 Bridge resolution 0.03 μF/F ∞ 0.5 0.015 Repeatability 0.02 μF/F 3 0.5 0.010 Bridge network 0.01 μF/F ∞ 0.5 0.005 Ratio transformer 0.02 μF/F ∞ 0.5 0.010 harmonics 0.03 μF/F ∞ 0.5 0.015 Ratio of two 1 nF 0.031 μF/F ∞ 0.5 0.016
3. Measurement of comparison artefact
Repeatability 0.016 μF/F 5 1 0.016 Temperature correction for 1 nF reference standard
0.005 μF/F ∞ 1 0.005
Drift rate for 1 nF reference standard during comparison
0 μF/F ∞ 1 0
Ratio transformer 0.02 μF/F ∞ 1 0.02 Bridge network 0.01 μF/F ∞ 1 0.01
Final Values: 100.000078 pF 3056 0.080
B.2 Uncertainty statement: KIM-LIPI, Indonesia
APMP.EM-S7 (100 pF)
Quantity Estimate Unit Standard uncertainty
Unit Effective DOF
Sensitivity coefficient
Unit Contribution to rel. std. unc.
(μF/F)
Measurement of comparison artefact
Mean of n independent measurements
0.54 μF/F 0.066 μF/F 9 1 0.066
Reference Capacitance 0.612 μF/F >120 1 0.612 Capacitance Drift 0.577 μF/F ∞ 1 0.577 Bridge Accuracy 5.774 μF/F ∞ 1 5.774 Bridge Accuracy (freq) 1592 Hz 0.744 μF/F ∞ 1 0.744 Bridge Resolution 0.003 μF/F ∞ 1 0.003 Lead Correction 0.214 μF/F ∞ 1 0.214 Reference Temperature 23 °C 0.577 °C ∞ 1.88 μF/F/K 1.085 Artefact Temperature 23 °C 1.732 °C ∞ 0.01 μF/F/K 0.017 Measurement Voltage 100 V 4.388 V ∞ 0.003 μF/F/V 0.013 Measurement Frequency 1592 Hz Power Line 220 V
Final Values: 0.54 μF/F >120 5.99
24
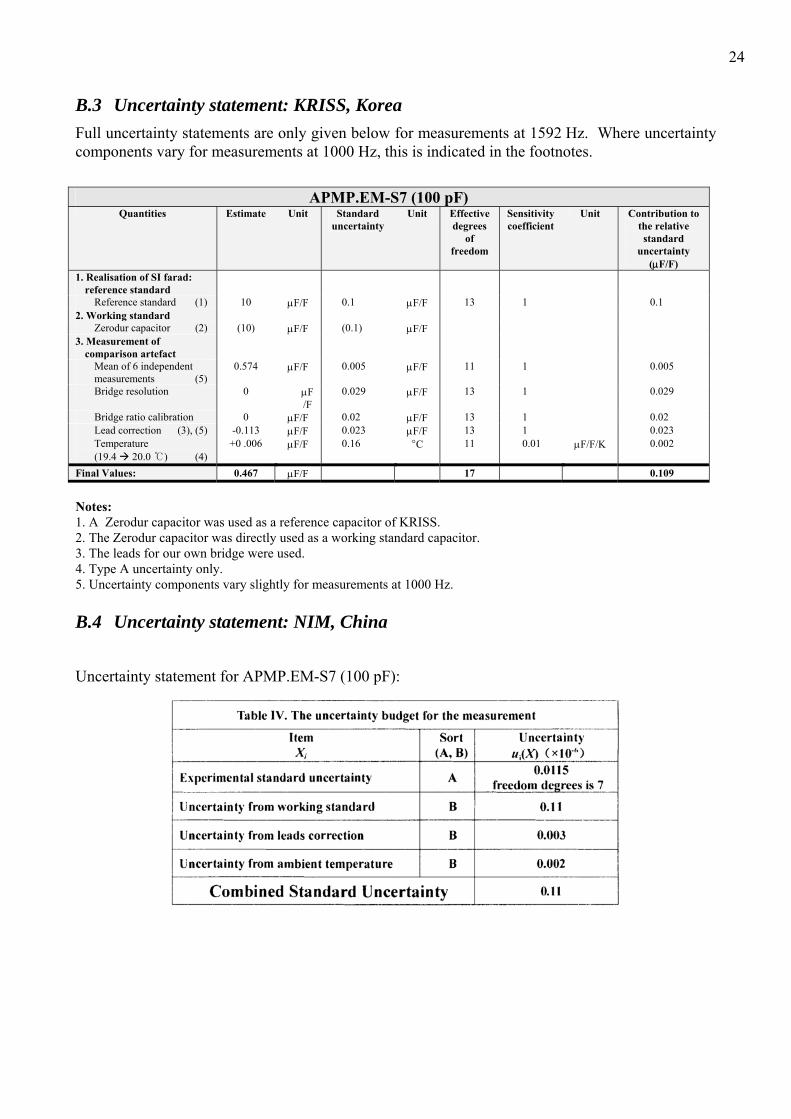
B.3 Uncertainty statement: KRISS, Korea Full uncertainty statements are only given below for measurements at 1592 Hz. Where uncertainty components vary for measurements at 1000 Hz, this is indicated in the footnotes.
APMP.EM-S7 (100 pF)
Quantities Estimate Unit Standard uncertainty
Unit Effective degrees
of freedom
Sensitivity coefficient
Unit Contribution to the relative standard
uncertainty (μF/F)
1. Realisation of SI farad: reference standard
Reference standard (1) 10 μF/F 0.1 μF/F 13 1 0.1 2. Working standard
Zerodur capacitor (2) (10) μF/F (0.1) μF/F 3. Measurement of
comparison artefact
Mean of 6 independent measurements (5)
0.574 μF/F 0.005 μF/F 11 1 0.005
Bridge resolution 0 μF/F
0.029 μF/F 13 1 0.029
Bridge ratio calibration 0 μF/F 0.02 μF/F 13 1 0.02 Lead correction (3), (5) -0.113 μF/F 0.023 μF/F 13 1 0.023 Temperature (19.4 20.0 ℃) (4)
+0 .006 μF/F 0.16 °C 11 0.01 μF/F/K 0.002
Final Values: 0.467 μF/F 17 0.109
Notes: 1. A Zerodur capacitor was used as a reference capacitor of KRISS. 2. The Zerodur capacitor was directly used as a working standard capacitor. 3. The leads for our own bridge were used. 4. Type A uncertainty only. 5. Uncertainty components vary slightly for measurements at 1000 Hz.
B.4 Uncertainty statement: NIM, China
Uncertainty statement for APMP.EM-S7 (100 pF):
25
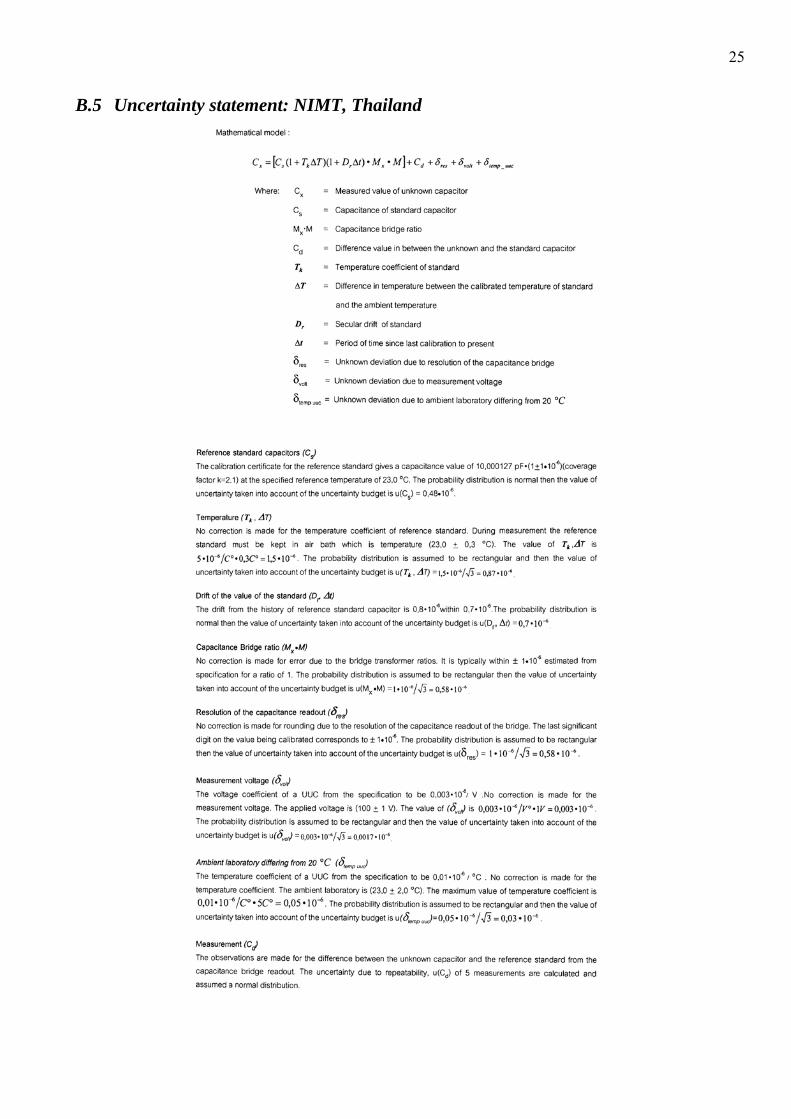
B.5 Uncertainty statement: NIMT, Thailand

26
B.6 Uncertainty statement: NMI, Australia The uncertainty statements presented below are for the 11th measurement (mean measurement date 27 May 2006). They are typical of the uncertainty statements for each measurement by the pilot laboratory at 1592 Hz.
APMP.EM-S7 (100 pF) Quantity Estimate Unit Standard
uncertainty Unit Effective
DOF Sensitivity coefficient
Unit Contribution to rel. std. unc.
(μF/F) 1. Realisation of SI farad
Calculable Capacitor 0 μF/F 0.0320 μF/F 6.4 1 0.0320 2. Working standard (50I)
Transformer Ratio 0 μF/F 0.0039 μF/F 4078 1.41 0.0055 Bridge voltage coefficient 0 μF/F 0.0034 μF/F 7 1.41 0.0048 Bridge loading correction 0 μF/F 0.0015 μF/F 5 1.41 0.0021 Bridge balance injection 0 μF/F 0.0010 μF/F 3 1.41 0.0014 2-port definition 0 μF/F 0.0010 μF/F 3 1.41 0.0014 50I Voltage Coefficient 0 μF/F 0.0000 μF/F 5 1 0.0000 Bridge resolution 0 μF/F 0.0029 μF/F ∞ 1.41 0.0041 Extrapolation (1) 0 μF/F 0.0088 μF/F 22 1 0.0088
3. Measurement of artefact Mean of 5 independent measurements (1)
0 μF/F 0.0023 μF/F 4 1 0.0023
Bridge resolution (2) 0 μF/F 0.0029 μF/F ∞ 1.58 0.0046 Lead correction (1) -0.032 μF/F 0.0016 μF/F ∞ 1 0.0016 Temperature (1) 19.6 °C 0.058 °C 246 0.0065 μF/F/K 0.0004
Final Values: -0.032 μF/F 9 0.035
Notes: 1. These uncertainties may vary slightly from measurement to measurement. 2. In measuring the 100 pF) artefact, the bridge resolution is applied on four occasions, two of which have a weight of 0.5.

27
B.7 Uncertainty statement: NMIJ/AIST, Japan
APMP.EM-S7 (100 pF) Quantity Estimate Unit Standard
uncertainty Unit Effective
DOF Sensitivity coefficient
Unit Contribution to rel. std. unc.
(μF/F)
Realisation of SI farad: reference standard
100 pF capacitance standard based on a quantized Hall resistance (QHR) (1),(2)
-0.262 μF/F 0.033 μF/F 1828 1 0.033
Measurement of comparison artefact
Mean of 5 independent measurements 0.723 μF/F 0.004 μF/F 4 1 0.004
Lead correction (3) -0.040 μF/F 0.012 μF/F ∞ 1 0.012 Temperature correction: (23 ºC → 20 ºC) (4) 0.005 μF/F 0.005 μF/F ∞ 1 0.005
Measurement voltage: 100 Vrms (5) 0.1 V ∞ 0.003 μF/F/V 0.0003
Measurement frequency: 10000/2π Hz (5) 0.005 Hz ∞ 0.0002 μF/F/Hz 0.000001
Final Values: 0.426 μF/F 2277 0.036
Notes:
1. Latest value of the von Klitzing constant of RK = 25. 812 807 449 kΩ with a relative standard uncertainty of 3.3×10⁻⁹ was used [9]. 2. Details of uncertainties are described in [10]. 3. Leads effect was estimated by measuring the relative change of capacitance with changing the length of leads. 4. The temperature coefficient of capacitance with respect to changes in ambient laboratory temperature was measured to be 0.0085 μF/F/K for Capacitor A (10 pF) and –0.0018 μF/F/K for Capacitor B (100 pF). 5. Type B uncertainty only.
B.8 Uncertainty statement: NMISA, South Africa
APMP.EM-S7 (100 pF at 1 kHz, 10 V) Certificate No DCLF/C-1259
Input Quantity
(Source of Uncertainty) (X i ) (x i ) Unit U(Xi) Ci Unit Ui (y) ν
Average of 29 pairs of readings -0.4080 0.0005 μF/F Normal k = 1 1.00 4.668E-04 1.000E+00 - 4.668E-04 28.00
Reading resolution of the AH2500A (in % mode) 0.000 0.001 μF/F Triangular √6 2.45 4.082E-04 1.000E+00 - 4.082E-04 infinite
Calibration of the reference (BIPM cert. no. 51) 0.910 0.050 μF/F Normal k = 1 1.00 5.000E-02 1.000E+00 - 5.000E-02 infinite
Drift of the standard since last calibration 0.009 0.003 μF/F Normal k = 1 1.00 3.000E-03 1.000E+00 - 3.000E-03 infinite
Voltage coefficient of capacitance of reference standard (no contribution) 0.000 0.000 μF/F Rectangular √3 1.73 0.000E+00 1.000E+00 - 0.000E+00 infinite
Voltage coefficient of capacitance of unit under test (no contribution) 0.000 0.000 μF/F Rectangular √3 1.73 0.000E+00 1.000E+00 - 0.000E+00 infinite
Corrections for temperature influences 0.000 0.030 μF/F Rectangular √3 1.73 1.732E-02 1.000E+00 - 1.732E-02 infinite
Corrections for powerline fluctuations 0.000 0.001 μF/F Rectangular √3 1.73 5.774E-04 1.000E+00 - 5.774E-04 infinite
Value of the measurand (deviation from nominal) 0.511 μF/FCombined Standard Uncertainty 5.301E-02 μF/F νeff infiniteExpanded Uncertainty Level of Confidence 68,27 % K = 1 5.30E-02 μF/F k = 1.00
Absolute value 100.000051 pFAbsolute uncertainty 5.3E-06 pF
UNCERTAINTY BUDGET MATRIX (UBM)Reference: Guide to the Expression of Uncertainty in Measurement, issued by BIPM, IEC, IFCC, ISO, IUPAC, IUPAP, OIML - ISO 1995 (ISBN 92-67-10188-9)
100 pF, 1 kHz, 10 VDescription Calibration of 100 pF Capacitor vs 100 pF reference in substitution method with AH2500A bridge
Type & Serial
Number100 pF, AH 11A, #01350 Range
Mathematical Model
Symbol
Estimated Input
Quantity
Estimated Probability Distribution (N, R, T, U)
Standard Uncertainty
Sensitivity Coefficient Uncertainty
Standard Uncertainty Contribution
Degrees of Freedom
ReadRead sx CC Δ−Δ
ResCΔ
CertsCΔ
DriftsCΔ
VoltsCΔ
VoltxCΔ
PLFCΔ
PLFsssResssxx CCCCCCCCCCTCCVoltDriftCertCertReadRead
Δ+Δ+Δ+Δ+Δ+Δ+Δ+Δ−Δ=Δ
TCCCΔ

28
B.9 Uncertainty statement: NPL, India The following uncertainty statements are those for measurements at 1592 Hz. Uncertainty statements for measurements at 1000 Hz differ where indicated.
APMP.EM-S7 (100 pF, measured at 10 V) Quantity Estimate Unit Standard
uncertaintyUnit Effective
DOF Sensitivity coefficient
Unit Contribution to rel. std. unc.
(μF/F)
1. Realisation of SI farad: reference standard
Value of reference standard (1) 9.9999923 pF 0.3 μF/F 400 1 0.3 Temperature correction 25.0 ºC 0.05 μF/F 1 0.05 Bridge Transformer Ratio 4x10⁻⁷ 0.05 10-6 1 0.05 Drift in Standards 2 years 0.2 μF/F 1 0.2 Temp Hysteresis 1 ºC 0.01 μF/F 1 0.01 Bridge resolution 0.04 μF/F 0.02 μF/F 1 0.02
3. Measurement of comparison
artefact
Mean of n independent measurements (1) 99.999932 pF 0.01 μF/F 8 1 0.01
Lead correction 0 μF/F 0 μF/F 0 Final Values: (1) 99.999932 1028 0.40
APMP.EM-S7 (100 pF, measured at 100 V) Quantity Estimate Unit Standard
uncertaintyUnit Effective
DOF Sensitivity coefficient
Unit Contribution to rel. std. unc.
(μF/F)
1. Realisation of SI farad: reference standard
Value of reference standard (1) 99.999931 pF 0.4 μF/F 500 1 0.4 Temperature correction 25.0 ºC 0.05 μF/F 1 0.05 Bridge calibration 0.1 1 10-6 700 1 1 Drift in Standards 2 years 0.2 μF/F 1 0.2 Temp Hysteresis 1 ºC 0.01 μF/F 1 0.01 Bridge resolution 0.02 μF/F 0.01 μF/F 1 0.02 Voltage Difference 90 V 0.1 μF/F 1 0.1
3. Measurement of comparison artefact
Mean of n independent measurements (1) 99.999933 pF 0.02 μF/F 8 1 0.02
Lead correction 0 μF/F 0 μF/F 0 Final Values: (1) 99.999933 840 1.05
Notes: 1. Indicates those values that differ for measurements at a frequency of 1000 Hz.

29
B.10 Uncertainty statement: SCL, Hong Kong
APMP.EM-S7 (100 pF) Quantity Estimate Unit Standard
uncertainty Unit Effective
DOF Sensitivity coefficient
Unit Contribution to rel. std. unc.
(μF/F)
1. Realisation of SI farad: reference standard
Value of reference standard 99.9981 pF 1.5 μF/F 100 1 1.5 Extrapolation to mean measurement date
99.9979 pF 1.3 μF/F 100 1 1.3
Temperature correction 0 °C 0.2 K 100 2 μF/F/K 0.4 3. Measurement of comparison
artefact
Mean of 5 independent measurements
100.00020 pF 0.05 μF/F 5 1 0.05
Bridge resolution 0 μF/F 0.29 μF/F 50 1 0.29 Lead correction 0 μF/F 0.06 μF/F 50 1 0.06 Temperature 23.0 °C 1.73 K 50 0.01 μF/F/K 0.0173 Measurement voltage 7.5 V 53.4 V 50 0.003 μF/F/V 0.1602
Final Values: 223 2.1
B.11 Uncertainty statement: SIRIM, Malaysia
APMP.EM-S7 (100 pF) Quantity Identifier Estimate Unit Standard
uncertainty Unit Effective
DOF Sensitivity coefficient
Unit Contribution to rel. std. unc.
(μF/F)
1. Reference Standard Assigned Value of Ref. Cap. CRefBIPM 99.999530 pF 0.050 μF/F 50 1 0.050 Transportation effects δCRefTransport - pF 0.156 μF/F ∞ 1 0.156 Temp.coefficient of Ref. Cap. δCRefTambient - pF 0.003 μF/F ∞ 1 0.003 Temp. hysteresis of Ref. Cap. δCRefThysteresis - pF 0.029 μF/F ∞ 1 0.029 Voltage coefficient of Ref. δCReftestvoltage - pF 0.000 μF/F ∞ 1 0.000 Mains line coeff.of Ref. Cap. δCRefmainsvoltage - pF 0.000 μF/F ∞ 1 0.000 Change in the value of Ref. Cap with time
δCReftime - pF 0.662 μF/F ∞ 1 0.662
2. Measurement of comparison artefact
Mean bridge readings DecadeMean 0.018720 pF 0.362 μF/F 9 1 0.362 Bridge calibration ΔBridgeCorr -0.018099 pF 0.362 μF/F 9 1 0.362 Bridge GR 1615 resolution δresl - pF 0.029 μF/F ∞ 1 0.029 Lead Correction δXlead - pF Ambient Temperature 22.5 °C ∞ 1.00E-06 0.003 Correction to temp differing from 20 deg. C
∆TempCorr -0.0000025 pF 0.003 μF/F ∞ 1.00E-06 0.000
Measurement voltage 10 V ∞ 3.00E-07 0.000 Measurement frequency 1000 Hz
Final Values: 100.00015 pF 139 0.853Notes:
1. Cx = CRef + DecadeMean + ∆BridgeCorr + δXTambient + δXtestvoltage+ δresl + δXlead 2. Cref = CRefBIPM + δCRefTambient + δCRefThysteresis + δCReftestvoltage + δCRefmainsvoltage + δCReftime + δCRefTransport

30
B.12 Uncertainty statement: SPRING, Singapore Uncertainty statements for measurements at 1592 Hz are given below. Uncertainty statements for measurements at 1000 Hz differ only in the uncertainty component relating to repeatability.
SPRINGUNCERTAINTY STATEMENT : APMP.EM-S7 (100 pF @ 1592 Hz)
Capacitor A : Serial Number 01350Quantity Estimate Unit Standard Unit Effective Senstivity Unit Contribution to
uncertainty degrees coefficient the relative standardof freedom uncertainty (µF/F)
1 Reference Standard1.1 Realisation of SI farad1.1.2 Reference standard calibration uncertainty 0.90 µF/F 0.45 µF/F ∞ (7) 1 0.45
1.2 Derivation of value of Reference Standard1.2.1 Stability (1) 0.31 µF/F 0.18 µF/F ∞ (7) 1 0.181.2.2 Chassis temperature (2) 30.06 ° C 0.68 °C ∞ (7) 0.01 µF/F/°C 0.00391.2.3 Measurement voltage (3) 10 V 0.17 V ∞ (7) 0.003 µF/F/V 0.0000
3 Measurement of comparison artefact3.1 Bridge calibration (4) 0.40 µF/F 0.23 µF/F ∞ (7) 1 0.233.2 Bridge resolution 0.010 µF/F 0.0058 µF/F ∞ (7) 1 0.00583.3 Repeatability 0.031 µF/F 0.010 µF/F 9 1 0.010
3.4 Measurement Conditions3.4.1 Ambient temperature (5) 23 ° C 0.58 °C ∞ (7) 0.01 µF/F/°C 0.00333.4.2 Measurement voltage (3) 10 V 0.17 V ∞ (7) 0.003 µF/F/V 0.00003.4.3 Measurement frequency (6) 1592 Hz - ∞ (7) - -
Final Values : (combined standard uncertainty) 0.6
Notes :1 due to drift of reference standard 5 ambient temperature was 23 ± 1.0 °C2 reference standard calibrated at chassis temperature of 28.9 °C 6 frequency was derived by systhesis from a frequency primary standard so effect of frequency 3 AC test signal voltage; 10 V ± 3 %, reference values were calibrated at 10 V uncertainty is insignificant4 includes stability, non-linearity, temperature coefficient, leads 7 type B uncertainty, assuming rectangular distribution
B.13 Uncertainty statement: VNIIM, Russia APMP.EM-S7 (100 pF)
Quantity Estimate Unit Standard uncertainty
Unit Effective DOF
Sensitivity coefficient
Unit Contribution to rel. std. unc.
(μF/F)
1. Realisation of SI farad: VNIIM calculable capacitor
Geometrical imperfections 0.2 pF 0.08 μF/F 13 1 0.08 Laser interferometer 0 μF/F 0.03 μF/F 8 1 0.03 Transformer bridge 0 μF/F 0.06 μF/F 13 1 0.06 Insufficient sensitivity 0 μF/F 0.09 μF/F 6 1 0.09 Repeatability 0 μF/F 0.10 μF/F 6 1 0.10
2. Working standard (10 pF) (1) Build-up from calculable capacitor
0 μF/F 0.04 μF/F 8 1 0.04
Extrapolation to mean measurement date
0 μF/F 0.02 μF/F 50 1 0.02
Bridge calibration 0 μF/F 0.02 μF/F 13 1 0.02 Temperature correction 0 μF/F 0.03 μF/F 20 1 0.03
3. Measurement of comparison artefact
Mean of 7 independent measurements
0. 27 μF/F 0.016 μF/F 6 1 0.016
Ratio calibration 0.12 μF/F 0.08 μF/F 6 1 0.08 Bridge resolution 0 μF/F 0.02 μF/F 13 1 0.02 Lead correction -0.018 μF/F 0.005 20 1 0.005 Temperature correction -0.004 μF/F 0.1 °C 13 0.01 μF/F/K 0.001
Final Values: (2) 0.37 μF/F 39 0.198
Notes: 1. The group standard for maintenance of the national unit of capacitance. 2. Calculated value of effective degrees of freedom is truncated to the next lower integer.

31
Appendix C: Optional measurements: Dissipation factor
Reporting of the dissipation factor was optional. The capacitor is modelled as an ideal capacitor, of capacitance C, in parallel with an ideal resistor, of conductance G. The admittance of the capacitor is therefore Y = G + jωC and the dissipation factor D = G/ωC.
Three participants made measurements of the dissipation factor. Results are shown in Table A - 2.
f = 1000 Hz f = 1592 Hz Participant
Measurement Voltage
(V) D
(μrad) U95%
(μrad) D
(μrad) U95%
(μrad) NPLI 10 0 3 0 3 100 0 3 0 5 KRISS 10 0.550 0.009 0.550 0.009 VNIIM 9.85 1.5 1.5 - -
Table A - 2 Dissipation factor measurements.
Appendix D: References [1] Mutual Recognition Arrangement “Mutual Recognition of National Measurement Standards and of Calibration and Measurement Certificates Issued by National Metrology Institutes - Arrangement Drawn up by the International Committee of Weights and Measures under the Authority Given to it in the Metre Convention.” http://www.bipm.org/utils/en/pdf/mra_2003.pdf 15 January 2007.
[2] Witt T. J. “Pressure coefficient of some Zener diode-based electronic voltage standards,” IEEE Trans. Instrum. Meas., Vol. 48, No. 2, 1999, pp. 329-332.
[3] Thompson A. M. and Lampard D. G. "A New Theorem in Electrostatics and its Application to Calculable Standards of Capacitance", Nature, Vol. 177, 1956, p. 888.
[4] Thompson A. M. "The Cylindrical Cross-capacitor as a Calculable Standard", Proc. IEE, Vol. 106, Part B No. 27, 1959, pp. 307-310.
[5] Clothier W. K. "A Calculable Standard of Capacitance", Metrologia, Vol. 1, No. 2, 1965, pp 35-56.
[6] Small G. W. "Twenty Years of SI Ohm Determinations at NML", IEEE Trans. Instrum. Meas., Vol. IM-36, No. 2, 1987, pp. 190-195.
[7] McGregor M. C., Hersh J.F., Cutkosky R.D., Harris F.R. and Kotter F.R. “New apparatus at the National Bureau of Standards for absolute capacitance measurement”, IRE Trans. Instrum., v.7, 1958, pp. 253-61
[8] GOST 8.371-80. State system for ensuring the uniformity of measurements. State primary standard and all-union verification schedule for means measuring electrical capacity.
[9] http://physics.nist.gov/cuu/Constants/index.html 15 January 2007
[10] Nakamura Y., Nakanishi M. and Endo T. “Measurement of frequency dependence of standard capacitor based on the QHR in the range between 1 kHz and 1.592 kHz” IEEE Trans. Instrum. Meas., vol. 50, No. 2, pp. 290-293, 2001

32
Appendix E: Comparison protocol The comparison protocol is attached.
33
Protocol for
APMP.EM-K4.1
APMP Key Comparison of Capacitance at 10 pF
and
APMP.EM-S7 APMP Supplementary Comparison of Capacitance at 100 pF
Contents
1. Introduction........................................................................................................................ 35
2. Travelling Artefacts ........................................................................................................... 35
(a) Description ........................................................................................................... 35 (b) Operation 37
3. Transport of Artefacts ....................................................................................................... 37
(a) Customs arrangements ......................................................................................... 37 (b) Transport case ...................................................................................................... 37 (c) Damage 37 (d) Receipt of travelling standard .............................................................................. 37 (e) Measurement Period............................................................................................. 38 (f) Dispatch of travelling standard............................................................................. 38
4. Measurement of the capacitors......................................................................................... 38
(a) Preparation ........................................................................................................... 38 (b) Laboratory conditions .......................................................................................... 39 (c) Measurement voltage ........................................................................................... 39 (d) Measurement frequency ....................................................................................... 39 (e) Measurement leads ............................................................................................... 39 (f) Recorded quantities .............................................................................................. 39 (g) Temperature dependence of capacitance ............................................................. 39
5. Reporting of results............................................................................................................ 39
(a) General comments................................................................................................ 39 (b) Results 40 (c) Uncertainty ........................................................................................................... 40
6. Notes .................................................................................................................................... 40
34
7. Comparison costs ............................................................................................................... 41
8. Inquiries .............................................................................................................................. 42
Appendix I: Schedule............................................................................................................. 51

35
11 Introduction A key comparison of capacitance at 10 pF and a supplementary comparison of capacitance at 100 pF is to be conducted between participating APMP member laboratories. Its aim is to provide participating laboratories with the opportunity to intercompare national standards of capacitance within the Region, and to gain experience and knowledge in this field.
It is proposed that the values from this key comparison in the APMP region be linked to the international key comparison CCEM-K4 carried out between 1994 and 1996. The linking laboratories will be NML CSIRO (Australia), MSL IRL (New Zealand), NIM (China) and VNIIM (Russian Federation).
The National Measurement Laboratory (NML), Australia, will act as the pilot laboratory for the comparison. Dr Leigh Johnson will act as the coordinator. The members of the support group for the comparison are Dr. Sze Wey Chua, SPRING Singapore, Dr Rae Duk Lee, KRISS Korea and Mr Andrew Corney, MSL New Zealand.
It is expected that the comparison will start towards the end of 2003. Each participating laboratory should ensure that the time required for their measurements and for transportation to the next laboratory does not exceed four weeks. It is anticipated that the comparison measurements will be completed within two years.
The circulation of the capacitors will be organised in loops of no more than five laboratories to allow close monitoring of the behaviour of the standard capacitors.
In the event of failure of a standard the pilot laboratory should be informed. The pilot laboratory will consider whether to continue the comparison with the remaining capacitor, substitute an alternative standard or abandon the comparison.
This protocol has been developed according to the Guidelines for CIPM key comparisons, available on the BIPM web site:
http://www.bipm.fr/pdf/guidelines.pdf
12 Travelling Artefacts
12.1 Description The artefacts are a 10 pF and a 100 pF Andeen-Hagerling AH11A fused silica capacitance standard mounted in a single AH1100 capacitance standard frame. Details of the two comparison capacitors are given in Table 3 and the manufacturer’s specifications for this type of standard are given in Table 4. The AH1100 frame is a standard width bench-top or rack-mountable frame. Each AH11A capacitance standard includes a temperature-controlled oven that is powered via the AH1100 frame. The frame also monitors internal power voltages and temperatures.
More detailed information on this type of capacitance standard is available on the manufacturers web site: http://www.andeen-hagerling.com/ah11a.htm
The capacitors are fitted with BNC co-axial terminations. Co-axial measuring leads with BNC to MUSA connectors will be supplied with the capacitors, together with MUSA-GR874 adapters and MUSA-BNC adapters.
A power line cord (standard IEC connector to Australian three-pin plug) will be supplied to power the standard. Participants may need an adapter or a power line cord appropriate to their country.

36
Comparison identifier P2-APMP.EM-K4.1 P1-APMP.EM-S7
Comparison type Key Supplementary
Nominal value of capacitance 10 pF 100 pF
Capacitor identifier Capacitor A Capacitor B
Serial number of capacitor 01349 01350
Table 3 Details of the comparison capacitors.
Operating parameters:
12.1.1.1.1.1 Power voltage ranges
85 to 115, 102 to 138, 187 to 253 and 204 to 276 volts rms
Power frequency 48 to 440 Hz
Warm up time from power-on 30 minutes
Operating temperature range 10° to 40° C
Maximum allowable applied voltage
250 volts peak
Operating humidity range 0 to 85% relative humidity, non-condensing
Sensitivity of AH11A capacitance standard:
12.1.1.1.1.2 Temperature coefficient relative to a change in ambient temperature
0.01 μF/F/K
12.1.1.1.1.3 AC voltage coefficient
0.003 μF/F/volt rms at 1 kHz
12.1.1.1.1.4 Sensitivity to power line voltage changes
0.0003 μF/F per 1% change in power line voltage
12.1.1.1.1.5 Hysteresis from mechanical shock
0.05 μF/F
12.1.1.1.1.6 Hysteresis from temperature cycling
0.05 μF/F
12.1.1.1.1.7 DC voltage coefficient
0.0001 μF/F/V
Transport information:
Storage temperature range -40° to +75° C
AH 1100 frame size 8.9 cm high and 38.1 cm deep behind the front panel.

37
Total weight of AH1100 frame and two AH11A capacitors
8.4 kg
Table 4 Manufacturer’s specifications for the Andeen-Hagerling AH11A standard capacitor and AH1100 frame.
12.2 Operation The AH 1100/11A Operation and Maintenance Manual will be included with the shipment. Participants should familiarise themselves with the operation of the standards before proceeding. In particular, the correct line voltage must be selected and a corresponding fuse fitted before applying power to the unit.
Measurements should not be taken until the OVEN NOT READY indicator stops blinking. If the OVEN NOT READY indicator continues blinking for more than an hour after applying power to the standard or starts blinking during measurements, please contact the pilot laboratory.
Note that the HIGH and LOW terminals of the capacitors have different properties. Refer to Chapter 2 of the AH 1100/11A Operation and Maintenance Manual for more information.
13 Transport of Artefacts
13.1 Customs arrangements The artefacts will be transported using an ATA Carnet for customs clearance where possible. A separate comparison loop will be organised for those participants that do not qualify for the ATA scheme.
13.2 Transport case The capacitors will be transported in an aluminium case. The dimensions of the transport case are 750 mm x 750 mm x 450 mm. The case weighs 27 kg giving a total shipping weight of approximately 36 kg.
Participants are requested to ensure that handling and transport shock is kept to a minimum.
13.3 Damage Please report to the pilot laboratory any damage of the artefacts or accompanying items.
13.4 Receipt of travelling standard On receipt of the travelling standard:
1. Inspect the outside of the transport case for any signs of physical damage. A shock monitor is attached to the outside of the transport case. Check that the monitor label has not been activated.
2. Open the transport case and check that the contents are complete (refer to Packing List for list of contents). In particular, please check that the Carnet is with the shipment.
3. Notify both the pilot laboratory and the sending laboratory of the receipt of the travelling standards using the Artefact Received Fax Form provided. Fax numbers for each participating laboratory are given in the Participant List.
4. Retain or make a copy of all shipping documentation. Please do not dispose of this documentation until the comparison is complete. DO NOT retain the original copy of the carnet.

38
5. A copy of the AH 1100/11A Operation and Maintenance Manual is included in the shipment. If you have not used this type of standard before, please familiarise yourself with the operation of the standards before proceeding.
6. The AH1100 frame containing the two capacitance standards should be removed from the transport case. Please do not open the AH1100 frame. Please do not remove the AH11A capacitance standards from the frame. Remove the travelling plug from the power line cord receptacle at the back of the bridge. Before applying power to the unit, select the correct line voltage and fit an appropriate fuse, referring to pages 1-5 and 1-6 of the AH 1100/11A Operation and Maintenance Manual.
7. Apply power to the frame and wait until the oven temperature is stable (OVEN NOT READY indicator stops blinking). Typically, the oven will take 20 minutes to stabilise. For the most precise measurements, it is recommended that the standards are left to stabilise for two to three days.
13.5 Measurement Period The draft comparison schedule allows a total of four weeks for each laboratory. The four week period starts when the travelling artefact arrives in the participant’s country and ends when the travelling artefact arrives in the following participant’s country. It is anticipated that participants will have at least a two week measurement period.
Arrangements for shipping the artefact to the next scheduled laboratory should be in place before the end of the measurement period. As a courtesy, contact should be made with the next scheduled laboratory regarding shipping, particularly if the anticipated dispatch date is earlier or later than scheduled.
Participants are requested to inform the pilot laboratory if delays to the Schedule have occurred or are likely to occur. If unforeseen circumstances prevent a laboratory from carrying out or completing measurements within the scheduled period, the pilot laboratory will, in most cases, request that the artefacts be sent to the next scheduled laboratory without delay. If time allows, the artefacts will be returned to the laboratory for the completion of measurements at a later date.
13.6 Dispatch of travelling standard On completion of measurements each participant is requested to ship the travelling standard to the next scheduled laboratory.
Repack the artefact and all accompanying items in the transport case. Please check that the contents are complete (refer to Packing List for list of contents). In particular, please ensure that the carnet travels with the artefact but do NOT pack the Carnet inside the transport case.
Addresses for dispatching the artefacts are given in the Participant List.
On dispatch of the travelling standard, notify both the pilot laboratory and the recipient laboratory using the Artefact Shipped Fax Form provided. Fax numbers for each participating laboratory are given in the Participant List.
14 Measurement of the capacitors
14.1 Preparation The artefacts should be unpacked and left to stabilise according to the instructions given in Section 13.4 “Receipt of travelling standard”.
39
14.2 Laboratory conditions Refer to the manufacturer’s specifications listed in Table 4.
14.3 Measurement voltage The measurement voltage must not exceed a peak value of 250 V.
The preferred measuring voltage for both capacitor is 100 V(rms).
An alternate measuring voltage for the 100 pF capacitor is 10 V(rms).
The manufacturer’s specification for the voltage coefficient of the capacitors is 0.003 μF/F/V(rms) at 1 kHz. Participants may choose to include this as a source of uncertainty if they use measuring voltages other than those listed above.
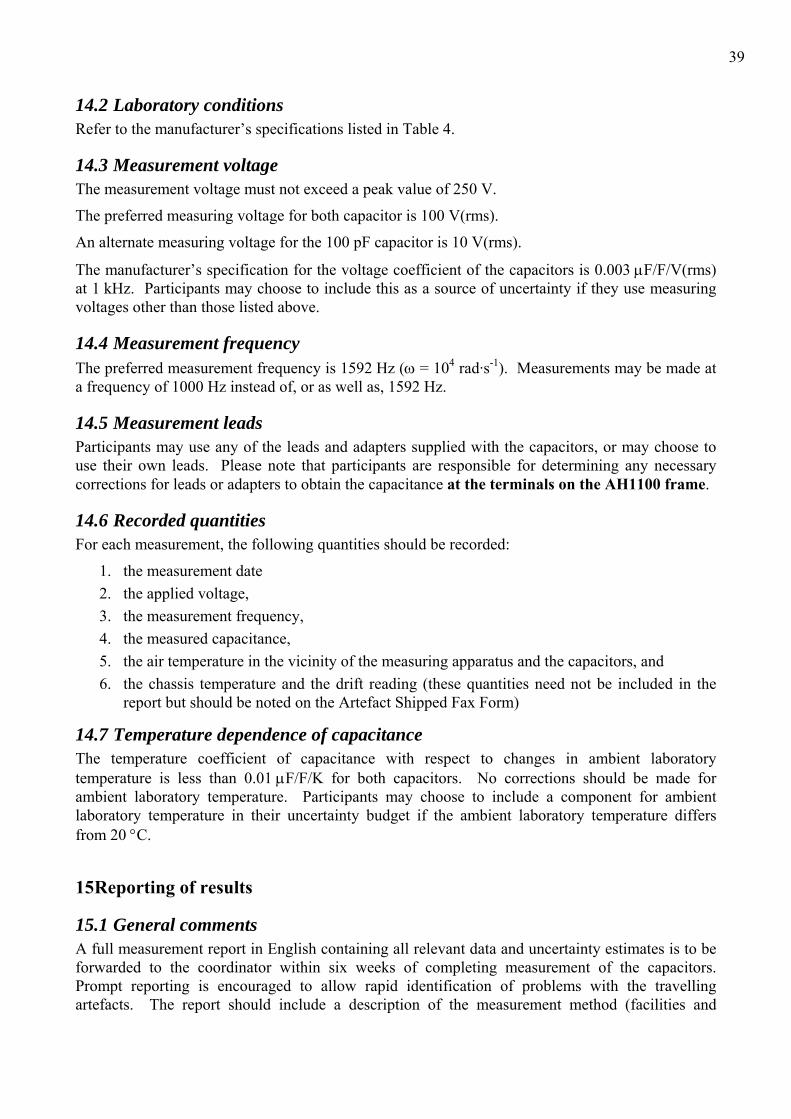
14.4 Measurement frequency The preferred measurement frequency is 1592 Hz (ω = 104 rad·s-1). Measurements may be made at a frequency of 1000 Hz instead of, or as well as, 1592 Hz.
14.5 Measurement leads Participants may use any of the leads and adapters supplied with the capacitors, or may choose to use their own leads. Please note that participants are responsible for determining any necessary corrections for leads or adapters to obtain the capacitance at the terminals on the AH1100 frame.
14.6 Recorded quantities For each measurement, the following quantities should be recorded:
1. the measurement date 2. the applied voltage, 3. the measurement frequency, 4. the measured capacitance, 5. the air temperature in the vicinity of the measuring apparatus and the capacitors, and 6. the chassis temperature and the drift reading (these quantities need not be included in the
report but should be noted on the Artefact Shipped Fax Form)
14.7 Temperature dependence of capacitance The temperature coefficient of capacitance with respect to changes in ambient laboratory temperature is less than 0.01 μF/F/K for both capacitors. No corrections should be made for ambient laboratory temperature. Participants may choose to include a component for ambient laboratory temperature in their uncertainty budget if the ambient laboratory temperature differs from 20 °C.
15 Reporting of results
15.1 General comments A full measurement report in English containing all relevant data and uncertainty estimates is to be forwarded to the coordinator within six weeks of completing measurement of the capacitors. Prompt reporting is encouraged to allow rapid identification of problems with the travelling artefacts. The report should include a description of the measurement method (facilities and
40
methodology), the traceability to the SI, and the results, associated uncertainty and number of degrees of freedom.
Participants are encouraged to submit their results using the Measurement Report Form. Participants may submit their results in the format of Calibration Certificates normally issued by their laboratory provided the all the required data are either included or attached.
15.2 Results The capacitance at the terminals on the AH1100 frame is to be reported for each capacitor.
The mean measurement date, the measurement frequency and the applied voltage must also be reported for each capacitor.
Details of any corrections that have been applied (for example, bridge corrections or leads corrections) must be given.
All results should be clearly identified with the serial number of the capacitor (refer to Table 3).
15.3 Uncertainty The uncertainly calculation should be carried out in accordance with the ISO “Guide to the expression of uncertainty in measurement”. All contributions to the uncertainty of measurement should be listed separately in the report and identified as either Type A or Type B uncertainties. The overall uncertainty, as calculated from the individual uncertainties, should be stated. Uncertainties are to be evaluated at the level of one standard uncertainty and the number of degrees of freedom are to be reported. The main uncertainty components are expected to be:
• Experimental standard uncertainty of the mean of n independent measurements (Type A) • Uncertainty in the primary standard or working standard against which the artefacts are
measured (Type B) • Uncertainty due to leads correction (Type B) Participants may need to consider the following additional sources of uncertainty, depending on their individual circumstances:
• Uncertainty due to ambient laboratory temperature differing from 20 °C (see Section 14.7) (Type B)
• Uncertainty due to measurement voltage differing from recommended level (see Section 14.3) (Type B)
• Uncertainty due to power line changes (refer to Table 4) (Type B) • Uncertainty due to frequency (Type B) Participants may need to include additional sources of uncertainty appropriate to their measurement system.
16 Notes If any laboratory feels that it would have difficulty meeting any of the above requirements, rather than withdraw from the comparison, it should discuss the problem with the coordinator so that satisfactory arrangements can be made. It is expected that amongst participating laboratories, uncertainties will cover a wide range (according to local requirements). This should not be seen as a deterrent to participating in the comparison.

41
17 Comparison costs Each participating laboratory is responsible for meeting the costs of its own measurements.
In addition, each participating laboratory is responsible for meeting all costs, and making all arrangements, relating to the transport of the travelling artefact from the time the artefact arrives in their country to the time the artefact arrives in the country of the next participating laboratory. Costs may include (but are not limited to) costs associated with the arrival in the country (eg. customs charges, quarantine fees, broker fees, carrier charges from the port of arrival to the participants laboratory) and costs associated with transporting the artefacts from the participant’s laboratory to the international port in the next scheduled country closest to the next participant’s laboratory. International carriage is to be by air.
42
18 Inquiries All inquiries or communications relating to the comparison should be addressed in the first instance to the comparison co-ordinator, Leigh Johnson.
18.1.1.1 Dr Leigh Johnson National Measurement Institute P. O. Box 218
18.1.1.1.1 Lindfield NSW 2070
18.1.1.2 AUSTRALIA
Telephone: + 61 2 8467 3529
18.1.1.3 Fax: + 61 2 8467 3610 E-mail: [email protected]
An alternative contact for urgent inquiries or communications relating to shipment:
18.1.1.4 Mrs Darien Northcote National Measurement Institute P. O. Box 218
18.1.1.4.1 Lindfield NSW 2070
18.1.1.5 AUSTRALIA
Telephone: + 61 2 8467 3574
18.1.1.6 Fax: + 61 2 8467 3719 E-mail: [email protected]
Further information and progress reports for the comparison will be available on the NML website at: http://www.measurement.gov.au/

43
Appendix II: Participants
M0 Contact Person: Dr Leigh Johnson
E-mail: [email protected]
Telephone Number: +61 2 8467 3529
NML, CSIRO
(AUSTRALIA) Fax Number: +61 2 8467 3610
Delivery Address: National Measurement Institute (NMI)
Bradfield Road
Lindfield
NSW 2070
AUSTRALIA
M1 Contact Person: Dr Yasuhiro Nakamura
E-mail: [email protected]
Telephone Number: +81 29 861 5659
NMIJ
(JAPAN) Fax Number: +81 29 861 3469
Delivery Address: National Metrology Institute of Japan (NMIJ/AIST)
AIST Tsukuba Central 2-2
1-1-1 Umezono
Tsukuba-shi
Ibaraki 305-8568
JAPAN
M2 Contact Person: Dr Rae Duk Lee
E-mail: [email protected]
Telephone Number: +82 42 868 5150
KRISS
(KOREA) Fax Number: +82 42 868 5018

44
Delivery Address: Korea Research Institute of Standards and Science (KRISS)
Division of Electromagnetic Metrology
P O Box 102
Yusong
Taejon 305-600
KOREA

45
M3 Contact Person: Jinni Lee
E-mail: [email protected]
Telephone Number: +65 6773 9823
SPRING
(SINGAPORE) Fax Number: +65 6773 9804
Delivery Address: Standards, Productivity and Innovation Board (SPRING Singapore)
1 Science Park Drive
118211
SINGAPORE
M4 Contact Person: Jimmy C Hsu
E-mail: [email protected]
Telephone Number: +886 3 574 3726
CMS
(CHINESE TAIPEI) Fax Number: +886 3 572 4952
Delivery Address: Center for Measurement Standards (CMS)
Industrial Technology Reasearch Institute
E200, BLDG 16
321 Kuang Fu Road, Section 2
Hsinchu 30042
CHINESE TAIPEI
M7 Contact Person: A K Saxena
E-mail: [email protected]
Telephone Number: +91 11 2574 26 10 or 11 or 12: Ext 2291, 2211, 2259
NPL
(INDIA) Fax Number: +91 11 2572 6938 or 91 11 2572 6952
Delivery Address: National Physical Laboratory (NPL)
Director
National Physical Laboratory
Dr K S Krishnan Rd
New Dehli 110012
INDIA

46

47
M8 Contact Person: Mrs Ajchara Charoensook
E-mail: [email protected]
Telephone Number: +66 2 248 2181
NIMT
(THAILAND) Fax Number: +66 2 248 4485
Delivery Address: National Institute of Metrology Thailand (NIMT)
Department of Electrical Metrology
Ministry of Science and Technology
75/7 Rama VI Road
Thungphayathai, Rajthevi
Bangkok 10400
THAILAND
M9 Contact Person: Mr Louis Marais
E-mail: [email protected]
Telephone Number: +27 12 841 3013
NML, CSIR
(SOUTH AFRICA) Fax Number: +27 12 841 4458
Delivery Address: National Metrology Laboratory (NML), CSIR
Build 5
CSIR, National Metrology Laboratory
Meiring Naude Rd
Brummeria
Pretoria
0001
SOUTH AFRICA
M11 Contact Person: Abdul Rashid Bin Zainal Abidin
E-mail: [email protected]
Telephone Number: +603 8778 1600
SIRIM
(MALAYSIA) Fax Number: +603 8778 1616

48
Delivery Address: Standards & Industrial Research Institute of Malaysia (SIRIM) Berhad
National Metrology Laboratory
SIRIM Berhad
PT Lot 4803
Bandar Baru Salak Tinggi
43900 Sepang
Selangor Darul Ehsan
MALAYSIA
M12 Contact Person: Mr Y K Yan
E-mail: [email protected]
Telephone Number: +852 2829 4855
SCL
(HONG KONG) Fax Number: +852 2824 1302
Delivery Address: Standards and Calibration Laboratory (SCL)
36/F., Immigration Tower
7 Gloucester Road
Wanchai
HONG KONG
M13 Contact Person: Mr R Hadi Sardjono
E-mail: [email protected]
Telephone Number: +62 21 756 0571
KIM-LIPI
(INDONESIA) Fax Number: +62 21 756 0568
Delivery Address: Puslitbang KIM-LIPI
Electrical Metrology Laboratory
Kompleks PUSPIPTEK
Serpong (15314)
Tangerang, BANTEN
INDONESIA
M14 Contact Person: Dr Laurie Christian
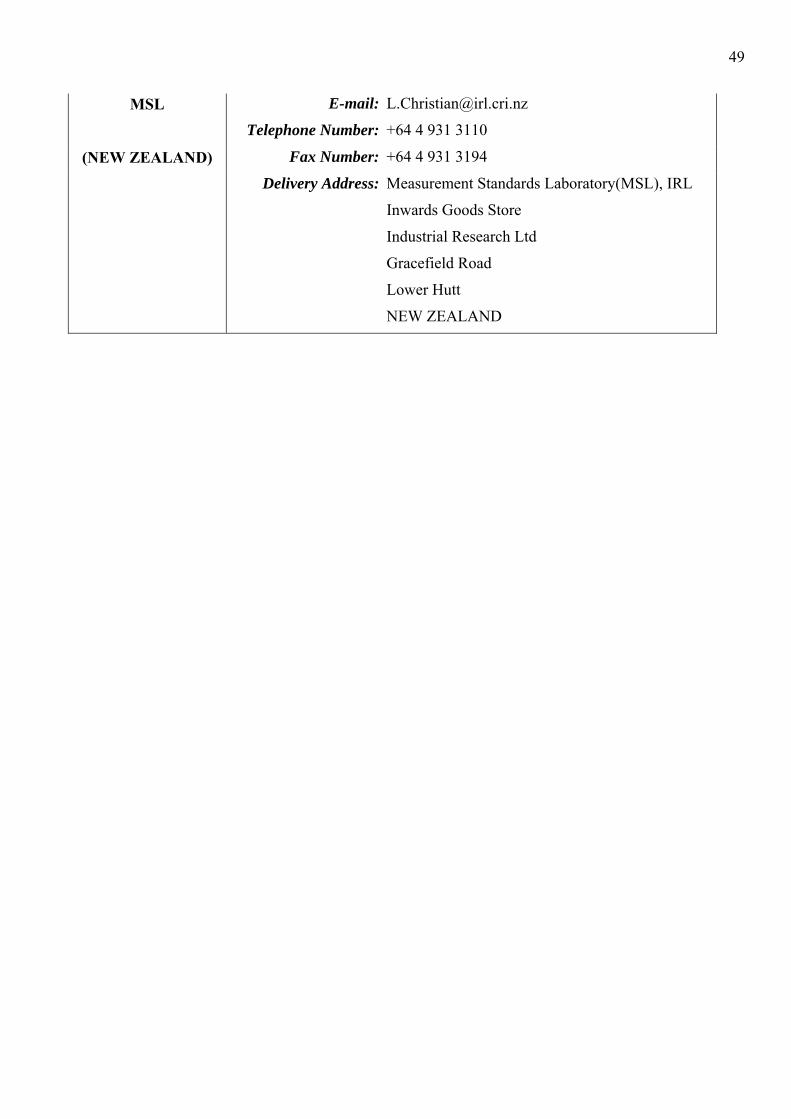
49
E-mail: [email protected]
Telephone Number: +64 4 931 3110 MSL
(NEW ZEALAND) Fax Number: +64 4 931 3194
Delivery Address: Measurement Standards Laboratory(MSL), IRL
Inwards Goods Store
Industrial Research Ltd
Gracefield Road
Lower Hutt
NEW ZEALAND

50
M16 Contact Person: Zhang Zhonghua
E-mail: [email protected]
Telephone Number: +86 10 6421 1631-3304
NIM
(CHINA) Fax Number: +86 10 6421 8629
Delivery Address: National Institute of Metrology (NIM)
No. 18 BeiSanHuan Dong Lu
Beijing 100013
CHINA
M18 Contact Person: Dr Yuri P Semenov
E-mail: [email protected]
Telephone Number: +7 801 323 9621
VNIIM
(RUSSIA FEDERATION) Fax Number: +7 812 316 1030
Delivery Address: D I Mendeleyev Institute for Metrology (VNIIM), Gosstandart of Russia
ATTN: V Dyskin
19 Moskovsky pr.
St. Petersburg
198005
RUSSIA FEDERATION

51
Appendix I: Schedule Measure-
ment Period
Laboratory Economy Receive Date Ship Date Report Date
M0 NMI Australia 12 January, 2004
M1 NMIJ Japan 19 January, 2004
09 February, 2004 22 March, 2004
M2 KRISS Korea 16 February, 2004 08 March, 2004 19 April, 2004
M3 PSB Singapore 15 March, 2004 05 April, 2004 17 May, 2004
M4 CMS/ITRI Chinese Taipei 12 April, 2004 03 May, 2004 14 June, 2004
M5 NMI Australia 10 May, 2004 31 May, 2004
M6 CPEM 2004: 27 June - 2 July
M7 NPL India 05 July, 2004 26 July, 2004 06 September, 2004
M8 NIMT Thailand 02 August, 2004 23 August, 2004 04 October, 2004
M9 NML, CSIR South Africa 30 August, 2004 20 September, 2004
01 November, 2004
M10 NMI Australia 27 September, 2004
18 October, 2004
M11 SIRIM Malaysia 25 October, 2004
15 November, 2004
27 December, 2004
M12 HKGSCL Hong Kong 22 November, 2004
13 December, 2004
24 January, 2005
M13 LIPI Indonesia 20 December, 2004
10 January, 2005
21 February, 2005
M14 IRL New Zealand 17 January, 2005
07 February, 2005 21 March, 2005
M15 NMI Australia 14 February, 2005 07 March, 2005
M16 NIM China 14 March, 2005 04 April, 2005 16 May, 2005
M17 Extra time for custom clearance to VNIIM
M18 VNIIM Russian Federation 09 May, 2005 30 May, 2005 11 July, 2005
M19 NMI Australia 06 June, 2005
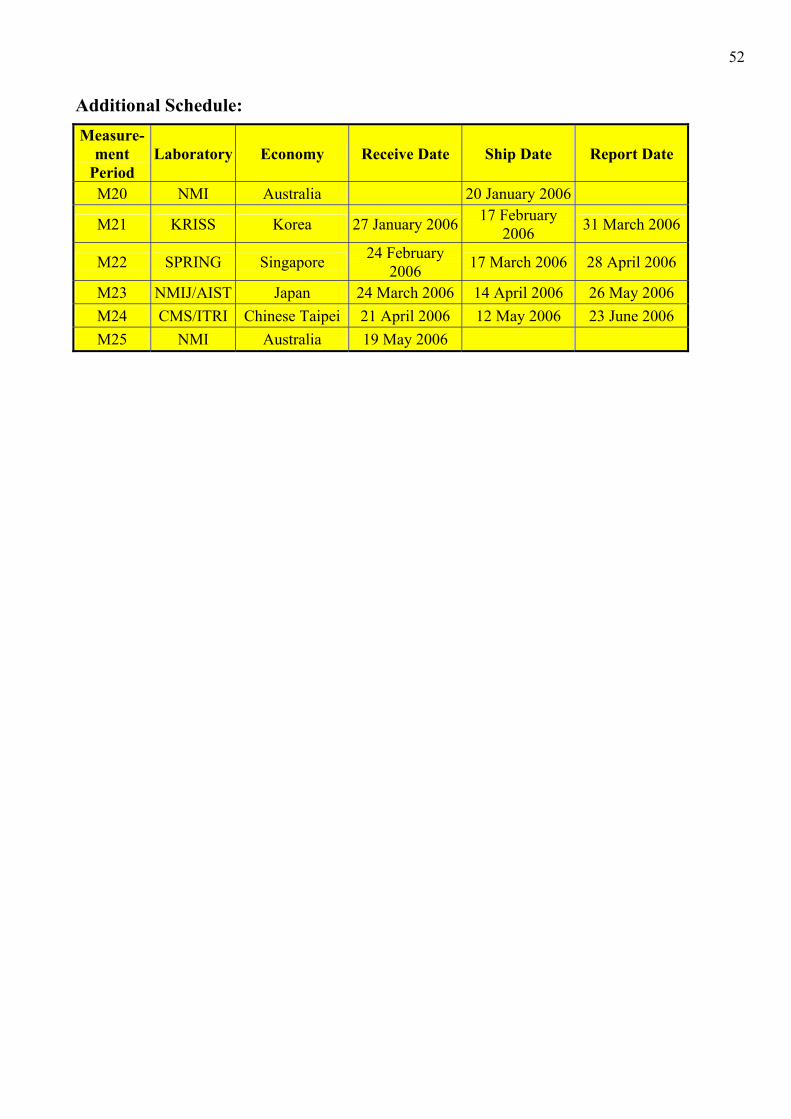
52
Additional Schedule: Measure-
ment Period
Laboratory Economy Receive Date Ship Date Report Date
M20 NMI Australia 20 January 2006
M21 KRISS Korea 27 January 2006 17 February 2006 31 March 2006
M22 SPRING Singapore 24 February 2006 17 March 2006 28 April 2006
M23 NMIJ/AIST Japan 24 March 2006 14 April 2006 26 May 2006 M24 CMS/ITRI Chinese Taipei 21 April 2006 12 May 2006 23 June 2006 M25 NMI Australia 19 May 2006


