Page 1
Analysis of Health Budgets with a Special Focus on RCH and MCH
components of National Health Mission in
Bihar and Rajasthan and Tamil Nadu
FINAL REPORT
December 2015
Submitted to
4, M N Krishna Rao Road
Basavanagudi
Bangalore 560004
Page 2
[This page has been deliberately left blank]
Page 3
Abbreviations
ASHA Accredited Social Health Activist
CAG Comptroller and Auditor General
CBR Crude Birth Rate
CHC Community Health Centre
DNHP Draft National Health Policy
GDP Gross Domestic Product
GSDP Gross State Domestic Product
IMR Infant Mortality Rate
MDG Millennium Development Goals
MMR Maternal Mortality Rate
NCMH National Commission on Macroeconomics and Health
NHM National Health Mission
NRHM National Rural Health Mission
NUHM National Urban Health Mission
PHC Primary Health Centre
PIP Program Implementation Plan
PMNCH Partnership for Maternal, Newborn and Child Health
RKS Rogi Kalyan Samithi
RMNCH Reproductive Maternal Newborn and Child Health
SC Sub Centre
SHS State Health Society
TFR Total Fertility Rate
VHSC Village Health and Sanitation Committee
Page 4
Acknowledgments
This Report has been prepared by Sri B V Madhusudhan Rao with inputs from Puja
Minni and R Thyagarajan under guidance from Sri Srinivas Alamuru.
The study team would like to thank Ms. Kavita Singh, Director (Finance) National
Health Mission, Ministry of Health and Family Welfare, Government of India for her
support in providing us with the data and connecting us with the State Health
Societies Bihar, Rajasthan and Tamil Nadu. We also like to thank Sri Tilak Raj Gauri,
Budget Officer, Government of Bihar who helped us in getting data from state health
department and state health society. We would like to place on record our sincere
thanks to Smt Amita Sharma, Joint Director, Office of Director treasuries, Rajasthan,
Sri Naveen Jain, Mission Director NHM, Government of Rajasthan and Sri Shambhu
Kallolikar, Mission Director, Government of Tamil Nadu and as well as the officers
in the State Health Societies who provided us with the data and relevant information.
We thank Save the Children for funding CBPS to conduct this study.
Page 5
Table of Contents
1. Introduction ............................................................................................................ 1
1.1 Rationale for investment on maternal and child health ................................... 1
1.2 Public expenditure on health in India .............................................................. 2
1.3 Brief historical perspective of health policy and health expenditure in India . 3
1.4 National Rural Health Mission ........................................................................ 3
2. Objectives, Scope and Methodology ..................................................................... 5
2.1 Objectives ........................................................................................................ 5
2.2 Scope ............................................................................................................... 5
2.3 Methodology ................................................................................................... 6
2.4 Assumptions, Limitations, etc. ........................................................................ 6
3. National Rural Health Mission – a brief overview ................................................ 7
3.1. National Rural Health Mission – a brief critique .............................................. 10
4. Profile of Sample States (Bihar, Rajasthan and Tamil Nadu) ............................. 14
4.1 Bihar ................................................................................................................... 14
4.2 Rajasthan ............................................................................................................ 16
4.3 Tamil Nadu ........................................................................................................ 17
5. Analysis and Findings .......................................................................................... 20
5.1 Comparative analysis of three sample states. ................................................ 20
5.2 Analysis of Health Expenditure of BIHAR................................................... 29
5.3 Analysis of Health expenditure of RAJASTHAN ........................................ 38
5.4 Analysis of Health Expenditure of TAMIL NADU ...................................... 48
6. Healthcare and Utilisation of Public Health Expenditure - Issues ....................... 57
7. Conclusion ........................................................................................................... 59
8. Recommendations ................................................................................................ 60
Bibliography ............................................................................................................ 64
Page 6
List of Tables
Table 1 : Fund flow under NHM (NRHM) Rs. in Crore ...................................................................... 8
Table 2: Demographic characteristics of sample states ...................................................................... 15
Table 3 Progress in Child Health Indicators (All India) .................................................................... 19
Table 4: Progress of Child Health Indicators among sample states .................................................... 19
Table 5: Average total expenditure 2010-11 to 2013-14 (Rs. in Crore) ............................................. 20
Table 6: Average Health Expenditure 2010-11 to 2013-14 (Rs. in Crore). ........................................ 20
Table 7: Average Health Expenditure (including NRHM) for 2010-11 to 2013-14 (Rs. in Crore) .... 21
Table 8: Average per capita Health Expenditure of Bihar, Rajasthan and Tamil Nadu (2010-11 to
2013-14) ............................................................................................................................... 23
Table 9: Share of GOI and State in average annual health expenditure (2010-11 to 2013-14) .......... 24
Table 10: Average Releases and Expenditure under NRHM for 2010-11 to 2013-14(Rs. in Crore).... 26
Table 11: Average component-wise expenditure of NRHM (SHS) (2010-11 to 2013-14) .................. 27
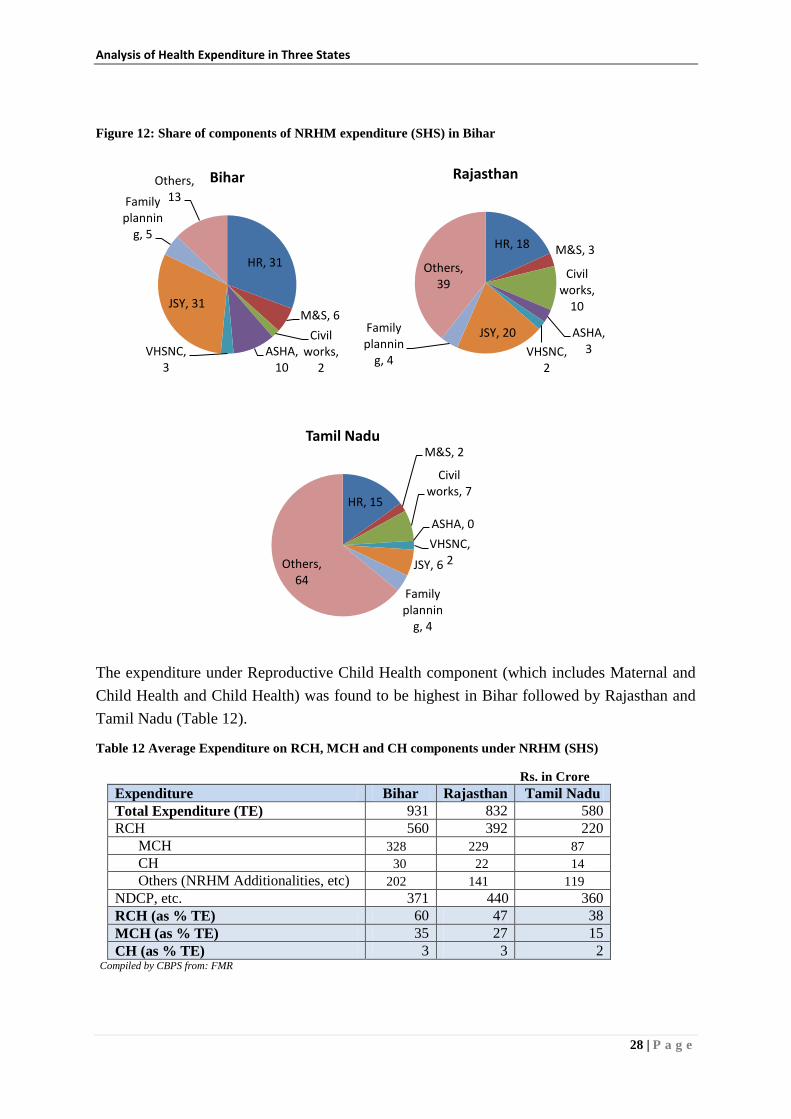
Table 12: Average Expenditure on RCH, MCH and CH components under NRHM (SHS) ................ 28
Table 13: Change in Health Expenditure over previous year ............................................................... 29
Table 14: Change in Health Expenditure (including NRHM) .............................................................. 30
Table 15: Change in state's own contribution to state health expenditure over previous year .............. 31
Table 16: State plan expenditure on health as a proportion of state health expenditure ....................... 32
Table 17: Primary, Secondary and Tertiary healthcare in Total Health Expenditure ........................... 33
Table 18: Capital health expenditure as percentage of total public health expenditure ........................ 34
Table 19: Per capita expenditure on medicine and drugs ..................................................................... 34
Table 20: Medicine and drugs expenditure as percent of total health expenditure ............................... 34
Table 21: Maintenance expenditure as percent of total health expenditure (revenue expenditure) ...... 34
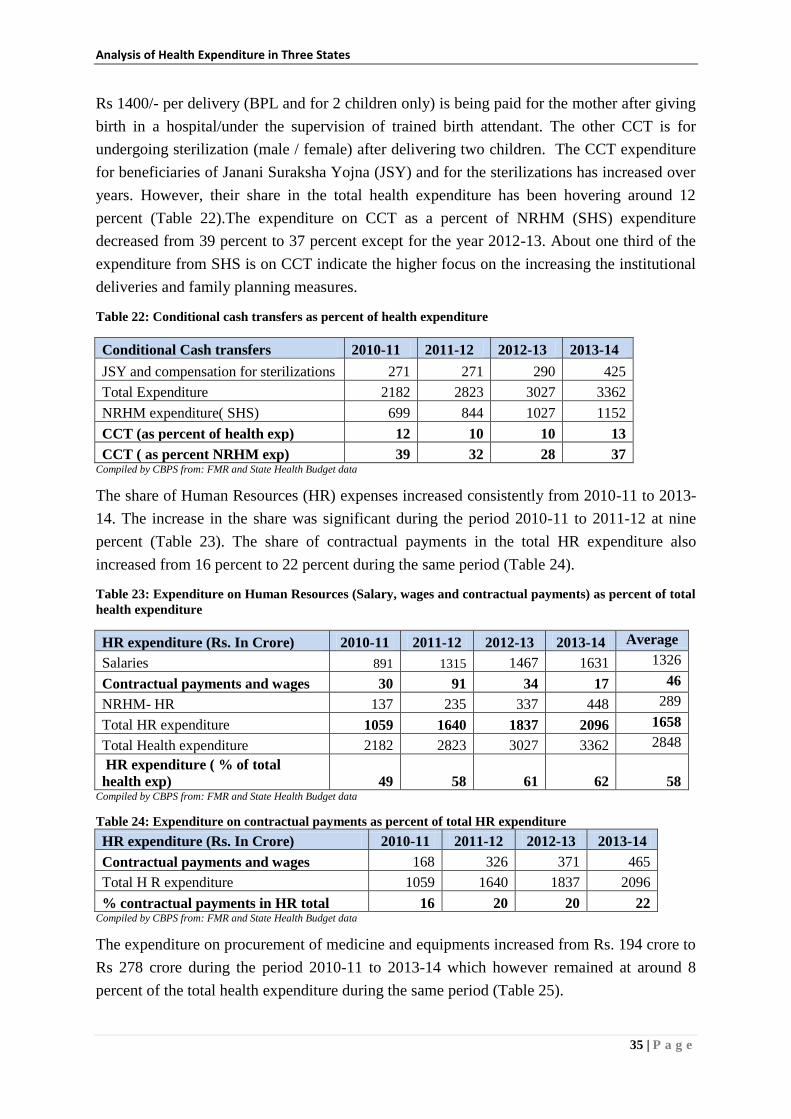
Table 22: Conditional cash transfers as percent of health expenditure ................................................... 35
Table 23: Expenditure on Human Resources (Salary, wages and contractual payments) as percent of
total health expenditure ........................................................................................................ 35
Table 24: Expenditure on contractual payments as percent of total HR expenditure ........................... 35
Table 25: Procurement expenses as percent of health expenditure ....................................................... 36
Table 26: Share of different components of NRHM expenditure (State Health Society) ..................... 36
Table 27 : Share of untied funds as percentage of NRHM expenditure ................................................. 36
Table 28: Trend Analysis of allocation, expenditure and under-expenditure (Rs. in Crore) ................ 36
Table 29: Trend analysis of allocation expenditure and under-expenditure (Rs. in crore) ................... 37
Table 30: State's own share in NRHM resource envelope (allocation) in percent ................................ 37
Table 31: Allocation and Expenditure of RCH, MCH and CH for 2010-11 to 2013-14(Rs. in lakh)... 37
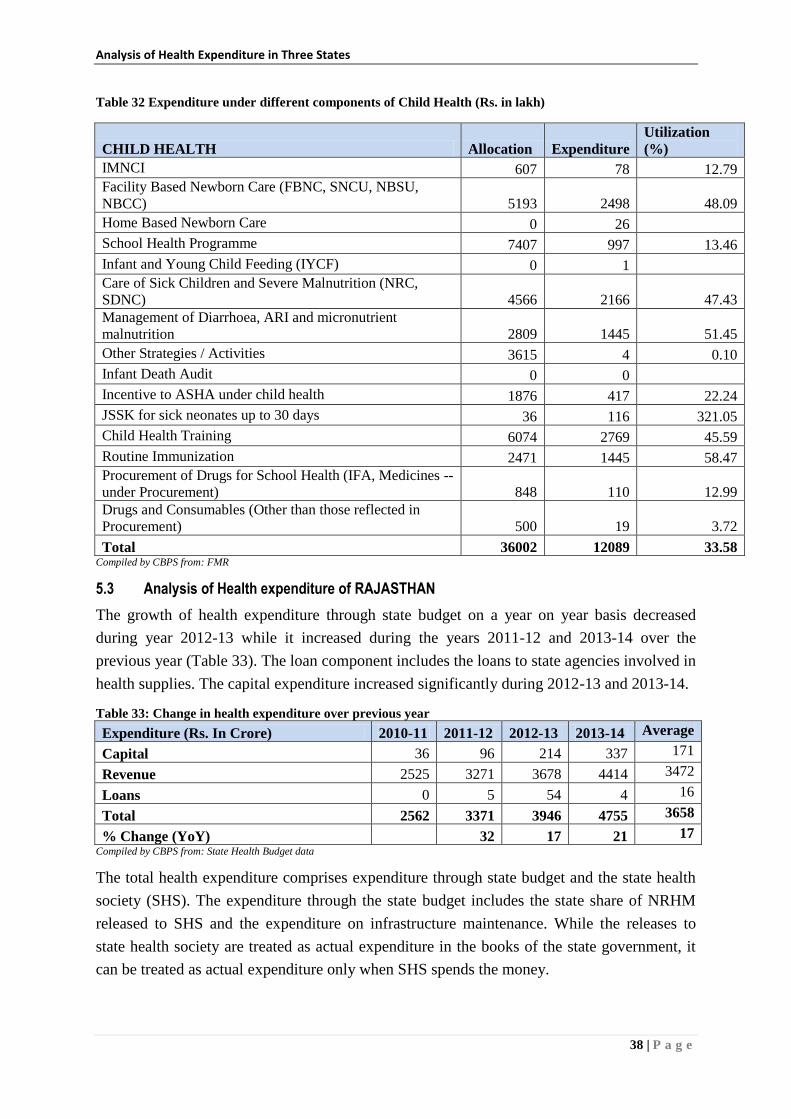
Table 32: Expenditure under different components of Child Health (Rs. in lakh) ............................... 38
Page 7
Table 33: Change in health expenditure over previous year ................................................................. 38
Table 34: Change in health expenditure over years including NRHM (in percent) .............................. 39
Table 35: Change in State's own contribution to state health expenditure over previous year (in
percent) ................................................................................................................................. 40
Table 36: State, percapita Government health expenditure .................................................................. 42
Table 37: Per capita health expenditure by state's own resources......................................................... 42
Table 38: State's plan expenditure on health as proportion of state health expenditure ........................ 42
Table 39: Change in state's plan expenditure on health (in percent) ..................................................... 42
Table 40: Primary, secondary and tertiary health care in total health expenditure ............................... 43
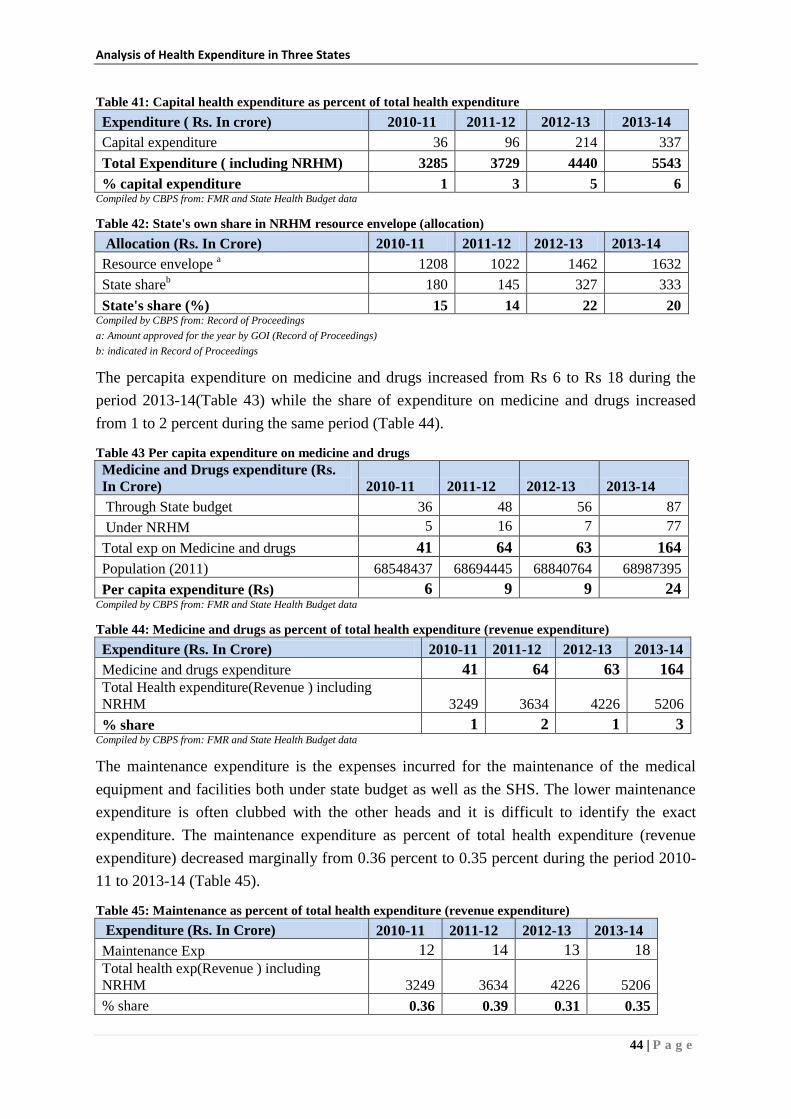
Table 41: Capital health expenditure as percent of total health expenditure ........................................ 44
Table 42: State's own share in NRHM resource envelope (allocation) ................................................. 44
Table 43: Per capita expenditure on medicine and drugs ..................................................................... 44
Table 44: Medicine and drugs as percent of total health expenditure (revenue expenditure) ............... 44
Table 45: Maintenance as percent of total health expenditure (revenue expenditure) .......................... 44
Table 46: Conditional cash transfers as percent of total health expenditure ......................................... 45
Table 47: Total expenditure on HR (salary, wages contractual payments) as percent of total health
expenditure ........................................................................................................................... 45
Table 48: Total expenditure on contractual payments as percent of total HR (salary, wages and
contractual payments) ........................................................................................................... 45
Table 49: Procurement (medicine and equipment) as percent of total health expenditure ................... 46
Table 50: Share of different components of NRHM expenditure (State Health Society) ..................... 46
Table 51: Expenditure on untied funds as percent of total NRHM expenditure (SHS) ........................ 46
Table 52: Trend analysis of allocation expenditure and under-expenditure (Rs. in crore) ................... 47
Table 53: Trend analysis of allocation, expenditure and under-expenditure (Rs. in crore) .................. 47
Table 54: Allocation and Expenditure of RCH, MCH and CH for 2010-11 to 2013-14(Rs. in lakh)... 47
Table 55: Expenditure under different components of Child Health (Rs. in lakh) ............................... 48
Table 56: Change in health expenditure over previous year ................................................................. 48
Table 57: Change in health expenditure over previous year including NRHM .................................... 49
Table 58: Change in State’s own contribution to health expenditure over previous year ..................... 50
Table 59: State’s per capita Govt. Health Expenditure ......................................................................... 51
Table 60: Per capita health expenditure by State’s own Resources ...................................................... 51
Table 61: State Plan Expenditure on Health as proportion on State Health Expenditure ..................... 52
Table 62: Change in State’s Plan Expenditure on Health (in percent) .................................................. 52
Table 63: Proportion of Primary, secondary and tertiary healthcare in total expenditure..................... 53
Table 64: Capital health expenditure as percentage of total public health expenditure ........................ 53
Page 8
Table 65: State’s own share in NRHM resource envelope (allocation) in percent ............................... 54
Table 66: Percapita expenditure on Medicines and Drugs .................................................................... 54
Table 67: Expenditure on medicines and drugs as percent of total health expenditure (revenue
expenditure) .......................................................................................................................... 54
Table 68: Maintenance as percentage of total health Expenditure (revenue expenditure) .................... 54
Table 69: Conditional Cash Transfers as percentage of total health Expenditure ................................ 55
Table 70: Total expenditure on HR (salary, wages, contractual payments) as percent of total health
expenditure ........................................................................................................................... 55
Table 71: Total expenditure on contractual payments as percentage of total HR (salary, wages,
contractual payments) ........................................................................................................... 55
Table 72: Procurement (equipment and medicines/drugs) as percentage of total health expenditure .. 55
Table 73: Share of different components of NRHM expenditure (State Health Society) ..................... 56
Table 74: Expenditure on untied funds as percent of total NRHM expenditure ................................... 56
Table 75: Trend analysis of allocation, expenditure and under-expenditure (State Budget) ................ 56
Table 76: Trend analysis of allocation, expenditure and under-expenditure (State Health Society) .... 56
List of Figures
Figure 1: Average Health Expenditure and its Share in 3 states ........................................................ 21
Figure 2: Average Health Expenditure (including NRHM) ............................................................... 21
Figure 3: Average Health Expenditure (State budget and incl SHS) as % of Total Expenditure ....... 22
Figure 4: Average Health Expenditure (State budget and including SHS) as a percent of GSDP ..... 22
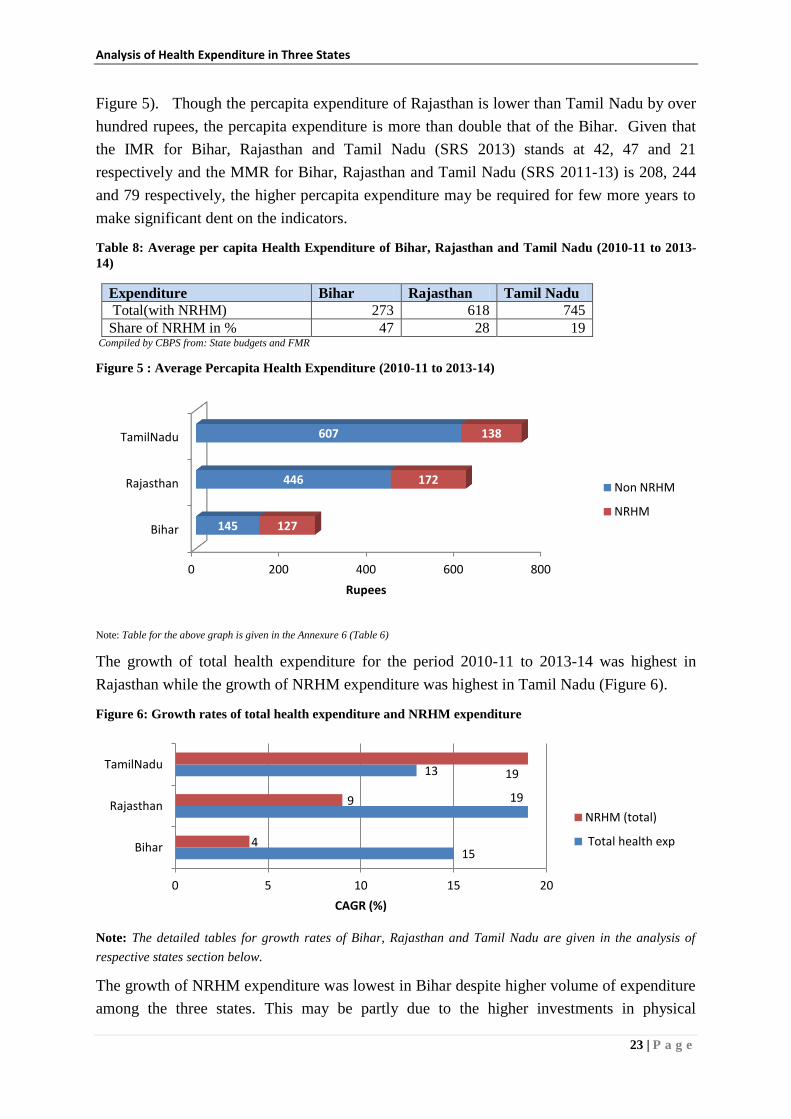
Figure 5 : Average Percapita Health Expenditure (2010-11 to 2013-14) ............................................ 23
Figure 6: Growth rates of total health expenditure and NRHM expenditure ..................................... 23
Figure 7: Share of Government of India and State in average health expenditure (2010 to 2014) .... 24
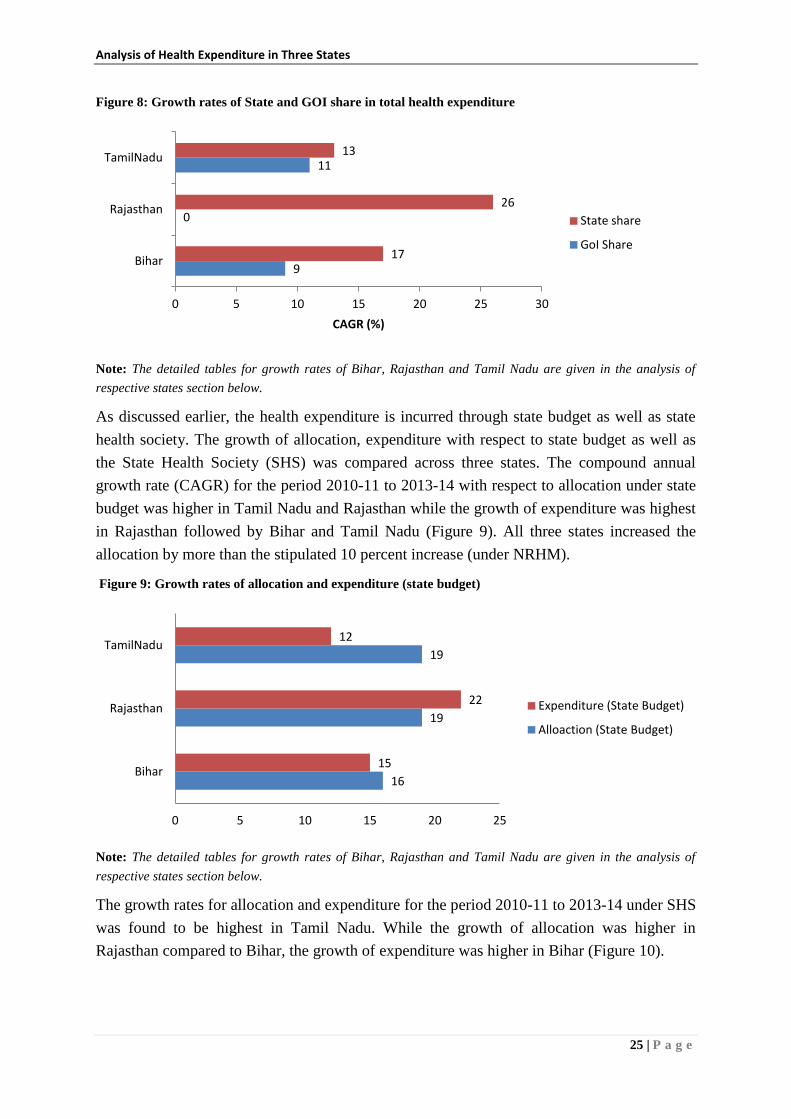
Figure 8: Growth rates of State and GOI share in total health expenditure ........................................ 25
Figure 9: Growth rates of allocation and expenditure (state budget) ................................................. 25
Figure 10: Growth rates of allocation and expenditure (State health society) ...................................... 26
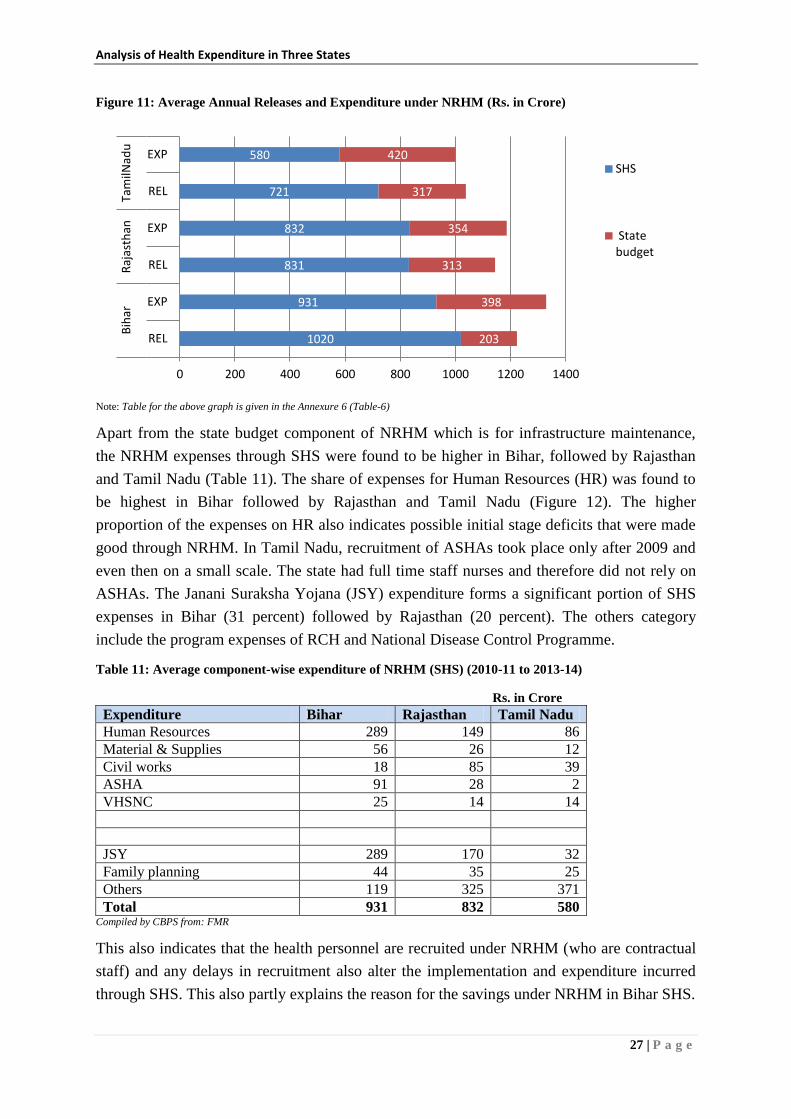
Figure 11: Average Annual Releases and Expenditure under NRHM (Rs. in Crore) .......................... 27
Figure 12: Share of components of NRHM expenditure (SHS) in Bihar ............................................. 28
Figure 13: Share of NRHM in total expenditure .................................................................................. 30
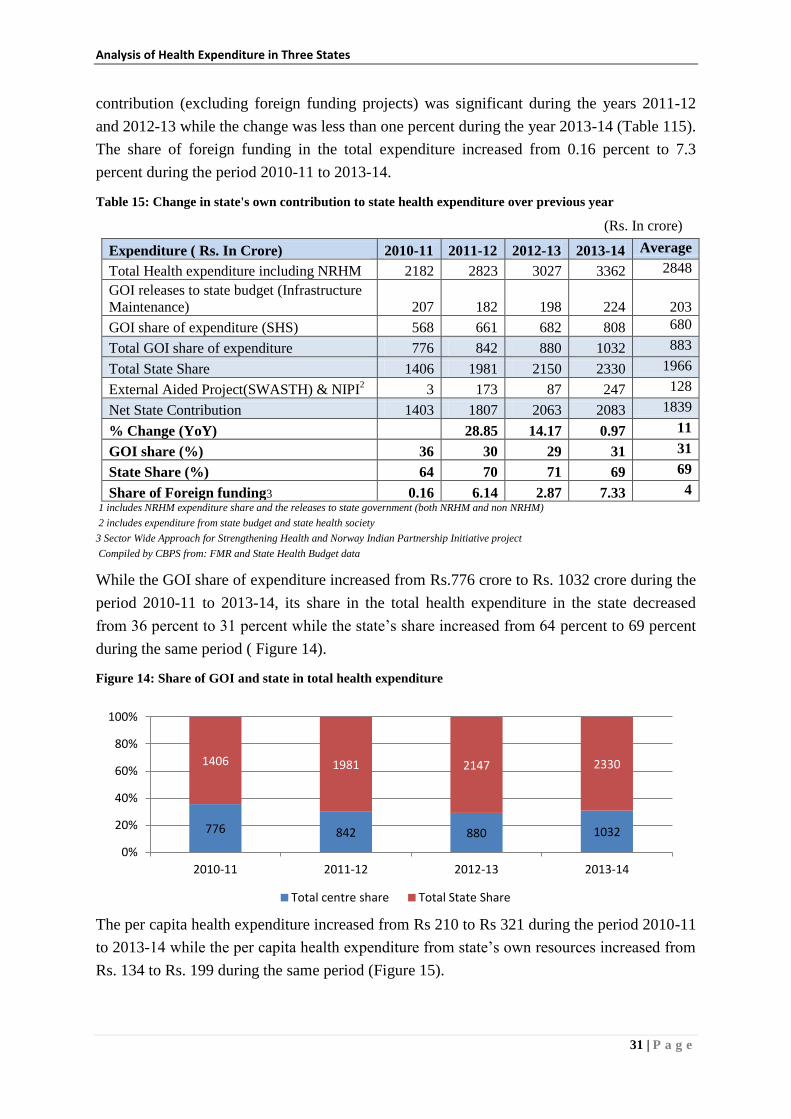
Figure 14: Share of GOI and state in total health expenditure ............................................................. 31
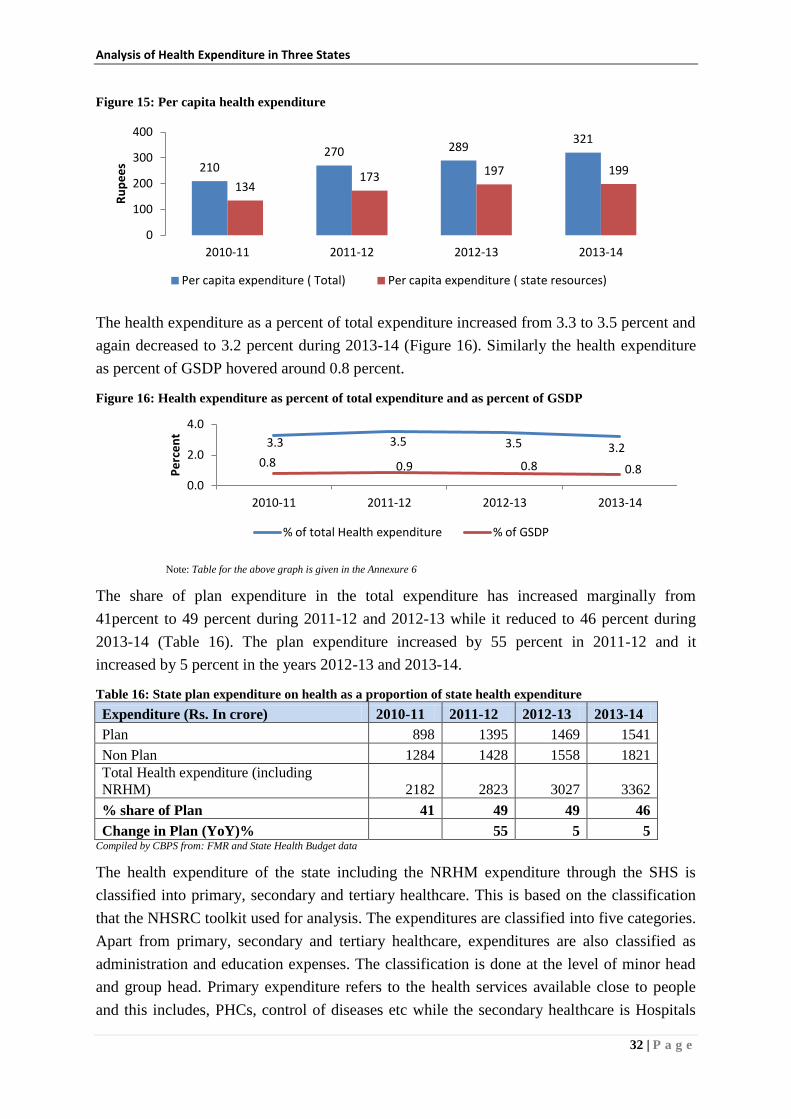
Figure 15: Per capita health expenditure .............................................................................................. 32
Figure 16: Health expenditure as percent of total expenditure and as percent of GSDP ...................... 32
Figure 17: Share of NRHM in total health expenditure ....................................................................... 40
Figure 18: Share of GOI and state in total health expenditure ............................................................. 41
Page 9
Figure 19: Health expenditure as percent of total health expenditure and as percent of GSDP ........... 41
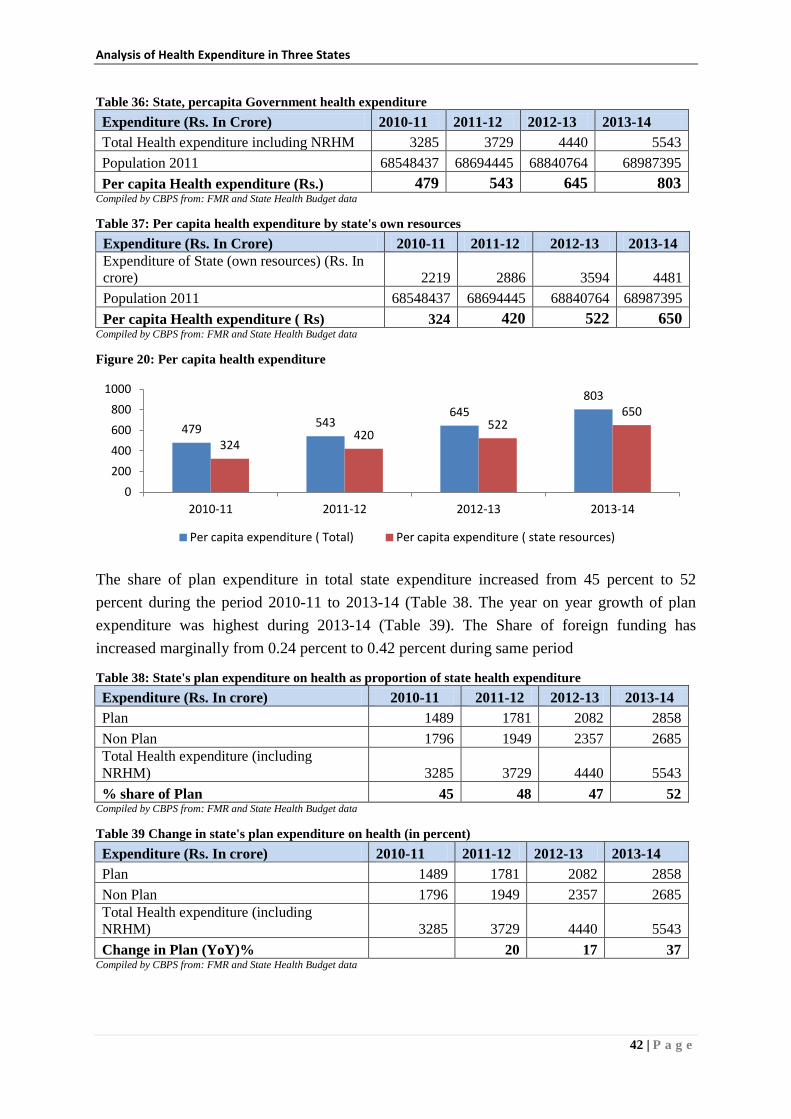
Figure 20: Per capita health expenditure .............................................................................................. 42
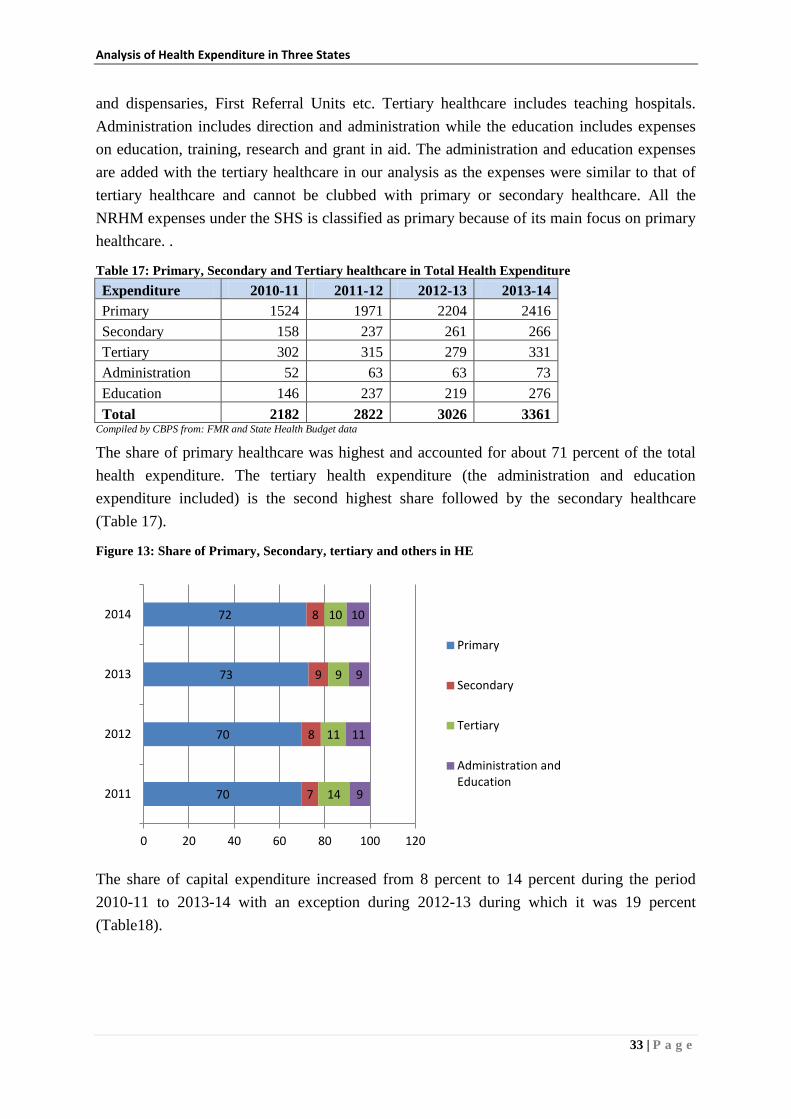
Figure 21: Share of Primary, Secondary and Tertiary healthcare in total expenditure ......................... 43
Figure 22: Share of NRHM in total health expenditure ....................................................................... 49
Figure 23: Share of GOI and state in total health expenditure ............................................................. 50
Figure 24: State health expenditure as percent of total state expenditure and as percent of GSDP ..... 51
Figure 25: Per capita health expenditure .............................................................................................. 52
Figure 26: Share of Primary, Secondary, tertiary and others in HE ..................................................... 53
Page 10
Executive Summary
The research has demonstrated that investment in early childhood care and education
is very critical and can fetch high returns of 7-10 percent per annum by way of better
outcomes in education, health, economic productivity and reduced crime. The World
Bank group, Governments of Canada, United States and Norway announced the
creation of Global Financing Facility (GFF) for supporting developing countries to
bring an end to preventable maternal and child deaths by 2030. Draft National Health
Policy 2015 (DNHP) highlights the country’s progress towards achievement of
MDGs, with Maternal Mortality Rate (MMR) and Under Five Mortality Rate (U5MR)
expected to reach 141 and 42 respectively by end of 2015.
The total health expenditure stands at 4.1 percent of GDP, while that of public health
expenditure is at 1.04 percent of GDP. Considering the National Commission on
Macroeconomics and Health (NCMH)’s observations and the need for achieving the
MDGs, Government of India launched the National Rural Health Mission (NRHM) in
2005 with an aim to increase the public expenditure to 2-3 percent of GDP by the end
of the year 2011-12 through an annual increase of 30 percent in budgetary outlays
every year. Though NRHM was not successful in increasing the public expenditure to
2-3 percent of GDP, it brought the much needed focus on the critical issues of the
health sector in the country. It was also successful in increasing the allocations of
state health budget every year by 10 percent.
The fiscal capacity of Tamil Nadu is more than that of Rajasthan and Bihar and,
therefore, it has the higher potential to fund health needs of the state. The higher fiscal
capacity and higher capital expenditure help improve efficiency of revenue
expenditure as well as the utilisation of funds from GOI. The average annual health
expenditure was highest in Tamil Nadu followed by Rajasthan and Bihar. The health
expenditure of Bihar was less than half of Tamil Nadu while the health expenditure
with NRHM funds was about 55 percent of health expenditure in Tamil Nadu. The
per capita expenditure was highest in Tamil Nadu followed by Rajasthan and Bihar.
The NRHM expenditure was highest in both absolute terms (Rs. 1328 crore) and its
share (47 percent) in total expenditure in Bihar, followed by Rajasthan and Tamil
Nadu. The share of NRHM decreased from 64 percent to 44 percent in Bihar, 36
percent to 26 percent in Rajasthan while it increased from 17 percent to 21 percent in
Tamil Nadu during the period 2010-11 to 2013-14.
The state share of expenditure on health in total health expenditure increased from 64
percent to 69 percent in Bihar, 68 percent to 81 percent in Rajasthan and 86-87
percent during the period 2010-11 to 2013-14. This indicates that the expenditure on
health by the state has increased significantly in Rajasthan while it had increased
marginally in Bihar. The share of HR expenses was highest in Rajasthan at 63 percent
Page 11
followed by Bihar at 58 percent and Tamil Nadu at 53 percent. The share of
contractual payments under HR expenditure was highest in Bihar at 20 percent
followed by Rajasthan (8 percent) and Tamil Nadu (4 percent). This also reflects upon
the availability of health personnel in terms of permanent staff.
The utilisation under RCH, MCH and CH was 74 percent, 85 percent and 56 percent
respectively in Rajasthan while it was 68 percent, 73 percent and 34 percent in Bihar
respectively. The lower utilizations under MCH and CH especially in Bihar highlight
the complementary nature of the program expenses which are dependent on the
availability of personnel and health facilities.
Public investments are critical and are the first step in improving healthcare system
especially in rural areas or where the concentration of poor population is higher. This
is critical to ensure the demand side financing (such as JSY) to work effectively.
Investments on infrastructure (physical and human), healthcare facilities and behavior
change communication are critical for the improvement in utilisation of healthcare
facilities especially by rural poor and marginalized sections. Improvement the fiscal
capacity of state can contribute significantly for the investment on healthcare given
the increased demand for healthcare created through NRHM.
_________________
Page 12
Analysis of Health Budgets with a Special Focus on RCH and MCH
components of National Health Mission in
Bihar and Rajasthan and Tamil Nadu
1. Introduction
1.1 Rationale for investment on maternal and child health
Investing in quality early childhood development from birth through age 5 will help prevent
achievement deficits and produces a 7 to 10 percent return, per child, per year’- Prof.
Heckman1.
While it is well recognized that the economic development would lead to better health
outcomes by way of improved access to nutrition, health, education, water and sanitation, the
impact of health on the economic development was not highlighted as much until the
Commission on Macroeconomics and Health (http://www.who.int/macrohealth/en/)
demonstrated that the causality runs in both directions and that ‘healthier is wealthier’.
Millennium Development Goals (MDGs) especially 4 (reducing child mortality) and
5(improving maternal health and achieving universal access to reproductive health) makes it
clear that health of women, mothers and children is essential for development.
An econometric study by Arshia Amiri and Ulf-G-Gerdtham (2013) on the impact of
maternal and child health on economic growth indicated that the causality between the GDP
and maternal and child health runs both ways. The effect of reductions in child mortality on
GDP was found to be higher among high income and upper middle income countries and
relatively lower among lower middle income countries and low income countries. The
differences in the impact are attributed to the difference in human capital and infrastructure.
Boston University School of Public Health in their study conducted (2013) for Partnership for
Maternal, Newborn and Child Health (PMNCH) analysed the benefits of investing on
maternal, newborn and child health. The returns on investment in maternal, newborn and
child health showed cost benefit ratios of 2.5-4.2 even with conservative assumptions and
shorter time frame of 5 years. The study concluded that investment in Reproductive Maternal
Newborn and Child Health (RMNCH) not only brings significant returns in economic terms
but also in terms of human capital development.
The researches by Prof. Heckman2 and his colleagues have demonstrated that investment in
early childhood care and education is very critical and can fetch high returns of 7-10 percent
per annum by way of better outcomes in education, health, economic productivity and
reduced crime. Heckman’s research also demonstrates that gap in ability and knowledge
between children denied of early childhood care and education and their peers with better
access begins much before kindergarten and persists for life time and is very difficult and
1 Nobel Laureate in Economics.
2 For more see www.heckmanequation.org
Page 13
Analysis of Health Expenditure in Three States
2 | P a g e
costlier to bridge. The long term health benefits due to early nutrition and health among
disadvantaged children include significantly lower risk of suffering from serious
cardiovascular and metabolic diseases.
The investment case (IC) launched by development partners in Asia-Pacific region to support
more equitable outcomes for MNCH indicated that in places (rural areas, poor and sparsely
populated areas) where there are few incentives for private service providers, public
investments in getting the public health care system right is the first step. Without such
investments, innovative strategies like demand side financing may not work effectively. In
such conditions enforcing the national policies also may not be appropriate.
The Partnership for Maternal, Newborn and Child Health (PMNCH) is clear about the need
of improving the health of women and children beyond MDG target date of 2015 by way of
mobilizing additional resources for the cause and by creating evidence for the same.
Estimation and demonstration of returns to society from the investment on health of women
and children therefore becomes critical to influence investment decisions especially of
parliamentarians, multilateral and bilateral donors, and global and regional development
banks.
In September 2014, the World Bank group, Governments of Canada, United States and
Norway announced the creation of Global Financing Facility (GFF) for supporting
developing countries to bring an end to preventable maternal and child deaths by 2030. The
GFF backed ‘Every woman, Every Child’ aims at supporting countries to mobilize domestic
and international resources to scale up and sustain RMNCH as the estimated investment
needs indicate an additional 5 USD percapita per year in high burden countries to end
preventable maternal and child deaths by 2030. About 4 billion USD is estimated to be
channeled for this purpose through International Development Association (IDA) including
the commitment of Norway and Canada of $600 million and $200 million respectively, for
developing countries by way of low interest loans and grants.
1.2 Public expenditure on health in India
India is committed towards achieving the Millennium Development Goals (MDGs) and
acknowledges the need to increase the public expenditure towards healthcare. The Draft
National Health Policy 2015 (DNHP) highlights the country’s progress towards achievement
of MDGs, with Maternal Mortality Rate (MMR) and Under Five Mortality Rate (U5MR)
expected to reach 141 and 42 respectively by 2015. The policy also points out that while the
achievements are noteworthy considering that MMR and U5MR were 47 percent and 40
percent above the international average, it could have been better. India, the third largest
economy (in terms of PPP) with potential to grow larger, is still facing huge gaps in health
outcomes despite having the required knowledge and technology to address the diverse
healthcare needs of its people. As DNHP sums up ‘The power of existing interventions is not
matched by the power of health systems to deliver them to those in greatest need, in a
comprehensive way and on an adequate scale’.
Page 14
Analysis of Health Expenditure in Three States
3 | P a g e
For providing the accessible and affordable healthcare in a comprehensive way, increasing
the expenditure on healthcare is very vital. As DNHP indicates, the total health expenditure
stands at 4.1 percent of GDP, while that of public health expenditure is at 1.04 percent of
GDP. The government expenditure on health constitutes less than 30 percent of the total
health expenditure in the country which is lower compared to other BRICS countries that
have the share of Government expenditure of more than 45 percent. The High Level Expert
Group constituted in 2010 by Planning Commission of India to develop a framework for
providing accessible and affordable healthcare to all Indians also recommended the increase
of the public expenditure (Union and State Governments together) on healthcare to 2.5
percent of GDP by the end of the 12th
plan and to at least 3 percent of GDP by the year 2022.
To understand the public expenditure on healthcare, its adequacy, efficiency in its totality,
understanding the role of Union and State Governments provides the useful framework to
analyze the commitment through policies and budgets. Constitution of India places health as
a subject of State Government with responsibility of public health and sanitation, hospitals
and dispensaries. The role of Union Government covers the subjects such as port quarantine,
marine hospitals, agencies of professional training and research. Subjects such as family
welfare, population control, medical education, prevention of food adulteration and quality
control in the manufacture of drugs are placed under concurrent list indicating the shared
responsibilities between Union and State Governments. The role of Union Government also
lies in defining guiding framework and broad policies for the health sector.
1.3 Brief historical perspective of health policy and health expenditure in India
The Bhore Committee report on ‘Health Survey and Development’ in 1946 was the first
attempt to prepare a comprehensive health policy in India. However, after independence,
focus was on large economic projects. In the fifties and sixties the focus of the health sector
was to manage epidemics like malaria, smallpox, tuberculosis, leprosy, trachoma and cholera.
The first National Health Policy (NHP) in 1983 focused on the expansion of reach by setting
target of one Primary Health Centre (PHC) for every 30000 population, and one Sub Centre
(SC) for every 5000 population, while the NHP of 2002 recognized the importance of health
systems architecture and recommended the need for convergence of all health programmes
under single administration as well as convergence of health inputs to achieve the health
goals. The National Commission on Macroeconomics and Health (NCMH) 2005 noted that
the public expenditure on health declined from 1.3 percent of GDP in 1990 to 0.9 percent of
GDP during 1999 and the declining trend continued till 2004-05. In terms of spending the
Union Government spent 15 percent while the State Governments spent 85 percent of the
public expenditure on health.
1.4 National Rural Health Mission
Considering NCMH observations and the need for achieving the MDGs, Government of
India launched the National Rural Health Mission (NRHM) in 2005 with an aim to increase
the public expenditure to 2-3 percent of GDP by the end of the year 2011-12 through an
Page 15
Analysis of Health Expenditure in Three States
4 | P a g e
annual increase of 30 percent in budgetary outlays every year. The NRHM implementation
was a multi pronged approach with focus on community involvement and decentralized local
planning with untied funds. The NRHM integrated all existing reproductive and child health
programs as well as national disease control programs under one broad umbrella. State
Governments were expected to increase the health care expenses by at least 10 percent every
year throughout the mission period (2005-12).
With the launch of National Urban Health Mission (NUHM) in January 2014 along with the
existing National Rural Health Mission (NRHM), under an apex programme National Health
Mission (NHM) the focus has just got widened in providing the health coverage, especially,
to the poor. The NHM aims to increase the public expenditure on health to 1.87 percent of
GDP by the end of 12th
plan 2017 March. State Governments are required to contribute 25
percent of the funds while the share is 10 percent for the north eastern states and special
category states. State Governments are required to commit a minimum of 10 percent annual
increase in the budgetary outlay to the health sector. The funding pattern for NRHM was
85:15(GoI: state) till 2011-12 and it changed to 75: 25 from 2012-13. National Urban Health
Mission (NUHM) with funding pattern of 75: 25 (GoI : State) except for 3 special category
states (J&K, HP and Uttarakhand where it is 90:10) and north eastern states aimed at
covering urban areas with an estimated cost of Rs 22,507 crore and project period till March
2017. All cities above the population of 50000 are covered under NUHM while the towns
with population less than 50000 are covered under NRHM.
The NHM has outlined its 11 point agenda which is identical to that of the Twelfth Five Year
Plan. Important among them are reducing the IMR and MMR to 25 and one per 1000 live
births respectively and also achieving the reduction of anemia among women aged 15-49
years. Focus is also on reducing the morbidity and mortality rates through communicable and
non communicable diseases. NHM has 6 components viz.
a. NRHM-RCH flexi pool
b. NUHM flexi pool
c. Flexible pool for communicable disease
d. Flexible pool for non communicable disease including injury and trauma
e. Infrastructure maintenance and
f. Family welfare central sector component
The NHM (RCH flexi pool) addresses the child health care comprehensively with recognition
of factors that result in infant and child mortality. The health of mother which cannot be dealt
separately from the child survival is well recognized. In 2013, the new Reproductive,
Maternal, Newborn, Child and Adolescent health strategic approach (RMNCH+A) was
started to introduce the concept of continuum care. This continuum approach starts during the
pregnancy period with the antenatal checkups, undertaking the precautions for risk
pregnancies, nutritional supplements for ensuring iron and folic acid levels, ensuring safe
delivery and continues with care for the newborn and attending to the special care
Page 16
Analysis of Health Expenditure in Three States
5 | P a g e
requirements of the newborn child, steps to avert malnutrition, respiratory infections and
immunization. Several schemes leading to cash and non cash transfers to beneficiaries,
incentivisation of personnel and upgrading the infrastructure are serially targeted to achieve
the objective of reducing the maternal and child mortality.
Under NHM, funds available as resource envelope is indicated by GoI and Programme
Implementation Plans (PIPs) are prepared by the states in a bottom up manner integrating the
plans from the lower level. The national programme coordination committee (NPCC)
approves the PIPs after review. The funds to state are released based on the PIPs,
commitment made by the state regarding the health sector allocations, and previous year’s
progress. Fund flows under NHM follow both the State treasury route and State Health
Society (SHS) route depending upon the components under it. Joint Review Missions and
Common Review Missions are put in place to review the progress of the state under NRHM.
Common review missions which has representatives from the Mission visit 10-15 states and
review the progress every year while the Joint Review mission visit 5-6 states and the review
is held jointly by the representatives of Union and State Governments.
2. Objectives, Scope and Methodology
2.1 Objectives
a. Analysis of NRHM, NUHM and NHM as a whole; the relevance and its specific focus in
the states of Bihar, Rajasthan and Tamil Nadu along with the health policies of these
States with special focus on Reproductive and Child Health (RCH) and Maternal and
Child Health (MCH) services.
b. Analysis of health budget as a whole, various components of health budget with a special
focus on maternal and child health related components of health budget in terms of
allocation, release and expenditure.
c. Analyse the health expenditure of the State in relation to contribution of GOI under NHM
towards health budget.
d. Analyse the norms of the healthcare with a focus on child care specified under NHM to
understand the budgetary requirements in the State and compare it with its expenditure to
identify the gaps in terms of health care investment.
e. Provide policy recommendations based on the analysis of policies and budget documents
to improve the healthcare under NHM with a special focus on childcare.
2.2 Scope
The study analyses public expenditure for the period of 2009-10 to 2013-14 of Bihar and
Rajasthan, which are among the 18 high focus states under NRHM, and Tamil Nadu.
Page 17
Analysis of Health Expenditure in Three States
6 | P a g e
2.3 Methodology
The analysis includes the study of budget documents (2010-11 to 2015-16), financial
management reports of the state health societies (SHS), and progress reports published by the
NRHM in the website. The reports of Comptroller and Auditor General (CAG) on state
finances are also referred to crosscheck the calculations arrived at using the budget
documents. The Program Implementation Plan (PIP) and Record of Proceedings (RoP) for
NRHM were also used for analysis. Review of various studies and evaluations related to the
implementation of NRHM was undertaken to understand different viewpoints and issues
relating to health expenditure and NRHM expenditure in particular. Visits to the three states
were undertaken to collect the data and to understand the flow of funds to State Health
Societies (Details of field visits in Annexure 1).
2.4 Assumptions, Limitations, etc.
a. Expenditure rather than budget taken for analysis. While the ToR refers to ‘budget’
in the list of broad indicators for analysis, we understand that it is the actual expenditure
that is meaningful to analysis of health expenditures. While term ‘budget’ usually refers
to the estimates, actual expenditure indicates the amount spent against the estimated
amount approved by the legislature. Allocations (budgeted) and expenditure are also
analysed to understand the utilisation.
b. What constitutes health expenditure? As per budgetary practice in the states as also in
the Union government, budget is presented to the legislature in groupings called ‘demand
for grants’. A grant typically covers one department and sometimes more than one
department in the same sector. For example, Grant number 10 (in Karnataka) covers
budget for Social Welfare, which may cover more than one department viz. Women and
Child Welfare, Social Welfare, etc. Usually the budget for health and family welfare is
presented as a separate Demand for Grant. E.g. Demand No 19 in Tamil Nadu; Demand
No 20 in Bihar; and Demand No 26 - Rajasthan. However, this Demand for Grants for
health may also include expenditures which are related to but not exactly health
expenditure. To illustrate, the demand may include expenditure on water and sanitation
(Major Head – 2215), overhead expenditure like the salaries of staff of health Department
(M.H – 2251) and Social Security and Welfare (M.H 2235). On the other hand,
expenditure on health (Major Heads 2210, 2211, 4210, 4211, 6210 and 6211) may be
distributed across more than one Demand for Grants. For example, Capital outlay on
Medical and Public Health (MH 4210) may be included in Demand for Grants of Public
works department (as in Bihar and Tamil Nadu). Health expenditures may be split among
many Demands for Grant say 26, 30 and 51 as in the state of Rajasthan. However, for the
purpose of this study, health budget / expenditure is defined as the budget / expenditure
incurred under the following Major Heads:
2210 and 2211 - the revenue expenditures incurred under Medical and Public
Health and Family Welfare respectively;
Page 18
Analysis of Health Expenditure in Three States
7 | P a g e
4210 and 4211 indicate the capital expenditure in medical health and family
welfare; and
6210 and 6211 represent the loans given out by the state for health services to the
state owned entities such as medical supplies corporation etc.
This definition of health expenditure is in line with the tool kit developed for National
Health Accounts by National Health Systems Resource Centre (NHSRC). The
classification of expenditures into primary, secondary and tertiary healthcare is also based
on the same toolkit. The expenditures related to health such as secretariat services for
social services (Major Head 2251) and social security and welfare (Major Head 2235- one
or two minor heads under it) which are health related expenditures are not taken into
consideration in order to enable comparison across the states.
c. Health expenditure includes the expenditure incurred by the State Health Society
(SHS). The funds for SHS come in two routes.
The GoI funds (under NRHM/NHM) are transferred to SHS and come directly to SHS
outside of the state budget.
The State share NRHM/NHM released to SHS and is indicated in the State budget
While releases to State Health Society are booked as expenditures at the state level. The
actual expenditures at the SHS occur with the funds from both GOI and state. The actual
expenditures at SHS do not provide the breakup of use of GOI and state funds. Thus the
expenditure of the State Health Society (SHS) is split into two (GOI and State) in the ratio
of the releases (GOI and state) to the society. Similarly the expenditure on infrastructure
maintenance incurred through state budget for which GOI contributes was not clearly
available from the state budgets. The expenditure on infrastructure maintenance was
taken from the NRHM progress reports (which coincided for all years in respect of
Rajasthan, 2 years in respect of Bihar and 3 years in respect of Tamil Nadu).
d. The NUHM started in 2013-14 was officially flagged off only in January 2014. Thus the
analysis period 2010-11 to 2013-14 largely refers to NRHM and that is being used in
analysis and not NHM (NRHM + NUHM). Therefore, in this report, we have used the
term NRHM rather than NHM.
3. National Rural Health Mission – a brief overview
The National Rural Health Mission (NRHM) was launched on 12 April 2005 which aimed at
undertaking architectural correction comprising decentralization, communitization,
organizational reforms in health sector, inter-sectoral convergence, mainstreaming of
Ayurveda, Yunani, Unani, Sidha and Homeopathy (AYUSH), improvement in infrastructure,
induction of management and financial professional into healthcare management and delivery
system. The objective was to provide accessible, affordable and quality healthcare to rural
Page 19
Analysis of Health Expenditure in Three States
8 | P a g e
population throughout the country with a focus on vulnerable and underserved populations in
the country including women and children.
Specifically, NRHM involved the following:
a. Eighteen states with weak public health infrastructure and poor health indicators were
categorized as focus states.
b. The NRHM aimed at achieving an Infant Mortality Rate (IMR) of 30 per thousand live
births, Maternal Mortality Rate (MMR) of 100 per lakh live births, and a Total Fertility
Rate (TFR) of 2.1 by the year 2012. The other targets included providing the clean
drinking water to all by 2009, reducing malnutrition of children of 0-3 years of age by 50
percent, reducing the anemia among girls and women by 50 percent and improving the
sex ratio to 935 by 2011-12 and to 950 by 2016-17.
c. NRHM integrated the existed Reproductive and Child Health (RCH), Family Welfare
Programmes and National Programmes for control of diseases like Malaria, Filaria,
Encephalitis, Dengue, Kala-azar, Leprosy, Tuberculosis, Blindness, Iodine deficiency and
Polio into one programme applying a funnel approach to ensure channeling of funds to
State Health Society and District Health Society with an aim of making district as the unit
for planning and implementing all health and family welfare services in the district.
d. Increase public spending on healthcare from 0.9 percent to 2-3 percent of GDP during the
period 2005-2012.
e. Important strategies included
creation and upgrading of Sub Centres (SC), Primary Health Centre (PHC),
Community Health Centre (CHCs);
conditional cash transfer such as Janani Suraksha Yojna (JSY);
use of Accredited Social Health Activists (ASHAs) as frontline service providers; and
promote community participation / decentralisation through Village Health and
Sanitation Committee (VHSC), Rogi Kalyan Samithi (RKS) at PHCs, CHCs and
District Hospitals.
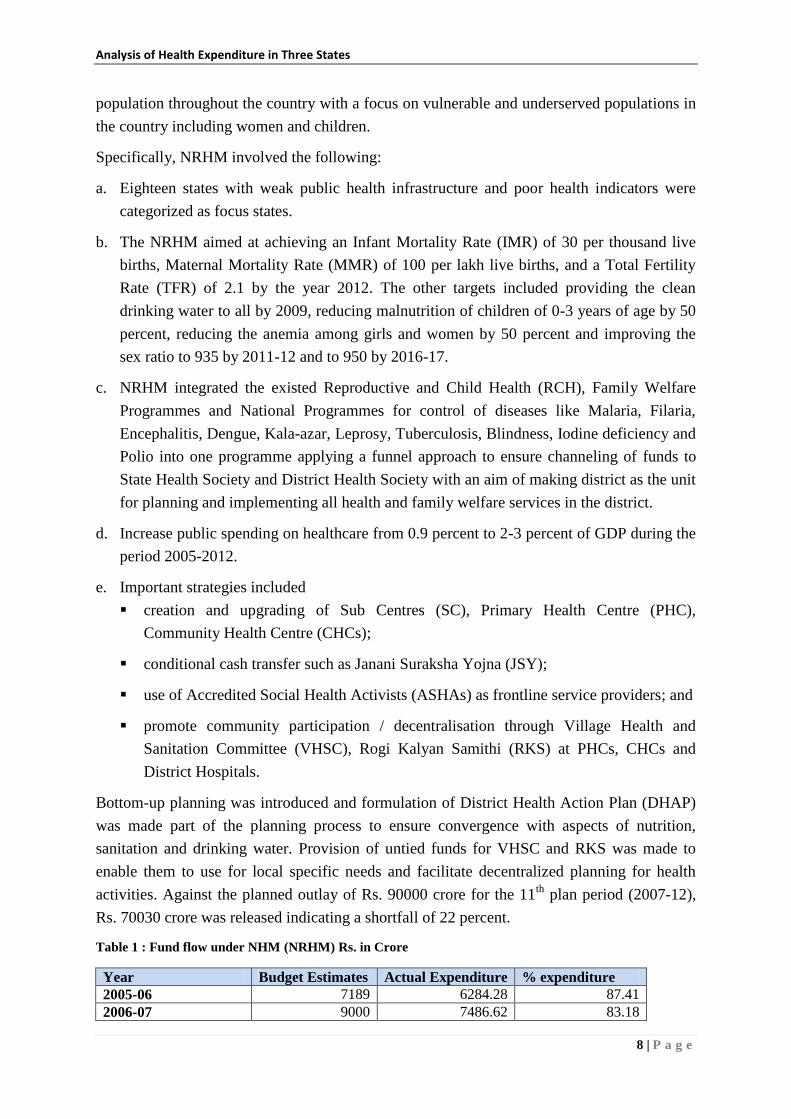
Bottom-up planning was introduced and formulation of District Health Action Plan (DHAP)
was made part of the planning process to ensure convergence with aspects of nutrition,
sanitation and drinking water. Provision of untied funds for VHSC and RKS was made to
enable them to use for local specific needs and facilitate decentralized planning for health
activities. Against the planned outlay of Rs. 90000 crore for the 11th
plan period (2007-12),
Rs. 70030 crore was released indicating a shortfall of 22 percent.
Table 1 : Fund flow under NHM (NRHM) Rs. in Crore
Year Budget Estimates Actual Expenditure % expenditure
2005-06 7189 6284.28 87.41
2006-07 9000 7486.62 83.18
Page 20
Analysis of Health Expenditure in Three States
9 | P a g e
2007-08 10890 10380.40 95.32
2008-09 11930 11239.23 94.21
2009-10 13930 13305.75 95.52
2010-11 15440 14696.42 95.18
2011-12 17840 16509.45 92.54
2012-13 20542 16762.76 81.60
2013-14 20999 18266.48 86.99
Total 127760 114931.40 89.96
Compiled by CBPS from: Public Accounts Committee (71st report) and CAG report
Among the important achievements, the MMR was reduced from 254 (SRS 2004-06) to 178
in 2012 in the country as a whole. States like Tamil Nadu and Kerala had achieved the target
of MMR less than 100. Even states like Bihar and rajasthan had reduced MMR significantly.
The IMR was 58 during 2005 and was 42 against the target of 25 (SRS
2012) for the year 2012.
Page 21
Analysis of Health Expenditure in Three States
10 | P a g e
TFR was reduced to 2.4 during 2011 while the target was 2.1.
With respect to infrastructure, NRHM aimed at strengthening public health delivery
system at all levels as per the IPHS standards. About 27400 new constructions have been
initiated since the beginning of NRHM of which 14880 have been completed as on December
2013. Around 29700 health facilities have been renovated and upgraded during the same
period. The number of First Referral Units (FRUs) increased from 940 in 2005 to 2653 in
2013-14. The number of 24X7 PHCs has increased from 1263 in 2005 to 2653 in 2013-14.
Augmentation of human resources (HR) is one of the key thrust areas under NRHM.
The total number of technical HR supported under NRHM increased to 1.49 lakh which
included 23079 doctors, 35172 staff nurses and 70891 ANMs. Programme management staffs
were also recruited. The number of ASHAs has increased to 8.9 lakh in 2013.ASHA have
been provided with Home Based Newborn Care (HBNC) kits and have been trained on
HBNC. ASHA have been given preference in ANM and GNM schools. The cost norms have
been increased from Rs 10000 to Rs 16000 per ASHA apart from revising several
performance based incentives.
Free supply of essential drugs, mobile medical units, ambulance services, increase in the
untied funds to RKS, VHSC is also being undertaken under NHM. By July 2011, of the 16.61
lakh total habitations, the number of habitations with 100 percent coverage in clean drinking
water facility reached to 70 percent while 2.6 lakh habitations had clean drinking water
coverage of 50-75 percent and about 0.7 lakh habitations had no drinking water facilities. The
malnutrition among children below three years continues to be at a higher rate of 40.4 percent
(NFHS 3) while the sex ratio had dropped from 927 to 914 at all India level.
3.1. National Rural Health Mission – a brief critique
The Draft National Health Policy 2015 noted that NRHM added over 9 lakh community
health workers (ASHA) and over 1.7 lakh skilled personnel in bringing improving public
health services to poor along with filling up critical infrastructure gaps. However, 80 percent
Page 22
Analysis of Health Expenditure in Three States
11 | P a g e
of the increased health services are provided by 20 percent of public facilities. DNHP also
noted that although NRHM envisaged strengthening of health systems for overall
improvement of public health facilities, it was largely confined only to achieve national
objectives of the scheme. Much of increase in facilities was related to Reproductive and
Child Health (RCH) and national disease control programmes and not to overall health
infrastructure. Social determinants of health were largely ignored in the process. The NRHM
expenditure in relation to the envisaged program outlay was found to be 40 percent. DHNP
noted that larger gaps in terms of infrastructure and human resources especially among the
focus states at the baseline level impacted fund utilisation as well as the impact on indicators.
States with better capacity in terms of human resources and infrastructure could absorb more
funds while the focus states had to develop capacity to utilize the funding. Building
infrastructure or human resources would require larger investment in a sustained manner be it
interms of medical and nursing colleges or health centres and recruitments which depends on
fiscal ability of the state.
Zakir Husain (2011) analysed the NRHM’s achievements against the stated objectives in 7
states of India which corroborated the results of evaluations done by Planning Commission
and Ministry of Health and Family Welfare, which had indicated that achievements in
quantitative goals and qualitative service were far from the envisaged outcomes. He
highlighted the point acknowledged by Ministry of Health and Family Welfare that although
NHRM was not successful in realizing of envisaged expenditure and outcomes, it did enough
to put public health on top of the government agenda and increased resources to health by
state governments (emphasis added). NRHM had significant impact in terms of increasing the
institutional deliveries, immunization and antenatal healthcare. In sum, given the diversity
and variation across Indian states in terms of political will, administrative ability and fiscal
capacities, NRHM’s envisaged plan of creating the essential workforce and infrastructure to
about 75 crore rural population in less than a decade (2005-2012- 7 years) seemed too
ambitious . In the process NRHM ignored the complexities across rural mass in terms of
gender disparities, caste and micro politics which proved to be a limitation.
CAG had conducted a performance audit of NRHM during the April to December 2008 in all
states except Goa and Nagaland and union territories. The performance of NRHM for the
period April 2005 to March 2008 was considered for audit purposes. The CAG Audit Report
noted that the District Health Society and District Health Mission were constituted in many of
the states. Baseline household surveys and facility surveys which were initial steps to
facilitate the District Health Action Plan (DHAP) were not conducted in many states
including Bihar and Rajasthan while it was conducted in Tamil Nadu. Facility survey was
conducted at the level of sub centre in Tamil Nadu. The perspective plans for the period
2005-12 were to be prepared at district and state level. Only seven states prepared it and
Bihar, Rajasthan and Tamil Nadu did not prepare the same. The Health Management
Information System (HMIS) which was supposed to be started by December 2005 did not
Page 23
Analysis of Health Expenditure in Three States
12 | P a g e
happen till October 2008. This resulted in poor reporting and monitoring and linking of fund
utilisation with performance was delayed. Absence of baseline surveys, perspective plans
which were envisaged to feed into Programme Implementation Plans (PIPs) rendered PIPs
less effective.
NRHM grants were supposed to be allocated across the states based on a comprehensive
index developed using population, disease burden, health indicators and state of health
infrastructure. However, no such index was evolved and grants were released based only on
population as criteria. States with poor health indicators and poor health infrastructure
received less as compared to states with better health indicators and better infrastructure. This
was largely due to the lower absorption capacities of these states which resulted in low
utilisation rates while better states could spend the allotted amount and seek additional funds.
Bihar was estimated to have lost Rs. 548 crore during the period 2005-08 while Tamil Nadu
had got excess funding of Rs. 156 crore during the same period.
District was envisaged as the basic unit for all purposes of NRHM. Surveys, Integrated
District Health Action Plans (IDHAP) and perspective plans of district were supposed to
guide the formation of PIPs and subsequent implementation. Ministry of Health and Family
Welfare had indicated that state and district level targets cannot be laid out centrally under
NRHM and that the baseline and perspective plans of district and state would describe the
pathway of targets and outcomes which would be more realistic one.
Under Janani Suraksha Yojna the delays in paying the beneficiaries were found to the tune of
8 days to 730 days across states. The delay in payments coupled by irregularities in payment
resulted in denial of benefits to eligible beneficiaries. In Bihar, 298 sample beneficiaries from
14 PHCs were found to have been paid the incentives two to five times the required amount.
Records of JSY cards were not available at PHCs. It was also observed that prescribed
meetings of ANMs and ASHA for efficient JSY implementation were not conducted at
PHCs.
Family planning schemes were concentrating only on female sterilization while the focus on
spacing and delaying age of marriage for females were very less. The untied grants for sub
centre, PHC and CHC were found to be underutilized owing to lack of absorptive capacities;
about Rs. 132 crore in 8 states it was diverted to other purposes like buying furniture,
equipment, stationery etc.
There were wide discrepancies between the funds released by ministry and funds received by
State Health Societies which was largely due to the release of funds during the month of
March from the ministry which was accounted as funds for the current year (letter of release)
while the receipt of the funds to SHS would be in April which would reflect for the receipt in
the coming year. Similar situation was observed in fund transfer between SHS and DHS. This
release of funds in March reflected the poor financial management while NRHM envisaged
the second tranche release in October/ November. Several SHS funds and DHS funds were
Page 24
Analysis of Health Expenditure in Three States
13 | P a g e
not maintained in interest bearing accounts despite the stipulation of keeping funds in interest
bearing account. In Bihar SHS and DHS Bhojpur deposited Rs. 106 crore in current account
in 2007 and lost an interest of around Rs. 37 lakh. Proper accounting (double entry
accounting system) and bank reconciliation were found to be absent in most of the SHS and
DHS across states.
A comparative study of NRHM in Karnataka and Rajasthan indicated that the State’s
contribution to NRHM is being channeled through more than one head. In the state of
Rajasthan expenditure on state schemes similar to those of NRHM viz. insurance, referral
transport, CM’s fund for critical health expenditure, etc. was is being reported as the state
share of NRHM. It was found that state share was less than 15 percent if state schemes were
taken out (ambulance, insurance) in Rajasthan. (2008-09 to 2010-11). It was found that
untied funds were utilized for ineligible items of expenditure such as repairs and
maintenance, consumables and buying of fixtures (cots, chairs, stabilizers, etc). The low
expenditure under untied funds was due to lack of clarity in guidelines during the initial
period and lack of capacity and incentive to spend the discretionary funds. The utilisation was
highest during the month of March (32 percent).
The NRHM evaluation in 2011 found that ASHA was not recruited till date in Tamil Nadu.
Village Health Nurse performed activities similar to ASHA (more of RCH activities). The
evaluation also found that despite lower levels of doctors/specialists in position, diagnostic
facilities, emergency services, obstetric care, surgical interventions, sick child care on 24 hrs
basis and delivery care were found to be alright. All the PHCs were providing IPD and OPD
services, ANC and new born care services. Availability of electricity, drinking water and
medicines at PHCs was to the tune of 95-100 percent. VHSC were working satisfactorily
though their presence and working was not perceived by the GPs. ASHA/VHN was critical in
influencing the health care seeking behaviour among the people especially among pregnant
who seek obstetric care, immunization and family planning services. The ASHA also
influenced the importance of safe drinking water and sanitation at house level.
Evaluation of NRHM in states of Andhra Pradesh, Bihar, Rajasthan and Uttar Pradesh looked
into the utilisation of NRHM funds for the period 2005-06 and 2006-07. It was found that
unspent money was higher in Bihar (35.1 percent and 40.7 percent) and in Rajasthan (41.6
and 34.9) as compared to AP. Vacancies of nurse position at PHCs /CHCs were highest in
Bihar followed by Rajasthan; the same was true for doctors (OBG) at PHC and CHC level
(none in Bihar). Financial records for using of untied funds were available to extent of 50
percent in Rajasthan and 33 percent in Bihar. Average waiting time to see health personnel
was 136 minutes in Bihar while it was 21 minutes Rajasthan. The rate of satisfaction was
found to be 23 percent in Bihar and 39 percent in Rajasthan.
The report of working group on NRHM for 12th
Five Year Plan indicated that RKS and
VHSC were concentrating on the activities/utilisation of untied funds while the overall
objective of looking into health centre / public health at villages seemed to be absent. It was
Page 25
Analysis of Health Expenditure in Three States
14 | P a g e
also found that the states spent their share of 15 percent of NRHM cost and have made
contribution in this regard. Almost all the states had increased their health budgets by more
than 10 percent every year indicating the priority towards health. One of the issues related to
low level of absorption of funds below district level was due to allocation of funds on a per
facility basis and not according to utilisation of funds by facility.
NRHM was successful in drawing attention towards health sector in terms of investment by
forcing the states to allocate their share (15 percent till 2011-12 and 25 percent since 2012-
13). However, as various reviews indicate the difference in preparedness among the states in
terms of having health personnel and health infrastructure reflected in their absorption
capacities of NRHM funds from GoI. Absence of state level assessment and state specific
planning and assessment of growth trajectory resulted in comparison of progress in the health
indicators with that of the national level goals/averages.
Initiation of bottom up planning and district as unit for micro planning, implementation and
reporting was supposed to have benefitted the health sector in its entirety while the activity of
District Health Society largely confined to NRHM activities.
The working group for 12th
five year plan on NRHM observed that the expansion of
management systems, structures and institutions had not kept pace with the requirements and
fund flow and this had resulted in slowing down the pace of the programme. It was also
found that despite efforts to expand the human resources, efforts towards reforms in
recruitment, training and rationalized deployment keeping a long term framework in mind
was found to be lacking.
4. Profile of Sample States (Bihar, Rajasthan and Tamil Nadu)
4.1 Bihar
Bihar is the second largest state in terms of population has
an area of 94163 sq km. The population of Bihar according
to 2011 census was 10.4 crore with the population density
of 1106 per square km and 34 percent of households having
6-8 members. Agriculture forms the backbone of the
economy and about 34 percent of population is considered
to be below poverty line (2012 estimates). The literacy rate
is 63.82 percent which is lower than the All India average
of 72.99 percent. The female literacy in the state is 53.33
percent against all India average of 64.64 percent. The
Total Fertility Rate at 3.6 is highest in the country. The urbanization is lowest in the country
at 11.3 percent. The census 2011 shows that only 16.4 percent of the households have
electricity as the source of lighting against all India average of 67.2 percent. The state is in
the last position in the use of clean cooking fuel (LPG, electricity) and toilet facilities. (See
Table 2 and Annexure 2)
Page 26
Analysis of Health Expenditure in Three States
15 | P a g e
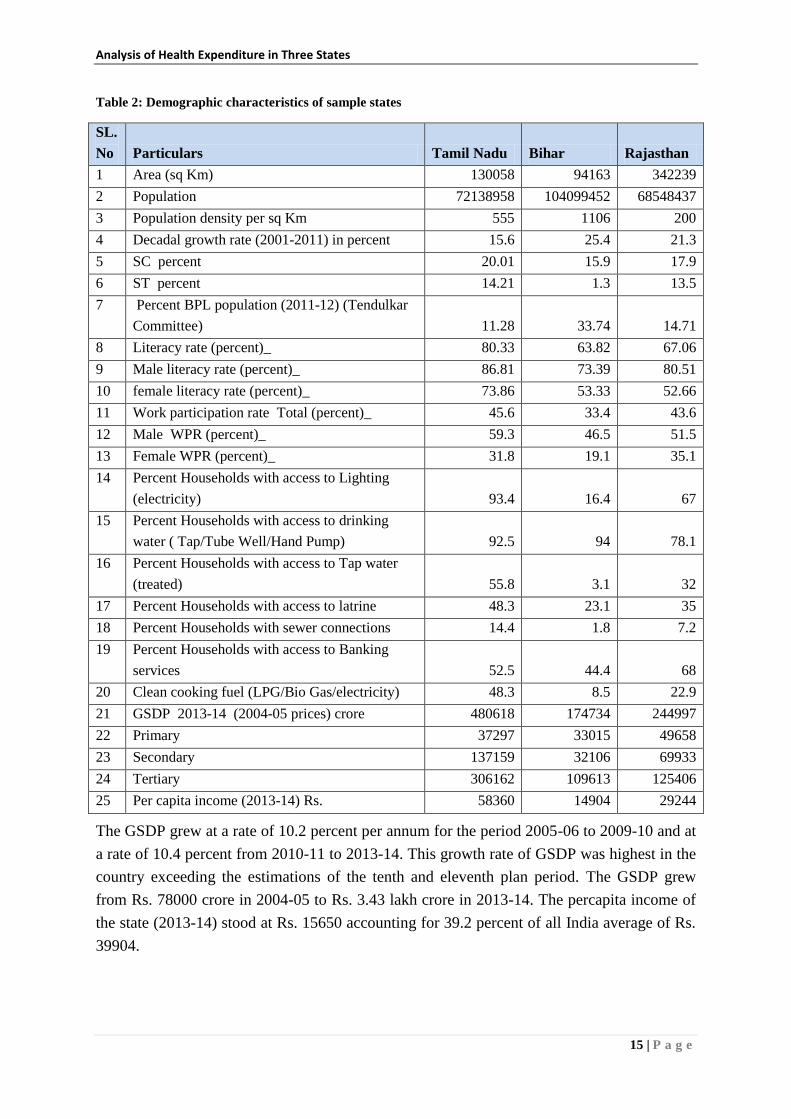
Table 2: Demographic characteristics of sample states
SL.
No Particulars Tamil Nadu Bihar Rajasthan
1 Area (sq Km) 130058 94163 342239
2 Population 72138958 104099452 68548437
3 Population density per sq Km 555 1106 200
4 Decadal growth rate (2001-2011) in percent 15.6 25.4 21.3
5 SC percent 20.01 15.9 17.9
6 ST percent 14.21 1.3 13.5
7 Percent BPL population (2011-12) (Tendulkar
Committee) 11.28 33.74 14.71
8 Literacy rate (percent)_ 80.33 63.82 67.06
9 Male literacy rate (percent)_ 86.81 73.39 80.51
10 female literacy rate (percent)_ 73.86 53.33 52.66
11 Work participation rate Total (percent)_ 45.6 33.4 43.6
12 Male WPR (percent)_ 59.3 46.5 51.5
13 Female WPR (percent)_ 31.8 19.1 35.1
14 Percent Households with access to Lighting
(electricity) 93.4 16.4 67
15 Percent Households with access to drinking
water ( Tap/Tube Well/Hand Pump) 92.5 94 78.1
16 Percent Households with access to Tap water
(treated) 55.8 3.1 32
17 Percent Households with access to latrine 48.3 23.1 35
18 Percent Households with sewer connections 14.4 1.8 7.2
19 Percent Households with access to Banking
services 52.5 44.4 68
20 Clean cooking fuel (LPG/Bio Gas/electricity) 48.3 8.5 22.9
21 GSDP 2013-14 (2004-05 prices) crore 480618 174734 244997
22 Primary 37297 33015 49658
23 Secondary 137159 32106 69933
24 Tertiary 306162 109613 125406
25 Per capita income (2013-14) Rs. 58360 14904 29244
The GSDP grew at a rate of 10.2 percent per annum for the period 2005-06 to 2009-10 and at
a rate of 10.4 percent from 2010-11 to 2013-14. This growth rate of GSDP was highest in the
country exceeding the estimations of the tenth and eleventh plan period. The GSDP grew
from Rs. 78000 crore in 2004-05 to Rs. 3.43 lakh crore in 2013-14. The percapita income of
the state (2013-14) stood at Rs. 15650 accounting for 39.2 percent of all India average of Rs.
39904.
Page 27
Analysis of Health Expenditure in Three States
16 | P a g e
Health Profile
The latest 8th
Common Review Mission of NRHM in 2014 indicates that number of PHCs,
Sub centres and CHCs in the state are inadequate. Against the norm of a sub centre for a
population of 5000, a sub centre serves 9464 persons. Similarly the population served by
PHC and CHC is 68200 and172750 against the norm of 30000 and 120000 persons
respectively. The utilisation of untied funds is low. The reporting, record maintenance and the
use of database are yet to be streamlined. Evaluations also indicate poor infrastructure, lack
of maintenance of infrastructure especially at PHCs, inadequate ancillary staff and shortage
of drugs. The Crude Birth Rate (CBR) declined from 31.9 in 2000 percent to 27.6 in 2013.
The percentage of institutional deliveries increased from 22.4 to 41.4 during the period 2006
to 2011. The building of health infrastructure was also taken up in a big manner under
NRHM. Bihar has 36 district hospitals, 70 referral hospitals, 533 PHCs and 9729 sub centres.
Bihar Medical Services and Infrastructure Corporation Limited (BMSICL) were established
to enable drug procurement and supplies to all public health institutions in the state.
Additionally, the corporation is also entrusted with building infrastructure (buildings) in the
state.
The Manav Vikas Mission 2013-17 has been initiated to undertake focused activities in social
sectors. Bihar has received recognition among Empowered Action Group (EAG) states/focus
states for its efforts in bringing down under 5 mortality rate and IMR, improvements in ANC
check up and institutional deliveries as well as increased utilisation of services by inpatients
and outpatients at health centres. Various UN agencies, international NGOs, have been
working in Bihar. Bill and Melinda Gates Foundation have been working in Bihar since 2010
with multi-sectoral funding to health and family welfare, water and sanitation sector. The
programme is named Ananya leading to specific approaches in the targeted 8 districts aimed
at reducing maternal and child mortality rates. DFID, European Commission, United Nations
Population Fund, United Nations Children’s Fund (UNICEF) and Norway India Partnership
Initiative (NIPI) are working on various issues related to health sector.
4.2 Rajasthan
This is the largest state in terms of area with 3.42 lakh sq km accounting for 10.42 percent of
total area of the country. The population of the state is 6.85 crore which amounts to 5.66
percent of total population of the country with a population density of 200 per sq km. The
urbanization is 24.87 percent in the state. The decadal growth of population was 21.3 percent
against the all India average of 17.7 percent. The sex ratio was 928 and is much less
compared to all India average of 943. About 14.71 percent of population lives below poverty
line (2012). Nearly 33 percent of households have 6-8 members in the family. The literacy
rate in the state is 67.06 percent which is below the all India average. While male literacy rate
is almost equal to national average, the female literacy rate is significantly lower than
national average by over 12 percentage points. The GSDP of the state was Rs. 2.44 lakh crore
in 2013-14 with a per capita income of Rs 29244.
Page 28
Analysis of Health Expenditure in Three States
17 | P a g e
The health scenario of the state is on a progressive path. The
state has 23 medical college hospitals, 34 district hospitals, 16
sub divisional hospitals, 376 CHCs, 1600 PHCs and 11500 sub
centres. The Rajasthan Health Systems project funded by World
Bank in 2004 (up to 2009) helped in strengthening of health
systems in the state. The state has made concerted efforts to
utilize the NRHM funds available to the state more effectively.
The state has formed the Rajasthan Medical Services
Corporation on the lines of Tamil Nadu Medical Supplies
Corporation. Supply of essential drugs for free and conducting
health tests for free (Nishulk Dava Yojna and Nishulk Jaanch Yojna for BPL/poor) have led
to significant improvement in the outpatients as well as inpatients in the public health centres
and is a significant move towards universal health care. The innovative efforts like using of
‘ASHAsoft’ for payments to ASHA for their services has resulted in the streamlining the
payments for ASHA. The MMR and IMR have reduced significantly during the period 2000-
2012. MMR reduced from 388 to 255 while the IMR has reduced from79 to 47 during the
same period.
4.3 Tamil Nadu
Tamil Nadu state is the southernmost part of the country
with an area of 1.3 lakh sq km and a population of 7.21
crore. It is the most urbanized state in the country with 48.5
percent of population living in urban areas. Tamil Nadu
state ranked 6th
among the states in Human Development
Index in the year 20113. The literacy rate is 80.33 percent
while that of the female literacy was 73.86 percent. About
12 percent of the population lives in BPL category. The
state has 93 percent of houses connected with electricity
against the national average of 67 percent. The share of
households using clean cooking fuel as well as having treated water connections is much
higher than the national average. The Gross State Domestic Product (GSDP) for the year
2013-14 was Rs 480618 crore (at constant prices 2004-05) with primary, secondary and
tertiary sectors contributing for 7.8 percent, 28.5 percent and 63.7 percent respectively. The
per capita income of the state was Rs. 58360 and occupied 4th
place in the country. The
GSDP growth rate for the eleventh five year plan period 2007-12 was 7.7 percent against the
target of 8.5 percent. Tamil Nadu state ranks first in the country in terms of industrial growth
and employment. The urbanization has augured well with the industrial growth of the state.
The state has a good road network of 2.4 lakh km (2014) of which 82 percent is surfaced.
3http://www.in.undp.org/content/dam/india/docs/inequality_adjusted_human_development_index_for_india
s_state1.pdf
Page 29
Analysis of Health Expenditure in Three States
18 | P a g e
Health Profile
The successive governments of Tamil Nadu have given importance to the healthcare,
nutrition and health facilities. It is the first state in India to enact Public Health Act 1939
which got amended in 1958 and 1970. The Danish International Development Agency
(DANIDA) supported health programmes for two decades from 1981 to 2003 and health
systems strengthening got importance with steps to improve human resource development,
drug supplies and Health Management Information Systems (HMIS). The Tamil Nadu
Medical Services Corporation (TNMSC) was established in 1994 to enable drug procurement
and supply to all public health institutions in the state became a success and this model is
being emulated by other states. Tamil Nadu embarked on strengthening of health systems in
comprehensive manner under The World Bank aided Tamil Nadu Health Systems Project
(TNHSP) in 2004. This specifically addressed the issues of utilisation of health services by
poor, disadvantaged and tribal groups apart from strengthening the monitoring and reporting
systems. All these concerted efforts resulted in significant drop in MMR and IMR. MMR
which was 450 in 1971 dropped to 111 in 2004. Similarly the IMR also dropped to 44 during
the same period. By the time NRHM was launched, the state of Tamil Nadu got a new
impetus to accelerate the health programmes that was already in place. The indicators like the
crude birth rate (CBR), Total Fertility Rate (TFR), MMR and IMR were lower than the all
India averages in Tamil Nadu even before the launch of NRHM. The institutional deliveries
increased from 76 percent in 2006 (All India 66.6 percent) to 92.4 percent in 2012 only
second to Kerala state (99.7 percent).
Along with the political will and conducive policies, Tamil Nadu had effects of social
movement led by E V Ramasamy Naicker4 which focused on moving away from
superstitions and dispelling ignorant practices. This had a significant effect on the
behavioural change and communication programmes of public health. This also focused on
encouraging women not to marry before the age of 22 years and exercise birth control
methods. Dr Muthulakshmi Reddy, who was the first woman admitted to Madras Medical
College, fought for gender equality and this had effects on abolishing the devadasi system. Dr
Muthulakshmi Reddy maternity benefit scheme provides financial assistance to BPL pregnant
woman to the tune of Rs. 12000 ( Rs 4000 for registration of pregnancy, Rs 4000 for getting
antenatal care and Rs 4000 for availing postnatal care) to meet nutrition expenses,
compensate for loss of income during delivery and to avoid low birth weight babies. An
amount of Rs. 450.16 crore was disbursed during 2013-14 to 6.64 lakh beneficiaries. Chief
Minister’s Comprehensive Health Insurance Scheme launched in 2012 provides insurance
coverage of Rs. 1 lakh (covering 1016 life saving procedures) to all families with annual
income of less than Rs. 72000. This has been very successful and 6.17 lakh persons benefited
with an expenditure of Rs. 617 crore till 2013-14. Tamil Nadu state with robust growing
4 Founded self respect movement in 1925 and Dravidar Kazhagam
Page 30
Analysis of Health Expenditure in Three States
19 | P a g e
economy has moved significantly from the issues of allocation and access to improvements in
quality of healthcare.
The Rapid survey of Children (RSOC) was conducted jointly by UNICEF and Ministry of
Women and Child Development in 2013-14 which provides a comparison after NFHS 3 in
2007-08. Dipa Sinha (2015) analysed the findings of the RSOC and the progress between the
period 2007-08 and 2013-14 across states. The overall picture indicate a very good progress
in terms of delivery care, proportion of births assisted by health professional and proportion
of births at medical facilities. The progress in terms of number of Ante Natal Care (ANC)
check-ups and Post Natal Care (PNC) check-ups by pregnant women and lactating mothers
however has shown smaller level of improvement (Table 3).
Table 3 Progress in Child Health Indicators (All India)
Indicators 2005-06 ( NFHS 3) 2013-14( RSOC)
More than 3 ANC visits (in percent) 52 63
Birth at medical facilities (in percent) 41 79
Birth assisted by health professional (in percent) 49 81
Full immunization coverage (in percent) 44 65
The progress in Bihar and Rajasthan is significant given their indicator levels in 2005-06.
Progress in proportion of children immunized as well as the health personnel assisted
deliveries is noteworthy (Table 4).
Table 4: Progress of Child Health Indicators among sample states
State Year Percent of
children who
survive to age 5
Percent of
children who
are fully
immunized
Percent of
children who
are not
underweight
Percent of
deliveries
assisted by
health
personnel
Bihar 2005-06 91.5 32.8 44.1 29.3
2013-14 94.6 60.4 61.5 68.4
Change 3.39 84.15 39.46 133.45
Rajasthan 2005-06 91.5 26.5 60.1 41
2013-14 94.3 60.7 68.5 85.8
Change 3.06 129.06 13.98 109.27
Tamil Nadu 2005-06 96.4 80.9 70.2 90.6
2013-14 97.7 76.3 76.7 99.5
Change 1.35 -5.69 9.26 9.82
All India 2005-06 92.6 43.5 57.5 46.6
2013-14 95.1 81.1 70.6 81.1
Change 2.70 86.44 22.78 74.03
Page 31
Analysis of Health Expenditure in Three States
20 | P a g e
5. Analysis and Findings
The analysis of health budgets is presented in two sections. Section one outline major
findings of the study and provides a comparative picture of the three sample states while the
second section would provide the detailed analysis of health budgets of individual states
Bihar, Rajasthan and Tamil Nadu in a sequence.
5.1 Comparative analysis of three sample states.
Among the three states, Tamil Nadu’s average annual expenditure (2010-11 to 2013-14) both
in capital and revenue expenditure is the biggest and also significantly higher than that of
Bihar and Rajasthan (Table 5). The capital expenditure of Bihar is higher than Rajasthan
while the total expenditure is lowest among three states. The size of expenditure also
represents the size of the economy and government machinery. The higher expenditure
indicates the higher fiscal capacity of the state government. The detailed table (for 4 years) is
presented in Annexure 6.
Table 5: Average total expenditure 2010-11 to 2013-14 (Rs. in Crore)
Expenditure Bihar Rajasthan Tamil Nadu
Capital 14710 10328 18824
Revenue 50415 59375 90912
Total 65124 69703 109736 Compiled by CBPS from: State budgets and FMR
Note: Table for the above graph is given in the Annexure 6 (Tables1-3)
The average annual health expenditure of the state (from state budget- which excludes the
expenditure outside of the state budget) is higher in Tamil Nadu state followed by Rajasthan
and Bihar (Table 6). The health expenditure of Bihar is less than half (44 percent) that of
Tamil Nadu. Similarly the health expenditure of Rajasthan is about three-fourths of that of
Tamil Nadu. The capital expenditure is highest in Bihar followed by Tamil Nadu and
Rajasthan. This is due to the fact that releases to state health society (SHS) in Bihar were
made under few capital heads (4210) which inflated the capital expenditure account. The
revenue expenditure which largely comprises of personnel expenditure is significantly higher
in Rajasthan than that of Bihar but less than Tamil Nadu.
Table 6: Average Health Expenditure 2010-11 to 2013-14 (Rs. in Crore).
Expenditure Bihar Rajasthan Tamil Nadu
Capital 377 171 355
Revenue 1814 3487 4678
Total 2191 3658 5033 Compiled by CBPS from: State budgets and FMR
While the average health expenditure was highest in Tamil Nadu, the expenditure as a
proportion of total health expenditure was highest in Rajasthan followed by Tamil Nadu and
Bihar. Given that the state of Bihar and Rajasthan has similar total expenditure (Rs 65000 and
69000 crore respectively), the proportionate expenditure on health is higher in Rajasthan than
in Bihar. Capital expenditure of Tamil Nadu is higher. Capital expenditure of Bihar includes
Page 32
Analysis of Health Expenditure in Three States
21 | P a g e
revenue misclassified as capital expenditure. The misclassification arises due to the
accounting of transfers to SHS as capital expenditure5.
Figure 1: Average Health Expenditure and its Share in 3 states
The health expenditure including both state budget and the expenditure incurred through
State Health Society (SHS) was found to be higher in Tamil Nadu followed by Rajasthan and
Bihar (Table 7 and Figure 2). The share of NRHM is highest in Bihar followed by Rajasthan
and Tamil Nadu also indicating the importance of NRHM in the state.
Table 7: Average Health Expenditure (including NRHM) for 2010-11 to 2013-14 (Rs. in Crore)
Expenditure Bihar Rajasthan Tamil Nadu
Expenditure excluding NRHM6 1520 3063 4390
NRHM 1328 1186 1000
Total 2848 4249 5390
Share of NRHM % 47 28 19 Compiled by CBPS from: State budgets and FMR
Figure 2: Average Health Expenditure (including NRHM)
5 Details of the Heads of Account was obtained from accountant - health department
6 This is less than the total expenditure from state budget (in Table 3) since it excludes GOI funds (under NRHM for Infrastructure
Maintenance) and state releases to SHS.
1814
3487
4678
103
171
355
274
0 1000 2000 3000 4000 5000 6000
Bihar
Rajasthan
TamilNadu
Revenue
Capital
Revenue mis-classified
1520
3063
4390
1328
1186
1000
0 1000 2000 3000 4000 5000 6000
Bihar
Rajasthan
Tamil Nadu
Rs in Crore
Non NRHM NRHM
Page 33
Analysis of Health Expenditure in Three States
22 | P a g e
Rajasthan spent higher proportion of its total expenditure on health compared to the other two
states of Bihar and Tamil Nadu (Figure 3). The NRHM expenditure through SHS increased
the share of health expenditure in total expenditure by one percent in Bihar (from 3.4 percent
to 4.4 percent) which is very significant (Figure 3). The similar increases in health
expenditure to total expenditure were 0.9 percent and 0.3 percent in Rajasthan and Tamil
Nadu.. This also signifies the fact that given similar total expenditure of the state in Rajasthan
and Bihar, Rajasthan incurred higher health expenditure.
Figure 3: Average Health Expenditure (State budget and including SHS) as % of Total Expenditure
Note: Table for the above graph is given in the Annexure 6 (Table 4)
Similarly the health expenditure as a percent of Gross State Domestic Product (GSDP) was
highest in Rajasthan followed by Bihar and Tamil Nadu which is an indicative of the higher
priority being given to health by way of expenditure. The increase in health expenditure with
including NRHM from SHS was significant in Bihar which increased the share of health
expenditure by 0.2 percent of GSDP (0.8 to 1.0 percent) while the increase was 0.1 percent in
other Rajasthan and Tamil Nadu.
Figure 4: Average Health Expenditure (State budget and including SHS) as a percent of GSDP
Note: Table for the above graph is given in the Annexure 6 ( Table 5)
The average per capita health expenditure was highest in Tamil Nadu followed by Rajasthan
and Bihar. The per capita expenditure under NRHM was highest in Rajasthan (Table 8 and
3.4
4.4
5.2
6.1
4.6
4.9
3.0
3.5
4.0
4.5
5.0
5.5
6.0
6.5
State Budget State budget+ SHS(NRHM)
Pe
rce
nt
Bihar
Rajasthan
TamilNadu
0.8
1.0
0.9
1.0
0.7
0.8
0.6
0.7
0.8
0.9
1.0
1.1
1.2
State Budget State budget+ SHS(NRHM)
Pe
rce
nt Bihar
Rajasthan
TamilNadu
Page 34
Analysis of Health Expenditure in Three States
23 | P a g e
Figure 5). Though the percapita expenditure of Rajasthan is lower than Tamil Nadu by over
hundred rupees, the percapita expenditure is more than double that of the Bihar. Given that
the IMR for Bihar, Rajasthan and Tamil Nadu (SRS 2013) stands at 42, 47 and 21
respectively and the MMR for Bihar, Rajasthan and Tamil Nadu (SRS 2011-13) is 208, 244
and 79 respectively, the higher percapita expenditure may be required for few more years to
make significant dent on the indicators.
Table 8: Average per capita Health Expenditure of Bihar, Rajasthan and Tamil Nadu (2010-11 to 2013-
14)
Expenditure Bihar Rajasthan Tamil Nadu
Total(with NRHM) 273 618 745
Share of NRHM in % 47 28 19 Compiled by CBPS from: State budgets and FMR
Figure 5 : Average Percapita Health Expenditure (2010-11 to 2013-14)
Note: Table for the above graph is given in the Annexure 6 (Table 6)
The growth of total health expenditure for the period 2010-11 to 2013-14 was highest in
Rajasthan while the growth of NRHM expenditure was highest in Tamil Nadu (Figure 6).
Figure 6: Growth rates of total health expenditure and NRHM expenditure
Note: The detailed tables for growth rates of Bihar, Rajasthan and Tamil Nadu are given in the analysis of
respective states section below.
The growth of NRHM expenditure was lowest in Bihar despite higher volume of expenditure
among the three states. This may be partly due to the higher investments in physical
0 200 400 600 800
Bihar
Rajasthan
TamilNadu
145
446
607
127
172
138
Rupees
Non NRHM
NRHM
15
19
13
4
9
19
0 5 10 15 20
Bihar
Rajasthan
TamilNadu
CAGR (%)
NRHM (total)
Total health exp
Page 35
Analysis of Health Expenditure in Three States
24 | P a g e
infrastructure and personnel recruitment which is time consuming and does not happen as
planned. The growth of expenditure on health is significantly contributed by NRHM in the
states of Bihar and Rajasthan. The higher growth of NRHM expenditure in Tamil Nadu can
be attributed to the existence of infrastructure (physical and personnel) which can effectively
increase the program expenditure and the higher growth is also partly because of lower base
to start with.
The health expenditure incurred in state comprises of the expenditure incurred by funds from
GOI through state budget as well as outside of the state budget through State Health Society
(SHS). The share of GOI was highest in the state of Bihar followed by Rajasthan and Tamil
Nadu (Table 9 and Figure 7). The GOI share includes the NRHM funds for infrastructure
maintenance and other schemes routed through state budget apart from its share of
expenditure incurred at SHS. The relatively higher share of GOI in Bihar indicates the higher
dependency of the state on incurring the health expenditure in the state compared to that of
Rajasthan and Tamil Nadu.
Table 9: Share of GOI and State in average annual health expenditure (2010-11 to 2013-14)
Expenditure Bihar Rajasthan Tamil Nadu
Expenditure (Rs. In crore) 2848 4249 5390
GOI share (%) 31 22 14
State Share (%) 69 78 86
Figure 7: Share of Government of India and State in average health expenditure (2010-11 to 2013-14)
Note: Table for the above graph is given in the Annexure 6
The growth of GOI share and state share was analysed for the period 2010-11 to 2013-14. It
was found that the growth rate of GOI share was highest in Tamil Nadu followed by Bihar
(Figure 8). The growth in GOI share of funds to Rajasthan health expenditure
reduced/remained constant. The growth rate of state share of health expenditure was highest
in Rajasthan followed by Bihar and Tamil Nadu.
882 939
732
1966 3310
4658
0%
10%
20%
30%
40%
50%
60%
70%
80%
90%
100%
Bihar Rajasthan TamilNadu
State Share
GOI share
Page 36
Analysis of Health Expenditure in Three States
25 | P a g e
Figure 8: Growth rates of State and GOI share in total health expenditure
Note: The detailed tables for growth rates of Bihar, Rajasthan and Tamil Nadu are given in the analysis of
respective states section below.
As discussed earlier, the health expenditure is incurred through state budget as well as state
health society. The growth of allocation, expenditure with respect to state budget as well as
the State Health Society (SHS) was compared across three states. The compound annual
growth rate (CAGR) for the period 2010-11 to 2013-14 with respect to allocation under state
budget was higher in Tamil Nadu and Rajasthan while the growth of expenditure was highest
in Rajasthan followed by Bihar and Tamil Nadu (Figure 9). All three states increased the
allocation by more than the stipulated 10 percent increase (under NRHM).
Figure 9: Growth rates of allocation and expenditure (state budget)
Note: The detailed tables for growth rates of Bihar, Rajasthan and Tamil Nadu are given in the analysis of
respective states section below.
The growth rates for allocation and expenditure for the period 2010-11 to 2013-14 under SHS
was found to be highest in Tamil Nadu. While the growth of allocation was higher in
Rajasthan compared to Bihar, the growth of expenditure was higher in Bihar (Figure 10).
9
0
11
17
26
13
0 5 10 15 20 25 30
Bihar
Rajasthan
TamilNadu
CAGR (%)
State share
GoI Share
16
19
19
15
22
12
0 5 10 15 20 25
Bihar
Rajasthan
TamilNadu
Expenditure (State Budget)
Alloaction (State Budget)
Page 37
Analysis of Health Expenditure in Three States
26 | P a g e
Figure 10: Growth rates of allocation and expenditure (State health society)
Note: The detailed tables for growth rates of Bihar, Rajasthan and Tamil Nadu are given in the analysis of
respective states section below.
The NRHM expenditure incurred in the states of Bihar, Rajasthan and Tamil Nadu indicate
that the average expenditure was higher in Bihar followed by Rajasthan and Tamil Nadu. The
expenditure was higher than releases by nine percent in Bihar and four percent in Rajasthan
while it was four percent savings against releases in Tamil Nadu (Table 10).
Table 10: Average Releases and Expenditure under NRHM for 2010-11 to 2013-14(Rs. in Crore)
NRHM Expenditure Bihar Rajasthan Tamil Nadu
Releases ( State + SHS) 1223 1144 1038
Expenditure (State+ SHS) 1329 1186 1000
Excess/Savings -106 -42 39
Excess (-)/Savings (+) % -9 -4 4 Compiled by CBPS from: State budgets and FMR
Note: The detailed year wise tables for Bihar, Rajasthan and Tamil Nadu are given in the analysis of respective states section below.
The expenditure was higher than the releases under state budget component of NRHM. (The
release under state budget component of NRHM is the releases by GOI for infrastructure
maintenance.) It can be seen that all the three states have spent more than the releases for
infrastructure maintenance (Figure 11). The expenditure under SHS component was found to
be less than releases for both Tamil Nadu and Bihar while it was higher in Rajasthan.
Rajasthan expenditure indicates better monitoring and utilisation of funds under NRHM. The
savings in Bihar and Tamil Nadu indicate the need for improving the expenditure levels in
SHS.
18
22
24
18
11
25
0 5 10 15 20 25 30
Bihar
Rajasthan
TamilNadu
CAGR (%)
Expenditure (SHS)
Alloaction ( SHS)
Page 38
Analysis of Health Expenditure in Three States
27 | P a g e
Figure 11: Average Annual Releases and Expenditure under NRHM (Rs. in Crore)
Note: Table for the above graph is given in the Annexure 6 (Table-6)
Apart from the state budget component of NRHM which is for infrastructure maintenance,
the NRHM expenses through SHS were found to be higher in Bihar, followed by Rajasthan
and Tamil Nadu (Table 11). The share of expenses for Human Resources (HR) was found to
be highest in Bihar followed by Rajasthan and Tamil Nadu (Figure 12). The higher
proportion of the expenses on HR also indicates possible initial stage deficits that were made
good through NRHM. In Tamil Nadu, recruitment of ASHAs took place only after 2009 and
even then on a small scale. The state had full time staff nurses and therefore did not rely on
ASHAs. The Janani Suraksha Yojana (JSY) expenditure forms a significant portion of SHS
expenses in Bihar (31 percent) followed by Rajasthan (20 percent). The others category
include the program expenses of RCH and National Disease Control Programme.
Table 11: Average component-wise expenditure of NRHM (SHS) (2010-11 to 2013-14)
Rs. in Crore
Expenditure Bihar Rajasthan Tamil Nadu
Human Resources 289 149 86
Material & Supplies 56 26 12
Civil works 18 85 39
ASHA 91 28 2
VHSNC 25 14 14
JSY 289 170 32
Family planning 44 35 25
Others 119 325 371
Total 931 832 580 Compiled by CBPS from: FMR
This also indicates that the health personnel are recruited under NRHM (who are contractual
staff) and any delays in recruitment also alter the implementation and expenditure incurred
through SHS. This also partly explains the reason for the savings under NRHM in Bihar SHS.
1020
931
831
832
721
580
203
398
313
354
317
420
0 200 400 600 800 1000 1200 1400
REL
EXP
REL
EXP
REL
EXP
Bih
ar
Raj
asth
an
Tam
ilNad
u
SHS
State budget
Page 39
Analysis of Health Expenditure in Three States
28 | P a g e
HR, 15
M&S, 2
Civil works, 7
ASHA, 0
VHSNC, 2 JSY, 6
Family plannin
g, 4
Others, 64
Tamil Nadu
Figure 12: Share of components of NRHM expenditure (SHS) in Bihar
The expenditure under Reproductive Child Health component (which includes Maternal and
Child Health and Child Health) was found to be highest in Bihar followed by Rajasthan and
Tamil Nadu (Table 12).
Table 12 Average Expenditure on RCH, MCH and CH components under NRHM (SHS)
Rs. in Crore
Expenditure Bihar Rajasthan Tamil Nadu
Total Expenditure (TE) 931 832 580
RCH 560 392 220
MCH 328 229 87
CH 30 22 14
Others (NRHM Additionalities, etc) 202 141 119
NDCP, etc. 371 440 360
RCH (as % TE) 60 47 38
MCH (as % TE) 35 27 15
CH (as % TE) 3 3 2 Compiled by CBPS from: FMR
HR, 31
M&S, 6
Civil works,
2
ASHA, 10
VHSNC, 3
JSY, 31
Family plannin
g, 5
Others, 13
Bihar
HR, 18 M&S, 3
Civil works,
10
ASHA, 3 VHSNC,
2
JSY, 20 Family plannin
g, 4
Others, 39
Rajasthan
Page 40
Analysis of Health Expenditure in Three States
29 | P a g e
The expenditure under maternal and child health component also followed the similar trend
while the child health component was almost same proportion across states. This also indicate
the focus of NRHM which is largely RCH oriented, family planning focused (through
institutional deliveries and Janani Suraksha Yojana and compensation for sterilizations) in
Bihar and Rajasthan while it is of less focus in Tamil Nadu.
5.2 Analysis of Health Expenditure of BIHAR
The growth of health expenditure through state budget has decreased on a year on year basis
during the period 2010-11 to 2013-14 though the total expenditure has increased from Rs.
1667 crore to 2574 crore (Table 13). The capital expenditure was highest in 2012-13 and
decreased during 2013-14. The NRHM stipulates that the allocation to health has to be
increased by 10 percent every year which would eventually translate into increase in
expenditure. While the expenditure growth during the year 2013-14 over the previous year
was less than 10 percent, on average growth rate has been of the order of 15.8 percent during
the four year period.
Table 13 : Change in Health Expenditure over previous year
Expenditure (Rs. In crore) 2010-11 2011-12 2012-13 2013-14 Average
Capital 165 321 563 460 377
Revenue 1502 1804 1836 2113 1814
Total 1667 2125 2398 2574 2191
% Change (YoY) 27.43 12.89 7.31 12 Compiled by CBPS from: State Health Budget data
The total health expenditure incurred at the state level comprises expenditure through state
budget as well as the state health society (SHS). The expenditure through the state budget
includes the state share of NRHM released to SHS and the expenditure on infrastructure
maintenance (for which the funds are received from GOI under NRHM). While the releases
to state health society are treated as actual expenditure in the books of the state government,
it can be treated as actual expenditure only when SHS spends the money. Thus, the actual
expenditure under NRHM comprises state spending on infrastructure maintenance (through
state budget) and the expenditure incurred by SHS7 under NRHM.
The total health expenditure including that of NRHM has increased consistently during the
period 2010-11 to 2013-14 (Table 14). However, the rate of increase was highest during
2011-12 at 29.3 percent. While the expenditures under SHS and state budget health
expenditure excluding infrastructure maintenance increased consistently, the expenditure
under infrastructure maintenance decreased during years 2011-12 by more than 50 percent of
the previous year. The share of NRHM was significant during 2010-11(64 percent). It has
reduced to 44 percent during 2013-14 (Figure 13).
7 SHS also incur expenditure from funds other than NRHM as well.
Page 41
Analysis of Health Expenditure in Three States
30 | P a g e
Table 14: Change in Health Expenditure (including NRHM)
Expenditure (Rs. in crore) 2010-11 2011-12 2012-13 2013-14 Average
a. Total expenditure 1667 2125 2398 2574 2191
b. Less: State share of NRHM
(Transfer to SHS) 188 146 399 364
274
c. Expenditure of the State (a-b) 1479 1978 2000 2210 1917
d. NRHM expenditure for
infrastructure maintenance1 687 248 318 337 398
e. State health expenditure (excluding
NRHM) c-d 792 1730 1682 1873 1519
f NRHM expenditure (SHS) 699 844 1027 1152 931
g External funding exp (SHS)2 3 0 0 0 1
Total Health Expenditure (d+e+f+g)
including NRHM 2182 2823 3027 3362
2848
% Change (YoY) in health
expenditure 29.39 7.23 11.08
12
NRHM expenditure( d+f) 1387 1093 1345 1489 1328
Health expenditure (excluding NRHM)
(e+g) 795 1730 1682 1873
1520
Share of NRHM expenditure 64 39 44 44 47
Share of Health expenditure (excluding
NRHM) 36 61 56 56
53 1 This is obtained from progress report of NRHM
2. this is outside of NRHM expenditure incurred by State Health society
Compiled by CBPS from: FMR and State Health Budget data
Figure 13: Share of NRHM in total expenditure
The health expenditure at the state includes the expenditure incurred from both state’s own
fund as well as the funds received from GOI. The funds from GOI come in two parts one (for
the infrastructure maintenance-NRHM) which is routed through state budget8 while the other
component is routed through the SHS which is outside of the state budget. The GOI share of
health expenditure in the state is calculated by adding the funds released through state budget
with the GOI share of expenditure incurred at SHS (SHS expenditure is done using funds
from both GOI and state share). The GOI share of expenditure is calculated using the
proportion of releases of GOI and State shares to SHS. The change in the net state
8 This comprises of funds for NRHM and other health schemes as well.
1387
1093 1345 1489
795
1730 1682 1873
0%
20%
40%
60%
80%
100%
2010-11 2011-12 2012-13 2013-14
NRHM Non NRHM
Page 42
Analysis of Health Expenditure in Three States
31 | P a g e
776 842 880 1032
1406 1981 2147 2330
0%
20%
40%
60%
80%
100%
2010-11 2011-12 2012-13 2013-14
Total centre share Total State Share
contribution (excluding foreign funding projects) was significant during the years 2011-12
and 2012-13 while the change was less than one percent during the year 2013-14 (Table 115).
The share of foreign funding in the total expenditure increased from 0.16 percent to 7.3
percent during the period 2010-11 to 2013-14.
Table 15: Change in state's own contribution to state health expenditure over previous year
(Rs. In crore)
Expenditure ( Rs. In Crore) 2010-11 2011-12 2012-13 2013-14 Average
Total Health expenditure including NRHM 2182 2823 3027 3362 2848
GOI releases to state budget (Infrastructure
Maintenance) 207 182 198 224
203
GOI share of expenditure (SHS) 568 661 682 808 680
Total GOI share of expenditure 776 842 880 1032 883
Total State Share 1406 1981 2150 2330 1966
External Aided Project(SWASTH) & NIPI2
3 173 87 247 128
Net State Contribution 1403 1807 2063 2083 1839
% Change (YoY) 28.85 14.17 0.97 11
GOI share (%) 36 30 29 31 31
State Share (%) 64 70 71 69 69
Share of Foreign funding3 0.16 6.14 2.87 7.33 4 1 includes NRHM expenditure share and the releases to state government (both NRHM and non NRHM)
2 includes expenditure from state budget and state health society
3 Sector Wide Approach for Strengthening Health and Norway Indian Partnership Initiative project
Compiled by CBPS from: FMR and State Health Budget data
While the GOI share of expenditure increased from Rs.776 crore to Rs. 1032 crore during the
period 2010-11 to 2013-14, its share in the total health expenditure in the state decreased
from 36 percent to 31 percent while the state’s share increased from 64 percent to 69 percent
during the same period ( Figure 14).
Figure 14: Share of GOI and state in total health expenditure
The per capita health expenditure increased from Rs 210 to Rs 321 during the period 2010-11
to 2013-14 while the per capita health expenditure from state’s own resources increased from
Rs. 134 to Rs. 199 during the same period (Figure 15).
Page 43
Analysis of Health Expenditure in Three States
32 | P a g e
3.3 3.5 3.5 3.2 0.8 0.9 0.8 0.8
0.0
2.0
4.0
2010-11 2011-12 2012-13 2013-14
Pe
rce
nt
% of total Health expenditure % of GSDP
Figure 15: Per capita health expenditure
The health expenditure as a percent of total expenditure increased from 3.3 to 3.5 percent and
again decreased to 3.2 percent during 2013-14 (Figure 16). Similarly the health expenditure
as percent of GSDP hovered around 0.8 percent.
Figure 16: Health expenditure as percent of total expenditure and as percent of GSDP
Note: Table for the above graph is given in the Annexure 6
The share of plan expenditure in the total expenditure has increased marginally from
41percent to 49 percent during 2011-12 and 2012-13 while it reduced to 46 percent during
2013-14 (Table 16). The plan expenditure increased by 55 percent in 2011-12 and it
increased by 5 percent in the years 2012-13 and 2013-14.
Table 16: State plan expenditure on health as a proportion of state health expenditure
Expenditure (Rs. In crore) 2010-11 2011-12 2012-13 2013-14
Plan 898 1395 1469 1541
Non Plan 1284 1428 1558 1821 Total Health expenditure (including
NRHM) 2182 2823 3027 3362
% share of Plan 41 49 49 46
Change in Plan (YoY)%
55 5 5 Compiled by CBPS from: FMR and State Health Budget data
The health expenditure of the state including the NRHM expenditure through the SHS is
classified into primary, secondary and tertiary healthcare. This is based on the classification
that the NHSRC toolkit used for analysis. The expenditures are classified into five categories.
Apart from primary, secondary and tertiary healthcare, expenditures are also classified as
administration and education expenses. The classification is done at the level of minor head
and group head. Primary expenditure refers to the health services available close to people
and this includes, PHCs, control of diseases etc while the secondary healthcare is Hospitals
210 270 289
321
134 173 197 199
0
100
200
300
400
2010-11 2011-12 2012-13 2013-14
Ru
pe
es
Per capita expenditure ( Total) Per capita expenditure ( state resources)
Page 44
Analysis of Health Expenditure in Three States
33 | P a g e
and dispensaries, First Referral Units etc. Tertiary healthcare includes teaching hospitals.
Administration includes direction and administration while the education includes expenses
on education, training, research and grant in aid. The administration and education expenses
are added with the tertiary healthcare in our analysis as the expenses were similar to that of
tertiary healthcare and cannot be clubbed with primary or secondary healthcare. All the
NRHM expenses under the SHS is classified as primary because of its main focus on primary
healthcare. .
Table 17: Primary, Secondary and Tertiary healthcare in Total Health Expenditure
Expenditure 2010-11 2011-12 2012-13 2013-14
Primary 1524 1971 2204 2416
Secondary 158 237 261 266
Tertiary 302 315 279 331
Administration 52 63 63 73
Education 146 237 219 276
Total 2182 2822 3026 3361 Compiled by CBPS from: FMR and State Health Budget data
The share of primary healthcare was highest and accounted for about 71 percent of the total
health expenditure. The tertiary health expenditure (the administration and education
expenditure included) is the second highest share followed by the secondary healthcare
(Table 17).
Figure 13: Share of Primary, Secondary, tertiary and others in HE
The share of capital expenditure increased from 8 percent to 14 percent during the period
2010-11 to 2013-14 with an exception during 2012-13 during which it was 19 percent
(Table18).
70
70
73
72
7
8
9
8
14
11
9
10
9
11
9
10
0 20 40 60 80 100 120
2011
2012
2013
2014
Primary
Secondary
Tertiary
Administration and Education
Page 45
Analysis of Health Expenditure in Three States
34 | P a g e
Table 18: Capital health expenditure as percentage of total public health expenditure
Expenditure ( Rs. In crore) 2010-11 2011-12 2012-13 2013-14
Capital expenditure 165 321 563 460
Total Expenditure ( including NRHM) 2182 2823 3027 3362
Capital Expenditure (percent) 8 11 19 14 Compiled by CBPS from: FMR and State Health Budget data
The per capita expenditure on medicine and drugs increased from Rs. 13 to Rs. 19 during the
period 2010-11 to 2013-14 (Table 19). The share of medicine and drugs in total health
expenditure hovered around 7 percent during the same period (Table 20)
Table 19: Per capita expenditure on medicine and drugs
Medicine and Drugs expenditure ( Rs. in
Crore) 2010-11 2011-12 2012-13 2013-14
Through State budget 89 114 125 135
Under NRHM 47 39 69 66
Total exp on Medicine and drugs 136 154 194 201
Population (2011) 104099452 104363865 104268949 104894706
Per capita expenditure (Rs) 13 15 19 19 Compiled by CBPS from: FMR and State Health Budget data
Table 20: Medicine and drugs expenditure as percent of total health expenditure (revenue expenditure)
Expenditure (Rs. In Crore) 2010-11 2011-12 2012-13 2013-14
Medicine and drugs expenditure 136 154 194 201 Total Health expenditure(Revenue ) including
NRHM 2017 2502 2464 2902
% share 7 6 8 7 Compiled by CBPS from: FMR and State Health Budget data
The maintenance expenditure is the expenses incurred for the maintenance of the medical
equipment and facilities both under state budget as well as the SHS. The lower maintenance
expenditure is often clubbed with the other heads and it is difficult to identify the exact
expenditure. (Example: Repair and maintenance is often clubbed with upgradation of health
facilities which includes capital investments) This formed a miniscule percent of 0.3 to 0.2
percent of the total revenue expenditure on health (Table 21).
Table 21: Maintenance expenditure as percent of total health expenditure (revenue expenditure)
Expenditure (Rs. In Crore) 2010-11 2011-12 2012-13 2013-14
Maintenance Exp 6 8 6 5 Total health exp(Revenue ) including
NRHM 2202 2648 2863 3266
% share 0.29 0.32 0.21 0.17 Compiled by CBPS from: FMR and State Health Budget data
Conditional Cash Transfer (CCT) is the demand side financing aimed at improving the
maternal and child health services. The CCT is provided for the eligible beneficiaries who
avail benefits from the public health facilities/ authorized by public health facility. This is
also to ensure that the facilities are provided as well as availed by the eligible persons. Janani
Suraksha Yojna is one such CCT which is aimed at registering pregnancies, following up
with the required immunization schedule leading up to institutional delivery. An amount of
Page 46
Analysis of Health Expenditure in Three States
35 | P a g e
Rs 1400/- per delivery (BPL and for 2 children only) is being paid for the mother after giving
birth in a hospital/under the supervision of trained birth attendant. The other CCT is for
undergoing sterilization (male / female) after delivering two children. The CCT expenditure
for beneficiaries of Janani Suraksha Yojna (JSY) and for the sterilizations has increased over
years. However, their share in the total health expenditure has been hovering around 12
percent (Table 22).The expenditure on CCT as a percent of NRHM (SHS) expenditure
decreased from 39 percent to 37 percent except for the year 2012-13. About one third of the
expenditure from SHS is on CCT indicate the higher focus on the increasing the institutional
deliveries and family planning measures.
Table 22: Conditional cash transfers as percent of health expenditure
Conditional Cash transfers 2010-11 2011-12 2012-13 2013-14
JSY and compensation for sterilizations 271 271 290 425
Total Expenditure 2182 2823 3027 3362
NRHM expenditure( SHS) 699 844 1027 1152
CCT (as percent of health exp) 12 10 10 13
CCT ( as percent NRHM exp) 39 32 28 37 Compiled by CBPS from: FMR and State Health Budget data
The share of Human Resources (HR) expenses increased consistently from 2010-11 to 2013-
14. The increase in the share was significant during the period 2010-11 to 2011-12 at nine
percent (Table 23). The share of contractual payments in the total HR expenditure also
increased from 16 percent to 22 percent during the same period (Table 24).
Table 23: Expenditure on Human Resources (Salary, wages and contractual payments) as percent of total
health expenditure
HR expenditure (Rs. In Crore) 2010-11 2011-12 2012-13 2013-14 Average
Salaries 891 1315 1467 1631 1326
Contractual payments and wages 30 91 34 17 46
NRHM- HR 137 235 337 448 289
Total HR expenditure 1059 1640 1837 2096 1658
Total Health expenditure 2182 2823 3027 3362 2848
HR expenditure ( % of total
health exp) 49 58 61 62
58 Compiled by CBPS from: FMR and State Health Budget data
Table 24: Expenditure on contractual payments as percent of total HR expenditure
HR expenditure (Rs. In Crore) 2010-11 2011-12 2012-13 2013-14
Contractual payments and wages 168 326 371 465
Total H R expenditure 1059 1640 1837 2096
% contractual payments in HR total 16 20 20 22 Compiled by CBPS from: FMR and State Health Budget data
The expenditure on procurement of medicine and equipments increased from Rs. 194 crore to
Rs 278 crore during the period 2010-11 to 2013-14 which however remained at around 8
percent of the total health expenditure during the same period (Table 25).
Page 47
Analysis of Health Expenditure in Three States
36 | P a g e
Table 25: Procurement expenses as percent of health expenditure
Expenditure (Rs. In Crore) 2010-11 2011-12 2012-13 2013-14
Total Health budget 2182 2823 3027 3362
NRHM expenditure 699 844 1027 1152
Expenditure on Procurement 194 197 269 278
As % of total health expenditure 9 7 9 8
As % of NRHM expenditure 28 23 26 24 Compiled by CBPS from: FMR and State Health Budget data
The HR expenses, expenses on ASHA and other expenses show consistent increase during
the period 2010-11 to 2013-14. The other expenses which include program expenditure such
as JSY and others (Table 26) accounted for 49 percent during the same period. The share of
untied funds provided to the health centres hovered around 2-6 percent (Table 27).
Table 26: Share of different components of NRHM expenditure (State Health Society)
Expenditure (Rs. In
Crore) 2010-11 2011-12 2012-13 2013-14 Total %Share
HR 137 235 337 448 1157 31
Materials & Supplies 49 39 69 66 224 6
Civil works 23 22 16 10 70 2
ASHA 42 59 95 169 365 10
VHSNC 10 39 34 17 99 3
Others 438 451 476 442 1808 49
Total 699 844 1027 1152 3724 100 Compiled by CBPS from: FMR `
Table 27 : Share of untied funds as percentage of NRHM expenditure
Expenditure 2010-11 2011-12 2012-13 2013-14 Total
Total 699 844 1027 1152 3724
Untied funds 22.37 47.02 41.56 21.79 133
% share of untied funds 3 6 4 2 4 Compiled by CBPS from: FMR and State Health Budget data
The analysis of trends of budget allocation and expenditure on health from state budget
indicated that the allocation grew at 16 percent per annum during the period 2010-11 to 2013-
14 while the expenditure grew by 15 percent (Table 28). The unspent amount also increased
every year by 20 percent. The rate of utilisation decreased marginally from 79 percent to 77
percent during the same period.
Table 28: Trend Analysis of allocation, expenditure and under-expenditure (Rs. in Crore)
State budget 2010-11 2011-12 2012-13 2013-14 CAGR
(%)
Allocation 2105 2705 3068 3339 16
Expenditure 1667 2125 2398 2574 15
unspent 437 580 669 766 20
Utilisation (%) 79 79 78 77 Compiled by CBPS from: State Health Budget data
Page 48
Analysis of Health Expenditure in Three States
37 | P a g e
The health expenditure through SHS grew by 18 percent while the unspent monies grew by
17 percent. The utilisation against allocation hovered around 60 percent (Table 29).
Table 29: Trend analysis of allocation expenditure and under-expenditure (Rs. in crore)
SHS 2010-11 2011-12 2012-13 2013-14 CAGR
Allocation 1179 1374 1909 1830 18
Expenditure 702 844 1027 1152 18
unspent 477 530 882 678 17
Utilisation (%) 60 61 54 63 Compiled by CBPS from: FMR
The state’s share in the NRHM resource envelope was 25 percent during the year 2013-14(as
stipulated by GOI since 2012-13). The state share during the years 2010-11 and 2012-13 was
lesser by two and one percent respectively (Table 30).
Table 30: State's own share in NRHM resource envelope (allocation) in percent
Allocation (Rs. In Crore) 2010-11 2011-12 2012-13 2013-14
Resource envelope a
1277 1345 2008 1862
State shareb 168 198 474 466
State's share (%) 13 15 24 25 Compiled by CBPS from: FMR and State Health Budget data
a: Amount approved for the year by GOI (Record of Proceedings)
b: indicated in Record of Proceedings
The allocation and expenditure under Reproductive Child Health (RCH), Maternal and Child
Health (MCH) and Child Health (CH) grew up to 2012-13 and decreased in 2013-14. RCH
includes MCH and CH components. The utilizations were highest under MCH followed by
RCH and CH components (Table 31).
Table 31 Allocation and Expenditure of RCH, MCH and CH for 2010-11 to 2013-14(Rs. in lakh)
SHS expenditure 2010-11 2011-12 2012-13 2013-14 Total
RCH (Allocation) 66483 62425 101788 99809 330505
RCH( expenditure) 42595 47021 61660 72520 223796
Utilization (%) 64 75 61 73 68
MCH (Allocation) 32641 29729 52130 64719 179218
MCH( expenditure) 25131 25151 37046 43917 131244
Utilization (%) 77 85 71 68 73
CH (Allocation) 6417 7553 14421 7611 36002
CH( expenditure) 2976 1985 2143 4985 12089
Utilization (%) 46 26 15 65 34 Compiled by CBPS from: FMR
The Child Health components such as school health programme, IMNCI, procurement of
Drugs for School Health, Facility based new born care, care of sick children and child health
training saw utilisation less than 50 percent. Only JSSK was spent more than the allocated
amount (Table 32). This also indicate the complementary nature of these programme
expenditure which are dependent on the availability of personnel and accessibility of the
health centre.
Page 49
Analysis of Health Expenditure in Three States
38 | P a g e
Table 32 Expenditure under different components of Child Health (Rs. in lakh)
CHILD HEALTH Allocation Expenditure Utilization
(%)
IMNCI 607 78 12.79 Facility Based Newborn Care (FBNC, SNCU, NBSU,
NBCC) 5193 2498 48.09
Home Based Newborn Care 0 26
School Health Programme 7407 997 13.46
Infant and Young Child Feeding (IYCF) 0 1 Care of Sick Children and Severe Malnutrition (NRC,
SDNC) 4566 2166 47.43 Management of Diarrhoea, ARI and micronutrient
malnutrition 2809 1445 51.45
Other Strategies / Activities 3615 4 0.10
Infant Death Audit 0 0
Incentive to ASHA under child health 1876 417 22.24
JSSK for sick neonates up to 30 days 36 116 321.05
Child Health Training 6074 2769 45.59
Routine Immunization 2471 1445 58.47 Procurement of Drugs for School Health (IFA, Medicines --
under Procurement) 848 110 12.99 Drugs and Consumables (Other than those reflected in
Procurement) 500 19 3.72
Total 36002 12089 33.58 Compiled by CBPS from: FMR
5.3 Analysis of Health expenditure of RAJASTHAN
The growth of health expenditure through state budget on a year on year basis decreased
during year 2012-13 while it increased during the years 2011-12 and 2013-14 over the
previous year (Table 33). The loan component includes the loans to state agencies involved in
health supplies. The capital expenditure increased significantly during 2012-13 and 2013-14.
Table 33: Change in health expenditure over previous year
Expenditure (Rs. In Crore) 2010-11 2011-12 2012-13 2013-14 Average
Capital 36 96 214 337 171
Revenue 2525 3271 3678 4414 3472
Loans 0 5 54 4 16
Total 2562 3371 3946 4755 3658
% Change (YoY) 32 17 21 17 Compiled by CBPS from: State Health Budget data
The total health expenditure comprises expenditure through state budget and the state health
society (SHS). The expenditure through the state budget includes the state share of NRHM
released to SHS and the expenditure on infrastructure maintenance. While the releases to
state health society are treated as actual expenditure in the books of the state government, it
can be treated as actual expenditure only when SHS spends the money.
Page 50
Analysis of Health Expenditure in Three States
39 | P a g e
Table 34: Change in health expenditure over years including NRHM (in percent)
Expenditure (Rs. in crore) 2010-11 2011-12 2012-13 2013-14 Average
a. Total expenditure through State
Budget 2562 3371 3946 4755
3658
b. State share of NRHM ( to state
health society) 154 407 358 429
337
c. Expenditure of the State (a-b) 2407 2965 3587 4326 3321
d NRHM expenditure for
infrastructure maintenance 298 333 371 405
352
e state budget health expenditure
(excluding NRHM) c-d 2110 2632 3216 3922
2970
f NRHM expenditure (SHS) 870 619 798 1041 832
g Other exp including external
funds(SHS)1 8 146 54 175
96
Total Health expenditure
(d+e+f+g)including NRHM 3285 3729 4440 5543
4249
% Change (YoY) in health
expenditure 14 19 25
14
NRHM expenditure( d+f) 1168 952 1169 1446 1186
Health expenditure (excluding
NRHM)(e+g) 2117 2778 3271 4097
3063
Share of NRHM expenditure (%) 36 26 26 26 28
Share of Health expenditure (excluding
NRHM) (%) 64 74 74 74
72 1 this is outside of NRHM expenditure incurred by State Health society
Compiled by CBPS from: FMR and State Health Budget data
Thus, the actual expenditure under NRHM comprises state spending on infrastructure
maintenance (through state budget) and the expenditure incurred by SHS9 under NRHM. The
health expenditure including the NRHM component increased consistently on year on year
basis during the period 2010-11 to 2013-14 (Table 34). The SHS expenditure also included
the external funded projects other than NRHM. The total health expenditure increased from
Rs. 3285 crore to Rs. 5543 crore during the same period. The expenditure through SHS
dipped during the year 2011-12 and 2012-13 but increased over previous year during 2013-
14. The share of NRHM in total health expenditure decreased from 36 percent to 26 percent
during the period2010-11 to 2013-14 (Figure 17) while share of health expenditure other than
NRHM increased from 64 percent to 74 percent.
9 SHS also incur expenditure from funds other than NRHM as well.
Page 51
Analysis of Health Expenditure in Three States
40 | P a g e
Figure 17: Share of NRHM in total health expenditure
The health expenditure at the state includes the expenditure incurred from both state’s own
fund as well as the funds received from GOI. The funds from GOI come in two parts one (for
the infrastructure maintenance-NRHM) which is routed through state budget10
while the other
component of NRHM is routed through the SHS which is outside of the state budget. The
GOI share of health expenditure in the state is calculated by adding the funds released
through state budget with the GOI share of expenditure incurred at SHS (Expenditure at SHS
is done using funds from both GOI and State). The GOI share of expenditure is calculated
using the proportion of releases of GOI and State to SHS. The net state expenditure excluding
the external funding increased from Rs 2219 crore to Rs 4481 during the period 2010-11 to
2013-14 (Table 35).
Table 35 Change in State's own contribution to state health expenditure over previous year (in percent)
Expenditure (Rs. In Crore) 2010-11 2011-12 2012-13 2013-14 Average
Total Health expenditure including NRHM 3285 3729 4440 5543 4249
GOI releases to state budget (Infrastructure
Maintenance and others)1 318 407 303 326
338
GOI share of expenditure(SHS) 740 418 529 713 600
Total GOI share of expenditure 1058 825 832 1039 939
Total State Share (Rs. In crore) 2227 2904 3608 4504 3310
External Aided Project2 8 18 14 23 16
Net State Contribution (Rs. In Crore) 2219 2886 3594 4481 3295
% Change (YoY) 30 25 25 20
GOI share (%) 32 22 19 19 22
State Share (%) 68 78 81 81 78
10
This comprises of funds for NRHM and other health schemes as well.
1168 952 1176 1447
2117 2778 3263 4096
0%
10%
20%
30%
40%
50%
60%
70%
80%
90%
100%
2010-11 2011-12 2012-13 2013-14
NRHM Non NRHM
Page 52
Analysis of Health Expenditure in Three States
41 | P a g e
Share of Foreign funding3(%) 0.24 0.49 0.31 0.42 0.4 1 includes NRHM expenditure share and the other releases to state government (non NRHM)
2 spent through SHS
Compiled by CBPS from: FMR and State Health Budget data
The year on year increase of state share of health expenditure was highest during 2011-12.
The GOI share of health expenditure decreased in absolute terms from Rs. 1058 crore in
2010-11 to Rs. 825 crore in 2011-12 before increasing to Rs.1039 crore in 2013-14. The
share of state in total health expenditure increased from 68 percent to 81 percent during the
period 2010-11 to 2013-14 while that of Government of India decreased during the same
period (Figure 18). External aided projects focused on improving health systems (Rajasthan
Health Systems Project) as well as the institutional deliveries (NIPI- Yashoda).The share of
external funding increased from 0.24 percent to 0.42 percent during the same period.
Figure 18: Share of GOI and state in total health expenditure
The health expenditure as a proportion of total state expenditure increased marginally from
5.1 percent to 5.3 percent 2010-11 to 2013-14. The health expenditure of state as percent of
GSDP also increased marginally from 0.76 percent to 0.93 percent during the same period
(Figure 19).
Figure 19: Health expenditure as percent of total health expenditure and as percent of GSDP
Note: Table for the above graph is given in the Annexure 6
The percapita expenditure on health increased from Rs. 324 to 654 during the period 2010-11
to 2013-14. The percapita health expenditure including NRHM has increased from Rs. 479
to 803 during the same period (Table 36. 37 and Figure 20).
1058 825 832 1039
2227 2904 3608 4504
0%
20%
40%
60%
80%
100%
2010-11 2011-12 2012-13 2013-14
GOI share State share
5.1
5.4 5.2 5.3
0.8 0.8 0.9 0.9
0.0
1.0
2.0
3.0
4.0
5.0
6.0
2010-11 2011-12 2012-13 2013-14
Pe
rce
nt
% of total Health expenditure % of GSDP
Page 53
Analysis of Health Expenditure in Three States
42 | P a g e
Table 36: State, percapita Government health expenditure
Expenditure (Rs. In Crore) 2010-11 2011-12 2012-13 2013-14
Total Health expenditure including NRHM 3285 3729 4440 5543
Population 2011 68548437 68694445 68840764 68987395
Per capita Health expenditure (Rs.) 479 543 645 803 Compiled by CBPS from: FMR and State Health Budget data
Table 37: Per capita health expenditure by state's own resources
Expenditure (Rs. In Crore) 2010-11 2011-12 2012-13 2013-14 Expenditure of State (own resources) (Rs. In
crore) 2219 2886 3594 4481
Population 2011 68548437 68694445 68840764 68987395
Per capita Health expenditure ( Rs) 324 420 522 650 Compiled by CBPS from: FMR and State Health Budget data
Figure 20: Per capita health expenditure
The share of plan expenditure in total state expenditure increased from 45 percent to 52
percent during the period 2010-11 to 2013-14 (Table 38. The year on year growth of plan
expenditure was highest during 2013-14 (Table 39). The Share of foreign funding has
increased marginally from 0.24 percent to 0.42 percent during same period
Table 38: State's plan expenditure on health as proportion of state health expenditure
Expenditure (Rs. In crore) 2010-11 2011-12 2012-13 2013-14
Plan 1489 1781 2082 2858
Non Plan 1796 1949 2357 2685 Total Health expenditure (including
NRHM) 3285 3729 4440 5543
% share of Plan 45 48 47 52 Compiled by CBPS from: FMR and State Health Budget data
Table 39 Change in state's plan expenditure on health (in percent)
Expenditure (Rs. In crore) 2010-11 2011-12 2012-13 2013-14
Plan 1489 1781 2082 2858
Non Plan 1796 1949 2357 2685 Total Health expenditure (including
NRHM) 3285 3729 4440 5543
Change in Plan (YoY)%
20 17 37 Compiled by CBPS from: FMR and State Health Budget data
479 543 645
803
324 420
522 650
0
200
400
600
800
1000
2010-11 2011-12 2012-13 2013-14
Per capita expenditure ( Total) Per capita expenditure ( state resources)
Page 54
Analysis of Health Expenditure in Three States
43 | P a g e
The health expenditure of the state including the NRHM expenditure through the SHS is
classified into primary, secondary and tertiary healthcare. This is based on the classification
that the NHSRC toolkit used for analysis. The expenditures are classified into five categories.
Apart from primary, secondary and tertiary healthcare, expenditures are also classified as
administration and education expenses. The classification is done at the level of minor head
and group head. Primary expenditure refers to the health services available close to people
and this includes, PHCs, control of diseases etc while the secondary healthcare is Hospitals
and dispensaries, First Referral Units etc. Tertiary healthcare includes teaching hospitals.
Administration includes direction and administration while the education includes expenses
on education, training, research and grant in aid. The administration and education expenses
are also presented in our analysis as the expenses cannot be clubbed with primary or
secondary healthcare. All the NRHM expenses under the SHS as well as expenses under
family welfare (Major Head 2211) are classified as primary because of its main focus on
primary healthcare. The share of expenditure on Primary healthcare decreased from 70
percent to 64 percent while expenditure on secondary care increased from 20 percent to 21
percent during the period 2010-11 to 2013-14 (Figure 21). The expenditure on tertiary
healthcare was marginal compared to others while the expenditures on education and
administration rose consistently from 2010-11 to 2013-14(Table 40).
Table 40: Primary, secondary and tertiary health care in total health expenditure
Expenditure ( Rs. in Crore) 2010-11 2011-12 2012-13 2013-14
Primary 2294 2461 2887 3522
Secondary 648 796 916 1146
Tertiary 1 11 55 4
Administration 83 64 66 78
Education 260 398 516 793
Total 3285 3730 4439 5543
Figure 21: Share of Primary, Secondary and Tertiary healthcare in total expenditure
The capital health expenditure increased from 1 percent to 6 percent during the same period
(Table 41). The state share in NRHM resource envelope increased from 15 percent to 20
percent during 2013-14 (Table 42).
70
66
65
64
20
21
21
21
11
13
13
15
0 20 40 60 80 100 120
2010-11
2011-12
2012-13
2013-14 Primary
Secondary
Tertiary
Administration and Education
Page 55
Analysis of Health Expenditure in Three States
44 | P a g e
Table 41: Capital health expenditure as percent of total health expenditure
Expenditure ( Rs. In crore) 2010-11 2011-12 2012-13 2013-14
Capital expenditure 36 96 214 337
Total Expenditure ( including NRHM) 3285 3729 4440 5543
% capital expenditure 1 3 5 6 Compiled by CBPS from: FMR and State Health Budget data
Table 42: State's own share in NRHM resource envelope (allocation)
Allocation (Rs. In Crore) 2010-11 2011-12 2012-13 2013-14
Resource envelope a
1208 1022 1462 1632
State shareb 180 145 327 333
State's share (%) 15 14 22 20 Compiled by CBPS from: Record of Proceedings
a: Amount approved for the year by GOI (Record of Proceedings)
b: indicated in Record of Proceedings
The percapita expenditure on medicine and drugs increased from Rs 6 to Rs 18 during the
period 2013-14(Table 43) while the share of expenditure on medicine and drugs increased
from 1 to 2 percent during the same period (Table 44).
Table 43 Per capita expenditure on medicine and drugs
Medicine and Drugs expenditure (Rs.
In Crore) 2010-11 2011-12 2012-13 2013-14
Through State budget 36 48 56 87
Under NRHM 5 16 7 77
Total exp on Medicine and drugs 41 64 63 164
Population (2011) 68548437 68694445 68840764 68987395
Per capita expenditure (Rs) 6 9 9 24 Compiled by CBPS from: FMR and State Health Budget data
Table 44: Medicine and drugs as percent of total health expenditure (revenue expenditure)
Expenditure (Rs. In Crore) 2010-11 2011-12 2012-13 2013-14
Medicine and drugs expenditure 41 64 63 164 Total Health expenditure(Revenue ) including
NRHM 3249 3634 4226 5206
% share 1 2 1 3 Compiled by CBPS from: FMR and State Health Budget data
The maintenance expenditure is the expenses incurred for the maintenance of the medical
equipment and facilities both under state budget as well as the SHS. The lower maintenance
expenditure is often clubbed with the other heads and it is difficult to identify the exact
expenditure. The maintenance expenditure as percent of total health expenditure (revenue
expenditure) decreased marginally from 0.36 percent to 0.35 percent during the period 2010-
11 to 2013-14 (Table 45).
Table 45: Maintenance as percent of total health expenditure (revenue expenditure)
Expenditure (Rs. In Crore) 2010-11 2011-12 2012-13 2013-14
Maintenance Exp 12 14 13 18 Total health exp(Revenue ) including
NRHM 3249 3634 4226 5206
% share 0.36 0.39 0.31 0.35
Page 56
Analysis of Health Expenditure in Three States
45 | P a g e
Compiled by CBPS from: FMR and State Health Budget data
Conditional Cash Transfer (CCT) is provided for the eligible beneficiaries who avail benefits
from the public health facilities/ authorized by public health facility. This is also to ensure
that the facilities are provided as well as availed by the eligible persons. Janani Suraksha
Yojna is one such CCT which is aimed at registering pregnancies, following up with the
required immunization schedule leading up to institutional delivery. An amount of Rs 1400/-
per delivery (BPL and for 2 children only) is being paid for the mother after giving birth in a
hospital/under the supervision of trained birth attendant. The other CCT is for undergoing
sterilization (male / female) after delivering two children. The CCT expenditure for
beneficiaries of Janani Suraksha Yojna (JSY) and for the sterilizations has increased over
years. The Conditional Cash Transfers (CCT) has decreased from 6 percent to 3 percent
during the period 2010-11 to 2013-14. The CCT as percent of NRHM (SHS) also decreased
from 24 percent to 17 percent during the same period (Table 46).
Table 46: Conditional cash transfers as percent of total health expenditure
Conditional Cash transfers (Rs. In
Crore) 2010-11 2011-12 2012-13 2013-14
JSY and compensation for sterilizations 212 172 173 179
Total Expenditure 3285 3729 4440 5543
NRHM expenditure( SHS) 870 619 798 1041
CCT (as percent of health exp) 6 5 4 3
CCT ( as percent NRHM exp) 24 28 22 17 Compiled by CBPS from: FMR and State Health Budget data
The HR expenditure as percent of health expenditure decreased from 51 percent to 47 percent
during the period 2010-11 to 2013-14(Table 47). The share of contractual payments in total
HR expenditure increased from 2 percent to 11 percent and again decreased to 9 percent
(Table 48).
Table 47: Total expenditure on HR (salary, wages contractual payments) as percent of total health
expenditure
HR expenditure (Rs. In Crore) 2010-11 2011-12 2012-13 2013-14 Average
Salaries 2057 2263 2548 2957 2546
Contractual payments and wages 16 37 56 84 48
NRHM- HR 25 197 195 179 149
Total HR expenditure 2098 2497 2799 3219 2653
Total Health expenditure 3285 3729 4440 5543 4249
HR expenditure ( % of total health
exp) 64 67 63 58
63 Compiled by CBPS from: FMR and State Health Budget data
Table 48: Total expenditure on contractual payments as percent of total HR (salary, wages and
contractual payments)
HR expenditure (Rs. In Crore) 2010-11 2011-12 2012-13 2013-14
Contractual payments and wages 41 234 251 262
Total H R expenditure 2098 2497 2799 3219
Page 57
Analysis of Health Expenditure in Three States
46 | P a g e
% contractual payments in HR total 2 9 9 8 Compiled by CBPS from: FMR and State Health Budget data
The share of expenditure on procurement of medicine and equipment as a percent of total
health expenditure increased from 0.4 percent to 2.46 percent during the period 2010-11 to
2013-14 while share of expenditure on procurement as percent of NRHM (SHS) increased
from 1.52 percent to 13.1 percent during the same period (Table 49).
Table 49: Procurement (medicine and equipment) as percent of total health expenditure
Expenditure (Rs. In Crore) 2010-11 2011-12 2012-13 2013-14
Total Health expenditure 3285 3729 4440 5543
NRHM expenditure (SHS) 870 619 798 1041
Expenditure on Procurement 55 91 75 300
As % total health expenditure 1.7 2.4 1.7 5.4
As % NRHM expenditure 6.3 14.8 9.5 28.8 Compiled by CBPS from: FMR and State Health Budget data
The share of different components of NRHM (SHS) indicated that the program expenditure
had the highest share followed by HR expenses and civil works (Table 50). The share of
untied funds in NRHM (SHS) expenditure decreased from 5 percent to 2 percent (Table 51).
Table 50: Share of different components of NRHM expenditure (State Health Society)
Expenditure (Rs. In
Crore) 2010-11 2011-12 2012-13 2013-14 Total %Share
HR 25 197 195 179 595 18
Materials & Supplies 5 16 7 77 106 3
Civil works 150 6 175 8 339 10
ASHA 30 25 22 36 112 3
VHSNC 23 14 10 8 55 2
Others 637 360 390 734 2121 64
Total 870 619 798 1041 3328 100 Compiled by CBPS from: FMR
Table 51: Expenditure on untied funds as percent of total NRHM expenditure (SHS)
Expenditure ( Rs. in crore) 2010-11 2011-12 2012-13 2013-14 Total
Total 870 619 798 1041 3328
Untied funds 43 30 23 21 117
% share of untied funds 5 5 3 2 15 Compiled by CBPS from: FMR and State Health Budget data
The trend analysis of budget indicated that allocation increased at the rate of 18 percent per
annum while the expenditure increased at the rate of 22 percent during the period 2010-11 to
Page 58
Analysis of Health Expenditure in Three States
47 | P a g e
2013-14. The utilisation improved significantly from 87 percent to 95 percent during the
same period (Table 52). The allocation and expenditure of NRHM (SHS) increased at the rate
of 22 percent and 11 percent respectively during the 2010-11 to 2013-14. While the
utilisation against allocation decreased from 90 to 70 percent, the unspent monies increased at
rate of 77 percent during the same period (Table 53).
Table 52: Trend analysis of allocation expenditure and under-expenditure (Rs. in crore)
State budget( Rs. in crore) 2010-11 2011-12 2012-13 2013-14 CAGR (%)
Allocation 2928 3655 3869a
5028 18
Expenditure 2562 3371 3946 4755 22
Unspent 367 283 -76 273
Utilisation (%) 87 92 102 95 Compiled by CBPS from: State Health Budget data
a: Revised estimate was 4012 crore and utilisation was 98 %
Table 53: Trend analysis of allocation, expenditure and under-expenditure (Rs. in crore)
State Health Society ( Rs. in crore) 2010-11 2011-12 2012-13 2013-14 CAGR (%)
Allocation 969 962 1315 1702 22
Expenditure 870 746 838 1193 11
Unspent 99 216 477 509 77
Utilisation (%) 90 78 64 70 Compiled by CBPS from: FMR
The utilisation of MCH was highest followed by RCH and CH cumulative for the period
2010-11 to 2013-14. The utilisation rates decreased for RCH and MCH during the period
2010-11 to 2013-14 while it increased marginally for CH during the same period (Table 54).
Table 54: Allocation and Expenditure of RCH, MCH and CH for 2010-11 to 2013-14(Rs. in lakh)
SHS expenditure 2010-11 2011-12 2012-13 2013-14 Total
RCH (Allocation) 32910 47640 62220 68775 211545
RCH( expenditure) 28690 37818 44156 46024 156689
Utilization (%) 87 79 71 67 74
MCH (Allocation) 15460 24134 32682 34707 106984
MCH( expenditure) 18495 19798 25804 27369 91467
Utilization (%) 120 82 79 79 85
CH (Allocation) 5657 4761 9668 7646 27733
CH( expenditure) 3055 3008 4937 4603 15603
Utilization (%) 54 63 51 60 56 Compiled by CBPS from: FMR
The expenditure under Child Health components indicate the lower rates of under utilisation
in almost all of the heads except for home based new born care (Table 55). The utilisation
under immunization is a cause for serious concern. The utilisation under school health
program, IYCF, and infant death audit were less than 25 percent. While lower utilization is a
concern, it also raises the issues of estimation and releases. The lower utilisation under
incentives to ASHA indicated that the estimated progress on child health is not made be it in
immunization, or etc.
Page 59
Analysis of Health Expenditure in Three States
48 | P a g e
Table 55: Expenditure under different components of Child Health (Rs. in lakh)
CHILD HEALTH Allocation Expenditure Utilization (%)
IMNCI 8 0 0.00
Facility Based Newborn Care (FBNC, SNCU, NBSU,
NBCC) 769 358 46.58
Home Based Newborn Care 41 40 98.70
School Health Programme 202 43 21.19
Infant and Young Child Feeding (IYCF) 575 134 23.38
Care of Sick Children and Severe Malnutrition (NRC,
SDNC) 912 338 37.09
Management of Diarrhoea, ARI and micronutrient
malnutrition 10 1 11.80
Other Strategies / Activities 263 191 72.83
Infant Death Audit 35 6 17.13
Incentive to ASHA under child health 2050 195 9.53
JSSK for sick neonates up to 30 days 1606 784 48.81
Child Health Training 1453 896 61.62
Routine Immunization 18510 12357 66.76
Procurement of Drugs for School Health (IFA, Medicines -
- under Procurement) 254 160 63.02
Drugs and Consumables (Other than those reflected in
Procurement) 1046 99 9.50
Total 27733 15603 56.26
5.4 Analysis of Health Expenditure of TAMIL NADU
The year on year growth of the health expenditure was highest for the year 2012-13 followed
by the year 2013-14. The capital expenditure decreased in the years 2011-12 and 2012-13 as
compared to 2010-11 and increased significantly during 2013-14. The revenue expenditure
showed a consistent increase during the period 2010-11 to 2013-14(Table 56).
Table 56: Change in health expenditure over previous year
Expenditure (Rs. In crore) 2010-11 2011-12 2012-13 2013-14 Average
Capital 326 200 304 589 355
Revenue 4076 4220 4986 5431 4678
Total 4401 4420 5290 6020 5033
% Change (YoY) 0.4 19.7 13.8 8
Compiled by CBPS from: State Health Budget data
The total health expenditure incurred at the state level comprises expenditure through state
budget as well as the state health society (SHS). The expenditure through the state budget
includes the state share of NRHM released to SHS and the expenditure on infrastructure
maintenance (for which the funds are received from GOI under NRHM). While the releases
to state health society are treated as actual expenditure in the books of the state government,
it can be treated as actual expenditure only when SHS spends the money. Thus, the actual
Page 60
Analysis of Health Expenditure in Three States
49 | P a g e
816 841 942 1400
3890 3874 4586 5210
0%
10%
20%
30%
40%
50%
60%
70%
80%
90%
100%
2010-11 2011-12 2012-13 2013-14
NRHM Non NRHM
expenditure under NRHM comprises state spending on infrastructure maintenance (through
state budget) and the expenditure incurred by SHS11
under NRHM.
Table 57: Change in health expenditure over previous year including NRHM
Expenditure (Rs. in crore) 2010-11 2011-12 2012-13 2013-14 Average
a. Total expenditure through State Budget 4401 4420 5290 6020 5033
b. State share of NRHM ( to state health
society) 162 118 287 327
223
c. Expenditure of the State (a-b) 4239 4302 5003 5693 4810
d NRHM expenditure for infrastructure
maintenance1 349 428 418 483
419
e state budget health expenditure
(excluding NRHM) c-d 3890 3874 4586 5210
4390
f NRHM expenditure (SHS) 467 413 525 917 580
Total Health expenditure
(d+e+f)including NRHM 4706 4715 5528 6610
5390
% Change (YoY) in health expenditure
0.19 17.74 19.57 9
NRHM expenditure( d+f) 816 841 942 1400 1000
Health expenditure (excluding
NRHM)(e+g) 3890 3874 4586 5210
4390
Share of NRHM expenditure 17 18 17 21 18
Share of Health expenditure (excluding
NRHM) 83 82 83 79
82 Compiled by CBPS from: FMR and State Health Budget data
The health expenditure including NRHM increased consistently during the period 2010-11 to
2013-14. Higher year on year increase was recorded during the year 2013-14(Table 57). The
share of NRHM in the total health expenditure increased from 17 percent to 21 percent
during the period 2010-11 to 2013-14 (Figure 22).
Figure 22: Share of NRHM in total health expenditure
11
SHS also incur expenditure from funds other than NRHM as well.
Page 61
Analysis of Health Expenditure in Three States
50 | P a g e
638 645 789 854
4068 4070 4739 5756
0%
20%
40%
60%
80%
100%
2010-11 2011-12 2012-13 2013-14
GOI share State Share
The health expenditure at the state includes the expenditure incurred from both state’s own
fund as well as the funds received from GOI. The funds from GOI come in two parts one (for
the infrastructure maintenance-NRHM) which is routed through state budget12
while the other
component is routed through the SHS which is outside of the state budget.
Table 58: Change in State’s own contribution to health expenditure over previous year
Expenditure ( Rs. in Crore) 2010-11 2011-12 2012-13 2013-14 Average
Total Health expenditure including NRHM 4706 4715 5528 6610 5390
GOI releases to state budget (Infrastructure
Maintenance+ others) 305 322 458 236
330
GOI share of expenditure(SHS) 333 323 331 617 401
Total GOI share of expenditure 638 645 789 854 732
Total State Share (Rs. in crore) 4068 4070 4739 5756 4658
External Aided Project TNHSP 167 84 63 98 103
Net State Contribution (Rs. In Crore) 3901 3986 4676 5658 4555
% Change (YoY)
2 17 21 10
GOI share (%) 14 14 14 13 14
State Share (%) 86 86 86 87 86
Share of Foreign funding3 4 2 1 1 2
Compiled by CBPS from: FMR and State Health Budget data
The GOI share of health expenditure in the state is calculated by adding the funds released
through state budget with the GOI share of expenditure incurred at SHS (SHS expenditure is
done using funds from both GOI and state share). The GOI share of expenditure is calculated
using the proportion of releases of GOI and State shares to SHS. The share of state in the
total health expenditure increased from 86 percent to 87 percent during the period 2010-11 to
2013-14(Table 58 and Figure 23). The net contribution of the state excluding external aided
project increased from Rs. 3901 crore to Rs. 5658 crore during the period 2010-11 to 2013-
14. The year on year change was highest for the year 2013-14 at 21 percent. The share of
centre in total health expenditure decreased marginally from 14 percent to 13 percent though
the expenditures increased from Rs.638 crore to Rs. 854 crore during the period 2010-11 to
2013-14. The share of foreign funding in total health expenditure of the state decreased from
3.54 percent to 1.49 percent during the period 2010-11 to 2013-14.
Figure 23: Share of GOI and state in total health expenditure
12
This comprises of funds for NRHM and other health schemes as well.
Page 62
Analysis of Health Expenditure in Three States
51 | P a g e
5.0
4.2
4.5 4.7
0.8 0.7 0.7 0.7
0.0
1.0
2.0
3.0
4.0
5.0
6.0
2010-11 2011-12 2012-13 2013-14
% of total Health expenditure % of GSDP
The share of health expenditure in total expenditure of the state hovered around 5 percent
during the period 2010-11 to 2013-14. The state health expenditure as percent of GSDP
decreased from 0.75 percent to 0.7 percent during the same period (Figure 24).
Figure 24: State health expenditure as percent of total state expenditure and as percent of GSDP
Note: Table for the above graph is given in the Annexure 6
The per capita health expenditure by state’s own resources increased from Rs 541 to Rs 784
during the period 2010-11 to 2013-14 while the percapita total health expenditure in the state
increased from Rs 652 to Rs. 916 for the same period (Table 59. 60 and Figure 25).
Table 59: State’s per capita Govt. Health Expenditure
Expenditure 2010-11 2011-12 2012-13 2013-14
Total Health expenditure (Rs. In crore) 4706 4715 5528 6610
Population (2011) 72138958 72251495 72364207 72477095
Per capita Health expenditure (Rs) 652 653 764 912 Compiled by CBPS from: FMR and State Health Budget data
Table 60: Per capita health expenditure by State’s own Resources
Expenditure 2010-11 2011-12 2012-13 2013-14 Expenditure of State (own resources) (Rs. In
crore)1 3901 3986 4676 5658
Population 2011 72138958 72251495 72364207 72477095
Per capita Health expenditure ( Rs) 541 552 646 781 Compiled by CBPS from: FMR and State Health Budget data
1 excluding GoI share and external funds
Page 63
Analysis of Health Expenditure in Three States
52 | P a g e
Figure 25: Per capita health expenditure
The share of plan expenditure on health decreased during the year 2011-12 to 39 percent and
again increased to 47 percent in 2013-14. The year on year change was highest during the
year 2012-13 which recorded 33.5 percent increase in plan expenditure over the previous
year( Table 61 and 62).
Table 61: State Plan Expenditure on Health as proportion on State Health Expenditure
Expenditure (Rs. In crore) 2010-11 2011-12 2012-13 2013-14
Plan 2250 1852 2473 3124
Non Plan 2456 2863 3055 3486 Total Health expenditure (including
NRHM) 4706 4715 5528 6610
% share of Plan 48 39 45 47 Compiled by CBPS from: FMR and State Health Budget data
Table 62: Change in State’s Plan Expenditure on Health (in percent)
Expenditure (Rs. In crore) 2010-11 2011-12 2012-13 2013-14
Plan 2250 1852 2473 3124
Non Plan 2456 2863 3055 3486 Total Health expenditure (including
NRHM) 4706 4715 5528 6610
Change in Plan (YoY)%
-17.68 33.50 26.34 Compiled by CBPS from: FMR and State Health Budget data
The health expenditure of the state including the NRHM expenditure through the SHS is
classified into primary, secondary and tertiary healthcare. This is based on the classification
that the NHSRC toolkit used for analysis. The expenditures are classified into five categories.
Apart from primary, secondary and tertiary healthcare, expenditures are also classified as
administration and education expenses. The classification is done at the level of minor head
and group head. Primary expenditure refers to the health services available close to people
and this includes, PHCs, control of diseases etc while the secondary healthcare is Hospitals
and dispensaries, First Referral Units etc. Tertiary healthcare includes teaching hospitals.
652 653
764
912
541 552
646
781
0
100
200
300
400
500
600
700
800
900
1000
2010-11 2011-12 2012-13 2013-14
Per capita expenditure ( Total) Per capita expenditure ( state resources)
Page 64
Analysis of Health Expenditure in Three States
53 | P a g e
Administration includes direction and administration while the education includes expenses
on education, training, research and grant in aid. The administration and education expenses
are presented our analysis as the expenses cannot be clubbed with primary or secondary
healthcare. All the NRHM expenses under the SHS as well as the family welfare expenses
(2011) are classified as primary because of its main focus on primary healthcare.
The primary healthcare expenditure increased from Rs 2292 crore to Rs. 3369crore in
absolute terms while its share in total health care expenditure increased marginally from 49
percent to 51 percent during the period 2010-11 to 2013-14. The share of tertiary healthcare
expenditure increased marginally from 16 percent to 17 percent during the same period
(Table 63).
Table 63: Proportion of Primary, secondary and tertiary healthcare in total expenditure
Expenditure ( Rs. in Crore) 2010-11 2011-12 2012-13 2013-14
Primary 2292 2365 2753 3369
Secondary 1650 1653 1862 2128
Tertiary 305 124 343 333
Administration 435 546 541 744
Education 25 27 29 36
Total 4706 4715 5528 6610 Compiled by CBPS from State Health Budget Data and FMR
Figure 26: Share of Primary, Secondary, tertiary and others in HE
The share of capital expenditure increased from 6.9 percent to 8.9 percent during the same period
(Table 64).
Table 64: Capital health expenditure as percentage of total public health expenditure
Expenditure ( Rs. in crore) 2010-11 2011-12 2012-13 2013-14
Capital expenditure 326 200 304 589
Total Expenditure ( including NRHM) 4706 4715 5528 6610
% capital expenditure 6.92 4.25 5.50 8.91 Compiled by CBPS from: FMR and State Health Budget data
The share of state in NRHM resource envelope increased from 13 percent to 22 percent
during the period 2010-11 to 2013-14 ( Table 65).
49
50
50
51
35
35
34
32
6
3
6
5
10
13
11
12
0% 20% 40% 60% 80% 100%
2010-11
2011-12
2012-13
2013-14
Primary
Secondary
Tertiary
Education and Administration
Page 65
Analysis of Health Expenditure in Three States
54 | P a g e
Table 65: State’s own share in NRHM resource envelope (allocation) in percent
Allocation (Rs. In Crore) 2010-11 2011-12 2012-13 2013-14
Resource envelope a
871 901 1364 1320
State shareb 116 135 289 295
State's share (%) 13 15 21 22 Compiled by CBPS from: FMR and State Health Budget data
a: Amount approved for the year by GOI (Record of Proceedings)
b: indicated in Record of Proceedings
The percapita expenditure on medicine and drugs increased from Rs. 7 to Rs 39 during the
period 2010-11 to 2013-14 while the expenditure on medicine and drugs as a percent of total
health expenditure increased from 1 percent to 4 percent during the same period (Table 66
and 67).
Table 66: Per capita expenditure on Medicines and Drugs
Medicine and Drugs expenditure ( Rs. in
Crore) 2010-11 2011-12 2012-13 2013-14
Through State budget 50 212 138 260
Under NRHM 3 14 8 22
Total exp on Medicine and drugs 53 226 146 282
Population (2011) 72138958 72251495 72364207 72477095
Per capita expenditure (Rs) 7 31 20 39 Compiled by CBPS from: FMR and State Health Budget data
Table 67: Expenditure on medicines and drugs as percent of total health expenditure (revenue
expenditure)
Expenditure (Rs. In Crore) 2010-11 2011-12 2012-13 2013-14
Medicine and drugs expenditure 53 226 146 282 Total Health expenditure(Revenue ) including
NRHM 4706 4715 5528 6610
% share 1 5 3 4 Compiled by CBPS from: FMR and State Health Budget data
The maintenance expenditure as percent of total health expenditure increased for three years
from 2010-11 to 2012-13 and dipped during 2013-14(Table 68). The share of CCT
accounted for 7 to 9 percent of the total health expenditure which is a significant amount
(Table 69). The CCT under JSY (which is payment of Rs 1400 per beneficiary) is less while
the state scheme Muthulakshmi Reddy scheme (pays Rs.12000 per beneficiary) is not part of
NRHM. Though this is a core maternal health care expenditure it is being spent under social
security head13
.
Table 68: Maintenance as percentage of total health Expenditure (revenue expenditure)
Expenditure (Rs. In Crore) 2010-11 2011-12 2012-13 2013-14
Maintenance Exp 13 16 30 16 Total health exp(Revenue ) including
NRHM 4706 4715 5528 6610
% share 0.27 0.33 0.54 0.24
13 This is not included in our calculation of health expenditure
Page 66
Analysis of Health Expenditure in Three States
55 | P a g e
Compiled by CBPS from: FMR and State Health Budget data
Table 69: Conditional Cash Transfers as percentage of total health Expenditure
Conditional Cash transfers 2010-11 2011-12 2012-13 2013-14
JSY and compensation for sterilizations 55 49 47 56
Muthulakshmi Reddy scheme1
264 390 444 450
Total CCT 319 439 492 507
Total Expenditure 4706 4715 5528 6610
NRHM expenditure( SHS) 467 413 525 917
CCT (as percent of health exp) 7 9 9 8
CCT ( as percent NRHM exp) 68 106 94 55 1This is a CCT but spent under social security and welfare (2235) though expenses are maternal related.
Compiled by CBPS from: FMR and State Health Budget data
The share of HR expenditure in the total health expenditure increased marginally from 48
percent to 52 percent during the period 2010-11 to 2013-14. The share of contractual
payments in the total HR expenditure increased from 2.8 percent to 4.1percent during the
same period (Table 70 and 71).
Table 70: Total expenditure on HR (salary, wages, contractual payments) as percent of total health
expenditure
HR expenditure (Rs. In Crore) 2010-11 2011-12 2012-13 2013-14 Average
Salaries 2256 2632 2755 3288 2733
Contractual payments and wages 14 18 17 32 20
NRHM- HR 52 91 91 111 86
Total HR expenditure 2322 2741 2862 3432 2839
Total Health expenditure 4706 4715 5528 6610 5390
HR expenditure ( % of total
health exp) 49 58 52 52
53 Compiled by CBPS from: FMR and State Health Budget data
Table 71: Total expenditure on contractual payments as percentage of total HR (salary, wages,
contractual payments)
HR expenditure (Rs. In Crore) 2010-11 2011-12 2012-13 2013-14
Contractual payments and wages 65 109 107 143
Total H R expenditure 2322 2741 2862 3432
% contractual payments in HR total 2.82 3.98 3.75 4.18 Compiled by CBPS from: FMR and State Health Budget data
The procurement expenditure as percent of total health expenditure decreased during years
2011-12 and 2012-13 and increased to 5 percent during 2013-14. The share of program
expenses was highest followed by HR expenditure among the expenditures from SHS (Table
72 and 73).
Table 72: Procurement (equipment and medicines/drugs) as percentage of total health expenditure
Expenditure (Rs. In Crore) 2010-11 2011-12 2012-13 2013-14
Total Health budget 4706 4715 5528 6610
NRHM expenditure 467 413 525 917
Page 67
Analysis of Health Expenditure in Three States
56 | P a g e
Expenditure on Procurement 77 242 154 328
As % total health budget 2 5 3 5
As % NRHM expenditure 17 59 29 36 Compiled by CBPS from: FMR and State Health Budget data
Table 73: Share of different components of NRHM expenditure (State Health Society)
Compiled by CBPS from: FMR
The share of untied funds decreased from 2.9 percent to 1.5 percent during the period 2010-
11 to 2013-14 (Table 74).
Table 74: Expenditure on untied funds as percent of total NRHM expenditure
Expenditure ( Rs. in crore) 2010-11 2011-12 2012-13 2013-14 Total
Total Expenditure 467 413 525 917 2321
Untied funds 14 15 15 14 58
% share of untied funds 2.92 3.63 2.92 1.56 2.51 Compiled by CBPS from: FMR
The expenditure against the allocation for health in state budget indicates higher utilisation
over the years (Table 75). (The allocation for health other than in Demand 19 was not
available). The utilisation under SHS was highest during the year 2013-14 at 47 percent while
it was lowest in 2012-13 at 36 percent (Table 76).
Table 75: Trend analysis of allocation, expenditure and under-expenditure (State Budget)
(Rs. in crore)
State budget 2010-11 2011-12 2012-13 2013-14 CAGR (%)
Allocation 3437 3814 4750 5691 19
Expenditure 4401 4420 5290 6020 12
Unspent -964 -606 -540 -329
Utilisation (%) 128 116 111 106
Table 76: Trend analysis of allocation, expenditure and under-expenditure (State Health Society)
(Rs. in crore)
SHS 2010-11 2011-12 2012-13 2013-14 CAGR (%)
Allocation 1035 1110 1472 1948 24
Expenditure 467 413 525 917 25
Unspent 568 697 948 1031 23
Utilisation (%) 45 37 36 47
Expenditure (Rs. in Crore) 2010-11 2011-12 2012-13 2013-14 Total %Share
HR 52 91 91 111 345 15
Materials & Supplies 3 14 8 22 47 2
Civil works 19 47 28 64 158 7
ASHA 0 1 2 4 8 0
VHSNC 16 13 14 11 54 2
Others 377 246 382 704 1710 74
Total 467 413 525 917 2321 100
Page 68
Analysis of Health Expenditure in Three States
57 | P a g e
6. Healthcare and Utilisation of Public Health Expenditure - Issues
Understanding of the issues with the access and utilisation of maternal and child health care
services becomes critical for improving the strategies. While it is noteworthy that health
infrastructure is being improved and several health initiatives are implemented, ensuring that
health services are delivered to people is equally important. This is more so in case of
maternal and child health issues. Apart from improving the health care facilities and
recruiting healthcare personnel, it is also important to focus on the issues of the access and
utilization of healthcare services. The access and utilisation of services largely depends on the
certainty of availability of services (by way of availability of personnel and facilities) as well
as the reach of the services. The infrastructure like the good roads, availability of electricity,
running water and clean toilets becomes equally important in determining the access to
healthcare particularly maternal and child healthcare services.
People prefer to go to health centres where the availability of facilities and health personnel
are more certain. As the NRHM evaluation by the Planning Commission (2009) notes that
many 24X7 facilities fail to become effective because of poor access and fewer personnel and
facilities. The availability of connectivity (roads) results in villagers preferring well equipped
facilities with full complement of health officials even though they may be a little far way
compared to nearby single doctor PHCs or single nurse sub centres. A study by Kritika Goel
and Reetika (2015) indicated basic infrastructure of electricity; running water and clean
toilets were found only in 14 percent of PHCs in Bihar where as it was found in 71 percent of
PHCs in Rajasthan and 80 percent in Himachal Pradesh. The Draft National Health Policy
2015 points out that the 80 percent increase in the public health services (increase in
outpatient and inpatient services, institutional deliveries) were through 20 percent of public
health facilities which signifies the importance of positioning of the health facilities,
equipping them with adequate human resources, infrastructure and consumables in ensuring
of higher utilisation of public health services. The efforts by Rajasthan state in terms of
ensuring essential drugs for free and conducting essential medical investigations for free has
scaled up the utilisation of health services into manifold. The DANIDA intervention in Tamil
Nadu gave a big push for health information systems which resulted in the identification of
locale specific issues further leading to specific interventions. Tamil Nadu was successful in
positioning the PHCs and upgrading them in to CHCs based on need. Tamil Nadu made
significant strides in reducing MMR and IMR because of its ability to identify the critical
gaps which were unique in nature for certain areas, and tackle them in a comprehensive
manner. Tamil Nadu found shortage of anesthetists and provided training to regular doctors
on anesthesia. Staff nurse willing to work in rural areas were given additional incentive,
bonus as well as higher performance incentives. Investment in roads and transport helped to
ensure the target of reaching referral hospital within one hour in case of emergency.
The other important issue in improving the access to healthcare particularly the maternal and
child health is to understand the role of behavioral change communication (BCC) in ensuring
Page 69
Analysis of Health Expenditure in Three States
58 | P a g e
the maternal and child health services from public institutions. The efforts in early 20th
century in Tamil Nadu proved to be very helpful in changing the health seeking behaviour of
the people. Be it self-respect marriages or bangle ceremonies14
done by the PHCs have had
significant impact on the health seeking behaviour.
Pratilekha Chatterjee (2013) found that marriages among females below legal age varied
from 3.0 percent in Uttarakhand to 21.9 percent in Rajasthan. She found that in rural areas,
every 4th
marriage among females in Rajasthan and every 5th
in Bihar and Jharkhand took
place below the legal age. This early marriage resulted in early pregnancies, higher morbidity
and mortality rates. The study also pointed out need for integration of efforts and activities of
health, social and development sectors to tackle these issues in holistic manner.
As the NIPI report (2011) indicated, in the states of Bihar and Rajasthan, the process of child
bearing, birth and postpartum is seen as a normal process that does not require any
intervention from medical doctor or any medical facility unless there is an emergency.
Women have found it to be comfortable at home using services of a dai rather than having
deliveries at hospital. The NIPI report(2011) indicated that surveyed women in Rajasthan felt
that they would feel exposed to male doctors, nurses and ward boys in the healthcare facility
and also newborn babies would be vulnerable to nazar which is harmful to mother and child.
As a part of NIPI initiative, Yashoda was launched in Rajasthan (2 districts) and in Odisha (1
district) to ensure that the pregnant women feel safe, secure and confident in obtaining the
medical facilities at PHCs and follow up with post natal care which was successful in
changing the behavior of the pregnant women. Yashodas were positioned at health facilities
to be mother’s aides. As the NIPI initiative demonstrates, the solutions have to be location
specific and interventions should be informed of socio-cultural issues. A study in Jharkhand
revealed that the utilisation of Janani Suraksha Yojana was largely due to improvement in the
facilities at PHCs and availability of ANM /Trained Birth Assistant rather than the monetary
benefits. PRACHAR15
– an initiative in Bihar to provide health education to adolescents,
young couples had significantly impacted on increasing the marriage age of girls, decreasing
total fertility rates and spacing between births as well as the use of health services from the
public institutions.
An effort for provisioning of basic health infrastructure and facilities is only the first step
towards ensuring efficient public health services. Electricity supply and availability of
running water, clean environment at the health centre as well as provision of all weather
roads and availability of public transport play critical role in utilisation of public health
services. The investment in BCC and health education is critical for ensuring the increased
access and utilisation of maternal and child health services from public hospitals. This also
14
Bangles are given for pregnant women (in odd month) by holding a ceremony. PHCs conduct it in mass and also ensure the ante natal check- ups ( of late -food is also provided to pregnant woman during her visits to PHC) 15
Promoting Change in Reproductive Behavior of Adolescents- initiative of Pathfinder International (2001-2012)- http://www.pathfinder.org/publications-tools/pdfs/PRACHAR_Advancing_Young_Peoples_Sexual_and_Reproductive_Health_and_Rights_in_India.pdf
Page 70
Analysis of Health Expenditure in Three States
59 | P a g e
highlights the need for a multipronged approach with location specific interventions. As the
study by Pratilekha Chatterjee (2013) endorses, health outcomes are the result of good
governance in many sectors, not just healthcare. It is important to have inter-sectoral action
for health so that resources that are invested in the coming years yield proportionate benefits
The study on determinants of public expenditure on health in India by Shailender Hooda
(2015) indicated that fiscal capacity of state is critical and has a very positive effect in
increasing the public expenditure on health. Every one percent increase in fiscal capacity of
state would result in 0.13 percent increase in public expenditure on health. This also indicate
the importance of augmenting the resources of state which becomes crucial for enhancing the
health infrastructure both physical and human resource in a consistent manner.
7. Conclusions
The fiscal capacity of Tamil Nadu is more than that of Rajasthan and Bihar and therefore has
the higher potential to fund to the health needs of the state. This is also reflected in higher
capital expenditure incurred by Tamil Nadu as compared to the other two states for the period
2010-11 to 2013-14. The higher fiscal capacity and higher capital expenditure would help in
improvement of efficiency of revenue expenditure as well as the utilisation of funds from
GOI.
The share of health expenditure as a percent of total expenditure of the state was highest in
Rajasthan followed by Tamil Nadu and Bihar. The share of health expenditure as percent of
GSDP was 1 percent in Bihar and Rajasthan while it was 0.9 percent in Tamil Nadu. This
indicates the higher focus being given by the states of Rajasthan and Bihar towards health
sector. Given that the average total expenditure of Bihar and Rajasthan is at similar levels, the
health expenditure incurred by Rajasthan is relatively much higher than Bihar. The latest SRS
surveys indicate higher IMR, MMR and U5 MR (SRS 2013) in Rajasthan than Bihar which is
above the all India average. This justifies the need for higher expenditure on health.
The average annual health expenditure was highest in Tamil Nadu followed by Rajasthan and
Bihar. The health expenditure of Bihar was less than half of Tamil Nadu while the health
expenditure with NRHM funds was about 55 percent of health expenditure in Tamil Nadu.
The per capita expenditure was highest in Tamil Nadu followed by Rajasthan and Bihar. The
difference was three times between Bihar and Tamil Nadu. The per capita expenditure by
GOI funds was highest (owing to higher utilisation under SHS) in Rajasthan followed by
Tamil Nadu and Bihar. While all the three states spent more than releases by GOI on
infrastructure maintenance, the expenditure under SHS was highest in Rajasthan while Bihar
and TamilNadu had savings against releases to SHS.
The growth rates of allocation and expenditure under state health budget was highest in
Rajasthan while the growth rates of allocation and expenditure under SHS was highest in
Tamil Nadu. The utilisation was higher in Rajasthan (94 percent) than in Bihar (78 percent)
Page 71
Analysis of Health Expenditure in Three States
60 | P a g e
under state budget. Similar trend was observed in under SHS where in utilisation was 72
percent in Rajasthan and 59 percent in Bihar.
The NRHM expenditure was highest in both absolute terms (Rs. 1328 crore) and its share (47
percent) in total expenditure in Bihar, followed by Rajasthan and Tamil Nadu. The share of
NRHM decreased from 64 percent to 44 percent in Bihar, 36 percent to 26 percent in
Rajasthan while it increased from 17 percent to 21 percent in Tamil Nadu during the period
2010-11 to 2013-14. This also reflects the state health priorities which indicate that focus of
NRHM was large in Bihar while its focus was little less in Rajasthan and Tamil Nadu.
The share of State expenditure in total health expenditure of state increased from 64 percent
to 69 percent in Bihar, 68 percent to 81 percent in Rajasthan and 86-87 percent in Tamil
Nadu during the period 2010-11 to 2013-14. This indicates that the expenditure on health by
the state has increased significantly in Rajasthan while it had increased marginally in Bihar.
The share of HR expenses was highest in Rajasthan at 63 percent followed by Bihar at 58
percent and Tamil Nadu (53 percent). The share of contractual payments under HR
expenditure was highest in Bihar at 20 percent followed by Rajasthan (8 percent) and Tamil
Nadu (4 percent). This also reflects upon the availability of health personnel in terms of
permanent staff. Similar trend was found in the HR expenditure under State Health Society.
The share of Conditional Cash Transfers (CCT) expenses was highest in Bihar (34 percent of
SHS expenses) followed by Rajasthan (23 percent) and Tamil Nadu (10 percent). This also
reflects higher focus of the expenditure on Maternal and Child health (institutional deliveries
and sterilizations) in Bihar. The CCT by way of a state scheme in Tamil Nadu
(Muthulakshmi Reddy scheme) during the year 2011-12 was Rs 390 crore while the
expenditure under SHS was Rs. 413 crore.
The utilisation under RCH, MCH and CH was 74 percent, 85 percent and 56 percent
respectively in Rajasthan while it was 68 percent, 73 percent and 34 percent in Bihar
respectively. The lower utilizations under MCH and CH especially in Bihar highlight the
complementary nature of the program expenses which are dependent on the availability of
personnel and health facilities. The utilisation under the child health components was 34
percent in Bihar while it was 56 percent in Rajasthan.
8. Recommendations
a. Public investments are critical and are the first step in improving healthcare system
especially in rural areas or where the concentration of poor population is higher. This is
critical to ensure the demand side financing (such as JSY) to work effectively.
b. State level planning based on assessment of health sector needs and fixing of targets at
district level is important for realistic allocation of funds and their utilisation.
Page 72
Analysis of Health Expenditure in Three States
61 | P a g e
c. USAID defines health systems strengthening as ‘a process that concentrates on
ensuring that people and institutions, both public and private, undertake core functions
of the health system (i.e. 1. governance, 2. financing, 3. service delivery, 4. health
workforce, 5. information, and 6. medicines/vaccines/other technologies) in a
mutually enhancing way, to improve health outcomes, protect citizens from
catastrophic financial loss and impoverishment due to illness, and ensure consumer
satisfaction, in an equitable, efficient and sustainable manner.’ Investing on
strengthening of health systems as in Tamil Nadu is an important step towards
ensuring the improved healthcare services especially for poor and marginalized
sections. System strengthening includes financial management which becomes critical
in planning and utilisation of funds.
d. The Muthulakshmi Reddy scheme in Tamil Nadu is operated entirely online with no
scope for corruption and facilitates accurate accounting. The process of this scheme could
be emulated.
Page 73
Analysis of Health Expenditure in Three States
62 | P a g e
e. Increasing the facilities at health centres like the free medicines/free testing in Rajasthan
would not only help in early detection of health problems of poor but also encourages the
demand and use of public facilities. The ASHASoft implementation for ensuring
transparent and regular payment of incentives to ASHA has been a model worth
emulation by other states.
f. Tamil Nadu strategically upgraded selected PHCs into CHCs based on the assessment of
need instead of uniform upgradation of block level PHCs which paid off well. Similarly
recruitment strategies for hilly areas and other areas which needed higher attention were
different from rest of the areas. The personnel were provided with additional incentives,
more training were provided to deal with the emergencies.
g. Investing on behavioural change communication (BCC) through community oriented
programmes which were followed up by VHN yielded good results in Tamil Nadu.
Initiatives like providing food for the attendant along with pregnant woman who had
turned up for ANC has been welcomed very well.
Page 74
Analysis of Health Expenditure in Three States
63 | P a g e
h. Focusing on the integrated approach for health sector is the need of the hour. Better roads,
public transport, hygienic conditions at health centres by way of proper maintenance,
availability of running water and electricity along with the availability of health
personnel, equipments and medicines can be more productive (DNHP indicates that 80
percent of increased services provided by 20 percent of the utilities) than provision of
health centres by population norms with little efforts to increase utilisation of services.
______________________
Page 75
Analysis of Health Expenditure in Three States
64 | P a g e
Bibliography
Ministry of Health and Family Welfare (2005), National Rural Health Mission 2005- 2012, New
Delhi: Ministry of Health & Family Welfare.
Ministry of Health and Family Welfare (2007), NRHM Common Review Mission, Ministry of
Health & Family Welfare, Government of India, New Delhi.
National Commission on Macroeconomics and Health (NCMH), (2004), Ministry of Health and
Family Welfare, Government of India, http://mohfw.nic.in
Duggal, R. (2009), Sinking Flagships and Health Budgets in India, Economic and Political Weekly,
Vol. XLIV, No. 33.
National Health Mission: Framework of Implementation (2012-2017) Ministry of Health and Family
Welfare, Government of India, http://mohfw.nic.in
Choudhary Mita, (2014) Universal health coverage in India: Policy Priorities for Central Government,
NIPFP working paper
HLEG, 2011. High Level Expert Group Report on Universal Health Coverage for India, Report
submitted to the Planning Commission of India, New Delhi
Chatterjee, P (2013), India’s Healthcare: Building on Gains, Facing Challenges, ORF seminar series
Volume 1(12).
Diane Coffey, A. C. (Vol XLIX,No 15). Wealth and Health of Children in India. Economic and
Political Weekly , 64-70.
Duggal, R. (Vol XLVII,No35,2012). Challenges in Financing Healthcare. Economic and Political
Weekly , 22-23.
Husain, Z. (Vol XLVI,No 4,2011). Health of National Rural Health Mission. Economic and Political
Weekly , 53-60.
Indrani Gupta, S. C. (Vol XLIX,No 35, 2014). Public Financing for Health Coverage in India.
Economic and Political Weekly , 59-63.
Kritika Goel, R. K. (VoL L, No 21, 2015). Public Helath Facilities in North India. Economic and
Political Weekly , 53-58.
Mohan Rao, P. G. (Vol L ,No 17, 2015). Draft National Health Policy 2015,A public Health Analysis.
Economic and Political Weekly , 94-101.
Rajivlochan, M. (Vol L, No1, 2015). Improving Healthcare services at Reduced Prices. Economic and
Political Weekly , 32-36.
Sharma, V. (Vol L No18, 2015). Are BIMARU states still Bimaru? Economic and Political weekly ,
58-63.
Timothy Powell-Jackson, A. A. (vol XLVIII,No 19, 2013). An Assessment of the Quality of Primary
Health Care in India. Economic and Political Weekly , 53-61.
Report on working group of 12th
five year plan (2011) Ministry of Health and Family
Welfare, Government of India.
Page 76
Analysis of Health Expenditure in Three States
65 | P a g e
Annexure 1: Field Visits to Bihar, Rajasthan and Tamil Nadu
Place Dates Offices visited
Patna,
Bihar
June 14-19,
2015
Department of Finance,
Department of Health and Family Welfare,
State Health Society, Bihar
Jaipur,
Rajasthan
June 9-13,
2015
Department of Finance, State Health Society, Rajasthan and Treasury
department, Government of Rajasthan
Chennai,
TamilNadu
August 28-30,
2015
Department of Finance, Government of TamilNadu, State Health
Society, TamilNadu
Page 77
Analysis of Health Expenditure in Three States
66 | P a g e
Annexure 2 Basic Demographic characteristics of Sample States
Particulars Tamil
Nadu Bihar Rajasthan
Area (sq Km) 130058 94163 342239
Population 72138958 104099452 68548437
Population density per sq Km 555 1106 200
Decadal growth rate (2001-2011) in percent 15.6 25.4 21.3
SC percent 20.01 15.9 17.9
ST percent 14.21 1.3 13.5 Percent BPL population (2011-12)
(Tendulkar committee) 11.28 33.74 14.71
Literacy rate (percent)_ 80.33 63.82 67.06
Male literacy rate (percent)_ 86.81 73.39 80.51
female literacy rate (percent)_ 73.86 53.33 52.66
Work participation rate Total (percent)_ 45.6 33.4 43.6
Male WPR (percent)_ 59.3 46.5 51.5
Female WPR (percent)_ 31.8 19.1 35.1 Percent Households with access to Lighting
(electricity) 93.4 16.4 67 Percent Households with access to drinking
water (tap/tube well/hand pump) 92.5 94 78.1 Percent Households with access to Tap water
(treated) 55.8 3.1 32
Percent Households with access to latrine 48.3 23.1 35
Percent Households with sewer connections 14.4 1.8 7.2
Banking services 52.5 44.4 68
clean cooking fuel (LPG/Bio Gas/electricity) 48.3 8.5 22.9
GSDP 2013-14 (2004-05 prices) crore 480618 174734 244997
Primary 37297 33015 49658
Secondary 137159 32106 69933
Tertiary 306162 109613 125406
Per capita income (2013-14) Rs. 58360 14904 29244
Page 78
Analysis of Health Expenditure in Three States
67 | P a g e
Annexure 3: Status of Health Indicators in Sample States
Health Indicators Tamil Nadu Bihar Rajasthan All India
Sex ratio 995 918 928 943
CBR (SRS 2013) 15.6 27.6 25.6 21.4
CDR ( SRS 2013) 7.3 6.6 6.5 7 percent live births receiving medical attention at delivery
2011 92.4 41.4 76.6 66.6
IMR (SRS 2013) 21 42 47 40
MMR ( SRS 2011-13) 79 208 244 167
TFR (SRS 2012) 1.7 3.5 2.9 2.4
Neo Natal Mortality (SRS 2012) 15 28 35 29
U5MR (SRS 2012) 24 57 59 52
Mothers who had ANC in Ist trimester 92.28 49.48 56.25 59.2
Mothers who had 3 or more ANC 99.71 59.98 71.69 73.96
percent children underweight (0-3 years) NFHS3 25.9 55 36.9 40.4
percent fully immunized (NFHS 3) 80.9 32.8 26.5 43.5
percent institutional Deliveries (NFHS3) 90.4 22 32.2 40.7
percent Home deliveries (HMIS 2014-15) 0.11 21.81 5.25 10.81
No of DH 31 36 34 755
No of PHC 1369 1883 2082 25020
No of CHC 385 70 567 5363
No. of Sub centres 8706 9729 14407 152326
24X7 facilities 1850 907 1659 16834
No. of ASHA 3905 84860 52173 901895
VHSNC 15064 8316 43440 512417
No of Sick Newborn Care Unit (SNCU) 64 12 36 548
No. of New Born Stabilization Unit (NBSU) 156 22 113 1810
No. Of New Born Care Corner(NBCC) 1764 496 1003 14135 Children under 3 years breastfed within one hour of Birth
(percent) 77.5 16.2 41.9 40.2
Children 0-5 months age exclusively breastfed ( percent) 64 38.4 65.5 46.4
No of Districts IMNCI implemented 31 38 33 592
Page 79
Analysis of Health Expenditure in Three States
68 | P a g e
Annexure 4: Physical Outcomes: Targets & Achievements under NRHM
Physical Outcomes : Targets & Achievements under NRHM
Sl. No. Targets (2005-12) Achievements (up to 2012)
1 IMR reduced to 30/1000 live births IMR reduced from 58 in 2005 (SRS) to 42 in
2012 (SRS).
2 Maternal Mortality to reduce to
100/100,000 live births MMR reduced from 254 in 2004-06 (SRS) to
178 in 2010-12 (SRS).
3 TFR reduced to 2.1 TFR reduced from 2.9 in 2005 (SRS) to 2.4
in 2012 (SRS).
4 Malaria Mortality reduction to 60% 70% Malaria mortality reduction- (Reduced
from 1707 in 2006 to 519 in 2012).
5 Kala Azar Mortality reduction to
100% 85% Kala Azar mortality reduction-
(Reduced from 187 in 2006 to 29 in 2012).
6 Filaria / Microfilaria Reduction Rate
to 80% 60% Filaria / Microfilaria Reduction
(Reduced from 1.02 in 2005 to 0.41 in 2012)
7 Dengue Mortality reduction by 50% 8% reduction- Dengue Mortality has reduced
from 184 in 2006 to 169 in 2011.
8 Cataract operations- increasing to 46
lakhs per year Cataract operations of more than 63.49 lakhs
per year have been reported in 2012.
9 Leprosy Prevalence Rate reduction
to less than 1 per 10,000
Leprosy Prevalence Rate reduced from 1.34
per 10,000 in 2005 to 0.68 per 10,000 in
2012.
10 Tuberculosis Control - over 70%
case detection & 85% cure rate Tuberculosis is having 71% case detection
and 88% Cure rate in 2012.
Page 80
Analysis of Health Expenditure in Three States
69 | P a g e
Annexure 5: Achievements during XII Plan
Physical Outcomes: Targets & Achievements for NHM/12
th FY Plan
Sl.
No. Targets (2012-17) Achievements
1 Reduce IMR to 25/1000 live births IMR reduced from 42 in 2012 (SRS)
to 40 in 2013 (SRS).
2 Reduce MMR to 1/1000 live births MMR has reduced to 167 in 2011-13
(SRS). 3 Reduce TFR to 2.1 TFR has reduced to 2.3 in 2013 (SRS).
4 Reduce annual incidence and mortality
from Tuberculosis by half
Tuberculosis is having 171 incidence
(per lakh population) and 19 mortality
(per lakh population) in 2013.
5 Reduce prevalence of Leprosy to <1/10000
population and incidence to zero in all
districts
Leprosy Prevalence Rate is < 1/
10,000 population
6 Annual Malaria Incidence to be <1/1000 Annual Malaria Incidence is <1/1000
7 Less than 1% microfilaria prevalence in all
districts Out of 255 districts, 222 have reported
mf rate of less than 1%
8 Kala-Azar Elimination by 2015, <1 case
per 10000 population in all blocks Out of 611 block PHCs, 454 have
reported < 1 case per 10000
Page 81
Analysis of Health Expenditure in Three States
70 | P a g e
Annexure 6: Tables
Table 1: Total Expenditure of the State (Bihar) Rs. in Crore
Expenditure 2010-11 2011-12 2012-13 2013-14 Average
Revenue 38215.91 46499.49 54466.15 62477.24 50415
Capital 12488.61 13681.94 14740.42 17927.94 14710
Total 50704.52 60181.43 69206.57 80405.18 65124
Table 2: Total Expenditure of the State (Rajasthan) Rs. in Crore
Expenditure 2010-11 2011-12 2012-13 2013-14 Average
Revenue 44873 53654 63462 75510 59375
Capital 5513 8228 13095 14476 10328
Total 50386 61882 76557 89986 69703
Table 3: Total Expenditure of the State (Tamil Nadu) Rs. in Crore
Expenditure 2010-11 2011-12 2012-13 2013-14 Average
Revenue 72916 83838 97067 109825 90912
Capital 14726 21819 19337 19415 18824
Total 87642 105657 116404 129240 109736
Table 4: Share of health expenditure in total expenditure( percent)
Expenditure Bihar Rajasthan Tamil Nadu
Total Health Expenditure 2191 3658 5033
Total Health Expenditure with NRHM(SHS) 2848 4249 5390
Total Expenditure of State 65124 69703 109736
Percent of Total Exp 3.4 5.2 4.6
Percent of Total Exp 4.4 6.1 4.9
Table 5: Share of health expenditure in GSDP ( percent)
Expenditure Bihar Rajasthan Tamil Nadu
Total Health Expenditure 2191 3658 5033
Total Health Expenditure with NRHM(SHS) 2848 4249 5390
Total GSDP of State 271508 428668 712230
Percent of Total Exp 0.8 0.9 0.7
Percent of Total Exp 1.0 1.0 0.8
Page 82
Analysis of Health Expenditure in Three States
71 | P a g e
Table 6: Per capita health expenditure under NRHM and Non –NRHM
Health Expenditure Bihar Rajasthan Tamil Nadu
Non NRHM 145 446 607
NRHM 127 172 138
Total 273 618 745
Table 7: Average Annual Release and Expenditure under NRHM (Rs. In crore)
State SHS State budget
Bihar REL 1020 203
EXP 931 398
Rajasthan REL 831 313
EXP 832 354
Tamil Nadu REL 721 317
EXP 580 419
Page 83
Analysis of Health Budget of Three States
72 | P a g e
Table 4. Allocation and Expenditure under Child Health Components in Bihar (SHS) Rs. in Lakhs
CHILD HEALTH 2010-11 2011-12 2012-13 2013-14 Total % Utilisation
Allocation Expend Allocation Expend Allocation Expend Allocation Expend Allocation Expend
IMNCI 36.00 6.51 543.01 63.56 13.00 7.59 15.00 0.00 607.01 77.66 12.79
Facility Based Newborn Care (FBNC, SNCU,
NBSU, NBCC)
40.00 64.67 310.00 21.37 734.80 154.52
4108.69 2257.02 5193.49 2497.58 48.09
Home Based Newborn Care 0.61 0.69 0.00 24.57 0.00 25.87
School Health Programme 1274.56 602.82 1756.28 191.90 4376.53 47.50 0.00 155.11 7407.37 997.33 13.46
Infant and Young Child Feeding (IYCF) 0.00 0.63 0.00 0.63
Care of Sick Children and Severe Malnutrition
(NRC, SDNC)
774.90 21.54 16.58 1903.73 959.71
1887.44 1167.88 4566.07 2165.71 47.43
Management of Diarrhea, ARI and
micronutrient malnutrition
114.62 19.91 1388.85 451.96 100.74 60.61
1205.11 912.84 2809.32 1445.32 51.45
Other Strategies / Activities 0.52 5.01 3220.43 1.76 394.34 -3.52 3614.77 3.77 0.10
Infant Death Audit 0.00 0.00 0.00 0.00
Incentive to ASHA under child health 221.72 1875.79 192.91 0.00 2.62 1875.79 417.25 22.24
JSSK for sick neonates up to 30 days 36.00 1.37 0.00 114.21 36.00 115.58 321.05
Child Health Training 1706.60 1055.00 2,207.03 1,105.05 2160.32 375.11 0.00 234.10 6073.95 2769.26 45.59
Routine Immunization 2470.81 983.76
341.72 0.00 119.27 2470.81 1444.75 58.47
Procurement of Drugs for School Health (IFA,
Medicines -- under Procurement)
847.77 110.10
847.77 110.10 12.99
Drugs and Consumables (Other than those
reflected in Procurement)
500.00 18.62
500.00 18.62 3.72
Total 6417.49 2976.45 7552.94 1984.76 14421.34 2143.49 7610.59 4984.72 36002.36 12089.42 33.58
Utilisation ( percent) 46.38 26.28 14.86 65.50 33.58
Page 84
Analysis of Health Budget of Three States
73 | P a g e
Table 5: Allocation and Expenditure under Maternal Health Components in Bihar (SHS) Rs. in Lakhs
2010-11 2011-12 2012-13 2013-14 Total
Allocation Expenditure Allocation Expenditure Allocation Expenditure Allocation Expenditure Allocation Expenditure
MATERNAL HEALTH 0.00 0.00
Operationalise Facilities (Only
Dissemination, Monitoring, and
Quality)
267.12 46.14 209.36 34.97 293.08 91.59
809.35296 674.72081 1578.91 847.42
Integrated Outreach RCH
Services
218.43 34.42 560.52 80.77 323.10 126.07
177.49 99.45856 1279.54 340.72
Janani Suraksha Yojana / JSY ####### 24185.09 26352.86 24502.84 45189.02 35570.31
38777.9566 31514.2906 140796.80 ########
Other Strategies/Activities 70.00 0.15 100.00 9.33 4035.04 549.84
146.4625 73.6837 4351.50 633.00
Maternal Health Training 627.72 182.64 657.17 275.05 769.24 346.25
734.63772 333.18954 2788.77 1137.13
Procurement of Equipment 104.33 393.93 1018.86 154.87 1187.82 274.42
41.712 2.24835 2352.72 825.47
Drugs & Supplies for MH:- 876.39 288.21 829.78 93.33 332.58 87.33 105.96964 0.6579 2144.72 469.53
JSSK 23925.5012 11218.3922 23925.50 11218.39
####### 25130.58 29728.55 25151.16 52129.88 37045.81 64719.08 43916.64 179218.46 ########
Total ( Rs in crore) 326.41 251.31 297.29 251.51 521.30 370.46 647.19 439.17 1792.18 1312.44
Utilisation ( percent) 76.99 84.60 71.06 67.86 73.23
Page 85
Analysis of Health Budget of Three States
74 | P a g e
Table 6. Allocation and Expenditure under Child Health Components in Rajasthan (SHS) Rs. in Lakhs
Child Health Components 2010-11 2011-12 2012-13 2013-14 ALL
Allocation Expend Allocation Expend Allocation Expend Allocation Expend Allocation Expend
IMNCI 0 0.08 0.08 0.00
Facility Based Newborn Care (FBNC,
SNCU, NBSU, NBCC) 1.15 0.65 1.37 0.68 1.46 1.05 3.71 1.20 7.69 3.58
Home Based Newborn Care 0.00 0.41 0.40 0.41 0.40
School Health Programme 2.02 0.43 2.02 0.43
Infant and Young Child Feeding (IYCF) 5.35 1.34 0.40 0.00 5.75 1.34
Care of Sick Children and Severe
Malnutrition (NRC, SDNC) 0.94 0.32 0.95 0.61 3.94 1.00 3.28 1.45 9.12 3.38
Management of Diarrhoea, ARI and
micronutrient malnutrition 0.10 0.01 0.10 0.01
Other Strategies / Activities 0.20 0.17 2.15 1.57 0.27 0.17 2.63 1.91
Infant Death Audit 0.10 0.00 0.10 0.04 0.15 0.02 0.35 0.06
Incentive to ASHA under child health 20.50 1.86 0.00 0.09 20.50 1.95
JSSK for sick neonates upto 30 days 5.61 2.16 10.45 5.68 16.06 7.84
Child Health Training 6.07 5.11 5.71 3.40 2.01 0.36 0.74 0.09 14.53 8.96
Routine Immunisation 40.94 22.68 26.19 22.62 60.51 40.94 57.46 37.34 185.10 123.57
Procurement of Drugs for School Health
(IFA, Medicines -- under Procurement) 2.54 1.60 2.54 1.60
Drugs and Consumerables (Other than
those reflected in Procurement) 10.46 0.99 10.46 0.99
56.57 30.55 47.61 30.08 96.68 49.37 76.46 46.03 277.33 156.03
Utilisation ( percent) 54.00 63.17 51.07 60.20 56.26
Page 86
Analysis of Health Budget of Three States
75 | P a g e
Table7. Allocation and Expenditure under Maternal Health Components in Rajasthan (SHS) Rs. in Lakh
2010-11 2011-12 2012-13 2013-14 Total
Allocation Expenditure Allocation Expenditure Allocation Expenditure Allocation Expenditure Allocation Expenditure
Operationalise facilities (only
dissemination, monitoring, and quality) 0.75 0.07 0.03 0.02 0.17 0.03 0.00 0.01 0.95 0.13
Referral Transport 1.50 0.34 0.00 0.00 0.00 0.00
0.04 0.38
Integrated outreach RCH services 1.69 0.98 0.48 0.37 0.00 0.00
0.00 1.35
Janani Suraksha Yojana / JSY 143.00 180.13 184.06 158.79 181.42 161.81 216.74 179.82 725.22 680.55
Maternal Dealth Audit 0.68 0.10 0.00 0.00 0.31 0.13 0.40 0.18 1.39 0.42
Other Activities 0.00 0.00 0.57 0.49 0.00 0.00 0.10 0.00 0.67 0.49
JSSK for pregnant women 0.00 0.00 52.01 36.22 141.89 95.42 127.44 90.64 321.34 222.29
Maternal Health Training 6.98 3.33 4.18 2.09 3.04 0.65 2.39 3.00 16.60 9.06
Total 154.60 184.95 241.34 197.98 326.82 258.04 347.07 273.69 1069.84 914.67
Utilisation ( percent) 119.63 82.03 78.95 78.86 85.50
Page 87
Analysis of Health Budget of Three States
76 | P a g e
Table 8: Expenditure under Child Health Components in Tamil Nadu (SHS) Rs. in Lakhs
Child Health 2010-11 2011-12 2012-13 2013-14
IMNCI
Facility Based Newborn Care (FBNC, SNCU, NBSU, NBCC) 404.15 197.8
Home Based Newborn Care
School Health Programme
Infant and Young Child Feeding (IYCF)
Care of Sick Children and Severe Malnutrition (NRC, SDNC)
Management of Diarrhea, ARI and micronutrient malnutrition
Other Strategies / Activities 5.81 7.92
Infant Death Audit 3.52 5.68
Incentive to ASHA under child health 0.55 3.55 0.13
JSSK for sick neonates up to 30 days 10.35 370.42
Child Health Training 227.46 474.29 279.99
Routine Immunization 1003.95 769.96 1667.78
Procurement of Drugs for School Health (IFA, Medicines --
under Procurement)
Drugs and Consumables (Other than those reflected in
Procurement)
1237.22 1244.8 2369.34 581.95
Child Health ( Rs in Crore) 12.4 12.4 23.7 5.8
Page 88
Analysis of Health Budget of Three States
77 | P a g e
Table 9: Expenditure under Maternal Health Components in Tamil Nadu (SHS) Rs. in Lakhs
Maternal Health 2010-11 2011-12 2012-13 2013-14
Operationalise facilities (only dissemination, monitoring,
and quality) 2.02 1139.49
Referral Transport
Integrated outreach RCH services 4.14 0.54 1.15
Janani Suraksha Yojana / JSY 3561.94 2529.98 2946.16 3594.26
Maternal Death Audit 1.19 88.89
Other Activities 371.56 61.37 13.47
JSSK for pregnant women 7743.06 8025.46
Maternal Health Training 525.74 628.9 155.11 286.64
BCC 8.63 68.27
procurement of equipment 1617.78 985.04
Drugs and supplies 125.31 95.14 123.87
5839.4 3697.99 10909.45 14258.27
Maternal Health ( Rs. in Crore) 58.39 36.98 109.09 142.58