THE ENUMERATION OF GIARDIA IN DRINKING WATER Contract Number: DWI 70/2/155 FINAL REPORT DECEMBER 2003 Severn Trent Laboratories Limited 2 Technology Drive Bridgend Science Park Bridgend CF 31 3NA United Kingdom Tel: 01656 647557 Fax: 01656 646525
3.1 Phase 1: Investigation of the possibility of identifying and enumerating Giardia cysts on slides prepared for Regulatory Cryptosporidium analysis ....................................................................... 17
3.1.1 Preparation and enumeration of stock suspensions: Source of Cryptospridium oocysts/Giardia cysts................................................ 17 3.1.2 Experimental rig ........................................................................... 18 3.1.3 Inter-run cleaning regime ............................................................ 19 3.1.4 Quality Control Procedures......................................................... 19 3.1.5 Identification of Cryptosporidium oocysts and Giardia cysts.. 20 3.1.6 Generation of recovery data........................................................ 20
3.2 Phase 2: Evaluation of the recovery performance for FiltaMaxTM and EnvirochekTM filters in terms of co-isolation of Cryptosporidium oocysts/Giardia cysts .............................................................................. 21
3.2.1 Preparation of stock suspensions: Source of Cryptosporidium oocysts/Giardia cysts ........................................................................... 21 3.2.2 Experimental rig ........................................................................... 21 3.2.3 Identification of Cryptosporidium oocysts and Giardia cysts.. 21 3.2.4 Generation of recovery data........................................................ 21
3.3 Phase 4: Field Trials: Evaluation of the recovery performance for FiltaMaxTM and EnvirochekTM filters in terms of co-isolation of Cryptosporidium oocysts/Giardia cysts at five Water Treatment Works (WTW)........................................................................................................ 22
3.3.1 Preparation of stock suspensions: Source of Cryptosporidium oocysts/Giardia cysts. .......................................................................... 22 3.3.2 Field Trials sites ........................................................................... 22 3.3.3 Experimental rig ........................................................................... 23 3.3.4 Identification of Cryptosporidium oocysts and Giardia cysts.. 23 3.3.5 Generation of recovery data........................................................ 24
4.1 Phases 1 and 2: Laboratory trials ..................................................... 33
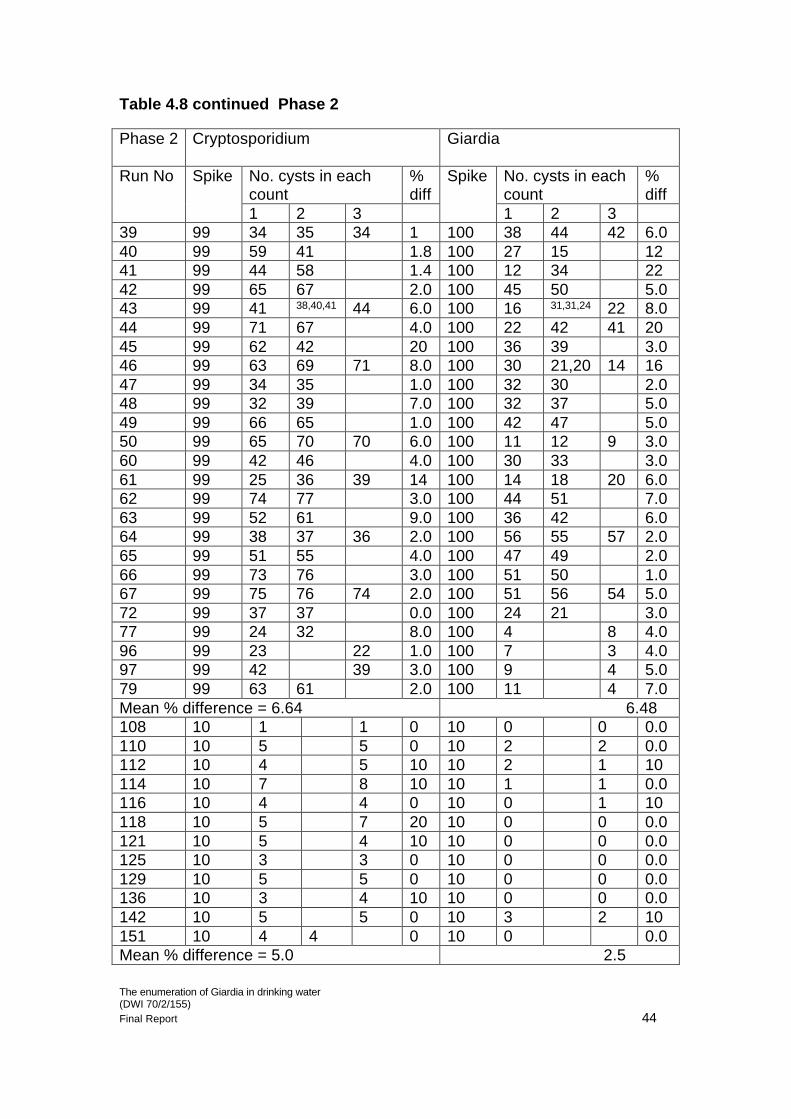
4.1.1 Phase 1: Investigation of the possibility of identifying and enumerating Giardia cysts on slides prepared for Regulatory analysis 1000 oocyst/cyst spike .......................................................... 33 4.1.2 Phase 2 100 oocyst/cyst spike .................................................... 33 4.1.3 Phase 2: 10 oocyst/cyst spike..................................................... 34
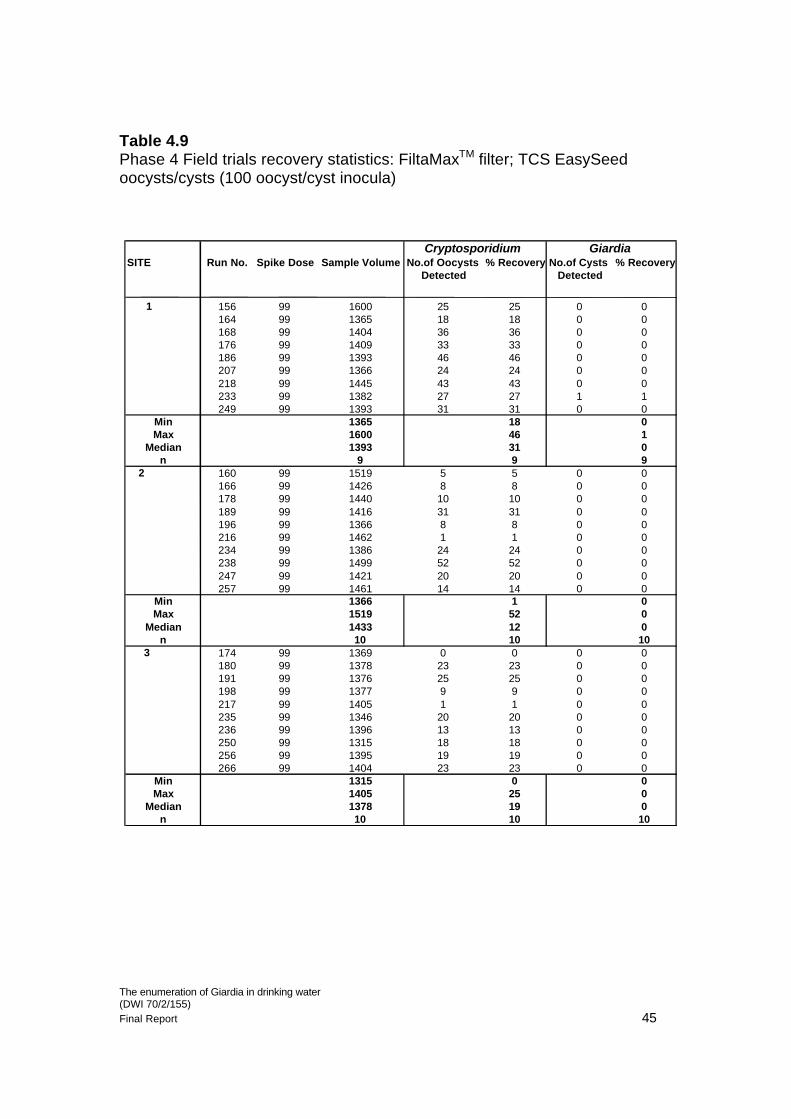
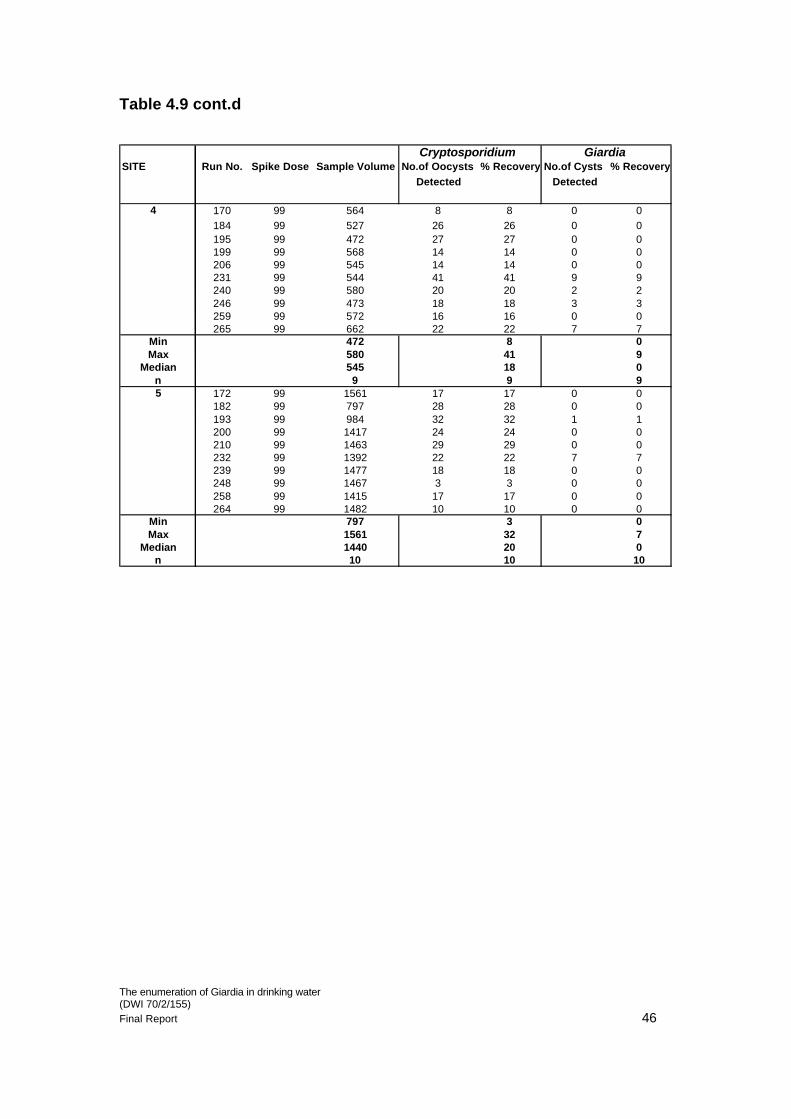
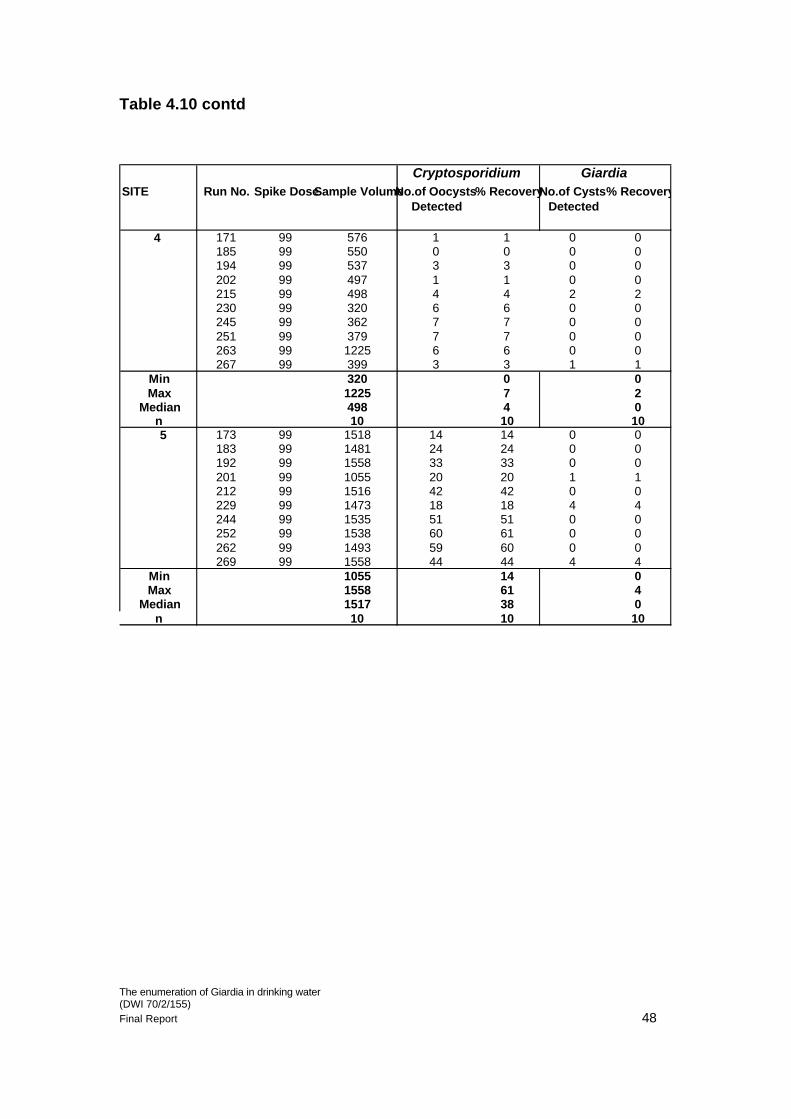
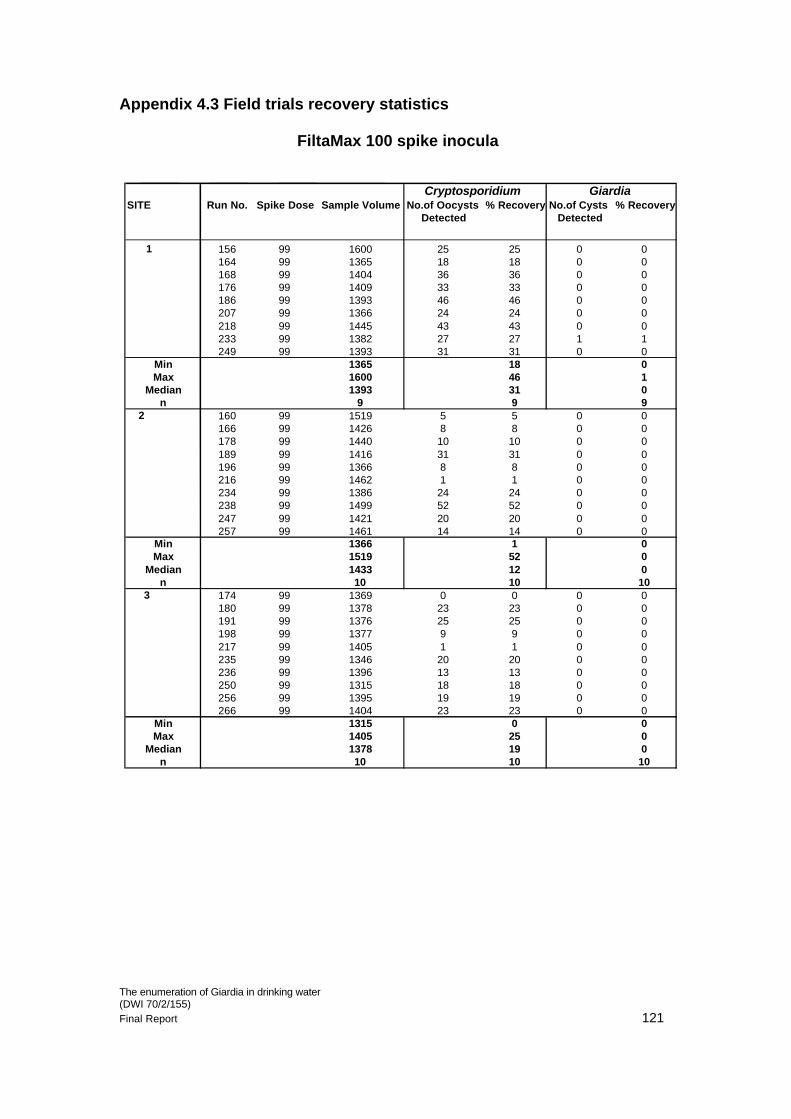
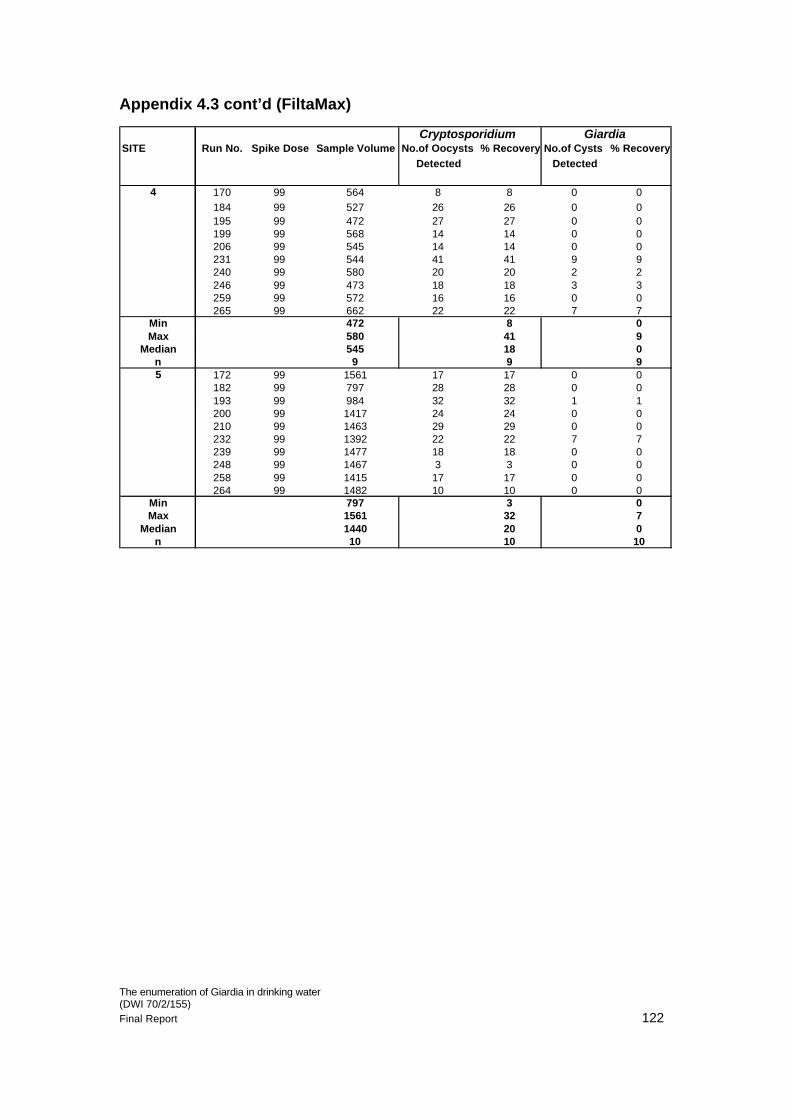
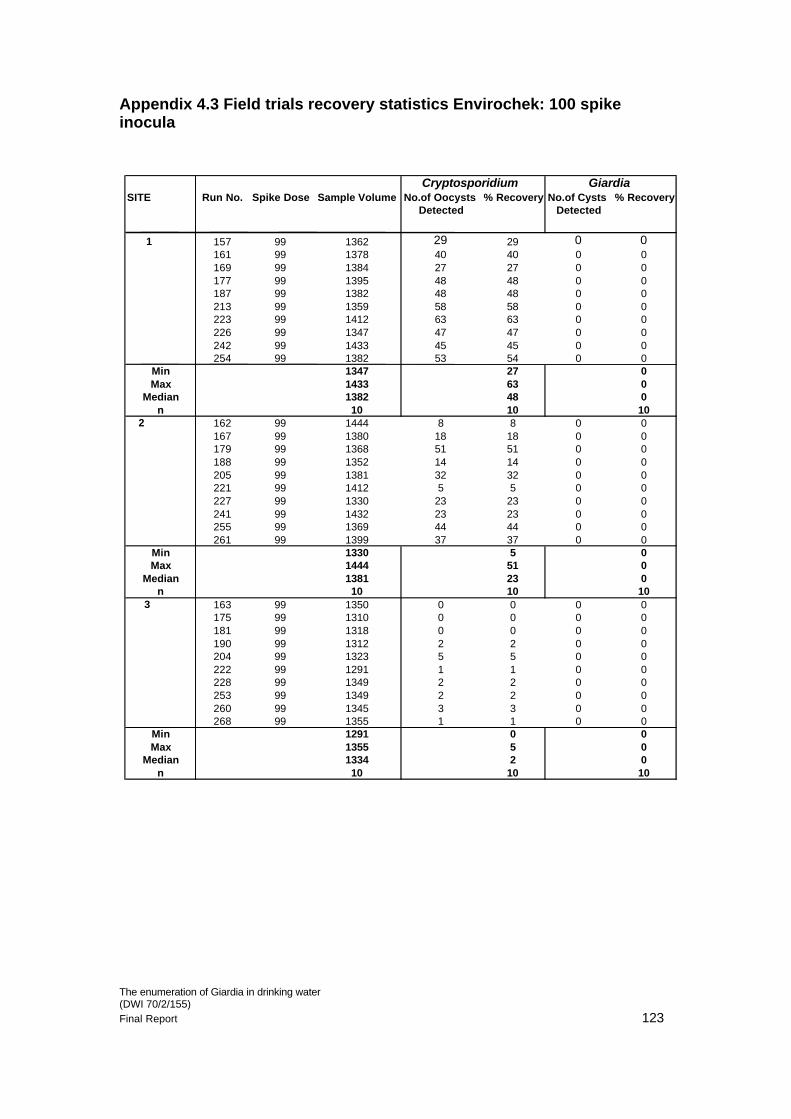
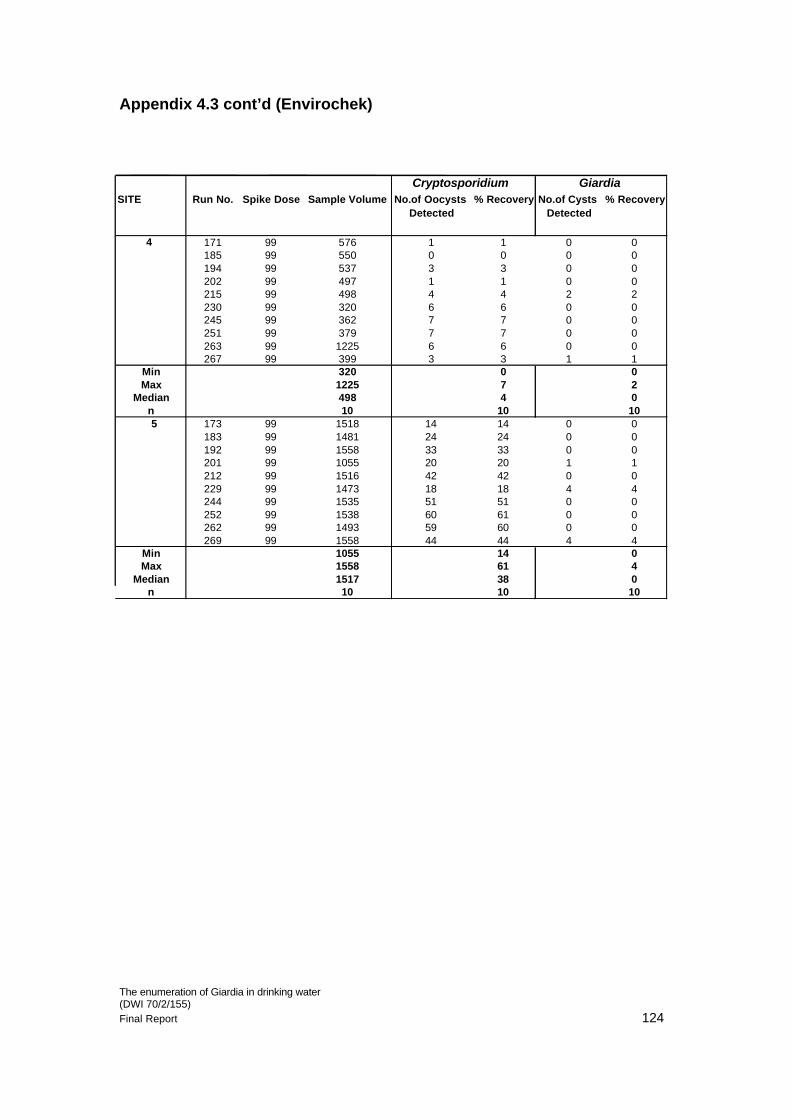
4.2 Phase 4 Field Trials: Evaluation of the recovery performance for FiltaMaxTM and EnvirochekTM filters in terms of co-isolation of Cryptosporidium oocysts/Giardia cysts at five Water Treatment Works................................................................................................................... 34
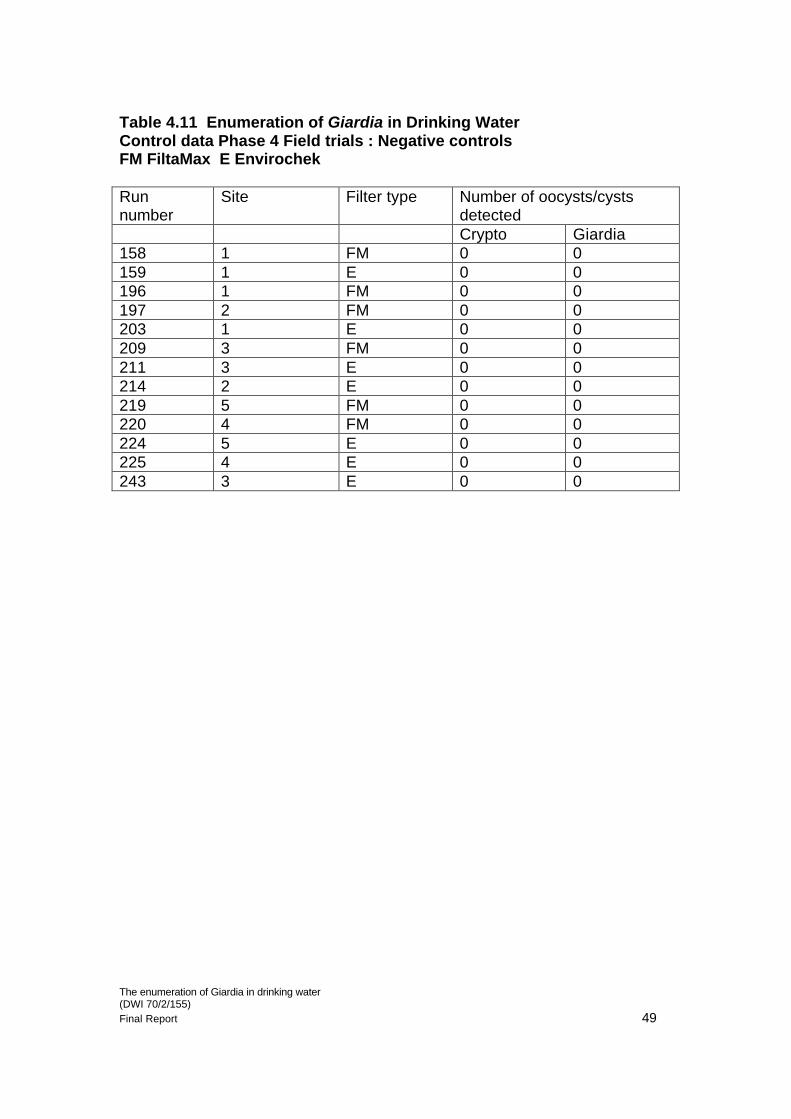
4.3 Negative controls/Cryptosporidium only spikes ............................ 35
5 CONCLUSIONS AND DISCUSSION........................................................ 52
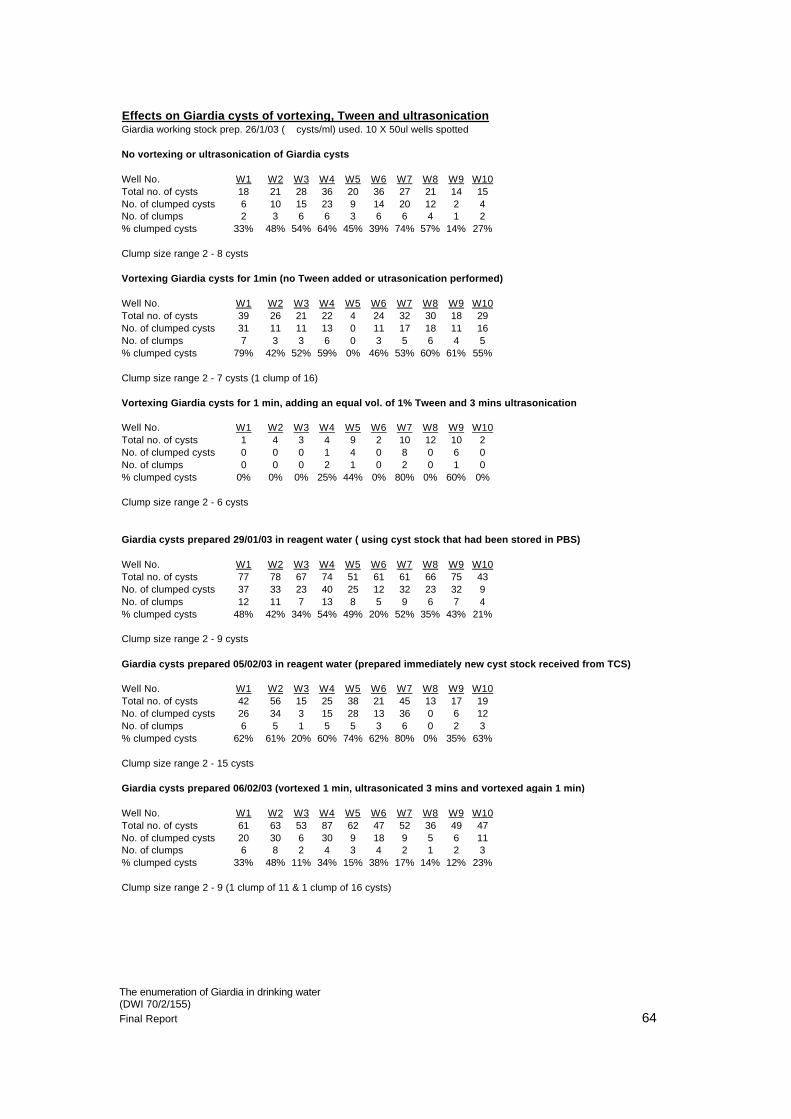
Appendix 1.1. Investigation to identify a procedure for the disaggregation of Giardia cyst clumps Table Appendix 1.1 Phase 1: Effect of disaggregation procedures on the incidence and size of Giardia clumps .............................................. 60 Plate Appendix 1.1 Microscopic appearance of typical Giardia clump containing more than 12 cysts................................................................ 65 Appendix 1.2 Information supplied by J. Clancy et al........................... 66
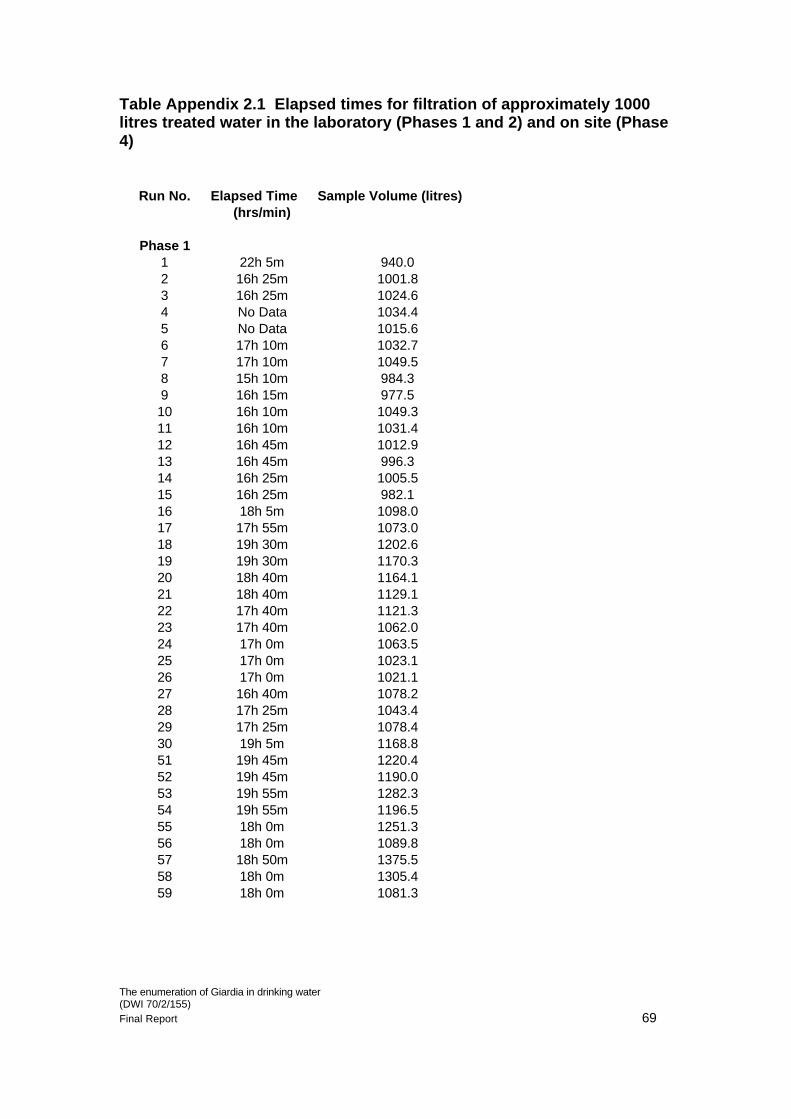
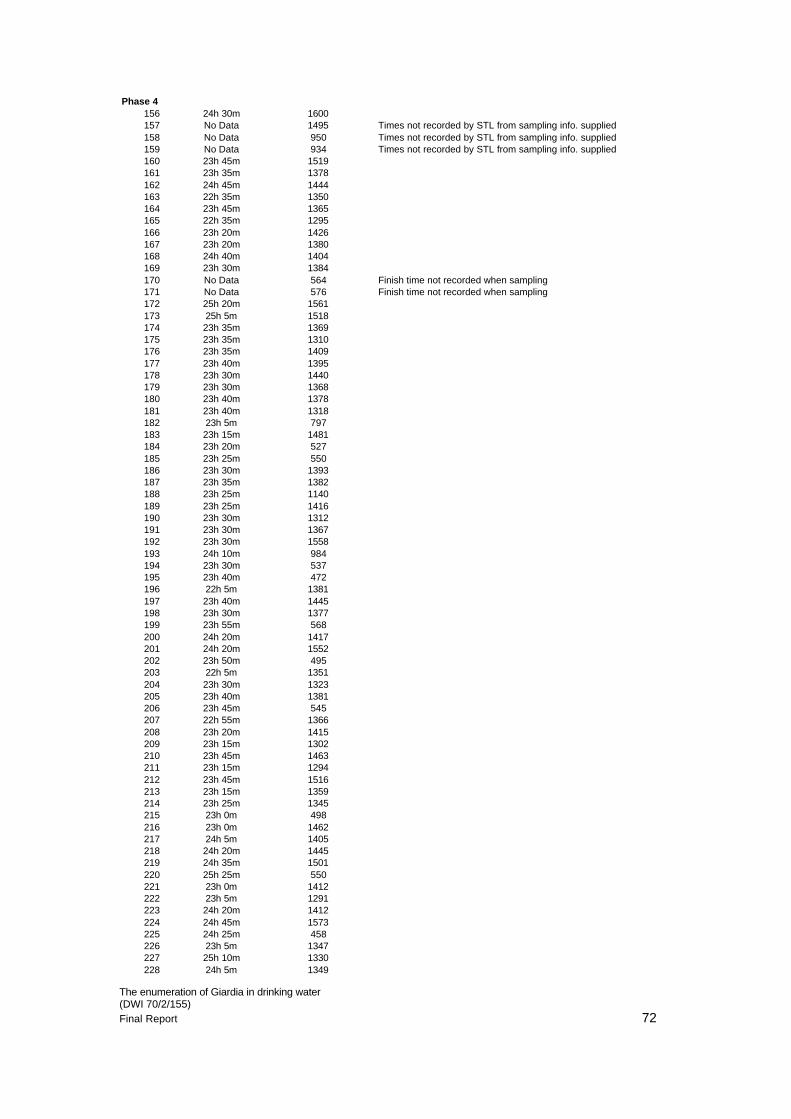
Table Appendix 2.1 Elapsed times for filtration of approximately 1000 litres treated water in the laboratory (Phases 1 and 2) and on site (Phase 4) ................................................................................................... 69
ACKNOWLEDGEMENTS Severn Trent Laboratories (STL) would like to thank the Drinking Water Inspectorate at the Department for Environment, Food and Rural Affairs for proposing and funding this piece of research. Particular thanks are due to Mr Mike Waite, our Project Manager at the Drinking Water Inspectorate, for his support and encouragement throughout the project. The author is especially grateful for the help and expert advice from co-director, Mr David Sartory, and from other members of the STL Project Steering Group: Mr Dave Dawson Ms Jane Roberts Many thanks to Carol Weatherley for undertaking the statistical analyses. The contribution of Pervinder Johal and Senior analysts from the STL Cryptosporidium laboratory: Jane Roberts, Peter Alcock and Shaun Jones, who expertly undertook all of the analyses associated with this project, is gratefully acknowledged together with the input from the Severn Trent Water team: Mark Field, Rachel Unwin and Adele Field who facilitated and supervised the Field Trials. Finally we wish to thank Severn Trent Water for the use of their Water Treatment facilities. Dr Helen Merrett Project Director, Contract DWI 70/2/155
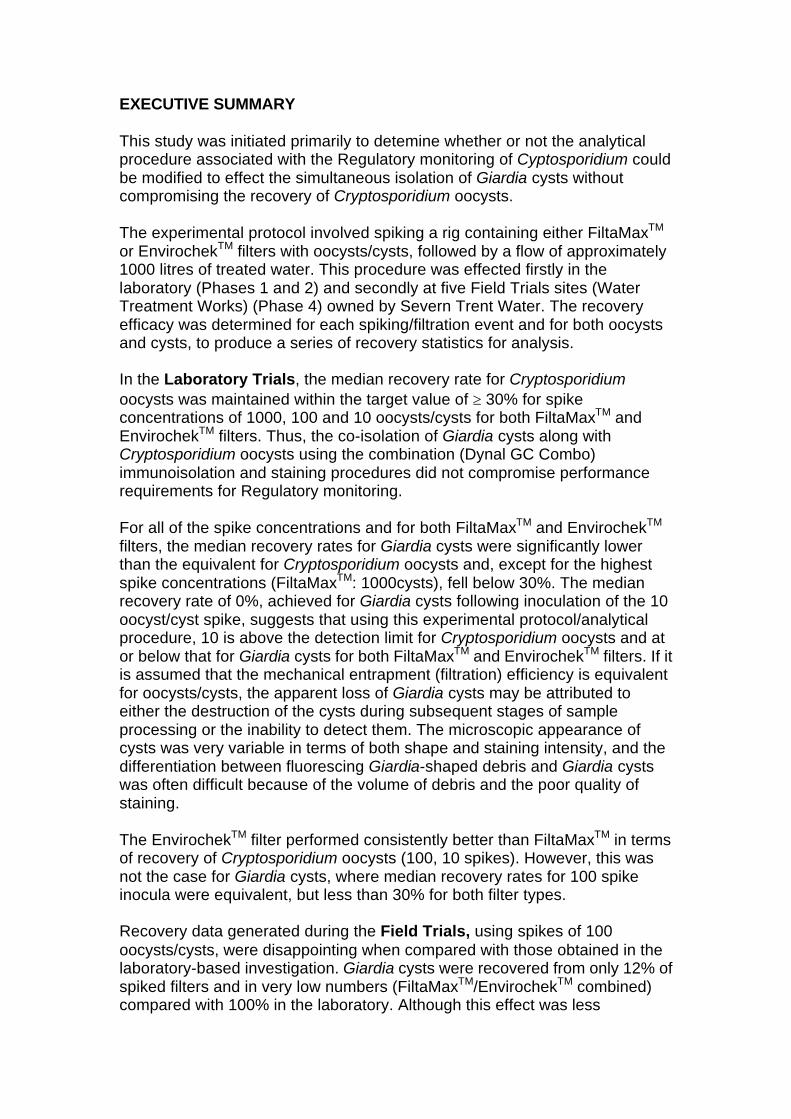
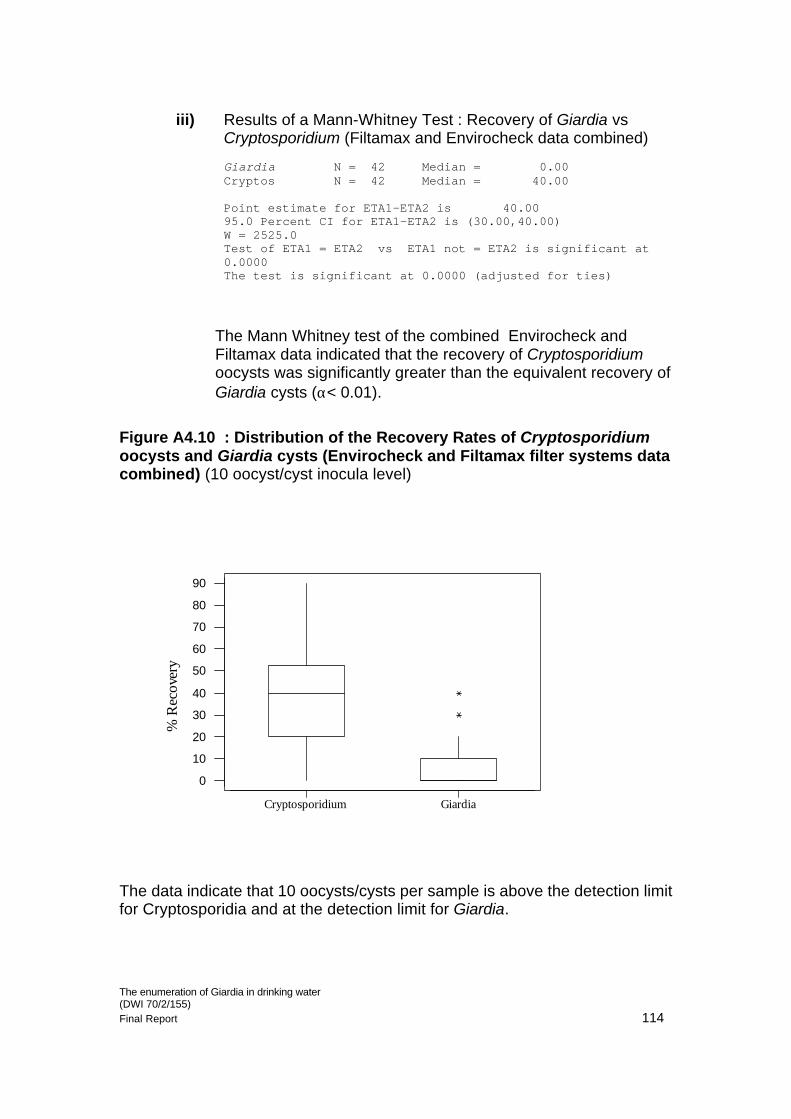
EXECUTIVE SUMMARY This study was initiated primarily to detemine whether or not the analytical procedure associated with the Regulatory monitoring of Cyptosporidium could be modified to effect the simultaneous isolation of Giardia cysts without compromising the recovery of Cryptosporidium oocysts. The experimental protocol involved spiking a rig containing either FiltaMaxTM or EnvirochekTM filters with oocysts/cysts, followed by a flow of approximately 1000 litres of treated water. This procedure was effected firstly in the laboratory (Phases 1 and 2) and secondly at five Field Trials sites (Water Treatment Works) (Phase 4) owned by Severn Trent Water. The recovery efficacy was determined for each spiking/filtration event and for both oocysts and cysts, to produce a series of recovery statistics for analysis. In the Laboratory Trials, the median recovery rate for Cryptosporidium oocysts was maintained within the target value of ≥ 30% for spike concentrations of 1000, 100 and 10 oocysts/cysts for both FiltaMaxTM and EnvirochekTM filters. Thus, the co-isolation of Giardia cysts along with Cryptosporidium oocysts using the combination (Dynal GC Combo) immunoisolation and staining procedures did not compromise performance requirements for Regulatory monitoring. For all of the spike concentrations and for both FiltaMaxTM and EnvirochekTM filters, the median recovery rates for Giardia cysts were significantly lower than the equivalent for Cryptosporidium oocysts and, except for the highest spike concentrations (FiltaMaxTM: 1000cysts), fell below 30%. The median recovery rate of 0%, achieved for Giardia cysts following inoculation of the 10 oocyst/cyst spike, suggests that using this experimental protocol/analytical procedure, 10 is above the detection limit for Cryptosporidium oocysts and at or below that for Giardia cysts for both FiltaMaxTM and EnvirochekTM filters. If it is assumed that the mechanical entrapment (filtration) efficiency is equivalent for oocysts/cysts, the apparent loss of Giardia cysts may be attributed to either the destruction of the cysts during subsequent stages of sample processing or the inability to detect them. The microscopic appearance of cysts was very variable in terms of both shape and staining intensity, and the differentiation between fluorescing Giardia-shaped debris and Giardia cysts was often difficult because of the volume of debris and the poor quality of staining. The EnvirochekTM filter performed consistently better than FiltaMaxTM in terms of recovery of Cryptosporidium oocysts (100, 10 spikes). However, this was not the case for Giardia cysts, where median recovery rates for 100 spike inocula were equivalent, but less than 30% for both filter types. Recovery data generated during the Field Trials, using spikes of 100 oocysts/cysts, were disappointing when compared with those obtained in the laboratory-based investigation. Giardia cysts were recovered from only 12% of spiked filters and in very low numbers (FiltaMaxTM/EnvirochekTM combined) compared with 100% in the laboratory. Although this effect was less
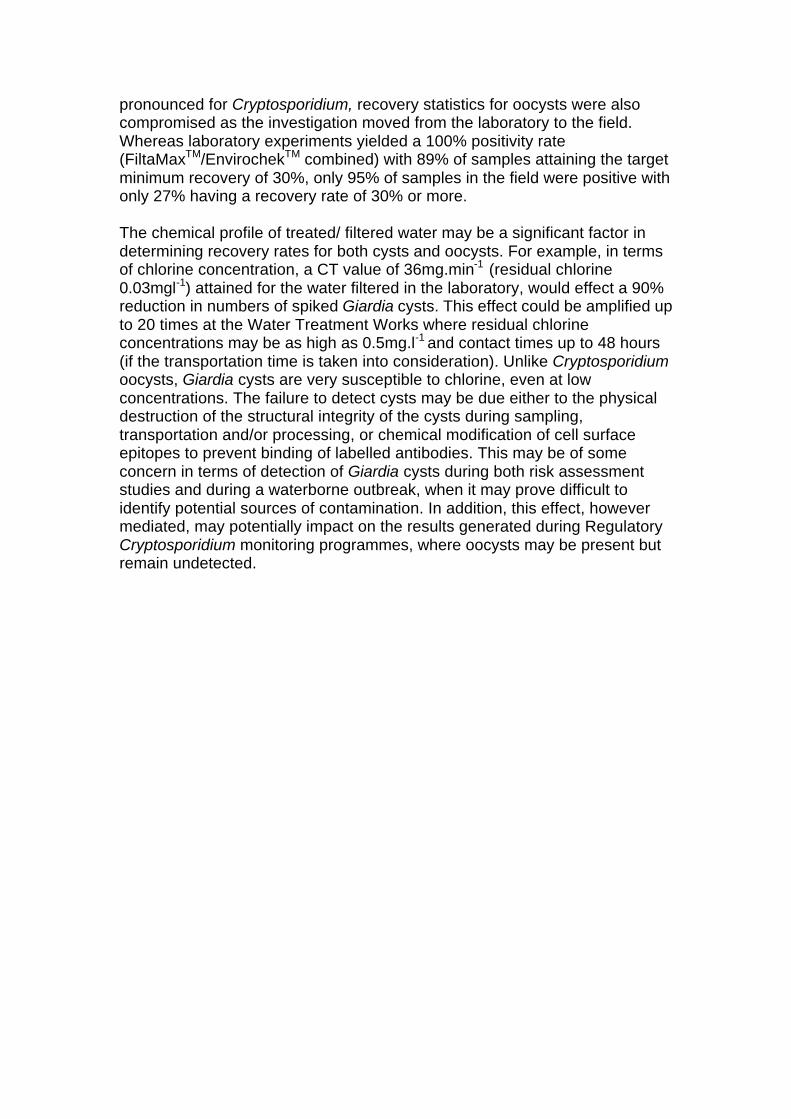
pronounced for Cryptosporidium, recovery statistics for oocysts were also compromised as the investigation moved from the laboratory to the field. Whereas laboratory experiments yielded a 100% positivity rate (FiltaMaxTM/EnvirochekTM combined) with 89% of samples attaining the target minimum recovery of 30%, only 95% of samples in the field were positive with only 27% having a recovery rate of 30% or more. The chemical profile of treated/ filtered water may be a significant factor in determining recovery rates for both cysts and oocysts. For example, in terms of chlorine concentration, a CT value of 36mg.min-1 (residual chlorine 0.03mgl-1) attained for the water filtered in the laboratory, would effect a 90% reduction in numbers of spiked Giardia cysts. This effect could be amplified up to 20 times at the Water Treatment Works where residual chlorine concentrations may be as high as 0.5mg.l-1 and contact times up to 48 hours (if the transportation time is taken into consideration). Unlike Cryptosporidium oocysts, Giardia cysts are very susceptible to chlorine, even at low concentrations. The failure to detect cysts may be due either to the physical destruction of the structural integrity of the cysts during sampling, transportation and/or processing, or chemical modification of cell surface epitopes to prevent binding of labelled antibodies. This may be of some concern in terms of detection of Giardia cysts during both risk assessment studies and during a waterborne outbreak, when it may prove difficult to identify potential sources of contamination. In addition, this effect, however mediated, may potentially impact on the results generated during Regulatory Cryptosporidium monitoring programmes, where oocysts may be present but remain undetected.
The enumeration of Giardia in drinking water (DWI 70/2/155) Final Report 1
1 INTRODUCTION In the year 2000, Water Companies throughout the UK were charged with undertaking assessments of the risk of Cryptosporidium oocysts being present in their source waters and surviving the water treatment process. Where facilities were assigned the status of ‘at risk’, continuous sampling equipment was installed at the identified treatment works so that a representative sample of the water produced could be monitored 24 hours a day, 365 days a year. The analytical methodologies and reporting format associated with this initiative were deliberately prescriptive, and the test frequency, the complexity of the procedures involved, together with the cost of consumable items, meant that the overall costs associated with Regulatory Cryptosporidium monitoring were, and remain, significant. The ability to isolate Giardia cysts simultaneously with Cryptosporidium oocysts during Regulatory tests would give Water Companies the opportunity to generate valuable additional information at relatively little extra cost. In this way, data relating to the incidence of Giardia could be collated and used to assess any potential public health concerns. However, whilst simultaneous isolation and enumeration of Giardia cysts with Cryptosporidium oocysts may be desirable, the assumption that isolation rates will be equivalent may be false for several reasons: • Differential size and mass: Cryptosporidium oocysts measure 4-6µm in
diameter, whilst Giardia cysts are 10-12µm. Their densities are similar. • Giardia cysts have a less rigid wall than Cryptosporidium oocysts. There
may be a differential response to vigorous movement (elution/vortexing) and/or centrifugation.
• Differential uptake of combination stains ( eg Dynal GC Combo) if
employed • Different water types (hard/soft, raw/potable etc) may have a differential
effect on the recovery of oocysts/cysts. The ‘Standard Operating Protocol for the Monitoring of Cryptosporidium oocysts in Treated Water Supplies to Satisfy the Water Supply (Water Quality) Regulations’ (SI No.1524, 1999, Revision 3) suggests that a recovery rate of 30% should be routinely achievable. We would expect to achieve at worst equivalent for Giardia cysts for both the established and routinely used FiltaMaxTM filtration system and the recently (19 August 2002) approved EnvirochekTM filter.
The enumeration of Giardia in drinking water (DWI 70/2/155) Final Report 2
The aim of the project was to examine the feasibility of using the technology and analytical methods associated with Regulatory Cryptosporidium monitoring to simultaneously isolate and enumerate Giardia cysts. Our approach to the project was to firstly to make the assumption that this was feasible. Thus, Phase 1 addressed objective 6a of the Tender document to investigate the possibility of identifying and enumerating Giardia cysts on the slides prepared for Regulatory Cryptosporidium analysis. At this stage, and for simplicity of approach, only the FiltaMaxTM filter was evaluated. All subsequent trials included parallel evaluations of the EnvirochekTM filter. Phase 1 was designed to detect any significant problems associated with the basic approach of simply modifying the Regulatory method by incorporating the GC Combo system for the IMS recovery and staining of oocysts and cysts. Phase 2 represented an extension of Phase 1 in that it included the EnvirochekTM filter and covered a lower range of spike concentrations. Once equivalent acceptable recovery rates were established for both Cryptosporidium oocysts and Giardia cysts in the laboratory, and we were satisfied that the analytical procedure was robust, the investigation progressed to Phase 4, Field Trials, where the potential effect of different water types on the capture and release on/off the filters was investigated. Identical rigs were be installed at up to five Water Treatment Works within the Severn Trent region to represent a range of water types.
The enumeration of Giardia in drinking water (DWI 70/2/155) Final Report 3
2 LITERATURE REVIEW The enteric protozoan parasites, Cryptosporidium and Giardia, which cause acute gastroenteritis in humans, have become significant waterborne pathogens in the developed world. Both parasites multiply in several host animal species including human beings, which subsequently excrete infective forms, Cryptosporidium oocysts and Giardia cysts, into the environment. Of the 3 known species of Giardia and currently 138 recognised species of Cryptosporidium, Giardia duodenalis and Cryptosporidium parvum are the principal species responsible for most human and mammalian infections. C.parvum contains two genotypes (1 and 2) but recently genotype 1 has been renamed as the separate species C.hominis (Morgan-Ryan et al, 2002). The waterborne transmission of these parasites is well documented, and over 160 outbreaks of cryptosporidosis and giardiasis have been reported worldwide (Lisle and Rose,1995; Kramer et al , 1996), resulting in a major focus on these organisms for the Water Industry and Regulators. Both parasites can pass through conventional water treatment processes, particularly when operated suboptimally and, whilst G. duodenalis (synonyms G. intestinalis; G.lamblia) cysts are relatively susceptible to chlorination at appropriate contact times, C. parvum and C.hominis oocysts are very resistant to the standard disinfection procedures used during conventional water treatment regimes (Korich et al, 1990; Moore et al, 1994; Frost et al, 1996). After the first recognised waterborne outbreaks of cryptosporidosis in the 1980s, it became apparent that there was a requirement for a standardised analytical method for the recovery, identification and enumeration of these parasites in water samples to determine both the occurrence and pathogenic loading levels and to identify and evaluate the efficacy of different treatment processes. Historically, the analytical protocols for these organisms have comprised 3 basic procedures: Initial concentration of the organisms from large volumes of water. This was conventionally achieved using either filtration through membrane or yarn wound filters, or via calcium carbonate flocculation. Although large volumes (up to 1000 litres) could be filtered using the yarn wound cartridge filters, only relatively small volumes could be sampled by membrane filtration (10–100 litres) or flocculation (10 litres). Recovery, separation from debris and further concentration Where samples had been filtered, cysts and oocysts were released (eluted) from the capture matrix using several litres of weak detergent. Calcium carbonate-flocculated samples were left to stand overnight to allow
The enumeration of Giardia in drinking water (DWI 70/2/155) Final Report 4
settlement of cysts/oocysts, the large volume of supernatant being aspirated the following day. Samples were then further concentrated and cleaned from co-concentrated debris material using sucrose and/or Percoll flotation/density gradient centrifugation. Later, flow cytometry was employed by some laboratories to separate the cysts/oocysts from sample debris. Detection and Enumeration Immunofluorescence microscopy, using fluorescently-labeled antibodies to label the cysts/oocysts, and the intercalating DNA dye 4’,6’- diamidino-2-phenylindole (DAPI) to label nuclei, was then used to detect and enumerate any cysts/oocysts present. These approaches proved inefficient and laborious (Smith et al, 1993), generating low/highly variable recovery efficiencies (Shepherd and Wyn-Jones, 1995; Vesey et al, 1993; Whitmore and Carrington, 1993; Nieminski et al , 1995) and high false positive and negative rates with poor precision and accuracy, even in the most experienced hands ( Clancy et al, 1994; McCuin and Clancy, 2003). It was generally accepted that, whilst oocysts/cysts were lost at all stages during the analytical process, the inefficient capture and retention by the filters or cartridges, combined with poor elution from the filters and further losses during separation from debris, were the key factors contributing to poor performance. However, until the late 1990s, these protocols were standard practice in both the US (Information Collection Rule (ICR) method (USEPA, 1996)) and the UK (Standing Committee of Analysts (SCA) method (SCA,1990)). In the US, the ICR method was heavily scrutinised (Clancy et al,1994; LeChevalier et al, 1995) and, on investigation, the initial cartridge concentration step and the Percoll-sucrose density gradient purification were identified to be the principal steps contributing to poor performance in recovery rates. Further waterborne outbreaks of cryptosporidosis worldwide stimulated concerted efforts to develop more robust analytical protocols that could consistently provide accurate information to both the Water Industry, Regulators and Public Health Institutions. In 1997, the USEPA approved a new method (USEPA method 1622 ‘Cryptosporidium in water by filtration/IMS/FA and viability by DAPI/PI’(USEPA, 1997)) for analysis of protozoa in water. The method incorporated filtration, Immuno Magnetic Separation (IMS) and Fluorescent Antibody (FA) staining, and represented a significant improvement over the standard ICR method. The new method prescribed: • A new filter design for increased efficiency of oocyst/cyst capture and
elution (EnvirochekTM capsule) • An IMS clean up stage permitting improved concentration of the target
organisms
The enumeration of Giardia in drinking water (DWI 70/2/155) Final Report 5
• An additional staining step to further aid in confirmed identification of oocysts/cysts
• Stringent QA/QC procedures A drawback of this procedure was that only small volumes (typically 10 litres) of water were being sampled. Studies in the US, however, did demonstrate superior performance in terms of entrapment of Giardia cysts/Cryptosporidium oocysts. A preliminary evaluation of the EnvirochekTM capsule was undertaken in the UK by Matheson et al, (1998) who demonstrated consistently higher recovery rates for 10 litre seeded tap water samples concentrated with the EnvirochekTM filter (oocysts 69.7%; cysts 83.5%) when compared with calcium carbonate flocculation (oocysts 60.9%; cysts 63.7%). Similar results were obtained for source waters, and the authors concluded that with this approach, high and reproducible recovery rates could be achieved during the simultaneous concentration of cysts/oocysts. In addition, the method was shown to be rapid and to lend itself to the processing of multiple samples. It could also be adapted for sampling in the field, at water treatment facilities and for concentrating ‘grab’ samples in the laboratory. The use of IMS in the clean-up stage of the analytical process was recognised as being highly significant in increasing the overall recovery rates and, as part of the development of the new method for the USEPA, IMS was investigated to specifically isolate C. parvum oocysts from environmental sample concentrates. The performance of several commercially available kits was assessed for deionised water and source water of various turbidities (Bukhari et al , 1998; Rochelle et al, 1999) and, whilst some kits performed better than others ( the Dynal kits performed consistently better than the other two kits studied), IMS was identified as a promising technology for the isolation of oocysts from turbid matrices. The advent and acceptance of the GC-Combo IMS (Dynal GC-Combo) kit for the concomitant isolation of oocysts/cysts led to the development and documentation of Method 1623 (USEPA, 1999), ‘Cryptosporidium and Giardia in water by filtration/IMS/FA’ which was subsequently validated in collaborative trials. Hsu and Huang (2000), undertook an extensive study to compare the component recovery efficiences of each concentration, elution and purification step in 1) the ICR protozoan method, which uses cartridge filtration with Percoll-sucrose gradient, 2) Method 1623 and 3) Method 1622. Both 2 and 3 combine EnvirochekTM filtration with IMS purification and use the same elution step. The performances of different concentration and elution techniques, as well as two purification methods were evaluated in terms of recovery of Giardia cysts/Cryptosporidium oocysts from 20 litres of seeded deionised, treated and raw water samples spiked with 2x10⁴– 4x10⁴ oocysts/cysts. In terms of concentration, cartridge filters (1µm nominal pore size, polypropylene yarn wound) with stomach homogenisation, membrane filters (polycarbonate, 3µm pore size) with hand kneading and Gelman EnvirochekTMcapsules with wrist action shaking, were evaluated. Percoll-
The enumeration of Giardia in drinking water (DWI 70/2/155) Final Report 6
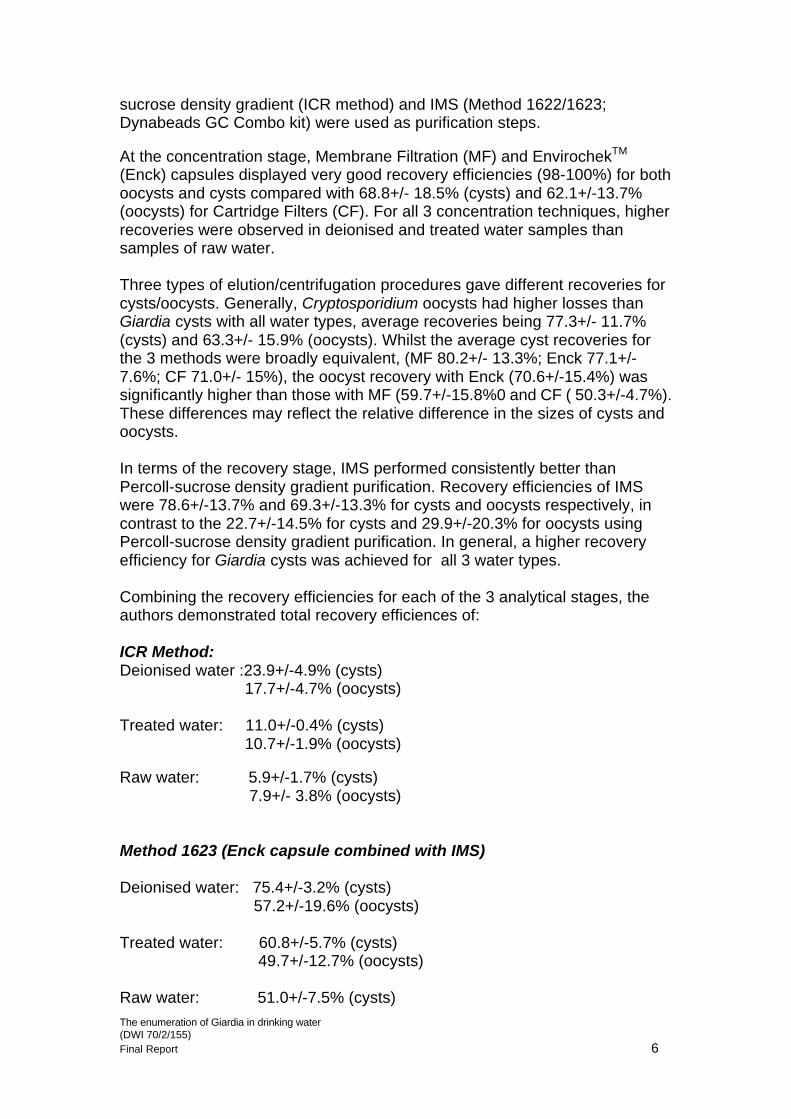
sucrose density gradient (ICR method) and IMS (Method 1622/1623; Dynabeads GC Combo kit) were used as purification steps. At the concentration stage, Membrane Filtration (MF) and EnvirochekTM (Enck) capsules displayed very good recovery efficiencies (98-100%) for both oocysts and cysts compared with 68.8+/- 18.5% (cysts) and 62.1+/-13.7% (oocysts) for Cartridge Filters (CF). For all 3 concentration techniques, higher recoveries were observed in deionised and treated water samples than samples of raw water. Three types of elution/centrifugation procedures gave different recoveries for cysts/oocysts. Generally, Cryptosporidium oocysts had higher losses than Giardia cysts with all water types, average recoveries being 77.3+/- 11.7% (cysts) and 63.3+/- 15.9% (oocysts). Whilst the average cyst recoveries for the 3 methods were broadly equivalent, (MF 80.2+/- 13.3%; Enck 77.1+/-7.6%; CF 71.0+/- 15%), the oocyst recovery with Enck (70.6+/-15.4%) was significantly higher than those with MF (59.7+/-15.8%0 and CF ( 50.3+/-4.7%). These differences may reflect the relative difference in the sizes of cysts and oocysts. In terms of the recovery stage, IMS performed consistently better than Percoll-sucrose density gradient purification. Recovery efficiencies of IMS were 78.6+/-13.7% and 69.3+/-13.3% for cysts and oocysts respectively, in contrast to the 22.7+/-14.5% for cysts and 29.9+/-20.3% for oocysts using Percoll-sucrose density gradient purification. In general, a higher recovery efficiency for Giardia cysts was achieved for all 3 water types. Combining the recovery efficiencies for each of the 3 analytical stages, the authors demonstrated total recovery efficiences of: ICR Method: Deionised water :23.9+/-4.9% (cysts) 17.7+/-4.7% (oocysts) Treated water: 11.0+/-0.4% (cysts) 10.7+/-1.9% (oocysts) Raw water: 5.9+/-1.7% (cysts) 7.9+/- 3.8% (oocysts) Method 1623 (Enck capsule combined with IMS) Deionised water: 75.4+/-3.2% (cysts) 57.2+/-19.6% (oocysts) Treated water: 60.8+/-5.7% (cysts) 49.7+/-12.7% (oocysts) Raw water: 51.0+/-7.5% (cysts)
The enumeration of Giardia in drinking water (DWI 70/2/155) Final Report 7
42.4+/-19.1% (oocysts) Thus, the Method 1623 (Enck capsule combined with IMS) performed consistently better for all water types. Overall, the recovery efficiences from the elution and centrifugation steps were lower than those from the concentration steps, suggesting that improvements at this stage would significantly raise the overall recovery efficiency. Indeed, when IMS replaced the Percoll-sucrose density gradient purification in the ICR protozoa method, the total recovery efficiency was improved from 13.4+/-8.4% to 45+/-25.5% (cysts) and from 11.5+/-5.3% to 20.4+/-6.2% (oocysts). McCuin et al (2001) assessed the efficiency of IMS recovery of cysts and oocysts in concentrates that had been spiked with particulates recovered from various rivers to turbidities that ranged from 50-5000 nephelometric turbidlty units (ntu). They demonstrated consistently reproducible recoveries of low numbers (around 100 oocysts/cysts) in both deionised waters (oocysts 62%;cysts 69%) and source waters (oocysts 55.9-83.1%; cysts 61.1-89.6%) Recovery was not affected by viability status or age of the oocysts/cysts. (recoveries for Giardia remained constant for cysts aged up to 8 months: 73, 81 and 81% for fresh, 4 and 8 months old respectively but decreased to 49.1% for cysts aged 20 months). Notably, a packed pellet volume of greater than 0.5 ml did not adversely affect recoveries. However, the authors did note that the composition of the sample matrix may be a significant factor in oocyst/cyst recoveries with IMS. Sturbaum et al (2002), tested the ability of the IMS-FA procedure to detect low nominal oocyst numbers of 5,10, and 15 reporting it to be efficient at detecting oocysts at these low levels. IMS recovery of cysts/oocysts may be affected by material, particularly iron products, co-recovered from the sample. Using the Dynal GC Combo IMS kit, Yakub and Stadterman-Knauer (2000) reported a significant decrease in the recovery of Cryptosporidium oocysts with dissolved iron concentration of 4 mg/l (recoveries dropping from around 58% to 5-7.5%). Reduction in recovery of Giardia cysts was not noted until iron concentrations reached 40mg/l. However, the cysts did show incomplete or faint FITC staining upon microscopic examination, indicating some interference caused by the iron. Whether this was an interference effect or due to damage of the cyst walls was not ascertained. The use of EDTA as a chelating agent did mitigate the impact of iron on recoveries of cysts and oocysts to some extent, but did not restore recoveries to those where iron was absent. Kuhn et al (2002) reported on the importance of pH on the optimal performance of IMS, stating maximal recoveries of Cryptosporidium oocysts from water sample concentrates at pH 7. They noted that the buffering capacity of the SL buffers supplied with IMS kits may not be sufficient for all water matrices. They reported that, if necessary, it was possible to adjust the pH manually after addition of the buffer to the concentrate pellet. DiGiorgio et al (2002) used method 1623 to evaluate the efficacy of the EnvirochekTM High Volume (HV) capsule for the recovery of low numbers of oocysts/cysts spiked into 10 litres of source waters with turbidities ranging from 11-99 ntu. Whilst recovery of Cryptosporidium oocysts remained at or
The enumeration of Giardia in drinking water (DWI 70/2/155) Final Report 8
above 50% at all but the highest (99ntu) of the turbidities tested (range 36% (99ntu)-75% (20 ntu); mean 54%), the recovery of Giardia cysts from waters was significantly lower in waters of high turbidity (range 0.5% (99ntu)-53%(11ntu); mean 25%). However, for both cysts and oocysts, recoveries varied significantly with sampling site, and recovery rates of 50% or less were observed in waters with both low and high turbidities, suggesting that the nature of the turbidity or background matrix of the water was as important to the recovery as was the absolute turbidity value. For example, where organic carbon concentrations were high (38 mg/litre), the chelation of organic carbon and iron may interfere with the IMS stage of the analytical process thus reducing overall recovery rates. In addition, the authors suggested that the quality and strain of Giardia cysts may also be important in terms of degradation during the sampling/handling process. It must be noted that this study used 10 litre samples of raw water and not the larger volumes of treated water (1000 + litres) for which the Envirochek HVTM was developed. During the 1990s in the UK, a collaborative project by Genera Technologies and Severn Trent Water resulted in the development of a novel filter system for the recovery of Cryptosporidium oocysts from large sample volumes (100-2000 litres) (Parton et al., 1997: Sartory et al., 1998). The system was specifically designed to allow relatively rapid filtration at 4 litres/minute or slower long term filtration at 1 litre/ minute, allowing ‘integrated’ sampling over a 24 hour period. The system became available as the FiltaMaxTM filter at the time that UK regulations on Cryptosporidium were being derived and, following a DWI-sponsored evaluation (DWI, 1999; Casemore et al., 2001), was incorporated as the prescribed filter for monitoring of Cryptosporidium under the regulations promulgated in 1999 (Anon. 1999). The FiltaMaxTM capture system, is made up of a foam filter consisting of 60 open-cell reticulated foam discs which are compressed between two retaining plates approximately 10 cm deep, and fitted into a filter housing. Water flows into the housing between the filter and housing wall and radially through the filter into the centre space and out via an outlet port. In the compressed state, the foams act as a depth filter with a nominal pore size of 1µm, trapping particulate material including Cryptosporidium oocysts (if present) as the water passes through. When the filters are allowed to expand, the foam structure opens up allowing an elution solution to wash the foam and free any trapped material and oocysts. Using potassium citrate density gradient flotation for sample concentrate clean-up and standard staining, Sartory et al (1998) reported recoveries of 56.7% from 10-20 litre river water samples and 60.9% from 100-2000 litres of tap water samples.
When used in combination with a recirculating IMS separation system (PuriMaxTM) and standard immunofluorescence microscopy effected either manually or by a semi-automated (QuantiMaxTM) system, Genera Technologies were able to demonstrate consistent recoveries of 80%(mean) (Parton et al , 2001) for 100-2000 litre volumes of raw/finished water, and for spike concentrations of between 80 and 3000 oocysts.
The enumeration of Giardia in drinking water (DWI 70/2/155) Final Report 9
The development of this system represented a significant step forward in terms of simplifying sample concentration, extraction, clean-up and analysis, and its principle, with few modifications, subsequently formed the basis for the UK analytical protocol prescribed by UK Regulatory bodies (Anon, 1999;2000)
In Europe, a consortium of members of the European Water Research Institutes (EWRI) (Anjou Recherche, CIRSEE, KIWA, TZW and WRc) undertook a programme of research with the specific objective of identifying a standard method for the isolation and enumeration of oocysts/cysts in water samples. Each stage of the analytical procedure (initial concentration, recovery and identification and enumeration) were investigated (Stanfield et al ,2000). For the initial concentration stage, 3 basic methods, filtration using a range of cartridge and membrane filters and flocculation were compared. Test waters were spiked with oocysts/cysts to a concentration of 105 /100litres and, from a total of 7 cartridge filters, the Genera FiltaMaxTMand EnvirochekTM (Gelman) filters gave the best performance, with recoveries of 101.5 +/-5% (Cryptosporidium); 99.8+/-5.6% (Giardia) and 58.1+/-23.8% (Cryptosporidium); 56.7+/-22.2% (Giardia) respectively for large volumes (up to 1000 litres) of treated water. Several types (6 in total) of membrane filters were evaluated but, whilst recoveries for cellulose acetate and polycarbonate filters were equivalent to the FiltaMaxTM and EnvirochekTM filters on some occasions, (Cellulose acetate, 52.5-80.8% (Cryptosporidium); 101.6-33.1% (Giardia) Polycarbonate 42.3-83.5% (Cryptosporidium); 20-70.2% (Giardia)), the level of consistency was poor, and membrane filters were subsequently excluded from the study. Flocculation for raw water was evaluated using a range of salts, with Ferric sulphate (FS) and Aluminium sulphate (AS) giving best recoveries for both Cryptosporidium oocysts and Giardia cysts(FS Cryptosporidium 74.1%; Giardia 67.6%: AS: Cryptosporidium 95.4%; Giardia 93%). However, this approach was considered unsuitable for treated waters since they generally have insufficient particulate organic material to achieve successful flocculation. In terms of recovery of cysts/oocysts from sample concentrates two approaches, centrifugation and immuno-magnetic separation (IMS) were evaluated using concentrates produced from spiked 100 litre samples of water. A range of centrifugal forces and times (1500g for 20 and 30 minutes; 3000g for 10,20 and 30 minutes) were compared with the standard 1500g for 10 minutes, but were found to have little significance in terms of recovery of Giardia cysts. The results obtained for Cryptosporidium oocysts were variable, but overall, it was concluded that centrifugation condition was not a highly significant factor.
The enumeration of Giardia in drinking water (DWI 70/2/155) Final Report 10
Four IMS systems, Dynal anti-Cryptosporidium, Dynal GC-Combo, Crypto-Scan Cryptosporidium IMS system, Genera PuriMaxTM were evaluated for both raw and treated waters. The Dynal, Crypto-Scan and Genera systems gave high recoveries (>88%) for the treated water concentrates. The Dynal GC Combo system gave significantly lower Cryptosporidium oocyst recoveries of 30.5+/- 8.1% with 13.4+/-8.5% for Giardia cysts. The apparently poor recovery statistics observed for both Cryptosporidium and Giardia using GC Combo in this study are in direct contrast to data obtained by others at around the same time (Hsu and Huang, 2000; Yakub and Stadterman-Knauer, 2000) and in subsequent evaluations (McCuin et al, 2001; McCuin and Clancy, 2003) where both oocysts and cysts were recovered efficiently and equivalently.
The introduction of a modified standard EnvirochekTM capsule for use in the isolation of oocysts from large volumes (>1000 litres) of treated water (Envirochek HVTM(EnHV)), and its validation for use in method 1623, provided a potential alternative for use in UK Regulatory monitoring exercises. Whilst the DWI-prescribed FiltMaxTM units continued to perform well in terms of recovery of Cryptosporidium oocysts in laboratories throughout the UK, the procedure associated with the prescribed method had certain drawbacks in terms of both analyst subjectivity and chronic injury sustained during the relatively laborious elution process. In addition, the availability of an alternative filtration device would have obvious advantages should supplies of the FiltMaxTM unit be compromised in any way.
The Standard Operating Procedures (SOPs) defined in the Drinking Water Regulations provide for the validation of alternative materials and equipment for use in Regulatory monitoring activities. The validation comprises two phases. Phase 1 consists of a single laboratory undertaking a trial of the proposed new method and must establish that the new technology gives similar or improved performance over the standard (established) method when both are used to monitor treated water according to the SOP (3 drinking water sites over a period of 60 days). Following approval of the results by the DWI, an inter-laboratory trial (Phase 2) using 5 approved laboratories is generally required to further evaluate the new technology. However, in relation to new filtration devices, the SOP does not specifically require Phase 2 inter-laboratory trials subsequent to approval of Phase 1 data by the Inspectorate.
The EnHV capsule was subsequently evaluated for the isolation/recovery of Cryptosporidium oocysts at 3 test sites in Yorkshire, representing treated water from a borehole water, a lowland river source and an upland water. (Boynton et al.,2002)
Filters were seeded with 100 oocysts in the laboratory and transported to each of the test sites and connected to the test rig. They were then left for 24 hours or until a minimum of 1000 litres of water had passed through. FM filters were evaluated in parallel with the EnHV capsules on 10 occasions during the
The enumeration of Giardia in drinking water (DWI 70/2/155) Final Report 11
60 day trial to produce a direct comparison in terms of recovery statistics. Dynal IMS Cryptosporidium beads were used in the concentration stage throughout the trial.
In the parallel trials, the EnHV capsule performed better than FiltaMaxTM at 2 (lowland and borehole water) of the 3 sites (EnHV 53.9+/-16.2% / FM 41.3+/-14.5%; EnHV 43.2+/-14.2% / FiltaMaxTM 34.2+/- 14.6%). At the other site, an upland water source sampled at the Water Treatment Works, recoveries were significantly lower for both filtration devices (EnHV 3.9+/- 3.1% / FiltaMaxTM 10.1+/-5.3%). Significantly, and in contrast to the lowland and borehole sources, water at this site is dosed with polyelectrolyte to aid coagulation.
During this and subsequent Phase 2 trials, the EnHV capsule performed consistently well and demonstrated at least equivalence in terms of recovery of Cryptosporidium oocysts. The investigators subsequently recommended that the EnHV capsule was suitable for the Regulatory monitoring of Cryptosporidium in accordance with the Water Supply (Water Quality) Regulations 2000/2001. The recommendation was accepted by the Inspectorate, and the EnHV filter was approved for use in August 2002.
Methods for the isolation of oocysts/cysts have been improved considerably during the last few years and, whilst in the UK, the Regulatory requirement for Cryptosporidium monitoring has focussed on the development of methods for sampling large volumes of treated water, in the US the effort has historically been directed towards the monitoring of relatively low volumes of source water.
During a recent Aww Research Foundation-funded study specifically designed to develop methods for sampling of source and treated water (Clancy et al, 2003), USEPA method 1622 was used to evaluate the efficacy of EnHV and FiltaMawTM filters for the isolation of Cryptosporidium oocysts. Whilst the investigation was successful in terms of both filters achieving overall recovery rates which met the acceptance criteria, several pertinent issues were raised which may have some relevance to the current initiative.
Whilst both filters produced consistently acceptable recovery rates for seeded source (50L) and pre-filtered (1000L) tap water, when the tap water was unfiltered, recovery rates for both EnHV and FiltaMaxTM filters declined to <5%. This was surprising since, in the UK, the FiltaMaxTM filter has yielded consistently good recovery rates in both field-based trials and in continuous monitoring associated with Regulatory requirements. The authors speculated that the poor recovery rates were due to the chemical composition of the water eg the presence of flocculants which, when concentrated on the test filter, may provide greater adhesion of oocysts (physically or chemically mediated) to the filter matrix. The presence of debris from the distribution system was also cited as a potential contributing factor. Having subsequently excluded the possibility that the IMS step had contributed to the decline in recovery, the authors concluded that the chemical composition of the treated water was a major factor in determining the rate of recovery of oocysts from
The enumeration of Giardia in drinking water (DWI 70/2/155) Final Report 12
treated waters. The inclusion of sodium hexametaphosphate in the elution solution to dislodge/ dissolve/ disaggregate and release the oocysts from the EnHV capsule increased recovery rates from 4 to 46%.
The use of the FiltaMaxTM filter for the simultaneous isolation of Cryptosporidium oocysts and Giardia cysts from large volumes of treated water has not until recently been extensively evaluated. However, its successful track record in the UK in Regulatory monitoring of Cryptosporidium in treated water supplies prompted an inter-laboratory study in the US whose primary objective was to compare the FiltaMaxTM system with other sample collection devices used in methods 1622 and 1623 (McCuin and Clancy, 2003).
Both source and treated waters were seeded with low concentrations oocysts/cysts (around 100/50 litres water; 50-1000/1000 litres water). Following filtration, the organisms were recovered using IMS (Dynal GC Combo) and subsequently detected using fluorescent monoclonal antibodies.
The mean recovery for Cryptosporidium (mean of 4 laboratories) in 50 litres seeded tap water was 48.5+/-11.8% (range 23.5-71.2%). Recoveries were marginally higher and less variable for Giardia cysts, (mean: 57.1 +/-11.0% range:33.1-70%). Equivalent recoveries from source water were Cryptosporidium: mean 40.5%(range 19.5-54.5%), Giardia: mean 59.5% (range: 45.7-69.1%).
When large volumes (1000 litres) of treated water were spiked with a range of oocyst/cyst concentrations (50-1000), recoveries ranged from 38.6+/- 17.3% to 50.5+/- 22.9% (oocysts) and from 24.9+/- 4.9 to 47.3+/- 10.4% (cysts). Whilst mean recoveries of 44.4% (oocysts) and 36.3% (cysts) were achieved for high spike numbers of >300, values of 39.7% (oocysts) and 26.4% were observed for lower concentrations (50,100).
These recovery statistics met the acceptance criteria for the USEPA and FiltaMaxTM was subsequently accepted as an alternative concentration procedure in methods 1622/1623.
REFERENCES Anon (1999) The Water Supply (Water Quality) (Amendment) Regulations 1999. SI No 1542, subsequently incorporated into The Water Supply (Water Quality) Regulations 2000, SI No3184 Boynton H, Corscadden D, Francis C, Rushby L, Watkins J (2002a) Phase 1: Validation of a new filter for use for the regulatory monitoring of Cryptosporidium in drinking water. Report for Pall Life Sciences Boynton H, Corscadden D, Francis C, Rushby L, Watkins J (2002b) Phase 2: Validation of Pall Life Sciences Envirochek HV filter for the purpose of regulatory monitoring of Cryptosporidium in drinking water. Interlaboratory trials. Report for Pall Life Sciences
The enumeration of Giardia in drinking water (DWI 70/2/155) Final Report 13
Bukhari Z, McCuin RM, Fricker CR, Clancy JL (1998) Immunomagnetic separation of Cryptosporidium parvum from source water samples of various turbidities. Applied and Environmental Microbiology 64:4495-4499 Casemore DP, Hoyle B, Tynan P, Smith M with members of the PHLS project team (2001). Trial of a method for continuous monitoring of the concentration of Cryptosporidium oocysts in drinking water for Regulatory purposes. In Cryptosporidium: The Analytical Challenge Eds Smith M and Thompson KC 73-83 Clancy JL, Gollnitz WD, Tabib Z (1994) Commercial labs: How accurate are they? Journal of the American Water Works Association 86, 89-97 Clancy JL, McCuin RM, Hargy TM (2003) Recovery of Cryptosporidium oocysts from high volume samples. Awwa Research Foundation, Denver, 1-44 DiGiorgio CL, Gonzalez DA, Huitt CC (2002) Cryptosporidium and Giardia recoveries in natural waters by using Environment Protection Agency Method 1623 Applied and Environmental Microbiology 5952-5955 Drinking Water Inspectorate (DWI) (1999) Continuous sampling for Cryptosporidium in treated water supplies. Report for the Drinking Water Inspectorate, London UK Frost FJ Craun GF and Calderon RL (1996) Waterborne disease surveillence. Journal of the American Water Works Association 88:66-75 Hsu BM and Huang C (2000) Recovery of Giardia and Cryptosporidium from water by various concentration, elution and purification techniques. J. Environmental Quality 29: 1587-1593 Korich DG, Mead JR, Madore MS, Sinclair NA and Sterling CR (1990) Effects of ozone, chlorine dioxide, chlorine and monochloramine on Cryptosporidium parvum. Applied and Environmental Microbiology 56, 1423-1428 Kramer MH, Herwaldt BL, Craun GF, Calderon RL and Juranek DD (1996) Waterborne disease: 1993 and 1994. Journal of the American Water Works Association 88, 66-80 Kuhn RC, Rock CM and Oshima KH (2002) Effects of pH and magnetic material on immunomagnetic separation of Cryptosporidium oocysts from concentrated water samples. Applied and Environmental Microbiology 68: 2066-2070
The enumeration of Giardia in drinking water (DWI 70/2/155) Final Report 14
Lisle JT and Rose JB (1995) Cryptosporidium contamination of water in the USA and UK: a mini review. Journal of Water Supply and Technology-AQUA 44, 103-117 LeChevalier MW, Norton WD, Siegel JE, Abbaszadegan M (1995) Evaluation of the immunofluorescence procedure for detection of Giardia cysts and Cryptosporidium oocysts in water.Applied and Environmental Microbiology 61:690-697 Matheson Z, Hargy TM, McCuin RM, Clancy JL, Fricker CR (1998) An evaluation of the Gelman Envirochek capsule for the simultaneous concentration of Cryptosporidium and Giardia from water. Journal of Applied Microbiology 85:755-761 McCuin RM, Bukhari Z, Sobrinho J, Clancy JL (2001) Recovery of Cryptosporidium oocysts and Giardia cysts from source water concentrates using immunomagnetic separation. Journal of Microbiological Methods 45, 69-76 McCuin RM and Clancy JL (2003) Modifications to United States Environmental Protection Agency methods 1622 and 1623 for detection of Cryptosporidium oocysts and Giardia cysts in water. Applied and Environmental Microbiology 69 No1,267-274 Morgan-Ryan UM, Fall A, Ward LA, Hijjawi N, Sulaiman I, Fayer R, Thompson RCA, Olson M, Lal A and Xiao L (2002) Cryptosporidium hominis n.sp. (Apicomplexa; Cryptosporidiidae) from Homo sapiens. The Journal of Eukaryotic Microbiology 49 433-440 Moore AC, Herwaldt BL, Craun GF, Calderdon RL, Highsmith AK and Juranek DD (1994) Waterborne disease in the United States, 1991 and 1992 Journal of the American Water Works Association 86:87-99 Nieminski EC, Schaefer FW 111 and Ongerth JE (1995) Comparison of methods for detection of Giardia cysts and Cryptosporidium oocysts in water. Applied and Environmental Microbiology 61,1714-1719 Parton A, Mendez F and Sartory DP (1997) Evaluation of a novel filter for the rapid capture and concentration of Cryptosporidium oocysts from drinking water. Proceedings of the 2nd UK Symposium on Health-Related Water Microbiology, International Association on Water Quality, Warwick, 1997, 185-191 Parton AC, Parton A, Brewin B, Bergmann K, Hewson E, Sartory DP (2001 ) Development of a novel method for the capture, recovery and analysis of Cryptosporidium oocysts from high volume water samples. In: Cryptosporidium: The analytical challenge Eds Smith M and Thompson KC 110-119
The enumeration of Giardia in drinking water (DWI 70/2/155) Final Report 15
Rochelle PA, DeLeon R, Johnson A, Stewart MH, Wolfe RL (1999) Evaluation of immunomagnetic separation for recovery of infectious Cryptosporidium parvum oocysts from environmental samples. Applied and Environmental Microbiology 65:841-845 Sartory DP, Parton A, Parton AC, Roberts J, Bergmann K (1998) Recovery of Cryptosporidium oocysts from small and large volume water samples using a compressed filter system. Letters in Applied Microbiology 27: 318-322 Standing Committee of Analysts (SCA) (1990) Methods for the examination of water and associated materials. Isolation and identification of Giardia cysts. Cryptosporidium oocysts and free living pathogenic amoebae in water etc 1989. Standing Committee of Analysts, Department of the Environment, Her Majesty’s Stationery Office, London, United Kingdom Shepherd KM and Wyn-Jones AP (1995)Evaluation of different filtration techniques for the concentration of Cryptosporidium oocysts from water. Water Science and Technology 31:425-429 Stanfield G, Carrington E, Albinet F, Compagnon B, Dumoutier N, Hambsh B, Lorthioy A, Medema G, Pezoldt H, deRoubin M-R, deLohman A, Whitmore T (2000) An optimised and standardised test to determine the presence of the protozoa Cryptosporidium and Giardia in water. Water Science and Technology 41 No 7 103-110 Sturbaum GD, Klonicki PT, Marshall MM, Jost BH, Clay BL and Sterling CR (2002) Immunomagnetic separation (IMS)-fluorescent antibody detection and IMS-PCR detection of seeded Cryptosporidium parvum oocysts in natural waters and their limitations. Applied and Environmental Microbiology, 68: 2991-2996 US Environmental Protection Agency (1996) Information collection rule. ICR microbial laboratory manual. EPA/600/R-95/L78. Office of Research and Development. US Environmental Protection Agency. Washington DC US Environmental Protection Agency (1997) Method 1622: Cryptosporidium in water by filtration/IMS/FA and viability by DAPI/PI, May 1997 draft EPA/821-D-97/001. USEPA, Office of Water, Washington, DC US Environmental Protection Agency (1999) Method 1623: Cryptosporidium and Giardia in water by filtration/IMS/FA. EPA/821-R-99/006. USEPA, Office of Water, Washington, DC US Environmental Protection Agency (1999) Method 1622: Cryptosporidium in water by filtration/IMS/FA . EPA/821-R-99/001. USEPA, Office of Water, Washington, DC
The enumeration of Giardia in drinking water (DWI 70/2/155) Final Report 16
Vesey G, Slade JS, Byrne M, Shepherd K and Fricker CR (1993) A method for the concentration of Cryptosporidium oocysts from water Journal of Applied Bacteriology 75,82-86 Whitmore TN and Carrington EG (1993) Comparison of methods for recovery of Cryptosporidium from water . Water Science and Technology 27, 69-76 Yakub GP and Stadterman-Knauer KL (2000) Evaluation of immunomagnetic separartion for recovery of Cryptosporidium parvum and Giardia duodenalis from high iron matrices. Applied and Environmental Microbiology, 66:3628-3631
The enumeration of Giardia in drinking water (DWI 70/2/155) Final Report 17
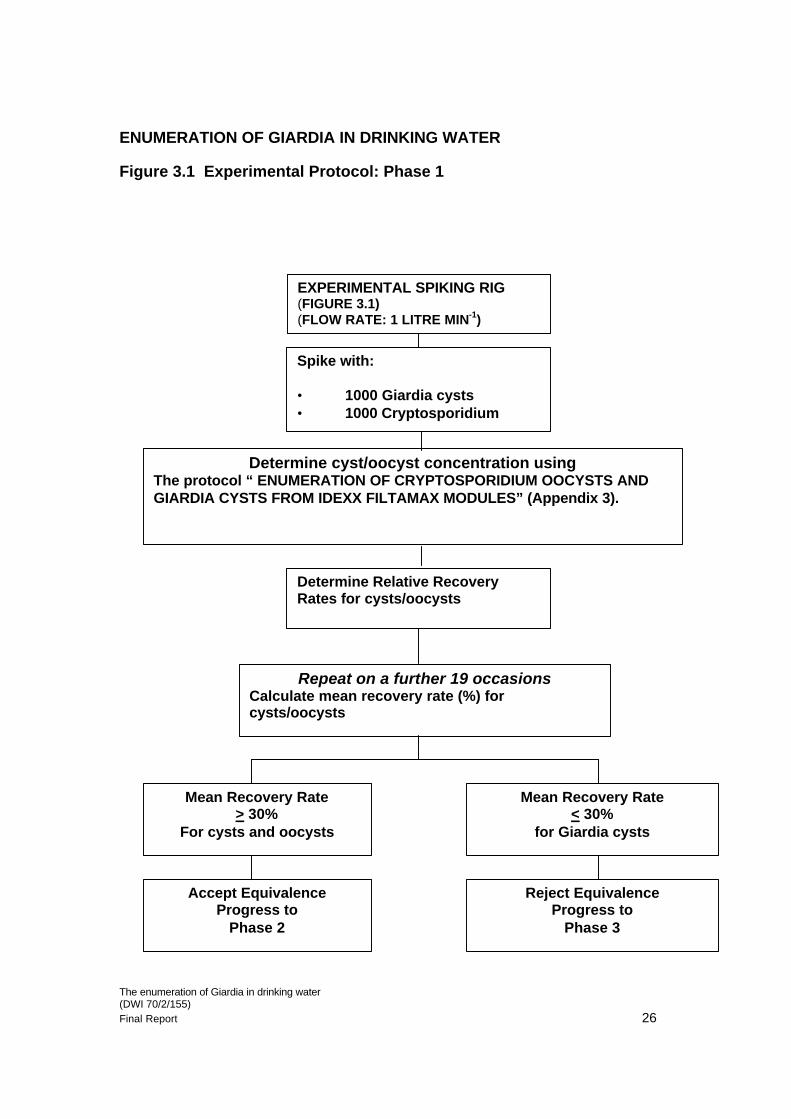
3 EXPERIMENTAL PROTOCOL The overall objective of this research initiative was defined in the original Tender document as follows: ‘to develop methods for the isolation and enumeration of Giardia cysts in drinking water, making the maximum use of the technology and methods currently used for Regulatory Cryptoporidium monitoring’. The primary objective (6a) ‘to investigate the possibility of identifying and enumerating Giardia cysts on the slides prepared for Regulatory Cryptosporidium analysis’ was further differentiated into four (6b-d) subsidiary sections which gave definition for alternative approaches should it prove difficult or impossible to satisfy 6a by simple modification of the analytical method currently adopted for Regulatory Cryptosporidium monitoring. Our approach was to make the basic assumption that, with minor method modifications, objective 6a was achievable. Thus, Phase 1 was designed to detect any potential problems associated with the basic approach of modifying the Regulatory method by incorporating the Dynal GC Combo system for the IMS recovery and staining of oocysts/cysts. Thus, only the established Filta-MaxTM filter was evaluated in this respect. All subsequent trials (Phase 2 and Field Trials) include parallel evaluations of the EnvirochekTM (high volume) filter. 3.1 Phase 1: Investigation of the possibility of identifying and enumerating Giardia cysts on slides prepared for Regulatory Cryptosporidium analysis The programme of work associated with Phase 1 of the investigation is summarised in Figure 3.1. 3.1.1 Preparation and enumeration of stock suspensions: Source of Cryptospridium oocysts/Giardia cysts Source of Cryptosporidium parvum/ Giardia duodenalis cysts (Master stocks) (i) Oocysts Cryptosporidium oocysts were obtained from Moredun Scientific Ltd. Inactivated oocysts (batches C4/02 and C1/03) were supplied in Phosphate Buffered Saline (PBS) at a concentration of 1x 107.2ml-1
(ii) Cysts Giardia cysts were obtained from Biotech Frontiers (BTF Decisive Microbiology (Australia))via TCS Biosciences Ltd, Buckingham UK. Batches of G61 and G76 were supplied in PBS at a concentration of 1x 10⁶. ml-1 Working (stock) suspensions were prepared by serially diluting the Master stocks received from the suppliers in 0.01M PBS. The actual number of
The enumeration of Giardia in drinking water (DWI 70/2/155) Final Report 18
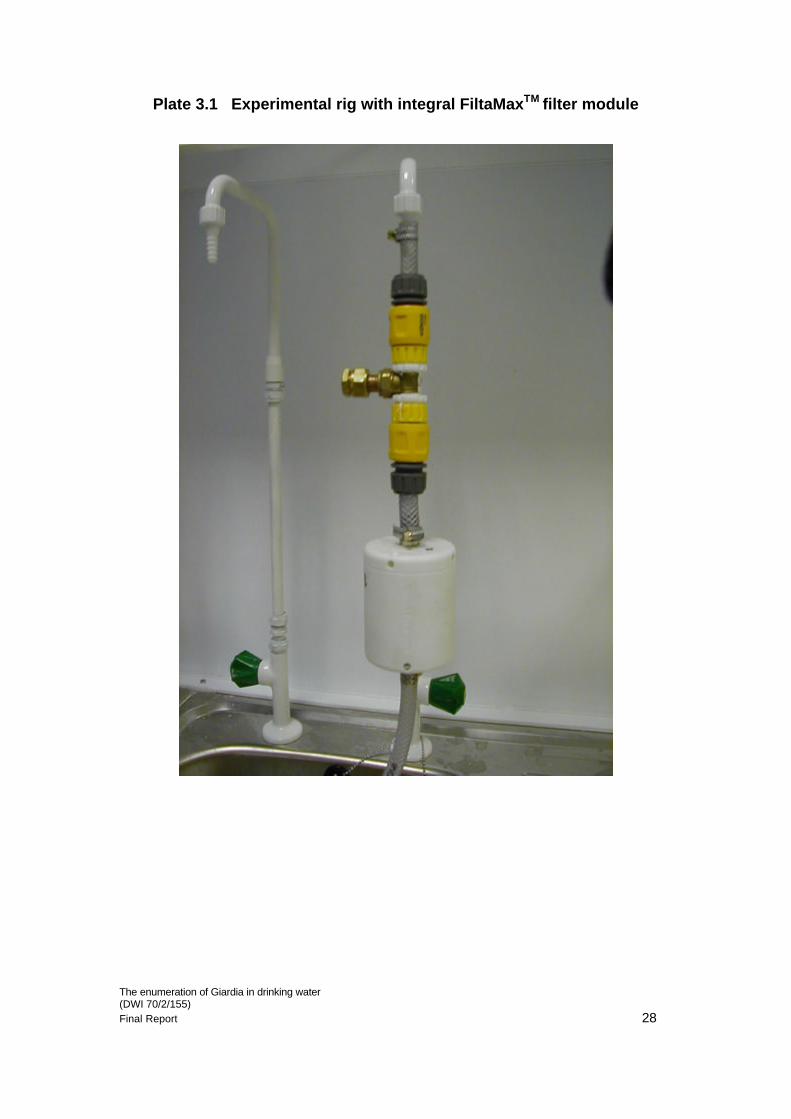
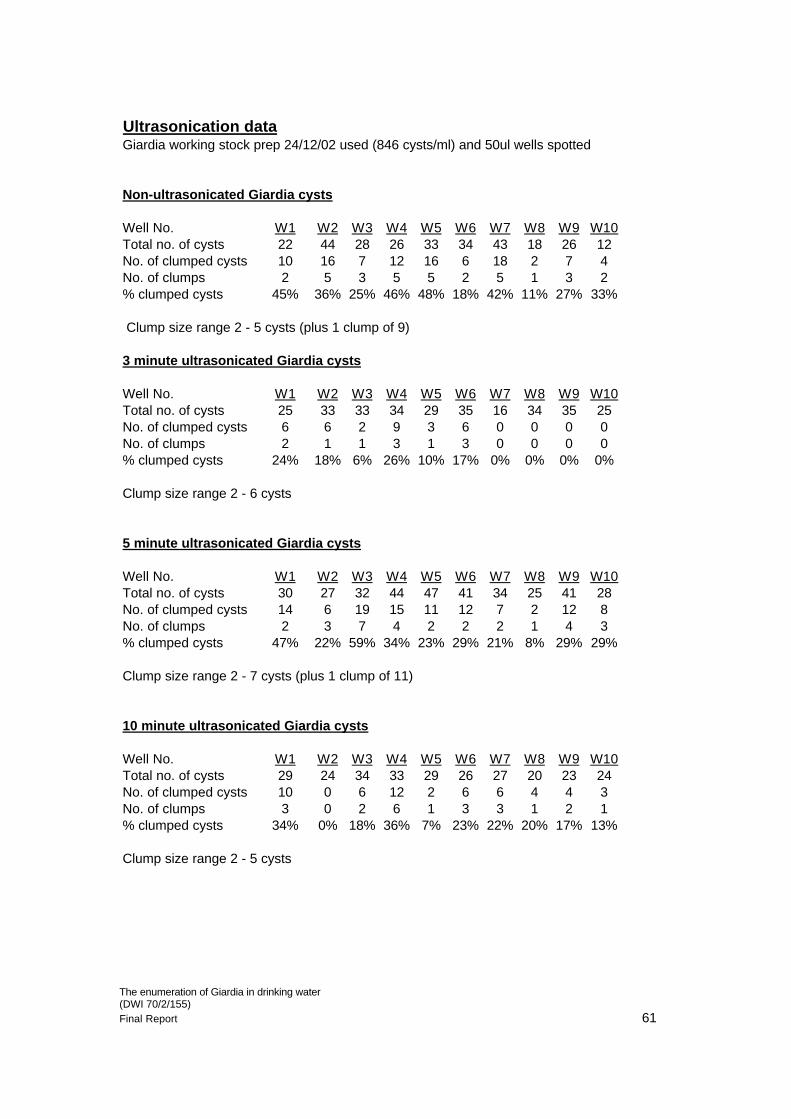
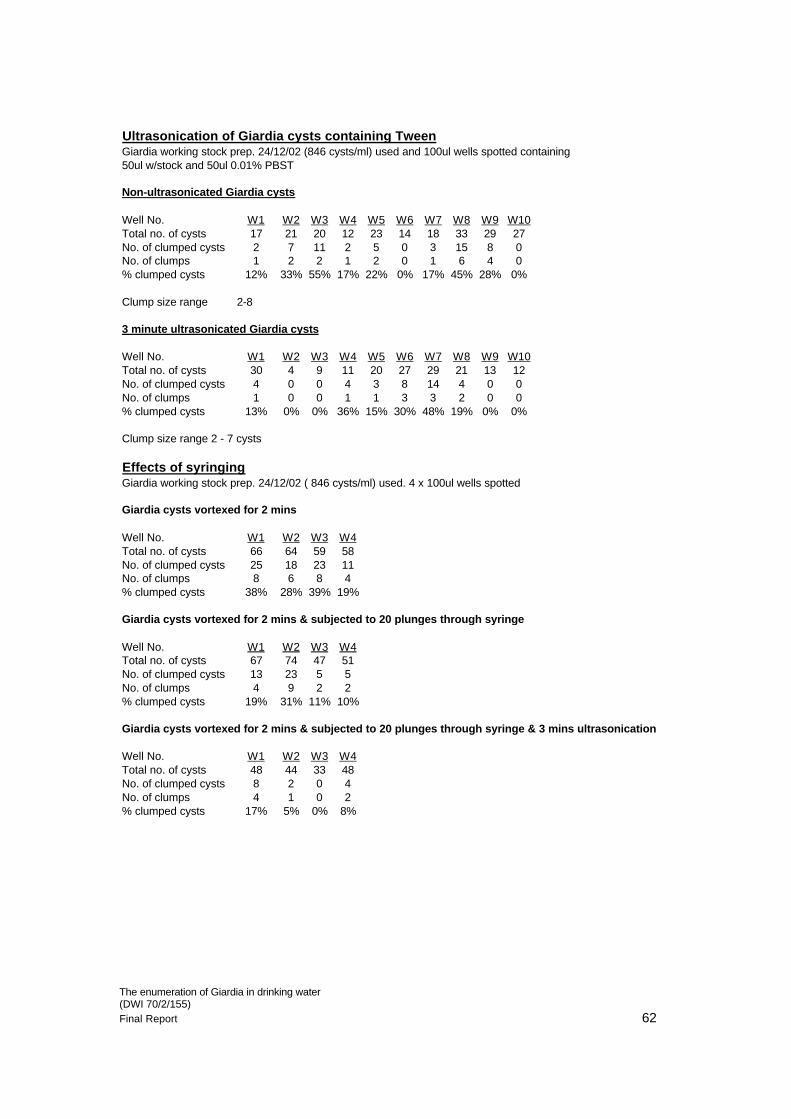
oocysts/cysts in the stock suspensions was then determined by vortexing the working stock for 30 seconds and then spotting 10x50µm aliquots of the resulting suspension into wells. The slides were then dried for 30 minutes, stained for 60-90 minutes using neat Crypto/Giardia FITC staining reagent (batch RR295A, TCS) and mounted with DABCO mounting medium (batch RMG21, TCS). The number of oocysts/cysts in each well was then determined using fluorescence microscopy. The mean for 10 wells was calculated and expressed as a count per 50µl (Table 3.1). All working stocks were assigned an expiry date of one month from the date of preparation. During the preparation of Giardia stock suspensions and subsequent microscopic examination to estimate the number of cysts in the spike inocula, it was noted that the cysts supplied by TCS BioSciences had a propensity for clumping (Appendix 1.1). This phenomenon was observed by our analysts from the outset of the project and, whilst there was consensus opinion that the issue would have relatively little significance for recovery data generated during Phase 1 (1000 spike concentration) (preliminary data indicated consistent recoveries of >30% for both cysts/oocysts), it was generally considered that recovery statistics could potentially be seriously compromised at lower (100,10) spike concentrations (Phase 2), where clumped cysts would represent a significant proportion of the spike suspension. A comprehensive investigation was undertaken to identify either a practical procedure for disaggregation of the clumps or an alternative source of Giardia cysts that would remain monodisperse. Several methods of disaggregation were trialed, without reproducible success ( Table Appendix 1.1) and, following consultation with the DWI Project Manager and discussions with colleagues in the US (Appendix 1.2), the investigation was continued using the TCS EasySeed product (Batch ES-CG 1000-24) which is a combination seed of Cryptosporidium parvum (IOWA) oocysts and Giardia duodenalis cysts. The oocysts/cysts remained essentially monodisperse in this preparation presumably because 1) they were prelabelled to facilitate sorting by flow cytometry 2) they were suspended in Tween which is an anti- clumping agent and 3) the concentration of cysts/oocysts is relatively low (1000, 100, 10 per 1.6ml compared to 1x10⁶ / ml in the bulk preparation), giving little opportunity for clumping. This suspension was used at the latter stages of Phase 1 (Runs 53-57) to assess whether or not recovery rates were comparable with the original Moredun oocyst/TCS cyst preparation. 3.1.2 Experimental rig A diagrammatic representation of the experimental rig is given in Figure 3.2 Two experimental rigs (A and B) were attached to mains taps in the STL Microbiology laboratory (Plate 3.1). This main is supplied by a Water Treatment Works which treats a lowland river source using coagulation, flocculation and sedimentation followed by gravity filtration and ozonation.
The enumeration of Giardia in drinking water (DWI 70/2/155) Final Report 19
Free and Total chorine measurements at the tap were 0.03 and 0.06 mg.l-1 respectively. Following rigorous testing to identify potential sources of water loss, each rig containing a FiltaMaxTM filter, was charged with approximately 1 litre of mains water before being spiked with around 1000 cysts/oocysts. The spike suspension was inoculated by sterile syringe through a septum via the spiking port immediately above the FiltaMaxTM filter unit (Plate 3.2). The spiking port consisted of a silicon/teflon chromatography septum fitted within a side tube which acted as a needle shield and as a security cover should the integrity of the septum be compromised during the filtration period. Following inoculation, approximately 1000 litres of water was allowed to flow through the filter at a flow rate of no greater than 1 litre.min-1. On completion of each run, ie after approximately 16 hours (Appendix 2), the FiltaMaxTM filter was removed and transported to the Cryptosporidium laboratory for processing using the STL procedure (W14) for ’Enumeration of Cryptosporidium oocysts and Giardia cysts from IDEXX FiltaMax TM (non-regulatory)’ (Appendix 3.1) within 2 hours. Method W14 differs from the prescribed Regulatory method for Cryptosporidium oocysts in that it replaces Cryptosporidium Dynabeads with GC Combo Dynabeads to effect co-immuncapture of Giardia cysts and Cryptosporidium oocysts. Subsequent analytical procedures differ in so far as they follow the manufacturer’s instructions. 3.1.3 Inter-run cleaning regime The experimental rigs were thoroughly cleaned between each spiking run using the STL Standard Operating Procedure: General laboratory hygiene and cleaning and maintenance of laboratory equipment (CRY OP F2) (Appendix 3.2). Briefly, all of the tubing associated with the experimental rigs was soaked in 1% Decon hot solution for 2 minutes. It was then rinsed twice with Cryptosporidium/Giardia-free water. The equipment was then left to dry at room temperature. 3.1.4 Quality Control Procedures For all laboratory-based experiments, Quality Control(QC) procedures were based upon those required for Regulatory Cryptosporidium monitoring. Additional runs were accommodated at several points during Phase 1 as QC measures: • The experimental rig was spiked with an equivalent concentration of
Cryptosporidium oocysts alone, concentrated using Crypto Dynabeads but stained using the Crypto/Giardia FITC staining reagent. This control was included to identify any difference in recovery attributable to the spiking/isolation/staining and enumeration of both oocysts and cysts.
• Negative controls using unspiked filters were included to assess the efficacy of the inter-run cleaning regime/microscopist accuracy.
The enumeration of Giardia in drinking water (DWI 70/2/155) Final Report 20
Three positive control slides spotted with between 80-120 cysts/oocysts per slide to check fluorescence response and antibody staining were prepared with each batch of stained slides in line with Regulatory requirements. Three negative slides, ie without cysts/oocysts were prepared in the same way. To minimise variability associated with analyst interpretation, only one senior member of staff was employed to read the slides. Duplicate and/or verification slide readings were undertaken for 20% of all runs, the former carried out by an additional senior analyst, the latter by an independent consultant (Mr Dave Dawson, Campden and Chorleywood Food Research Association). The original count for ocysts/cysts recorded by our Senior analyst was accepted as the definitive reading provided either the duplicate or verification counts fell within the acceptable range of +/- 10%. These data were then entered on to the spreadsheet and used in the statistical analysis. 3.1.5 Identification of Cryptosporidium oocysts and Giardia cysts Slides generated during Phase 1 were stained as described previously (Section 3.1.1). Confirmation of oocysts/cysts was not undertaken during this phase as it was considered impractical in terms of number of features. Thus, oocysts and cysts were identified by fluorescence, size and shape alone.
Strongly fluorescing compared with any background fluorescence
Size 4-6µm in diameter 8-14µm long; 7-10µm wide
Shape More or less spherical Ovoid The condition of the Giardia cysts in spiking and post recovery was monitored for any significant changes which may have potentially affected the basic criteria for their definition. 3.1.6 Generation of recovery data Following staining and microscopic examination, the total number of cysts and oocysts were determined and recorded. The percent recovery for both cysts and oocysts was then calculated for each spiking experiment. The spiking/recovery/enumeration process (3.1.2; 3.1.3; 3.1.4) was repeated on 19 further occasions to generate a total of 20 replicate data points*. *Five additional runs (53-57) were included to establish/reject equivalence of TCS EasySeed suspension with original Moredun/TCS preparation (3.1.1)
The enumeration of Giardia in drinking water (DWI 70/2/155) Final Report 21
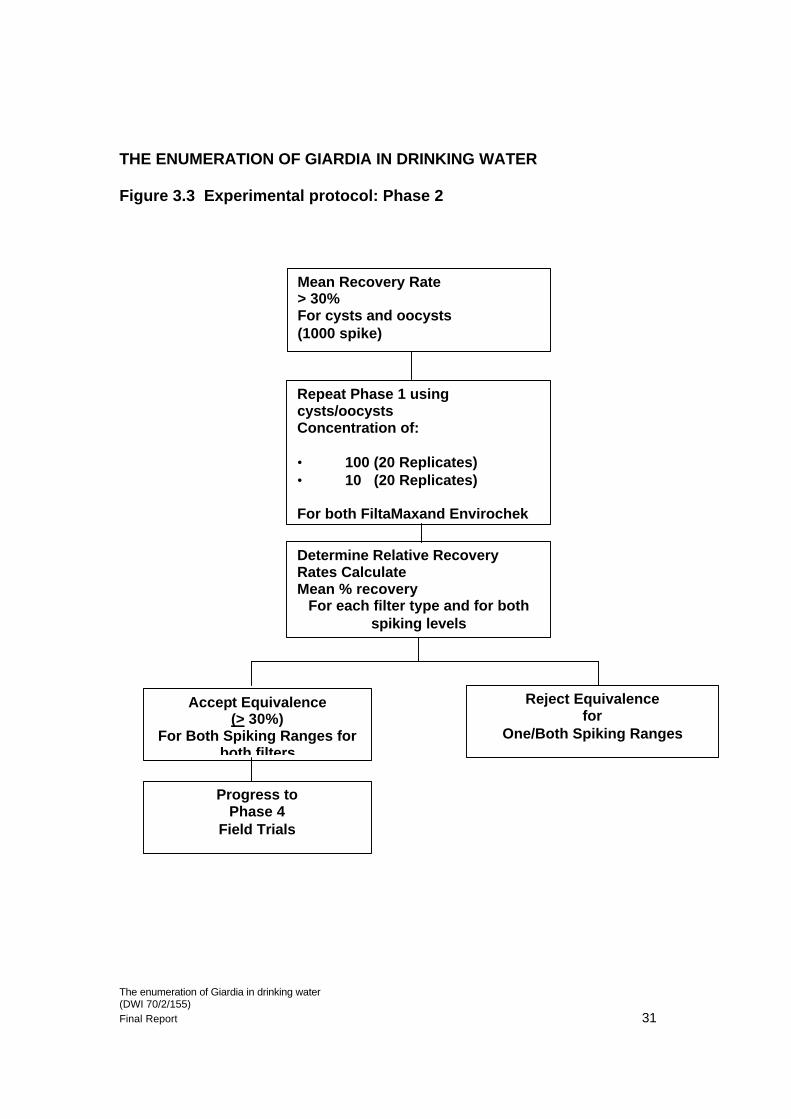
3.2 Phase 2: Evaluation of the recovery performance for FiltaMaxTM and EnvirochekTM filters in terms of co-isolation of Cryptosporidium oocysts/Giardia cysts The original proposed programme of work is summarised in Figure 3.3 3.2.1 Preparation of stock suspensions: Source of Cryptosporidium oocysts/Giardia cysts The EasySeed oocyst/cyst suspension was obtained from BTF via TCS Biosciences, and used for all of the Phase 2 spike/recovery experiments involving both oocysts and cysts. Stocks of oocysts/cysts at concentrations of 100/100 (Batches ES-CG 100-121,100-125, 100-127) and 10/10 (Batch ES-CG 10-129) were supplied in approximately 1.6ml PBS 3.2.2 Experimental rig Two additional experimental rigs, (C and D) each containing an EnvirochekTM filter were attached to mains taps in the STL Microbiology laboratory in parallel to rigs A and B (Plate 3.3). Spikes were inoculated via the spiking port immediately above each of the filters and, following a flow of approximately 1000 litres water, the filters were removed and transported to the Cryptosporidium laboratory for processing within 2 hours. FiltaMaxTM filters were processed as described previously (Section 3.1.2; Appendix 3) and EnvirochekTM filters according to the DWI Standard Operating Protocol (DWI, 2003). The rigs were cleaned using the inter-run cleaning regime described previously (Section 3.1.3), and QC and identification criteria were applied as for Phase 1 (Sections 3.1.4; 3.1.5). 3.2.3 Identification of Cryptosporidium oocysts and Giardia cysts Slides were stained and oocysts and cysts identified as described previously (Section 3.1.1). Confirmation with DAPI and DIC was applied to a random 5% of the oocysts/cysts recovered from 100/100 spikes and to all of those recovered from 10/10 spikes. 3.2.4 Generation of recovery data Following staining and microscopic examination, the total number of cysts and oocysts was determined and recorded. The percent recovery for both cysts and oocysts was then calculated for each spiking experiment. The spiking/recovery/enumeration process was repeated on 19 further occasions for both FiltaMaxTMand EnvirochekTM filters and for spiking levels of both 100,10 cysts/oocysts, to generate 20 replicate data points for each concentration and each filter type.
The enumeration of Giardia in drinking water (DWI 70/2/155) Final Report 22
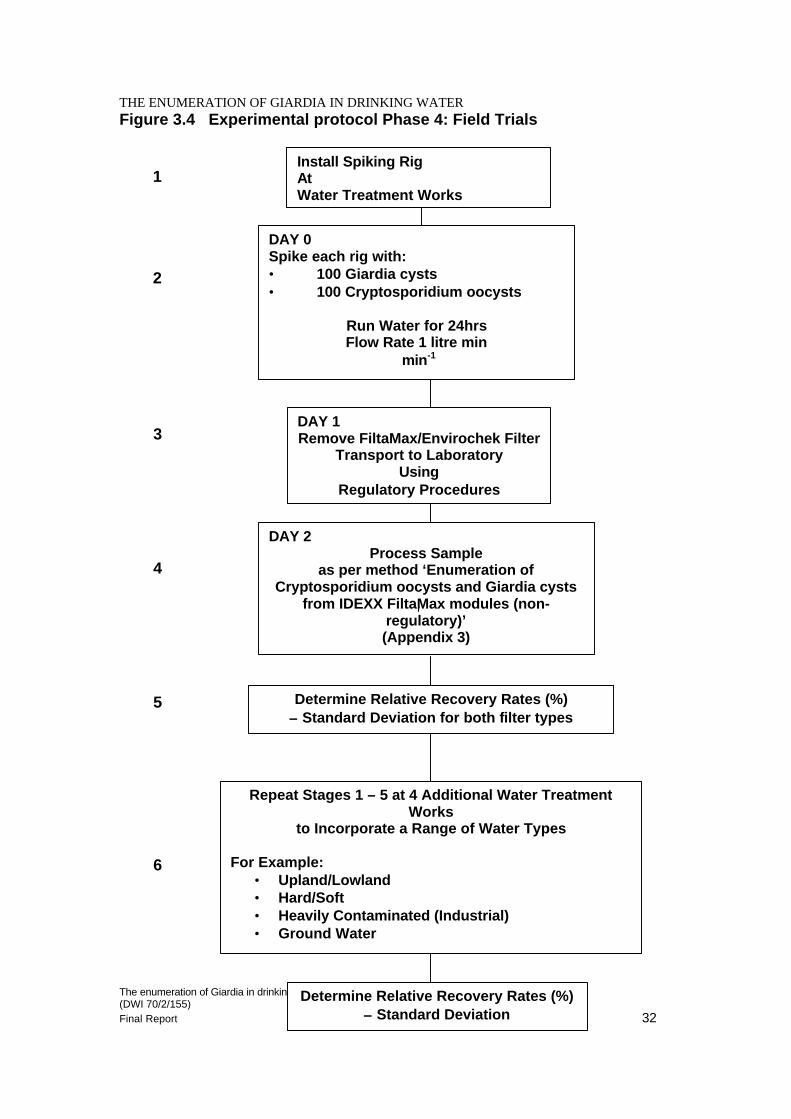
3.3 Phase 4: Field Trials: Evaluation of the recovery performance for FiltaMaxTM and EnvirochekTM filters in terms of co-isolation of Cryptosporidium oocysts/Giardia cysts at five Water Treatment Works (WTW) The original proposed programme of work is summarised in Figure 3.4. 3.3.1 Preparation of stock suspensions: Source of Cryptosporidium oocysts/Giardia cysts. EasySeed oocyst/cyst suspensions were used for all of the Phase 4 recovery experiments. Stocks of oocysts/cysts at 100/100 were supplied at concentrations of 100/100 in approximately 1.6ml PBS. 3.3.2 Field Trials sites All of the Field Trials sites are owned and managed by Severn Trent Water and were chosen to provide a spectrum of different water sources and treatment regimes.
WTW 1 is a 25 Ml/day treatment works with direct abstraction from the River Severn (14 Ml/day), supplemented from a borehole source to meet additional demand. The River Severn upstream of the WTW receives sewage effluent discharges and agricultural run-off, including slurry discharges. The river water is coagulated with alum and polyelectrolyte before clarification and rapid-gravity filtration (back-wash water is not recycled). The water is then transferred to GAC contactors for pesticide removal and taste and odour control. The product water is chlorinated in contact tanks for 4 hours to give a minimum residual of 0.6 mg.l-1 free chlorine before pumping to a final water reservoir and distribution (after dechlorination to 0.3 mg.l-1 free chorine). The works also adds phosphoric acid for plumbosolvency control.
WTW 2 is a 5 Ml/day simple groundwater source abstracting from two 122m deep boreholes in an aquifer partially protected by a clay drift. The borehole water may be blended on site with WTW 1 water to assist with the abstraction licence (at the time of this study this source did not receive water from WTW 1). Disinfection is achieved using sodium hypochlorite on site to achieve a residual of 0.2 mg.l-1 free chlorine.
WTW 3 is a 6 Ml/day groundwater source abstracting from a 150 m deep borehole in a confined aquifer with elevated iron and manganese levels. The water is passed through filters to remove iron and manganese, aerated through an aeration tower and undergoes a 30 minute contact chlorination process which is classified as marginal chlorination, to give a residual of 0.25 mg.l-1 free chlorine. The water is then pumped via high lift pumps to a supply reservoir. The works also adds phosphoric acid for plumbosolvency control using a rig on site.
The enumeration of Giardia in drinking water (DWI 70/2/155) Final Report 23
WTW 4 is a 90 Ml/day treatment works with direct river abstraction from the River Derwent . The River Derwent upstream of the WTW receives sewage effluent discharges and agricultural run-off from the City of Derby. The river water is coagulated with ferric sulphate and polyelectrolyte before clarification and rapid-gravity filtration (back-wash water is recycled via sludge thickeners back to the head of the works). The water is then transferred to GAC contactors for pesticide removal and taste and odour control. The product water is chlorinated in a contact tank for 2 hours to give a minimum residual of 0.9 mg.l-1 free chlorine before dechlorination reduces the residual to 0.5 mg.l-1. The works also adds phosphoric acid for plumbosolvency control.
WTW 5 is a 135 Ml/day treatment works with abstraction form the River Derwent, into the 2000 Ml reservoir on site. The River Derwent upstream of the WTW receives sewage effluent discharges and agricultural run-off, including slurry discharges, from the City of Derby. The river water is coagulated with ferric sulphate and polyelectrolyte before clarification and rapid-gravity filtration (back-wash water is recycled via sludge thickeners back to the reservoir). The water is then transferred to GAC contactors for pesticide removal and taste and odour control. The product water is chlorinated in a contact tank for 2 hours to give a minimum residual of 0.9 mg.l-1 free chlorine before dechlorination reduces the residual to 0.5 mg.l-1. The works also adds phosphoric acid for plumbosolvency control.
3.3.3 Experimental rig
Two experimental rigs, identical to those used in Phases 1 and 2 and containing either and EnvirochekTM or FiltaMaxTM filter were installed in parallel at each of the identified Field Trials sites.
Oocyst/cyst spikes were inoculated into the rigs via the spiking ports immediately above the filters as described previously (Section 3.1.2). Water was allowed to flow for approximately 24 hours at a rate of 1 litre per minute to reflect conditions prescribed for Regulatory monitoring for Cryptosporidium (Appendix 2.2). The filters were then removed and transported to the laboratory for processing within 24 hours of receipt.
The rigs were cleaned using the inter-run cleaning regime after each run (Section 3.1.3).
Negative controls using unspiked filters were included (1 per site) to assess the efficacy of the inter-run cleaning regime/microscopist accuracy.
3.3.4 Identification of Cryptosporidium oocysts and Giardia cysts
Filters were processed and oocysts and cysts identified as decribed previously (Section 3.1.1) and confirmation with DAPI and DIC was applied to a random 5% of the oocysts/cysts recovered.
The enumeration of Giardia in drinking water (DWI 70/2/155) Final Report 24
3.3.5 Generation of recovery data
Following staining and microscopic examination, the total number of cysts and oocysts isolated from each filter was determined and recorded. The percentage recovery for both cysts and oocysts isolated from each filter was then calculated for both FiltaMaxTM and EnvirochekTM filters. The spiking/recovery/enumeration process was repeated for each filter on 9 additional occasions at each of the Trials sites. A median percent recovery was calculated for each filter type and for each site.
The enumeration of Giardia in drinking water (DWI 70/2/155) Final Report 25
Table 3.1 Preparation of Working (Stock) suspensions: Enumeration of Giardia cysts/Cryptosporidium oocysts Giardia cysts
Determine cyst/oocyst concentration using The protocol “ ENUMERATION OF CRYPTOSPORIDIUM OOCYSTS AND GIARDIA CYSTS FROM IDEXX FILTAMAX MODULES” (Appendix 3).
Repeat on a further 19 occasions Calculate mean recovery rate (%) for cysts/oocysts
Mean Recovery Rate < 30%
for Giardia cysts
Reject Equivalence Progress to
Phase 3
Accept Equivalence Progress to
Phase 2
Mean Recovery Rate > 30%
For cysts and oocysts
Determine Relative Recovery Rates for cysts/oocysts
The enumeration of Giardia in drinking water (DWI 70/2/155) Final Report 27
ENUMERATION OF GIARDIA IN DRINKING WATER Figure 3.2: Experimental rig
111
‘Hozelock’ type connection
FiltaMaxTM/ EnvirochekTM filter unit‘
Water meter
Flow restrictor
septum
Spiking port
Mains Supply
Waste
The enumeration of Giardia in drinking water (DWI 70/2/155) Final Report 28
Plate 3.1 Experimental rig with integral FiltaMaxTM filter module
The enumeration of Giardia in drinking water (DWI 70/2/155) Final Report 29
Plate 3.2 Inoculation of oocyst/cyst spike via spiking port
The enumeration of Giardia in drinking water (DWI 70/2/155) Final Report 30
Plate 3.3 Experimental rig with integral FiltamaxTM and Envirochek TM filter modules
The enumeration of Giardia in drinking water (DWI 70/2/155) Final Report 31
THE ENUMERATION OF GIARDIA IN DRINKING WATER Figure 3.3 Experimental protocol: Phase 2
Repeat Phase 1 using cysts/oocysts Concentration of: • 100 (20 Replicates) • 10 (20 Replicates) For both FiltaMaxand Envirochek
Reject Equivalence for
One/Both Spiking Ranges
Progress to Phase 4
Field Trials
Accept Equivalence (> 30%)
For Both Spiking Ranges for both filters
Determine Relative Recovery Rates Calculate Mean % recovery
For each filter type and for both spiking levels
Mean Recovery Rate > 30% For cysts and oocysts (1000 spike)
The enumeration of Giardia in drinking water (DWI 70/2/155) Final Report 32
THE ENUMERATION OF GIARDIA IN DRINKING WATER Figure 3.4 Experimental protocol Phase 4: Field Trials
Install Spiking Rig At Water Treatment Works
DAY 0 Spike each rig with: • 100 Giardia cysts • 100 Cryptosporidium oocysts
Run Water for 24hrs Flow Rate 1 litre min
min-1
DAY 2 Process Sample
as per method ‘Enumeration of Cryptosporidium oocysts and Giardia cysts
from IDEXX FiltaMax modules (non-regulatory)’ (Appendix 3)
Repeat Stages 1 – 5 at 4 Additional Water Treatment Works
to Incorporate a Range of Water Types For Example:
Determine Relative Recovery Rates (%) ±± Standard Deviation for both filter types
Determine Relative Recovery Rates (%) ±± Standard Deviation
DAY 1 Remove FiltaMax/Envirochek Filter
Transport to Laboratory Using
Regulatory Procedures
1
2
3
4
6
5
The enumeration of Giardia in drinking water (DWI 70/2/155) Final Report 33
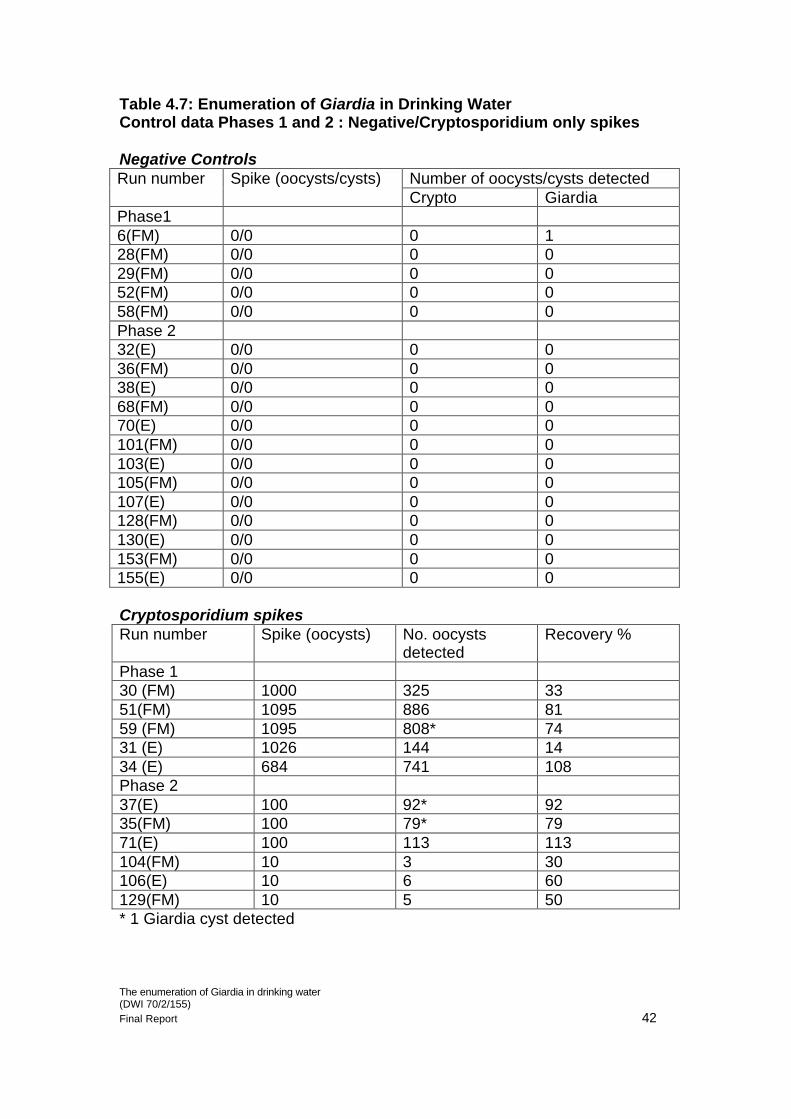
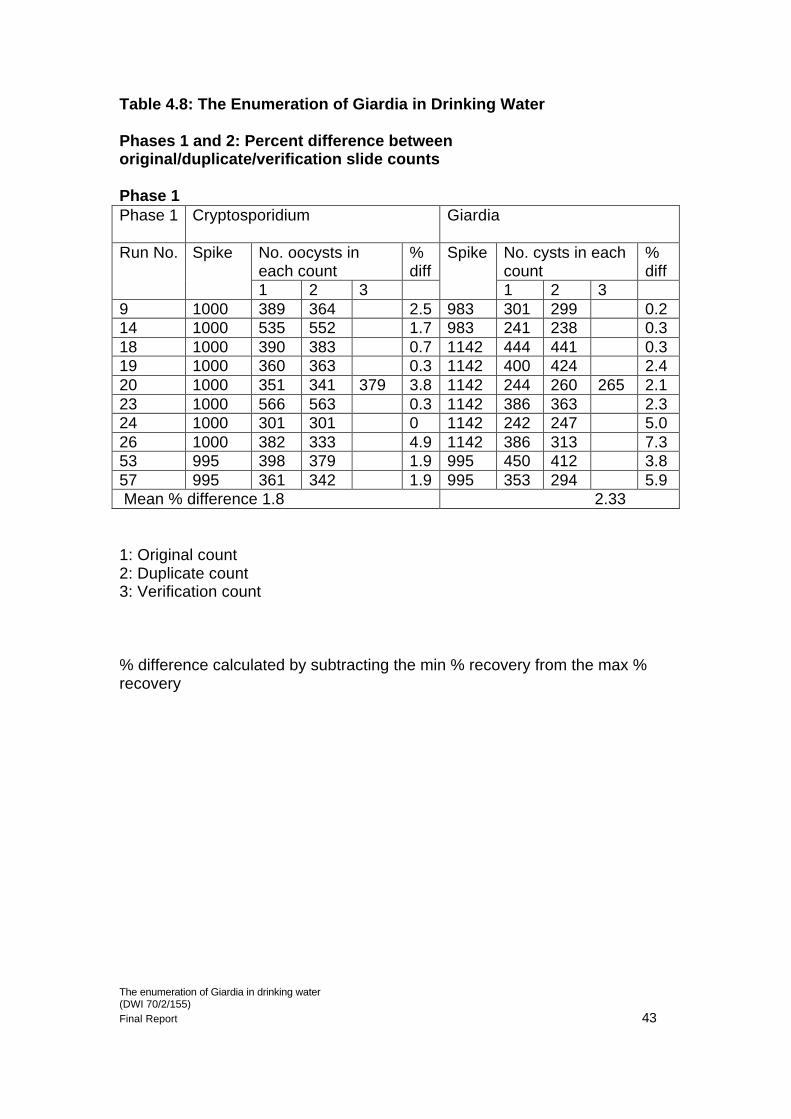
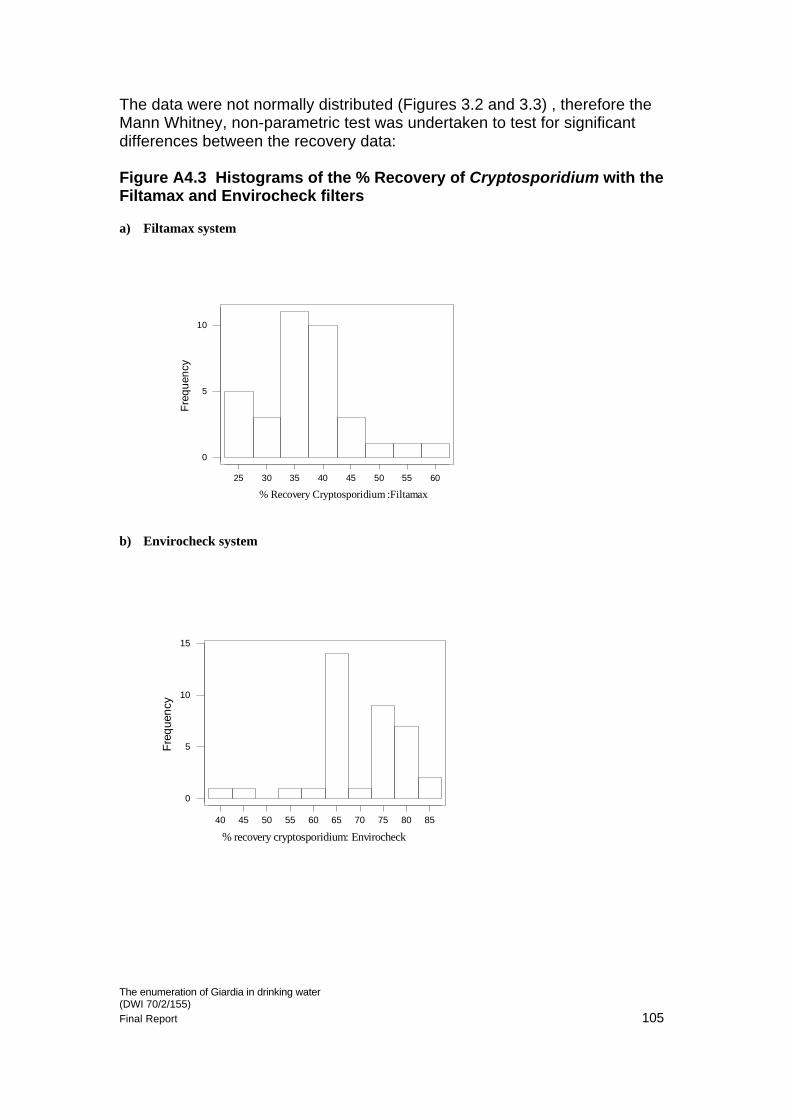
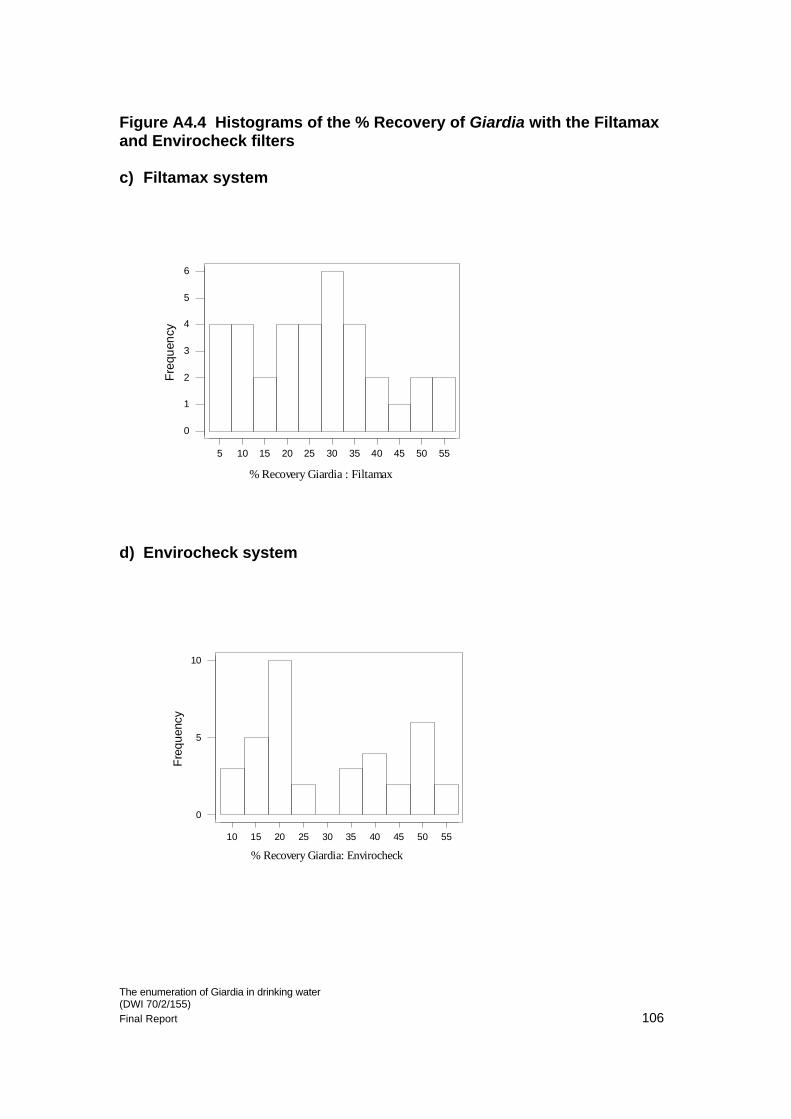
4 RESULTS 4.1 Phases 1 and 2: Laboratory trials Recovery data are summarised in Tables 4.1-4.8. Statistical analysis of the data is presented in full in Appendix 4. Negative controls and Cryptosporidium only spikes were excluded from the statistical analysis and are presented elsewhere (Tables 4.7). On analysis, it was apparent that the recovery data generated from laboratory experiments were not normally distributed (Appendix 4), thus, the Mann Whitney non-parametric test was applied to determine significance using Minitab Release 13 software. 4.1.1 Phase 1: Investigation of the possibility of identifying and enumerating Giardia cysts on slides prepared for Regulatory analysis 1000 oocyst/cyst spike • There was no significant difference between recovery rates for the spike
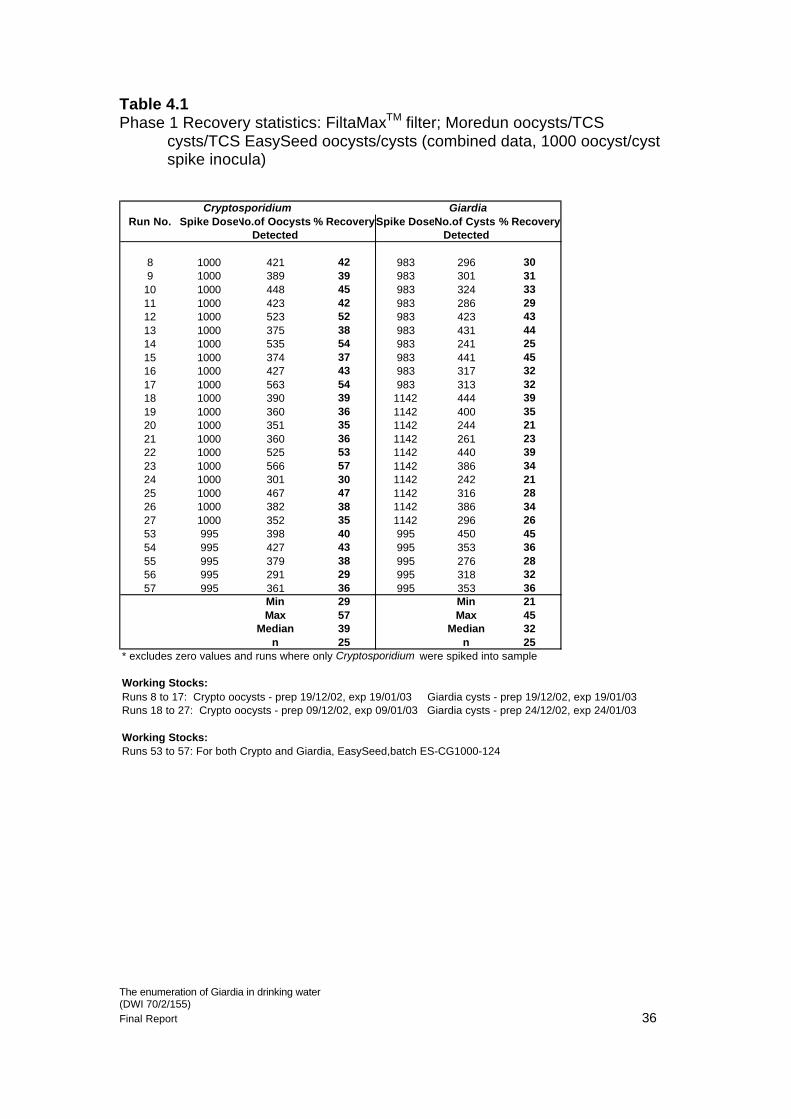
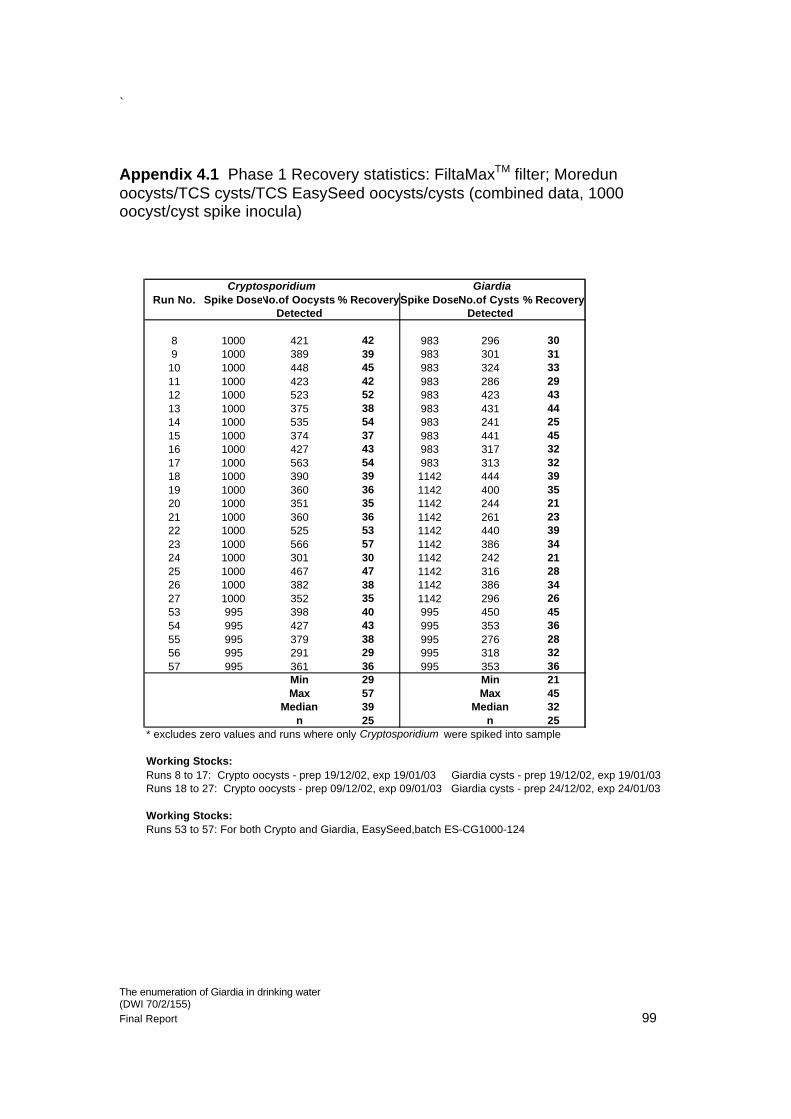
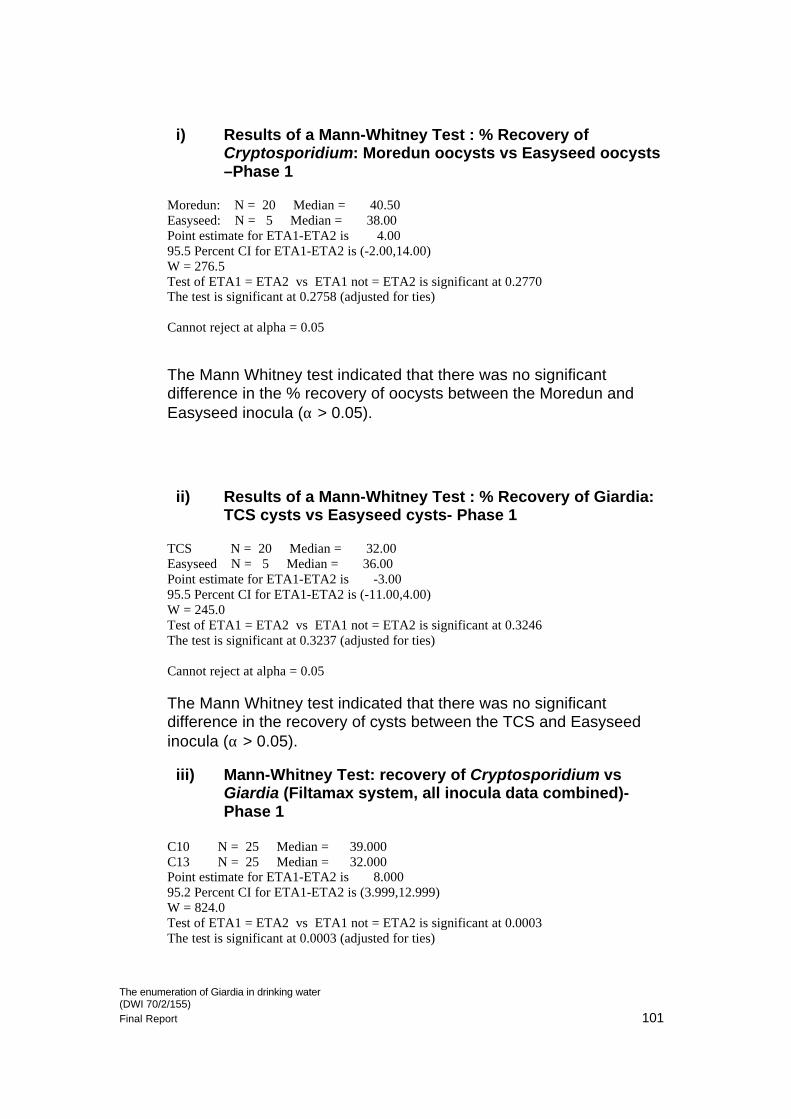
containing Cryptosporidium oocysts (Moredun) and TCS Giardia cysts (Runs 8-27) and those for TCS EasySeed suspensions (Runs 53-57)(p(α) >0.05) (Appendix 4(i)). Thus, the data were combined to give a total of 25 observations (Table 4.1)
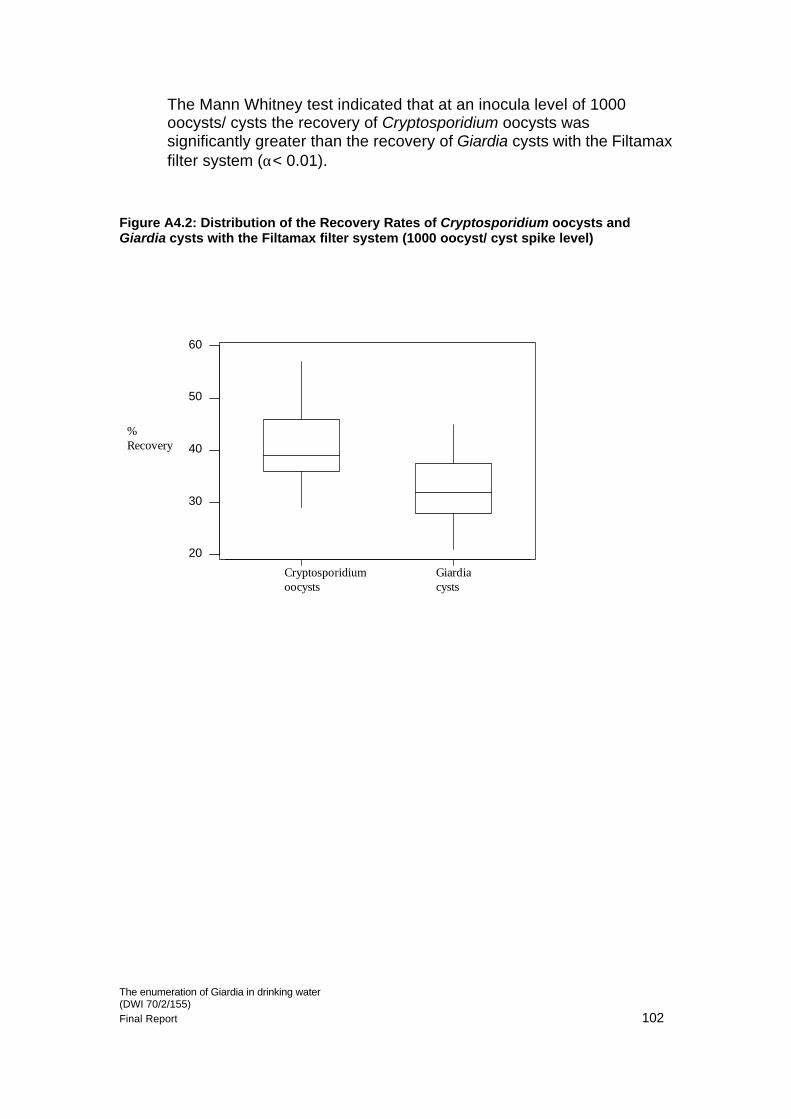
• The median recovery rates for Cryptosporidium oocysts and Giardia cysts
were 39 and 32% respectively. The Mann Whitney test indicated that, at an inoculum concentration of 1000/1000 oocysts/cysts, the recovery of Cryptosporidium oocysts was significantly greater than the recovery of Giardia cysts with the FiltaMaxTMsystem. Whilst these values were significantly different from each other (p(α) < 0.01), both exceeded the target value of > 30% (Table 4.1)
• Only I recovery rate for Cryptosporidium oocysts fell below the target of
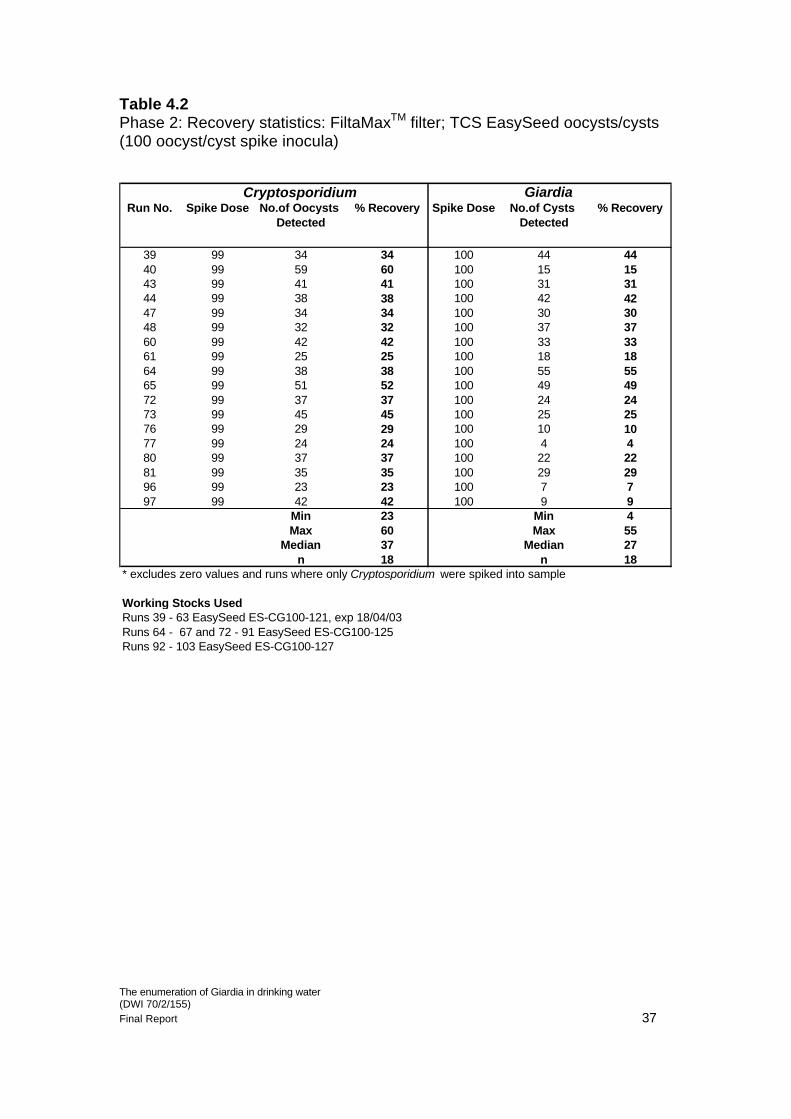
30%, compared with 7 similar observations for Giardia cysts (Table 4.6b). 4.1.2 Phase 2 100 oocyst/cyst spike • Using the FiltaMaxTMsystem, the median recovery rate was 37% for
Cryptosporidium oocysts which was significantly higher than the corresponding value obtained for Giardia cysts (27%)(p(α) >0.05) (Table 4.2)
• Only 4 individual recovery rates for Cryptosporidium oocysts fell below the target of 30% compared with 10 observations for Giardia cysts (Table 4.6b).
The enumeration of Giardia in drinking water (DWI 70/2/155) Final Report 34
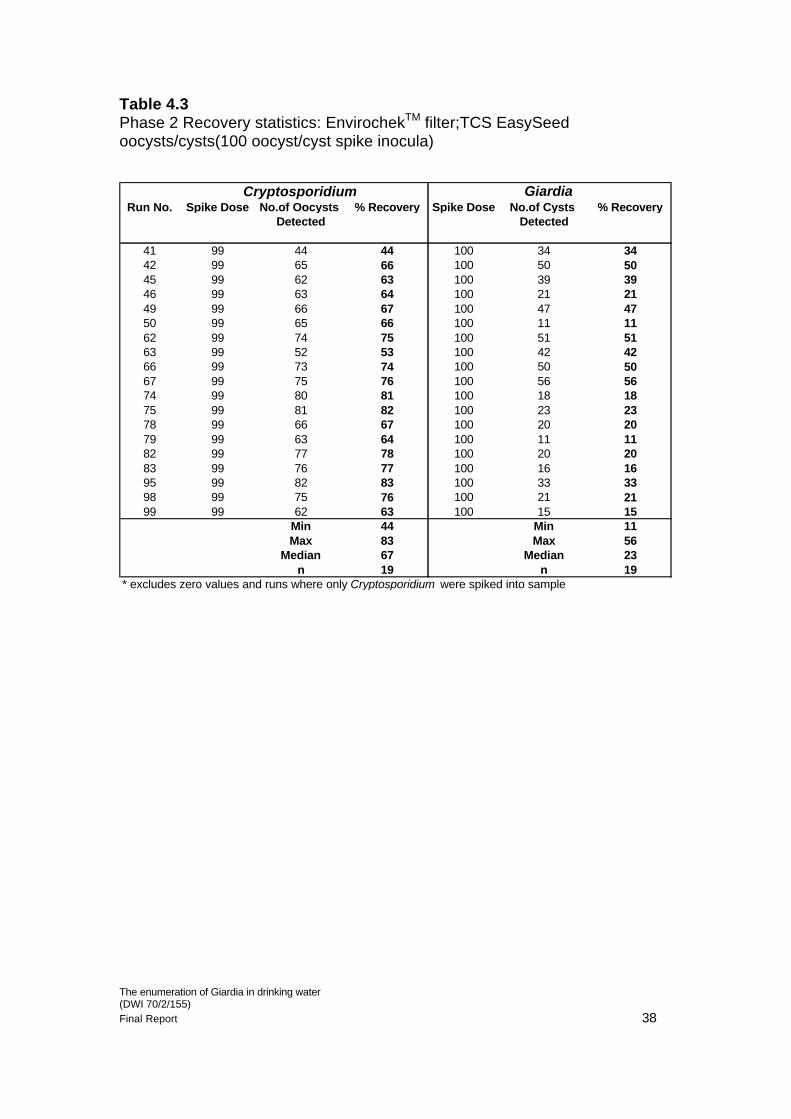
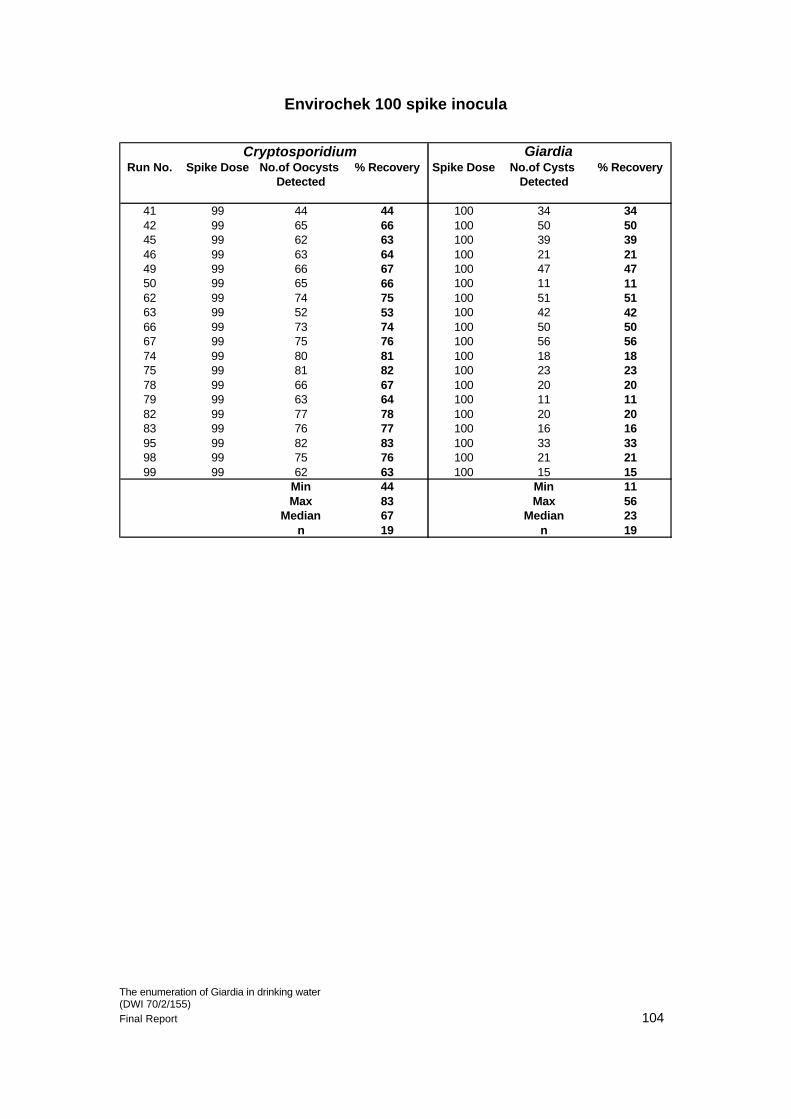
• Using the EnvirochekTM filter, the median recovery rate was 67% for Cryptosporidium oocysts which was significantly higher than the corresponding value of 23% obtained for Giardia cysts (p(α)>0.05)( Table 4.3). None of the individual recovery rates for Cryptosporidium oocysts fell below 30%, compared with 10 observations(56%) for Giardia cysts (Table 4.6b)
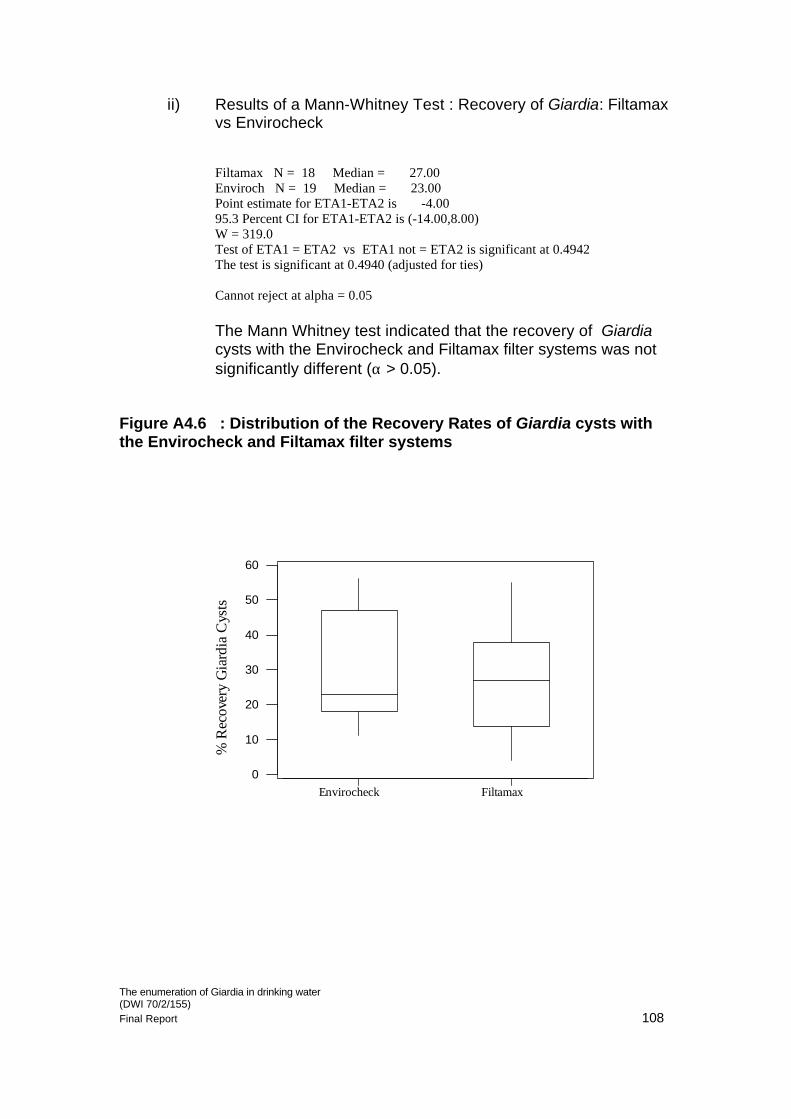
• Whilst the median recovery rate for Cryptosporidium oocysts was significantly greater (p(α)> 0.05) with the EnvirochekTM (67%) than the FiltaMaxTM filter (37%), recovery rates for Giardia cysts were not significantly different (p(α) >0.05) for the two filter types with median recovery rates of 27 and 23% for FiltaMaxTM and EnvirochekTM respectively (Table 4.3)
4.1.3 Phase 2: 10 oocyst/cyst spike • For the 10 oocyst/cyst spike, the FiltaMaxTM system gave a median
recovery rate of 30% for Cryptosporidium oocysts which was significantly higher than the corresponding value for Giardia cysts (0%) (Table 4.4). 8 individual recovery rates (42%) for Cryptosporidium oocysts fell below the target of 30%, compared with all of the observations for Giardia cysts (Table 4.6b)
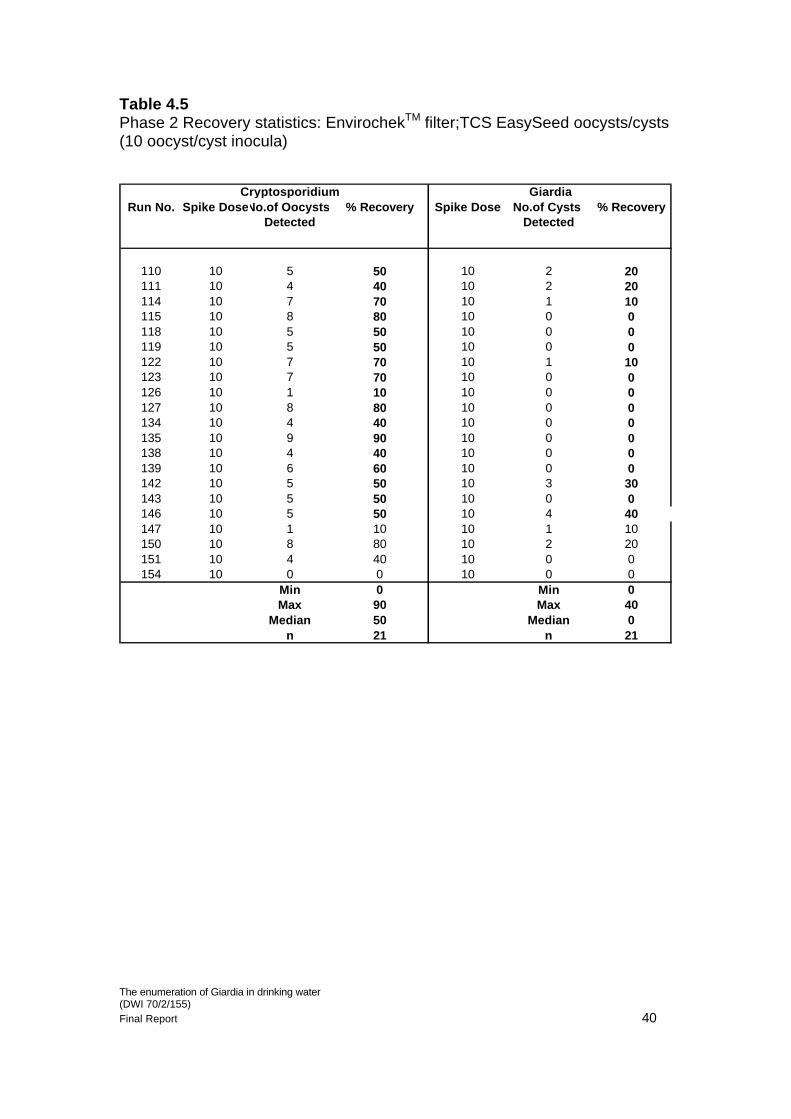
• Using the EnvirochekTM filter, the median recovery rate was 50% for Cryptosporidium oocysts which was significantly higher than the corresponding value obtained for Giardia cysts (0%). Only 2 (9%) of the individual recovery rates for Cryptosporidium oocysts fell below the target of 30%, compared with 19 observations (90%)for Giardia cysts (Table 4.5)
• Whilst the median recovery rate for Cryptosporidium oocysts was significantly greater (p(α( <0.01) with the EnvirochekTM (median 50%) than the FiltaMaxTM filter (median 30%), recovery rates for Giardia cysts were not significantly different (p(α) >0.05)
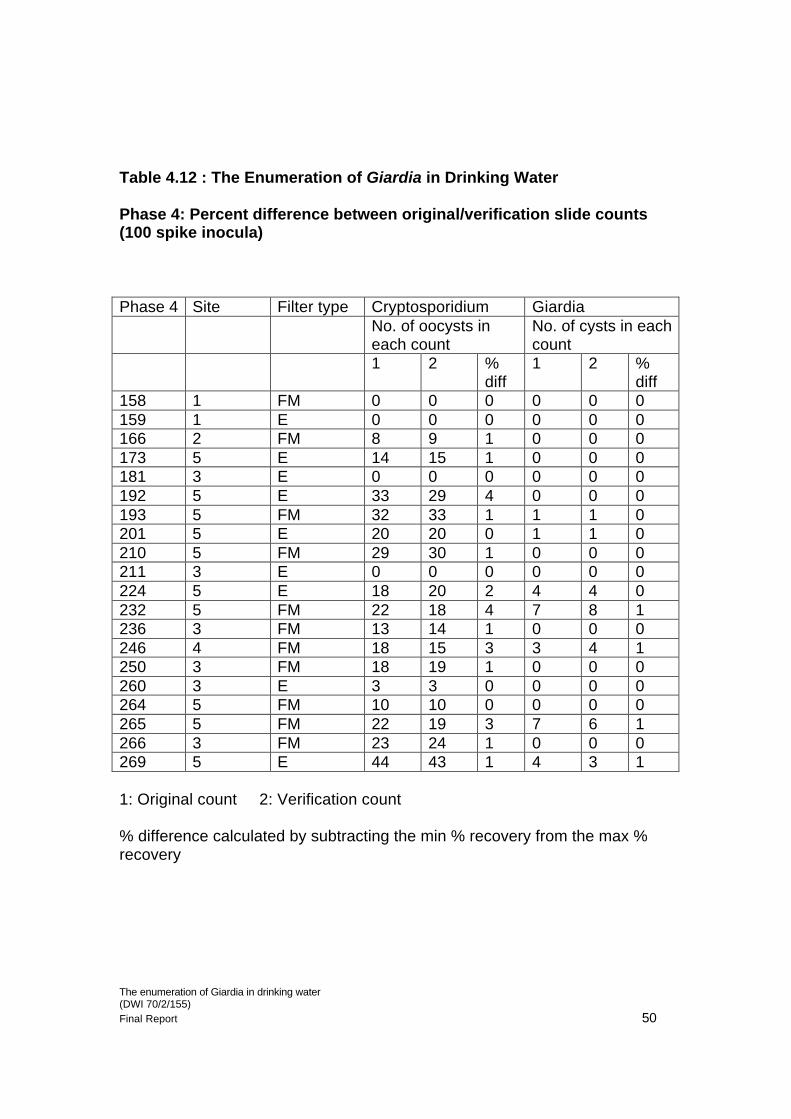
4.2 Phase 4 Field Trials: Evaluation of the recovery performance for FiltaMaxTM and EnvirochekTM filters in terms of co-isolation of Cryptosporidium oocysts/Giardia cysts at five Water Treatment Works Recovery data are summarised in Tables 4.9-4.13. Statistical analysis of the data is presented in full in Appendix 4. Negative controls were excluded from the statistical analysis and are presented elsewhere (Table 4.11). On analysis, it was apparent that the recovery data generated from Field trials experiments were not normally distributed (Appendix 4), thus, the Mann-Whitney non-parametric test was applied to determine significance using Minitab Release 13 software.
The enumeration of Giardia in drinking water (DWI 70/2/155) Final Report 35
• Giardia cysts were detected in only 12 out of 98 samples generated from the Field trials sites
• Cysts were detected in 7/48 (15%: range 1-9 cysts) of samples concentrated using FiltaMaxTM compared with 5/50 (10%: range 1-4 cysts) of samples concentrated with EnvirochekTM .
• All but one of the Giardia-positive samples were generated during trials at WTW 4 and WTW 5
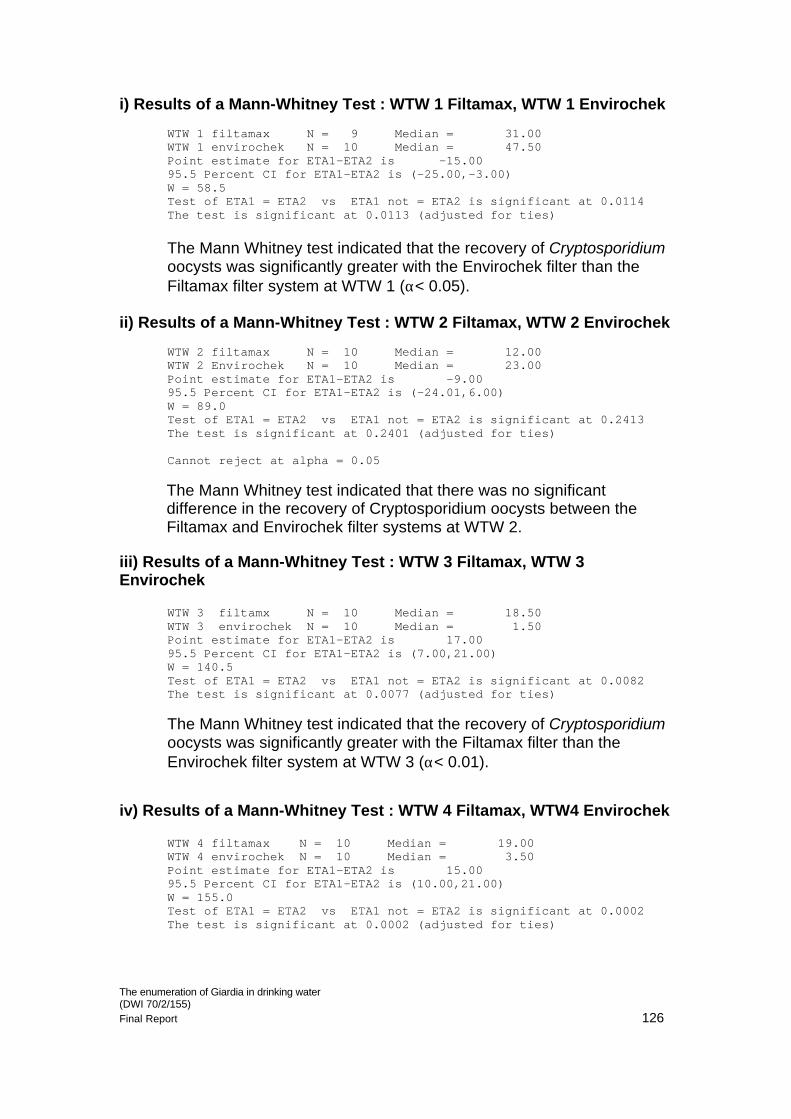
• At WTW 1and WTW 5, the median recovery of Cryptosporidium oocysts was significantly higher (p(α)<0.05) for EnvirochekTM than the corresponding value for FiltaMaxTM
• At WTW 3 and WTW 4, the median recovery of Cryptosporidium oocysts was significantly higher (p(α)<0.01) for FiltaMaxTM than the corresponding value for EnvirochekTM
• At WTW 2, there was no significant difference between the recovery rates for Cryptosporidium oocysts for the two filter types
4.3 Negative controls/Cryptosporidium only spikes Negative control samples, where experimental runs were carried out without the addition of either oocysts or cysts, were included in both Phases 1 and 2 and Phase 4 Field trials experiments. Generally, and as expected, oocysts/cysts remained undetected in 95% of samples. However, on one occasion, Run 6 (Phase 1), 1 Giardia cyst was detected when the rig remained unspiked (Table 4.7). Similarly, 1 Giardia cyst was detected on 3 occasions (Runs 59,37,35) when a Cryptosporidium only spike had been added (Table 4.7). Thus, ‘false positive’ events may be tentatively attributed to either cross contamination of the experimental rigs, the configuration of the equipment combined with the relatively high concentration spike ( all events were associated with Phase 1 where 1000 spike inocula were used) making it difficult to eradicate cross contamination completely, or to the presence of other Giardia-shaped objects that were mistaken for Giardia cysts during microscopic examination. There were no false positive events during the Field trials experiments.
The enumeration of Giardia in drinking water (DWI 70/2/155) Final Report 36
* Falls outside target value of >30% Table 4.6b Summary recovery data: Phases 1 and 2: Number of observations(%) below 30% recovery target NUMBER OF OBSERVATIONS < 30% RECOVERY
The enumeration of Giardia in drinking water (DWI 70/2/155) Final Report 43
Table 4.8: The Enumeration of Giardia in Drinking Water Phases 1 and 2: Percent difference between original/duplicate/verification slide counts Phase 1 Phase 1
The enumeration of Giardia in drinking water (DWI 70/2/155) Final Report 49
Table 4.11 Enumeration of Giardia in Drinking Water Control data Phase 4 Field trials : Negative controls FM FiltaMax E Envirochek Run number
Site Filter type Number of oocysts/cysts detected
Crypto Giardia 158 1 FM 0 0 159 1 E 0 0 196 1 FM 0 0 197 2 FM 0 0 203 1 E 0 0 209 3 FM 0 0 211 3 E 0 0 214 2 E 0 0 219 5 FM 0 0 220 4 FM 0 0 224 5 E 0 0 225 4 E 0 0 243 3 E 0 0
The enumeration of Giardia in drinking water (DWI 70/2/155) Final Report 50
Table 4.12 : The Enumeration of Giardia in Drinking Water Phase 4: Percent difference between original/verification slide counts (100 spike inocula) Phase 4 Site Filter type Cryptosporidium Giardia No. of oocysts in
each count No. of cysts in each count
1 2 % diff
1 2 % diff
158 1 FM 0 0 0 0 0 0 159 1 E 0 0 0 0 0 0 166 2 FM 8 9 1 0 0 0 173 5 E 14 15 1 0 0 0 181 3 E 0 0 0 0 0 0 192 5 E 33 29 4 0 0 0 193 5 FM 32 33 1 1 1 0 201 5 E 20 20 0 1 1 0 210 5 FM 29 30 1 0 0 0 211 3 E 0 0 0 0 0 0 224 5 E 18 20 2 4 4 0 232 5 FM 22 18 4 7 8 1 236 3 FM 13 14 1 0 0 0 246 4 FM 18 15 3 3 4 1 250 3 FM 18 19 1 0 0 0 260 3 E 3 3 0 0 0 0 264 5 FM 10 10 0 0 0 0 265 5 FM 22 19 3 7 6 1 266 3 FM 23 24 1 0 0 0 269 5 E 44 43 1 4 3 1 1: Original count 2: Verification count % difference calculated by subtracting the min % recovery from the max % recovery
The enumeration of Giardia in drinking water (DWI 70/2/155) Final Report 51
Table 4.13a Enumeration of Giardia in Drinking Water Summary recovery data: Phase 4 Field trials: Median recovery rates
RECOVERY RATE ( MEDIAN%)
Site Median % recovery Cryptosporidium SH/NS Giardia FiltaMax Envirochek FiltaMax Envirochek 1 31 48 SH (E) 0 0 2 12 23 NS 0 0 3 19 2 SH(FM) 0 0 4 18 4 SH(FM) 0 0 5 20 38 SH(E) 0 0 SH: Significantly higher ( Filter type) NS: Not significantly different FM FiltaMaxTM E EnvirochekTM Table 4.13b Summary recovery data: Phase 4: Number of observations(%) below 30% recovery target NUMBER OF OBSERVATIONS < 30% RECOVERY Field trials site
The enumeration of Giardia in drinking water (DWI 70/2/155) Final Report 52
5 CONCLUSIONS AND DISCUSSION 5.1 Laboratory Trials During the Laboratory Trials, the median recovery rate for Cryptosporidium oocysts was maintained within the target value of ≥30% for all spike concentrations and for both FiltaMaxTM and EnvirochekTM filters (Table 4.6a), indicating that the co-isolation of Giardia cysts along with Cryptosporidium oocysts using the combination immuno isolation and staining procedures does not compromise performance requirements for Regulatory monitoring. Recovery statistics for both Cryptosporidium and Giardia (FiltaMaxTM at 1000 oocyst/cysts spike) were comparable with those obtained by others using comparable methodologies and filtration volumes (Method 1623) (McCuin and Clancy, 2003; 43.6+/-5.7% and 44.3+/-4.1% respectively). Similarly, in Phase 2 (100 oocyst/cyst spike) we obtained recovery rates of 37 (oocysts) and 27% (cysts) compared with 38.6+/-17.3 and 27.8+/-2.3% (cysts) (McCuin and Clancy, 2003). Using FiltaMax TM, there was no significant difference between mean recovery rates for Cryptosporidium at 1000/100/10 spike concentrations (Table 4.6a; Appendix 4).However, whilst there was no significant difference between recovery of Giardia cysts at 1000/100 inoculum spikes, the median recovery rate for 10 spike inocula was significantly lower than rates obtained for 1000,100 spikes (Table 4.6a). Similarly, with EnvirochekTM, whilst the median recovery rate for Cryptosporidium oocysts was independent of spike concentration, the performance for Giardia cysts following inoculation of 10 oocysts/cysts was poor, yielding a median recovery rate of 0%. This suggests that using this experimental protocol and analytical procedure, 10 is above the detection limit for Cryptosporidium oocysts and at or below the detection limit for Giardia cysts for both filter types. For all spike concentrations, and for both FiltaMaxTM and EnvirochekTM filters, the median recovery rates for Giardia cysts were significantly lower than those obtained for Cryptosporidium oocysts and, except for the highest spike concentration (using FiltaMaxTM:1000 oocysts/cysts), fell below the target value of ≥ 30% (Table 4.6a). If we assume that the mechanical entrapment (filtration) efficiency is equivalent for oocysts/cysts, then we must concede that the cysts are lost/destroyed/undetected during subsequent stages of sample processing. For example, Giardia cysts are known to be less robust than Cryptosporidium oocysts and may be more susceptible to disruption/disintegration during the vigorous process of elution form the filter matrix, particularly during the processing of FiltaMaxTM samples.
The enumeration of Giardia in drinking water (DWI 70/2/155) Final Report 53
In addition, the appearance of Giardia cysts on microscopic examination may have adversely affected recovery/detection rates. STL analysts have observed and noted several features relating to the appearance of Giardia cysts following staining with CryptoGiardiacel: • The cysts were very variable in quality in terms of shape and staining
intensity. The EasySeed Giardia cysts were generally less variable in this respect than the original Giardia stock used in Phase 1
• Cryptosporidium oocysts stained consistently better and more brightly than
Giardia cysts. (The manufacturer acknowledges that Giardia cysts fluoresce weaker than Cryptosporidium oocysts with the CryptoGiardiacel stain). During the microscopic analysis of slides generated from the 100 spike trials, it was noted that cysts tended to be poorly stained and that this could potentially lead to underdetection and reporting of an apparently poor recovery rate. Recounting and verification of the slides by very experienced microscopists revealed that higher counts could be obtained for Giardia cysts in a significant number of samples (15/20). This ‘recount’ data was subsequently used in the calculation of recovery statistics. The approach to microscopic examination was reviewed and reappraised and, for the rest of the study, only the STL Principal Analyst and our independent Specialist Consultant were employed to read and score slides generated from the study. It is well known that environmental isolates fluoresce brighter than oocysts/cysts prepared commercially for laboratory use. Damage to surface epitopes during, for example, prolonged exposure to water treatment chemicals during the filtration of large volumes of treated water may exacerbate the effect.
• The combination of two monoclonal antibody stains has been used previously to enhance the fluorescence of Cryptosporidium oocysts (Dawson et al, 1993). A brief (unreported) investigation initiated during the latter part of the current study suggests that a similar approach for Giardia cysts may significantly improve the quality and intensity of staining
• Differentiation between fluorescing , Giardia-shaped debris and Giardia
cysts was often difficult because of the volume of debris and the poor quality of staining
• The density of organisms on slides derived from Phase 1 spikes (1000
oocysts/cysts) sometimes made counting and confirmation difficult and potentially inaccurate.
The EnvirochekTM filter performed consistently better than FiltaMaxTM in terms of recovery rates for Cryptosporidium oocysts at 100 and 10 spikes. This may simply be a function of more efficient initial entrapment by the filter itself or because the subsequent elution process is more efficient/less vigorous for
The enumeration of Giardia in drinking water (DWI 70/2/155) Final Report 54
the EnvirochekTMfilter compared with that associated with the FiltaMaxTMsystem. If we assume that the EnvirochekTM filter is a more efficient capture system, one might expect recovery rates for Giardia cysts to be significantly higher than the equivalent rate for FiltaMaxTM. This is evidently not the case, and data presented in Table 4.6a indicate that the compromised recovery rate for Giardia cysts may be due to either loss/destruction of cysts during entrapment on the filter, or at a point during the subsequent processing of the sample including elution/staining and microscopic examination. 5.2 Field trials Recovery data generated during the Field Trials were disappointing when compared with similar data obtained previously in the laboratory-based investigation. In the Laboratory Trials, 100% (37/37) of samples generated from filters (FiltaMax TM/Envirochek TM (FM/Enck) data combined) spiked with 100 oocysts/cysts were positive for Giardia cysts (range 4-56 cysts) and, of these, 17/37 (46%) gave recoveries of >30%. In contrast, in the field, only 12% (12/99) of samples processed (FM/Enck combined) were positive (range 1-9 cysts and none of these (0/99) attained the target recovery of 30%, Although this effect was less pronounced for Cryptosporidium, close scrutiny of the data suggested that recovery statistics for oocysts were also compromised as the investigation moved from the laboratory into the field. Laboratory experiments yielded a 100% (37/37) positivity rate (FM/Enck combined) (range 23-83 oocysts) with 89% (33/37) attaining a recovery rate of at least 30%. Equivalent data generated in the field gave a positivity rate of 95% 93/99) range 1-63, with only 27% (27/99) of samples having a recovery rate of 30% or more. The apparent and significant ‘loss’ of Giardia during the Field Trials investigations may be attributed to one or more factors, The experimental protocol, equipment, analytical methodology and quality of the oocyst/cyst spike may be discounted on the basis that these were identical in both Laboratory and Field-based trials. Thus, the only significant variables are water quality and the elapsed time between the end of the sampling period and the initiation of sampling processing in the laboratory. The chemical profile of the treated/filtered water may be a significant factor in determining recovery rates for Cryptosporidium and Giardia oocysts/cysts. Analysis of recovery data generated from samples originating from 5 water treatment facilities employing different treatment regimes, revealed that the performance of both FiltaMaxTM and EnvirochekTM was highly dependent on the water source and that there was inconsistency in their performance relative to each other (Table 4.13a and b ). For example, the first run carried
The enumeration of Giardia in drinking water (DWI 70/2/155) Final Report 55
out at WTW 3 failed to isolate either Cryptosporidium or Giardia from samples concentrated with either FiltaMaxTM or EnvirochekTM filters (Tables 4.9, 4.10). On investigation, it was revealed that the sampling line used at WTW 3 had remained unused for several months and contained heavy deposits of iron and manganese which were released in high concentrations during the first runs generating large pellet volumes of 3-5 ml. After run 1, recoveries of Cryptosporidium oocysts from FiltaMaxTM–filtered water improved significantly, although recoveries from EnvirochekTM filters remained negligible (Table 4.9, 4.10). The effect of high concentrations of iron/manganese and/or failure of the elution process to release entrapped cysts/oocysts may have been direct, resulting in destruction of cysts/oocysts trapped on the filter, or indirect by interfering with the IMS stage of the isolation process. In any event, the effect was persistent for EnvirochekTM filters and emphasises the impact of water chemistry and the composition of the filter matrix in determining overall recovery performance . A similar effect has been observed by others (Clancy et al, 2003). When 1000 litres of prefiltered tap water was replaced with unfiltered water, recovery rates for Cryptosporidium oocysts declined from 21-51% to <5%. The poor recovery rates were attributed to the presence of flocculants and other chemicals in the water which, when concentrated on the filters, provided greater adhesion of oocysts to the filter matrix. The addition of sodium hexametaphosphate in the elution solution to aid the release of oocysts from the Envirochek TM capsule increased recovery rates to 46%. However, the use of sodium hexametaphosphate routinely during the current trials appeared to have little or no impact on the release of Giardia cysts, since only 5/50 of samples concentrated with Envirochek TM filters were Giardia-positive. In a series of Field trials undertaken in the UK, Boynton et al (2002b) attributed poor recovery of Cryptosporidium oocysts with both FiltaMaxTM and EnvirochekTM filters to the presence of polyelectrolyte in the filtered water. Also,during a recent intensive revalidation exercise associated with Regulatory requirements and involving more than 25 water treatment facilities, we have noted consistently poor recoveries from spiked grab samples at 2 specific sites (unassociated with this study) where the water exhibits high concentrations of phosphate/lime. All of the samples generated during Laboratory Trials derived from 1 of 2 experimental rigs supplied by water from the relevant STW WTW and were processed within 2 hours of completion of the filtration period. Thus, oocysts/cysts remained trapped on the filter for approximately 20 hours before processing (Table Appendix 2.1). The chlorine residual (measured at the tap) was 0.03 mg.l-1, giving a CT of 36 mg min.l-1 (0.03x1200). This value will inactivate 90% of exposed Giardia cysts (EPA,1999) and, whilst these cysts may not necessily be physically removed and may appear microscopically in this context, their potential for staining and thus detection and enumeration may be severely conpromised. The relative resistance of Cryptosporidium oocysts to chlorine could explain why the recovery rates for Giardia cysts
The enumeration of Giardia in drinking water (DWI 70/2/155) Final Report 56
were consistently lower than those obtained for Cryptosporidium oocysts (Table 4.6a). The differential recovery rates for Cryptosporidium oocysts and Giardia cysts was further accentuated during the Field Trials, where we consistently failed to isolate Giardia cysts from both FiltaMaxTM and EnvirochekTM–concentrated samples. In contrast to laboratory experiments, the total time elapsed between the initiation of a ‘run’ to elution of cysts/oocysts was estimated at up to 50 hours. Whilst the actual filtration time was only around 24 hours, a further 24 hours may have elapsed before the filters were processed. Using the free chlorine measurements at the works, (0.2-0.5 mg.l-1), and assuming a 24 hour filtration (contact) period, CT values could potentially range from 300 (0.2 mg.l-1) to 750 mg min-1 (0.5 mg.l-1) and up to 20 times that calculated for laboratory experiments. These values could theoretically be increased further if the effect of chlorine persisted during the transportation period. If we acknowledge the susceptibility of Giardia cysts to chlorine even at low concentrations, it is perhaps not surprising that cysts were detected on only very few occasions during the Field Trials. Several chemical water disinfectants have been shown to inactivate G. duodenalis cysts (Rice et al,1982; Wickramanayake et al, 1984; Rubin et al,1989; Finch et al, 1993; Winieka-Krusnell and Linder, 1998) although the precise nature of the inactivation on the structure and biochemistry of the cysts has not yet been investigated. A study undertaken by Widmer et al (2002b) using scanning electon microscopy of Cryptosporidium oocysts that had been challenged with 4 mg.l-1 chlorine for up to 1380 min (CT =5400) showed an absence of visible chlorine effect. However, significant damage to the antigen was noted at CTs of 6000-12000. There are no equivalent data for Giardia cysts but, using ozone, Widmer et al (2002a) demonstrated a dose-dependent reduction in cyst concentration, loss of infectivity in gerbils and profound structural modifications to the cyst wall. Exposure to 1.5 mg.l-1 for >60 seconds resulted in extensive protein degradation and in the disappearance of cyst wall and trophozoite antigen.Thus, the failure to detect Giardia cysts in Field Trials samples is possibly due to either the destruction of the cysts during sampling and pre-processing and/or a failure to detect the cysts with antibodies because of the effect of chlorine and other chemicals on cell surface epitopes. This is an aspect of large volume sampling of chlorinated/treated waters that may be worthy of further investigation since the data generated in this study suggest that the sampling protocol used currently for Regulatory monitoring of Cryptosporidium cannot be adopted without modification for the co-isolation of Giardia cysts and, indeed, may be suboptimal for the optimum recovery of Cryptosporidium oocysts from some treated waters.
The enumeration of Giardia in drinking water (DWI 70/2/155) Final Report 57
REFERENCES Boynton H, Corscadden D, Francis C, Rushby L , Watkins J (2002) Phase 1:Validation of a new filter for use for the Regulatory monitoring of Cryptosporidium in drinking water. Report for Pall Life Sciences Clancy JL, McCuin RM, Hargy TM (2003) Recovery of Cryptosporidium oocysts from high volume samples. Awwa Research Foundation, Denver, 1-44 Dawson DJ, MaddocksM, Roberts J and Vidler JS (1993) Evaluation of recovery of Cryptosporidium parvum oocysts using membrane filtration. Letters in Applied Microbiology 17, 276-279 DWI (2003) Standard operating protocol for the monitoring of Cryptosporidium in treated water supplies to satisfy the Water Supply (Water Quality) regulations 2000, SI number 3184 England. Part 2 Laboratory and Analytical Procedures: Section 5 Sample preparation: 5.6 Elution and primary concentration for Pall EnvirochekTM HV filter 22-24 Finch CR, Black EK, Labatuik CW, Gyurek L, Belosevic M (1993) Comparison of Giardia lamblia and Giardia muris cyst inactivationby ozone. Applied and Environmental Microbiology 59: 3674-3680 Rice EW, Hoff JC, Schaefer 111 FW (1982) Inactivation of Giardia cysts by chlorine. Applied and Environmental Microbiology 43:250-251 Rubin AJ, Ever DP, Eyman CM, Jarroll EL (1989) Inactivation of gerbil-cultured Giardia lamblia cysts by free chlorine. Applied and Environmental Microbiology 55:2592-2594 Wickramanayake GB, Rubin AJ, Sproul OJ (1984) Inactivation of Giardia lamblia cysts with ozone. Applied and Environmental Microbiology 48: 671-672 Widmer G, Clancy T, Ward HD, Miller D, Batzer GM, Pearson CB, Bukhari Z (2002a) Structural and biochemical alterations in Giardia lamblia cysts exposed to ozone. Journal of Parasitology 88(6) 1100-1106 Widmer G, Bowman CA, Batzer G, Stein B, Pearson C, Buckholt MA, Tzipori S, Clancy T, Bukhari Z, Miller D, Clancy JL, Ward HD (2002b) Molecular mechanisms of chemical inactivation of Cryptosporidium oocysts
The enumeration of Giardia in drinking water (DWI 70/2/155) Final Report 58
and Giardia cysts. Report 90924, American Water Works Association Research Foundation (AwwaRF), 56 Winieka-Knisell J, Linder E (1998) Cystical effect of chlorine dioxide on Giardia intestinalis cysts. Acta Tropica 70: 369-372 USEPA (1999) Microbial and Disinfection Byproduct Rules Simultaneous Compliance Guidance Manual. Office of Water (4607) EPA 815-R-99-015, 2-8
The enumeration of Giardia in drinking water (DWI 70/2/155) Final Report 59
APPENDIX 1
CLUMPING INVESTIGATION Appendix 1.1 Investigation to identify a procedure for the disaggregation of Giardia cyst clumps Table Appendix 1.1 Phase 1: Effect of disaggregation procedures on the incidence and size of Giardia clumps Plate Appendix 1.1 Phase 1: Microscopic appearance of Giardia clump containing >12 cysts Appendix 1.2 Information supplied by J.Clancy et al
The enumeration of Giardia in drinking water (DWI 70/2/155) Final Report 60
Appendix 1.1. Investigation to identify a procedure for the
disaggregation of Giardia clumps During the microscopic examination and enumeration of Giardia working stock suspensions in Phase 1 of the investigation, a high degree of clumping was noted. The cysts were supplied via TCS from BTF (Australia) in PBS and were clumped on receipt. The PBS was implicated in contributing to the clumping of cysts, the preference for suspending media being reagent water. However, BTF were unable to supply the cysts in reagent water and the team were forced to consider either 1) application of a robust and reproducible disaggregation procedure or 2) an alternative source of Giardia cysts. Several disaggregation techniques were investigated, including: • Ultrasonication of cysts suspended in PBS or 1% Tween for various
periods of time (0,3,5,10 min (PBS), 0,3 min Tween) • Vortexing the cyst suspension in PBS for 2 min with or without syringing • A combination of vortexing, syringing and ultrasonication in PBS • A combination of vortexing and ultrasonication in 1% Tween For each well counted, the total number of cysts, the total number of clumped cysts and the total number of clumps were recorded. The results of the investigation are summarised in Table Appendix 1.1 None of the disaggregation methods produced an acceptably low yield of clumps and an alternative source of Giardia cysts was sought.
The enumeration of Giardia in drinking water (DWI 70/2/155) Final Report 61
Ultrasonication dataGiardia working stock prep 24/12/02 used (846 cysts/ml) and 50ul wells spotted
The enumeration of Giardia in drinking water (DWI 70/2/155) Final Report 62
Ultrasonication of Giardia cysts containing TweenGiardia working stock prep. 24/12/02 (846 cysts/ml) used and 100ul wells spotted containing 50ul w/stock and 50ul 0.01% PBST
Clump size range 2 - 9 (1 clump of 11 & 1 clump of 16 cysts)
The enumeration of Giardia in drinking water (DWI 70/2/155) Final Report 65
Plate Appendix 1.1 Microscopic appearance of typical Giardia clump containing more than 12 cysts
The enumeration of Giardia in drinking water (DWI 70/2/155) Final Report 66
Appendix 1.2 Information supplied by J. Clancy et al Jennifer Clancy To: [email protected] <jclancy@clanc cc: "Schaefer, Frank" <[email protected]>, randi mccuin yenv.com> <[email protected]> Subject: Re: Clumping of Giardia cysts 30/01/2003 14:25 David:
W/rt/ Giardia cysts, I will reply but will also copy this message to Randi McCuin in my lab for her input and also to Frank Schaefer, King of Protozoan Parasites himself. Giardia are difficult to work with as they tend to be far less hardy than Cryptosporidium. When working with them live, we have had them last for a week before going belly up or in some cases many weeks. We have to continuously check them microscopically before use to be sure they have not clumped or lysed. The cleanliness of the prep is a big factor as well, as with bacteria present they will clump and lyse even faster. If you are keeping the preps for up to 3 months, that is likely to be a problem. In Method 1623, on page 11 of the April 2001 version, labs are directed to use flow counted preps within 2 weeks of counting at the flow lab. In Wisconsin, where the US gets all of the flow counted live spikes for routine work, they sort the cysts within a week of receiving them from Hal Stibbs. Then they go out to labs for immediate use. Dave Battigelli is the research director here now at CEC, but was at Madison, WI previously and ran the flow lab there. He says they often got fresh shipments that were clumped and had to be discarded. Even with antibiotics and Tween, they sometimes were yeast contaminated and clumped. So age is a big factor and trying to keep them for 3 months is not practical. You will need to
The enumeration of Giardia in drinking water (DWI 70/2/155) Final Report 67
establish a shorter hold time and examine them microscopically on a regular basis for integrity. Prep cleanliness is critical but not the only factor. And once they are clumped, they are like concrete, and cannot be rendered individuals again. Perhaps prayer should be considered, we prefer cussing around here. Over to Frank for comments. Jen [email protected] wrote: Dear Jen, I hope all is well with you and your gang !! I am seeking some advise. I am > involved in a project for our regulators on the co-recovery of Cryptosporidium oocysts and Giardia > cysts, using > the current regulatory continuous sampling procedure for final waters. > Whilst we were working with the high number spikes (1000 oocyst and cysts) > we got good results, but noticed during our spike verification that up to > 30% of the Giardia cysts were present in clumps of up to 12 cysts. Whilst > this was not too much of a concern with high number spikes, it will be a > significant problem when try using our lower indented spike doses of 10 > oocysts and cysts. We have tried various ways of disaggregating the clumps > (vortexing, unltrasonication with and without the addition of Tween 20) but > have had little success in breaking the clumps up. We are restricting > ourselves to using cysts of not more than three months old. Have you > encountered this problem before and have you any suggestions of how we can > achieve an acceptable level of monodispersion of cysts for our low level > spikes. > > Best regards, > > David. > > David Sartory > Company Advisor (Microbiology) > Quality & Environmental Services > Severn Trent Water Ltd > Welshpool Road > Shelton > Shrewsbury > SY3 8BJ > Tel: +44 (0) 1743 265765 > Fax: +44 (0) 1743 265043 > Mobile +44 (0) 7880 788208 > E-mail: [email protected] > > ************************************
The enumeration of Giardia in drinking water (DWI 70/2/155) Final Report 68
The enumeration of Giardia in drinking water (DWI 70/2/155) Final Report 71
Phase 2 - 10104 No Data 1536.4105 No Data 1043.6106 No Data 1071.6107 No Data 1021.1108 16h 0m 1560.1109 16h 0m 1041.4110 16h 0m 1070.1111 16h 0m 1028.2112 16h 15m 1588.3113 16h 15m 999.8114 16h 15m 1028.0115 16h 15m 983.4116 15h 20m 1417.4117 15h 20m 908.2118 15h 20m 931.2119 15h 20m 888.0120 17h 20m 1675.2121 17h 20m 1076.0122 17h 20m 1078.4123 17h 20m 1058.5124 16h 50m 1653.3125 16h 50m 1031.2126 16h 50m 1035.3127 16h 50m 1005.5128 18h 5m 1784.7129 18h 5m 1112.2130 18h 5m 1138.1131 18h 5m 1093.6132 16h 30m 1637.1133 16h 30m 1012.6134 16h 30m 1038.9135 16h 30m 986.7136 18h 10m 1515.7137 18h 10m 1180.7138 18h 10m 1211.4139 18h 10m 1158.7140 16h 30m 1701.8141 16h 30m 1017.5142 16h 30m 1038.9143 16h 30m 1001.8144 18h 30m 1888.0145 18h 30m 1096.4146 18h 30m 1143.3147 18h 30m 1066.2148 17h 30m 1784.2149 17h 30m 1074.2150 17h 30m 1074.9151 17h 30m 1050.7152 No Data 1930.6153 No Data 1132.7154 No Data 1132.2155 No Data 1107.6
The enumeration of Giardia in drinking water (DWI 70/2/155) Final Report 72
Phase 4156 24h 30m 1600157 No Data 1495 Times not recorded by STL from sampling info. supplied158 No Data 950 Times not recorded by STL from sampling info. supplied159 No Data 934 Times not recorded by STL from sampling info. supplied160 23h 45m 1519161 23h 35m 1378162 24h 45m 1444163 22h 35m 1350164 23h 45m 1365165 22h 35m 1295166 23h 20m 1426167 23h 20m 1380168 24h 40m 1404169 23h 30m 1384170 No Data 564 Finish time not recorded when sampling171 No Data 576 Finish time not recorded when sampling172 25h 20m 1561173 25h 5m 1518174 23h 35m 1369175 23h 35m 1310176 23h 35m 1409177 23h 40m 1395178 23h 30m 1440179 23h 30m 1368180 23h 40m 1378181 23h 40m 1318182 23h 5m 797183 23h 15m 1481184 23h 20m 527185 23h 25m 550186 23h 30m 1393187 23h 35m 1382188 23h 25m 1140189 23h 25m 1416190 23h 30m 1312191 23h 30m 1367192 23h 30m 1558193 24h 10m 984194 23h 30m 537195 23h 40m 472196 22h 5m 1381197 23h 40m 1445198 23h 30m 1377199 23h 55m 568200 24h 20m 1417201 24h 20m 1552202 23h 50m 495203 22h 5m 1351204 23h 30m 1323205 23h 40m 1381206 23h 45m 545207 22h 55m 1366208 23h 20m 1415209 23h 15m 1302210 23h 45m 1463211 23h 15m 1294212 23h 45m 1516213 23h 15m 1359214 23h 25m 1345215 23h 0m 498216 23h 0m 1462217 24h 5m 1405218 24h 20m 1445219 24h 35m 1501220 25h 25m 550221 23h 0m 1412222 23h 5m 1291223 24h 20m 1412224 24h 45m 1573225 24h 25m 458226 23h 5m 1347227 25h 10m 1330228 24h 5m 1349
The enumeration of Giardia in drinking water (DWI 70/2/155) Final Report 73
APPENDIX 3
METHODS Appendix 3.1 Method W14: Enumeration of Cryptosporidium oocysts and Giardia cysts from IDEXX FiltaMaxTM modules (non-regulatory) Appendix 3.2 Method CRY OP F2: Procedure for general laboratory hygiene and cleaning and maintenance of laboratory equipment
The enumeration of Giardia in drinking water (DWI 70/2/155) Final Report 74
Appendix 3.1 Method W14: Enumeration of Cryptosporidium oocysts and Giardia cysts from IDEXX FiltaMaxTM modules (non-regulatory) Author: Section Manager Approval by: Quality Approval for Release by:
PSJ/JR PSJ JK
Date: Date:
This procedure is based on the Standard Operating Procedure for the monitoring of Cryptosporidium oocysts in treated water supplies to satisfy the Water Supply (Water Quality) Regulations 2001, SI No. 3911 (W.323) Wales. Any problems encountered in the process of elution and concentration and any deviations from the procedure must be reported to a senior member of staff. Principle Cryptosporidium Oocysts and Giardia Cysts are retained on Filta Max® filter modules during the filtration of water through the filters. The oocysts and cysts have to be eluted from the filters and concentrated as a consequence of the large volumes of reagent used in the elution phase. The concentrate can then be subjected to Immuno magnetic bead separation (IMS) prior to identification by microscopy.
1. Hazards
There are potentially viable Cryptosporidium oocysts and Giardia cysts in all samples submitted. It is recommended that disposable gloves are worn during sample processing. Care must be taken to prevent the formation of aerosols as bacteria may be concentrated by the filter module.
2 Documentation and Recording
All sample and elution details must be recorded onto the worksheets generated by LIMS. If worksheets have not been produced due to technical difficulties, then CSD134 must be used. IMS details must be recorded in the IMS logbook and microscopy details in the microscope and microscopy results logbooks.
The enumeration of Giardia in drinking water (DWI 70/2/155) Final Report 75
3 Reagents and Equipment
Elution buffer (0.01M PBS containing 0.01% Tween 20) prepared according to CRY OP D2 Oocyst-free reagent water (prepared according to CRY OP D2) Filta Max® 72mm concentrator filters in polyethylene bag Concentrator/Elutor assembly 50ml and 15ml graduated centrifuge tubes Piston head Centrifuge capable of 1100 x G Allen Key 1.5 litre catch pot Dynal Dynabeads® anti-Cryptosporidium kit, Product No. 730.01 (10 tests) or 730.11 (50 tests) consisting of:- Dynabeads Anti – Cryptosporidium, 10x concentrated SL A buffer, 10x concentrated SL B buffer or Dynabeads® GC Combo kit, Product No. 730.02 (10 tests)or 730.12 (50 tests). 0.1N Hydrochloric acid pre prepared (e.g. FISHER chemicals/Sigma-Aldrich chemicals) 1.0N Sodium Hydroxide pre prepared (e.g. FISHER chemicals/Sigma-Aldrich chemicals) Monoclonal antibody/FITC reagent-Cellabs Crypto-cell and Crypto/Giardia-cel IF reagent (available form TCS) DAPI (4’, 6 – diamidino-2-phenyl indole). A 2mg ml-1 stock solution in methanol is diluted daily in 0.01M PBS. 2% DABCO-PBS anti fadant mountant (e.g. TCS DABCO IF mounting fluid, Product code ZIMMIO) Methanol Industrial methylated spirit (IMS)
4 Elution and Primary Concentration
4.1 Dedicated elution equipment must be used for non-regulatory samples. For Raw and Final samples, Raw and Final elution equipment and wash stations must be used respectively.
4.2 Place a 72mm concentrator filter on the concentrator tube base,
positioning it so that it lies flat. Ensure that the membrane is rough side up. Locate the base of the concentrator into the jaws of the wash station and screw the concentrator tube (the larger of the two tubes) onto the membrane to create a tight seal, taking care to avoid cross-threading. Take the assembled concentrator tube out of the jaws and place on the bench.
4.3 Pour approximately 600ml 0.01% PBST elution buffer into the
assembled concentrator tube. Open the valve on the base of the
The enumeration of Giardia in drinking water (DWI 70/2/155) Final Report 76
concentrator and allow a small volume of buffer to pass through and close the valve.
4.4 Attach the plunger head to the wash station using the tool to secure
firmly in position. 4.5 Remove the Filta-Max® from the housing (if appropriate) and pour any
excess liquid from the filter housing or bag in which the sample has been transported, into the concentrator tube. Screw the filter module into the base of the plunger head. Note the appearance of the filter on the worksheet.
4.6 Taking care to avoid cross threading, locate the elution tube base (the smaller of the two tubes) in the jaws of the wash station and screw the elution tube firmly in place. Pull the plunger down until the module is located at the base of the elution tube. The locking pin (located at the top left-hand side of the wash station) should “click” in to lock the plunger in position.
4.7 Remove the filter module bolt using the Allen key provided by IDEXX for use with the equipment, by turning the key in an anti-clockwise direction (when viewed from below the elution tube base) and attach the stainless steel tube to the elution tube base.
4.8 Attach the concentrator tube to the base of the elution module and
wash the filter module by moving the wash station plunger up and down twenty times. To avoid excess foam generation during this process, gentle movements of the plunger are recommended. It is important that consistence is maintained and to ensure that full strokes of the plunger are undertaken.
NB: (i) The plunger has an upper limit restriction during
the wash process to avoid the plunger “popping out” of the top of the chamber.
(ii) If the filter does not expand, perform 5 plunges to “wet”
filter and leave to soak with the plunger arm in the up position for a maximum period of 2 hours to permit re-expansion prior to washing. Full expansion is not needed to wash oocysts from the filter module.
The enumeration of Giardia in drinking water (DWI 70/2/155) Final Report 77
4.9 Compress the filter and detach the concentrator module from the base of the assembled elution tube and lower it to the point where the stainless steel tube is above the level of the liquid, taking care to ensure that the seal on the plunger is not misplaced. Remove the remaining liquid from the elution tube by moving the plunger five times up and down and locking the wash station plunger in place (NB: Sponges may sometimes over expand and make locking difficult). Rinse the outside of the stainless steel tube with 2-5ml elution buffer from a wash bottle. Place the bung or the bag (used for membrane rubbing) provided, inside or over respectively, the end of the stainless steel tube to prevent loss of sample.
4.10 Place the assembled concentrator tube on a magnetic stirrer and attach
the lid with stirring magnet attached. Connect the Filta-Max® waste bottle trap and hand pump to the valve at the base of the assembled concentrator tube, begin stirring and open the valve after the liquid has reached a stable rotational velocity. If necessary, pump to obtain a vacuum ensuring the gauge reading does not exceed a maximum of 30cm (11.8 inches, 40 kPa)of mercury. Use the minimum vacuum required.
An electrically pumped vacuum system may be used. Connect the Filta-Max® waste bottle trap and hand pump to the valve at the base of the assembled concentrator tube. Then connect the hand pump to the fine control valve (vacuum tap) of the vacuum system. Turn on the vacuum tap and ensure that the gauge does not exceed a maximum of 30cm (11.8 inches, 40 kPa) of mercury. Use the minimum vacuum required.
4.11 Allow the sample level to drain until approximately 20ml remains
(level with the middle of the magnetic stirrer bar) and then close the valve. Remove the lid and pipette or pour out the concentrator into a 50ml conical centrifuge tube and retain. (NB. In the case of samples containing excessive deposits this may cause the membrane to clog and the next sub-sample(s) may need to be filtered using separate membrane(s)). If the membrane blocks, further membranes must be used and the membrane must be changed avoiding any losses. If the membrane clogs, preventing further filtration , pour the remaining eluant into a polyethylene bag. Replace membrane and return the eluant to the assembled concentrator tube. The membrane may be used smooth side up.
4.12 Add another 600ml of elution buffer to the same concentrator module,
remove the bung or bag from the base of the steel tube and screw the concentrator tube back onto the base of the elution module.
The enumeration of Giardia in drinking water (DWI 70/2/155) Final Report 78
4.13 Repeat above wash steps, with the following exceptions:
(i) only 10 wash strokes are required instead of the 20 used in the first wash.
(ii) once the sample level is down to approximately 50ml, add the
concentrate from the first washing and carry on filtering until the total volume is again down to approximately 20ml.
(iii) before collecting the concentrate, rinse the magnetic stirrer with
arm with 2-5ml elution buffer from a wash bottle into the concentrator module.
(iv) collect the concentrate in the sample 50ml conical
centrifuge tube used for the first run. (v) for excessively dirty samples it may be necessary to use
two or more membrane filters during the concentration step. At this point the membrane may be used smooth side up. The membranes must be changed avoiding any losses.
(vi) the magnetic stirrer must be rinsed between filtrations.
4.14 Remove the magnetic stirrer and insert assembled concentrator tube
into the jaws of the wash station, detach the concentrator tube, remove the membrane with fine point tweezers and place in the bag supplied by IDEXX. If a bag was used over the steel rod after the first wash to prevent loss of sample, then use this bag. Add 5ml of wash buffer, seal the bag and rub the surface of the membrane for approximately 1 minute between thumb and forefinger until the membrane appears to be clean. Remove the eluate using a pipette and add to the concentrate fraction obtained at the end of section 4.13. Record the concentrate volume on the worksheet.
4.15When a large number of membranes are used for a highly turbid sample they should be washed individually and the washings combined with the rest of the concentrated eluate before centrifugation. This may result in more than 50ml of eluate and washings requiring centrifugation. In this case, the combined eluate should be divided equally into two or more 50ml centrifuge tubes and each tube processed through the rest of the procedure independently.
4.16In the event of a failure or lifting of the membrane, pour all the eluant into
the catchpot, replace the membrane on the concentrator base and pour the eluant into the concentrator assembly. Rinse out the catchpot with a few mls of 0.01% PBST and add to the eluant to ensure that no oocysts are left in the catchpot.
The enumeration of Giardia in drinking water (DWI 70/2/155) Final Report 79
4.17 During concentration and separation, the filter eluate is further
concentrated by centrifugation and any oocysts in the sample and then separated from other particulates using immunomagnetic bead separation (IMS).
4.18 Centrifuge the 50ml centrifuge tube containing the filter eluate at 1100G for 15 minutes (2300rpm for 16.5 minutes on Mistral 3000E). Allow the centrifuge to coast to a stop without braking. With a pasteur pipette or venturi vacuum pump with a disposable micro-pipette tip and using gentle suction, carefully aspirate off the supernatant to just above the pellet so that approximately 2-5 ml of liquid remains above the pellet.
5 Secondary Concentraton
5.1 If the pellet volume is less than or equal to 0.5ml, record the pellet volume and the date and time that concentration was completed in the IMS logbook. Add oocyst-free reagent water to the centrifuge tube to bring the total volume to 9ml. Cap the tube and vortex for 10 to 15 seconds to re-suspend the pellet. The pellet volume is measured by comparing the pellet volume to a number of standards prepared previously. Proceed to section 6, Dynal IMS procedure.
5.2 If the pellet volume exceeds 0.5ml then add 10ml oocyst-free reagent
water (distilled, deionised or reverse osmosis water) to the centrifuge tube by pipette. Cap the tube and vortex for 10 to 15 seconds to re-suspend the pellet. Transfer the re-suspended deposit to a 15ml conical centrifuge tube. Rinse out the 50ml centrifuge tube with a further 2ml reagent water and pipette into the 15ml conical centrifuge tube. Repeat this wash step again if necessary. Centrifuge the 15ml conical centrifuge tube at 1100G for 15 minutes (2300 rpm for 16.5 minutes on Minstral 3000E). Allow the centrifuge to coast to a stop without braking.
5.3 The sample pellet volume is the sum of the pellet volumes for each
tube. Each 15ml centrifuge tube used is treated as a sub sample of the whole sample
e.g. 75ml combined eluate – 2 x 50ml tubes used.
Then for Dynal IMS procedure. 50ml tube #1 pellet volume 0.3ml – 1 x 15ml tube used. 50ml tube #2 pellet volume 0.7ml – 2 x 15ml tubes used. Sample pellet volume – 0.3 + 0.7 = 1ml. Three sub-samples are analysed.
The enumeration of Giardia in drinking water (DWI 70/2/155) Final Report 80
5.4 When more than one 50 ml tube is required for very turbid samples then full records must be kept for each 50 ml tube and their contents subject to separate preparation for the IMS procedure as in 5.2.
5.5 Record the pellet volume (volume of solids) in the IMS logbook. With
a pasteur pipette or venturi vacuum pump with a disposable micro-pipette tip and using gentle suction, carefully aspirate off the supernatant to just above the pellet.
5.6 Add reagent water to the centrifuge tube to bring the total volume to 10ml. Cap and vortex the tube for 10 to 15 seconds to re-suspend the pellet. Then split the sample between a number of 15ml centrifuge tubes to give no more than 0.5ml deposit in any one tube, i.e. if the pellet volume was 0.7ml use two centrifuge tubes and if 1.2ml use three tubes. Make up the volume in each tube to 9ml and proceed to section 6, Dynal IMS Procedure, treating each centrifuge tube as a sub-sample. NB: Samples may be stored at this stage under secure conditions in
a refrigerator at a temperature of between +2o to +8o).
6 Immunomagnetic capture and staining of Cryptosporidium oocysts and Giardia cysts
6.1 Principle
Cryptosporidium oocysts and Giardia cysts eluted and concentrated from Filta-Max® filters, are further concentrated by Immunomagnetic Separation (IMS) prior to staining using an Immuno fluorescent technique for identification by microscopy. The Dynabeads® anti-Cryptosporidium and anti- Giardia are for the rapid, selective separation of Cryptosporidium oocysts and Giardia cysts from water sample concentrates using Immunomagnetic Separation (IMS). Anti Cryptosporidium antibodies and anti-giardia antibodies are attached to para-magnetic particles (Dynabeads) which adhere to Cryptosporidium oocysts and Giardia cysts. The oocysts and cysts with the Dynabeads attached can then be removed from solution by the application of a magnetic field. The oocysts and cysts can then be released from the para-magnetic particles using acid dissociation. They can then be stained using further anti-Cryptosporidium antibodies and anti- Giardia antibodies conjugated with FITC, a fluorescent label, enabling the oocysts and cysts to be viewed under a suitable microscope.
The enumeration of Giardia in drinking water (DWI 70/2/155) Final Report 81
6.2 Hazards
Positive controls are prepared with live Cryptosporidium and Giardia and must be handled with appropriate caution. Positive controls must only be prepared in the AQC laboratory, not the main laboratory and must only be brought through to the main laboratory once the microscope slide cover slip has been sealed on all sides. Methanol is used to assist sample adhesion and IMS for cleaning slides. These reagents are highly flammable and must be used in the absence of naked flames.
6.3 Reagents and media
Dynal Dynabeads® anti-Cryptosporidium kit, Product No. 730.01 (10 tests) or 730.11 (50 tests) consisting of:- Dynabeads Anti – Cryptosporidium, 10x concentrated SL A buffer, 10x concentrated SL B buffer or Dynabeads® GC Combo kit, Product No. 730.02 (10 tests)or 730.12 (50 tests). Oocyst-free reagent water (prepared according to CRY OP D2) 0.1N Hydrochloric acid pre prepared (e.g. FISHER chemicals/Sigma-Aldrich chemicals) 1.0N Sodium Hydroxide pre prepared (e.g. FISHER chemicals/Sigma-Aldrich chemicals) Monoclonal antibody/FITC reagent-Cellabs Crypto-cel Monoclonal antibody/FITC reagent-Cellabs Crypto/Giardia-cel DAPI (4’, 6 – diamidino-2-phenyl indole). A 2mg ml-1 stock solution in methanol is diluted daily in 0.01M PBS. 2% DABCO-PBS anti fadant mountant (e.g. TCS DABCO IF mounting fluid, Product code ZIMMIO) Methanol Industrial methylated spirit (IMS)
6.4 Equipment
All temperature values are nominal and working temperature values that take into account the measurement of uncertainty will be found on the appropriate calibration cards.
Dynal L10 tubes, Product No. 740.03 Dynal spot-on 9mm well slides, Product No. 740.04 or IDEXX Slides, Product No. QMS 30200 Dynal Primary Magnetic Particle Concentrators MPC-1 and/or MPC-6 Dynal Secondary Magnetic Particle Concentrator for microcentrifuge tubes, MPC-M or MPC-S Dynal Sample Mixer MX-1, Product No. 159.07 5 ml graduated microcentrifuge tubes Disposable polyethylene pipettes, 1 ml volume Incubator 37°C±1.0°C
The enumeration of Giardia in drinking water (DWI 70/2/155) Final Report 82
Humidity chamber Vortex mixer Pipettes and tips, 5µl-1000µl volume 22x22mm cover slips No 1 1/2
6.5 Dynal IMS Procedure
6.5.1 Preparation of Reagents a) For each 10 ml of sample, sub sample or control the following
quantities of buffer will be required:-
1 ml of 1 x SLTM-buffer-A (clear, colourless solution) 1 ml of 10 x SLTM-buffer-A (clear, colourless solution) 1 ml of 10 x SLTM-buffer-B (with supplied magenta solution)
Reagent batch numbers must be recorded in the IMS logbook.
b) Prepare a 1 x dilution of SL-buffer-A from the “10 x SLTM-
buffer-A” (clear, colourless solution) supplied using oocyst –free reagent water as the diluent. For every 1ml of 1 x SL-buffer-A required, take 100µl of “10 x SLTM-buffer-A” and make up to 1ml with reagent water
c) To a Dynal L10 tube (125 x 6mm flat-sided Leighton tube)
with 60 x 10mm flat sided area add 1ml of the “10 x SLTM Buffer A”.
d) Add 1ml of the “10 x SLTM-buffer-B” (with supplied magenta
solution) to the Dynal L10 tube containing the “10 x SLTM-buffer-A”.
e) The Dynal L10 tube containing the mixed SL-buffers A and B
is ready for use in oocyst capture in 5.5.1.
6.5.2 Oocysts capture – care must be taken to avoid interruptions to the following procedure, except where indicated.
a) Label the Dynal L10 tube with the sample number and place
open tube in a tube rack. Transfer the water sample concentrate from elution step to the Dynal L10 tube containing the mixed SL-buffer and use a further 1ml oocyst-free reagent water to rinse out the centrifuge tube
b) Vortex the Dynabeads® anti-Cryptosporidium reagent and the
Dynabeads Anti-Giardia reagent (if Giardia is to be analysed)
The enumeration of Giardia in drinking water (DWI 70/2/155) Final Report 83
for approximately 10 seconds to resuspend the beads. Ensure that the beads are fully resuspended by inverting the tube and making sure that there is no residual pellet at the bottom. Record the batch number(s) in IMS logbook.
c) Add 100µl of the resuspended beads (Dynabeads Anti-
Cryptosporidium) and 100µl of the resuspended Dynabeads Anti-Giardia (if Giardia is to be analysed) to the Dynal L10 tube containing the water sample concentrate and SL-buffer. Cap the tube.
d) Non-regulatory samples must be processed as a separate batch
to Regulatory samples when beads are added. Affix the Dynal L10 tube to the Dynal rotating mixer and rotate at approximately 25rpm for at least 1 hour.
e) After rotating for 1 hour, remove the Dynal L10 tube from the
mixer and place in the Dynal magnetic particle concentrator (MPC-1) or a Dynal multi-tube magnetic particle concentrator (MPC-6) with flat side of Dynal L10 tube towards the magnet.
From this stage each sample, or control, must be processed individually. The remaining L10 tubes can be left rotating on the mixer.
f) Without removing the Dynal L10 tube from the MPC-1 (or MPC-6), place the magnetic side of the MPC-1 (or MPC-6) downwards, so that the Dynal L10 tube is horizontal and the flat side of the tube is facing down and above the magnet.
g) Gently rock the Dynal L10 tube by hand end-to-end through approximately 90º, tilting cap-end and base-end of the tube up and down in turn. Continue the tilting action for 2 minutes with approximately one tilt per second. To achieve this the user needs to do one tilt per second for the to and another for the fro.
The enumeration of Giardia in drinking water (DWI 70/2/155) Final Report 84
Ensure that the tilting action is continued throughout this period to prevent binding of low-mass material that is magnetic or magnetizable. If the sample in the MPC-1 (or MPC-6) is allowed to stand motionless for more than 10 seconds, then the tube should be removed and the beads re-suspended by gentle shaking. Then the rocking procedure must be repeated for 2 minutes before continuing.
h) Return the MPC-1 (or MPC-6) to the upright position so that
the Dynal L10 tube is vertical with cap at top. If particles do not form a single compact streak, re-suspend and repeat steps from e). Immediately remove cap ensuring the tube is not disturbed and decant all the supernatant from the tube held in the MPC-1 (or MPC-6) into a suitable container e.g. the original sample tube. Carefully decant the tube held such that the flat face and the magnet are uppermost to help retain particles.
Providing the particles have not been disturbed during the decanting process the supernatant can be discarded. Do not shake the tube and do not remove the tube from MPC-1 (or MPC-6) during this step.
i) Remove the Dynal L10 tube from the MPC-1 (or MPC-6) and
resuspend the sample in 0.9ml 1 x SL-buffer-A. Mix very gently to resuspend all material in the tube. Do not vortex.
j) Using a long form disposable 1ml pipette transfer all the liquid
from the Dynal L10 tube to a labelled 1.5ml microcentrifuge tube; add 0.1ml of diluent buffer A to rinse and pool in the same microcentrifuge tube ensuring that no beads are left behind.
k) Place the microcentrifuge tube in the second magnetic particle
concentrator (MPC-M), with the magnetic strip in place with the tube hinge to the rear.
The other samples may be processed from the L10 tube (step j) and all then carried on to step k).
l) Without removing the microcentrifuge tubes from MPC-M
gently rock/roll the tube through 180º by hand. Continue for 1 minute with approximately one gentle 180º roll/rock per second. The magnet is rocked 180° in one direction and then rolled back in another second. At the end of this step, the beads and oocysts should produce a well-formed brown streak on the back of the tube.
The enumeration of Giardia in drinking water (DWI 70/2/155) Final Report 85
m) Uncap and using a long form 1ml disposable pipette, carefully aspirate the supernatant from the tube and the cap held in the MCP-M and recap the tube. Take care not to disturb the material attached to the wall of the tube adjacent to the magnet. If more than one sample is being processed, conduct three gentle 180º rock/roll actions before removing the supernatant from each tube. Do not shake the tube. Do not remove the tube from the MPC-M while conducting these steps.
6.5.3 Dissociation of beads/oocysts complex
a) Remove the magnetic strip from the MPC-M or MPC-S. b) Uncap and add 50µl of 0.1M hydrochloric acid (HCl), recap
and then vortex for 10 seconds.
c) For the dissociation of Cryptosporidium oocysts/beads only, stand each tube for approximately 5 minutes at room temperature in a vertical position. For the dissociation of Cryptosporidium oocysts/beads and Giardia cysts/beads, stand each tube for approximately 10 minutes at room temperature in a vertical position.
d) Vortex thoroughly for 10 seconds. After vortexing, ensure that
all the sample is at the base of the tube.
e) Replace magnetic strip in MPC-M or MPC-S and replace tube in MPC-M or MPC-S. Allow tube to rest horizontally for a minimum of 10 seconds so that magnetic beads attach to MPC-M or MPC-S.
f) Remove the required number of 9mm diameter well slides from
the box stored at room temperature and ensure that they are clean and grease free by wiping them with IMS and allowing to dry.
g) Add 5µl of 1.0N sodium hydroxide (NaOH) to the slide sample
well. h) Return the microcentrifuge tube in the MPC-M or MPC-S to
the vertical position and transfer the entire sample from the tube to the slide sample well containing the NaOH. Do not disturb the beads at the back wall of the tube. Gently mix sample with the NaOH using the transfer pipette. Ensure all the sample is transferred.
NB. Samples may be stored at this stage at room temperature until dry, or incubated at a temperature not exceeding 42ºC
The enumeration of Giardia in drinking water (DWI 70/2/155) Final Report 86
until the evaporation step is complete. The samples are now ready to be stained.
7 Staining
NB. In the following procedures it is essential to hold reagent droppers sufficiently far above the slide to prevent “bridging” between the slide and the dropper by reagent. 7.1 After evaporating to dryness, remove slides from the incubator and
apply 25-50µl of absolute methanol (standard reagent grade) to each slide well and allow to air dry for 3 to 5 minutes. Do not allow the methanol to spill outside the well.
7.2 Overlay the sample slide well, and the positive-control slide well with 50µl
of monoclonal antibody/FITC reagent, Cellabs Crypto-cel IF antibody if analysing for cryptosporidium only and Cellabs Crypto/Giardia-cel for cryptosporidium and giardia analysis. Place the slides in a humid chamber and incubate at 37ºC for 60-90 minutes in the dark.
7.3 After staining, remove the slides and using either a hand held
disposable micropipette or a disposable micro-pipette tip attached to a gentle vacuum source (e.g. Venturi), tilt the slide and carefully aspirate the antibody from the side of each slide well.
When performing this step, ensure that the vacuum source is set at a minimum suction (<5cm Hg vacuum) and ensure that the pipette tip does not touch the well surface, tipping the slide to permit the stain to drain towards the pipette tip.
7.4 Apply 50µl of ‘4,6-diamidino-2-phenylindole (DAPI) working solution
(1/5000 dilution in 0.01M phosphate buffered saline (PBS), prepared according to CRY OP D2, prepared daily by adding 10µl of 2 mg/ml DAPI stock solution to 50ml of PBS) to each slide well. Allow to stand at room temperature for approximately 2 minutes.
7.5 Carefully remove the excess DAPI solution by aspiration as described
in section 7.3 above.
7.6 Apply a drop of oocyst-free reagent water to each slide well and allow to stand for approximately 1 minute, then aspirate the excess reagent water. Leave to dry for 2-3 minutes. When removing the excess water ensure that the pipette tip does not touch the well surface.
7.7 Apply a drop of mounting medium containing an anti-fadant (2%
DABCO-PBS) to the centre of each slide well, avoiding bridging. 7.8 Place a suitable 22 x 22mm coverslip on each microscope slide and
allow mountaint to spread. Do not apply pressure to the coverslip. Use a tissue to remove excess mounting fluid from the edges of the
The enumeration of Giardia in drinking water (DWI 70/2/155) Final Report 87
coverslip and then seal the edges of the coverslip onto the slide using a suitable sealant.
NB. Slides may be stored in a dry box or in a refrigerator at this stage at +2º to +8ºC until ready for examination (allow to equilibrate to room temperature before proceeding).
8 Positive Control Slide
One positive control slide, to check the fluorescence response and antibody staining must be prepared with each batch of samples to be stained. This comprises Cryptosporidium oocysts and Giardia cysts in sediment. and is prepared with each batch of slides by fixing a known volume of a mixed culture on microscope slides. Positive controls must give good fluorescence in order to validate the tests. If there is a problem with the fluorescence, or discerning the Cryptosporidium oocysts and Giardia cysts on this slide it must be bought to the attention of a senior member of staff and noted on the worksheet.
To prepare a control well either add 35 + 5µl of the prepared control sediment containing Cryptosporidium and Giardia supplied with the Hydrofluor staining kit or spot 25µl cryptosporidium working stock solution and 25µl giardia working stock solution to a microscope slide well. THIS PROCEDURE MUST BE CARRIED OUT OUTSIDE THE MAIN CRYPTOSPORIDIUM LABORATORY AREA USING DEDICATED EQUIPMENT Stain the control slide well, using the above procedure, after the samples relating to the control have been stained. Any unused stain must be discarded. IT MUST NOT BE RETURNED TO THE MAIN CRYPTOSPORIDIUM LABORATORY. The stained control slide must only be taken into the main Cryptosporidium laboratory when it has been mounted, covered with a coverslip and sealed.
9 Screening
9.1 Cryptosporidium oocysts are identified using epifluorescence microscopy with excitation at approximately 495nm and emission at 535nm (mid green). In addition, to determine the DAPI staining of any Cryptosporidia present, an ultra violet filter with an excitation of 350nm and emission of >450nm is used. Scanning can be carried out at 200X with identification at higher magnifications (X400, X1000). Each microscopist should, examine the control slide, relevant to the batch of slides being examined, to ensure that the microscope is correctly adjusted and the stains have worked correctly. If there is any doubt over the efficiency of staining consult a senior member of staff.
Screening of samples should be carried out using vertical and horizontal movements proceeding Left to Right across the membrane (or Right to
The enumeration of Giardia in drinking water (DWI 70/2/155) Final Report 88
Left depending on personal preferences). Operators should ensure there is a slight overlap of each scan to ensure full coverage of the filter.
9.2 Cryptosporidium oocysts are defined as brilliant “granny smith” apple
green fluorescing spherical, or slightly ovoid 4-6µm in diameter, (Dimensions are measured using the calibrated eye piece graticule), with a brightly stained periphery, or cell wall. If these are present, the UV filter, for DAPI, should be used to determine internal cellular staining. Examine the DAPI internal staining as follows;
a) The presence of up to four small, distinct, sky blue bodies within
a single oocyst.
b) Oocysts with diffuse blue internal staining and with nuclei also present.
c) Oocysts with light blue internal staining (no distinct nuclei) a)
and b) are recorded in analysts comments as DAPI positive; c) is recorded as b) DAPI negative in analysts comments.
In addition structures that resemble Cryptosporidium oocysts, or may be damaged or empty cells (no DAPI staining) are to be recorded as Crypto Like Bodies (CLB’s).
9.3 Giardia cysts are approximately 10µm in diameter and are ovoid in shape, the length can vary between 7-14µm and 7-10µm in width. The stained appearance is similar to stained oocysts with four nuclei although young cysts may only contain 1-2 nuclei and recording of results should be as for oocysts specified above.
9.4 Only staff who have successfully duplicate read a minimum of 10 slides
compared to a trained microscopist, in accordance with UKAS requirements, and have shown observed competence in microscopy can read non-regulatory samples unsupervised.
The enumeration of Giardia in drinking water (DWI 70/2/155) Final Report 89
10. Calculation and Expression of Results
If results are to be reported per litre:-
Results are expressed as the numbers/litre = No. cysts/oocysts No. litres screened For negative samples the results are expressed as <1 No. litres screened
If results are to be reported per 10 litres, multiply the result by 10.
11. Quality Control
At least 1 slide for each analyst that has screened sample slides that month must be duplicate screened and any deviation from the original result must be reported to the microbiology and cryptosporidium manager. In addition, a positive and negative Filta-Max® must be prepared monthly. Process the positive and negative control samples according to CRW OP 2. The presence of Cryptosporidium oocysts and/or Cryptosporidium like bodies in the negative control must be immediately reported to a senior member of staff.
12. Interpretation
The presence in final water of Cryptosporidium oocysts and/or Giardia cysts is indicative of faecal contamination of the source water from either infected animals (via run-off) or humans (via sewage effluent) and possibly coagulation or filtration failure in the water treatment process. In groundwaters, their presence is evidence of surface water influence or other contaminating routes. The presence of any suspect Cryptosporidium oocysts and/or Giardia cysts in a water sample should be confirmed with a senior member of staff, who will report these findings to the client as appropriate.
13. Viability Staining
In some instances where Cryptosporidium oocysts are found and where the client requires it, viability staining may be an option. In such an instance procedure CRW OP 1 should be followed.
The enumeration of Giardia in drinking water (DWI 70/2/155) Final Report 90
14. References
The monitoring of Cryptosporidium oocysts in treated water supplies to satisfy the Water Supply (Water Quality) Regulations 2001, SI No. 3911 (W.323) Wales.
The enumeration of Giardia in drinking water (DWI 70/2/155) Final Report 91
Appendix 3.2 Method CRY OP F2: Procedure for general laboratory hygiene and cleaning and maintenance of laboratory equipment Author: Section Manager Approval by: Quality Approval for Release by:
PSJ PSJ JK
Date: Date:
Principle: All equipment in the laboratory must be segregated into those used for Raw waters, Final waters and Spiked samples. All equipment used on regulatory testing must be dedicated to a nominated site and marked as such. When items are cleaned they must be cleaned with like items. For example, equipment used for Raw water analysis must not be cleaned with equipment used for Final water analysis. This will reduce the potential for cross contamination. Also, spiked sample equipment must only be cleaned in one nominated sink in the Cryptosporidium Quality Control laboratory. This should be separate from the routine processing of samples in the Cryptosporidium analytical laboratory.
Procedure to be operated 1. Cleaning 1.1 The wash station plunger head must be washed in a hot solution of 1% Decon 90 solution and then thoroughly rinsed with Cryptosporidium free water followed by cleaning with a damp cloth and left to dry before storing. The paintwork can be cleaned with soapy water and/or 70% ethanol. 1.2 All tubing and Concentrator Sets must be disassembled prior to washing. Concentrator Sets must be washed in a hot solution of 1% Decon 90 solution and then thoroughly rinsed with Cryptosporidium free water followed by cleaning with a damp cloth and left to dry before storing. Peristaltic tubing should be washed with soapy water and flushed with Cryptosporidium free water. 1.3 The filter housings (stainless steel and plastic) must be washed in a hot
solution of 1% Decon 90 solution and then thoroughly rinsed with Cryptosporidium free water followed by cleaning with a damp cloth and left to dry before storing.
1.4 Plastic trays and racks should be washed in a hot solution of 1% Decon 90
solution and then thoroughly rinsed with Cryptosporidium free water followed by cleaning with a damp cloth and left to dry before storing.
The enumeration of Giardia in drinking water (DWI 70/2/155) Final Report 92
1.5 All glassware (including L10 Leighton tubes (Dynal) should be washed in hot solution of 1% Decon 90 solution and then thoroughly rinsed with Cryptosporidium free water followed by cleaning with a damp cloth and left to dry before storing.
1.6 Record all cleaning and washing in the cleaning logbook accompanied by
initials, date and time. 2. Performance criteria 2.1 Abrasive washing must not be used. 2.2 Do not leave metal components immersed in hot 1% Decon 90 solution for longer than 2 minutes. 2.3 All equipment used for positive control samples must be washed separately from any other equipment. 2.4 Tubing and Concentrator sets must not be autoclaved. 3. Maintenance of Equipment Principle: All equipment used in the sampling, elution, concentration and analysis of Cryptosporidium oocysts must be maintained as described in the manufacturer’s instructions. All maintenance (servicing, replacement parts) must be recorded in a log book with dates and type of maintenance performed. 3.1 The “O” ring on the plunger should be lubricated with silicon grease before
each use. However lubrication of the “rack and pinion” mechanism is not required. The latter is self lubricating.
3.2 The “O” rings in the concentrator must be checked at least once per week for effectiveness of seal. Replace if necessary. 3.3 The screw threads on the filter housing body/lid and the internal “O” rings should be lightly greased using a silicone grease. 3.4 It is recommended to use the tool spanners provided with the Filter Housings to tighten and undo the housing. 3.5 All types of maintenance must be recorded in the maintenance logbook.
The enumeration of Giardia in drinking water (DWI 70/2/155) Final Report 93
4. Instructions for correct use and maintenance of the MKII Filta-MaxTM Filter Housings 4.1 Guidelines for Use with the Filta-Max System:-
4.1.1 Ensure all O-rings are located correctly and lightly greased before use.
4.1.2 Use the tools provided by IDEXX to close the MKII housing. Align the lid onto the base and tighten until the two tag holes and serial numbers align. Tag holes are identified by the presence of horizontal and vertical drill holes.
4.1.3 When tightened adequately there should be a gap of approximately
0.50mm between base and lid of the housing. The filter module should not move within the housing. Avoid tightening beyond this point.
4.1.4 Ideally the MKII Filter Housing should be used at pressures less than 5
Bar. 8 Bar is the maximum operating pressure.
4.1.5 To open the MKII Filter Housing use the tools supplied by IDEXX. 4.2 Maintenance and Cleaning:-
4.2.1 Before each use, clean debris and grease from around the housing threads, re-grease before use.
4.2.2 The MKII filter housing may be cleaned in a dishwasher at
temperatures not exceeding 40°C. Note: Rinse aids should NOT be used.
4.2.3 Clean the inner and outer surfaces of the filter housing with a non-
abrasive sponge or cloth and warm soapy water. Rinse with oocyst free water and dry.
5. Cleaning of Experimental Rig for Spiking Recovery Experiments 5.1 Thoroughly soak the tubing associated with the experimental rig in 1% Decon
90 hot solution for no longer than 2 minutes. 5.2 Thoroughly rinse with deionised water which has been tested for the absence
of Cryptosporidium oocysts and Giardia cysts. 5.3 Leave to dry.
The enumeration of Giardia in drinking water (DWI 70/2/155) Final Report 94
6. Laboratory Spills and Breakages 6.1 General:-
6.1.1 Act to minimise risks to yourself and other personnel.
6.1.2 Seek assistance. It is usually most convenient to get another member of staff to bring items to you rather than spread the breakage/spill further.
6.2 Chemical Spills:-
6.2.1 Clean up minor spills of reagents, media, etc. with paper towel and water. Do not add water to strong acid.
6.2.2 Where required, chemical spillage kits are available from the chemistry
laboratories which contain absorbant pads.
6.2.3 Seek advice from a senior member of staff in the unlikely event of a significant spill of a hazardous chemical.
6.3 Broken Glass:-
6.3.1 Collect clean/dry and non-contaminated broken glass carefully using dustpan and brush or pieces of card. Dispose of glass in sharps bin.
6.3.2 Clear up broken glass and liquid carefully using card and paper towel.
Discard into sharps bin. 6.4 Broken or Spilt Cultures:-
6.4.1 Work so as not to spread contamination further. Remove contaminated clothing to a bag for autoclaving. Call for assistance.
6.4.2 Wear gloves. Cover the spill with alcohol wipes. Leave for 10-15
minutes to allow disinfectant to act and allow aerosols to settle.
6.4.3 Inform all other relevant staff of the incident and write a label to mark and quarantine the affected area if spill is significant.
6.4.4 Put on disposable gloves and collect all waste into a incinerator
container. Use paper towel and/or card. Do not use the dustpan or brush as these cannot be disinfected readily.
6.4.5 Clean the spillage area thoroughly with IMS wipes. Clean surrounding
area with IMS wipes.
The enumeration of Giardia in drinking water (DWI 70/2/155) Final Report 95
6.4.6 Inform senior member of staff if any other cleaning, precautionary measures or environmental monitoring is required.
7. General Laboratory Cleaning 7.1 All staff including cleaners must record the time and date of entry and
departure from the Cryptosporidium laboratory including initials and signature in the entry log book. Unauthorised persons must be accompanied at all times whilst in the Cryptosporidium laboratory by an authorised member of staff.
7.2 Where an authorised person is in the laboratory unaccompanied, it is the
responsibility of a senior member of staff to ensure all samples and slides are securely stored.
7.3 Regular general cleaning of the Cryptosporidium laboratory is a requirement
to ensure a suitable environment. It is normally performed by authorised staff. 7.4 In addition, specific cleaning of work areas and equipment is performed, but
only by trained Cryptosporidium laboratory staff as is cleaning in the event of a spillage. Cleaning should be carried out using an approved and tested (eg. European suspension test), bacteriacidal detergent sanitiser (eg. SWC Bacto Detsan), deemed suitable by the Cryptosporidium Manager. This sanitiser should preferably be a quaternary ammonium based compound and odourless since other formulations may interfere with sensitive chemical measuring devices.
7.5 Floors:-
7.5.1 Floors should be cleaned daily, but must be done a minimum of at least twice a week.
7.5.2 Vacuum clean the floors, paying particular attention to edges and corners. Do not use broom or dustpan and brush as this stirs up the dust.
7.5.3 Mop or buffer all the accessible floor areas using the approved
sanitiser. 7.6 Sinks and Hand Basin:-
7.6.1 Clean regularly once a week using detergent and household cleaner.
7.6.2 Always rinse sinks well and leave clean.
The enumeration of Giardia in drinking water (DWI 70/2/155) Final Report 96
7.7 Ledges:-
7.7.1 Wipe all ledges as required using approved sanitiser. 7.8 Laboratory cleaning by authorised staff must only be performed when it is safe
and convenient with respect to work in the laboratory. Wear gloves and an apron when handling hot water and detergents or cleaning materials for prolonged periods.
7.9 Disposal of Rubbish:-
7.9.1 The laboratory must be maintained so that Good Laboratory Practice is performed at all times. The laboratory must be cleaned regularly, spills and breakages (section 6) must be actioned immediately and rubbish disposed of suitably.
7.9.2 Broken glassware must be disposed in the appropriate container ie.
broken glass disposal boxes (FISHER CATALOGUE NUMBER SAT-625-010R).
7.9.3 Sharp items used for Cryptosporidium analysis is placed in sharps
boxes (FISHER CATALOGUE NUMBER 55139 SHARPAK 250). If the waste is regarded as infectious then it must be treated under the direction of the laboratory manager to eliminate any risk. The sharps containers are then placed in a clinical waste bag and collected by a specialist clinical waste contractor for incineration (Biffa).
7.9.4 Membranes and sponges that have been analysed are disposed into autoclave bags provided in the laboratory. They are then placed in a clinical waste bag provided in the laboratory (CCS TRANSWASTE, telephone 024 76832251) and placed securely in the provided waste collection bins.
7.9.5 Waste office quality paper should be placed in the special paper bins
provided. This is collected separately from the general waste and is sent for recycling. All non-authorised personnel involved with collecting waste must be supervised at all times and must sign in and out of the laboratory.
7.9.6 General waste ie. non hazardous waste eg. glass, plastics, small metal
objects and paper can be placed in black bin liners for collection by cleaners or taken by laboratory analysts for disposal in the skips outside the building.
The enumeration of Giardia in drinking water (DWI 70/2/155) Final Report 97
All non-authorised personnel involved with the collecting waste must be supervised at all times and must sign in and out of the laboratory.
7.9.7 Cardboard must be taken to the dedicated skip outside the building for recycling. All non-authorised personnel involved with the collecting waste must be supervised at all times and must sign in and out of the laboratory.
7.9.8 Gravels, sludges and soils must be placed in black bin liners and then
taken to the skip for collection and disposal. If the source of the samples or the results of the analysis indicate a potential risk they must be disposed under the guidance of the Manager or Cryptosporidium Laboratory Supervisor Microbiology.
7.9.9 Glass slides must be disposed into the sharps containers (FISHER
CATALOGUE NUMBER 55139 SHARPAK 250) provided. All analysts must consult the responsible manager prior to disposal of any slides (see CRY OPG4). The sharps containers are then placed in a clinical waste bag and collected by a specialist clinical waste contractor for incineration (Biffa).
8. Hazards/Safety 8.1 Carry out all manipulations with due care to avoid accidents. 8.2 Laboratory cleaning by authorised staff must only be performed when it is safe
and convenient with respect to work in the laboratory. Wear gloves and an apron when handling hot water and detergents or cleaning materials for prolonged periods.
8.3 Health and Safety:-
Gloves should be worn at all times when handling potentially contaminated glassware and plastics when using detergents and hot water.
9. References 9.1 Standards and working practices for Microbiological laboratories. Code of practice for Safety in Chemical and Microbiological Laboratories. October 1995.
The enumeration of Giardia in drinking water (DWI 70/2/155) Final Report 98
FiltaMaxTM /EnvirochekTM 100 spike inocula Recovery of Cryptosporidium oocysts FM vs Enck Recovery of Giardia cysts FM vs Enck Recovery of oocysts/cysts Cryptosporidium vs Giardia FiltaMaxTM/EnvirochekTM 10 spike inocula Recovery of Cryptosporidium oocysts FM vs Enck Recovery of Giardia cysts FM vs Enck Recovery of oocysts/cysts Cryptosporidium vs Giardia Recovery rates: oocyst/cysts (Enck/FM filters combined)
Appendix 4.3: Phase 4 Field trials FiltaMaxTM vs EnvirochekTM
100 spike inocula: Recovery of Cryptosporidium oocysts at:
WTW 1 WTW 2 WTW 3 WTW 4 WTW 5
The enumeration of Giardia in drinking water (DWI 70/2/155) Final Report 99
Working Stocks:Runs 53 to 57: For both Crypto and Giardia, EasySeed,batch ES-CG1000-124
Cryptosporidium Giardia
The enumeration of Giardia in drinking water (DWI 70/2/155) Final Report 100
The data were not normally distributed (Figure 3.1), therefore the Mann Whitney, non-parametric test was undertaken to test for significant differences between the recovery data:
Figure A4.1 Histograms of the percentage recovery data a) Cryptosporidium Data
The enumeration of Giardia in drinking water (DWI 70/2/155) Final Report 101
i) Results of a Mann-Whitney Test : % Recovery of Cryptosporidium: Moredun oocysts vs Easyseed oocysts –Phase 1
Moredun: N = 20 Median = 40.50 Easyseed: N = 5 Median = 38.00 Point estimate for ETA1-ETA2 is 4.00 95.5 Percent CI for ETA1-ETA2 is (-2.00,14.00) W = 276.5 Test of ETA1 = ETA2 vs ETA1 not = ETA2 is significant at 0.2770 The test is significant at 0.2758 (adjusted for ties) Cannot reject at alpha = 0.05
The Mann Whitney test indicated that there was no significant difference in the % recovery of oocysts between the Moredun and Easyseed inocula (α > 0.05). ii) Results of a Mann-Whitney Test : % Recovery of Giardia:
TCS cysts vs Easyseed cysts- Phase 1 TCS N = 20 Median = 32.00 Easyseed N = 5 Median = 36.00 Point estimate for ETA1-ETA2 is -3.00 95.5 Percent CI for ETA1-ETA2 is (-11.00,4.00) W = 245.0 Test of ETA1 = ETA2 vs ETA1 not = ETA2 is significant at 0.3246 The test is significant at 0.3237 (adjusted for ties) Cannot reject at alpha = 0.05 The Mann Whitney test indicated that there was no significant difference in the recovery of cysts between the TCS and Easyseed inocula (α > 0.05). iii) Mann-Whitney Test: recovery of Cryptosporidium vs
Giardia (Filtamax system, all inocula data combined)- Phase 1
C10 N = 25 Median = 39.000 C13 N = 25 Median = 32.000 Point estimate for ETA1-ETA2 is 8.000 95.2 Percent CI for ETA1-ETA2 is (3.999,12.999) W = 824.0 Test of ETA1 = ETA2 vs ETA1 not = ETA2 is significant at 0.0003 The test is significant at 0.0003 (adjusted for ties)
The enumeration of Giardia in drinking water (DWI 70/2/155) Final Report 102
The Mann Whitney test indicated that at an inocula level of 1000 oocysts/ cysts the recovery of Cryptosporidium oocysts was significantly greater than the recovery of Giardia cysts with the Filtamax filter system (α< 0.01).
Figure A4.2: Distribution of the Recovery Rates of Cryptosporidium oocysts and Giardia cysts with the Filtamax filter system (1000 oocyst/ cyst spike level)
cystsGiardia
oocystsCryptosporidium
60
50
40
30
20
Recovery%
The enumeration of Giardia in drinking water (DWI 70/2/155) Final Report 103
The enumeration of Giardia in drinking water (DWI 70/2/155) Final Report 105
The data were not normally distributed (Figures 3.2 and 3.3) , therefore the Mann Whitney, non-parametric test was undertaken to test for significant differences between the recovery data: Figure A4.3 Histograms of the % Recovery of Cryptosporidium with the Filtamax and Envirocheck filters a) Filtamax system
b) Envirocheck system
6055504540353025
10
5
0
% Recovery Cryptosporidium :Filtamax
Fre
qu
ency
40 45 50 55 60 65 70 75 80 85
0
5
10
15
% recovery cryptosporidium: Envirocheck
Fre
que
ncy
The enumeration of Giardia in drinking water (DWI 70/2/155) Final Report 106
Figure A4.4 Histograms of the % Recovery of Giardia with the Filtamax and Envirocheck filters c) Filtamax system
d) Envirocheck system
5 10 15 20 25 30 35 40 45 50 55
0
1
2
3
4
5
6
% Recovery Giardia : Filtamax
Fre
quen
cy
10 15 20 25 30 35 40 45 50 55
0
5
10
% Recovery Giardia: Envirocheck
Fre
quen
cy
The enumeration of Giardia in drinking water (DWI 70/2/155) Final Report 107
i) Results of a Mann-Whitney Test : Recovery of Cryptosporidium:
Filtamax vs Envirocheck
Filtamax N = 35 Median = 37.000 Enviroch N = 37 Median = 68.000 Point estimate for ETA1-ETA2 is -34.000 95.0 Percent CI for ETA1-ETA2 is (-38.997,-29.000) W = 645.5 Test of ETA1 = ETA2 vs ETA1 not = ETA2 is significant at 0.0000 The test is significant at 0.0000 (adjusted for ties)
The Mann Whitney test indicated that the recovery of Cryptosporidium oocysts was significantly greater with the Envirocheck system than that obtained with the Filtamax filter system (α< 0.01).
Figure A4.5 : Distribution of the Recovery Rates of Cryptosporidium oocysts with the Envirocheck and Filtamax filter systems
Filtamax: CryptoEnvirocheck: Crypto
80
70
60
50
40
30
20
% r
ecov
ery
The enumeration of Giardia in drinking water (DWI 70/2/155) Final Report 108
ii) Results of a Mann-Whitney Test : Recovery of Giardia: Filtamax vs Envirocheck
Filtamax N = 18 Median = 27.00 Enviroch N = 19 Median = 23.00 Point estimate for ETA1-ETA2 is -4.00 95.3 Percent CI for ETA1-ETA2 is (-14.00,8.00) W = 319.0 Test of ETA1 = ETA2 vs ETA1 not = ETA2 is significant at 0.4942 The test is significant at 0.4940 (adjusted for ties) Cannot reject at alpha = 0.05
The Mann Whitney test indicated that the recovery of Giardia cysts with the Envirocheck and Filtamax filter systems was not significantly different (α > 0.05).
Figure A4.6 : Distribution of the Recovery Rates of Giardia cysts with the Envirocheck and Filtamax filter systems
Filtamax Envirocheck
60
50
40
30
20
10
0
% R
ecov
ery
Gia
rdia
Cys
ts
The enumeration of Giardia in drinking water (DWI 70/2/155) Final Report 109
iii) Results of a Mann-Whitney Test : Recovery of Giardia vs
Cryptosporidium (Filtamax and Envirocheck data combined)
Crypto 1 N = 37 Median = 53.00 Giardia N = 37 Median = 25.00 Point estimate for ETA1-ETA2 is 25.00 95.1 Percent CI for ETA1-ETA2 is (16.00,33.00) W = 1852.5 Test of ETA1 = ETA2 vs ETA1 not = ETA2 is significant at 0.0000 The test is significant at 0.0000 (adjusted for ties)
The Mann Whitney test of the combined Envirocheck and Filtamax data indicated that the recovery of Cryptosporidium oocysts was significantly greater than the equivalent recovery of Giardia cysts (α< 0.01).
Figure A4.7 : Distribution of the Recovery Rates of Cryptosporidium oocysts and Giardia cysts (Envirocheck and Filtamax filter systems data combined)
GiardiaCryptosporidium
90
80
70
60
50
40
30
20
10
0
% R
ecov
ery
The enumeration of Giardia in drinking water (DWI 70/2/155) Final Report 110
The enumeration of Giardia in drinking water (DWI 70/2/155) Final Report 112
The data were not normally distributed (not illustrated), therefore the Mann Whitney, non-parametric test was undertaken to test for significant differences between the recovery data:
i) Results of a Mann-Whitney Test : Recovery of Cryptosporidium: Filtamax vs Envirocheck
Crypto Enviro N = 21 Median = 50.00 Crytpso Filtam N = 21 Median = 30.00 Point estimate for ETA1-ETA2 is 20.00 95.0 Percent CI for ETA1-ETA2 is (10.00,30.00) W = 564.5 Test of ETA1 = ETA2 vs ETA1 not = ETA2 is significant at 0.0047 The test is significant at 0.0042 (adjusted for ties)
The Mann Whitney test indicated that the recovery of Cryptosporidium oocysts was significantly greater with the Envirocheck system than the Filtamax filter system (α< 0.01).
Figure A4.8 : Distribution of the Recovery Rates of Cryptosporidium oocysts with the Envirocheck and Filtamax filter systems (10 oocyst spike inocula)
Filtamax Envirocheck
90
80
70
60
50
40
30
20
10
0
% R
ecov
ery
The enumeration of Giardia in drinking water (DWI 70/2/155) Final Report 113
ii) Results of a Mann-Whitney Test : Recovery of Giardia: Filtamax vs Envirocheck
Giardia Enviroch N = 21 Median = 0.00 Giardia Filtamax N = 21 Median = 0.00 Point estimate for ETA1-ETA2 is 0.00 95.0 Percent CI for ETA1-ETA2 is (-0.00,-0.00) W = 467.5 Test of ETA1 = ETA2 vs ETA1 not = ETA2 is significant at 0.6966 The test is significant at 0.6475 (adjusted for ties) Cannot reject at alpha = 0.05
The Mann Whitney test indicated that the recovery of Giardia cysts with the Envirocheck and Filtamax filter systems was not significantly different (α > 0.05).
Figure A4.9 : Distribution of the Recovery Rates of Giardia cysts with the Envirocheck and Filtamax filter systems (10 oocyst spike inocula)
FiltamaxEnvirocheck
40
30
20
10
0
% R
ecov
ery
The enumeration of Giardia in drinking water (DWI 70/2/155) Final Report 114
iii) Results of a Mann-Whitney Test : Recovery of Giardia vs
Cryptosporidium (Filtamax and Envirocheck data combined)
Giardia N = 42 Median = 0.00 Cryptos N = 42 Median = 40.00 Point estimate for ETA1-ETA2 is 40.00 95.0 Percent CI for ETA1-ETA2 is (30.00,40.00) W = 2525.0 Test of ETA1 = ETA2 vs ETA1 not = ETA2 is significant at 0.0000 The test is significant at 0.0000 (adjusted for ties)
The Mann Whitney test of the combined Envirocheck and Filtamax data indicated that the recovery of Cryptosporidium oocysts was significantly greater than the equivalent recovery of Giardia cysts (α< 0.01).
Figure A4.10 : Distribution of the Recovery Rates of Cryptosporidium oocysts and Giardia cysts (Envirocheck and Filtamax filter systems data combined) (10 oocyst/cyst inocula level)
The data indicate that 10 oocysts/cysts per sample is above the detection limit for Cryptosporidia and at the detection limit for Giardia.
GiardiaCryptosporidium
90
80
70
60
50
40
30
20
10
0
% R
ecov
ery
The enumeration of Giardia in drinking water (DWI 70/2/155) Final Report 115
i) Results of a Mann-Whitney Test : Recovery of Cryptosporidium -1000 oocysts versus 100 oocysts inocula levels
Crypto10 N = 25 Median = 39.00 Crypto 1 N = 37 Median = 56.00 Point estimate for ETA1-ETA2 is -10.00 95.1 Percent CI for ETA1-ETA2 is (-24.00,-1.00) W = 622.0 Test of ETA1 = ETA2 vs ETA1 not = ETA2 is significant at 0.0179 The test is significant at 0.0178 (adjusted for ties)
Figure A4.11 : Distribution of the Recovery Rates of Cryptosporidium oocysts at 1000 oocyst and 100 oocyst inocula levels
oocysts1000
oocysts100
80
70
60
50
40
30
20
% R
ecov
ery
The enumeration of Giardia in drinking water (DWI 70/2/155) Final Report 116
ii) Results of a Mann-Whitney Test : Recovery of Giardia -1000 cysts versus 100 cysts inocula levels Giardia N = 25 Median = 32.00 Giardia N = 37 Median = 25.00 Point estimate for ETA1-ETA2 is 6.00 95.1 Percent CI for ETA1-ETA2 is (-2.00,12.00) W = 894.0 Test of ETA1 = ETA2 vs ETA1 not = ETA2 is significant at 0.1282 The test is significant at 0.1281 (adjusted for ties) Cannot reject at alpha = 0.05
The enumeration of Giardia in drinking water (DWI 70/2/155) Final Report 117
Figure A4.12 : Distribution of the Recovery Rates of Giardia cysts at 1000 cyst and 100 cyst inocula levels
1000 cysts100 cysts
60
50
40
30
20
10
0
% R
ecov
ery
oocysts1000
oocysts100
80
70
60
50
40
30
20
% R
ecov
ery
The enumeration of Giardia in drinking water (DWI 70/2/155) Final Report 118
COMPARISON OF RECOVERIES : INOCULA LEVELS i) Results of a Mann-Whitney Test: Cryptosporidium 1000 seed versus 100 seed with Filtamax filters Crypto10 N = 25 Median = 39.000 Filtamax N = 18 Median = 37.000 Point estimate for ETA1-ETA2 is 3.000 95.2 Percent CI for ETA1-ETA2 is (-0.997,8.002) W = 612.0 Test of ETA1 = ETA2 vs ETA1 not = ETA2 is significant at 0.1300 The test is significant at 0.1291 (adjusted for ties) Cannot reject at alpha = 0.05
ii) Results of a Mann-Whitney Test: Giardia 1000 seed versus 100 seed with Filtamax filters Giardia N = 25 Median = 32.00 Filtamax N = 18 Median = 27.00 Point estimate for ETA1-ETA2 is 6.00 95.2 Percent CI for ETA1-ETA2 is (-1.00,14.00) W = 617.0 Test of ETA1 = ETA2 vs ETA1 not = ETA2 is significant at 0.1016 The test is significant at 0.1014 (adjusted for ties) Cannot reject at alpha = 0.05
iii) Results of a Mann-Whitney Test: Cryptosporidium 100 seed versus 10 seed with Filtamax filters Filtamax N = 18 Median = 37.00 Crytpso N = 21 Median = 30.00 Point estimate for ETA1-ETA2 is 5.00 95.3 Percent CI for ETA1-ETA2 is (-3.00,16.01) W = 395.0 Test of ETA1 = ETA2 vs ETA1 not = ETA2 is significant at 0.3311 The test is significant at 0.3289 (adjusted for ties) Cannot reject at alpha = 0.05
iv) Results of a Mann-Whitney Test: Cryptosporidium 1000 seed versus 100 seed with Envirocheck filters Enviroch N = 19 Median = 68.00 Cryptosp N = 21 Median = 50.00 Point estimate for ETA1-ETA2 is 17.00 95.2 Percent CI for ETA1-ETA2 is (6.00,28.00) W = 484.0 Test of ETA1 = ETA2 vs ETA1 not = ETA2 is significant at 0.0109 The test is significant at 0.0107 (adjusted for ties)
The enumeration of Giardia in drinking water (DWI 70/2/155) Final Report 119
COMPARISON OF RECOVERIES ENVIROCHECK VERSUS FILTAMAX ( 100 SEED) i) Results of a Mann-Whitney Test: Filtamax system - Cryptosporidium 100 seed versus Giardia 100 seed Filtamax Crypto N = 18 Median = 37.00 Filtamax Giardia N = 18 Median = 27.00 Point estimate for ETA1-ETA2 is 11.00 95.2 Percent CI for ETA1-ETA2 is (2.00,20.00) W = 409.5 Test of ETA1 = ETA2 vs ETA1 not = ETA2 is significant at 0.0162 The test is significant at 0.0161 (adjusted for ties)
ii) Results of a Mann-Whitney Test: Envirocheck system - Cryptosporidium 100 seed versus Giardia 100 seed Enviroch Crypto N = 19 Median = 68.00 Enviroch Giardia N = 19 Median = 23.00 Point estimate for ETA1-ETA2 is 43.00 95.3 Percent CI for ETA1-ETA2 is (29.00,49.00) W = 545.5 Test of ETA1 = ETA2 vs ETA1 not = ETA2 is significant at 0.0000 The test is significant at 0.0000 (adjusted for ties)
The enumeration of Giardia in drinking water (DWI 70/2/155) Final Report 120
Boxplot analysis The boxplot consists of a box, whiskers, and outliers. A line is drawn across the box at the median. By default, the bottom of the box is at the first quartile (Q1), and the top is at the third quartile (Q3) value. The whiskers are the lines that extend from the top and bottom of the box to the adjacent values. The adjacent values are the lowest and highest observations that are still inside the region defined by the following limits: Lower Limit: Q1 - 1.5 (Q3 - Q1) Upper Limit: Q3 + 1.5 (Q3 - Q1) Outliers are points outside of the lower and upper limits and are plotted with asterisks (*).
The enumeration of Giardia in drinking water (DWI 70/2/155) Final Report 121
Appendix 4.3 Field trials recovery statistics
FiltaMax 100 spike inocula
SITE Run No. Spike Dose Sample Volume No.of Oocysts % Recovery No.of Cysts % RecoveryDetected Detected
The enumeration of Giardia in drinking water (DWI 70/2/155) Final Report 125
The Cryptosporidium data were not normally distributed (Figure A4.13) , therefore the Mann Whitney, non-parametric test was undertaken to test for significant differences between the Filtamax and Envirochek recovery data. Statistical analysis of the Giardia data was not undertaken.
Figure A4.13: Histograms of the recovery data for Cryptosporidium oocysts using the Filtamax system
454035302520
3
2
1
0
WTW 1 Filtamax
Fre
quen
cy
50403020100
5
4
3
2
1
0
WTW 2 filtamax
Fre
qu
ency
2520151050
3
2
1
0
WTW 3 Filtamax
Fre
qu
ency
40353025201510
3
2
1
0
WTW 4 Filtamax
Fre
qu
ency
30252015105
3
2
1
0
WTW 5 Filtamax
Fre
qu
ency
The enumeration of Giardia in drinking water (DWI 70/2/155) Final Report 126
i) Results of a Mann-Whitney Test : WTW 1 Filtamax, WTW 1 Envirochek WTW 1 filtamax N = 9 Median = 31.00 WTW 1 envirochek N = 10 Median = 47.50 Point estimate for ETA1-ETA2 is -15.00 95.5 Percent CI for ETA1-ETA2 is (-25.00,-3.00) W = 58.5 Test of ETA1 = ETA2 vs ETA1 not = ETA2 is significant at 0.0114 The test is significant at 0.0113 (adjusted for ties)
The Mann Whitney test indicated that the recovery of Cryptosporidium oocysts was significantly greater with the Envirochek filter than the Filtamax filter system at WTW 1 (α< 0.05).
ii) Results of a Mann-Whitney Test : WTW 2 Filtamax, WTW 2 Envirochek
WTW 2 filtamax N = 10 Median = 12.00 WTW 2 Envirochek N = 10 Median = 23.00 Point estimate for ETA1-ETA2 is -9.00 95.5 Percent CI for ETA1-ETA2 is (-24.01,6.00) W = 89.0 Test of ETA1 = ETA2 vs ETA1 not = ETA2 is significant at 0.2413 The test is significant at 0.2401 (adjusted for ties) Cannot reject at alpha = 0.05
The Mann Whitney test indicated that there was no significant difference in the recovery of Cryptosporidium oocysts between the Filtamax and Envirochek filter systems at WTW 2.
iii) Results of a Mann-Whitney Test : WTW 3 Filtamax, WTW 3 Envirochek
WTW 3 filtamx N = 10 Median = 18.50 WTW 3 envirochek N = 10 Median = 1.50 Point estimate for ETA1-ETA2 is 17.00 95.5 Percent CI for ETA1-ETA2 is (7.00,21.00) W = 140.5 Test of ETA1 = ETA2 vs ETA1 not = ETA2 is significant at 0.0082 The test is significant at 0.0077 (adjusted for ties)
The Mann Whitney test indicated that the recovery of Cryptosporidium oocysts was significantly greater with the Filtamax filter than the Envirochek filter system at WTW 3 (α< 0.01).
iv) Results of a Mann-Whitney Test : WTW 4 Filtamax, WTW4 Envirochek
WTW 4 filtamax N = 10 Median = 19.00 WTW 4 envirochek N = 10 Median = 3.50 Point estimate for ETA1-ETA2 is 15.00 95.5 Percent CI for ETA1-ETA2 is (10.00,21.00) W = 155.0 Test of ETA1 = ETA2 vs ETA1 not = ETA2 is significant at 0.0002 The test is significant at 0.0002 (adjusted for ties)
The enumeration of Giardia in drinking water (DWI 70/2/155) Final Report 127
The Mann Whitney test indicated that the recovery of Cryptosporidium oocysts was significantly greater with the Filtamax filter than the Envirochek filter system at WTW 4 (α< 0.01).
v) Results of a Mann-Whitney Test : WTW 5 Filtamax, WTW 5 Envirochek
WTW 5 filtamax N = 10 Median = 20.00 WTW 5 envirochek N = 10 Median = 37.50 Point estimate for ETA1-ETA2 is -16.00 95.5 Percent CI for ETA1-ETA2 is (-32.00,-1.00) W = 77.0 Test of ETA1 = ETA2 vs ETA1 not = ETA2 is significant at 0.0376 The test is significant at 0.0374 (adjusted for ties)
The Mann Whitney test indicated that the recovery of Cryptosporidium oocysts was significantly greater with the Envirochek filter than the Filtamax filter system at WTW 5 (α< 0.05).
The enumeration of Giardia in drinking water (DWI 70/2/155) Final Report 128