Final Report Evaluation of MAUDE Reporting Rates, Sales Estimates and Comparative Bench Testing Related to Vena Cava Filters John Lehmann, MD, MPH December 15th , 2004 3 EXHIBIT Pct-To t\Iff a LMD1 BPVE-01-01019786
Transcript
Final Report
Evaluation of MAUDE Reporting Rates, Sales Estimates and
Comparative Bench Testing Related to Vena Cava Filters
John Lehmann, MD, MPH December 15th, 2004
3
EXHIBIT Pct-To t\Iff
a
LMD1 BPVE-01-01019786
Vena Cava Filters — Final Report December 15th, 2004 Privileged and confidential Attorney work product Pursuant to contract
Table of Contents:
Main report Executive Summary 1 1. Methods
1.1. MAUDE reports 4 12. Sales data 5 13. Risk calculations 5 1.4. Bench test data 5
2. MAUDE reporting rates 2.1. Overview 6 2.2. Reports of death 8 2.3. Reports of adverse events 9 2.4. Reports of filter fractures 10 2.5. Reports of caval perforation 11
'- go n I •
nieii
2.7. Reports of filter embolization 13 2.8. Reports of filter emboli7ation deaths 14 2.9. Assessment of other VCFs 15 2.10. 'Proportional reporting rates 17
ary reg Li • 11111 -pas iaLysis 1.8 3. Analysis of B each Testing for Migration Resistance
3.1. Overview 19 3.2. Test data 19 3.1 Correlation with MAUDE reporting rates 20 1_4 Summary Ti-garding_benchiesting.of-migtation_resi.4ance
Appendix A: Problems with quantitative interpretation of 1VIAT_IDE and sales data 1. Introduction Al 2. Lack of reliable relationship between reporting rates and true event rates Al 3. Absence of benefit assessment. AS 4. Absence of alternative data sets A6 5. Potential effect of these factors in the assessment of the Recovery VCF A7 6. Summary and Conclusion A9 7. References Al 0
Appendix B: References
Appendix C: MAUDE Data tables
II II
LMD1 BPVE-01-01019787
Vena Cava Filters — Final Report December 15th, 2004 Privileged and confidential Attorney work product Pursuant to contract
Executive Summary
Introduction
This analysis considered selected types of adverse events related to the use of vena cava filters (VCF) as reported in the MAUDE database maintained by the FDA for medical device reporting. These reported events were compared to estimated sales data to establish apparent reporting rates for each category of adverse event The risk for each repor dug rate was compared between the Bard Recovery VCF and the other products individually and as aggregated by using relative risk calculations with confidence intervals and significance testing.
Once a reporting rate for VCF migration was established, it was compared to bench testing performed by Bard Peripheral Vascular (BPV) Division, and correlations
In considering any of these conclusions, it is important to consider the multiple sources of potential error and bias in the underlying data. It is my opinion, and that of most of the
expert-literature, that-quantitative assessment_ofreporting_rates_to-the-F_DAIsspantaneous reporting systems (MAUDE for devices and AERS for drugs) cannot be used to prove assertions about actual incidence rates for any events. Rather, substantial increases in reporting rates are useful as signals indicating the need for further evaluation of potential risks. Please refer to Appendix A, "Problems with quantitative interpretation of MAUDE
An additional caveat is that this analysis did not include a formal assessment of benefit, a critical element of meaningful risk-benefit appraisals of medical product clinical performance. If the Recovery VCF provides unique benefit to a class of patients, then the suggestion of a small absolute increase in risk of death related to its use needs to be considered in light of its potential benefit, even if that benefit cannot be quantified at this time.
Findings
A summary of the report findings follows. The major analysis centered around the relative risk (RR) of reporting rates between the Recovery VCF and aggregates of the other commercialized VCF, reported as a RR with a statistical significance. Other filters were-also-compared,--and-bench-testing-was-reported-and-compared-te-MADDE-reporting rates for filter movement.
Page 1 of 21
LMD1 BPVE-01-01019788
Vena Cava Filters -Final Report December 151, 2004 Privileged and confidential Attorney work product Pursuant to contract
o Recovery compared with permanent VCFs: The relative risk (RR) for the VCFs was significantly higher Recovery VCF report rate compared with all other
for the following categories of reports: o Reports of death (RR = 4.6, p =0.000) o Reports of all adverse events (RR= 1.9, p = 0.000) o Reports of filter fracture (RR = 5.3, p = 0.000) o Reports of caval perforation (RR = 4.1, p = 0.001) o Reports of filter movement (RR = 4.4, p =0.000) o Reports of filter embolization (RR= 3.2, p = 0.002) o Reports of filter embolization deaths (RR = 12.8, p = 0.000)
• Recovery compared with retrievable VCFs: The RR for the Recovery VCF report rate compared with all retrievable VCFs (Tulip and Optease) was significantly higher for the following categories of reports:
o Reports of all adverse events (RR =- 1.6, p = 0.022) o Reports of filter fracture (RR = 13.6, p = 0.006) o Reports of filter movement (RR= 2.6,p = 0.012)
;053 o _p Th*. ans of fdtei emb-Olizakm
o Other significant comparisons: o The TrapEase VCF was associated with a significantly higher RR than
other VCFs for reports of ca.val thrombosis, as follows:
~~
-rapEase-vs,al1-other-VGFs---4RR-=-32.2, p =-I/-000) • TrapEase vs. other permanent VCFs (RR= 106.0, p = 0.000)
TrapEase vs. retrievable VCFs (RR = 7.7, p = 0.000) o The VenaTech VCF was associated with a significantly higher RR than
other VCFs for reports of filter embolization, as follows: a V-v&-oth - "-=4-95-p-- 0.000) • VenaTech vs_ other permanent VCFs (RR= 4.6, p = 0.000) • VenaTech vs. retrievable VCFs (BR = 1.9, p 0.074)
• Bench testing for migration resistance: The Recovery VCF had the lowest mean migration resistance in a simulated inferior vena cava test apparatus, with a mean value of 50 rom .1-1g, closely followed by the Tulip VCF at 55 nun Hg.
O Correlation of MAUDE reporting rates for filter movement with bench testing for migration resistance: There is a significant inverse linear relationship between these two measures of VCF performance, suggesting:
o That bench testing may be predictive for clinical performance o That the two independent datasets (MAUDE report rates and bench testing
results) contain significant relevant signals regarding VCF performance related to VCF migration.
1 Page 2 of 21
LMD1 BPVE-01-01019789
Vena Cava Filters — Final Report December 15th, 2004 Privileged and confidential Attorney work product
Pursuant to contract
o No consideration of benefit None of this analysis considers relative VCF benefits, and thus can only indirectly support a risk— benefit assessment related to overall product performance.
Conclusion: This data and analysis provides two significant signals (MAUDE rates and bench test data) that further investigation of the Recovery VCF filter performance in relation to migration and fracture is urgently warranted. Given the multiple known flaws in the data available, this analysis is insufficient to demonstrate conclusively that any of the VCFs analyzed presents an excess risk. Valid product performance assessment must also consider product benefit.
Page 3 of 21
LMD1 BPVE-01-01019790
Vena Cava Filters —Final Report Privileged and confidential Attorney work product
December 15th, 2004 Pursuant to contract
CAVEAT
Reporting rates must not be equated with true event rates, and in fact may differ from formal incidence rates by orders of magnitude for a variety of complex reasons. In addition, the biases and confounding factors that produce such distortions may be quite different between VCFs, and an unknown proportion of the observed differences reported below could arise from these defects in the data. In addition to considerable flaws regarding reporting data, the use of sales data as a proxy for device exposure, while a widely practiced expedient, has many potential shortcomings.
Therefore, this analysis cannot by its nature offer conclusive evidence of comparative risk, but at best can only suggest hypotheses that need further, independent investigation. Appendix A details the complex issues involved, and is an integral part of this report.
1.0 Methods:
1.1 MAUDE reports:
The Manufacturer and User Facility Device Experience Database (MAUDE) was searched by Bud Peripheral Vascular (BPV) personnel and an initial list of relevant reports relating to VCFs was compiled for the time period starting January, 2000, and concluding in September, 2004. The author reviewed the listing and performed repetitive
additional-searehes-of-the-MAUDE-database-using-product-code-MTICI)rmanufacturer name (including spelling variants), product name (including spelling variants) and key adverse event categories, using both text and category search facilities provided by the FDA.2 The BPV database categorization was sampled by reviewing approximately 300 of the 600 reports including all reports for analyzed categories, and discrepancies discussed with BPV personnel and further reports reviewed until consensus was reached. The attribution of category, fatal outcome and potential report duplication were ultimately determined for this analysis by the author. When uncertainty remained despite reasonable effort, the attributions were made in a way that did not favor the Recovery VCF; these instances were quite infrequent These reports and. their categories were stored in an Excel spreadsheet3 which aggregated report types across all filters. This database and analysis does not include any Recovery or other VCF events reported after September 2004.
t bttp:/fwww.fda.gov/cdrhfmaude.httnl 2 bttp://www.aceessdatalda.goviscripts/cdrh/cfdocs/cfMAUDE/search:cfm 3 Please refer to Appendix C.
Page 4 of 21
LMD1 BPVE-01-01019791
Vena Cava Filters — Final Report December 15th, 2004 Privileged and confidential Attorney work product Pursuant to contract
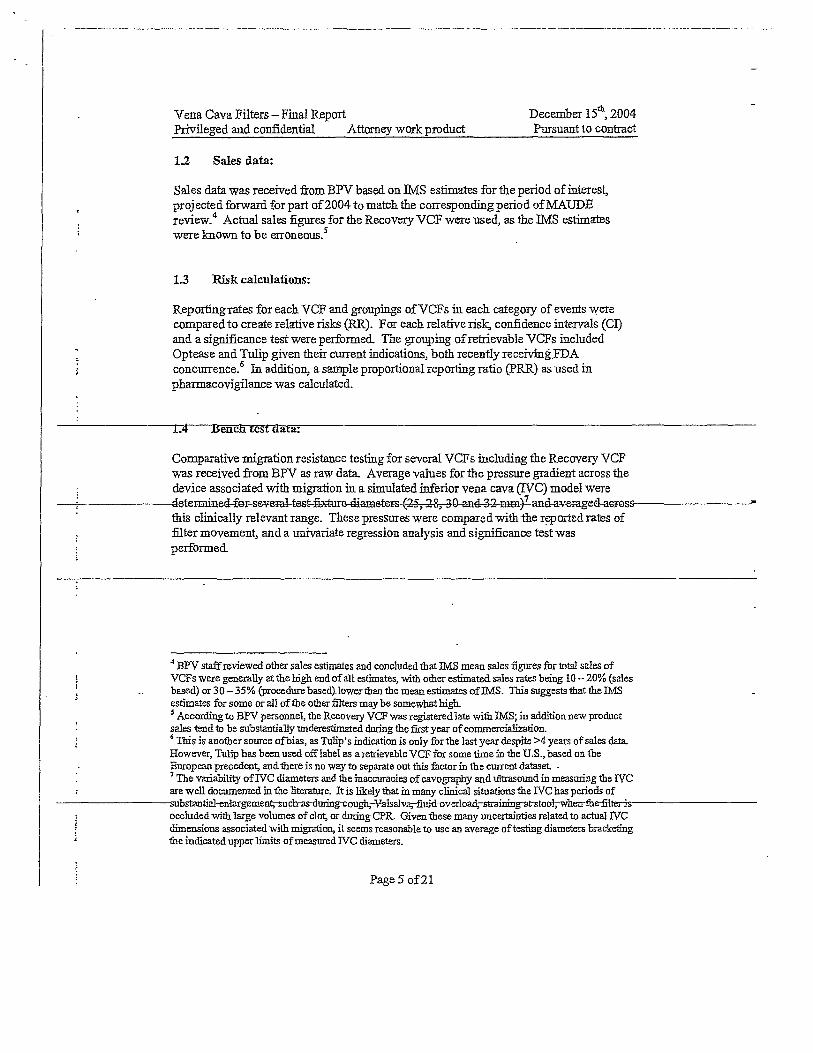
1.2 Sales data:
Sales data was received from BPV based on IMS estimates for the period of interest, projected forward for part of 2004 to match the corresponding period of MAUDE review.4 Actual sales figures for the Recovery VCF were used, as the IMS estimates were known to be erroneous.5
1.3 Risk calculations:
Reporting rates for each VCF and groupings of VCFs in each category of events were compared to create relative ricks (RR). For each relative risk, confidence intervals (CI) and a significance test were performed. The grouping of retrievable VCFs included Optease and Tulip given their current indications, both recently receiving .FDA concurrence.6 In addition, a sample proportional reporting ratio (PRR) as used in pharmacovigilance was calculated.
1.4--BErrtcla fardAta.
Comparative migration resistance testing for several VCFs including the Recovery VCF was received from BPV as raw data. Average values for the pressure gradient across the device associated with migration in a simulated inferior vena cava (IVC) model were detesraineel-fer-several-testre-diameters-(2-5, 28, 30-and-3-2 and-averaged-across this clinically relevant range. These pressures were compared with reported rates of filter movement, and a univariate regression analysis and significance test was performed.
4 BPV staff reviewed other sales estimates and concluded that IMS mean sales figures for total sales of VCFs were generally at the high end of all estimates, with other estimated sales rates being 10 - 20% (sales based) or 30 -.35% (procedure based) lower than the mean estimates of IMS. This suggests that the IMS estimates for some or all of the other filters may be somewhat high. 5 According to BPV personnel, the Recovery VCF was registered late with IMS; in addition new product sales tend to be substantially underestimated during the first year of commercialization. 6 Tbis is another source of bias, as Tulip's indication is only for the last year despite >4 years of sales data. However, Tulip has been used off label as a retrievable VCF for some time in the 'U.S., based on the European precedent, and there is no way to separate out this factor in the current dataset. - 7 The variability of IVC diameters and the inaccuracies of cavography and ultrasound in measuring the NC are well documented in the literature. It is likely that in many clinical situations the IVC has periods of substantial-enlargemensuch-as-during-cough,-Valsalvfluid-overload-straining-at-stool-,-wberrthe-fiiteris occluded with large volumes of clot, or during CPR. Given these many uncertainties related to actual NC dimensions associated with migration, it seems reasonable to use an average of testing diameters bracketing the indicated upper limits of measured NC diameters.
Page 5 of 21
LMD1 BPVE-01-01019792
Vena Cava Filters.- Final Report December 15-th, 2004 Privileged and confidential Attorney work product Pursuant to contract
2.0 MAUDE reporting rates:
2.1 Overview
The report categories of interest analyzed below are listed and defined in Table One:
Table One: Categories of MAUDE Reports
Category of report Definition for categorizing MAUDE reports Death Any VCF report in which the patient was reported as
deceased, without attempt to assess causality Total adverse events Any VCF report except those without patient impact of any
kind, such as mislabeling Filter fracture Any VCF report describing a device found in two or more
separate pieces Caval perforation Any VCF report stating or implying penetration, perforation
or disruption of the WC wall, with or without consequences bitter movements Any V etrreport in which the VC,t, was reported as having
moved from the initial implant site Filter embolization9 A subset of filter movement reports in which the VCF moved
to a new anatomic region Filter embolizafion
-death A subset of filter embolization reports which were also death
-reports
Table Two lists the estimated sales data and counts for each report type.
Tal -wnt—Sales-antl-Repoirt-eouo
VCF 1000- 3404
Sales
Nonduplicate report counts from the MAUDE database for tmeolten
82 'Recovery sales are actual, all others IMS estimates projected thru 3004
16
8 This is often called 'migration', but the term is variably used by authors and so the neutral term `movemene-is-substituted in-this-report—As-a-practical-rnatterrthis-includecl-all-VGF-movements-in-whieh the filter remained in the IVC, even if above the renal vessels. 9 As a practical matter, these almost always involved movements into the thorax, including the superior vena cava, the chambers and valves of the heart and the pulmonary artery.
Page 6 of 21
LMD1 BPVE-01-01019793
Vena Cava Filters —Final Report Privileged and confidential Attorney work product
December 15e, 2004 Pursuant to contract
When these counts are divided by the sales data and multiplied by 100,000, the normalized MAUDE reporting rates per 100,000 units sold results, as shown in Table Three:
Table Three: Calculated MAUDE Reporting Rates per 105 unit sales
VCF
Calculated MAUDE reporting rates for
Deaths Caval
Total AEs Fractures perforation Movement Emboliz'ns Ernboliz'n
In reviewing these reporting rates, we see that the largest reporting for adverse events overall is-for-the-Bird4-Nest-filter-at 3-72-reports-/-1-asalesTfollowed-by-the-Reco-ve filter with 215 reports / 105 sales. Death is reported at the highest rate for the Recovery filter at 36 reports 1105 sales, followed by Optease at 24 reports / 105 sales. Fractures and caval perforation are reported at the highest rate for the Bird's Nest Filter at 77 and 124 reports / 105 sales respectively. The highest rate of filter movement reports is seen with the Recovery filter at 82 reports / 105 sales, followed by the Vena Tech VCF at 52 reports / 105 sales. Filter embolization, in which the VCF moves to a new anatomic region, often in the heart or pulmonary artery, is reported at the highest rate by Vena Tech at 50 reports / 105 sales, followed by Recovery at 46 reports / 105 sales. Finally, reports of filter embolization associated with death were reported at the highest rate for the Recovery filter at 26 reports / 105 sales.
It may be inferred from this dataset that different VCFs are reported to have different patterns of events, and also that the Recovery filter has relatively high reporting rates of total death, filter movement filter embolization and filter embolization death reporting. For further depiction of other VCF extremes, see Tables Eleven and Twelve below.
Each of these reporting rates can be used to calculate relative risks of individual VCFs and aggregated categories of VCFs compared with the Recovery device. The following tables display this calculation, including comparisons of Recovery to each individual competitor VCF, to all other VCFs, to all other VCFs indicated for permanent placement, and to all other VCFs indicated for retrievable placement.
It is important to- remember that these rates are reporting rates, and not in any way true incidence rates or even accurate predictors of incidence rates. The associated statistical calculations_a_re technically accurate but cannot c_ozreettlie_undeilying_po_or_dataaalidity or necessarily imply clinical significance.
Page 7 of 21
LMD1 BPVE- 01-01 01 9794
Vena Cava Filters — Final Report Privileged and confidential Attorney work product
TrapEASE 155,493 19 12 2.9 0.025 12 7.0 >...4 w r_. g
Tulip 35,788 4 11 3.2 0.099 0.9 11_0
I r_ Totals
OptF_ASE 8,500 2 24 1.5 0.868 0.3 7.3
Non Recovery 494,116 41 a 4.3 0.000 is 9.6
Permanent 449,828 36 a 4.6 0.000 2.0 104
Retrievable 44288 6 14 2.6 0129 0.9 7.9
This table shows that Recovery is 4.3 times more like to have a MAUDE report associated with patient death than all other VCFs combined, 4.6 times more likely than for permanent VCFs and 2.6 times more likely than retrievable VCFs. Neither the overall comparison of Recovery to other retrievable VCFs nor Tulip or Optease individually was significant However, the overall trend is that Recovery had a higher rate of reporting associated with patient death than any other VCF individually or as aggregated.
Page 8 of 21
LMD1 BPVE-01-01019795
Vena Cava Filters - Final Report Privileged and confidential Attorney work product
2.3 Reports of Adverse Events
Table Five: Reports of Adverse Events
December 15th, 2004 Pursuant to contract
Filter Sales
Total
reports
AE reports
105psearies RecRovery v a ipu e 91..57 Lower .Upper 1 957c
Recovery 19,537 42 215 ritivi atia FR:1g ore ^ Zi c g t a,
This table shows that Recovery has a rate of adverse event reporting that is almost twice as high as other VCFs combined, and 1.6 times as high as other retrievable VCFs. These overall-comparisons-are-statistically-significant-as-is-the-eamparison with-the-Tulip-VCP, but not Optease.
Page 9 of 21
BPVE-01-01019796 LMD1
Vena Cava Filters — Final Report Privileged and confidential Attorney work product
0 Tulip 35,788 0 0 co 0.004 co co 15 OptEASE 8,500 1 12 2.6 0.609 0.3 21.7
I To
tals I
Non Recovery 494,116 27 5 5.6 0.000 2.3 13.6
Permanent 449,828 26 6 5.3 0.000 2_2 12.9
__Retrievahl- . • — ta,. cm _D I C 113 0
This table shows that Recovery has a rate of reporting of filter fracture that is 5.6 times higher than all other VCFs, and 13.6 times as high as other retrievable VCFs. Only the d's-Nest-Filter-had-an-equivalent-reporting-rate --- -0:47NS).
0° 04. k -7: -
'4k iiokcoo
C). DS = 0 ovoyit(
=ßC1 iw,(3.00
D,
kk - 3 I OD, mo
Page 10 of 21
LMD1 BPVE-01-01019797 •
Vena Cava Filters — Final Report Privileged, and confidential Attorney work product
December 15th, 2004 Pursuant to contract
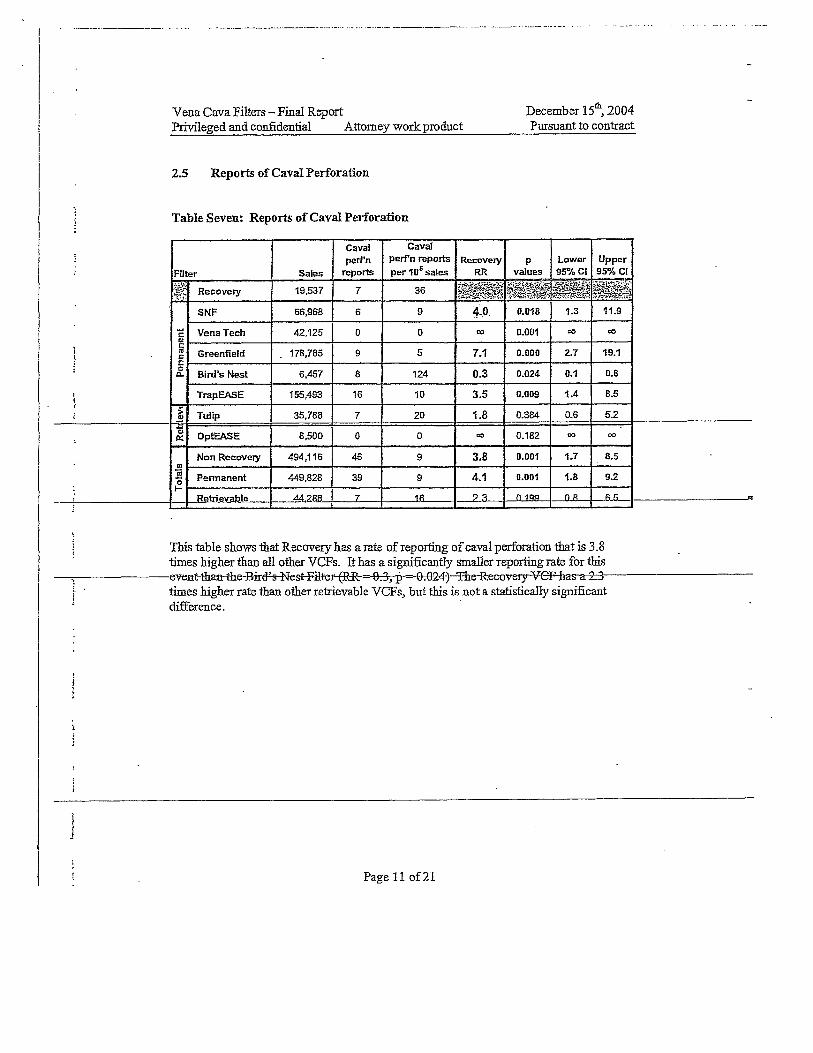
2.5 Reports of Caval Perforation
Table Seven: Reports of Caval Perforation
Filter Sales
Caval perf'n
reports
Caval perrn reports per lOs sales
Recovery RR
p values
Lower 95% Cl
Upper 95% Cl
Recovery 19537 7 36 :ZY-,2•.=W ..-::-..go.is.'16
'4'..Till'Z'Ogi ja*Ciíz4,- .741 V".1^;.--
c g h CD
13-
SWF 66,968 6 9 4.0 0.018 1.3 11.9
Vena Tech 42,125 0 0 e0 0.001 co co
Greenfield . 178,785 9 5 7.1 0.000 2.7 19.1
Bird's Nest 6,457 8 124 0.3 0.024 0.1 0.8
TrapEASE 155,493 16 10 3.5 0.009 1.4 8.5
o --c Tulip 35,788 7 20 1.8 0.384 0.6 5.2 ta` it OptEASE 8,500 0 0 co 0.182 co co -
tt,
-1 1—
Non Recovery 494,116 46 9 3.8 0.001 1.7 8.5
Permanent 449,828 39 9 4.1 0.001 1.8 9.2
BAlliexable 44 288 7 16 7 "4 Û1P _0 R 65_
This table shows that Recovery has a rate of reporting of caval perforation that is 3.8 times higher than all other VCFs. It has a significantly smaller reporting rate for this event than-the Birds-Nest-Filterila------0=3fli-----07024)—The Recovery-VC , as a 2.3 times higher rate than other retrievable VCFs, but this is not a statistically significant difference.
Page 11 of21
LMD1 BPVE-01-01019798
Vena Cava Filters - Final Report Privileged and confidential Attorney work product
2.6 Reports of Filter Movement
Table Eight: Reports of Filter Movement
December 15th, 2004 Pursuant to contract
Filter Sales
Filter mov't
reports
Filter Inov't reports per 105 sales
Recovery RR
p value
Lower 95% Cl
Upper 95% Cl
.,.-„ Recovery 19,537 16 ,a;,! 82
; P
erm
anen
t SNF 66,968 2 3 27.4 0.000 6.3 119.3
Vane Tech 42,125 22 52 1.6 0228 0.8 3.0
Greenfield 178,785 39 22 3.8 0.000 2.1 6.7
Bird's Nest 6,457 2 31 2.6 0282 0.6 11.5
TrapEASE 155,493 19 12 6.7 0.000 3.4 13.0 s' 0
33 Tulip 35,788 13 36 2.3 0.041 1.1 4.7
I m cc OptEASE 8,500 1 12 7.0 0.054 0.9 52.5
0 T i - o
Non Recovery 494,116 98 20 4.1 0.000 2.4 7.0
Permanent 449,828 84 19 4.4 0.000 2.6 7.5
r- I Retrievable 44,288 14 32 2.6 0.012 1.3 5.3
This tables shows that Recovery had a 4 times higher reporting rate for filter movement compared with all other VCFs, as well as a 2.6 times higher rate when compared to other retriev_ableXCFR
Page 12 of 21
LMD1 BPVE-01-01019799
Vena Cava Filters —Final Report Privileged and confidential Attorney work product
TrapEASE 155,493 12 8 6.0 0.000 2.5 14.2 `5. 0 ,..r.- Tulip 35,788 a 22 2.1 0.205 0.8 5.3 Ii re OptEASE 8,500 0 0 co 0.106 co co
0 -a -5 f•-•
Non Recovery 494,116 73 15 3.1 0.002 1.6 6.2
Permanent 949,828 65 14 3.2 0.002 1.6 6.4
Retrievable 44288 8 18 2 6 0.083 1.0 6.6
This tables shows that Recovery had a 3 times higher reporting rate for filter embolization compared with all other VCFs, as well as a 2.6 times higher rate when -orapared-to-other-retievable-V-CFs-although-the-latter-differeace-was-not-quit significant statistically.
Page 13 of 21
1
LMD1 BPVE-01 -01019800
7.•
;
Vena Cava Filters — Final Report Privileged and confidential Attorney work product
Tulip 35,788 2 6 4.6 0.109 0.9 23.6 a) re OptEASE 8,500 0 0 00 0.323 .0 00
Tota
ls Non Recovery 494,116 11 2 11.5 +Loop 4.0 33.1
Permanent 449,828 9 2 12.8 0.000 4.3 38.2
_Retrinzable 44,2:3 2 5 57
-.3 This tables shows that Recovery had an 11.5 times higher reporting rate for filter embolization deaths compared with all other VCFs. This ratio was 5.7 for other
Vena Cava Filters — Final Report December 15th, 2004 Privileged and confidential Attorney work product Pursuant to contract
2.9 Assessment of Other VCFs
It is important to note that the preceding analyses "single out" the Recovery VCF; that was the nature of the assignment. However, it is instructive to look at other VCFs and adverse event report types, such as caval thrombosis or filter embolization, and note that the same sort of disproportionate reporting rates exist for other widely used VCFs.
Table Eleven: Caval thrombosis and the TrapEase VCF
In evaluating the TrapEase VCF, we see a 32 fold increased risk of caval thrombosis reports composed to all other VCFs, 106 times higher for other permanent VCFs and almost 8 times higher than the retrievable VCFs.
Page 15 of 21
LIAD1 BPVE-01-01019802
Vena Cava Filters - Final Report December 15th, 2004
Privileged and confidential Attorney work product Pursuant to contract
Table Twelve: Filter embolization and the VenaTech VCF
Non Vena Tech 471,528 61 13 3.9 I 0.000 2.3 6.3 o (IS ... o i--
Other Permanent 407,703 44 11 4.6 0.000 2.7 7.8
Retrievable 63,825 17 27 1.9 0.074 1.0 3.5
In evaluation the VenaTech VCF for filter embolization reports, we find 3.9 times the 0/
reporting rate for venal ech when compared to all other VUFs, 4.6 times the reporting rate for other permanent VCFs, and 1.9 times the reporting rate (marginal significance) compared with retrievable VCFs.
These two examples show the hazard in focusing on one type of VCF in such analyses, by demonstrating higher reporting rates for a variety of other widely used V GI, s.
Page 16 of 21
LMD1 BPVE-01-01019803
Vena Cava Filters —Final Report December 15th, 2004 Privileged and. confidential Attorney work product Pursuant to contract
2.11 Smnmary regarding MAUDE report analysis:
• In this dataset, Recovery demonstrates a consistent, statistically significant and potentially clinically important higher rate of reporting of adverse events in many analyzed categories.
• Given the pattern of the eported events, the higher rate of death reports seems related to filter movement and filter emboli7ation associated with death.
• These conclusions must be substantially tempered in light of the poor quality and validity of the data available, and the fact that it analyzes reporting behavior as much as it does adverse events.
• Other successful VCFs are also found to have significantly higher reporting rates than other VCFs for serious complications such as caval thrombosis (TrapEase) and filter embolization (VenaTech), as well as higher proportional reporting rates for death (OptEase) and filter movement and erabolization (Vena Tech).
o VCF benefits have not been considered, given the absence of any quantitative information, but must be considered in the evaluation of device performance even if not quantifiable.
* The observed differential reporting rates are large enough and consistent enough to constitute a signal for farther evaluation, preferably of all devices in this class.
Vena Cava Filters —Final Report December 1521, 2004 Privileged, and confidential Attorney work product Pursuant to contract
3.0 Analysis of Bench Testing for Migration Resistance
3.1 Overview
Bard Peripheral Vascular personnel devised and implemented a testing device for assessing VCF migration resistance in the lab. This consisted of a closed loop circulation of 37°C saline solution through a silastic tube with variable diameters between 15 and 32mm, lined with sausage casing to simulate the endothelium_ A test VCF was deployed in the silastic tube between two pressure transducers, and artificial emboli were then introduced serially until the VCF moved a specified amount. The test output was the pressure gradient at which the test article moved.
3.2 Test data
This test was used. to compare many of the commercially available VCFs, and the following mean gradients were observed for the diameters the author felt to be relevant for this failure mode. In the following results table, each of four test diameters is reported, with the mean pressure gradrein= 5 mm diameter, etc.)
Table Fourteen: Mean Migration Resistance Test Data, in Rank Order
BPV testing results MAUDE data esistanceimm -Hg
# per 105 sales MR25 MR28 MR30 MR32 I Mean 74 51 40 35' 50 82 87 43 56 36 55 36
This demonstrates several initial facts: • Migration resistance declines as the test fixture increases in diameter (bottom row
averages, left to right) cl! Mean migration resistance performance is substantially different between VCFs
(column entitled Mean) • The Tulip testing may have an anomaly with the MR28 testing fixture, as it is the
only filter to have a dramatic deviation from declines in performance with each increase in diameter.
Page 19 of 21
LMD1 BPVE-01-01019805
u, 80 a) to c )̀ 70 c)
(15 60
50
40
30
20
10
0 Filte
r mo v
emen
t re
Gree nf
OpteaseTra Pe .. . . 0 •
SW-
Vena Cava Filters – Final Report December 156, 2004 Privileged and confidential Attorney work product Pursuant to contract
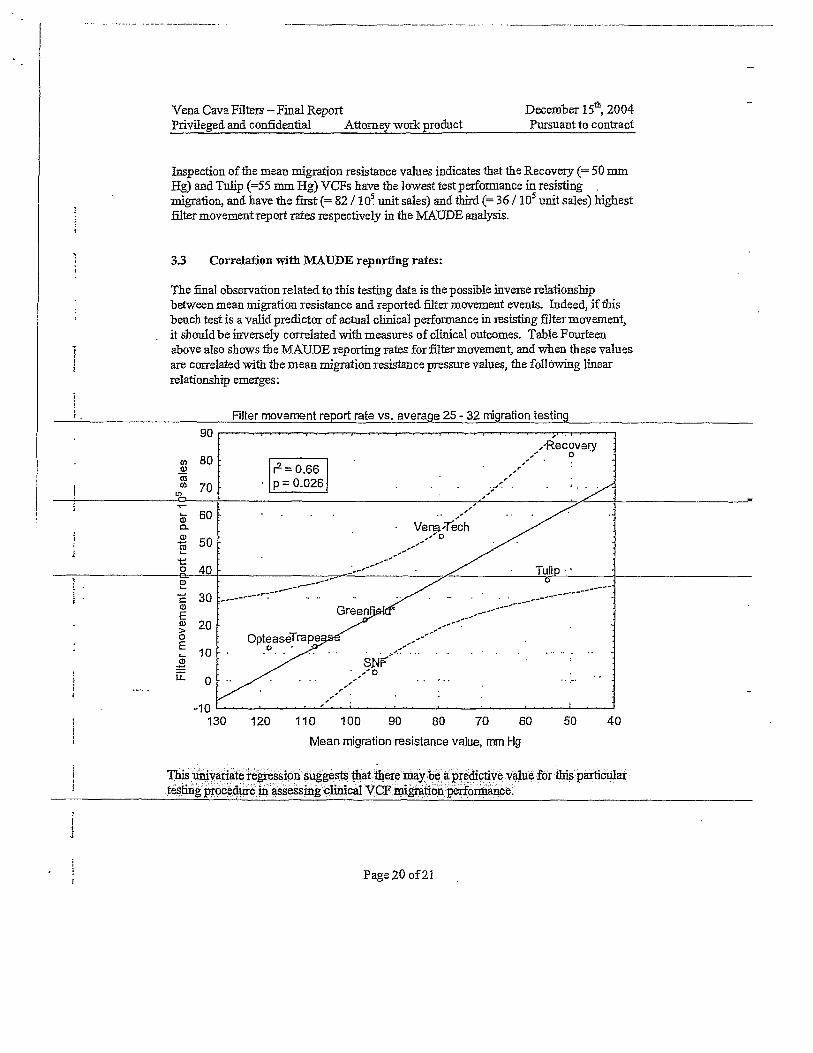
Inspection of the mean migration resistance values indicates that the Recovery (=50 tom Hg) and Tulip (=55 mm Hg) VCFs have the lowest test performance in resisting migration, and have the first (= 82/ 105. unit sales) and third (= 36 / 105 unit sales) highest filter movement report rates respectively in the MAUDE analysis.
3.3 Correlation with MAUDE reporting rates:
The final observation related to this testing data is the possible inverse relationship between mean migration resistance and reported. filter movement events. Indeed, if this bench test is a valid predictor of actual clinical performance in resisting filter movement, it should be inversely correlated with measures of clinical outcomes. Table Fourteen above also shows the MAUDE reporting rates for filter movement, and when these values are correlated with the mean migration resistance pressure values, the following linear relationship emerges:
Filter movement report rate vs. average 25- 32 migration testing 90
rRecov
r2 = 0.66 p = 0.026
Vena-T'e'ch o
Tulip •
------------
-10 130 120 110 100 90 80 70 60 50 40
Mean migration resistance value, mm Hg
This univariate regression suggests that there may be a predictive value for this pcuticular testing procedure in assessing clinical WI' migration performance.
Page 20 of21
LMD1 BPVE-01-01019806
Vena Cava Filters —Final Report December 15th, 2004 Privileged and confidential Attorney work product Pursuant to contract
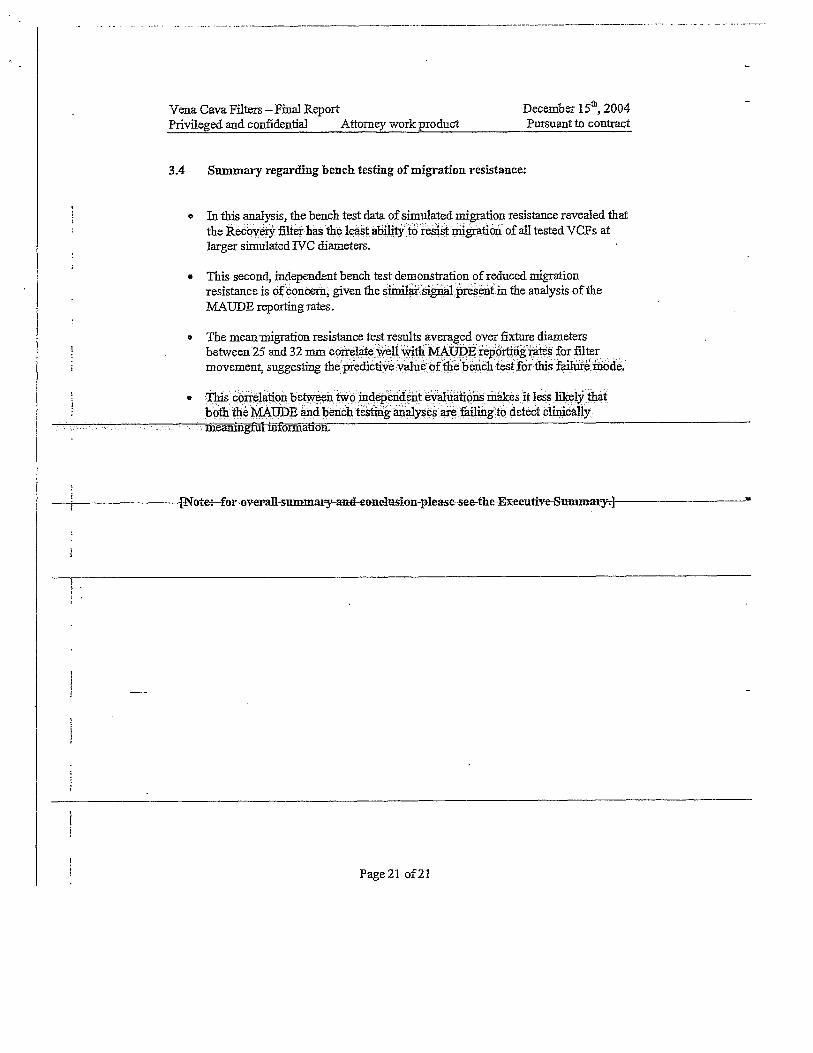
3.4 Summary regarding bench testing of migration resistance:
o In this analysis, the bench test data of simulated migration resistance revealed that the Recovery filter has the least ability to resist migration of all tested VCFs at larger simulated WC diameters.
• This second, independent bench test demonstration of reduced migration resistance is of concern, given the similar signal present in the analysis of the MAUDE reporting rates.
• The mean-migration resistance test results averaged over fixture diameters between 25 and 32 mm correlate well with MAUDE reporting rates for filter movement, suggesting the predictive value of the bench test for this failure mode.
• This correlation between two independent evaluations makes it less likely that both the MAUDE and bench testing analyses are failing to detect clinically. meaningli on.
Vena Cava Filters — Final Report December 15th, 2004 Privileged and confidential Attorney work product
Pursuant to contract
2.10 Proportional Reporting Rates
FDA pharmacovigilance procedures include a "numerator" only comparison method, which does not factor in exposure to a medical product, but only assesses the proportion that a certain category of report comprises out of all reports for that product. This proportional reporting rate (PRR) is then used as a signal generator when screening reports. For this analysis, a form of PRR appears in the following table:
Table Thirteen: Proportional Reporting Rates
VCF
Proportional reporting rates for:
Deaths Cava!
Fractures perforation Movement Emboliens Embolien
deaths
Recovery 17% '14% 17% 38% • . 21% 12%.
SNF 0% 5% 14% 5% 2% 0%
Vena Tech 7% 2% 0% 54% 51% 5%
Greenfield —5%--- —3%---- /1%----459/ —122/ 07
Bird's Nest 4% 21% 33% 8% 4% 0%
TrapEASE 14% 7% 12% 14% 9% 4%
Tulip 8% 0% 14% 27% 16% 4%
OptEASE 20% 10% 0% 10% 0% 0%
All others 7% 5% 8% 18% 13% 2%
Permanent 7% 5% 8% 17% 13% 2%
Retrievable 10% 2% 12% 24%* 14% 3%
Here we see a variety of V CEs that have the highest proportional reporting rates for the event types of interest, with Optease having a 20% rate for deaths, Birds' Nest a 21% rate for fractures and a 33% rate for caval perforation, VenaTech having a 54% rate for filter movement and a 51% rate for filter embolization, and Recovery having a 12% rate for filter embolization death. Only in this last event category of filter embolization deaths is Recovery the most extreme in this analysis, again indicating the variability in VCF performance in such reporting rate assessments.