Final Report for the Indiana University Office of Sustainability Financing Renewable Energy Internship Spring 2014 Christopher Round Table of Contents Executive Summary Introduction The Regulatory and Incentive Ecosystem For Solar Energy Finance Study Relevant Case Studies Potential Projects and Financial Structures Conclusions
Transcript
Final Report for the Indiana University Office of Sustainability
Financing Renewable Energy Internship Spring 2014
Christopher Round
Table of Contents Executive Summary
Introduction The Regulatory and Incentive Ecosystem For Solar Energy
Finance Study Relevant Case Studies
Potential Projects and Financial Structures Conclusions
Executive Summary Background: This report examines the preliminary feasibility of financing the development of a large-scale solar photovoltaic project for the IU Bloomington Campus. A solar power analysis was previously considered utilizing building-integrated solar photovoltaic collectors as part of the Integrated Energy Master Plan. (8760 Engineering, 2012) This report builds upon the goal outlined in the Integrated Energy Master Plan of moving toward a carbon-neutral campus. (8760 Engineering, 2012) It was estimated that approximately 493,000 square feet of roof space was available for solar collectors, potentially providing up to 10,000,000 kWh of electricity per year. The payback at the time on such a project was determined to exceed forty years without the consideration of incentives and the regulatory ecosystem. (8760 Engineering, 2012) Regulatory Ecosystem: Indiana is a regulated state. Duke Energy provides energy for the Bloomington area. Duke energy at this time provides a utility rebate plan for geothermal heat pumps for non-residential renewable energy sources. (North Carolina Solar Center, 2012) Duke Energy is developing a solar energy incentive plan that will not be announced until later in the spring. (Chapman, 2013). The state of Indiana has three sets of incentives that may be relevant to the project. There is a net metering program in place for investor-owned utilities with a system capacity limit of 1 megawatt. (Hunter, 2013) The aggregate capacity limit is 1% of utility’s most recent peak summer load. (Hunter, 2013) Net excess generation is credited to the customer’s bill at the retail rate and is carried over indefinitely. (Hunter, 2013) Solar wind, hydropower, and geothermal systems and their affiliated equipment are exempt from property taxes. (Hunter, 2013) There is a grant available providing between 25,000 to 125,000 dollars for community conservation projects and can be applied to solar energy installation. (Hunter, 2013) The city of Bloomington itself offers fee waivers for energy projects. (City of Bloomington) The federal government provides incentives in the form of corporate depreciation, tax credits, grants, and loan programs. (North Carolina Solar Center) Proposed routes to financing: Solar prices have dropped dramatically in the last few years. This combined with government incentives, and the correct financial structure could enable IU to build a large-scale project for the Bloomington campus. There are three routes to financing: direct buy, philanthropy, and 3rd party financing. In a direct buy program, Indiana University would directly buy the solar panel installation. A philanthropic strategy could harness IU’s substantial alumni base to partially or fully fund a solar structure. A third party program would enable IU to take advantage of government incentives for solar projects. A vendor has suggested that such a project using this method could be feasible for Indiana University, with a payback period of less than ten years. With the costs of photovoltaics having fallen dramatically and when government incentives are taken into consideration, this likely a legitimate estimation. Even using the same assumptions utilized by the Integrated Energy Master Plan, a project using government incentives would likely have a payback period of 13 years or less. As these systems are warrantied for 25 years, this would mean 12 plus years of savings for IU.
Introduction
The university currently spends approximately $18,677,297 per year on electricity, which produces the largest share (62.2%) of its carbon emissions. (8760 Engineering, 2012) Best case scenarios computed under the Integrated Energy Master Plan computed a 40-year payback for solar without government incentives or any form of financing structure. The financing renewable energy internship was started to find a path for Indiana University to build a large-scale renewable energy project. After the “Integrated Energy Master Plan” (IEMP) suggested that a direct buy program for solar energy would be far too expensive, it became necessary to explore the incentives available to the university. The estimate in the IEMP was a 40 year payback period. As part of the research into incentives, the solar company Telamon was contacted. Telamon came to the university on February 28th and April 22nd to present their ideas on how the university could build a large scale array. Thus this report has the objective of assessing the claims of both the IEMP and Telamon. A solar structure becomes financially feasible when the cost of solar energy over time is less than what can be purchased from the utility. Costs are based on what type of installation, the distance between the installation and the interconnection, as well as the operation, maintenance, and insurance of the structure itself. The energy bated by the solar array is what produces the cost savings, which is determined by: consumption ($kWh), demand ($kW), solar production, demand shedding, energy inflation, and any Solar Renewable Energy Credits received and sold from the project. This all works under the assumption the solar energy purchased remains at a fixed price, and thus immune to the ups and downs of the energy market and inflation. An example of such a change in price occurred in Indiana recently. The Indiana Court of Appeals just ruled unanimously to allow Duke Energy to raise electricity rates to pay for its 3.5 billion dollar Edwardsport coal-gasification power plant. The Indiana Utility Regulatory commission had capped construction costs that Duke could pass onto its customers at 2.6 billion dollars.(Wilson, 2014) This increases the cost of electricity for Indiana University. According to physical plant, electricity has been going up at an average rate of 7.5% for the last three years.There are three common structures for solar installations. Ground mounts are usually the cheapest option with the easiest maintenance and are highly visible. Roof mounts have difficult maintenance and are not as visible, and canopy mounts are the most expensive option but have easy maintenance and are highly visible. Telamon estimated that the average cost per watt for each of the three most common structures are: 2.00, 2.50, and 3.00 dollars per watt.
Telamons Claims
Telamon estimated the potential revenue from the structure (revenue defined as savings on energy, see the graph below). Telamon estimated that the total current electric charges for the university came out to $1,210,081.93. This was computed using an estimated consumption cost of $0.039 per kilowatt hour and a demand cost of $22.38 per kilowatt hour. Revenue was calculated assuming that the university would utilize solar renewable energy certificates (known as SRECs). A simple payback period was estimated for each major type of installation at 5.4 years, 10.9 years, and 17.6 years for a ground, roof, and canopy structure respectively. A general anylsis with an estimated internal rate of return of 30% predicted a simple payback (without the use of any advanced financial structures) of 8.1 years.
Checking the Validity Telamon and IEMP Claims
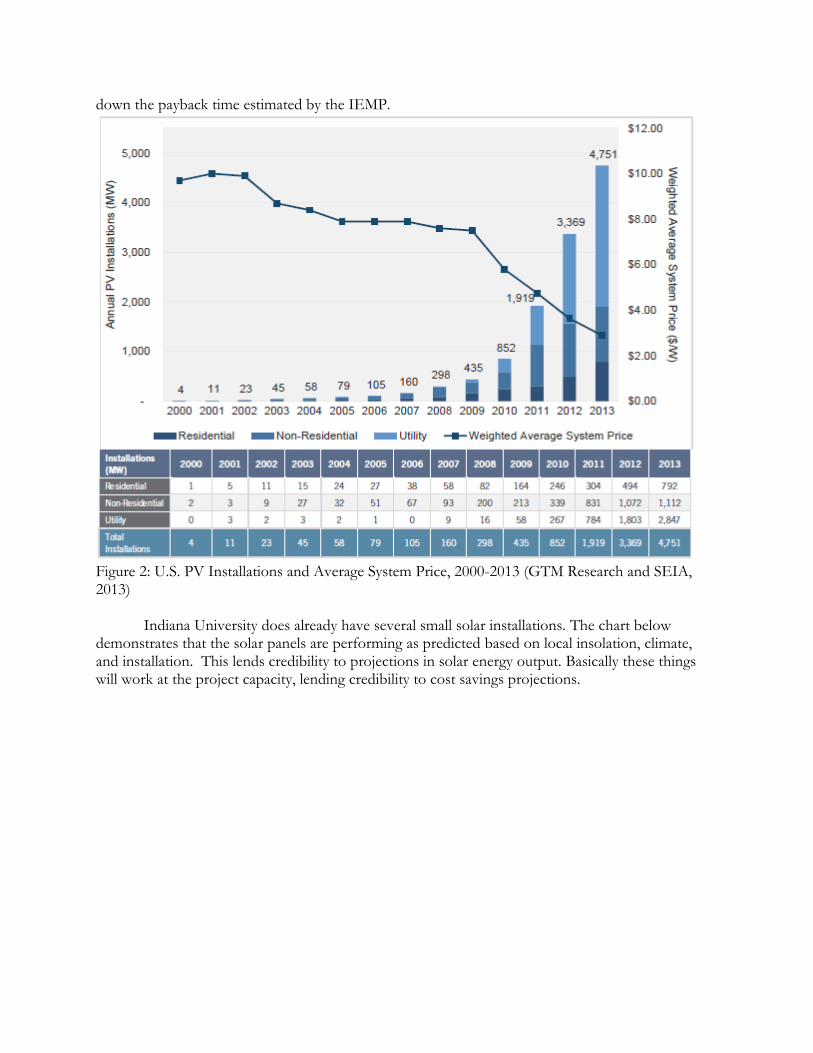
Solar panels have seen a dramatic drop in price since the production of the IEMP. Weighted average PV system prices fell 15% in 2013, reaching a new low of 2.59/W in the fourth quarter. Between 2011 and 2013 prices fell by almost half. (GTM Research and SEIA, 2013). This dramatically cuts
down the payback time estimated by the IEMP.
Figure 2: U.S. PV Installations and Average System Price, 2000-2013 (GTM Research and SEIA, 2013)
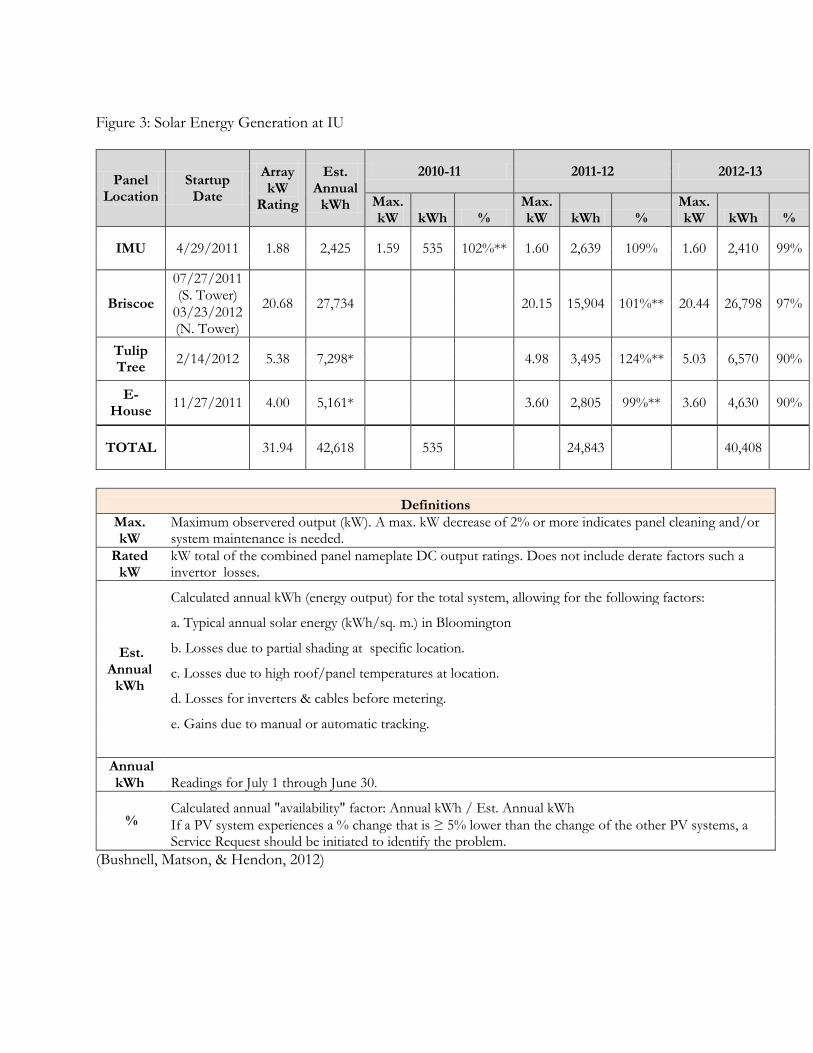
Indiana University does already have several small solar installations. The chart below
demonstrates that the solar panels are performing as predicted based on local insolation, climate, and installation. This lends credibility to projections in solar energy output. Basically these things will work at the project capacity, lending credibility to cost savings projections.
If a PV system experiences a % change that is ≥ 5% lower than the change of the other PV systems, a Service Request should be initiated to identify the problem.
(Bushnell, Matson, & Hendon, 2012)
Regulatory Ecosystem State and Local Regulatory Ecosystem
Indiana has a regulated energy market. Duke energy is the primary energy utility for Bloomington and in turn IU. It is important to note that a major aspect of the incentive playing field is expected to change. Duke Energy in a recent settlement with the Sierra Club agreed to either implementing a 30-megawatt feed-in tariff or construct/contract for 15 megawatts of wind and solar generation. (Protogere, 2013) Their choice is expected to be delivered in later this year. Duke energy is currently one of the largest utility providers in the country. Duke currently offers a rebate for geothermal projects. (North Carolina Solar Center, 2012) Indiana state law restricts planning and zoning authorities from prohibiting or unreasonably restricting the use of solar energy. Indiana’s solar easement does not create an automatic right to sunlight, but they do allow parties to enter into solar easement contracts. (North Carolina Solar Center, 2012) The State of Indiana offers a net metering program. The net metering program is available to investor-owned utilities with a limit of 1 megawatt in size unless all power is used on site. If a potential IU project used all power on site, this limit would not apply. The aggregate capacity limit is 1% of the utility’s most recent peak summer load. The net excess generation is credited to the customer’s bill at the retail rate and is carried over indefinitely. (Hunter, 2013) Net metering is offered to nonprofits, government, and schools, meaning that IU is likely to qualify for a net metering agreement. (North Carolina Solar Center, 2013) The city of Bloomington offers fee waivers for different building projects as long as they meet the requirements laid by their sustainable development initiatives. (City of Bloomington)
Federal Regulatory Ecosystem
The federal government offers a variety of incentives for renewable energy technology. A corporate tax credit of up to 30% for solar, fuel cells, small wind and PTC-eligible technologies is available. (North Carolina Solar Center) While a 10% tax credit for geothermal, micro turbines, and CHP is also made available under the same program. The tax credit for solar and small wind turbines has no maximum credit. It should be noted that after December 31st, 2016 this credit is expected to decrease to 10%. (North Carolina Solar Center) The federal Modified Accelerated Cost-Recovery System (MACRS) allows businesses to recover investments through depreciation deductions. The accelerated depreciation is on a five-year schedule. There is a 50% bonus first year depreciation but that expired on the 31st of December 2013 and it is unknown if it will be extended. (North Carolina Solar Center, 2013)
Finance Study Utilizing the AASHE Campus Solar Photovoltaic Installations Database, a survey was performed looking at how solar photovoltaic structures were financed. The survey focused on projects larger than 1 megawatt. There are 53 such structures on 42 campuses in the database. Of the 53 projects: 31 utilized a solar power purchase agreement or a lease versus 3 that were owned outright by their respective institutions. The rest either did not report, or had other financing structures. In the vast majority of cases, third parties were involved in the development and funding of solar structures. Occasionally funds for construction were provided by the 2009 federal stimulus. Rarely were large structure directly bought.
Rutgers
Source: Rutgers today
While the Rutgers project is located in New Jersey, and thus subject to a different set of incentives and regulations, it utilized a potentially interesting project for IU. They built an 8.01 MW solar canopy array over 32 acres of parking lots on its Livingston campus. The array provides approximately 50% of the power for the Livingston campus. (AASHE, 2013) The array was built on a canopy system, which allowed Rutgers to keep valuable parking space. The canopies used Yingli photovoltaic systems. (AASHE, 2013) The canopies provide winter shelter and summer shade to keep for cars and parking patrons. The project was started in September 2011 and completed in January 2013. It was financed through a 3rd party lease with the leaser taking advantage of the 30% tax grant and 5 year accelerated depreciation, while the university owns the power and the SRECS. (AASHE, 2013) The SRECs are valued at $180 a credit, with a 15-year lease. (Kornitas, 2013)
IUPUI
Source: IUPUI
The IUPUI project was funded by a qualified energy savings project. The installation of the solar panels was part of a larger energy savings project. The project cost $245,000 and will generate 43 kilowatts of electricity a day from 164 panels. The solar photovoltaic project has an estimated payback around 18 years. The project will utilize a feed-in tariff at $0.245 per kilowatt hour. Some of the funding for the project came from Indianapolis Power and Light. (Kamman, 2013)
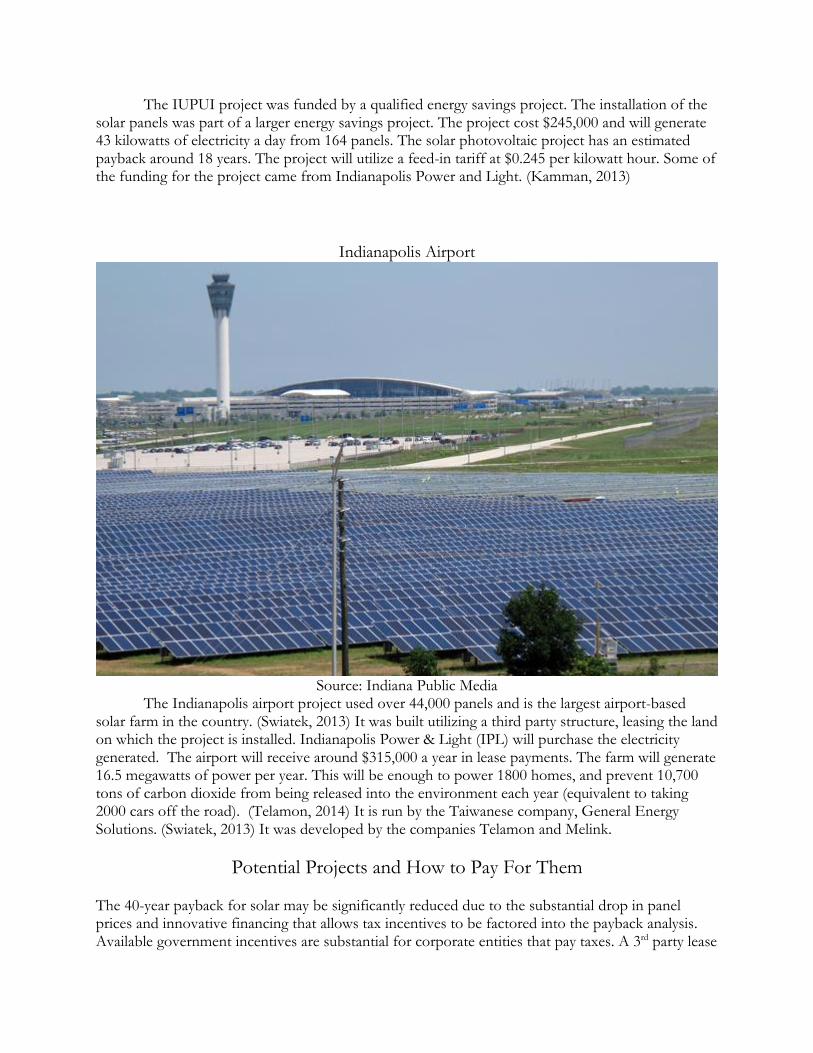
Indianapolis Airport
Source: Indiana Public Media
The Indianapolis airport project used over 44,000 panels and is the largest airport-based solar farm in the country. (Swiatek, 2013) It was built utilizing a third party structure, leasing the land on which the project is installed. Indianapolis Power & Light (IPL) will purchase the electricity generated. The airport will receive around $315,000 a year in lease payments. The farm will generate 16.5 megawatts of power per year. This will be enough to power 1800 homes, and prevent 10,700 tons of carbon dioxide from being released into the environment each year (equivalent to taking 2000 cars off the road). (Telamon, 2014) It is run by the Taiwanese company, General Energy Solutions. (Swiatek, 2013) It was developed by the companies Telamon and Melink.
Potential Projects and How to Pay For Them The 40-year payback for solar may be significantly reduced due to the substantial drop in panel prices and innovative financing that allows tax incentives to be factored into the payback analysis. Available government incentives are substantial for corporate entities that pay taxes. A 3rd party lease
agreement utilizing the 30% tax credit with a depreciation plan is an option. After this point, a buyback program may be in the best interest of the university. A direct buy program through a revolving loan fund or alumni donation solicitation is an option as well. The panels are warrantied for approximately for 25 years, so a payback period of less than 25 years is crucial for solar to be even on the table. An additional options exists in light of the recent court case between Duke Energy and the Sierra club over the Edwardsport plant. Duke energy is required by the court to either build 15 megawatts of solar or wind infrastructure, or purchase 30 megawatts of solar power. The university could seek to negotiate with Duke over getting involved with either of these programs.
Direct Buy program A direct buy program would entail that the university directly purchases the panels and does not utilize a third party. This would preclude IU from taking advantage of the solar incentives, including a thirty percent tax credit.
Green Revolving Loan Fund
Revolving loan funds have become an increasingly common solution for higher educational institutions to meet sustainability goals. One such example is the Harvard Green load fund.
The Harvard green loan fund is a 12 million dollar fund that has supported nearly 200 projects that have yielded 4 million in energy savings annually. Harvard has used this financial mechanism to fund renewable energy, metering, and cogeneration projects. Massachusetts previously ran a program to aid communities in establishing their own
revolving loan funds. The state of Georgia has a green revolving loan fund that provides low-interest loans to businesses to be used for energy improvements. These include solar
water heaters. According to the Association for the Advancement of Sustainability in Higher Education (AASHE) there are 84 revolving loan funds active in higher education. At this
time they contain over 118 million dollars. (AASHE, 2014) Green revolving loan funds work by lending money to finance sustainability projects, and are paid back within an allotted time
period. A green revolving loan fund could be used not just to aid in the development of a large-scale solar project, but other sustainability projects on campus. They provide an opportunity for sustainability minded alumni to make donations for green projects.
Considering the sizable number of SPEA alumni and other potentially environmentally conscious alumni of IU, this might be welcome.
Alumni solicitation
The solicitation of alumni donations to build a solar structure may be a legitimate strategy. In the event a parking structure is considered, this could be especially attractive to alumni as their names could be readily recognized and there may be attractive tax advantages. Though it should be noted this has not been tested with IU Alumni. A parking structure contains other advantages (security cameras for the parking lot, outlets for tailgates, etc) that make it worthy of consideration. Alumni donations can play a role regardless of whether or not a direct buy program is implemented, as it could help to increase the available capital going
into a third party program. Telamon suggested the possibility of financial structure on the leased land that would allow alumni to take advantage of tax incentives. This all remains speculation however.
Conclusion
If we take the original proposed 40 year payback period and take into consideration a roughly 50% drop in price for solar photovoltaics (from 4.25 a watt to just above 2 dollars), and the 30% federal tax credit you get a payback period of around 13 years. This is without considering the impacts of SRECs. These structures are usually warrantied for 25 years, so you can expect at least 12 years of payback. Telamon utilizing additional incentives and through thorough cost savings calcuations estimated an even earlier payback time. When this is taken into consideration a large scale solar structure (especially through third party financing, alumni philanthropy, or a combination of the two) is feasible for the university. The structure would provide power at a fixed cost that would be immune to inflation and the ups and downs of the energy market. This would save money in the long term and introduce increased stability to the energy budget of the university. A large scale structure could aid in recruiting efforts for students and faculty. This is pertinent as IU has been recognized for having some of the environmental and scientific programs in the country. These programs attract both top students and top faculty. This use for the solar structure is currently being proposed by Purdue for their airport. The solar structure could also provide research opportunities for faculty and students. It is my recommendation that university seriously consider the development of a large-scale solar project.
Bibliography 8760 Engineering. (2012). Integrated Energy Master Plan for Indiana University Bloomington. Bloomington: Indiana University. AASHE. (2013, May 17). Rutgers Solar Canopy Array. Retrieved December 27, 2013, from The Association for the Advancement of Sustainability in Higher Education: http://www.aashe.org/resources/case-studies/rutgers-solar-canopy-array Brown, B. (2013, December). Personal Correspondence. (C. Round, Interviewer) Bushnell, A., Matson, C., & Hendon, N. (2012). IUB Solar Photovoltaic Annual report Chapman, J. (2013, November). Personal Correspondence. (C. Round, Interviewer) City of Bloomington. (n.d.). Sustainable Development Incentives. Retrieved December 27, 2013, from City of Bloomington: http://bloomington.in.gov/documents/viewDocument.php?document_id=2194 GTM Research and SEIA. (2013). U.S. Solar Market Insight Hunter, L. (2013). Renewable Energy in the 50 States: Midwestern Region. American Council on Renewable Energy. Kamman, J. P. (2013, October 31). Personal Correspondence (email). (C. Round, Interviewer) Kornitas, M. (2013, October 30). Personal Correspondence (Email). (C. Round, Interviewer) North Carolina Solar Center. (2012, November 15). Duke Energy - Commercial and Industrial Energy Efficiency Rebate Program . Retrieved December 27, 2013, from Database of Solar Incentives for Renewables & Efficiency: http://www.dsireusa.org/incentives/incentive.cfm?Incentive_Code=IN15F&re=0&ee=0 North Carolina Solar Center. (2013, January 3). Federal Business Energy Investment Tax Credit (ITC). Retrieved December 28, 2013, from Database of State Incentives for Renewables &
Efficiency: http://www.dsireusa.org/incentives/incentive.cfm?Incentive_Code=US02F&re=1&ee=1&printable=1 North Carolina Solar Center. (n.d.). Federal Incentives/Policies for Renewables & Efficiency. Retrieved December 27, 2013, from Database of State Indentives for Renewables & Efficiency: http://www.dsireusa.org/incentives/allsummaries.cfm?State=us&re=1&ee=1 North Carolina Solar Center. (2013, July 3). Indiana Net Metering. Retrieved December 27, 2013, from Database of State Incentives for Renewables & Efficiency: http://www.dsireusa.org/incentives/incentive.cfm?Incentive_Code=IN05R&re=0&ee=0 North Carolina Solar Center. (2012, September 27). Indiana Solar Easements & Rights Laws. Retrieved December 27, 2013, from Database of State Incentives for Renewables & Efficiency: http://www.dsireusa.org/incentives/incentive.cfm?Incentive_Code=IN02R&re=0&ee=0 North Carolina Solar Center. (2013, January 3). Modified Accelerated Cost-Recovery System (MACRS) + Bonus Depreciation (2008-2013). Retrieved December 28, 2013, from Database of State Incentives for Renewables & Efficiency: http://www.dsireusa.org/incentives/incentive.cfm?Incentive_Code=US06F&re=1&ee=1 Protogere, A. (2013). Duke Energy reaches settlement on Edwardsport plant air permit. Duke Energy. Swiatek, J. (2013, October 21). Indianapolis airport solar farm is largest of its kind. The Indianapolis Star . Telamon. (2014). The Solar Farm | IND Solar Farm. Retrieved March 25, 2014, from http://indsolarfarm.com/the-solar-farm/ Wilson, B.C.D. (2014). Court gives Duke Energy go-ahead for rate increase. The Kansas City Star