98
EurEnDel Technology and Social Visions for Europe’s Energy Future a Europe-wide Delphi Study Final Report November 2004

EurEnDel Technology and Social Visions for Europe’s Energy Future
a Europe-wide Delphi Study
Final Report
November 2004

Institute for Futures Studies and Technology Assessment
EurEnDel is a European Union research project
funded under the 5th RTD Framework Programme
This document contains the main results of the EurEnDel project. It includes the findings of the European Energy Delphi survey and the resulting recommendations for R&D policy. Further information on the EurEnDel project is documented in EurEnDel working papers which are available from the project website: www.eurendel.net. We would like to thank all participants of the EurEnDel Delphi survey for their contributions which were vital for the project�s success. The Project Team:
Timon Wehnert Björn Helbig Wolfram Jörß Michael Knoll Tobias Reuss IZT - Institute for Futures Studies and Technology Assessment (D)
Anna Oniszk-Popławska Lukasz Jaworski Magdalena Rogulska Grzegorz Wiśniewski EC BREC/IBMER - EC Baltic Renewable Energy Centre (Pl)/Institute for Building Mechanisation and Electrification of Agriculture
Augusto Ninni Oliviero Bernardini Monica Bonacina Massimo Parati IEFE, Università Bocconi (I)
Daniela Velte Juan Pedro López Araguás Ibon Zugasti Prospektiker - European Institute for Future Studies and Strategic Planning (E)
Birte Holst Jørgensen Mads Borup Poul Erik Morthorst Oliver Nielsen Risø - Risø National Laboratory (Dk)
Table of Contents
Summary .................................................................................................. 5
1. Outline of the Report ..................................................................... 17
2. Objectives ....................................................................................... 17
3. Methodological Approach of EurEnDel ....................................... 18
3.1. Outline of the project..............................................................................18 3.2. Basic Assumptions ................................................................................19 3.3. EurEnDel’s Search for a Multitude of Futures......................................20 3.4. Design of the Delphi Questionnaire ......................................................21
4. Main Survey Results ...................................................................... 25
4.1. General remarks .....................................................................................25 4.2. Technology Statements .........................................................................28
4.2.1. Time of Occurrence....................................................................28 4.2.2. Impact Assessment....................................................................34 4.2.3. Actions Needed ..........................................................................36
4.3. Wildcards.................................................................................................39 4.4. Societal Visions ......................................................................................41
4.4.1. Major Findings on Technologies and Energy Sources...........42 4.4.2. Major Findings on Instruments and Innovations.....................45
4.5. Country Specific Analysis......................................................................47 4.6. Quantitative Co-Assessment .................................................................50
4.6.1. Reference Studies......................................................................50 4.6.2. Comparison of Results ..............................................................50
5. Comparison of Social and Technological Perspectives............ 53
5.1. Introduction.............................................................................................53 5.2. Possible sources of divergences in the evaluation of the
statements:..............................................................................................54 5.3. The “Preferences” of the three Societal Visions for the Technology
Statements ..............................................................................................55 5.4. Preferences of the Societal Visions for Technologies and
“feasibility gaps” ....................................................................................60 5.5. Main Conclusions ...................................................................................64
6. EurEnDel Scenarios....................................................................... 65
6.1. Change of Paradigm...............................................................................67 6.2. Fossil Fuel Wars .....................................................................................71 6.3. Muddling Through Across the Gas Bridge...........................................74 6.4. Comments on the Scenarios .................................................................76
6.4.1. Alternative Pathways .................................................................76 6.4.2. Comparison to Quantitative Forecasting .................................76 6.4.3. Quantitative CO2 Emission Classification of the Scenarios...77

4 EurEnDel � Final Report; September 2004
7. Policy Recommendations ............................................................. 78
7.1. “Safe Bet” and “Conditional” Technologies ........................................78 7.2. Comparative Analysis of R&D Priorities...............................................81 7.3. In-depth Analysis of Results and Recommendations .........................83
7.3.1. Energy Demand..........................................................................83 7.3.2. Transport ....................................................................................84 7.3.3. Energy Storage and Grids .........................................................85 7.3.4. Energy Supply ............................................................................88
7.4. Conclusions ............................................................................................92
8. References ...................................................................................... 96

Summary »I always avoid prophesying beforehand because it is much better to prophesy after the event has already taken place.« Winston Churchill
Contents of the Summary I. Scope of EurEnDel ...................................................................................5 II. 19 Technology Trends..............................................................................6 III. Three Societal Visions............................................................................10 IV. Assessment of Results ..........................................................................11 V. Europe’s Energy Future in 2030 – Three Scenarios ............................11 VI. Conclusions and Policy Recommendations ........................................12
I. Scope of EurEnDel EurEnDel is the first Europe-wide Delphi study on future developments in the energy sector. The ultimate objective of the project was to provide advice on energy R&D priorities, based on sound expert knowledge. With a time horizon of 2030, this expert survey not only provides a useful perspective on long-term developments of energy technologies, but also evaluates these technologies against different sets of social values or �visions�. More than 3,400 energy experts from 48 countries were originally invited to participate in this two-round, web-based Delphi exercise. The response rate of about 20%, obtained in the first round, ensures that the results represent a broad European perspective on the challenges that Europe�s energy system will be facing over the next two and a half decades. The following pages document the expert opinions emerging from the survey, including insight from the more than 1,600 written comments sent by the participants. In the survey and in the analysis of the results equal emphasis was placed on the technology-push perspective �What will the future be like?� and the normative social-pull perspective �What should the future be like?�. In this respect, considerable attention was given to the different responses received from technology experts, generalists and decision makers. The results of the Delphi were interpreted on the background of three qualitative scenarios of Europe�s energy futures up to the year 2030. In a world of uncertainties, EurEnDel recognized the impracticality of referring to a single energy scenario. For this reason it adapted the classical Delphi approach, employing a variety of foresight approaches both in the design phase and in the later analysis of the results.
The Delphi questionnaire The EurEnDel Delphi questionnaire consisted of two parts:
• Part I represented the technology push perspective: For 19 �classical� Delphi statements of energy technologies and trends the participants of the survey were asked to assess the Time of Occurrence, the Impact and Actions Needed to promote an early occurrence of each statement. In addition, a

6 EurEnDel � Final Report; September 2004
section on technological �wildcards� explored unlikely developments, which, might have a strong impact on the energy system.
• Part II covered the social pull perspective: Three societal visions were presented and the participants were asked to assess the importance of energy technologies and sources as well as other instruments and innovations for each of these visions.
II. 19 Technology Trends The 19 technological statements highlight important developments of all fields relating to energy demand and supply. Bearing in mind the objective of developing R&D recommendations the focus was set on emerging rather than established technologies. This selection should not be misinterpreted in the way that technologies not touched upon would not be present in future energy systems. The respondents where asked to qualify their expertise for each individual statement in the first part of the Delphi questionnaire according to four categories: expert, knowledgeable, familiar or unfamiliar.
Time of Occurrence Presented in Graph 8-1 the Delphi statements and their Time of Occurrence, as assessed by the participants. The graph displays the answers obtained in the second round for all those participants, who considered themselves to be either experts, knowledgeable or at least familiar with the topic. The bars in Graph 8-1 indicate the statistical spread of answers. This spread become smaller from the first to the second round, as intended with the Delphi method, thus signifying a higher reliability of the results. However, for many statements the difference between the lower and upper quartile still surpasses 10 years, thus the mean value should not be referred to as an exact prediction. Displayed on the right hand side of Graph 8-1 are the share of respondents, who found the corresponding statement to be totally unlikely and classified it to happen �never�. Some important issues should be pointed out:
• Energy Demand On both statements on energy demand there is a great consensus by the survey participants. Doubling the energy efficiency in industrial production is considered to be likely before 2030 by 65% of the respondents. An even higher percentage, 75% of the respondents anticipate 50% of all new buildings in Europe to be low energy buildings before 2030. Only a marginal share (1 to 2%) consider these developments to be totally unlikely.
• Transport A 20% market share of fuel cell driven cars is expected by the respondents in the late 2020s. Note that this is well before hydrogen is expected to play a significant role in Europe�s energy system. On the issue of a 25% share of biofuels for transportation the expert�s opinions are divided: The majority expects this to happen before 2030. However quite a large share (15%) of respondents consider 25% a too larger number.

Summary 7
Time of Occurrence Never
Novel production processes Industrial energy consumption in Europe is reduced by 50% per produced unit through novel production processes
2%
Ener
gy
Dem
and
Intelligent buildings Low-energy buildings with intelligent power systems make up >50% of all new buildings in Europe
1%
20 % FC cars Fuel cell driven cars reach a European market share of 20%
1%
25% Bio-fuels Bio-fuels will have a European market share of >25% in the road transport sector
15%
Tran
spor
t
15% Freight on rail Improved logistics based on information and communication technologies raise the railway's market share in Europe's freight
10%
H2 from diverse sources Hydrogen produced from diverse sources and used as an energy carrier constitutes a significant part of the energy system.
3%
H2 from RES Hydrogen produced solely from renewables and used as an energy carrier constitutes a significant part of the energy system.
10%
H2 from bio Biological or bio-chemical production of hydrogen are in practical use
6%
Energy storage in RES Advanced energy storage technologies are widely used in renewable energy supply systems
1%
Superconductive materials Widespread use of superconductive materials in transformers and generators
2%
30% distributed energy systems Distributed energy systems (< 10 MW) contribute with >30% to Europe's electricity supply
4%
Stor
age,
Dis
tribu
tion
and
Grid
s
International grids Large international grids allow an energy production based on regional renewables (solarthermal power from North Africa, biomass from Central Europe etc.)
16%
Plasma confinement tech Plasma confinement technologies for nuclear fusion are in practical use
22%
Safe fission Nuclear power plants based on passive safe reactor types are in practical use
19%
25% RES Renewable energy sources cover 25% of Europe�s total energy supply
4%
5% PV Photovoltaic cells contribute with >5% of European electricity generation
9%
Ocean tech Ocean technologies (e.g. tidal, currents, and wave) are in practical use
6%
Biomass Biomass for central heating and district heating systems is widely used
5%
Supp
ly
CO2 capture and sequestration CO2 capture and sequestration from fossil fuel power plants is in practical use
12%
Graph 8-1 Mean value of Time of Occurrence of technology
statements in the second Delphi round. Left hand side of the bar indicates 25% quartile and right hand side 75% quartile.
25% quartile mean value 75% quartile
2010 2020 2030 2040

8 EurEnDel � Final Report; September 2004
• Storage, Distribution and Grids There is a large consensus that the trend towards a more decentralised electricity supply prevails. A 30% share of decentralised generation is expected by 2020. In contrast there is quite a controversy when and if at all large international grids allow for an energy transportation of regionally produced renewable energy. 16% of the experts do not believe that e.g. solar-thermal power from North-Africa or Biomass from Central Europe will be used beyond for regional supply. Energy storage is considered to be in widespread use by the early 2020s to support renewable energy systems. Hydrogen, as one storage option is considered to constitute a significant part only after 2030.
• Energy Supply The respondents are quite split concerning the future of nuclear energy. Both statements, on fusion and on fission, received the highest �never� shares. Those experts who consider these technologies to come anticipate to passive safe reactor types around 2025. Fusion is considered a very long-term option. Plasma confinement technologies, a prerequisite for fusion reactors, are not considered to be in practical use before 2040. As for renewable energy sources there is little doubt that a 25% share of Europe�s total energy supply is possible. 66% of the respondents consider it likely that this share is reached before 2030. A high contribution of photovoltaic to this share is a truly long-term goal. The majority of respondents consider a 5% contribution of PV to Europe�s electricity supply realistic only after 2030.
Country specific analyses Sensitivity analyses regarding country specific answering patterns show only minor differences with regards to the anticipated time of occurrence. In this respect the respondents share a common European view. However, for certain issues, especially for the two nuclear statements, there is considerable disagreement between respondents from different countries on the general likelihood or desirability of the statements.
Comparison with quantitative models A comparison of the EurEnDel Delphi results with two energy scenarios, which were developed from quantitative models1, indicates that the EurEnDel participants anticipate more rapid development of substitute technologies and higher market shares, particularly those based on renewable energy resources. These expectations logically extend to changes in related systems, such as advanced storage and distributed energy technologies. However, recent research [Laitner 2004] suggests that economic models tend to underestimate the potential of emerging technologies. Furthermore, the scenario assumptions behind these reference studies (which are very careful business as usual assumptions) are unlikely to correspond to the framework conditions underlying the EurEnDel experts� anticipations. 1 These were �European Energy and Transport - Trends to 2030� published by the European Commission, DG TREN [Mantzos et al. 2003] and the �With Climate Policies� (WCLP) scenario which is used as one of the baseline scenarios in the EU-wide CAFE (Clean Air For Europe) process managed by the European Commission, DG Environment. [Zeka-Paschou 2003].

Summary 9
In fact, the EurEnDel Delphi results on expected time frames should be more correctly be interpreted as identifying achievable future developments, given the right framework conditions and incentives.
Impact Assessment The respondents were asked to rate the anticipated impact of the statements in the areas of Wealth Creation, Environment, Quality of Life and Security of Supply. An index based calculation of the impacts, allowed comparison between the technology statements. Major findings were:
• A share of 25% renewables for Europe�s total energy supply was considered to be overall the most beneficial in the four areas considered. In addition to the positive ecological impact, the respondents highlighted the strong contribution to security of supply.
• Following closely were the two statements on efficient use of energy � the statement on novel production processes and the statement on low-energy buildings.
• The two statements on nuclear energy (safe passive reactors and plasma confinement technologies for nuclear fusion) received low overall ratings. The greatest positive contribution of these technologies was seen in the area of security of supply. But even in this field, these statements had only average impact, the crucial factor being the lack of public acceptance of nuclear fission.
• CO2 capture and sequestration in fossil fuel plants was assessed to be beneficial only for environmental reasons, but generally obtained very low ratings.
• The statements on fuel cells and hydrogen were generally perceived as providing only medium benefits. However, hydrogen production from renewable sources was judged to have more positive impacts than hydrogen produced from diverse sources.
Most technology statements scored higher on environment and on security of supply rather than on wealth creation and quality of life. This may reflect the high costs respondents associate with the energy transition process but also the clearer understanding of environmental impacts and the concern for security of supply, while wealth creation and quality of life are more relative criteria and not so directly linked to energy development.
Supportive Actions In the questionnaire the respondents were also asked to assess which actions are most needed to promote an earlier occurrence of the Delphi statements. The results of this assessment are the basis for the policy recommendations outlined in the respective section of this summary (see chapter VI).

10 EurEnDel � Final Report; September 2004
III. Three Societal Visions In the second part of the questionnaire, three societal visions were outlined and the respondents asked to assess the importance of energy technologies and sources on the background of the set of values identified in each of the visions. The visions correspond to some extend to the three cornerstones of sustainable development:
1) The vision of Individual Choice placed emphasis on individual needs, liberalised markets and consumer sovereignty in the choice of products and services.
2) The vision of Ecological Balance valued protection of the ecosystem, ecological awareness and sustainable production and consumption.
3) The main features of the vision of Social Equity were a reduction of income disparities and of social exclusion, accompanied by community balance and cohesion at the European level, while allowing for regional solutions.
None of the three visions should be interpreted as a forecast of a likely future, nor should they be confused with the EurEnDel scenario exercise (see chapter 6). Rather, they represent the extreme situations that would materialise if the values upon which they are based became predominant and if Europe�s energy system were shaped according to those values alone. It seems more likely that European values in 2030 will reflect a combination of the visions. Nonetheless, the exercise undertaken in the second part of the questionnaire is valuable because it allows an assessment of technologies and energy sources, not just with respect to their technical and market potential, but also in relation to different social contexts. The most significant conclusions emerging from the survey responses were:
• Energy conservation technologies and demand-side management techniques are considered to be of highest importance and reached the highest ranking in each of the three visions.
• In the vision of Individual Choice, fuel cells were given very high importance, presumably as an option to develop individually tailored energy solutions.
• In the vision of Ecological Balance, Wind and Biomass were rated second, seemingly reflecting their perceived limited impact on environment.
• In the vision of Social Equity, biomass was rated highly probably because of its high labour intensity and potential for regional wealth creation.
• The role of hydrogen was considered to be rather independent of social values and achieved intermediate ratings in all three visions.
• CO2 sequestration received a low rating, except for the vision of Environmental Balance, in which it was assigned intermediate importance.
• Nuclear fission was rated lowest in importance in all three visions.

Summary 11
IV. Assessment of Results An in-depth analysis of the survey data was conducted linking the first and the second part of the questionnaire thus comparing results gained with the prospective technology-push perspective to those gained under the normative social-pull perspective. The analysis focuses on two issues:
• The differences in assessment made by the self-declared �experts� and the totality of respondents to Delphi (who considered themselves to be either experts; knowledgeable; familiar or unfamiliar on the specific subjects). The experts are assumed to know very well, for each technology statement, the effects, the times of occurrence and the actions needed to accelerate their expected times of occurrence. The average level of scientific knowledge of the totality of respondents is lower, but they are assumed to well represent the “energy community”, i.e. those people requested to back governments in implementing policies to accelerate their occurrence, having a better knowledge of the broader framework conditions.
• The anticipated impacts of a certain development and the consequent contribution of this technology to a social vision are compared to the feasibility under a certain vision. For this analysis the actions needed to promote a technology are linked to support schemes which are in-line with the values of each vision and would thus be implemented more easily.
Following the political economy literature, this approach can explain the divergences between targets and instruments, or the so called �feasibility gaps�. Important results are:
• Both experts and energy community agree that under all the Societal Visions energy demand technologies are the most important ones in terms of the total social impacts. However, energy conservation technologies may face problems of underinvestment, as its evaluation is around 10-15 % higher than that of policies needed to implement it.
• If only security of supply is considered a strong disagreement between experts and energy community can be noted: for the experts the most important technology in terms of security of supply is �nuclear fission�. The energy community (totality of respondents) considers it to be only of medium importance. For the energy community the most important are still �Energy conservation technologies�.
Further results are incorporated into the policy recommendations presented below.
V. Europe’s Energy Future in 2030 – Three Scenarios The three qualitative scenarios derived from the Delphi results put the seemingly unrelated data on different technologies into a coherent context. They illustrate the findings of the Delphi and serve as a tool to check the robustness of technological choices under different framework conditions. The transformation of the European energy system as well as the pace of this process, are largely dependent upon political will, but also upon external framework conditions, which cannot be completely controlled by the main political actors, i.e. the European Commission and
12 EurEnDel � Final Report; September 2004
the countries and regions, which form part of the European Union. Decisive factors, which may act as motors or restraints, are related to the accessibility of fossil fuels, the mainstreaming of ecological values throughout the European society and its institutions, and also the level of risk perception in society. The frameworks of the scenarios are based on different trends in these three fields.
Scenario 1: Change of Paradigm The first scenario combines hypotheses, which are closely related to a strong policy shift towards sustainable development in the years up to 2030: it is due to a combination of political will, technological progress, structural changes in the economy and urgent environmental pressures that Europe 25 is on the way of achieving great progress in energy efficiency. These combined features trigger an aggressive and self-learning move towards much lower levels of energy intensity across all processes and countries. It is mostly a universal attitude, which seeps across all layers of societies and spheres of activity, summing up efforts by many and in many places.
Scenario 2: Fossil Fuel Wars Fossil Fuel Wars stands for a crisis scenario, in which climate change concerns play a minor role when defining priorities for energy policies. Conflicts between the different interest groups prevail on European, as well as on national levels. Economic, social and environmental policy goals are difficult to integrate and there is a general lack of willingness among companies and citizens to bear the increasing costs of environmental protection.
Scenario 3 : Muddling Through Across the Gas Bridge In the third scenario there is also a major drive towards sustainability, but it is assumed that long-term climate change impacts cannot be avoided. In 2030, Europe is still caught in the middle of a slow transition process towards a more sustainable energy system. Natural gas plays a key role as intermediary solution, not only in power generation, but also in transport.
VI. Conclusions and Policy Recommendations The EurEnDel findings provide a twofold contribution to the analysis of Europe's energy policies:
• they corroborate the conflicting attitudes and paradigms prevalent among energy experts, with valuable new dimensions for the on going energy debate;
• they offer genuine new insight on energy issues, with added value for decision makers.
This final chapter summarises the most important results of the EurEnDel survey. The underlying objective of EurEnDel was the assessment of long-term trends and needs in the fields of energy technologies. Special attention is given to faithfully translating the trends and needs identified by the survey participants into recommendations for R&D and energy policies.

Summary 13
Highest Priority: Energy efficiency • The foremost message from the EurEnDel exercise is that energy efficiency
technologies are the decisive element in Europe�s energy future. The EurEnDel participants are quite resolute in their appraisal that technologies to reduce energy demand have the most beneficial impacts and must be favoured independently of the societal vision pursued. No matter whether we strive for economic well-being and liberty of choice, ecological balance or social equity, demand-side options to reduce Europe�s dependence on energy supplies are highest on the list of priorities.
• However, despite their high potential and societal needs, supportive actions to improve energy efficiency must be intensified combining research, fiscal incentives and initiatives to promote end-user acceptance in order to avoid the high underinvestment risk.
• In housing and industry, long-term strategies are vital since high rates of energy efficiency improvements in these sectors can be achieved only in long term perspective, beyond 2020. Efficiency improvements in housing and industry rely heavily on fiscal incentives and regulation. However, by analogy with the priority given to research in these fields in the USA and Japan, market measures need strong backing from applied research in energy efficiency technologies.
• Enhancing energy efficiency in housing and industry is facilitated in the enlarged Europe because of the greater energy saving potential in new member states. However urgent action is necessary in all 25 member states, to obtain the expected results.
• Containing the increase in transport energy demand was identified as one of the most difficult challenge for Europe�s energy system. The EurEnDel analysis indicates that there is no simple solution, capable of meeting this challenge. Efforts need to be intensified on all levels and employ all available means. The EurEnDel survey focussed on fuel cells and freight transport by railways as two solutions that can play a significant role.
• Fuel cells meet all the criteria for classifying as a safe-bet technology. They are well placed to play a major role in future transport systems, contributing both to energy efficiency improvements and reduction of local emissions. Fuel cell driven cars are expected to reach a significant market share well before the hydrogen economy is established. Thus flexibility of design using natural gas as a transition fuel will be crucial in the development of fuel cells for transportation.
• Though fuel cells for transport as well as hydrogen production still require substantial research support, many Eurendel respondents are of the opinion that the technology could already benefit from the application of market measures (essentially fiscal incentives), due to potentially strong cost reductions coming from economies of scale.
• As for other mature technologies, fiscal and regulatory measures are the most important means of supporting freight transport by rail, though research still has a significant role to play. However, the future role of railways in freight transport depends more than anything on political choice.
14 EurEnDel � Final Report; September 2004
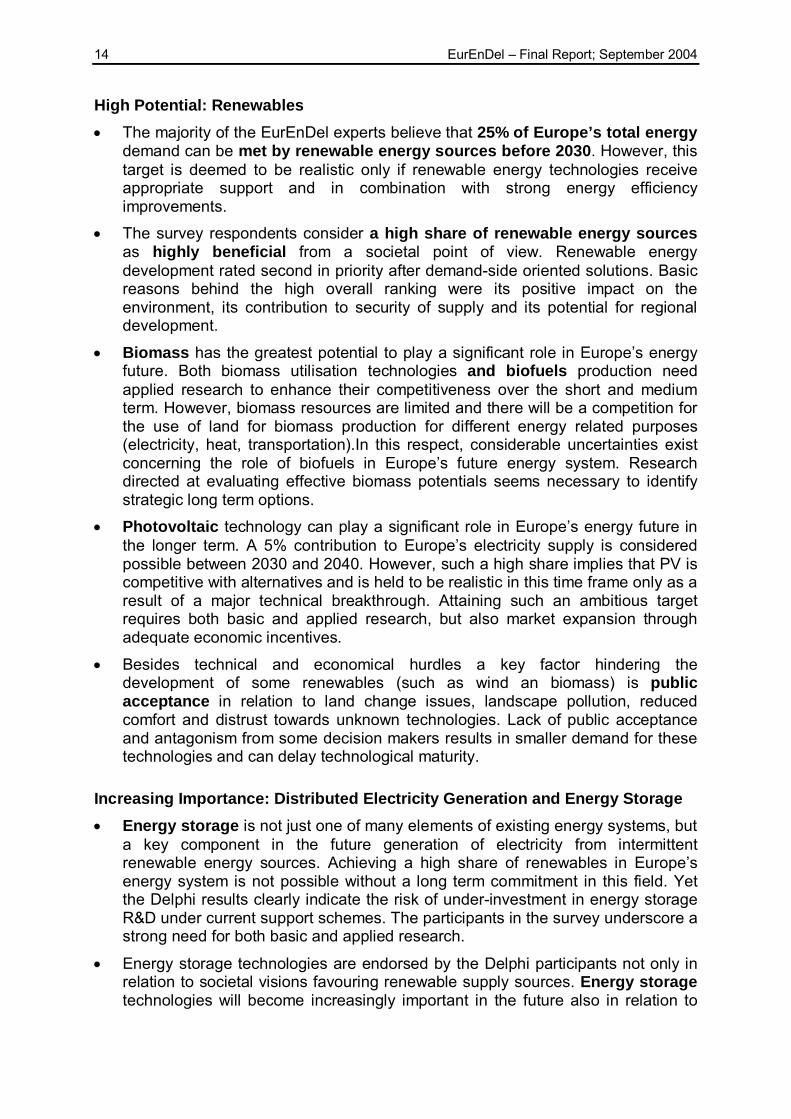
High Potential: Renewables • The majority of the EurEnDel experts believe that 25% of Europe’s total energy
demand can be met by renewable energy sources before 2030. However, this target is deemed to be realistic only if renewable energy technologies receive appropriate support and in combination with strong energy efficiency improvements.
• The survey respondents consider a high share of renewable energy sources as highly beneficial from a societal point of view. Renewable energy development rated second in priority after demand-side oriented solutions. Basic reasons behind the high overall ranking were its positive impact on the environment, its contribution to security of supply and its potential for regional development.
• Biomass has the greatest potential to play a significant role in Europe�s energy future. Both biomass utilisation technologies and biofuels production need applied research to enhance their competitiveness over the short and medium term. However, biomass resources are limited and there will be a competition for the use of land for biomass production for different energy related purposes (electricity, heat, transportation).In this respect, considerable uncertainties exist concerning the role of biofuels in Europe�s future energy system. Research directed at evaluating effective biomass potentials seems necessary to identify strategic long term options.
• Photovoltaic technology can play a significant role in Europe�s energy future in the longer term. A 5% contribution to Europe�s electricity supply is considered possible between 2030 and 2040. However, such a high share implies that PV is competitive with alternatives and is held to be realistic in this time frame only as a result of a major technical breakthrough. Attaining such an ambitious target requires both basic and applied research, but also market expansion through adequate economic incentives.
• Besides technical and economical hurdles a key factor hindering the development of some renewables (such as wind an biomass) is public acceptance in relation to land change issues, landscape pollution, reduced comfort and distrust towards unknown technologies. Lack of public acceptance and antagonism from some decision makers results in smaller demand for these technologies and can delay technological maturity.
Increasing Importance: Distributed Electricity Generation and Energy Storage • Energy storage is not just one of many elements of existing energy systems, but
a key component in the future generation of electricity from intermittent renewable energy sources. Achieving a high share of renewables in Europe�s energy system is not possible without a long term commitment in this field. Yet the Delphi results clearly indicate the risk of under-investment in energy storage R&D under current support schemes. The participants in the survey underscore a strong need for both basic and applied research.
• Energy storage technologies are endorsed by the Delphi participants not only in relation to societal visions favouring renewable supply sources. Energy storage technologies will become increasingly important in the future also in relation to

Summary 15
the development of distributed energy systems and are therefore a fundamental element of societal visions favouring individual choice.
• The hydrogen system has the potential to become a major storage option. However, due to the long time horizon for hydrogen to contribute significantly to Europe�s energy system other storage alternatives, including batteries, flywheels and super-capacitators also have to be pursued.
• The assessment of the hydrogen economy provided by the EurEnDel respondents depends on the source of the hydrogen. A hydrogen economy for its own sake is difficult to justify from an economic and environmental standpoint and less beneficial. The prevalent position is that hydrogen production from renewable sources is to be preferred mainly for environmental reasons. However, other sources (natural gas, coal or nuclear energy) may be required as bridges in the transition to a hydrogen economy based on renewable energy sources. To this end it is deemed important to identify a suitable long term growth path establishing framework conditions for the large new infrastructure needs required in the expansion of the hydrogen economy.
• The development of superconductive materials was considered to support the fulfilment of major policy and technology goals such as strengthening of the European electricity transmission grid, reduction of transmission and distribution losses and more efficient energy storage. Although it is now in very immature stages of development, the vast majority of the EurEnDel participants consider it to be a viable option for the future energy system.
Controversial Issue: Nuclear Energy • A large majority of the EurEnDel participants do not expect the introduction of
passively safe reactor types in Europe before 2020. However, it seems a controversial issue considering that almost 20% of the respondents do not believe it will ever occur. Despite its importance for security of supply and CO2 abatement, nuclear fission was given very low ratings in the impact assessments.
• Roughly three quarters of the experts believe that at some point in the future nuclear fusion will be in practical use. However, this was the most controversial issue covered in the EurEnDel survey. Due to the very long-term perspective for its technological maturity, fusion generally received very low impact ratings. Some experts even doubt whether high support levels for nuclear fusion should be continued at all as there have been no clear signs of a major breakthrough and there are no chances for the commercialisation of this technology before 2030. In any event, the Delphi respondents generally agree that the perception of nuclear fusion in the public mind should be decoupled from that of nuclear fission.
• Both nuclear technologies elicit the largest divergence between participants based on national origin. While there seems to be a fairly high consensus between respondents from different countries on the technical feasibility and the anticipated time horizons, there are strong disagreements on the expected societal impacts and whether or not the technologies will be in practical use in Europe.

16 EurEnDel � Final Report; September 2004
Intermediate Solution: Natural Gas • Most of the Delphi participants agree that natural gas can play an important role
towards a more sustainable energy supply future for Europe. However, they also stress the need to avoid excessive reliance on this energy source for security of supply reasons. Many emphasize the transitional character of this resource as a bridge to a more sustainable energy future not based on fossil fuels. Consequently growth strategies should ensure compatibility with truly sustainable long-term options. In any event in the period considered a strong increase in natural gas imports can be anticipated together with high investments needed to build up the necessary infrastructure (pipelines and liquefaction facilities). R&D efforts in this field can contribute to bringing down the costs of natural gas transportation and storage infrastructure.
Other issues • Participants in the survey broadly agree that long term reliability and safety (both
real and perceived by the public at large) are the most crucial issues for the development of nuclear power. To a lesser extend this also holds true for the hydrogen system (production, transport and storage) as well as CO2 sequestration and storage.
• Another pervasive issue throughout the Delphi response is that, both in the case of demand and supply side technologies, the level of energy prices should reflect the external costs, in order to increase the economic competitiveness of emerging technologies.

Outline of the Report 17
1. Outline of the Report After a short summary of the objectives underlying the EurEnDel project in chapter 2 the methodological approach is described in chapter 3. This is done in quite detail since EurEnDel follows a newly developed approach of applying the Delphi method in combination with other foresight tools. The main survey results are presented in chapter 4. This includes a comparison of the EurEnDel Delphi results with scenarios developed from quantitative models. One of the new items in the EurEnDel approach is to split the Delphi questionnaire into two parts: one with a technology driven perspective and one with a societal demand perspective. The combining comparison of the results stemming from these two perspectives is outlined in chapter 5. To interrelate the findings on the assessed technologies three qualitative scenarios are described in chapter 6 which illustrate the findings of the survey on the background of different global framework conditions. Finally policy recommendations are developed in chapter 7 which mainly aim at energy R&D policy. For each chapter of this report a background paper exists which is available for download from the project website: www.eurendel.net. Also available is a 35 page summary report [Wehnert et al. 2004] which highlights the major findings presented in this report.
2. Objectives Main objectives of EurEnDel were:
• Explore future trends in energy technology development.
• Assess the potentials of emerging and existing technologies to contribute towards a sustainable development.
• Add to the development of a common European knowledgebase on energy technologies.
• Identify research needs in the energy field which help to promote a sustainable development.
As a time horizon for the assessment 2030 was chosen for the following reasons: 25 to 30 years is a reasonable time frame for emerging technologies to enter the market. Thus today�s research activities should shape Europe�s energy future in 2030. And, by that time major transformations in Europe�s energy future may have occurred. A large share of today�s power plants will (have to) be replaced, making room for new choices. Furthermore it seems very likely that the depletion point for conventional oil will be reached by then [Illum 2004]. If this would mark the end of the �cheap oil era� then major changes in Europe�s energy supply would be inevitable.

18 EurEnDel � Final Report; September 2004
3. Methodological Approach of EurEnDel »Prediction is very difficult, especially if it‘s concerning the future« Niels Bohr
3.1. Outline of the project The core of EurEnDel is a Europe-wide Delphi survey with two rounds of expert consultations. However, EurEnDel is more than a Delphi. In adaptation of the classical Delphi approach EurEnDel combines prospective and normative foresight elements. Following the prospective technology-push perspective, the question is: �Which are likely developments in the energy technology field�? The normative social-pull perspective focuses on (normative) societal demands: �Which technologies do we need in order to be able to satisfy future needs�? EurEnDel combines these two perspectives both within the Delphi questionnaire itself and by applying additional foresight methods such as the development of scenarios.
Why Delphi? The aim of EurEnDel is to describe trends in the development of energy technologies and to identify research and development needs in the energy field based on estimated technical potentials and future societal demands. This requires a common European perspective. Especially with this focus, Delphi is an appropriate method to involve a large number of energy experts and stakeholders in the energy sector who have heterogeneous backgrounds and bring them together in a large-scale discussion process for the assessment of energy technologies. Through the anonymity of the process it can be guaranteed that the participants can change their mind without loosing their face or without having to pound on their established position. On the other hand, Delphi is not a simple questionnaire. By confronting the experts with the results of the first round they can re-assess their own position, which makes the overall results more valid. In addition the Delphi method is not only providing predictions, but a discussion within a certain community and thus helps to establish a common knowledge base (cf. [Gordon 1994], [Linstone and Turroff 1974]).
Project design Graph 3-1 gives an overview of the major project steps. Since the design of the Delphi questionnaire is crucial for the whole project it is described in more detail below. In addition to an in-depth quantitative analysis of the Delphi results (see chapter 4) the results of the Delphi were assessed against results gained from quantitative models (see chapters 4.6 and 6).2 Three qualitative scenarios were developed
2 A series of major energy scenarios was analysed. A special focus was put on two scenarios which were used as benchmarks for the EurEnDel findings: �European Energy and Transport - Trends to 2030� [Mantzos et al. 2003] and the �With climate policies� scenario [Zeka-Paschou 2003]. See EurEnDel working paper �Quantitative co-assessment of the EurEnDel Delphi results� [Jörß and Wehnert, 2004] (available at www.eurendel.net) for details.

Methodological Approach of EurEnDel 19
which provide a more holistic and illustrative description of the Delphi results (see chapter 6). 3 The comparison of the technology-push and the social-pull perspective links together the first and the second part of the questionnaire. This comprises an in-depth statistical analysis of the survey data focussing on differences in respondents� answers with regards to their expertise. Guiding questions were: �Which technologies do we need?� and �Which technologies will be easy to promote?�. 4 Combining the results of all previous project steps policy recommendations were developed, focusing on R&D policies. The evaluation scheme employed to assess the analysed technologies takes into account the impacts of technologies, their coherence with societal demands (importance in EurEnDel visions) and their robustness (performance in EurEnDel scenarios) as described in chapter 6. An overview of EU, USA and Japanese energy R&D priorities and funding was compiled as background information. 5
Workflow of EurEnDel
Analysis of future energy trends:! Structural Analysis! Rewiew of Delphi surveys
Identification of societal visions:! Visions workshop! Scenario writing
Part I20 "classical" Delphi statements
DelphiQuestionnaire
Design ofDelphi Questionnaire:! Panel workshop
ScenariosTechnology and Market
Trends
Comparison withQuantitative Models
Comparison ofSocial Pull vs.
Technology Push
R&D PolicyRecommendations
Part II3 societal visions
Delphi Results
Conduction of 2 Survey Rounds
Graph 3-1: Tasks and workflow of the
EurEnDel project
3.2. Basic Assumptions
Technology development is a social process. It sounds almost like a triviality to state that technological development can not be considered a �black box�, which follows it�s own path, solemnly obeying it�s own rules. Technology development is interdependent with social and economic developments. It is embedded in and itself provoking a specific legal and societal framework.
3 The process of scenarios development is described in detail in the EurEnDel working paper �The EurEnDel Scenarios - Europe�s Energy System by 2030� [Velte et al. 2004] which is available at www.eurendel.net.
4 The methodology is further described in chapter 5 � for details see also EurEnDel working paper �Social and technical perspectives� [Ninni, Bonacina 2004] which is available at www.eurendel.net.
5 For details see also EurEnDel working paper �Policy Implications� [Oniszk et. al. 2004] which is available at www.eurendel.net.

20 EurEnDel � Final Report; September 2004
The Implicit Scenarios Therefore it is not surprising that, when experts fill-in a Delphi questionnaire, they often ask themselves � or the designers of the questionnaire, in fact � under which assumption they should assess the statements. According to the Delphi methodology, however, no explicit framework is given. There is no directive, for instance, whether or not the experts should assume that the Kyoto Protocol would be ratified � in the case of EurEnDel such assumptions would make a significant difference. Instead the experts should assess the statements bearing in mind all their personal assumptions of what the future would be like. Consequently, the experts are giving their individual judgement on how certain technologies will develop, and each one of them has his individual scenario in mind � a future framework in which the anticipated technological developments take place.
How to interpret Delphi results Following the above line of thought a limitation of the Delphi method is revealed: The framework conditions the participants have in their mind are not made explicit. Thus it is important to assess Delphi results against different frameworks (e.g. policy priorities or economic conditions). Furthermore, it is important to note that Delphis tend to give mainstream answers and tend to neglect trend breaks. Catastrophes, crises or major technology breakthroughs are generally not foreseen by the experts as being the most likely option. Consequently, certain Delphi predictions become invalid if the trend break occurs. Therefore it is important not to limit Delphi results to the statistical means of all answers, but to enhance the robustness of the predictions by combining Delphi with other foresight methods.
3.3. EurEnDel’s Search for a Multitude of Futures Bearing in mind that one cannot talk about the one future which is bound to come and which can be predicted precisely, but instead following a concept of a multitude of possible futures, EurEnDel employed a wide variety of instruments to adapt the classical Delphi approach.
• Broad Mix of Experts Since pure technological experts often overestimate the technological possibilities the participants of EurEnDel were chosen to have a broad view on energy issues and to present all stakeholders in the energy business (see chapter 4.1 for details).
• Look at Outsider Opinions and Contradictions In addition to the statistical analysis of the quantitative data the evaluation of the EurEnDel survey explicitly focused on minority opinions and contradictions: An in-depth analysis of all experts comments was run. The statistical data was scanned for �double peaks� (e.g. a large share of experts saying that a certain technology is to come rather early while an equally large share predicts that it will never come) � a contradiction which would be lost if one only looks at the mean value, but which can be adequately explored by sketching a set of scenarios of future developments
• Confrontations with Societal Visions One fundamental approach of EurEnDel was to stir the experts mind and invite them to leave the entrenched paths of our daily thinking. Sketches of Europe�s energy future based on idealised societal visions are presented in

Methodological Approach of EurEnDel 21
the questionnaire and the participants of the Delphi were asked to assess the importance of energy technologies for each of the visions. These visions were normative elements looking for technologies most apt to fulfil societal needs.
• Development of Scenarios To be able to adequately describe the multitude of possible futures three different scenarios of Europe�s energy future were developed from the Delphi results. The correlations between the Delphi statements are taken into account and the results on single technologies are combined to consistent pictures of Europe�s energy system. The scenarios are a tool to test the robustness of energy technologies under different framework conditions.
3.4. Design of the Delphi Questionnaire The EurEnDel Delphi questionnaire consists of two parts:
• Part I represents the technology push perspective: 19 �classical� Delphi statements of energy technologies and trends form the main body, augmented with a section on technological �wildcards� � unlikely developments which however might have a strong impact on the energy system.
• Part II covers the social pull perspective: Three societal visions are presented and the participants of the survey are asked to assess the importance of energy technologies and sources as well as other instruments and innovations for each of these visions.
The aim of EurEnDel is to take the broad perspective on the energy system as a whole. However, covering all energy related issues and at the same time exploring each topic in depth would come down to having the whole world in a nutshell. Due to the methodological approach of EurEnDel and the fact that the survey was conducted on-line, the number of Delphi statements had to be limited to 19 � otherwise the participants would have been overburdened with a too large questionnaire. It took approximately one hour to fill in the questionnaire, which is quite long for an on-line survey. 6
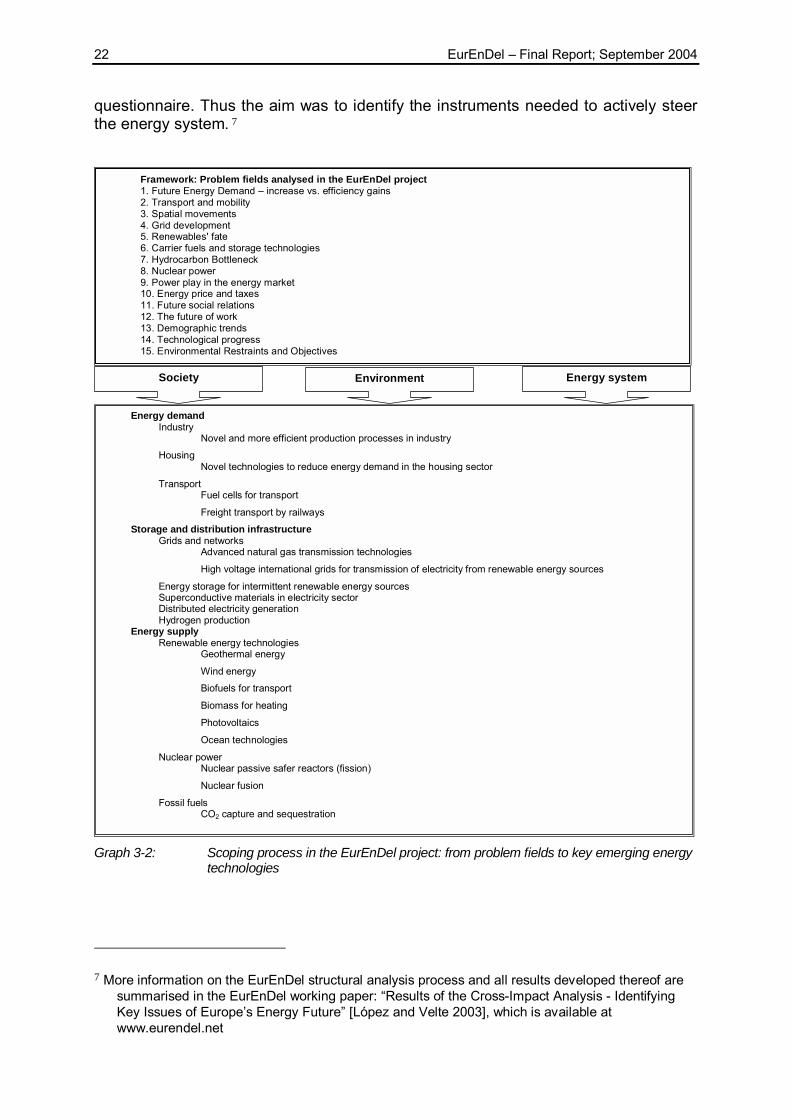
Cross-impact analysis – Identifying Key Drivers Being very aware of the fact that covering the whole energy system in mere 19 statements is not possible, the approach was to find one or two key technological statements within each field that influences the energy system. Starting with the question of what will be the main drivers of future energy demand in Europe a cross-impact analysis process was conducted. A total of 42 drivers within 15 problem fields (see Graph 3-2) were identified relating to both demand and supply options, but also to political and social trends, which are likely to have an important influence on the future constellation of the energy system. Those drivers, which have the highest impact on the energy system and at the same time can purposely be influenced from the outside were selected for further investigation in the Delphi
6 The full questionnaire is available as download from www.eurendel.net.
22 EurEnDel � Final Report; September 2004
questionnaire. Thus the aim was to identify the instruments needed to actively steer the energy system. 7
Framework: Problem fields analysed in the EurEnDel project
1. Future Energy Demand � increase vs. efficiency gains 2. Transport and mobility 3. Spatial movements 4. Grid development 5. Renewables' fate 6. Carrier fuels and storage technologies 7. Hydrocarbon Bottleneck 8. Nuclear power 9. Power play in the energy market 10. Energy price and taxes 11. Future social relations 12. The future of work 13. Demographic trends 14. Technological progress 15. Environmental Restraints and Objectives
Energy system Society Environment
Energy demand Industry
Novel and more efficient production processes in industry
Housing Novel technologies to reduce energy demand in the housing sector
Transport Fuel cells for transport Freight transport by railways
Storage and distribution infrastructure Grids and networks
Advanced natural gas transmission technologies
High voltage international grids for transmission of electricity from renewable energy sources
Energy storage for intermittent renewable energy sources Superconductive materials in electricity sector Distributed electricity generation Hydrogen production
Energy supply Renewable energy technologies
Geothermal energy
Wind energy
Biofuels for transport
Biomass for heating
Photovoltaics
Ocean technologies
Nuclear power Nuclear passive safer reactors (fission)
Nuclear fusion Fossil fuels
CO2 capture and sequestration
Graph 3-2: Scoping process in the EurEnDel project: from problem fields to key emerging energy
technologies
7 More information on the EurEnDel structural analysis process and all results developed thereof are summarised in the EurEnDel working paper: �Results of the Cross-Impact Analysis - Identifying Key Issues of Europe�s Energy Future� [López and Velte 2003], which is available at www.eurendel.net

Methodological Approach of EurEnDel 23
Analysis of Foresight and Delphi Surveys A thorough evaluation of 17 previous major foresight and Delphi surveys was conducted.8 From this the state of the art as well as hints to future potentials of energy technologies were identified. Input for the selection of the EurEnDel Delphi statements was gathered from an analysis with the following criteria:
1) Where are contradictions in assumptions on future developments? This is e.g. the case in the field of future energy demand where a rise in air-conditioning conflicts with a growing share of low-energy houses.
2) Which are technological advances, which have not been sufficiently covered in national Delphis? (Blind spots)
3) Where are differences in the assessment of the time-frame for technology improvements?
In addition, the foresight comparison served as a control instrument for the EurEnDel project to guarantee that no major areas were overlooked in the cross-impact analysis.
Development of Delphi Statements The key drivers, which had been identified in the cross-impact analysis, were then associated to corresponding technologies. The focus was put on energy technologies with estimated high research needs. In this respect the Delphi questionnaire does not want to explore all aspects of a future energy system (e.g. it was not the intention to determine shares of all energy sources � a task for which other methods are suited better). Consequently a focus was put on emerging rather than established technologies. The final choice and wording of the Delphi statements was done on a panel workshop with all project partners and external experts.
Identification of societal visions The development of the societal visions, which form the second part of the Delphi questionnaire, followed a bottom-up approach � starting from general social needs and then narrowing them down to socially driven visions of Europe�s Energy Future in 2030. In a broad literature research general societal trends were analysed (issues which were also addressed in the cross impact analysis were i.e. transport and mobility; spatial movements; future social relations; the future of work; demographic trends as well as environmental restraints and objectives). They were complemented by a review of EU policy priorities. This information formed the basis for a visions workshop in which all EurEnDel team members as well as six social and energy experts participated. The workshop brought about the seeds for the three societal visions then presented in the Delphi questionnaire (see chapter 4.4 for full description):
8 The results of this analysis are documented in a working paper �Energy related Delphi statements in comparison� which is available for download from: http://www.izt.de/eurendel/background_information/evaluation_foresight_studies/index.html

24 EurEnDel � Final Report; September 2004
• The societal vision of Individual Choice puts emphasis on individual needs, liberalised markets and consumers� sovereignty in choosing products and services.
• Ecological Balance values protection of the ecosystem, ecological awareness and sustainable production and consumption.
• The main features of the vision of Social Equity are a minimisation of income disparities and social exclusion, accompanied by social balance and cohesion at the European level while allowing for regional solutions.
None of the final three societal visions should be mistaken as a realistic forecast of a likely future. Instead, they mark extreme cornerstones for situations that might arise if the values upon which each vision is based became predominant in Europe and if the continent�s energy system was shaped according to those values only. Most probably, the societal values in Europe in 2030 will consist of a mixture of the dominant values stated in the visions, but the information contained in the second part of the questionnaire gives information on the question which technologies would be preferable if a certain societal value was emphasised.
Main Survey Results 25
4. Main Survey Results »Get your facts first, and then you can distort them as much as you please. «
Mark Twain (1835 - 1910)
This chapter presents the main results from the EurEnDel Delphi survey and a co-assessment with other quantitative analyses9. These cover:
• General remarks on the professional, demographic and national profile of the respondents.
• Expectations regarding 19 technology statements in terms of their Time of Occurrence, their impact on Wealth Creation, Environment, Quality of Life, and Security of Supply, and Actions Needed to support an early occurrence.
• A section on wildcards in terms of technological breakthroughs which may be unlikely but would have a strong impact on the whole energy system.
• Expectations with respect to three visions for future energy systems comprising the vision of Individual Choice, the vision of Ecological Balance, and the vision of Social Equity. These visions are tested against the importance of energy sources and technologies as well as the impact of various instruments and innovations.
• A country specific analysis of the result, focusing mainly on the three countries with the highest share of respondents: Germany, Spain and Poland.
• A quantitative co-assessment of the results by comparing the respondents� expectations with quantitative models.
4.1. General remarks The EurEnDel Delphi survey was conducted electronically. The first round survey was conducted in the period from 2nd June to 1st August 2003. The gross population of the first round survey was 3,461 experts, of whom 669 responded producing a response rate of 19%. The second round survey included the results from the first round survey as well as some adjustments and improvements. It was sent out to the 669 respondents from the first round survey and was conducted in the period 18th August to 30th September 2003. A total of 418 experts responded to the survey resulting in a response rate of 62%. The participants for the survey were identified by the EurEnDel partners in the following way:
• Selecting from existing expert databases of the institution • Identified authors of energy publications • Identified speakers on energy congresses
9 More detailed information on the issues covered in this chapter are presented in the EurEnDel working papers [Jørgensen et. al 2004] and [Jörß and Wehnert 2004] which are available on www.eurendel.net.
26 EurEnDel � Final Report; September 2004
• Co-nomination of experts either by partners or on the project web-site (www.eurendel.net)
• Completing missing fields by directed research (internet, address databases, phone calls), e.g. for the energy journalists, public agencies and politicians, associations
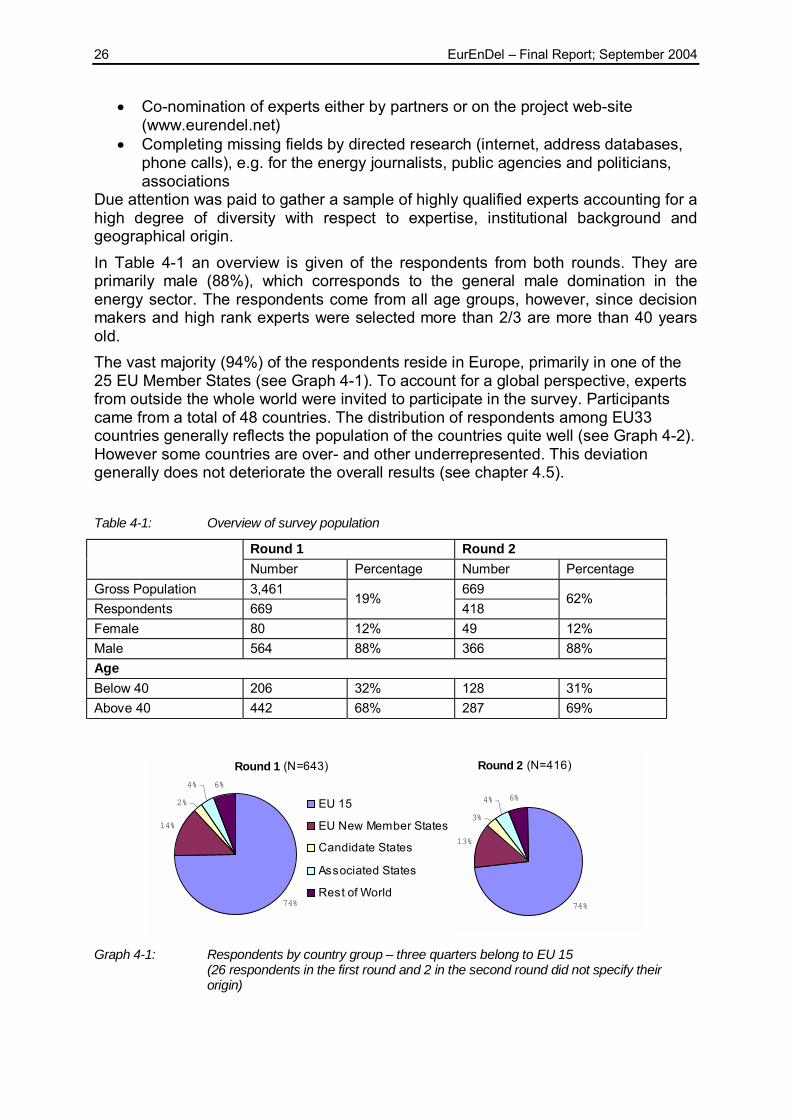
Due attention was paid to gather a sample of highly qualified experts accounting for a high degree of diversity with respect to expertise, institutional background and geographical origin. In Table 4-1 an overview is given of the respondents from both rounds. They are primarily male (88%), which corresponds to the general male domination in the energy sector. The respondents come from all age groups, however, since decision makers and high rank experts were selected more than 2/3 are more than 40 years old. The vast majority (94%) of the respondents reside in Europe, primarily in one of the 25 EU Member States (see Graph 4-1). To account for a global perspective, experts from outside the whole world were invited to participate in the survey. Participants came from a total of 48 countries. The distribution of respondents among EU33 countries generally reflects the population of the countries quite well (see Graph 4-2). However some countries are over- and other underrepresented. This deviation generally does not deteriorate the overall results (see chapter 4.5). Table 4-1: Overview of survey population
Round 1 Round 2
Number Percentage Number Percentage Gross Population 3,461 669 Respondents 669
19% 418
62%
Female 80 12% 49 12% Male 564 88% 366 88% Age Below 40 206 32% 128 31% Above 40 442 68% 287 69%
Round 2 (N=416)
74%
13%
3%
4% 6%
Round 1 (N=643)
74%
14%
2%
4% 6%
EU 15
EU New Member States
Candidate States
Associated States
Rest of World
Graph 4-1: Respondents by country group – three quarters belong to EU 15
(26 respondents in the first round and 2 in the second round did not specify their origin)

Main Survey Results 27
Respondents vs. Population
0% 5% 10% 15% 20% 25%
Austria
Belgium
Denmark
Finland
France
Germany
Greece
Ireland
Italy
Luxembourg
Netherlands
Portugal
Spain
Sweden
UK
EU 15
0% 2% 4% 6% 8% 10%
Bulgaria
Cyprus
Czech Rep.
Estonia
Hungary
Iceland
Latvia
Liechtenstein
Lithuania
Malta
Norway
Poland
Romania
Slovakia
Slovenia
Switzerland
New member states, candidate and associated countries
Proportion of Population Proportion of EurEnDel RespondentsProportion of Population Proportion of EurEnDel Respondents Graph 4-2: Share of respondents to the second Delphi round in comparison to the size of their
country of origin. 100% refers to all countries listed. Please note the different scaling of the graphs.
The respondents show an even mix of technological and non-technological experts (see Graph 4-3). The non-technological experts have their expertise primarily expertise public policy (23%) and to a lesser extent in business (13%). In terms of institutional background the respondents also show a very good distribution within the various fields (Graph 4-4). Roughly one third each comes from academic research (34%) and from industry (29%). The remaining experts mainly work in consulting (18%) or public policy (11%).
Expertise
55%
13%
23%
9%Technology
Business
Public policy
Other
Institutional Background
34%
29%
18%
11%8%Academia
Industry
Consulting
Public agency
NGO and other
Graph 4-3: Respondents by Expertise (2nd Delphi round)
Graph 4-4: Respondents by Institutional Background (2nd Delphi round)
28 EurEnDel � Final Report; September 2004
4.2. Technology Statements In the first part of the Delphi questionnaire, experts were asked to assess 19 technology statements against their Time of Occurrence, their Impact, and Actions Needed to support an early occurrence of the statement. In addition the respondents where asked to qualify their expertise for each individual statement:
Expertise of Respondents: The respondents where asked to qualify their expertise for each individual statement in the first part of the Delphi questionnaire according to the four categories:
Expert - if you consider yourself to belong to that community of people who currently dedicate themselves to this topic. Knowledgeable � a) if you were an expert in it some time ago, but feel somewhat rusty now; b) if you are in the process of becoming an expert but still have some way to go to achieve mastery of the topic; c) if you work in a neighbouring field and occasionally draw upon or contribute to the development of this topic. Familiar - if you know most of the arguments used in discussions on the topic, you have read about it, and have formed an opinion about it. Unfamiliar
If not indicated differently in this document only the answers of those respondents who considered them either �expert�, �knowledgeable� or �familiar� are displayed. The answers of respondents that are unfamiliar with the given statement were analysed only in relation to specific aspects (see Chapter 5). In some cases the answers of those respondents who rated themselves as �experts� are especially highlighted.
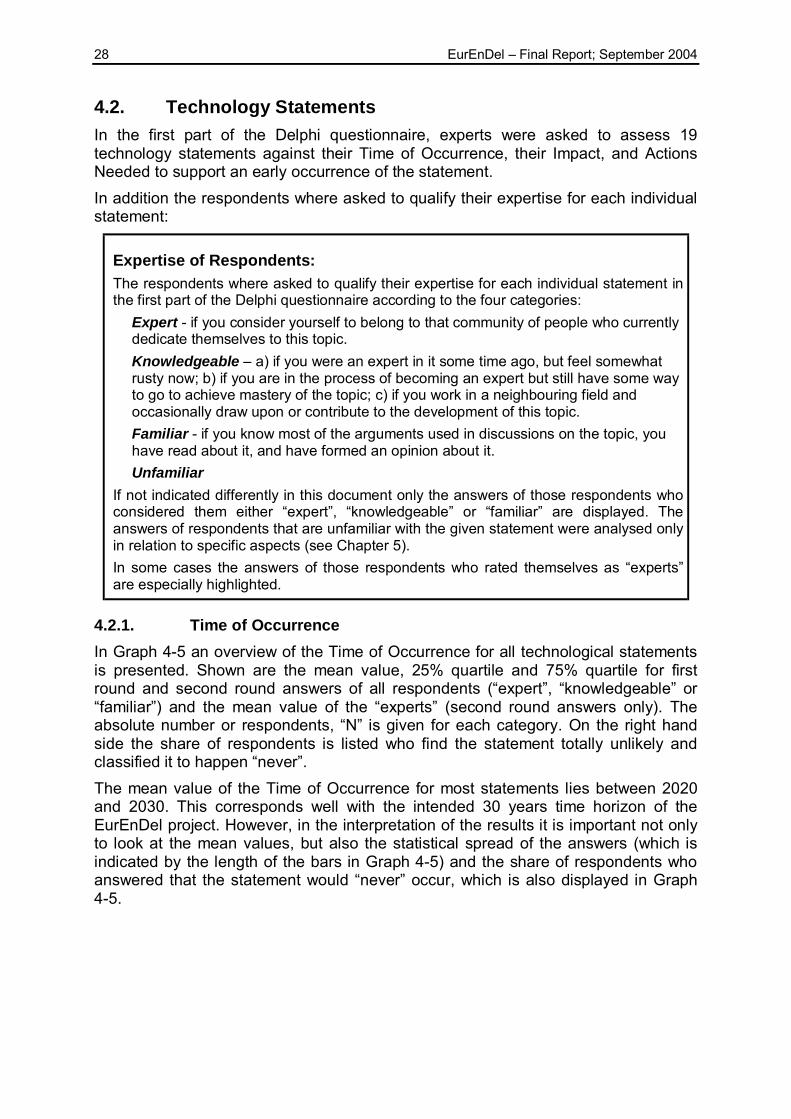
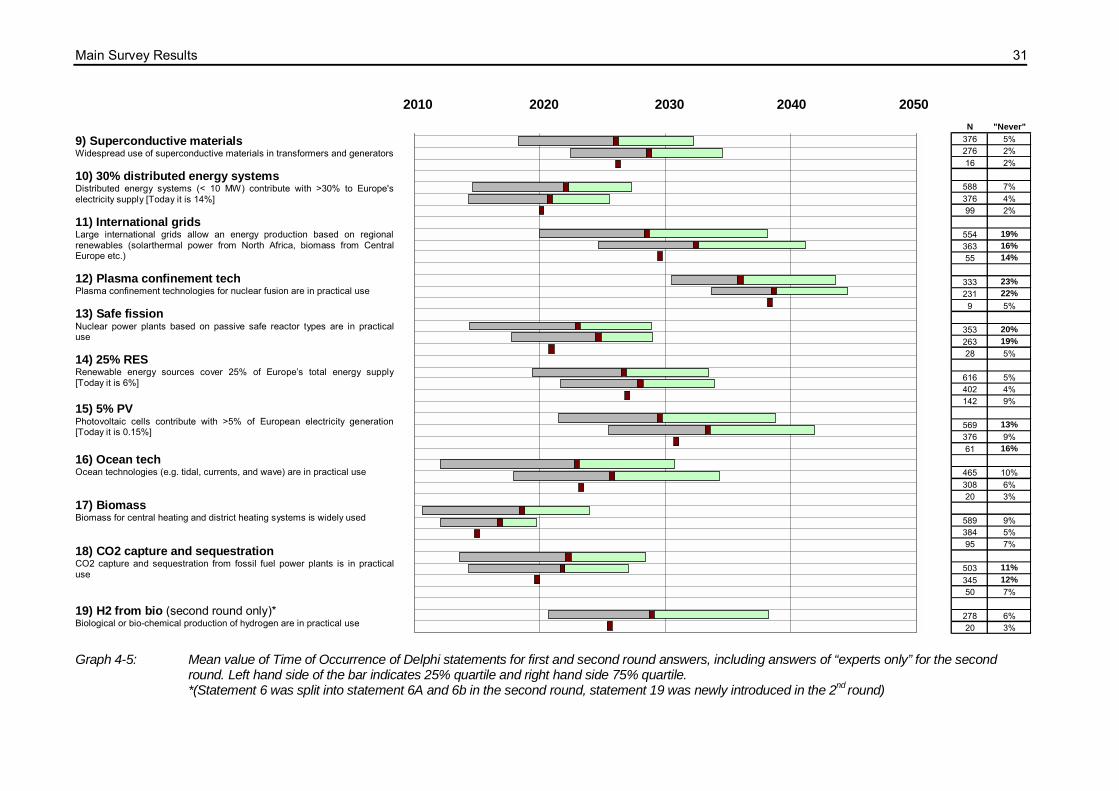
4.2.1. Time of Occurrence In Graph 4-5 an overview of the Time of Occurrence for all technological statements is presented. Shown are the mean value, 25% quartile and 75% quartile for first round and second round answers of all respondents (�expert�, �knowledgeable� or �familiar�) and the mean value of the �experts� (second round answers only). The absolute number or respondents, �N� is given for each category. On the right hand side the share of respondents is listed who find the statement totally unlikely and classified it to happen �never�. The mean value of the Time of Occurrence for most statements lies between 2020 and 2030. This corresponds well with the intended 30 years time horizon of the EurEnDel project. However, in the interpretation of the results it is important not only to look at the mean values, but also the statistical spread of the answers (which is indicated by the length of the bars in Graph 4-5) and the share of respondents who answered that the statement would �never� occur, which is also displayed in Graph 4-5.

Main Survey Results 29
Calculation – Time of Occurrence To calculate the mean time of occurrence for one statement the number of answers in each class was weighted with the average class value:
Before 2010 (i.e. 2006 � 2010) " 2008 2011 � 2020 " 2015 2021 � 2030 " 2025 After 2030 (i.e. 2030 � 2050) " 2040
Note that in this calculation the answer option �never� is excluded, because it can�t be logically integrated. For this reason Graph 4-5 explicitly lists the percentage of respondent who stated �never� when asked for the Time of Occurrence for the different statements. The 25% quartile and the 75% quartile are a measure for the degree of consensus / disagreement of the respondents. 25% quartile: 25% of the respondents say that the statement comes true before this date. 75% quartile: 75% of the respondents say that the statement comes true before this date (This corresponds to 25% of the respondents saying that the statement comes true after this date).
Distinct findings of a first hand evaluation of the Times of Occurrences are:
• Differences between first and second rounds o A convergence of the answers can be observed over the two rounds:
this illustrates a greater degree of consensus among the respondents � a desirable and typical phenomenon of the Delphi technique.
o The majority of statements experience a slight shift towards a later Time of Occurrence between the 1st and the 2nd round.
• The degree of consensus on the Time of Occurrence differs strongly from statement to statement.
o The statements with highest degree of agreement among the respondents are �Biomass for central heating and district heating systems is widely used�, with 61% of the respondents expecting a time of occurrence between 2011 and 2020, and the statement on fuel cell driven cars predicting a 20% market share between 2021 and 2030 (57% of respondents).
o Least consensus is found in statements on the practical use of ocean technologies (e.g. tidal, currents, and wave), in statements referring to hydrogen production, and in the statements �Large international grids allow energy production based on regional renewables� and � Nuclear power plants based on passive safe reactor types are in practical use�. In these fields the uncertainty of the expert�s predictions is highest.
30 EurEnDel � Final Report; September 2004
Time of Occurrence
2010 2020 2030 2040 2050 1) Novel production processes Industrial energy consumption in Europe is reduced by 50% per produced unit through novel production processes 2) Intelligent buildings Low-energy buildings with intelligent power systems make up >50% of all new buildings in Europe 3) 20 % FC cars Fuel cell driven cars reach a European market share of 20% 4) 25% Bio-fuels Bio-fuels will have a European market share of >25% in the road transport sector 5) 15% Freight on rail Improved logistics based on information and communication technologies raise the railway's market share in Europe's freight transport to 15% [1990: 11%, today: 8%]. 6) H2 (first round only)* Hydrogen used as an energy carrier constitutes a significant part of the energy system.
6a) H2 from diverse sources (second round only)* Hydrogen produced from diverse sources and used as an energy carrier constitutes a significant part of the energy system.
6b) H2 from RES (second round only)* Hydrogen produced solely from renewables and used as an energy carrier constitutes a significant part of the energy system.
7) Energy storage in RES Advanced energy storage technologies are widely used in renewable energy supply systems
8) LNG terminals and pipelines Liquefied Natural Gas terminals and advanced high-pressure pipeline systems permit to multiply Europe�s gas imports by 10 [EU-15 demand 1999 is 386 bcm (billion cubic meters); 40% imported]
N "Never"577 5%386 2%58 5%
575 1%378 1%52 0%
589 3%387 1%54 2%
576 21%377 15%50 26%
390 14%284 10%10 2%
591 4%
386 3%67 5%
379 10%74 19%
573 3%366 1%69 3%
429 31%297 42%16 24%
= 1st round (Experts/Knowledgeable/Familiar) = 2nd round (Experts/Knowledgeable/Familiar) = 2nd round Experts only 25% quartile mean value 75% quartile
Main Survey Results 31
2010 2020 2030 2040 2050 9) Superconductive materials Widespread use of superconductive materials in transformers and generators 10) 30% distributed energy systems Distributed energy systems (< 10 MW) contribute with >30% to Europe's electricity supply [Today it is 14%] 11) International grids Large international grids allow an energy production based on regional renewables (solarthermal power from North Africa, biomass from Central Europe etc.) 12) Plasma confinement tech Plasma confinement technologies for nuclear fusion are in practical use 13) Safe fission Nuclear power plants based on passive safe reactor types are in practical use 14) 25% RES Renewable energy sources cover 25% of Europe�s total energy supply [Today it is 6%]
15) 5% PV Photovoltaic cells contribute with >5% of European electricity generation [Today it is 0.15%] 16) Ocean tech Ocean technologies (e.g. tidal, currents, and wave) are in practical use 17) Biomass Biomass for central heating and district heating systems is widely used 18) CO2 capture and sequestration CO2 capture and sequestration from fossil fuel power plants is in practical use
19) H2 from bio (second round only)* Biological or bio-chemical production of hydrogen are in practical use
N "Never"376 5%276 2%16 2%
588 7%376 4%99 2%
554 19%363 16%55 14%
333 23%231 22%9 5%
353 20%263 19%28 5%
616 5%402 4%142 9%
569 13%376 9%61 16%
465 10%308 6%20 3%
589 9%384 5%95 7%
503 11%345 12%50 7%
278 6%20 3%
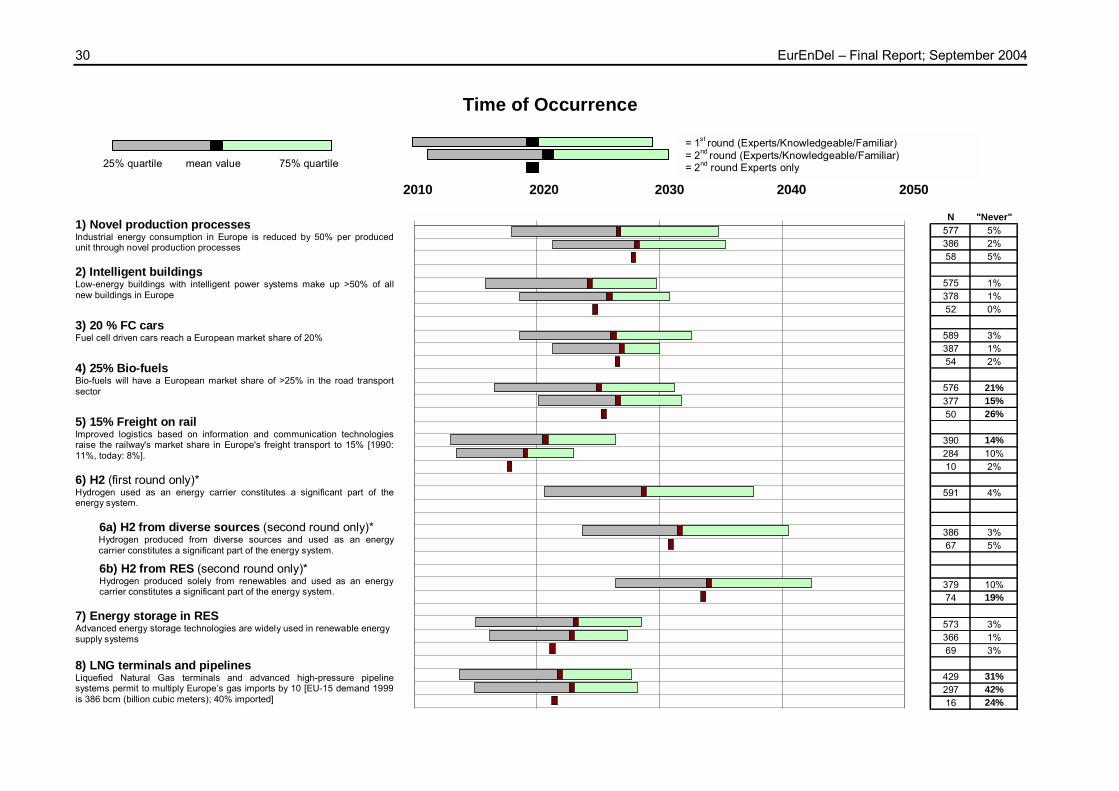
Graph 4-5: Mean value of Time of Occurrence of Delphi statements for first and second round answers, including answers of “experts only” for the second
round. Left hand side of the bar indicates 25% quartile and right hand side 75% quartile. *(Statement 6 was split into statement 6A and 6b in the second round, statement 19 was newly introduced in the 2nd round)

32 EurEnDel � Final Report; September 2004
• Likelihood of Occurrence The overall likelihood of occurrence can be estimated by the share of �never� answers (a low percentage indicating a high likelihood that the statement will eventually become true). The shares of never answers range from 0% to 22%.10 Especially noteworthy are:
o Although there is a great consensus on when plasma confinement technologies for nuclear fusion could be available (statement 12) there is a strong disagreement whether or not this will ever be the case. The perceptions of the respondents show quite strong country specific differences on this issue (see chapter 4.5).
o A similar picture evolves for nuclear fission where almost 20% of the respondents consider the construction of passively safe reactors in Europe as unrealistic.
o On statement 4 a large number of respondents doubt the feasibility of a 25% share of biofuels in road transport. As a major limiting factor the overall biomass potential is mentioned.
• Respondents with high expertise The �experts� always expect the occurrence for the stated technologies to be earlier than the overall group of respondents. This phenomenon of professional optimism is frequently found in the literature (Häder and Häder 2000). However on some issues the difference between specialised experts in a certain field and the overall respondents is very distinct:
o Noteworthy are the two nuclear statements where the experts are much more optimistic that the technologies will come at all (see lower never share of experts in statements 12 & 13). A similar tendency can be observed for the statement on CO2 sequestration
o The contrary holds true for the photovoltaic statement (no. 15) where a higher share of experts considers a 5% PV contribution to Europe�s electricity supply unrealistic, compared to the totality of the respondents.
Important findings by technology field: • Energy Demand
On both statements on energy demand there is a great consensus by the survey participants. Doubling the energy efficiency in industrial production is considered to be likely before 2030 by 65% of the respondents. An even higher percentage, 75% of the respondents anticipate 50% of all new buildings in Europe to be low energy buildings before 2030. Only a marginal share (1 to 2%) consider these developments to be totally unlikely.
10 The statement on natural gas infrastructure development is excluded from most parts of the evaluation due to defective formulation which made the interpretation of the corresponding results problematical. Here the �never� share was even higher (42%). However this is due to the fact that is ill formulated altogether (a 10 fold increase in natural gas imports would be too high). Responses on natural gas development from the second part of the questionnaire could nevertheless be retained.

Main Survey Results 33
• Transport A 20% market share of fuel cell driven cars is expected by the respondents in the late 2020s. Note that this is well before hydrogen is expected to play a significant role in Europe�s energy system. On the issue of a 25% share of biofuels for transportation the expert�s opinions are divided: The majority expects this to happen before 2030. However quite a large share (15%) of respondents consider 25% a too larger number. Comments indicate that the major restraining factor was the limited overall potential for biomass production
• Storage, Distribution and Grids There is a large consensus that the trend towards a more decentralised electricty supply prevails. A 30% share of decentralised generation is expected by 2020. In contrast there is quite a controversy when and if at all large international grids allow for an energy transportation of regionally produced renewable energy. 16% of the experts do not believe that e.g. solar-thermal power from North-Africa or Biomass from Central Europe will be used beyond for regional supply. Energy storage is considered to be in widespread use by the early 2020s to support renewable energy systems. Hydrogen, as one storage option is considered to constitute a significant part only after 2030.
• Energy Supply The respondents are quite split concerning the future of nuclear energy. Both statements, on fusion and on fission, received the highest �never� shares. Those experts who consider these technologies to come anticipate to passive safe reactor types around 2025. Fusion is considered a very long-term option. Plasma confinement technologies, a prerequisite for fusion reactors, are not considered to be in practical use before 2040. The perception of the respondents revealed certain country specific differences on this issue, which are further analysed section 3.3. As for renewable energy sources there is little doubt that a 25% share of Europe�s total energy supply is possible. 66% of the respondents consider it likely that this share is reached before 2030. A high contribution of photovoltaic to this share is a truly long-term goal. The majority of respondents consider a 5% contribution of PV to Europe�s electricity supply realistic only after 2030.
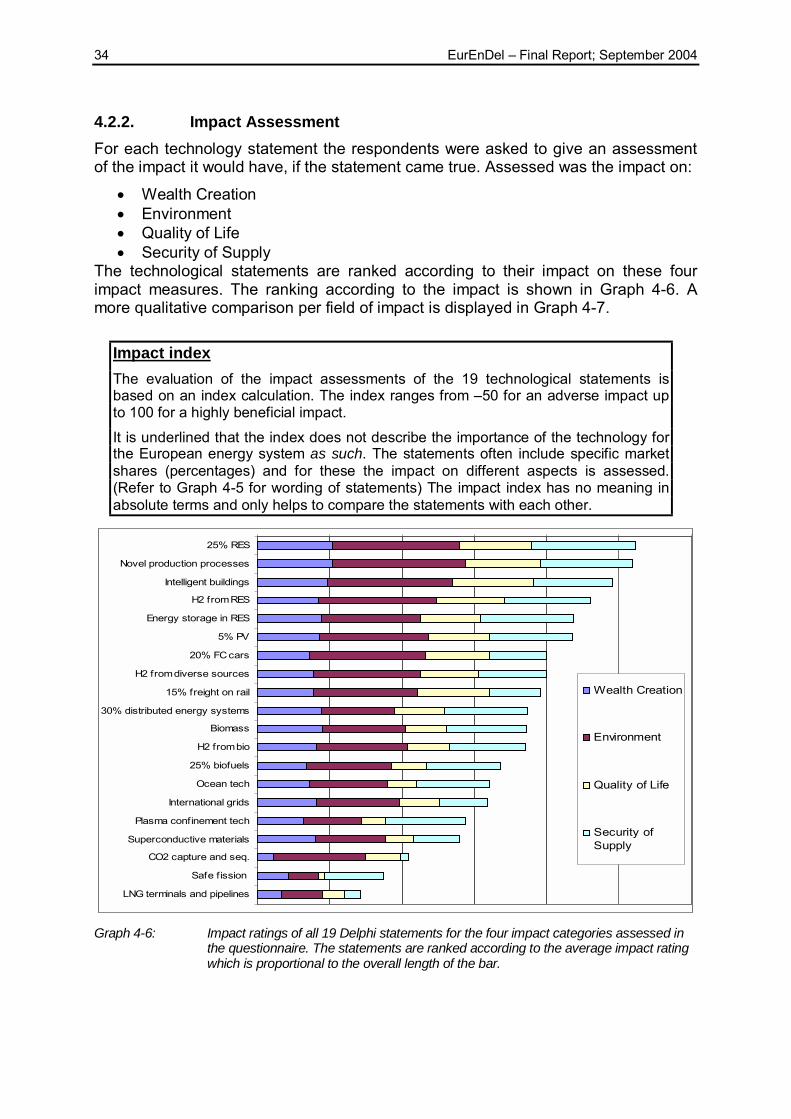
34 EurEnDel � Final Report; September 2004
4.2.2. Impact Assessment For each technology statement the respondents were asked to give an assessment of the impact it would have, if the statement came true. Assessed was the impact on:
• Wealth Creation • Environment • Quality of Life • Security of Supply
The technological statements are ranked according to their impact on these four impact measures. The ranking according to the impact is shown in Graph 4-6. A more qualitative comparison per field of impact is displayed in Graph 4-7.
Impact index The evaluation of the impact assessments of the 19 technological statements is based on an index calculation. The index ranges from �50 for an adverse impact up to 100 for a highly beneficial impact. It is underlined that the index does not describe the importance of the technology for the European energy system as such. The statements often include specific market shares (percentages) and for these the impact on different aspects is assessed. (Refer to Graph 4-5 for wording of statements) The impact index has no meaning in absolute terms and only helps to compare the statements with each other.
25% RES
Novel production processes
Intelligent buildings
H2 from RES
Energy storage in RES
5% PV
20% FC cars
H2 from diverse sources
15% freight on rail
30% distributed energy systems
Biomass
H2 from bio
25% biofuels
Ocean tech
International grids
Plasma confinement tech
Superconductive materials
CO2 capture and seq.
Safe fission
LNG terminals and pipelines
Wealth Creation
Environment
Quality of Life
Security ofSupply
Graph 4-6: Impact ratings of all 19 Delphi statements for the four impact categories assessed in
the questionnaire. The statements are ranked according to the average impact rating which is proportional to the overall length of the bar.

Main Survey Results 35
Impact on Security of Supply
020406080
1001. Novel production processes
2. Intelligent buildings3. 20% FC cars
4. 25% biofuels
5. 15% freight on rail
6a. H2 from diverse sources
6b. H2 from RES
7. Energy storage in RES
8. LNG terminals and pipelines9. Superconductive materials
10. 30% distributed energysystems
11. International grids12. Plasma conf inement tech
13. Safe fission
14. 25% RES
15. 5% PV
16. Ocean tech
17. Biomass
18. CO2 capture and seq.19. H2 from bio
Impact on Quality of Life
020406080
1001. Novel production processes
2. Intelligent buildings3. 20% FC cars
4. 25% biofuels
5. 15% freight on rail
6a. H2 f rom diverse sources
6b. H2 f rom RES
7. Energy storage in RES
8. LNG terminals and pipelines9. Superconductive materials
10. 30% distributed energysystems
11. International grids12. Plasma confinement tech
13. Safe fission
14. 25% RES
15. 5% PV
16. Ocean tech
17. Biomass
18. CO2 capture and seq.19. H2 f rom bio
Impact on Environment
020406080
1001. Novel production processes
2. Intelligent buildings3. 20% FC cars
4. 25% biofuels
5. 15% freight on rail
6a. H2 from diverse sources
6b. H2 from RES
7. Energy storage in RES8. LNG terminals and pipelines
9. Superconductive materials10. 30% distributed energy
systems
11. International grids12. Plasma conf inement tech
13. Safe f ission
14. 25% RES
15. 5% PV
16. Ocean tech
17. Biomass18. CO2 capture and seq.
19. H2 from bio
Impact on Wealth Creation
020406080
1001. Novel production processes
2. Intelligent buildings3. 20% FC cars
4. 25% biofuels
5. 15% freight on rail
6a. H2 f rom diverse sources
6b. H2 f rom RES
7. Energy storage in RES
8. LNG terminals and pipelines9. Superconductive materials
10. 30% distributed energysystems
11. International grids12. Plasma confinement tech
13. Safe f ission
14. 25% RES
15. 5% PV
16. Ocean tech
17. Biomass
18. CO2 capture and seq.19. H2 f rom bio
Graph 4-7: Comparison of impacts of technological developments on Wealth Creation,
Environment, Quality of Life and Security of Supply
36 EurEnDel � Final Report; September 2004
The most important findings are: • A share of 25% renewables for Europe�s total energy supply was considered
to be overall the most beneficial in the four areas considered. In addition to the positive ecological impact, the respondents highlighted the strong contribution to security of supply.
• Following closely were the two statements on efficient use of energy � the statement on novel production processes and the statement on low-energy buildings.
• The two statements on nuclear energy (safe passive reactors and plasma confinement technologies for nuclear fusion) received low overall ratings. The greatest positive contribution of these technologies was seen in the area of security of supply. But even in this field, these statements had only average impact, the crucial factor being the lack of public acceptance of nuclear fission.
• CO2 capture and sequestration in fossil fuel plants was assessed to be beneficial only for environmental reasons, but generally obtained very low ratings.
• The statements on fuel cells and hydrogen were generally perceived as providing only medium benefits. In the first round survey, statement 6 did not distinguish between deriving H2 from diverse sources (6A) or from renewable sources (6B) and was ranked in the higher end (rank 6). The result of splitting the statement into two in the second round (No. 6A H2 produced from diverse resources, and No. 6B H2 produced from RES) is that No. 6A is ranked number 9 whereas No. 6B is ranked as number 4.
An in depth impact assessment is presented in chapter 5. It is important to mark that the biggest differences with respect to the national origin of the respondents appear in the field of impact assessment.
4.2.3. Actions Needed The respondents were asked to assess which of the following actions could promote an early occurrence of the statement:
• Increase in Basic R&D
• Increase in Applied R&D
• Fiscal Measures
• Regulation • Public Acceptance
The percentages of respondents who consider an action suitable to promote a statement are displayed in Graph 4-8. Since more than one action could be ticked off for each question the percentages do not add up to 100.

Main Survey Results 37
Fiscal Measures
0%
20%
40%
60%
80%
100%Novel production processes
Intelligent buildings20% FC cars
25% biofuels
15% freight on rail
H2 from diverse sources
H2 from RES%
Energy storage in RES
LNG terminals and pipelinesSuperconductive materials
30% distributed energysystems
International gridsPlasma confinement tech
Safe fission
25% RES
5% PV
Ocean tech
Biomass
CO2 capture and seqH2 from bio
Public Acceptability
0%20%40%60%80%
100%Novel production processes
Intelligent buildings20% FC cars
25% biofuels
15% freight on rail
H2 from diverse sources
H2 from RES%
Energy storage in RESLNG terminals and pipelines
Superconductive materials30% distributed energy
systems
International gridsPlasma confinement tech
Safe fission
25% RES
5% PV
Ocean tech
BiomassCO2 capture and seq
H2 from bio
Regulation
0%20%40%60%80%
100%Novel production processes
Intelligent buildings20% FC cars
25% biofuels
15% freight on rail
H2 from diverse sources
H2 from RES%
Energy storage in RESLNG terminals and pipelines
Superconductive materials30% distributed energy
systems
International gridsPlasma confinement tech
Safe fission
25% RES
5% PV
Ocean tech
BiomassCO2 capture and seq
H2 from bio
Increase in Basic R&D
0%
20%
40%
60%
80%
100%Novel production processes
Intelligent buildings20% FC cars
25% biofuels
15% freight on rail
H2 from diverse sources
H2 from RES%
Energy storage in RES
LNG terminals and pipelinesSuperconductive materials
30% distributed energysystems
International gridsPlasma confinement tech
Safe fission
25% RES
5% PV
Ocean tech
Biomass
CO2 capture and seqH2 from bio
Increase in Applied R&D
0%
20%
40%60%
80%
100%Novel production processes
Intelligent buildings20% FC cars
25% biofuels
15% freight on rail
H2 from diverse sources
H2 from RES%
Energy storage in RES
LNG terminals and pipelinesSuperconductive materials
30% distributed energysystems
International gridsPlasma confinement tech
Safe fission
25% RES
5% PV
Ocean tech
Biomass
CO2 capture and seqH2 from bio
Graph 4-8: Comparison of actions needed to enhance the likelihood of occurrence of the Delphi
statements.
Just by the shapes of the covered areas in the spider graphs it can be concluded that the respondents consider quite different measures appropriate to promote the individual technologies. Important findings are:
• The three statements with the highest degree of consensus among the respondents on the necessity of basic research are:
o Statement 9 Superconductive materials (84%), o Statement 12 Plasma confinement tech (92%) and o Statement 19 H2 from bio (83%)
while o Statement 2 Intelligent buildings (11%), o Statement 5 15% freight on rail (4%), o Statement 8 LNG terminals and pipelines (7%),
38 EurEnDel � Final Report; September 2004
o Statement 10 30% distributed energy systems (11%) and o Statement 17 Biomass (8%)
have very few respondents pointing towards an increase in Basic research as a required action for realisation.
• Increase in applied R&D is the category that is considered most relevant by the respondents across all statements. For example 97% of all respondents agree that statement 16 (Ocean technologies) requires increased Applied R&D. Statements 1 (Novel production processes), 3 (20% FC cars), 6A (H2 from diverse sources), 7 (Energy Storage in RES), 9 (Superconductive materials) and 15 (5% PV) all have 90% or more of the respondents agreeing on Applied R&D as an action that will enhance the likelihood of occurrence. The only statement with a relatively low number (37%) of respondents suggesting increased Applied R&D is statement 5 (15% freight on rail).
• The evaluation of the need for fiscal measures to promote the technology statement is quite varied. A great majority of respondents (above 80%) encourage this for statements 4 (25% biofuels), 5 (15% freight on rail), 10 (30% distributed energy systems), 15 (25% RES) and 17 (Biomass). In the low end are statements 9 (Superconductive materials), 12 (Plasma confinement tech) and 13 (safe fission), all with support of 8% of the respondents. An explanation for the low number of respondents could be the very high percentages in either �Increase in Basic R&D� or �Increase in Applied R&D� of these statements, indicating that they are far from actual market introduction.
• Regulation is considered relevant to statements 2 (Intelligent buildings), 5 (15% freight on rail) and 10 (30% distributed energy systems) by 80%, 79% and 78% of the respondents respectively. Only 6% finds Regulation a necessary precondition for statement 12 (Plasma confinement technologies) and only 15% for statement 9 (Superconductive materials). Again, the low percentages reflect high percentages in Basic and Applied R&D, and thus distant from market introduction.
The need for actions addressing public acceptability is only supported by a majority of respondents (67%) in the case of statement 13 (Safe fission). The other statement involving nuclear power, statement 12 (Plasma confinement tech), only has 27% of the respondents pointing towards Public Acceptability as an action requiring issue. This may be related to the long term realisation perspective of this technology. Only 1% of the respondents find that statement 9 (Superconductive materials) has need for action addressing Public Acceptability.

Main Survey Results 39
4.3. Wildcards In the scenario technique wildcards are events that have a relatively low chance of occurrence but would have a very significant impact on the system in question. Within EurEnDel technological breakthroughs with high impact on the energy system as a whole were analysed. In the first round of the EurEnDel Delphi survey the respondents were invited to suggest energy technologies they would consider to be possible wildcards. Most suggestions referred to leaps in established technologies. In contrast to these rather evolutionary developments three possible wildcards - ambient superconductivity, cold fusion and space power � were selected from the suggestions and introduced in the second round of the survey. The respondents were asked to assess probability and potential impact of the wildcards.
Wild card probability
0% 10% 20% 30% 40% 50% 60% 70% 80% 90% 100%0% 10% 20% 30% 40% 50% 60% 70% 80% 90% 100%
Space power
Cold fusion
Ambientsuperconductivity
likelyunlikelyextremely unlikelyimpossible
Wild card impact
Space power
Cold fusion
Ambientsuperconductivity
100%0% 20% 40% 60% 80% 100%0% 20% 40% 60% 80%
revolutionmajor impactminor impactno impact
Graph 4-9: Wildcard probability within the next 20 years
Graph 4-10: Wild card impact
The results can be summarised as follows: • Ambient temperature superconductivity has first rank of the wildcards. Only
4% of the respondents find this technology entirely impossible and still 35% find it likely to happen (see Graph 4-9).
• Cold nuclear fusion is considered to have the highest potential impact ( Graph 4-10), but is assessed to be much more unlikely than Ambient temperature superconductivity.
• The utilisation of Space power is considered to be the most unlikely Wildcard as well as having the least potential impact on the energy system. Many expert�s comments point out that it would be by fat too costly.
The wild cards have not explicitly been incorporated into the further evaluation. They were considered too unlikely to base one of the scenarios on a breakthrough in one of the fields. However it should be kept in mind that such wildcards can have a major impact on the whole energy system and consequently a breakthrough could render quite many of the Delphi predictions incorrect. From the above, it can be concluded that the developments in the field of superconductivity should be watched closely. While the developments anticipated in the corresponding Delphi statements were considered as having a rather moderate impact, ambient superconductivity has a
40 EurEnDel � Final Report; September 2004
quite high potential and was considered extremely unlikely or impossible by only 25% of the respondents.
Conclusions As a general outcome from the wildcard exercise it can concluded that the energy system of 2030 will to a large extend be based on technologies known today. The only �real� wildcards are the three discussed above. All the other comments and suggestion of the experts in this section refer to technologies already quite well known � e.g.: photovoltaics or fuel cells � where the respondents pointed out that innovation leaps in these fields could lead to major changes in the future energy system. As there are no hints to new technological fields where they expect extreme innovations for the energy system, it can be considered quite likely that Europe�s energy system of the year 2030 will largely be dominated by technologies known or in the laboratory today.

Main Survey Results 41
4.4. Societal Visions In the second part of the questionnaire short descriptions of three societal visions were given and the respondents were asked to assess the importance of certain energy technologies and innovations for the energy systems of each vision.11
Vision I – Individual Choice 2030: Individual liberty is the prime societal value in Europe. Consequently politics sets the framework for liberalised markets with a strong emphasis on consumers� sovereignty. Transparency of costs and free competition ensure that people have the possibility to choose products and services according to their individual needs and personal preferences. The portfolio ranges from low-cost fulfilment of basic needs to high comfort or ecological products at high costs.
Vision II – Ecological Balance To live a life in balance with nature is the slogan that best describes the predominant European value in 2030. Accordingly the protection of the ecosystem is the major policy goal. It embodies both local (air quality, acid rain, etc.) and global (climate change, biodiversity, etc.) dimensions. The �polluter pays� principle is strictly enforced. Higher costs for ecological sound solutions are widely accepted by the consumers. This has led to the �greening� of companies on the producer side. Following the precautionary principle the use of resources and the emission of pollutants have been reduced dramatically. Industrial processes are being transformed into closed cycle processes.
Vision III – Social Equity The pursuit of greatest possible equity is the primary value in Europe in 2030. Consequently European policy strives to minimise income disparities and to combat social exclusion. The growth of the European Union, namely the accession of the central and eastern European countries, raises the urgent need for establishing a social balance within Europe. To promote social cohesion within and between regions, European regulatory authorities set up a strong communal social framework, which explicitly allows for regional solutions. In the private sector concepts of social accountability are widely applied. Responsible industries contribute their share to enhance the employment intensity of economic growth. Society is willing to socialize costs that go along with burden sharing and adopting measures that promote equity.
11 In addition to the here presented visions in the Delphi questionnaire consequences for the energy sectors were listed as bullet points to stir the experts imagination. They are presented in [Jørgensen et. al 2004] which is available from www.eurendel.net

42 EurEnDel � Final Report; September 2004
Index definitions The respondents were asked to assess the importance of certain energy sources and technologies as well as economical instruments and innovations for the energy systems of each vision. Technology / energy source index: The index of the technology / energy source assessment is based on total number of respondents and weighted values of 100 (very important), 50 (important), 25 (low importance) and 0 (unimportant)). Instruments / innovation index The innovation index is based on total numbers of respondents and weighted values of 100 (highly beneficial), 50 (beneficial), -50 (adverse), and -100 (highly adverse.
4.4.1. Major Findings on Technologies and Energy Sources The respondents were asked to assess the importance of certain energy sources and technologies for the energy systems of each vision.
• As can be seen in Graph 4-11 the major difference appears between the vision of Individual Choice and the vision of Ecological Balance. Under the vision of Social Equity the ratings of the importance of the various energy technologies and sources come close to the average rating which was calculated from the means over all visions. Although there are significant differences between the three visions they are not drastic (refer to Graph 4-11: the shape of the areas covered is generally quite similar). The EurEnDel respondents clearly state preferences but would not go as far as suggesting totally different energy portfolios to comply with the demands of the individual visions.
• Significant differences in terms of which energy technologies are considered most important are most pronounced in the assessment of the renewable energy sources. All renewables are rated much higher in the vision of Ecological Balance compared to Social Equity. In return Natural Gas Import by Pipeline is ranked higher in Individual Choice than in Ecological Balance and Social Equity.
• The undisputed top rank variable when looking at the average of the three visions is Energy Conservation Technologies, as it holds the top rank in all of the three societal visions, followed by Demand Side Management Systems and Biomass (see Table 4-2).
• In the societal vision of Individual Choice the top three variables are Energy Conservation Technologies, Fuel cells and Demand Side Management Systems. The lowest ranked are Ocean Power, Geothermal and CO2 Sequestration. Based on the ranking in the Individual Choice vision, the energy technology matters more than the origin (whether renewable or not) of the energy.

Main Survey Results 43
• In the societal vision of Ecological Balance the message from the respondents is clearly that fossil and nuclear energy source are rated low. The top ranks are Energy Conservation Technologies, Wind and Biomass.
• ·In the vision of Social Equity, Biomass and Demand Side Management Systems are considered most important in addition to Energy Conservation Technologies. Nuclear Fission is by far the least valued energy source in this vision.
Table 4-2: Comparison of societal visions
Energy source/technology Individual Choice
Rank/index
Ecological Balance
Rank/index
Social Equity
Rank/index
Average
Rank/index
Energy conservation technologies 1 / 67 1 / 89 1 / 69 1 / 75
Demand side management systems 3 / 60 6 / 78 3 / 64 2 / 67
Biomass 9 / 50 3 / 83 2 / 67 / 67
Fuel cells 2 / 65 5 / 80 8 / 54 4 / 66
Wind 9 / 50 2 / 86 4 / 62 / 66
Alternative transport fuels 4 / 58 7 / 77 5 / 56 6 / 64
Energy storage for electricity power 5 / 57 9 / 72 5 / 56 7 / 62
Photovoltaics 11 / 46 4 / 81 5 / 56 8 / 61
H2 production and storage 8 / 54 8 / 75 9 / 50 9 / 60
Pan European electricity and gas grid 6 / 56 13 / 47 9 / 50 10 / 51
CO2 sequestration 14 / 36 10 / 64 14 / 37 11 / 46
Natural gas import by pipeline 7 / 55 14 / 37 11 / 43 12 / 45
Geothermal 15 / 31 11 / 60 12 / 39 13 / 43
Ocean power 16 / 29 12 / 55 15 / 34 14 / 40
Natural gas import liquefied 12 / 45 15 / 33 13 / 38 15 / 39
Nuclear fission 13 / 37 16 / 30 16 / 25 16 / 31

44 EurEnDel � Final Report; September 2004
Vision 1: Individual Choice
02040
6080
100Nuclear f ission
Natural gas import by pipeline
Natural gas import liquef ied
Biomass
Photovoltaics
Wind
Geothermal
Ocean pow erH2 production and storage
Fuel cells
CO2 sequestration
Energy conservation technologies
Demand side management systems
Energy storage for electricity pow er
Pan European electricity and gas grid
Alternative transport fuels
Individual choice Average
Vision 2: Ecological Balance
020406080
100Nuclear fission
Natural gas import by pipeline
Natural gas import liquef ied
Biomass
Photovoltaics
Wind
Geothermal
Ocean pow erH2 production and storage
Fuel cells
CO2 sequestration
Energy conservation technologies
Demand side management systems
Energy storage for electricity pow er
Pan European electricity and gas grid
Alternative transport fuels
Ecological balance Average
Vision 3: Social Equity
020406080
100Nuclear f ission
Natural gas import by pipeline
Natural gas import liquef ied
Biomass
Photovoltaics
Wind
Geothermal
Ocean pow erH2 production and storage
Fuel cells
CO2 sequestration
Energy conservation technologies
Demand side management systems
Energy storage for electricity pow er
Pan European electricity and gas grid
Alternative transport fuels
Social equity Average
Graph 4-11 Comparison of societal visions - importance of certain energy sources and technologies for the energy systems of each vision. As a reference the average over all three visions is given. For definition of index refer to p. 42
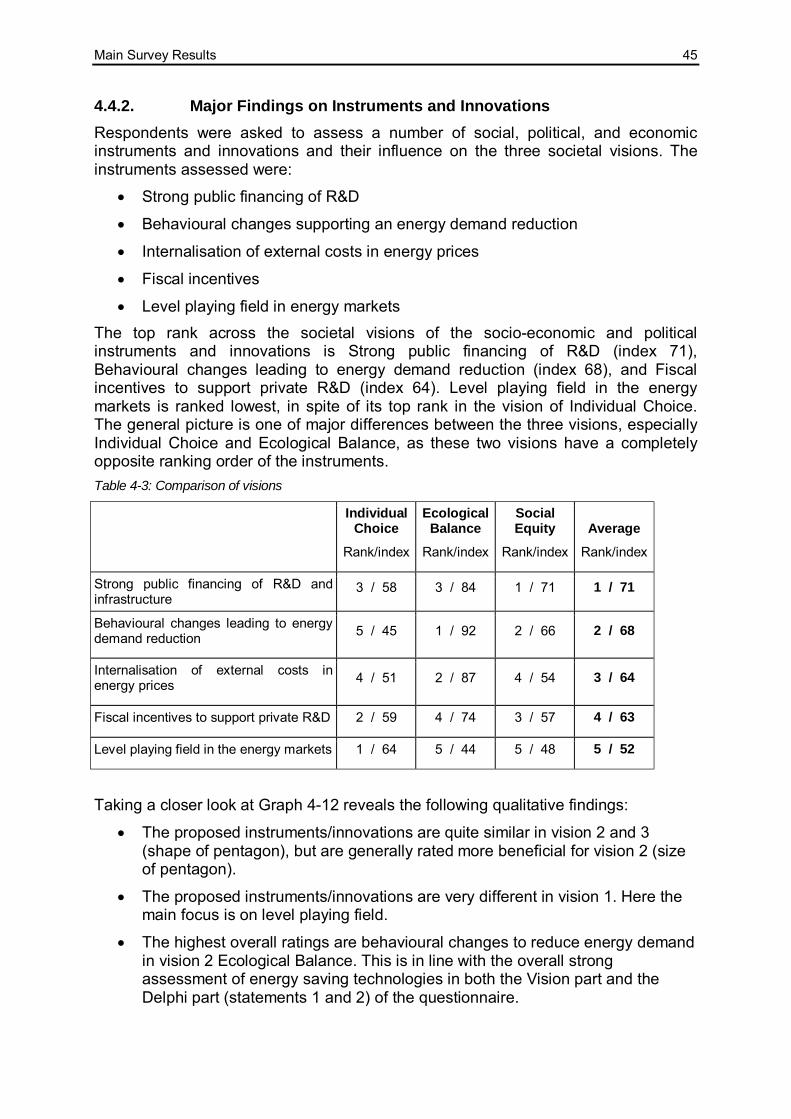
Main Survey Results 45
4.4.2. Major Findings on Instruments and Innovations Respondents were asked to assess a number of social, political, and economic instruments and innovations and their influence on the three societal visions. The instruments assessed were:
• Strong public financing of R&D
• Behavioural changes supporting an energy demand reduction
• Internalisation of external costs in energy prices
• Fiscal incentives
• Level playing field in energy markets The top rank across the societal visions of the socio-economic and political instruments and innovations is Strong public financing of R&D (index 71), Behavioural changes leading to energy demand reduction (index 68), and Fiscal incentives to support private R&D (index 64). Level playing field in the energy markets is ranked lowest, in spite of its top rank in the vision of Individual Choice. The general picture is one of major differences between the three visions, especially Individual Choice and Ecological Balance, as these two visions have a completely opposite ranking order of the instruments. Table 4-3: Comparison of visions
Individual Choice
Rank/index
Ecological Balance
Rank/index
Social Equity
Rank/index Average
Rank/index
Strong public financing of R&D and infrastructure
3 / 58 3 / 84 1 / 71 1 / 71
Behavioural changes leading to energy demand reduction 5 / 45 1 / 92 2 / 66 2 / 68
Internalisation of external costs in energy prices 4 / 51 2 / 87 4 / 54 3 / 64
Fiscal incentives to support private R&D 2 / 59 4 / 74 3 / 57 4 / 63
Level playing field in the energy markets 1 / 64 5 / 44 5 / 48 5 / 52
Taking a closer look at Graph 4-12 reveals the following qualitative findings:
• The proposed instruments/innovations are quite similar in vision 2 and 3 (shape of pentagon), but are generally rated more beneficial for vision 2 (size of pentagon).
• The proposed instruments/innovations are very different in vision 1. Here the main focus is on level playing field.
• The highest overall ratings are behavioural changes to reduce energy demand in vision 2 Ecological Balance. This is in line with the overall strong assessment of energy saving technologies in both the Vision part and the Delphi part (statements 1 and 2) of the questionnaire.
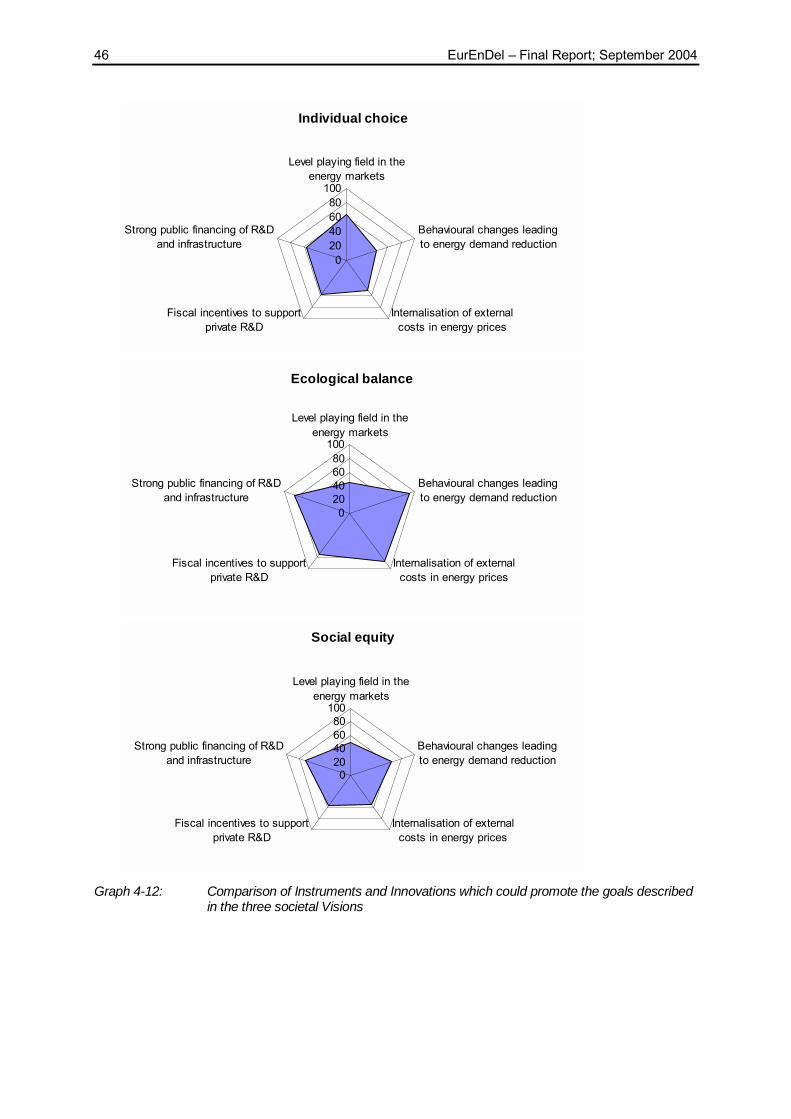
46 EurEnDel � Final Report; September 2004
Individual choice
020406080
100
Level playing field in theenergy markets
Behavioural changes leadingto energy demand reduction
Internalisation of externalcosts in energy prices
Fiscal incentives to supportprivate R&D
Strong public financing of R&Dand infrastructure
Ecological balance
020406080
100
Level playing field in theenergy markets
Behavioural changes leadingto energy demand reduction
Internalisation of externalcosts in energy prices
Fiscal incentives to supportprivate R&D
Strong public financing of R&Dand infrastructure
Social equity
020406080
100
Level playing field in theenergy markets
Behavioural changes leadingto energy demand reduction
Internalisation of externalcosts in energy prices
Fiscal incentives to supportprivate R&D
Strong public financing of R&Dand infrastructure
Graph 4-12: Comparison of Instruments and Innovations which could promote the goals described
in the three societal Visions

Main Survey Results 47
4.5. Country Specific Analysis The objective of the EurEnDel Delphi is to investigate energy futures on a European level. The technology statements and societal visions are European in their scope and the nationality of the respondents should not be relevant as such an expert should be expert irrespectively of his/her nationality and country of residence. However, national circumstances cannot be ruled out a priori. Therefore country specific analyses of the results were conducted following two lines:
• For some countries the return rates were high enough to conduct in-depth statistical analysis and to search for national peculiarities and correlations between the origin of the experts and their answers.
• On the other hand the representation of experts is not proportional to the population of their countries. It had to be checked therefore, whether or not national �biases� would influence the overall results of the survey.
A country specific analysis was run for the answers of German, Spanish and Polish respondents. Germany and Spain are the two EU15 countries with the strongest representation of approximately 70 respondents each. Poland was represented by approximately 30 respondents and was picked as an example for a New Member State. On most issues covered in the EurEnDel survey there are only minor differences in the answering patterns of respondents which are due to their national origin. However six issues show some deviations that are noteworthy:
• 25% Biofuels The biggest differences on the anticipated Time of Occurrence appear in the judgments of when a 25% share of biofuels for road transportation will be reached. Here especially Spanish and Polish respondents point to an earlier time horizon. It has to be noted however, that this statement is generally viewed as very controversial. A great number of experts doubt that the figure of 25% is feasible at all. The deviation of approximately four years is still relatively small compared to the time horizon of 20 to 25 years.
• Ocean Technologies The question when ocean technologies will be in practical use is the one with the second biggest differences with regards to the anticipated Time of Occurrence. Here the assessment of the Spanish respondents shifts the overall assessment to a later time horizon. However, it has to be pointed out that there generally exists a great uncertainty about this technology by the experts participating in the EurEnDel survey. The statistical spread in the judgement on the time horizon is quite high. And the number of respondents who consider themselves to be an expert in this field (N=20) is one of the lowest of all statements.
• Nuclear Fusion The answering patterns on the statement about Plasma Confinement Technologies for nuclear fusion show strong differences with regards to national origin. The time horizon itself is not so much subject to country specific deviation, but the answer to the question whether or not the technology will be developed at all depends highly on the origin of the respondent. Here the countries examined in detail take pretty much antagonist

48 EurEnDel � Final Report; September 2004
positions: on the one hand there is a large share of �never� answers among the German respondents. In contrast there is basically no doubt among the Spanish and Polish respondents. The average over all other countries is basically very similar to the average over these three countries. Similar patterns appear in the assessment of the impact. The Polish and Spanish respondents anticipate a much more positive impact than experts from all other countries. The average over the German respondents gives the opposite picture.
• Nuclear Fission A similar picture, but not as pronounced, appears on the issue of Safe Fission. An analysis of the Time of Occurrence answers shows two peaks: one in the time range 2021-2030 and a smaller in �never�. This could be interpreted as: �the technology could be available by the year x � if the corresponding political choice is made�. Whether or not the respondents consider this choice likely also seems to depend on their origin. However, the assessment of the time of occurrence is rather independent of their national background.
• Natural Gas In the societal visions part the Spanish respondents rate the contribution of liquefied natural gas in each of the visions higher than the average does. In contrast the German respondents rate it rather lower. This tendency is also mirrored in the corresponding statement on gas imports (statement 8) where the Spanish (and Polish) respondents anticipate more positive impacts in all areas than the German respondents do. It has to be mentioned that on this statement the differences between the EU33 respondents and those from other countries are most pronounced. The respondents from other countries anticipate a more positive impact.
• CO2 sequestration The country specific findings on CO2 sequestration are quite similar to those in the field of natural gas. The Spanish respondents rate the impact of CO2 sequestration more positively than the average. Correspondingly they also give a higher rating to CO2 sequestration in the societal vision. So, in this field the strong representation of Spanish experts may have shifted the overall results slightly towards a more positive assessment of the impacts. However, generally the impact of CO2 sequestration is not assessed very positively compared to the anticipated impact of other technologies. Therefore the overall findings of EurEnDel mirror the European perspective quite well. It has to be noted, however, that the Non-European respondents rate the impacts of CO2 sequestration more positively than those from EU33.
It can be concluded that:
1) The assessment of the Time of Occurrence of the technological Delphi statements is only to a very small degree influenced by the national origin of the respondents. Compared to the overall statistical spread of the answers the deviations due to nationality are minimal in most cases. In this sense our respondents are actually experts and are sharing a common European perspective.

Main Survey Results 49
2) For a few specific statements the Likelihood of Occurrence is assessed very differently by respondents from different countries. This is the case for nuclear, especially nuclear fusion. In fact the answering patterns of the respondents go quite in line with the political priority setting and/or the corresponding political discussions in the respective countries. Since the experts were not only asked to assess the technological feasibility, but to give a statement on whether or not a technology will be in practical use, such political perspectives do have to be taken into account. However, it seems that on politically controversial issues, like nuclear, the respondents tend to take up a rather national and not so much a European perspective.
3) The assessment of impacts of technological developments as well as the assessment of technologies under the premise of a guiding societal vision show a higher degree of differences due to the origin of the respondents compared to the assessment of the Time and Likelihood of Occurrence. An explanation for this could be that the assessment of impacts is to a lesser degree a technical but instead mainly a socio-economic question. Therefore the strong differences of the socio-economic conditions of the European countries are reflected in the different answering patterns of the EurEnDel respondents. Some of the issues can be related to ongoing political discussions in the various countries, as is the case for nuclear. Other issues can rather be related to geographical framework conditions. Examples are the issues of liquefied natural gas (where the Spanish experts see a great need � which corresponds to the fact that Spain has little access to pipelines) or biomass (which is assessed quite positively by Polish respondents � corresponding to the high potential Poland has for biomass use).
As an answer to the question �Are the EurEnDel results representative for all of EU 33?� it can be said that in terms of the time horizons the EurEnDel results do indeed reflect the current judgments of the European energy community. With regards to impact assessments and the social desirability of energy technologies in the energy field it can be stated that generally the EurEnDel results reflect a common European perspective quite well for most areas covered. In the areas discussed above however, the results have to be treated with care.
50 EurEnDel � Final Report; September 2004
4.6. Quantitative Co-Assessment The scope of the quantitative co-assessment was to compare quantitative data drawn from the EurEnDel Delphi and used for the EurEnDel Scenarios with a set of studies based on quantitative modelling. The rationale of this exercise was on one hand to validate the EurEnDel results and on the other hand to contribute to the interpretation of EurEnDel results in comparison to quantitative forecasting. After a short presentation of the reference studies (chapter 4.6.1), an overview on the comparison is given (chapter 4.6.2) in the following. 12
4.6.1. Reference Studies Two quantitative studies were used for the comparison with EurEnDel Delphi results. These were �European Energy and Transport - Trends to 2030� [Mantzos et al. 2003] and the �With climate policies� scenario [Zeka-Paschou 2003]. Both are comparable to the EurEnDel Delphi in geographic terms and in the time frame. Additionally they politically and scientifically broadly acknowledged and thus eligible as reference studies. The Trends 2030 study delivers quantitative results for all single countries that were covered in the analysis, as well as aggregations EU15, EU25 and Europe3013. Generally, the EU25 results were used in the analysis within EurEnDel, as these were best comparable to the results of the EurEnDel Delphi survey. Trends 2030 is a baseline study assuming the continuation of current world energy market structures and taking a conventional view on fossil fuel reserves. For EU25, an average GDP growth of 2.4% pa between 2000 and 2030 is assumed [Mantzos 2003a], [Mantzos et al. 2003]. Furthermore, Trends 2030 is characterised by the fact that it explicitly covers no new policies to reduce greenhouse gas emissions. In order to account for this shortfall in �realism� of Trends 2030 in terms of future climate policies, the �With Climate Policies� (WCLP) scenario [Zeka-Paschou 2003] was chosen, which is used as one of the baseline scenarios in the EU-wide CAFE (Clean Air For Europe) process managed by the European Commission, DG Environment. The WCLP scenario and Trends 2030 are nearly identical. The relevant difference is that WCLP assumes the existence of an EU wide CO2 emissions trading regime as a now greenhouse policy.
4.6.2. Comparison of Results The results of the comparison between the Delphi survey and the reference studies are summarised in Table 4-4. It can clearly be seen that the results of the EurEnDel Delphi are generally more �optimistic� in terms of technical developments and structural changes compared to the reference studies. The ratio between the Delphi energy experts� opinion and the model results, which provides a quantitative measure of the deviation between the two, moves up to >20 for certain statements.
12 More detailed information on the quantitative co-assessment can be found in the Eurendel working paper [Jörß and Wehnert 2004] which is available at www.eurendel.net.
13 EU25 plus Bulgaria, Norway, Switzerland, Romania and Turkey

Main Survey Results 51
No Delphi Statement Time of Occurrence *
Never**
Reference studies: Trends 2030 / WCLP
Comparison Result
Deviation
ratio Demand
1 Industrial energy consumption in Europe is reduced by 50% per produced unit through novel production processes
2028 (2021 � 2034) 2%
No info on novel production processes; energy intensity reduction 2000 - 2030: 38% (Trends 2030); 39% (WCLP)
Delphi more optimistic than reference studies.
1.3
Transport
3 Fuel cell driven cars reach a European market share of 20%
2027 (2020 � 2032) 1%
Fuel cell cars are not expected to gain significant market share until 2030 primarily due to costs but also lack of fuel supply infrastructure. (Trends 2030)
Delphi much more optimistic than reference study.
> 10
4 Bio-fuels will have a European market share of >25% in the road transport sector
2027 (2018 � 2030) 15% 5% in 2030
(Trends 2030 and WCLP)
Delphi much more optimistic than reference studies.
5
5
Improved logistics based on information and communication technologies raise the railway's market share in Europe's freight transport to 15% [1990: 11%, today: 8%].
2019 (2012 � 2023) 10%
No info on ICT in railways the share of rail freight transport declines from 17.1% (2000) to 11.2% (2030) (excluding short sea shipping) (Trends 2030 and WCLP)
Delphi much more optimistic than reference studies.
-
Storage and Distribution
6a/ 6b
Hydrogen produced from diverse sources (H2 from RES: solely from renewables) and used as an energy carrier constitutes a significant part of the energy system (transport and stationary application)
2031 (2023 � 2040)
(H2 from diverse
sources)
2034 (2026 � 2042)
(H2 from RES)
5% (6a) 19% (6b)
Share of new energies (hydrogen etc.) in final energy demand will rise to 1.4 Mtoe in 2030 (i.e. 0.1%) (Trends 2030)
Delphi much more optimistic than reference study.
> 20
Supply
14 Renewable energy sources cover 25% of Europe�s total energy supply [Today it is 6%]
2028 (2020 � 2033) 4%
"Relatively slow penetration of renewables"; the use of renewables will rise by 74% (Trends 2030) between 2000 and 2030 (WCLP: 106%); the share of renewables in gross inland consumption rises from 5.8% in 2000 to 8.6% (Trends 2030) in 2030 (WCLP: 10.5%)
Delphi much more optimistic than reference studies.
3 / 2.5
15
Photovoltaic cells contribute with >5% of European electricity generation [Today it is 0.15%]
2030 (2023 � 2040) 9%
"Solar photovoltaic energy starts emerging beyond 2020 (accounting for 1.3% of total installed capacity by 2030). (Trends 2030) No data on production shares
Delphi much more optimistic than reference study.
> 10
* (Mean value of the 2nd survey round considering only respondents who classified themselves as either �experts�, �knowledgeable� or �familiar� for the respective topic. The given time range in brackets refers to the lower and the upper quartile. This means that 50% of the respondents expect an occurrence in the given timeframe, 25% expect an earlier, and 25% expect a later occurrence.) ** Share of respondents who consider this statement "never" to become reality
Table 4-4: Overview on comparison results of Delphi statement responses with reference studies
52 EurEnDel � Final Report; September 2004
However, these differences should not be misinterpreted as a lack of expertise on the EurEnDel energy experts� side. There are indications showing that economic quantitative models generally tend to underestimate the potentials of emerging technologies. A comparison of projections of the Annual Energy Outlook 2004 by the US Energy Information Administration [EIA 2003] and a Delphi study by the George Washington University (TechCast Delphi; see [Halal and Kallmeyer 2004]) shows comparable differences to those presented in this report [Laitner 2004]. The fact that previous energy models tended to overestimate future energy demands and underestimated the potentials of new technologies have led to several improvements of quantitative energy models (e.g. the introduction of learning curves). However, the EurEnDel results may indicate that additional ways should be sought for to integrate projections on emerging technologies into quantitative models. Thus, the differences between the EurEnDel Delphi results and the reference scenarios should rather be interpreted as making clear what future developments are realistically achievable, if framework conditions and incentives are set correspondingly.
Comparison of Social and Technological Perspectives 53
5. Comparison of Social and Technological Perspectives »Worldwide demand for cars will never exceed one million - primarily because of a limitation in the number of available chauffeurs .« Market Research Study, Mercedes Benz, 1901
5.1. Introduction The main task of this chapter is to deal with and to discuss together the technology push and the social pull aspects of the EurEnDel project. The task has been achieved in two ways, which are pursued simultaneously by exploiting the large and diversified amount of information granted by the replies to the questionnaire. 14 The first way consists in deeply assessing the energy technology bases of the 3 ideal Societal Visions (2nd Part of the Delphi) and comparing them with the general attitudes of the Societal Visions towards the policies needed to accelerate the development of the technology statements. Both assessments and comparisons are made possible through assuming the existence of (partial) correspondences between some of the items object of questions in the two separate parts of the Delphi questionnaire. The second way aims still to ascertain possible biases between the �technical� needs, requiring the promotion of specific energy technologies, and the �social� factors linked to the process of implementing those policies. However these biases depend now on the fact that the �technical� needs and the problems of implementation stem from two different groups of people. To reach this objective, the analysis compares continuously the assessments made by the self-claimant Experts with those made by the totality of respondents to the Delphi questionnaire (experts; knowledgeable; familiar; as well as unfamiliar). The Experts are assumed to know very well, for each statement, the effects, the times of occurrence and the actions needed to accelerate their expected times of occurrence. The average level of scientific knowledge of the totality of respondents is well lower than that of the Experts for every specific statement, but they are assumed to represent the �Energy Community�, i.e. those people requested to back governments in implementing policies to accelerate the occurrence of technologies, having a better knowledge of the broader framework conditions. Consequently, the comparisons are between the evaluations of the statements on the �technical� basis of the expected social impacts, as made by the Experts, and the evaluations of the same statements on the basis of the policy instruments to obtain them, as made by the Energy Community. Following the literature on political economy, this approach can explain the divergences between targets and instruments, or the so called �feasibility gaps�.
14 All the chapter goes along the already known results of the Delphi, focusing on possible sources of changes with respect to the figures of the chap 4. The methodology is outlined in the notes.
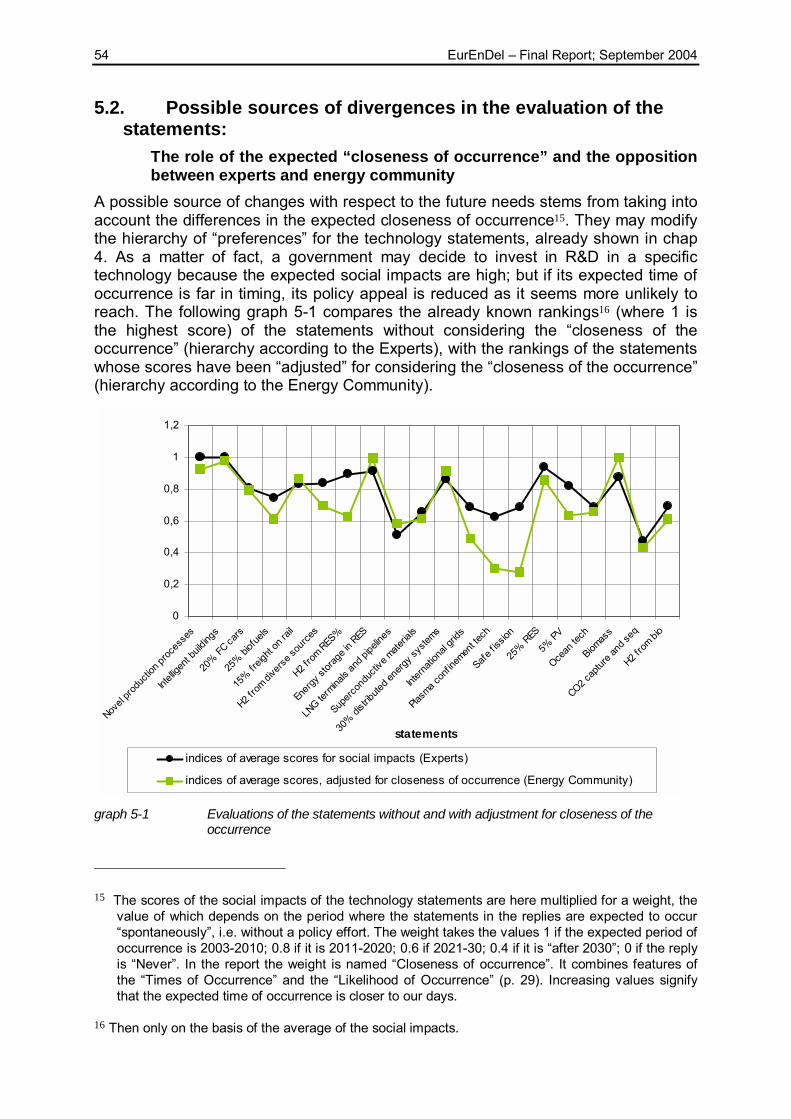
54 EurEnDel � Final Report; September 2004
5.2. Possible sources of divergences in the evaluation of the statements:
The role of the expected “closeness of occurrence” and the opposition between experts and energy community
A possible source of changes with respect to the future needs stems from taking into account the differences in the expected closeness of occurrence15. They may modify the hierarchy of �preferences� for the technology statements, already shown in chap 4. As a matter of fact, a government may decide to invest in R&D in a specific technology because the expected social impacts are high; but if its expected time of occurrence is far in timing, its policy appeal is reduced as it seems more unlikely to reach. The following graph 5-1 compares the already known rankings16 (where 1 is the highest score) of the statements without considering the �closeness of the occurrence� (hierarchy according to the Experts), with the rankings of the statements whose scores have been �adjusted� for considering the �closeness of the occurrence� (hierarchy according to the Energy Community).
0
0,2
0,4
0,6
0,8
1
1,2
Novel
produ
ction
proc
esse
s
Intelli
gent
buildi
ngs
20% FC
cars
25% bi
ofuels
15% fr
eight
on ra
il
H2 from
dive
rse so
urces
H2 from
RES%
Energ
y stor
age i
n RES
LNG te
rmina
ls an
d pipe
lines
Superc
ondu
ctive
mate
rials
30% di
stribu
ted en
ergy s
ystem
s
Intern
ation
al gri
ds
Plasm
a con
f inem
ent te
ch
Safe f is
sion
25% RES
5% PV
Ocean
tech
Biomas
s
CO2 cap
ture a
nd se
q
H2 from
bio
indices of average scores for social impacts (Experts)
indices of average scores, adjusted for closeness of occurrence (Energy Community)
statements
graph 5-1 Evaluations of the statements without and with adjustment for closeness of the
occurrence
15 The scores of the social impacts of the technology statements are here multiplied for a weight, the value of which depends on the period where the statements in the replies are expected to occur �spontaneously�, i.e. without a policy effort. The weight takes the values 1 if the expected period of occurrence is 2003-2010; 0.8 if it is 2011-2020; 0.6 if 2021-30; 0.4 if it is �after 2030�; 0 if the reply is �Never�. In the report the weight is named �Closeness of occurrence�. It combines features of the �Times of Occurrence� and the �Likelihood of Occurrence� (p. 29). Increasing values signify that the expected time of occurrence is closer to our days.
16 Then only on the basis of the average of the social impacts.

Comparison of Social and Technological Perspectives 55
Some changes are evident:
• two technology statements become now much more �interesting� than before for their �closeness of occurrence�: �Biomass� and �Energy Storage in RES�;
• the two statements on the efficient use of energy, �Novel production processes� and �Intelligent buildings�, remain at the top of the preferences, even after taking into account the �closeness of occurrence�;
• the relative position in the preferences of some statement worsens, because their feasibility seems too far in timing: �25% biofuels�, �Plasma confinement technology�, �International grids�, �H2 from RES�, �H2 from diverse sources�, �5% PV�;
• the case of �Safe fission�� is different: its position worsens not because of the times of occurrence, but because the preferences for it expressed by the Energy Community in terms of social impacts is far lower with respect to those of the Experts.
5.3. The “Preferences” of the three Societal Visions for the Technology Statements
The analysis now deals directly with the Societal Visions, to contrast the newly calculated preferences for statements based on Social Impacts, with the preferences based on Policies. First, consider the hierarchies of the preferences for the statements expressed by the Experts in terms of Societal Visions17, on the basis of the Social Impacts 18 (graph 5-2). �Ecological Balance� seems to be the most favorable environment for most of the energy technology statements, as it provides higher scores for almost all of them.
17 They can be obtained by assuming a table of correspondences between Societal Visions and Social Impacts. Each element of the table represents the value that every Societal Vision should ascribe to every Social Impact, on the basis of its assumed preferences. The table, where the values of the scores have been equalized to have the sums for column equal to 1, was agreed among the EurEnDel partners. Other, alternative sets of correspondences did not improve its usefulness in terms of results table 5-1 Table of Correspondences between Societal Visions and Social Impacts
Individual
choice Ecological balance
Social equity
Wealth creation 0,35 0,15 0,28
Environment 0,13 0,38 0,15
Quality of life 0,26 0,24 0,27
Security of supply 0,26 0,23 0,29
18 All the calculations are obtained through subsequent multiplications of matrices.

56 EurEnDel � Final Report; September 2004
The preferences made by �Individual Choice� and �Social Equity� are lower than those expressed by �Ecological Balance��, and seem very similar even in the absolute scores19 These two Societal Visions seem to represent an environment for the development comparable with �Ecological Balance� only for two statements: �30% distributed energy systems� and for �Plasma confinement technologies�. The hierarchies of the statements seem stable among different Societal Visions, and the relative positions do not change when they are adjusted to consider the �closeness of occurrence�. The energy demand statements, �Intelligent buildings� and �Novel Production Process�, are the preferred in every Vision.
0
0,2
0,4
0,6
0,8
1
1,2
Novel
produ
ction
proc
esse
s
Intell
igent
build
ings
20% FC
cars
25% bi
ofuels
15% fre
ight o
n rail
H2 from
dive
rse so
urces
H2 from
RES%
Energy
stora
ge in
RES
LNG te
rmina
ls an
d pipe
lines
Superc
ondu
ctive
mate
rials
30% di
stribu
ted en
ergy s
ystem
s
Intern
ation
al gri
ds
Plasma c
onfin
emen
t tech
Safe fis
sion
25% R
ES
5% PV
Ocean
tech
Biomas
s
CO2 cap
ture a
nd se
q
H2 from
bio
indices of average evaluations of the statements for social impacts (by Experts)indices of average evaluation of the statements for social impacts (by Energy Community)indices of average evaluations, adjusted for closeness of occurrence (by Energy Community)
graph 5-2: Preferences of the Societal Visions for Statements, depending on Social Impacts
Secondly, consider the preferences for the statements expressed by the Energy Community in terms of Societal Visions, on the basis of their attitude (or reluctance) to utilize policies including actions able to accelerate the times of occurrence of the statements20. They are depicted in the graph 5-3.
19 The utilisation of different sets of correspondences Societal Visions � Social Impacts does not alter the comparisons between �Individual Choice� and �Social Equity� in terms of rankings of the statements, even if they do modify the absolute values.
20 They can be obtained by assuming a table of correspondences between the actions needed to accelerate the occurrence of the statements (1st part of Delphi) and general policies and attitudes, attributed to the Societal Visions just by the Delphi respondents (2nd part of Delphi). Each element of the table represents the value that every policy and attitude should ascribe to every action, on the basis of its assumed preferences.
The table was agreed among the EurEnDel partners

Comparison of Social and Technological Perspectives 57
0
0,2
0,4
0,6
0,8
1
1,2
Novel
produ
ction
proc
esse
s
Intell
igent
build
ings
20% FC ca
rs
25% bi
ofuels
15% fre
ight o
n rail
H2 from
dive
rse so
urces
H2 from
RES%
Energy
stora
ge in
RES
LNG te
rmina
ls and
pipe
lines
Superc
ondu
ctive
mate
rials
30% di
stribu
ted en
ergy s
ystem
s
Intern
ation
al gri
ds
Plasma c
onfin
emen
t tech
Safe fis
sion
25% RES
5% PV
Ocean
tech
Biomas
s
CO2 cap
ture a
nd se
q
H2 from
bio
individual choice ecological balance social equity
graph 5-3: Preferences of the Societal Visions for Statements, on the basis of actions able to
accelerate their times of occurrence
The Societal Vision which more appreciates the energy technology statements on the basis of the actions required to accelerate their development is still �Ecological Balance�. Then �Ecological Balance� represents both the Societal Vision which attributes more values to the energy technology statements and the Societal Vision more in accordance with the policies and the attitudes requested to accelerate the occurrence of the statements. Among the other two Societal Visions, �Social Equity� shows a slightly broader attitude to intervene in the energy technology field than �Individual Choice�. Of course, the differences of evaluations among the statements become now far less sharp.
Comparison of targets and instruments The most important thing is now to compare the results coming from the two sets of �Preferences�. From one side (cf. graph 5-2) there are the target vectors, where table 5-2: Table of Correspondences between Policies and Actions
Policies ↓ Actions → ↑ Basic R&D
↑ Applied R&D
Fiscal measures Regulation
Public acceptance
Level playing field 0,44 0,64 0,52 0,56 0,5
Fiscal incentives to private R&D 0,62 0,73 0,62 0,39 0,09
Strong public financing of R&D and infrastructures 0,9 0,77 0,2 0,17 0,37
Internalisation of external energy costs 0,27 0,37 0,62 0,72 0,6
Behavioural changes 0,2 0,24 0,37 0,41 0,76

58 EurEnDel � Final Report; September 2004
every statement is evaluated by the experts according to the expected results (Social Impacts), for every �state of the world� (Societal Vision). From another side (cf. graph 5-3) there are the instrument vectors, where every statement is evaluated by the energy community according to the expected problems of implementing it (Actions to enhance), for every �state of the world� (Societal Vision). Comparing them allows to understand if some statement is unlikely to be enforced for reluctance within the Societal Visions to realize the requested policies to accelerate its occurrence. The problem can become more serious if the average expected social impact is high and if the �spontaneous� occurrence is distant in time. Table 6-3 faces the issue. Here the scores of the statements from graph 5-2 and graph 5-3 are transformed in index numbers, giving the 100 value to the highest scores within each Societal Vision. For example in the case of �Social Equity� the highest value statements are �Novel production process� in the case of �Preferences because of Social Impacts� and �25% RES� in the case of �Preferences because of Actions needed�.
table 5-3: Differences between preferences for social impacts and preferences for policy attitude
to intervene, for every statement and for every Societal Vision: for the meaning of the signs refer to the text
Individual Choice
Ecological Balance
Social Equity
Average Social Impact
Spontaneous Occurrence
Novel production processes + + + High Average Intelligent buildings + + + High Fast 20% FC cars - = - Average Average 25% biofuels = = = Average Distant 15% freight on rail + + + Average Fast H2 from diverse sources = = = High Average H2 from RES% = = = High Distant Energy storage in RES + + + High Fast LNG terminals and pipelines - - - Low Fast Superconductive materials = = = Low Average 30% distributed energy systems = = = High Fast International grids - = - Average Distant Plasma confinement tech = = = Low Distant Safe fission = = = Average Fast 25% RES = = = High Average 5% PV - = - Average Distant Ocean tech = = = Low Average Biomass = = = High Fast CO2 capture and seq - - - Low Fast H2 from bio = = = Average Average The differences of the two values for each statement (scores in the hierarchy in social impacts less scores in the hierarchy in actions) are reported in the 2nd,3rd and 4th columns of tab 3, for every Societal Visions: here only the signs of the differences are reported, and only if they exceed 10 %, otherwise = is the reported sign. The presence of a positive sign means that, for that statement, the relative evaluation on the basis of the social impacts is higher than the relative evaluation for the needed policies. In policy terms it means to emphasize that a specific technology faces the
Comparison of Social and Technological Perspectives 59
risk not to be supported by an institutional environment able to enforce the correct policies to stimulate it. In the 5th column the average social impact is reported, judged with respect to the average of statements. In the last column �fast�, �distant� and �average� refer to the assessments of the statements in terms of closeness of occurrence. Only for 4 statements (�Novel production process�, �Intelligent buildings�, �15% freight on rail� and �Energy storage in RES�) the index of the score about social impacts, given by the experts, is higher than the index of the score about needed policies, given by the energy community. But according to the last column the expected �autonomous� technical progress allows to meet the statements, all very important on the side of the involved social impacts, in relatively few years (with the partial exception of �Novel production process�). On the contrary, statements which should be realized in distant times, like �H2 from RES� or �Plasma confinement tech� seem not to suffer from a social opposition towards policies or actions needed to sustain them.

60 EurEnDel � Final Report; September 2004
5.4. Preferences of the Societal Visions for Technologies and “feasibility gaps”
What happens if this approach and this analysis are extended to the Technologies, connected to the Societal Visions directly by the respondents to the questionnaire? It becomes possible to underline the policy and social constraints to the exploitation of the new technologies, and how they change according to different, hypothetical �states of the world�. This objective can be carried out by comparing the features of the energy sources and technologies, as they are attributed to the Societal Visions by all the respondents to the questionnaire (see p. 39 of this Report), with the Preferences of the Societal Visions for the Technologies, on the basis of Policies (evaluated by the Energy Community).21
21 It is then necessary to pass through a third table of correspondences, referred to the relations between statements and technologies . The table 6-4 proposes the correspondences between the technology statements (1st part of the Delphi) and the energy technologies and sources (2nd part of the Delphi): Each element of the table 6-4 establishes how the figures referred to the policies can be obtained starting from the technology statements, so that the total for every row is equal to 1. For example, the value of the variable referred to �Energy storage for electricity�� (a technology) is a weighed average of the values coming from the statements �Energy storage in RES� (the weight is 0.7), �Superconductive materials�(the weight is 0.18), �30% distributed energy systems� (the weight is 0.05), �25% RES� (the weight is 0.03), �5% PV (the weight is 0.03), so that the sum for row is always 1. As usual, it has been realized through an agreement between the partners of Eurendel.
table 6-4 Table of Correspondences between Technology Statements and Technologies
1 2 3 4 6A 6B 7 8 9 10 11 12 13 14 15 16 17 18 19
Demand side management 0.2 0.8
Energy conservation technologies 0.8 0.2
Fuel Cells 0.9 0.1
Nuclear fission 1.0
PV 0.1 0.9
CO2 sequestration 0.1 0.9
Pan European electricity and gas grid 0.3 0.1 0.6
Natural gas import by pipeline 0.8 0.2
Natural gas import by LNG 1.0
Alternative transportation fuels 0.1 0.5 0.1 0.1 0.1
Energy storage for electricity 0.7 0.2 0.1
H2 production and storage 0.3 0.3 0.1 0.1 0.2
Biomass 0.3 0.1 0.1 0.1 0.4
Wind 0.1 0.3 0.6
Geothermal 0.1 0.9
Ocean power 0.1 0.9
1 Novel production processes 6B H2 from RES% 11 International grids 16 Ocean tech
2 Intelligent buildings 7 Energy storage in RES 12 Plasma confinement tech 17 Biomass
3 20% FC cars 8 LNG terminals and pipelines 13 Safe fission 18 CO2 capture and seq
4 25% biofuels 9 Superconductive materials 14 25% RES 19 H2 from bio
6A H2 from diverse sources 10 30% distributed energy systems 15 5% PV
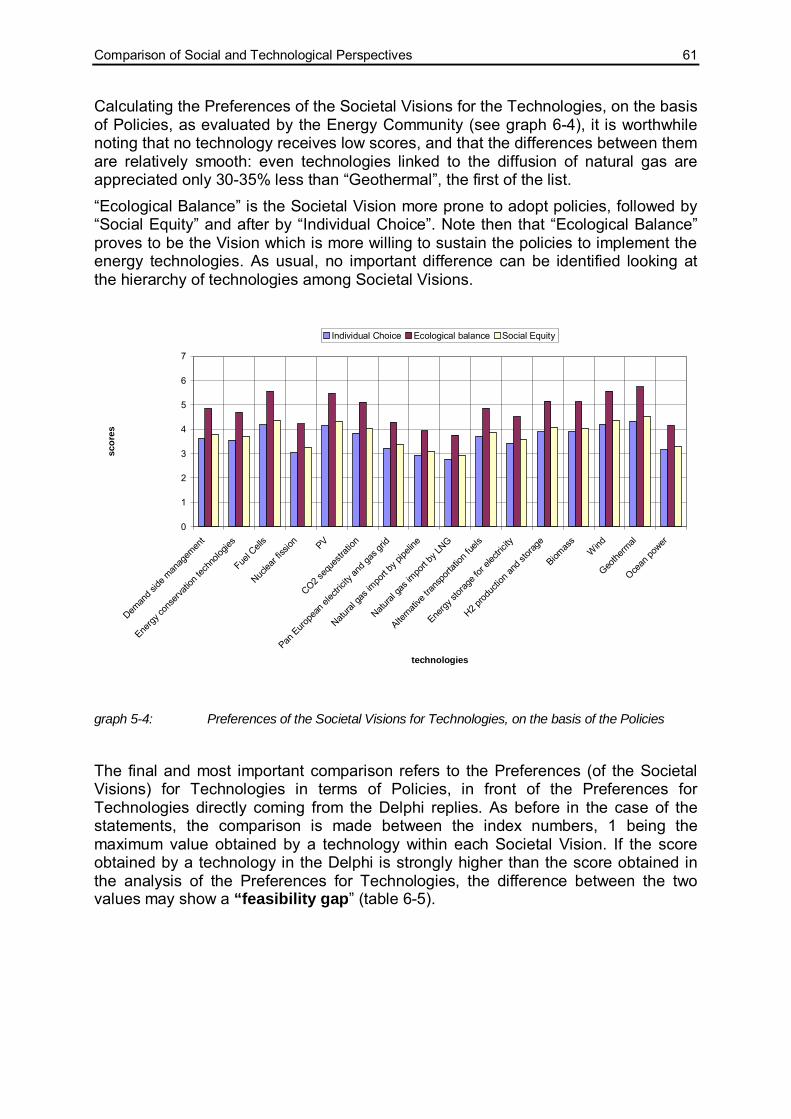
Comparison of Social and Technological Perspectives 61
Calculating the Preferences of the Societal Visions for the Technologies, on the basis of Policies, as evaluated by the Energy Community (see graph 6-4), it is worthwhile noting that no technology receives low scores, and that the differences between them are relatively smooth: even technologies linked to the diffusion of natural gas are appreciated only 30-35% less than �Geothermal�, the first of the list. �Ecological Balance� is the Societal Vision more prone to adopt policies, followed by �Social Equity� and after by �Individual Choice�. Note then that �Ecological Balance� proves to be the Vision which is more willing to sustain the policies to implement the energy technologies. As usual, no important difference can be identified looking at the hierarchy of technologies among Societal Visions.
0
1
2
3
4
5
6
7
Deman
d side
man
agem
ent
Energy
cons
ervati
on te
chno
logies
Fuel C
ells
Nuclea
r fiss
ion PV
CO2 seq
uestr
ation
Pan Euro
pean
elec
tricity
and g
as gr
id
Natural
gas i
mport b
y pipe
line
Natural
gas i
mport b
y LNG
Alterna
tive t
ransp
ortati
on fu
els
Energy
stora
ge fo
r elec
tricity
H2 prod
uctio
n and
stora
ge
Biomas
sW
ind
Geothe
rmal
Ocean
power
technologies
scor
es
Individual Choice Ecological balance Social Equity
graph 5-4: Preferences of the Societal Visions for Technologies, on the basis of the Policies
The final and most important comparison refers to the Preferences (of the Societal Visions) for Technologies in terms of Policies, in front of the Preferences for Technologies directly coming from the Delphi replies. As before in the case of the statements, the comparison is made between the index numbers, 1 being the maximum value obtained by a technology within each Societal Vision. If the score obtained by a technology in the Delphi is strongly higher than the score obtained in the analysis of the Preferences for Technologies, the difference between the two values may show a “feasibility gap� (table 6-5).

62 EurEnDel � Final Report; September 2004
table 5-5 Feasibility gaps between preferences by Delphi and preferences based on policies
Individual Choice Ecological Balance Social Equity
Delphi feasibility gap Delphi
feasibility gap Delphi
feasibility gap
Energy Conservation Technologies 1,00 0,14
Energy Conservation Technologies 1,00 0,14
Energy Conservation Technologies 1,00 0,14
Fuel Cells 0,97 -0,02 Wind 0,97 0,02 Biomass 0,97 0,10 Demand side management 0,90 0,05 Biomass 0,93 0,06
Demand side management 0,93 0,07
Alternative transport fuels 0,87 0,07 PV 0,91 -0,03 Wind 0,90 -0,05 Energy storage for electricity 0,85 0,07 Fuel Cells 0,90 -0,09
Alternative transport fuels 0,81 0,01
Pan European el. and gas grid 0,84 0,10
Demand side management 0,88 0,02
Energy storage for electricity 0,81 0,03
Natural gas imports by pipeline 0,82 0,13
Alternative transport fuels 0,87 0,07 PV 0,81 -0,13
H2 production and storage 0,81 -0,06
H2 production and storage 0,84 -0,03 Fuel Cells 0,78 -0,19
Biomass 0,75 -0,08 Energy storage for electricity 0,81 0,03
Pan European el. and gas grid 0,73 -0,01
Wind 0,75 -0,20 CO2 sequestration 0,72 -0,12 H2 production and storage 0,73 -0,14
PV 0,69 -0,26 Geothermal 0,67 -0,33 Natural gas imports by pipeline 0,62 -0,07
Natural gas imports by LNG 0,67 0,01 Ocean power 0,62 -0,13 Geothermal 0,57 -0,43
Nuclear fission 0,55 -0,15 Pan European e.l and gas grid 0,53 -0,19
Natural gas imports by LNG 0,55 -0,11
CO2 sequestration 0,54 -0,30 Natural gas imports by pipeline 0,42 -0,27 CO2 sequestration 0,54 -0,30
Geothermal 0,46 -0,54 Natural gas imports by LNG 0,37 -0,30 Ocean power 0,49 -0,26
Ocean power 0,43 -0,33 Nuclear fission 0,34 -0,39 Nuclear fission 0,36 -0,36 CORRELATION COEFFICIENTS 0,84 0,89 0,84 SUM OF THE DIFFERENCES 2,49 2,22 2,40
Some technologies may show strongly positive signs of the �feasibility gap�. The economic meaning is that those technologies, even if well appreciated by the energy community (the Delphi replies come from all the respondents, as it is not possible to separate them on the basis of expertise of them) may face troubles in implementing because a far lower level of evaluation (that means lost welfare) of the policies or of the attitudes requested at the social level can hamper or slacken their realization. The past history and the current times are plenty of examples of such situation: for example, the high consumption of petrol in US have been often explained also with the political unwillingness of heavily taxing the petrol, so that its prices are far lower than in Europe. The �feasibility gap� can be represented under a lot of features. The most common of them is the following: if the policies and attitudes for the development or the full exploitation of a technology can be realized through investments in R&D or investment expenditure in fixed capital, the most obvious danger is underinvestment. Note that the most evaluated technology in all the Societal Visions, �Energy Conservation Technologies�, is also the technology showing the highest possibilities of underinvestment, in all the Societal Visions. The �feasibility gap� is always 14 %;

Comparison of Social and Technological Perspectives 63
prima vista it seems a scarce value, but the scale is not well defined. The only thing that can be claimed is that this technology could spread less than the requested. This assertion seems common to all the Societal Visions. Other two technologies showing positive signs of �feasibility gap� are in the �Individual Choice� vision. They are �Pan European electricity and gas grid� and �Natural gas imports by pipelines�, which do not show �feasibility gaps� in the other visions. The reason of this is that the �demand� for these technologies is higher in the �Individual Choice� vision (the degree of preference quoted by the respondents is higher), whereas the attitude to realize policies for their implementation is rather similar between the visions (and probably it should be even lower for �Individual Choice�). The vision �Social Equity� shows �feasibility gaps� for �Biomass�, besides �Energy Conservation Technologies�. It seems that �Ecological Balance� is the vision less suffering from dangers of underinvestment, with respect to the technologies searched by that vision. The last row of table 5-5, the sum of differences, claims even more: �Ecological Balance� is the more balanced Vision, when �Individual Choice� is the more unbalanced. When the feasibility gaps have a minus sign, their interpretation is more ambiguous. From an optimistic point of view, the interested technologies are expected not to find hard difficulties to be implemented, as the requested policies and attitudes fit well with the behavior preferences of the community. From a pessimistic point of view, however, it can mean that the communities can be driven to the exploitation of some technologies simply because implementing them is less difficult than implementing other, more important technologies. It can be the case of �Geothermal� (which is however linked to the availability of natural resources), of �Natural gas imports by LNG� and of �Pan European electricity and gas grids�. They are possible cases of overinvestment. That society will invest more in those technologies whose realization fits better with the requests of the population (who are the voters ?) even if they are technologies less requested on the scientific ground. This tendency is common to all visions: looking at the correlation coefficients, there is a sort of �common path� between technologies and �feasibility gaps�. When the importance of the technology is decreasing, the level of overinvestment is increasing. Furthermore, six technologies in �Individual Choice� show a value of the �feasibility gap� higher than � 10 % (the border is arbitrary, of course), seven in �Ecological Balance�, eight in �Social Equity�. This is a sort of potentially diffused policy failure that is important to note.

64 EurEnDel � Final Report; September 2004
5.5. Main Conclusions • There is consensus between experts and energy community from one side,
between all the Societal Visions from another side, in considering the energy demand technologies the most important ones in terms of the total social benefits (impacts).
• Strong disagreements between the Experts and the Energy Community exist in the assessment of �Nuclear fission�. The Expert�s rate the contribution of �Nuclear fission� for Security of Supply much higher than the Energy Community.
• When taking into account the results from the first part of the questionnaire (Impact assessment on Delphi statements) the three Societal Visions hierarchize the energy technology statements in very similar ways. Differences occur in the absolute values: �Ecological Balance� is the vision which gives higher scores to the bulk of the statements in terms of social impacts. However, if the respondents are directly conscious of the differences between the features of the Visions (questions in the second part of the Questionnaire, refer to page 41), their ratings in the Visions do differ.
• The policies to attain the statements not necessarily reward the technologies which are rated the most effective by the Experts. Partially this is due to the fact that the Energy Community, who is responsible for the implementation of the policies, has its own preferences which can differ from those of the experts.
• Another reason for �not rewarding the best� is the role that the perception of the �closeness of occurrence� of the statements can play a role in re-allocating efforts and actions among the technologies quoted in the statements. If the closeness of occurrence is considered a factor de facto affecting the practicability of policies of R&D, investments to attain some statements, like �25% biofuels�, �Plasma confinement technology�, �International grids�, �H2 from RES�, �H2 from diverse sources�, �5% PV�, can be jeopardized.
• Maybe the most important reason for the potential divergences between what is more requested and what is done is the fact that the policies to realize statements or technologies are not neutral but reflect the preferences for specific kinds of actions and attitudes, that sometimes justify efforts to implement other technologies. If applied to the preferences directly expressed by the respondents to the Delphi questionnaire, this approach displays problems of policy failures, or �feasibility gaps�, as underinvestment or overinvestment;
• More specifically, the most appreciated technology, “Energy Conservation Technology” may face problems of underinvestment, as its evaluation is around 10-15 % higher than that of policies needed to implement it.
• Among the Societal Visions, �Ecological Balance� shows itself to be the most appropriate �state of the world� for nurturing the energy technologies considered in the report; more than the other Societal Visions, it appreciates energy technologies on the basis of the expected social impacts; it shows willingness to realize policies and attitudes coherent with the requested technologies; it shows lower “feasibility gaps”.
EurEnDel Scenarios 65
6. EurEnDel Scenarios
»Weep not that the world changes-- did it keep a stable, changeless state, it were cause indeed to weep.«
William Cullen Bryant
The three qualitative scenarios of Europe�s possible energy futures are based on the findings of the EurEnDel Delphi study. These results have been checked against multiple inputs from a considerable number of related research projects22. We understand scenarios to be a set of future configurations, which must be at the same time coherent, probable and possible. This understanding implies that the number of potential combinations can be and must be reduced, as some are self-exclusive and others are not desirable. Another element, which marks the character of the scenarios described here, derives from the basic approach of the research project: i.e. that of discussing energy technologies within the context of social values The prior work carried out in the EurEnDel project, mainly the key messages from the Cross-Impact Analysis and the results of the Delphi Survey, determined the basic character of the scenarios, in the sense that: # There is no business-as-usual case for the European Energy System, when
looking at a longer-term horizon (2030). Major structural changes are already taking place in the system and serious upheavals are likely to occur in the coming decades. The process of change, as well as its pace, is largely dependent upon political will, but also upon external framework conditions, which cannot be completely controlled by the main actors, i.e. the European Commission and the countries and regions, which form part of the European Union. The decisive factors, which may act as motors or restraints, are related to the accessibility of fossil fuels, the mainstreaming of ecological values throughout the European society and its institutions, and also the level of risk perception in society.
# From the societal point of view, the most desirable options are demand-side related, heading towards overall demand reduction. No matter whether we strive for economic well-being and liberty of choice, ecological balance or social justice, reducing society�s dependence on energy supply is highly desirable. Next is the sustainable exploitation of renewable energy sources, but, within this field, there is no clear future pathway to be perceived at the moment.
Of course, these clear messages derived from the Expert Workshops and the European Delphi Survey only constitute one among many sources of information on energy-related issues. And the European Commission is by far not the only actor involved in setting policy priorities, nor is �Society� represented by a single interest group. What may be desirable from the overall societal perspective, may be in clear
22 For details of the development of the EurEnDel scenarios please refer to the EurEnDel working paper [Velte et al. 2004] which is available for download at www.eurendel.net.
66 EurEnDel � Final Report; September 2004
contradiction to the particular interests of some groups of actors, or may simply not be feasible under certain framework conditions. It is therefore necessary to explore possible pathways to reach these future situations, using the technique of scenario building. The main purpose of this exercise is that of indicating not policy, but research priorities, which will aid the process of transition of the future, minimizing the risk of stranded investments and avoiding major crisis situations during the transition period.
Development and Background of the Scenarios The key drivers for the scenarios had been identified during an expert workshop, using the technique of Cross-Impact Analysis, which permits to cluster sets of variables by their degree of influence on a given systems. These key drivers were than associated in a second workshop to a number of hypothesis, which reflected the main results of the Delphi exercise (including some strong minority votes), as well the numerous comments received on the technology statements. The most likely combinations of key drivers and hypothesis referring to instruments (technologies and socio-economic trends) supply the basic structure for each of the scenarios presented below. It should be pointed out that every scenario exercise is conducted in a given context and based on the knowledge of past developments and present trends. The EurEnDel project, including the expert survey, has been carried out on the background of major political upheavals in Europe and on the international scene which do not favour a �business-as-usual� attitude: the shock of two terrorist attacks � September 11th in the US and the Madrid bombings in spring 2004 � as well as the ongoing invasion and occupation of Iraq and the strong popular protest against this latest war in large parts of Europe. Thus the project team put much emphasis on integrating into the analysis the longer-term, structural changes, which are connected to these sad incidents and which may have a decisive influence on the future energy system. What will Europe look like in 2030? As for the European Union it seems highly likely that the number of member states rises beyond the 25 of today. However, this scenario exercise refers to a EU25 in order to make the findings comparable with accessible quantitative data. The main environmental challenges and threats will still exercise their influence on society and politics, in spite of considerable technological progress, and the trend towards the service economy continues. It is foreseeable that Europe�s societies will be made up of a larger percentage of older people and, in many other aspects, Europe will also be different in 2030�

EurEnDel Scenarios 67
6.1. Change of Paradigm The first scenario combines hypotheses, which are closely related to a strong policy shift towards sustainable development in the years up to 2030: it is due to a combination of political will, technological progress, structural changes in the economy and urgent environmental pressures that Europe is on the way of achieving great progress in energy efficiency. These combined pressures trigger an aggressive and self-learning move towards much lower levels of energy intensity across all processes and countries. It is mostly a universal attitude, which seeps across all layers of societies and spheres of activity, and produces a “democratic” initiative, summing up efforts by many and in many places.
Climate change concerns have led to an important reduction of CO2 emissions and long-term consequences can thus be mitigated. By 2012, CO2 emissions had been reduced below 1990 levels. During the second decade of the century, efficiency measures started to show a major effect on overall energy use, lowering the carbon intensity of the European economy by approximately 1.5% annually for the last two decades in the EU25 member countries. Europe strives towards achieving �Factor 4�, using substitute resources for oil and petroleum-derived products. Import dependency can so be limited, and the drive towards substitute energy sources is strong enough to exercise a positive effect on gas consumption levels. As a result, pressures on energy demand start to ease, so that the year-count of oil reserves (on a falling demand) is increasing again and new options on the supply-side remain unexplored. Everything is on track so that, by 2050, the World will have learned to live with almost no oil for energy production. International consensus on the need for improving the living conditions in the poorest countries has been growing for decades. Correctly channelled aid programs have helped to speed up electrification in many of these countries, although the differences between the per capita energy consumption between the 1st and 3rd World are still considerable. Presently, the main issues of debate in energy policy are long-term planning, re-regulation of energy markets and re-nationalization of many energy companies, as well as other strategic or high-risk industries (airways, steel�). The different administrative levels in Europe work closely together in promoting ecological values as guiding priorities in all fields of public policy. The principle of eco-efficiency is widely accepted and leads to active energy saving policies in the public and private sector. The European Commission and the national institutions have worked hand in hand to set up a legal framework, which promotes environmental excellence in companies and ecological consumption habits. Technologies that are labelled to be risky encounter strong opposition. The strong public awareness of technological risks helps the citizens� organizations to gain greater influence on political and industrial decision makers.
Development of Energy Demand Growing concerns about the environmental and social impacts of unsustainable energy consumption and production, have turned energy and transport into �hot� political questions. What used to be �captive� and �passive� final consumers are now main actors in energy policies both on the demand and on the supply side,
68 EurEnDel � Final Report; September 2004
stimulating residential energy production. Most housing communities are advised by a local energy expert, who usually also lives in the same building and has participated in training courses offered by the local or regional energy agencies. Traffic reduction measures and well-functioning public transport are considered essential elements of quality of life in urban areas by a large majority of the inhabitants. It has been obvious ever since the beginning of the century that efficiency improvements in motorized vehicles would not been sufficient to cope with overall emission increases, and that the longer-term solution would require converting the European vehicle fleet to less polluting fuels. The first major changes took place in captive fleets (urban buses, fishing fleets, agricultural vehicles and similar), which now use those substitute fuels that can be produced regionally at the lowest cost. Biofuels, mixed fuels, natural gas and hydrogen are all valid options during the present transition period. Yet, in order for biofuels to reach a market share of 25% in European road transport, major efficiency improvements in the vehicle fleets had to be achieved, while, at the same time, transferring important freight volumes to railway carriers. Motorized passenger transport has increasingly been slowed down by traffic congestion problems in urban areas and pan-European transit routes, so that alternative transport modes have become more interesting for the final user. The motorized car park started to decrease from 2020 on. Increased costs of fuels derived from fossil sources have made versatile hybrid solutions attractive for industry and users of hybrid cars, while these have preferential treatment in inner city areas. Versatile fuel cell vehicles now play a major role in all European countries. The political priority of transferring a major share of freight transport in Europe led to the corresponding investments in the modernization of railway networks during the first two decades of the century. The priorities set by the regulator improved the railways� competitiveness, although major efforts by the companies were also required in order to offer the necessary service quality in terms of speed and client orientation. Interoperability of the systems was then further enhanced through common ICT-interfaces, increased vocational training for employees and by establishing freight routes of excellence between destinations, which were most severely affected by road traffic saturation. Distribution of the growing freight volumes and the transfer of containers to trucks for final delivery remained a problem until the railway networks were linked to intermodal transport centres outside the large urban areas. As a result of these combined efforts railways were again transporting 15% of freight volumes in 2020. Electricity-intensive industries, which require high-quality power (with high IT and nanotechnology components), maintain their most crucial production activities in world regions with excellent energy service conditions. Industry has been able to reduce energy input per produced unit by 50% since the beginning of the century, introducing novel and more efficient production processes. Energy efficiency also increases in the service sector and in household appliances, in compliance with Europe-wide efficiency standards, and due to the increased use of intelligent demand-side management systems with integrated response to hourly price fluctuations by heavy energy users in the service sector, such as hotels. Inefficient uses of electricity in this client segment for thermal uses and refrigeration, such as heating, hot water and air-conditioning, are increasingly substituted by solar-

EurEnDel Scenarios 69
thermal appliances, since the solar industry has managed to set up an ample network of providers and maintenance companies, offering long-term guarantees and financing opportunities. These trends also benefit residential customers in the medium term, thus slowing down the growth of electricity demand in this sector. Green products gain important market shares, whenever they are supported by independent analysis of consumer organisations and the company, which produces and / or distributes these goods, has a credible record of environmental performance. Clear and easy labelling, which reflects the product�s environmental performance over the total life-cycle, as well as the compliance of other sustainability criteria by the producer makes it possible for the consumer to �make the right choices�. It also obliges the producers to make their production processes and the source of prime materials more transparent. Companies responsible for major accidents or continued environmental impacts can hardly survive in the market. These consumer preferences for green products and services are also evident in the energy retail sector, which is now dominated by suppliers specialized on renewable energies and community-oriented municipal companies.
Development of Energy Supply Up until 2010, increasing import dependency led to heavy infrastructure investment, with special attention to more versatile LNG facilities and transport capacities. At this point, the increasing world demand and the negative perspective for the development of major new reserves turned these large-scale investments too risky and private investors started to back out, so that only the already initiated projects for connections with the CIS countries were actually carried out. Nowadays, the convergence of innovations in the field of material research, ICT, power electronics and other research fields works in benefit of a much higher level of efficiency in the entire energy chain, achieving an overall yearly improvement of 3%. Advances are especially important in renewable energies with the highest potential of efficiency improvements and cost reduction. Environmental impact studies on new materials and technologies are carried out prior to their introduction into the mass market. Unresolved safety and waste problems, together with low public acceptance led to political rejection of nuclear during the first decade of the century. Without public/state backing, private investments in new plant designs were considered too risky because of high capital costs. Existing plants have been shut down as they reached the end of their projected life span, and extension of useful life is not contemplated anymore. Development of fusion has long been discarded for cost reasons. As a result, the nuclear industry�s main focus shifted to the dismantling of power plants at the end of their useful life, while R&D efforts over the last decades have been exclusively centred on safe waste management, long-term storage technologies and on shielding existing reactors against terrorist attacks. Europe has well prepared the way towards a non-fossil-fuel based economy. All regions have thoroughly accessed the maximum potential of the different sources, taking into account the limits of sustainable growth in each sector. The basic concept for the development of new energy technologies is that of reducing or eliminating inefficient transformation processes and offering integrated, user-friendly solutions to the final customer. Wind power is, at the moment, the greatest contributor to

70 EurEnDel � Final Report; September 2004
electricity production besides large hydro. Biomass is mainly used for heating processes and some trigeneration facilities in regions with limited potential. On-shore wind farms have been fully developed, while off-shore capacity had to be planned carefully in order to avoid conflicts with other uses of the coastal zones and thus maintain options for low impact wave and ocean power plants, which are now reaching technical maturity. Incremental improvements in the solar industry, the reduction of silicon-content, as well as the development of integrated systems for buildings are now turning the solar industry into the key factor for Europe�s future energy supply. PV is close to reaching the threshold of a 5% market share in electricity production. As soon as the industry has developed a well-trained, customer-oriented supply chain, Europe will be entering a new energy era.
Development of Carrier Technologies and Electricity Grids From 2020 on, the European countries and companies undertake heavy investments in order to increase the transport capacity of the high-voltage international connections, after having concentrated during the first two decades on solving the bottlenecks in the distribution network and on putting the largest part of the urban networks underground. In view of siting problems for new transmission lines, the emphasis is placed on increasing the capacity of the existing infrastructure within Europe by means of new superconductive cables and on extending the modernized grid to neighbouring countries. New emission standards and large-scale R&D have paved the way for the introduction of hydrogen to the energy system, adding production and distribution facilities to the existing fossil-based infrastructure. Nowadays, hydrogen is considered a potential competitor to electricity through the use of fuel cells, especially in smaller, remote communities, although it is not yet price competitive on a large scale with traditional energy carriers. Production takes place in central power stations (wind, gas and possibly nuclear) as well as on-site (mainly wind and solar). Most of the hydrogen is produced from CO2-free sources, because its main competitive advantages are clean end use, versatility and its contribution to security of supply. Hydrogen is also an important storage medium for intermittent electricity production from renewable energy sources, such as wind and solar, and thus has allowed RES to attain high market shares of electricity production in Europe. Although security aspects related to hydrogen use have been taken care of, other environmental threats, which have so far been widely neglected, are now becoming visible, mainly due to small, but continuous leakages.
Quantitative CO2 emission classification of the “Change of Paradigm” scenario: With the CO2 reduction to 1990 levels by 2012, the Kyoto protocol is not complied with domestically, but by means of the flexible mechanisms. The CO2 reduction by 1.5% annually later on is equivalent to a 25% reduction by 2030 compared to 1990. With this setting, the �Change of Paradigm� scenario is far more optimistic in terms of CO2 reduction than the quantitative �With Climate Policies� reference scenario [Zeka-Paschou 2003] used in the quantitative co-assessment of the EurEnDel project (cf. [Jörß and Wehnert 2004].
EurEnDel Scenarios 71
6.2. Fossil Fuel Wars
Fossil Fuel Wars stands for a crisis scenario, in which climate change concerns play a minor role when defining priorities for energy policies. Conflicts between the different interest groups prevail on European, as well as on national levels. Economic, social and environmental policy goals are difficult to integrate and there is a general lack of willingness among companies and citizens to bear the increasing costs of environmental protection.
There is little progress towards sustainability in Europe, due to a lack of consensus, not only on international level, but also within the European Union. In the absence of decisive measures to promote energy efficiency and alternative sources, there is a strong likelihood of armed conflicts caused by the desire to control the remaining reserves of oil and gas. The financial system is in turmoil and international trade barriers appear very soon and strong. Europe is not yet a true federal union and finds itself in a very weak position in this game. It is witnessing, disoriented, the great Chino-American war. Growing energy demand in the rapidly developing countries, primarily China, put a strain on oil and gas markets. The US maintains the grip on a large part of the available resources, using, when necessary, military pressure, while Europe concentrates its efforts on stabilizing its main supplier regions and developing strong multilateral ties. In this crisis situation, the perception of technological risk is not a prime concern in the population. Rising consumer prices in Europe make it difficult for consumers to acquire higher-priced green products. Consumer confidence in environmental labels has suffered several setbacks since the beginning of the century, especially in the South of Europe. In the past, a number of leading companies in the market intended to use the �eco-trend� for the selective marketing of products and services, which did not comply with ecological standards, and even less with sustainability criteria. European auditors finally discovered these practices, but so far it has not been possible to restore consumers� confidence. Only products with environmental benefits that are evident to the customer or which present an economic and ecological win-win situation, for example efficient electrical applications or cars with reduced gasoline consumption, keep gaining market shares. The public considers that energy consumption and production are important issues, but concerns about security of supply and the increase of energy and transport-related household expenses have shifted the public�s focus from environmental to social and economic concerns. Energy-saving measures are highly appreciated, but final consumers feel that they have little influence on questions related to European energy policy and its environmental consequences. This perception of �lack of alternatives� is especially strong among tenant households or residents in rural areas, which see little scope of action even on local level. From the beginning of the century energy supply responded to a strongly rising demand, while the signals of depleting reserves were camouflaged by conflicting interests. Because of this, the prevailing attitude until 2020 was that there was no need for urgent action neither in the fields of supply nor demand. As a result, tensions mounted unexpectedly as few tools were available to cope with the

72 EurEnDel � Final Report; September 2004
tightening supply situation. Societies and their political leaders had been caught unprepared and were unwilling to admit responsibility or to change. Now, the World is in an extremely difficult situation � moving away from solidarity while the rule of force spreads, fuelling a military rearmament. The Kyoto Agreements never got to be implemented on international level. CO2 emissions are now 14% higher than in reference year 1990 and 18% higher than in 2000. Different techniques of CO2 sequestration were introduced on a larger scale from 2015 on. But since climate issues were already low on the agenda at that time the efforts in this direction were not intensified. Despite the showing of more and more severe signs of the climate change, the strategy is to cope locally with the consequences rather than to globally address the cause. The focus of concern is energy supply. Any traditional solution or fuel has to be drawn upon, no matter its longer-term implications and 3rd World countries (and the 1st to some extent, too) look for coal development. The strategic areas for production and the pipes/terminals for the transport of hydrocarbons are of paramount importance for maintaining a minimum level of security of supply. Natural gas continues to substitute petroleum in Western Europe. Heavy investments in transport routes, LNG facilities and large underground storage facilities, located partly in the transit countries, make it possible for Europe to triple consumption rates until 2030. In order to guarantee return on investments, the European Union establishes strong political and economic ties with the CIS states, the African producer countries, as well as the transit countries. Research has concentrated on the reduction of transport costs and the future use of the infrastructure created for gas transportation, storage and distribution. Yet, political and social unrest rises, bringing to light the vulnerability of energy infrastructures. The main feature of this scenario � the lack of long-term planning and preparedness � is reflected in the development of energy demand and supply. Research priorities in the key technologies have not explicitly contemplated progress in energy efficiency or renewable energies, but have been much more centred on the mass production of consumer goods and on substituting costly raw materials. Technological progress in regard to energy efficiency has therefore not reached the critical 2% improvement per year in the EU25 countries.
Development of Energy Demand Shifts on the demand side are occurring, but mainly driven by structural change: the large energy users have transferred part of their energy-intensive production processes to non-EU countries in order to lower production costs, thus provoking an overall reduction of industrial energy demand and lower production levels. Those economic activities, which now remain in Europe, are service-oriented (logistics management, design and similar) and mainly electricity-fuelled. The trend towards the service economy continues, also shifting energy uses towards electricity, but at a rather slow pace. Nowadays, the increased importance of electricity use (and cost) in industry turns investments in electricity saving more profitable and may eventually lead to a more sustained growth of demand in most companies. The turnover rate of residential buildings (old versus new construction, including restored buildings) is increasing in Central and East European countries, where the housing stock contains a high percentage of post-war buildings, while the turn-over rate in the Southern parts decreases after the end of the construction boom experienced at the beginning of the century.

EurEnDel Scenarios 73
Construction norms in all countries oblige to reduce the new buildings’ energy consumption by 30% as compared to the standard housing stock built before the year 2000. With a 2% p.a. substitution rate for the building stock in EU 25, about 60% of the buildings have since been adapted to the new efficiency standards, bringing along an overall reduction of 20% in energy demand related to buildings. Since most of the savings measures aimed at reducing energy demand for heating, electricity has slowly gained higher overall market shares. The sector hardest hit by supply problems and price hikes for fossil fuel is transport. Freight transport by rail is actually recovering market shares, but motorized traffic can no longer rely exclusively on fossil fuels. The potential of energy crops in Europe, which can be exploited without major environmental impacts (monoculture), is too limited and therefore does not constitute a large-scale alternative for road transport. The crucial question for Europe is the pace of development of a parallel transport infrastructure based on hydrogen. FC cars have so far not reached a market share of 20%, due to the slow development of the hydrogen infrastructure. The transitional use of natural gas has been discarded, since the necessary investments in the conversion of the car fleet, increased dependence on imported gas, as well as price increases would have rendered this solution too risky. Hydrogen is presently being produced from both fossil sources (primarily gas and to a lesser extent coal) and renewable energy sources (wind, solar, biomass), but the latter form of decentralized production dominates. Biological processes for the production of hydrogen are still in the demonstration phase. Hydrogen is not yet produced in quantities that allows for a substitution of electricity or other energy carriers, nor for large-scale use in transport. Nor is hydrogen used in power generation except as backup in remote areas or consumers, for which autonomous energy solutions are crucial (i.e. hospitals). Distribution on regional scale is generally carried out by road and rail in pressurized bottles, but some local pipeline networks exist.
Development of Energy Supply The national energy systems in Europe show large differences regarding the use of renewable sources. Some of the countries still maintain a considerable share of nuclear and fossil-based power stations, supplying baseload power also to the rest of the EU Member States, while others have long ago redirected research funds to promoting the efficient use of wind, biomass and solar thermal, thus considerably reducing investment costs. Technologies based on these energy sources are now competitive for peak load and in most thermal uses, but PV is still having problems for penetrating the market in countries with insufficient public subsidies. The serious supply problems experienced over the last decades led to a political and (reluctant) public acceptance of nuclear energy. State support for investments has made the technology competitive with acceptable return to investors and led to a doubling of world nuclear capacity to 650 GWe between 2000 and 2030. In EU 25, nuclear production has slightly increased its market share with respect to 2000, thanks to the construction of new light water reactors such as EPR in those countries, which decided against the phase-out of nuclear. Waste is now handled as once-through cycle inside the EU, and final deposit sites have been in place in all European countries with nuclear production since 2020.

74 EurEnDel � Final Report; September 2004
Nuclear fusion has not reached a commercial stage yet, but ITER progresses as planned, thus fusion is still considered an option for the medium term future (after 2050).
6.3. Muddling Through Across the Gas Bridge In the third scenario there is also a major drive towards sustainability, but it is assumed that long-term climate change impacts cannot be avoided. In 2030, Europe is still caught in the middle of a slow transition process towards a more sustainable energy system. Natural gas plays a key role as intermediary solution, not only in power generation, but also in transport.
CO2 emissions were reduced to 1990 levels by 2012 and then stabilized. In this transition period, flexible mechanisms were employed as a short-term solution. Still, long before 2030, climate change effects had become more evident in some regions and started to have affects on energy production and infrastructure, especially in coastal areas. Risk prevention measures have become inevitable and costs derived from climate change surge. Due to the increasing environmental pressures, sustainable development has high political priority in Europe and the different levels of administration cooperate in the major effort of reorienting policy goals towards societal values, which permit to share the remaining fossil fuel resources with the poorer nations. These prime goals for international policies receive broad support in the population. Yet, the World�s response to the combined challenge of depleting reserves and climate change impact has been rather late. Market initially responded to pressure from rising oil demand by producing even more, attuning oil supply to the World�s energy-hungry economy, in a huge replica of the �classic� 20th century Western model, now extended worldwide. Then, a combination of technology, investment and broad political consensus made it possible to keep production costs within limits, so that �the global� economic and social model is not severely compromised� in the short/medium term. But the outcome remains unclear, even grim, in the longer term. And that vision is broadly shared. Because signals of an ending era appear and are read correctly by most of the humankind. This, coupled with strong evidence (market, science�) of oil cycle ending, tend to hike oil prices up, and fosters development of energy conservation and much more efficient end-uses for energy, as well as changes in productive and even ordinary life patterns. A gradual -but strong- reduction in energy intensity helps Europe to gain time for a fundamental migration towards a new life style and economic system. A wave of economic dematerialization and the extension of the useful life of oil reserves frees economic resources and time to launch en masse new sources of primary energy. Finally, the role of oil will be just that of an expensive and much needed source for chemical compounds, in a market able to pay for it. Gas plays the wild card role for an evolutionary bridging from the oil to the next (low-carbon) era. Lacking some of the oil production restrictions and being more attractive economically as a solution for ancillary investments in the mid/down-stream (electricity generation, space heating�), competition on the demand side rises fast and strong under this scenario, even more so than for oil. Increased demand not only
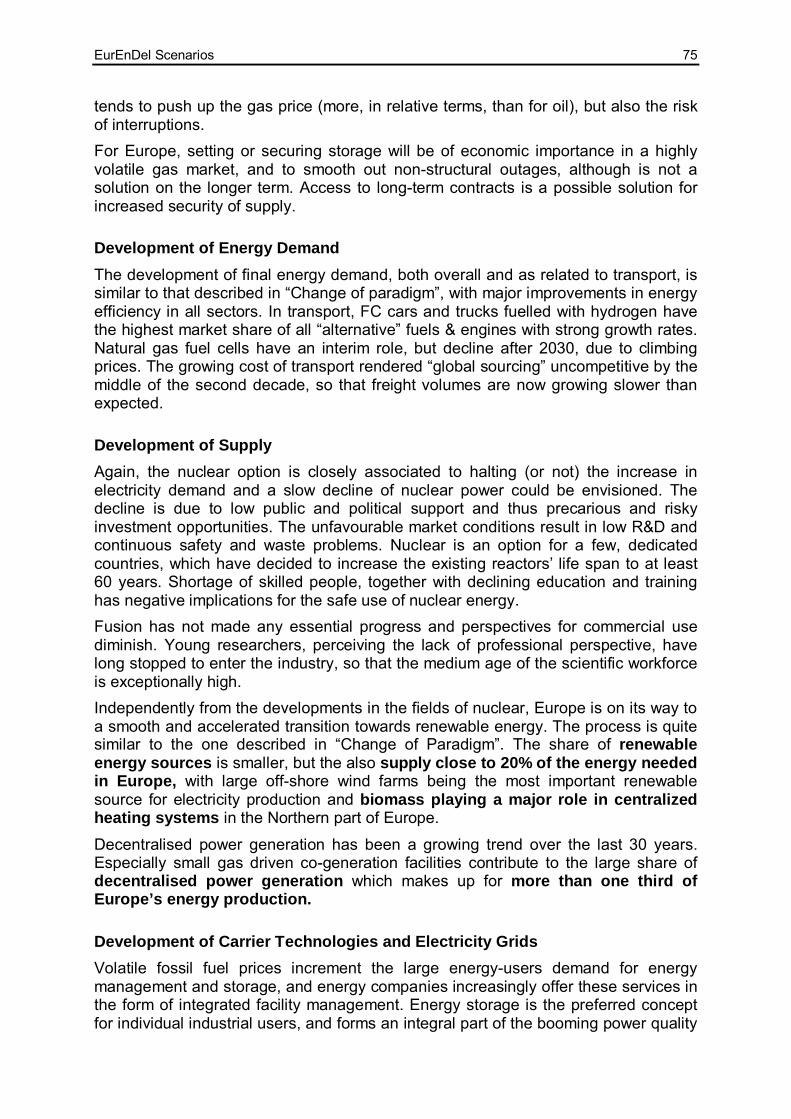
EurEnDel Scenarios 75
tends to push up the gas price (more, in relative terms, than for oil), but also the risk of interruptions. For Europe, setting or securing storage will be of economic importance in a highly volatile gas market, and to smooth out non-structural outages, although is not a solution on the longer term. Access to long-term contracts is a possible solution for increased security of supply.
Development of Energy Demand The development of final energy demand, both overall and as related to transport, is similar to that described in �Change of paradigm�, with major improvements in energy efficiency in all sectors. In transport, FC cars and trucks fuelled with hydrogen have the highest market share of all �alternative� fuels & engines with strong growth rates. Natural gas fuel cells have an interim role, but decline after 2030, due to climbing prices. The growing cost of transport rendered �global sourcing� uncompetitive by the middle of the second decade, so that freight volumes are now growing slower than expected.
Development of Supply Again, the nuclear option is closely associated to halting (or not) the increase in electricity demand and a slow decline of nuclear power could be envisioned. The decline is due to low public and political support and thus precarious and risky investment opportunities. The unfavourable market conditions result in low R&D and continuous safety and waste problems. Nuclear is an option for a few, dedicated countries, which have decided to increase the existing reactors� life span to at least 60 years. Shortage of skilled people, together with declining education and training has negative implications for the safe use of nuclear energy. Fusion has not made any essential progress and perspectives for commercial use diminish. Young researchers, perceiving the lack of professional perspective, have long stopped to enter the industry, so that the medium age of the scientific workforce is exceptionally high. Independently from the developments in the fields of nuclear, Europe is on its way to a smooth and accelerated transition towards renewable energy. The process is quite similar to the one described in �Change of Paradigm�. The share of renewable energy sources is smaller, but the also supply close to 20% of the energy needed in Europe, with large off-shore wind farms being the most important renewable source for electricity production and biomass playing a major role in centralized heating systems in the Northern part of Europe. Decentralised power generation has been a growing trend over the last 30 years. Especially small gas driven co-generation facilities contribute to the large share of decentralised power generation which makes up for more than one third of Europe’s energy production.
Development of Carrier Technologies and Electricity Grids Volatile fossil fuel prices increment the large energy-users demand for energy management and storage, and energy companies increasingly offer these services in the form of integrated facility management. Energy storage is the preferred concept for individual industrial users, and forms an integral part of the booming power quality
76 EurEnDel � Final Report; September 2004
market, while in larger industry parks, the facility management concepts include versatile on-site generation facilities and the reuse of energy by-products derived from industrial processes (steam and heat). The efficient combination of available on-site energy sources, in combination with on-site conversion facilities for electricity production and storage facilitates the introduction of new, electricity-fuelled production processes. By 2030 hydrogen is not yet produced in a quantity that allows for a substitution of electricity or other energy carriers, nor for large-scale use in transport. In short, Europe reacts rather late to the peaking of oil production and is forced to use larger volumes of imported gas, exposing itself to serious risks of supply interruption. Due to increasing societal pressure for adopting low-risk technologies, Europe�s institutional leaders finally accept that ecological concerns must prevail in other policy fields. But in 2030, Europe is still caught in the middle of a transition process towards a more sustainable energy system.
6.4. Comments on the Scenarios
6.4.1. Alternative Pathways It must be pointed out that two of the Scenarios contain �alternative pathways�, which, in methodological terms the two alternative combinations of factors are almost equally probable (i.e. they present a similar number of exclusions and preferences, according to the results of the Scenario Workshop). The �Change of Paradigm� scenario would permit to phase out nuclear production in Europe, but only under the condition that future electricity demand is also drastically reduced. Otherwise, the most likely option would be the continued use of nuclear power plants, in order to make up for reduced fossil fuel use. In the Fossil Fuel Scenario, a rapid, although rather late deployment of renewable energy systems also shows a very high degree of likelihood and would also be in accordance with the Delphi results.
6.4.2. Comparison to Quantitative Forecasting The EurEnDel Delphi results and Scenarios have been checked against a number of reference documents based on quantitative modelling, in order to validate the EurEnDel results and on the other hand to contribute to the interpretation of EurEnDel results in comparison to quantitative forecasting. The analysis embodies firstly the direct comparison between results of the EurEnDel Delphi survey in terms of time of occurrence and quantification of relevance of certain Delphi statements. Secondly the EurEnDel scenarios are classified in terms of their implied CO2 emissions development. Two quantitative studies were used for the comparison with EurEnDel Delphi results. These were �European Energy and Transport - Trends to 2030� [Mantzos et al. 2003] and the �With climate policies� scenario [Zeka-Paschou 2003]. It can clearly be seen that the results of the EurEnDel Delphi are generally more �optimistic� in terms of technical developments and structural changes compared to the reference studies. The �level of intensity� multiplier which visualises the distance between the Delphi energy experts� opinion and the model results moves up to >20 for certain statements.

EurEnDel Scenarios 77
As a conclusion, the differences should rather be interpreted as making clear what future developments are realistically achievable, if framework conditions, barriers and incentives are set correspondingly.
6.4.3. Quantitative CO2 Emission Classification of the Scenarios
“Change of Paradigm”: With the CO2 reduction to 1990 levels by 2012, the Kyoto protocol is not complied with domestically, but by means of the flexible mechanisms. The CO2 reduction by 1.5% annually later on is equivalent to a 25% reduction by 2030 compared to 1990. With this setting, the �Change of Paradigm� scenario is far more optimistic in terms of CO2 reduction than the quantitative �With Climate Policies� reference scenario [Zeka-Paschou 2003] used in the quantitative co-assessment of the EurEnDel project (cf. chapter 4.6).
“Fossil Fuel Wars”: Compliance with the Kyoto protocol is no issue under the �Fossil Fuel Wars� scenario. The envisaged growth of CO2 emissions by 14% compared to 1990 until 2030 is in line with the quantitative �no-climate-policies� baseline scenario recently published by the European Commission [Mantzos et al. 2003] that was used in the quantitative co-assessment of EurEnDel (cf. chapter 4.6).
“Muddling Through Across the Gas Bridge”: As in the �Change of Paradigm� scenario, the Kyoto protocol is not complied with domestically in the �Muddling Through Across the Gas Bridge� scenario, the CO2 emissions reaching 1990 levels by 2012. With the subsequent stabilisation of CO2 emissions at 1990 levels, Europe fails to engage in further domestic emission reduction for long term climate protection. The envisaged development of CO2 emissions is relatively close to the quantitative �With Climate Policies� reference scenario (cf. chapter 4.6).

78 EurEnDel � Final Report; September 2004
7. Policy Recommendations »The best way to predict the future is to invent it.« Alan Kay
This �Policy Implications� chapter summarises the findings of all previous steps of the EurEnDel project, compares them against current EU policies and formulates recommendations for policy makers on the EU level. R&D recommendations and policy implications are a result of a throughout analysis of the enormous amount of information gathered during realisation of the EurEnDel project. In order to make the results more useful for the decisions makers they are structured along the R&D recommendations (basic and applied R&D) and policy implications (market mechanisms, policy, public acceptance). Bearing in mind the international character of this study, the recommendations are not divided into national, regional and sub-regional characteristics. However, they are formulated in such a way that national organisations and decision makers can easily transform them to their country specific conditions. 23 The following parameters were examined during a cross-technology analysis in order to draw conclusions for policy recommendations:
• Time and likelihood of occurrence • Actions needed • Importance for visions • Impacts • Importance for scenarios • Current R&D policies and expenditures
7.1. “Safe Bet” and “Conditional” Technologies The basis for the development of policy recommendations was a division of the analysed technologies into two categories: �safe bet� and �conditional� technologies, which are characterised as follows: The technologies classified as “safe bets” should and most likely will play a prominent part in Europe�s future energy system. Thus, all decisions on strategic planning should consider the growing importance of these technologies. They show a strong robustness under a wide variety of framework conditions, they are desirable for the positive impacts associated with them and they are apt to meet future needs. They are outstanding as they are to the highest degree capable of meeting economic, ecological and social challenges, so that they satisfy all three aspects of sustainable development simultaneously. Therefore, they should receive a high degree of promotion in policy priority setting. „Conditional” technologies might be important for the future energy system but are not apt to satisfy all societal demands uniformly under all framework conditions. Despite their strengths they were assessed to have weaknesses with regards to
23 More detailed information on the issues covered in this chapter are presented in the EurEnDel working paper [Oniszk et. al 2004] which is available on www.eurendel.net.
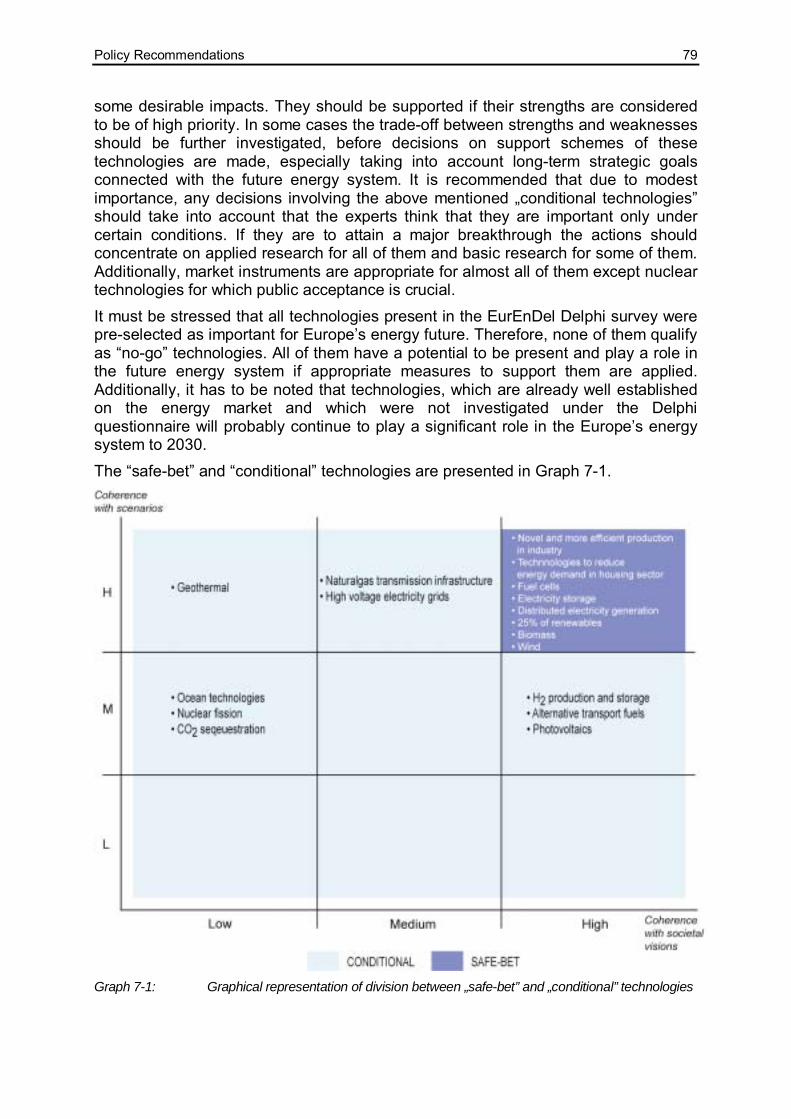
Policy Recommendations 79
some desirable impacts. They should be supported if their strengths are considered to be of high priority. In some cases the trade-off between strengths and weaknesses should be further investigated, before decisions on support schemes of these technologies are made, especially taking into account long-term strategic goals connected with the future energy system. It is recommended that due to modest importance, any decisions involving the above mentioned �conditional technologies� should take into account that the experts think that they are important only under certain conditions. If they are to attain a major breakthrough the actions should concentrate on applied research for all of them and basic research for some of them. Additionally, market instruments are appropriate for almost all of them except nuclear technologies for which public acceptance is crucial. It must be stressed that all technologies present in the EurEnDel Delphi survey were pre-selected as important for Europe�s energy future. Therefore, none of them qualify as �no-go� technologies. All of them have a potential to be present and play a role in the future energy system if appropriate measures to support them are applied. Additionally, it has to be noted that technologies, which are already well established on the energy market and which were not investigated under the Delphi questionnaire will probably continue to play a significant role in the Europe�s energy system to 2030. The �safe-bet� and �conditional� technologies are presented in Graph 7-1.
Graph 7-1: Graphical representation of division between „safe-bet” and „conditional” technologies

80 EurEnDel � Final Report; September 2004
�Safe-bet� Basic R&D Applied R&D Fiscal
measures Regulations Public acceptance
When will it
happen
% Biomass for heating widely used
15% freight on rail Mid
term
20
11-2
020
% Novel and more efficient processes in industry (50% of demand reduction)
% Reduction of energy demand in the housing sector (intelligent systems 50% of buildings)
% 25% of RES in primary energy
Ocean technologies in practical use
% 30% of distributed energy generation
% 20% of fuel cells for transport
25% of biofuels for transport
% Energy storage for intermittent RES widely used
Passive safe reactors (nuclear fission) in practical use
Superconductive materials are widely used in power systems
CO2 capture and sequestration in practical use
Long
term
202
1-20
30
Practical use of international grids for RES
5% of Photovoltaics
Nuclear fusion in practical use
High market penetration of H2 from RES
High market penetration of H2 from diverse sources
Biological production of H2 in practical use Ve
ry lo
ng te
rm, a
fter 2
030
Graph 7-2: Cross statement analysis: displayed are all technologies and trends analysed in the
first part of the questionnaire, the time frame when they will be developed to a certain degree (practical use, widely used and high market penetration) and which actions are most needed to promote them.
An overview of the cross-technology analysis of the energy technologies covered in the Delphi statements is presented in Graph 7-2. It aims at answering the following questions:
• Which are the �safe bet� (bottom part of the figure) and �conditional� technologies (upper part of the figure)?
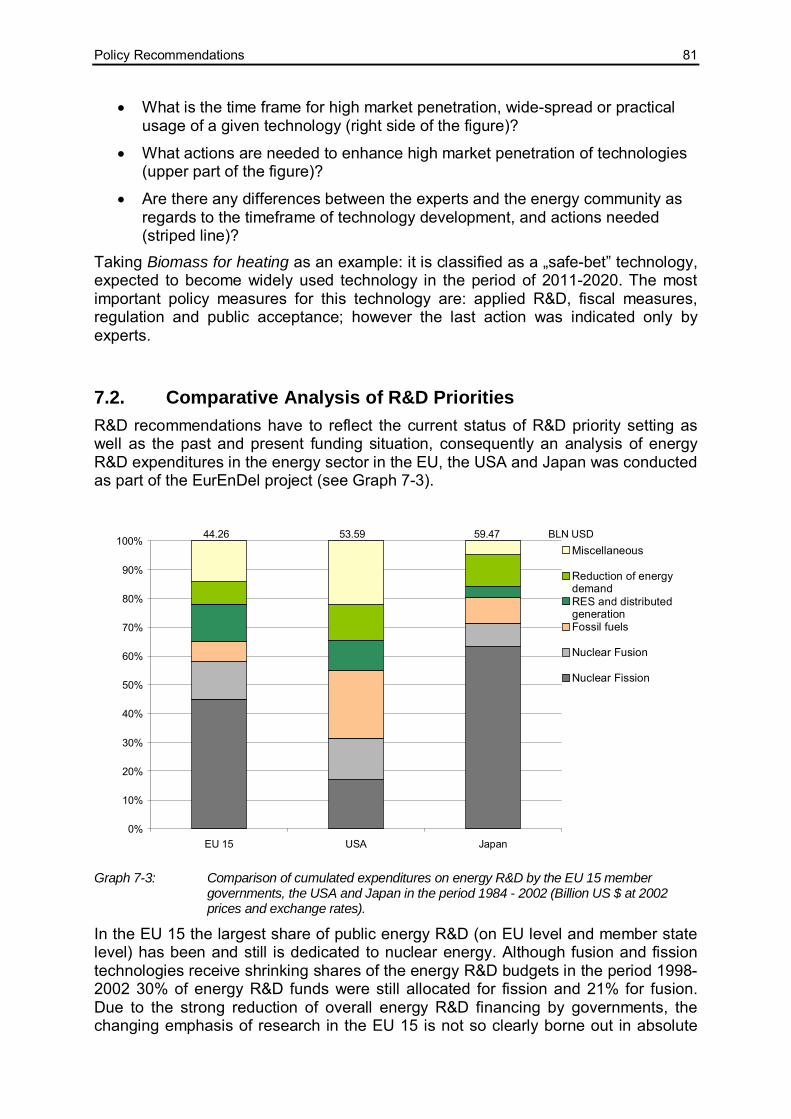
Policy Recommendations 81
• What is the time frame for high market penetration, wide-spread or practical usage of a given technology (right side of the figure)?
• What actions are needed to enhance high market penetration of technologies (upper part of the figure)?
• Are there any differences between the experts and the energy community as regards to the timeframe of technology development, and actions needed (striped line)?
Taking Biomass for heating as an example: it is classified as a �safe-bet� technology, expected to become widely used technology in the period of 2011-2020. The most important policy measures for this technology are: applied R&D, fiscal measures, regulation and public acceptance; however the last action was indicated only by experts.
7.2. Comparative Analysis of R&D Priorities R&D recommendations have to reflect the current status of R&D priority setting as well as the past and present funding situation, consequently an analysis of energy R&D expenditures in the energy sector in the EU, the USA and Japan was conducted as part of the EurEnDel project (see Graph 7-3).
0%
10%
20%
30%
40%
50%
60%
70%
80%
90%
100%
EU 15 USA Japan
Miscellaneous
Reduction of energydemandRES and distributedgenerationFossil fuels
Nuclear Fusion
Nuclear Fission
44.26 53.59 59.47 BLN USD
Graph 7-3: Comparison of cumulated expenditures on energy R&D by the EU 15 member
governments, the USA and Japan in the period 1984 - 2002 (Billion US $ at 2002 prices and exchange rates).
In the EU 15 the largest share of public energy R&D (on EU level and member state level) has been and still is dedicated to nuclear energy. Although fusion and fission technologies receive shrinking shares of the energy R&D budgets in the period 1998-2002 30% of energy R&D funds were still allocated for fission and 21% for fusion. Due to the strong reduction of overall energy R&D financing by governments, the changing emphasis of research in the EU 15 is not so clearly borne out in absolute
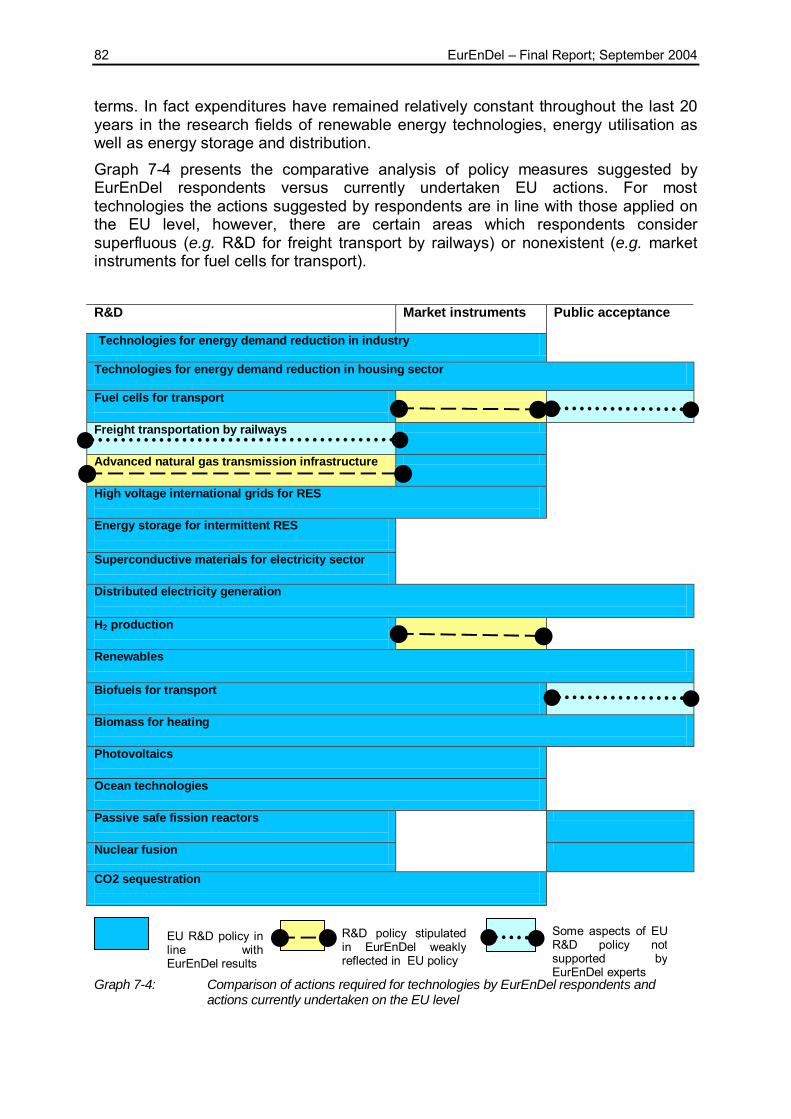
82 EurEnDel � Final Report; September 2004
terms. In fact expenditures have remained relatively constant throughout the last 20 years in the research fields of renewable energy technologies, energy utilisation as well as energy storage and distribution. Graph 7-4 presents the comparative analysis of policy measures suggested by EurEnDel respondents versus currently undertaken EU actions. For most technologies the actions suggested by respondents are in line with those applied on the EU level, however, there are certain areas which respondents consider superfluous (e.g. R&D for freight transport by railways) or nonexistent (e.g. market instruments for fuel cells for transport). R&D Market instruments Public acceptance
Technologies for energy demand reduction in industry
Technologies for energy demand reduction in housing sector
Fuel cells for transport
Freight transportation by railways
Advanced natural gas transmission infrastructure
High voltage international grids for RES
Energy storage for intermittent RES
Superconductive materials for electricity sector
Distributed electricity generation
H2 production
Renewables
Biofuels for transport
Biomass for heating
Photovoltaics
Ocean technologies
Passive safe fission reactors
Nuclear fusion
CO2 sequestration
Graph 7-4: Comparison of actions required for technologies by EurEnDel respondents and actions currently undertaken on the EU level
EU R&D policy inline withEurEnDel results
R&D policy stipulatedin EurEnDel weaklyreflected in EU policy
Some aspects of EU R&D policy not supported by EurEnDel experts

Policy Recommendations 83
7.3. In-depth Analysis of Results and Recommendations This chapter summarises the major considerations and recommendations for R&D policy developed within the EurEnDel project � they are highlighted in the boxes at the end of each section. The findings are described with reference to four major fields of energy R&D:
• Energy Demand
• Transport
• Grids and networks
• Energy supply The body of this chapter highlights background information in each respective field, which is based on the results of the Delphi survey, outlined in Chapter 4. These are supported by facts, figures and ideas submitted by the respondents in the course of the survey in the form of more than 1,600 comments to the technology statements and accompanying enquiries. Further contributions to the analysis have been provided by parallel research undertaken within the scope of the project as described in chapter 5 and 6 as well as the previous sections of this chapter.
7.3.1. Energy Demand Industry and housing Concerning energy savings in the housing sector, many experts point out, that the technology is already available. Thus a share of 50% low-energy houses of all new build houses in Europe could be reached before 2030. However, the experts consider the higher costs of investment in new technology as the greatest problem for energy efficient buildings. Furthermore efforts should not be limited to new buildings only but should increasingly address existing buildings in order to reduce the overall energy consumption. A separate issue concerns the strong increase in air-conditioning and in other energy intensive appliances which contribute to offsetting the rate of overall energy efficiency improvements in buildings despite gains in the efficiency of individual technologies. In a similar manner, diffusion of residential CHP/fuel cells may contribute to increasing energy efficiency of buildings but reduce funding available for energy efficient technologies in appliances and space heating applications. For an increase of energy efficiency in industrial production the experts point out that many large-scale production processes are already optimised, so that further improvements must rely on energy-efficient innovations, such as electrochemical substitutes for chemical reactions, heat integration in production processes, etc. The Delphi respondents state that in the time range considered a goal of a 50% decrease in energy consumption per unit of industrial production is facilitated after enlargement to EU25 (and beyond), because of the much greater energy saving potential of the new member states compared to the EU15. In both fields the technological maturity of energy saving technologies is relatively high, so that support mechanisms should concentrate on fiscal measures, such as the internalisation of external costs of conventional energy production, as well as on energy R&D in industrial process technologies.

84 EurEnDel � Final Report; September 2004
There is a very clear consensus among participants in the Delphi survey that technologies reducing energy demand have the most beneficial impacts and must be favoured independently of the pursued social values. Energy efficiency was rated most important no matter which aspect of sustainability was to be emphasised. Both in industry and the residential sector, energy efficient technologies are certain to become the most decisive element of Europe�s energy future. However, high levels of energy efficiency in these sectors can only be achieved in a longer term perspective, after 2020.
Demand-side oriented technologies have historically suffered from under-investment and may not be receiving appropriate support. Improving energy efficiency in housing and industry needs to be strongly backed by applied research. However, due to the long life expectancy of buildings (80 -100 years), drastic improvements in energy efficiency in the short and medium term are difficult to achieve, while energy savings in existing buildings require fiscal incentives, regulation and public sector support even more than applied R&D. Given the high priority of energy demand reduction and considering the strong research engagements of the USA and Japan in energy efficiency research, it is recommended that applied research efforts in related technologies and systems are intensified.
7.3.2. Transport Containing rising energy demand in the transportation sector has been identified as a crucial challenge for Europe�s future energy system. The EurEnDel analysis confirms that purely technological solutions are not capable of achieving this end and that efforts must be intensified on various levels, employing all available means. Demand side technology options included in the Delphi were fuel cells and freight transport by rail. Fuel cells for transport It seems certain that fuel cells will play a major role in the future, contributing to improve energy efficiency in transportation and reducing local emissions. Fuel cell driven cars are predicted to have a major market share significantly before a hydrogen economy is established. Thus flexibility of design with the option to use natural gas as a transition fuel will be crucial in the development path of fuel cells for transportation. A breakthrough in fuel cell development would be facilitated by high fuel prices and, in the longer term, shortages in crude oil supplies. While some participants in the Delphi link fuel cells directly to the need to build up a hydrogen economy, others argue that over the next 20 to 50 years fuel cells will be using predominantly natural gas. Many also point out that a central question in judging the technological and market impact is the origin of the hydrogen fuel: production from renewable energy sources, nuclear, or fossil. At the same time, it was underlined that an increasing market share of fuel cells would have a positive influence on the development of the hydrogen system.
Further strong support to research is necessary in order to achieve a technological breakthrough in fuel cells for transport. This must be undertaken

Policy Recommendations 85
bearing in mind that the choice of the fuel is decisive for maximizing environmental benefits of the option. At the same time, market instruments (mainly fiscal measures) are needed to ensure the timely extension of distribution infrastructures for the alternative fuels through the transition period.
Freight transport by rail The share of freight transport by rail in the European Union has decreased steadily in the last 30 years, from 20% in the early 1970s to barely 8%. The European rail stakeholder (UIC, CER, UIPT, UNIFE) set the target for the share of �freight transport by railways� at 15% in 2020 [EC 2001]. The Delphi experts consider an increase in the railway share from the current 8% to 15% as realistic in the mid-term. However, a crucial element in achieving this objective is the price ratio between various transport options (rail, road and sea). Prices will be influenced by new investments needed to increase the capacity of transport systems and by policy instruments such as subsidies and taxes. Another important issue highlighted by the experts was the need to improve international connections between the EU countries and strengthening interoperability.
Increasing the share of �freight transport by railways� is perceived as desirable by most participants in the survey. However, basic or applied R&D in the field of logistics and inter-modal concepts is considered to have only minor importance in the effective promotion of this transportation mode. The success of inter-modal concepts and improved logistics in favour of rail transport is ultimately dependent on the structure and organisation of railway systems, the prevailing government policies, their management and governance. Though in the longer term innovations and technological improvements can positively influence the development of freight transport by rail, R&D efforts must be accompanied by infrastructure expansion, fiscal and regulatory support measures aiming at significant changes in the framework conditions.
7.3.3. Energy Storage and Grids
Energy storage technologies Comments received from Delphi participants suggest that developments in energy storage may in time lead to a complete overhaul of the energy system. There is little doubt about the technical feasibility of electricity storage within the indicated time frame since technologies such as pumped storage have been in use over many decades and are frequently an essential part of existing power systems. Redox flow batteries, fly wheels, super capacitors, hydrogen storage and other systems are still too expensive to be in widespread use, but may become important in the medium term in specific applications. New fields of research contemplated for the longer term are based on organic and silicate chemistry and electrochemical storage. However, barring exceptional breakthroughs, these currently seem too expensive for use in renewable energy systems. The Delphi experts also differentiate between two areas of technology development: large seasonal storage and small short-term storage. Besides the backup supply function, particularly in isolated systems, they stress the need for power quality as a further important driver for storage technologies.
86 EurEnDel � Final Report; September 2004
One of the main issues regarding storage technologies is cost effectiveness and energy pricing, especially peak-time pricing. If prices are set right, storage systems may be expected to become a competitive element of power generation and distribution systems. Moreover, in the interests of security of supply, the Delphi experts discourage the extensive diffusion of storage technologies which are not yet fully developed and tested.
The consensus among most Delphi participants is that energy storage technologies will become increasingly important after 2020. They indicate a strong need for both basic and applied research, while there have been signs of under-investment in R&D other than in relation to the hydrogen system.
Innovations in storage technology are particularly crucial for the development of renewable energy systems, where storage is the key to integrating power generation from intermittent sources. A long-term research commitment in this sector with dedicated promotion by public authorities seems essential to support an increasing share of renewables in Europe�s energy system.
Distributed energy systems The results emerging from the Delphi survey indicate that the production of power, heat and biogas in distributed energy systems (DES) can play a key role in Europe�s energy system, particularly in combination with the development of local renewable energy resources and storage technologies. In this regard, recent technological advances in small scale (<10 MW) combined heat and power production from biomass open up new opportunities in the development of DES. Distributed generation technologies are in very different stages of development. A number of power generation systems available today in the 1.0 to 10 MW range can already be reliably embedded in existing distribution networks. However, prime movers in smaller sizes (10 to 500 kW) remain more difficult to control on the low voltage side of existing grids. Wind power and cogeneration plants as well as photovoltaic power systems are particularly well suited for integration in DES. Promotion of these technologies can have positive synergic effects also on the development of DES. However, instability problems need to be resolved in the case of wind, while the high cost of photovoltaic power make this solution prohibitive as a key element of DES at the present time. The basic obstacle for the development of DES is the lower efficiency and higher cost of small scale generating plants compared to central station power generation. However, avoided investments in high voltage transmission lines, the potential savings in grid operation and management, due to a more balanced distribution of power nodes, and the benefits of greater security of supply can significantly reduce the costs of DES in the case of suitably meshed networks.
A steadily increasing share of distributed electricity generation is considered very likely under all framework conditions analysed in EurEnDel and highly beneficial for its contribution to increasing security of supply. Energy R&D needs to be directed specifically to the development of small scale technologies using local renewable energy resources and to attaining greater stability in low voltage distribution grids. Delphi respondents refer to environmental taxation, feed-in tariffs, and changes to the legal framework (for example, legislation on rented housing) as primary steps
Policy Recommendations 87
towards the promotion of distributed energy systems. Regulations and fiscal measures can also contribute to guaranteeing adequate grid development.
Super-conductive materials in the electricity sector The relatively few comments received on super-conductive materials express serious doubts that significant savings would actually result from their widespread use. In addition, several respondents recall that extensive implementation of the technology depends on the development of high temperature systems. It was also pointed out that in the longer term the development of hydrogen as an energy carrier could reduce the importance of superconductivity in energy transport.
Overall, the Delphi respondents consider the development of super-conductive materials to support the strengthening of the European electric power system, through greater efficiency in energy transport and storage. Despite its currently low degree of maturity, 98% of the experts believe the technology to be a viable option in the longer term. EurEnDel participants recommend that the most effective way of promoting technological progress in this area is by intensifying basic and applied R&D also through projects undertaken jointly with other EU research areas (such as medical science) with interest in super-conductive materials.
Hydrogen carrier In their comments, the Delphi experts recognise that hydrogen energy systems have been investigated for a long time without significant progress. Implementation of a viable fuel cycle before 2030 requires increasing research efforts on a European scale. Current efforts are unlikely to lead to a significant role for hydrogen as an energy carrier before 2050. Nevertheless, distinct time scales are expected for transport and stationary applications. There is a lack of consensus on the importance of hydrogen as a substitute for fossil fuels over the time horizon of the study, whether this could take place on a regional scale and, more specifically, whether Europe should strive towards a �hydrogen economy�. At one extreme is the point of view of respondents who consider that it will be inevitable some time before 2030 in the wake of increasingly costly and depleting oil and gas resources; at the other, is the conviction that there are more efficient and less costly alternatives to bridge the possible gap between supply and demand. The main problem associated with the use of hydrogen is the need to invest in extensive, new infrastructure for production, transport and storage as well as the safety considerations. Technical difficulties related to the handling of this fuel may be solved by European standardisation. But hydrogen is likely to be perceived as potentially dangerous and one major accident could jeopardize advances in research. Moreover, serious doubts exist concerning the overall efficiency of the fuel cycle. A key issue regards the long-term impact of the hydrogen fuel cycle on the environment. Production from fossil fuels and as a by product from nuclear fission are explicitly rejected by many experts as a long term solution, although production from fossil fuels may be important in the transition period. There are strong recommendations to strive for the production of hydrogen from renewable energy sources, avoiding CO2 emissions. But the potential of renewable sources in the EU may be too limited for large-scale production.

88 EurEnDel � Final Report; September 2004
The principal message that comes out of the Delphi survey is that the development of hydrogen production and storage requires greatly intensified basic and applied R&D. Even so, large-scale production of hydrogen as an energy carrier and as a substitute for secondary fuels will only occur in the very long term, after 2030. There was a fairly broad consensus among respondents on a long term strategy focussing on hydrogen production from renewable sources as opposed to fossil fuels and nuclear energy. In either case, it is necessary to address the issue of new transport and storage infrastructure early in time to avoid bottlenecks to future expansion. To this end an adaptable development path should be established identifying hydrogen�s future role in the European energy system. Policies to promote the introduction and expansion of the hydrogen economy are premature, given the early stage of development of this fuel, but fiscal measures can contribute already in the transition stage while regulations may be postponed.
7.3.4. Energy Supply
Renewable energy technologies In the 1997 White Paper �Energy for the Future� [EC 1997], the EU Commission identifies a 12% share of renewable energy sources (RES) in the primary energy balance as a strategic target for the EU � 15 by 2010. Most Delphi respondents indicate that it should be possible to achieve a 25% share in Europe as a whole shortly after 2020. Reaching a 25% share of renewable energy sources is claimed to be realistic if appropriate political decisions are taken and total energy demand does not increase substantially. However, a significant number of respondents sees no chance of achieving a 25% target because of the limited technical potential in Europe, the slow penetration into entrenched fossil systems and the still considerable increase in energy demand. They also point to obstacles such as lack of political will, low public acceptance of local environmental impacts, continuing high costs and technological handicaps, such as intermittent production. The nature of support measures required to accelerate the diffusion of RES vary widely among technologies. Relatively mature technologies, such as �biomass for heating�, need less R&D but rely heavily on fiscal and regulatory policy for their growth. At the other extreme are immature technologies, such as ocean energy systems, for which market support is currently irrelevant. Technologies in intermediate stages of development, such as photovoltaic systems, require both intensive support in terms of both basic and applied R&D, but can also greatly benefit from promotional strategies aiming at enlarging their market capabilities.
Respondents broadly agreed that a strong increase in the use of renewable energy sources has important implications for the environment and for the long-term security of energy supplies. The development of RES also contributes to regional cohesion. However, intensified basic and applied research as well as specific and resolute support schemes promoting the diffusion of RES technologies are necessary to obtain a strong increase in their utilisation in the period to 2030. A strong synergic role in achieving a high share of RES in the primary energy balance can be played by efficiency improvements in the production, transport and utilisation of energy.

Policy Recommendations 89
Biomass and biofuels Biomass received very favourable ratings in the Delphi survey, not only because of its ecological attributes and its contribution to security of supply, but also for its role in wealth creation and regional cohesion, specifically the creation of jobs on a regional scale. The near term potential of this energy source and its expected positive impacts justify a stronger support than is currently the case. Many participants indicate that biomass is already widely used for heating in some Northern countries, but questions remain regarding resource availability, strong regional differences in potential, high production costs and logistic problems related to transport over long distances of low density fuels. The Delphi experts also point to potential environmental problems related to sustainability of biocrop monocultures and pollution from biomass use. The key determinant in the penetration of biofuels into the transport market is the availability of suitable biomass sources. However, attaining a 25% share in this sector in the time scale considered depends ultimately on the growth in transport sector demand and many experts claim it will not be possible in the absence of strong measures to reduce this through energy efficiency improvements, shifts to public forms of transport and rationalisation of transport patterns. As in the case of biomass utilisation in other sectors, the main problem with strong biofuels development regards sustainability in relation to the strain on soil use and the environmental risk of monocultures. As a partial solution, some experts stress the use of crop waste rather than dedicated crops.
The majority of Delphi participants agree that biomass could be in widespread use already in the mid-term perspective, shortly beyond 2010. However, the resource potential can be a limiting factor over large areas of the European land mass, though this could be partly alleviated through the development of biomass delivery and trading schemes from regions with large potential.
Applied research in biomass utilisation and biofuel conversion technologies can significantly contribute to increasing the use of biomass resources in the short and medium term. In recent years there have been signs of under-investment in this field of energy R&D compared to most other renewable energy resources, though there is still much scope for technological progress both in relation to efficiency improvements and cost reduction. Because of uncertainties concerning the role of biomass and biofuels in Europe�s energy system, research is also needed to evaluate the potential of these resources under different development options, so that realistic implementation strategies can be planned.
Photovoltaics The image of photovoltaics (PV) that emerges from the Delphi exercise is that of a highly valued and desirable technology. However, the experts comment on a number of significant obstacles limiting the role of this technology in Europe's energy system in the medium term. These are above all the relatively low potential of direct solar energy over most of the continent and the persisting high cost of electricity produced from existing and near term technologies, due to the low efficiency of conversion and high cost of materials. Moreover a number of experts felt that the development of other renewable energy sources could limit the rate of penetration of PV in Europe in the period considered. The general consensus is that R&D and activities in this field and in related areas such as energy storage should be strengthened also through international cooperation. Demand side measures to accelerate development in

90 EurEnDel � Final Report; September 2004
Europe include integration of PV devices in construction materials in combination with new building designs.
Achievement of a 5% share of PV in electricity production received an impact rating higher than any other renewable energy source analysed in the Delphi survey. PV does not classify as a �safe bet� technology in the EurEnDel analysis, only because of uncertainties in the rate of technological progress. In fact, even a major breakthrough is not expected to significantly increase its role in Europe's energy supply before 2030. There is more scope for a substantial increase in the period beyond, depending on improvements and new discoveries. The qualification of PV as a viable long-term technology is justified by the promise of future technological advances. Most experts point to applied research as the key to progress and innovation in PV technology, although many indicate that basic research is still necessary.
Nuclear power (fission and fusion) A number of Delphi comments point to the apparent contradiction between the high share of funding for nuclear energy research, especially fusion, and the meagre positive impacts anticipated over the next 35 years. Though fusion goes beyond the time scale of the EurEnDel study, there is great uncertainty on the potential of the technology, which is mirrored in the fact that almost a quarter of the respondents expect that fusion will never be in practical use. The technology is considered too expensive and there is as yet no clear evidence of a breakthrough, despite massive R&D investment over the years. The crucial issue in the case of nuclear fission is public acceptance related to the safety aspect in all phases of the nuclear cycle. The respondents highlight as major obstacles the unsolved problem of waste management and the risks from political instability, terrorism and war. One of the few positive notes expressed in the comments in favour of nuclear technologies is that they are practically free of CO2 emissions and thus are in a good position to fulfil the Kyoto targets.
The EurEnDel respondents are openly divided on nuclear technologies. They agree on the positive impact of nuclear power in reducing CO2 emissions, but disagree on the perception of risk and safety as well as on the waste management problem. All are very much aware of the delicate issue of public acceptance. One group recommends improving public information on nuclear technology, while the other favours reorienting R&D resources from nuclear power to the alternative energy sources. Respondents qualifying themselves as experts in the field, perceive nuclear fission as important to enhance security of supply. However, this view is not shared by the energy community as a whole, which explains the low overall rating received in the impact assessment both for new fission reactors and fusion research. There is consensus on the need to improve public safety and waste treatment technologies, but overall the EurEnDel survey does not provide encouraging recommendations for long-term research. CO2 capture and sequestration In their comments the Delphi respondents express a lack of belief in the technology as a long-term solution to greenhouse gas emissions, pointing to insurmountable technical obstacles. Although the technology is already in use in small-scale

Policy Recommendations 91
demonstration projects, the prevalent assessment is that the long-term prospects of CO2 sequestration is in doubt. The key problem lies in the high costs of the infrastructure needed to sequestrate CO2 in comparison to other emission reduction options (energy conservation, fuel switching, renewable energy development and reforestation). Essentially none of the respondents indicates sequestration as the preferred abatement option. Major uncertainties regard the long-term storage of CO2 and public acceptance, given the unknown impact on the environment and considering the risks of leakage, industrial accidents and natural catastrophes such as earthquakes.
The Delphi respondents generally rated the anticipated impacts of CO2 sequestration as rather low, largely in relation to the uncertainties connected with the technology. They indicated that research efforts should concentrate on minimising risks concerning public safety, also through the parallel development of monitoring and verification techniques.
Policy Recommendations 92
7.4. Conclusions The EurEnDel findings provide a twofold contribution to the analysis of Europe's energy policies:
• they corroborate the conflicting attitudes and paradigms prevalent among energy experts, with valuable new dimensions for the on going energy debate;
• they offer genuine new insight on energy issues, with added value for decision makers.
This final chapter summarises the most important results of the EurEnDel survey. The underlying objective of EurEnDel was the assessment of long-term trends and needs in the fields of energy technologies. Special attention is given to faithfully translating the trends and needs identified by the survey participants into recommendations for R&D and energy policies.
Highest Priority: Energy efficiency • The foremost message from the EurEnDel exercise is that energy efficiency
technologies are the decisive element in Europe�s energy future. The EurEnDel participants are quite resolute in their appraisal that technologies to reduce energy demand have the most beneficial impacts and must be favoured independently of the societal vision pursued. No matter whether we strive for economic well-being and liberty of choice, ecological balance or social equity, demand-side options to reduce Europe�s dependence on energy supplies are highest on the list of priorities.
• However, despite their high potential and societal needs, supportive actions to improve energy efficiency must be intensified combining research, fiscal incentives and initiatives to promote end-user acceptance in order to avoid the high underinvestment risk.
• In housing and industry, long-term strategies are vital since high rates of energy efficiency improvements in these sectors can be achieved only in long term perspective, beyond 2020. Efficiency improvements in housing and industry rely heavily on fiscal incentives and regulation. However, by analogy with the priority given to research in these fields in the USA and Japan, market measures need strong backing from applied research in energy efficiency technologies.
• Enhancing energy efficiency in housing and industry is facilitated in the enlarged Europe because of the greater energy saving potential in new member states. However urgent action is necessary in all 25 member states, to obtain the expected results.
• Containing the increase in transport energy demand was identified as one of the most difficult challenge for Europe�s energy system. The EurEnDel analysis indicates that there is no simple solution, capable of meeting this challenge. Efforts need to be intensified on all levels and employ all available means. The EurEnDel survey focussed on fuel cells and freight transport by railways as two solutions that can play a significant role.
• Fuel cells meet all the criteria for classifying as a safe-bet technology. They are well placed to play a major role in future transport systems, contributing both to energy efficiency improvements and reduction of local emissions. Fuel cell driven

Policy Recommendations 93
cars are expected to reach a significant market share well before the hydrogen economy is established. Thus flexibility of design using natural gas as a transition fuel will be crucial in the development of fuel cells for transportation.
• Though fuel cells for transport as well as hydrogen production still require substantial research support, many Eurendel respondents are of the opinion that the technology could already benefit from the application of market measures (essentially fiscal incentives), due to potentially strong cost reductions coming from economies of scale.
• As for other mature technologies, fiscal and regulatory measures are the most important means of supporting freight transport by rail, though research still has a significant role to play. However, the future role of railways in freight transport depends more than anything on political choice.
High Potential: Renewables • The majority of the EurEnDel experts believe that 25% of Europe’s total energy
demand can be met by renewable energy sources before 2030. However, this target is deemed to be realistic only if renewable energy technologies receive appropriate support and in combination with strong energy efficiency improvements.
• The survey respondents consider a high share of renewable energy sources as highly beneficial from a societal point of view. Renewable energy development rated second in priority after demand-side oriented solutions. Basic reasons behind the high overall ranking were its positive impact on the environment, its contribution to security of supply and its potential for regional development.
• Biomass has the greatest potential to play a significant role in Europe�s energy future. Both biomass utilisation technologies and biofuels production need applied research to enhance their competitiveness over the short and medium term. However, biomass resources are limited and there will be a competition for the use of land for biomass production for different energy related purposes (electricity, heat, transportation).In this respect, considerable uncertainties exist concerning the role of biofuels in Europe�s future energy system. Research directed at evaluating effective biomass potentials seems necessary to identify strategic long term options.
• Photovoltaic technology can play a significant role in Europe�s energy future in the longer term. A 5% contribution to Europe�s electricity supply is considered possible between 2030 and 2040. However, such a high share implies that PV is competitive with alternatives and is held to be realistic in this time frame only as a result of a major technical breakthrough. Attaining such an ambitious target requires both basic and applied research, but also market expansion through adequate economic incentives.
• Besides technical and economical hurdles a key factor hindering the development of some renewables (such as wind an biomass) is public acceptance in relation to land change issues, landscape pollution, reduced comfort and distrust towards unknown technologies. Lack of public acceptance and antagonism from some decision makers results in smaller demand for these technologies and can delay technological maturity.

94 EurEnDel � Final Report; September 2004
Increasing Importance: Distributed Electricity Generation and Energy Storage • Energy storage is not just one of many elements of existing energy systems, but
a key component in the future generation of electricity from intermittent renewable energy sources. Achieving a high share of renewables in Europe�s energy system is not possible without a long term commitment in this field. Yet the Delphi results clearly indicate the risk of under-investment in energy storage R&D under current support schemes. The participants in the survey underscore a strong need for both basic and applied research.
• Energy storage technologies are endorsed by the Delphi participants not only in relation to societal visions favouring renewable supply sources. Energy storage technologies will become increasingly important in the future also in relation to the development of distributed energy systems and are therefore a fundamental element of societal visions favouring individual choice.
• The hydrogen system has the potential to become a major storage option. However, due to the long time horizon for hydrogen to contribute significantly to Europe�s energy system other storage alternatives, including batteries, flywheels and super-capacitators also have to be pursued.
• The assessment of the hydrogen economy provided by the EurEnDel respondents depends on the source of the hydrogen. A hydrogen economy for its own sake is difficult to justify from an economic and environmental standpoint and less beneficial. The prevalent position is that hydrogen production from renewable sources is to be preferred mainly for environmental reasons. However, other sources (natural gas, coal or nuclear energy) may be required as bridges in the transition to a hydrogen economy based on renewable energy sources. To this end it is deemed important to identify a suitable long term growth path establishing framework conditions for the large new infrastructure needs required in the expansion of the hydrogen economy.
• The development of superconductive materials was considered to support the fulfilment of major policy and technology goals such as strengthening of the European electricity transmission grid, reduction of transmission and distribution losses and more efficient energy storage. Although it is now in very immature stages of development, the vast majority of the EurEnDel participants consider it to be a viable option for the future energy system.
Controversial Issue: Nuclear Energy • A large majority of the EurEnDel participants do not expect the introduction of
passively safe reactor types in Europe before 2020. However, it seems a controversial issue considering that almost 20% of the respondents do not believe it will ever occur. Despite its importance for security of supply and CO2 abatement, nuclear fission was given very low ratings in the impact assessments.
• Roughly three quarters of the experts believe that at some point in the future nuclear fusion will be in practical use. However, this was the most controversial issue covered in the EurEnDel survey. Due to the very long-term perspective for its technological maturity, fusion generally received very low impact ratings. Some experts even doubt whether high support levels for nuclear fusion should be continued at all as there have been no clear signs of a major breakthrough

Policy Recommendations 95
and there are no chances for the commercialisation of this technology before 2030. In any event, the Delphi respondents generally agree that the perception of nuclear fusion in the public mind should be decoupled from that of nuclear fission.
• Both nuclear technologies elicit the largest divergence between participants based on national origin. While there seems to be a fairly high consensus between respondents from different countries on the technical feasibility and the anticipated time horizons, there are strong disagreements on the expected societal impacts and whether or not the technologies will be in practical use in Europe.
Intermediate Solution: Natural Gas • Most of the Delphi participants agree that natural gas can play an important role
towards a more sustainable energy supply future for Europe. However, they also stress the need to avoid excessive reliance on this energy source for security of supply reasons. Many emphasize the transitional character of this resource as a bridge to a more sustainable energy future not based on fossil fuels. Consequently growth strategies should ensure compatibility with truly sustainable long-term options. In any event in the period considered a strong increase in natural gas imports can be anticipated together with high investments needed to build up the necessary infrastructure (pipelines and liquefaction facilities). R&D efforts in this field can contribute to bringing down the costs of natural gas transportation and storage infrastructure.
Other issues • Participants in the survey broadly agree that long term reliability and safety (both
real and perceived by the public at large) are the most crucial issues for the development of nuclear power. To a lesser extend this also holds true for the hydrogen system (production, transport and storage) as well as CO2 sequestration and storage.
• Another pervasive issue throughout the Delphi response is that, both in the case of demand and supply side technologies, the level of energy prices should reflect the external costs, in order to increase the economic competitiveness of emerging technologies.
96 EurEnDel � Final Report; September 2004
8. References [EIA 2003] Energy Information Administration, Annual Energy Outlook 2004, DOE/EIA-
0383(2004). U.S. Department of Energy, Washington, DC, December 2003.
[EC 1997] European Commission, 1997. Energy for the future: Renewable sources of energy - White Paper for a Community strategy and action plan, COM(97) 599. Brussels
[EC 2000] European Commission, 2000. Towards a European strategy for the security of energy supply (Green Paper), COM (2000)769. Brussels.
[EC 2001] European Commission, 2001. White Paper - European transport policy for 2010: time to decide, COM(2001) 370. Brussels.
[ENS 2002] Washington DC, November 19, 2002 (ENS) � Environment News Series 2002. http://ens-news.com/ens/nov2002/2002-11-19-02.asp
[EUREC 2002] The Future for Renewable Energy 2. Prospects and Directions, Brussels: EUREC Agency (European Renewable Energy Centres Agency), 2002
[Fraunhofer 1998] Fraunhofer-Institut für Systemtechnik und Innovationsforschung �DELPHI� 98. Studie zur globalen Entwicklund von Wissenschaft und Technik. Zusammenfassung der Ergebnisse. Methoden- und Datenband�, 1998
[Cahill and Scapolo 1999] Cahill, Eamon / Scapolo, Fabiana and others, �The Futures Project. Technology Map�. Series no 11, European Commission, Directorate General JRC Joint Research Center, 1999
[Coates et.al. 1997] Coates, J.F.; Mahaffie, J.B.; Hines, A. (1997): 2025: Scenarios of US and Global Society Reshaped by Science and Technology, Oakhill Press
[Czech Technology Foresight 2002] Ministry of Education, Youth and sports of the CR: Proposal of the National Research Programme 2002. Technology foresight in the Czech Republic, 2002.
[Gordon 1994] T.J. Gordon, 1994. The Delphi Method, AC/UNU Millennium, Project Futures Research Methodology.
[GWU 2002] George Washington University 2002: The GW forecast, http://gwforecast.gwu.edu/index.asp
[Häder and Häder 2000] Häder, Michael and Sabine Häder, eds. 2000. Die Delphi-Technik in den Sozialwissenschaften. Wiesbaden: Westdeutscher Verlag.
[Halal and Kallmeyer 2004] Halal, William E. and Jeffrey Kallmeyer, 2004. �Technology Forecasts for Improving National Energy Modelling Efforts.� TechCast LLC, Washington, D.C., March 2004.
[IDA 2002] Ingeniørforeningen I Danmark (IDA) Danish Association of Engineers: Energy technology foresight. Visions for the future energy systems (only in Danish). Copenhagen, 2002. www.ida.dk
[Illum 2004] Klaus Illum: Oil-based Technology and Economy - Prospects for the Future - A short introduction to basic issues and a review of oil depletion projections derived from different theories and methods� published by the Danish Board of Technology and the Society of Danish Engineers, March 2004. accessible at http://www.tekno.dk/subpage.php3?article=1025

References 97
[Jörß and Wehnert 2004] Wolfram Jörß, Timon Wehnert: �Quantitative co-assessment of the EurEnDel Delphi results�, 2004, accessible at http://www.izt.de/eurendel/survey_results/index.html
[Jørgensen et. al 2004] Birte Holst Jørgensen, Oliver Nielsen, Tobias Reuss, Timon Wehnert: �Delphi report�, 2004, accessible at http://www.izt.de/eurendel/survey_results/index.html
[Laitner 2004] John A. �Skip� Laitner: � Exploring the Energy Impacts of Unanticipated but Emerging Technologies: Some Preliminary Insights�, Presented at the WorldFuture 2004: Creating the Future Now!, World Future Society Annual Meeting, World Future Society, Washington, DC, August 2004.
[Larsen and Petersen 2002] Larsen, Hans & Leif Sønderberg Petersen (eds.) 2002: Risø Energy Report 1. New and emerging technologies � options for the future, Risø National Laboratory, Denmark
[Linstone and Turroff 1974] Linstone, H.A, Turroff, M. ed. 1974. The Delphi Method � Techniques and Applications.
[López and Velte 2003] Juan Pedro López de Araguas, Daniela Velte: �Results of the Cross-Impact Analysis - Identifying Key Issues of Europe�s Energy Future� EurEnDel structural analysis report, 2003, accessible at http://www.izt.de/eurendel/survey_results/index.html
[Loveridge et.al. 1995] Loveridge, D., Georghiou, L. & Nedeva. M. (1995): United Kingdom Technology Foresight Programme, Delphi Survey, PREST, University of Manchester, 543 pp.
[Magnusson et al. 2000] Leif Magnusson et al. (eds.): Swedish Technology foresight. A Synthesis Report from the Swedish Technology foresight Project. The foresighted society. Västerås: Stenby Offset, 2000. ISBN 91 7082-668-4
[Mantzos et al. 2003] Mantzos, L., Capros, P., Kouvaritakis, N., Zeka-Paschou, M., Chesshire, J., Guilmot, J.F.: �European Energy and Transport - Trends to 2030�, European Commission, Luxembourg: Office for Official Publications of the European Communities, 2003, ISBN 92-894-4444-4 accessible at: http://europa.eu.int/comm/dgs/energy_transport/figures/trends_2030/index_en.htm
[Mantzos 2003a] Mantzos, L.: �Note on �with� and �without climate policies� scenarios definition� in the framework of the CAFE stakeholder consultation process managed by the European Commission, DG Environment, 2003, http://forum.europa.eu.int/Public/irc/env/cafe_baseline/library?l=/baseline_data/summary_tables/scenarios_definition/_EN_1.0_&a=d
[Nakicenovic and Riahi 2002] Nakicenovic, Nebojsa & K. Riahi 2002: An Assessment of Technological Change Across Selected Energy Scenarios, International Institute for Applied Systems Analysis, Laxenburg, Austria (also published by the World Energy Council 2001)
[Ninni, Bonacina 2004] �Social and technical perspectives�, 2004, accessible at http://www.izt.de/eurendel/survey_results/index.html
[NL 1998] Ministry of Economic Affairs, The Netherlands (1998): Technology Radar. Vol. 1-5, Ministry of Economic Affairs/RAND Europe
[NRCETF 1999] Natural Resources Canada Energy Technology Futures: Results from the Renewable Energy Focus Group, February 18, 1999.http://www.nrcan.gc.ca/es/etf

98 EurEnDel � Final Report; September 2004
[Oniszk et. al 2004] Anna Oniszk-Popławska, Łukasz Jaworski, Augusto Ninni, Oliviero Bernardini, Timon Wehnert, Wolfram Jörß: �Policy implications� �, 2004, accessible at http://www.izt.de/eurendel/survey_results/index.html
[ORNL 2000] Scenarios for a Clean Energy Future, Oak Ridge National Lab. et.al. 2000, Springfield VA, USA, www.nrel.gov/applications.html
[OPTI 2002] OPTI Observatorio de Prospectiva Tecnológica Industrial, �Energía. Tendencia tecnológicas a medio y largo plazo�, OPTI / Ministerio de Ciencia y Tecnología, 2002
[Velte et al. 2004] Daniela Velte, Juan Pedro López de Araguas, Oliver Nielsen, Wolfram Jörß: �The EurEnDel Scenarios - Europe�s Energy System by 2030�, 2004, accessible at http://www.izt.de/eurendel/survey_results/index.html
[VTT 2002] VTT Energy: Energy visions 2030 for Finland. Helsingki: Edita Prima Ltd. 2002
[Wehnert et al. 2004] Timon Wehnert, Birte Holst Jørgensen, Wolfram Jörß, Anna Oniszk-Popławska, Augusto Ninni, Daniela Velte: �EurEnDel - Summary Report�, 2004, accessible at http://www.izt.de/eurendel/survey_results/index.html
[Zeka-Paschou 2003] Zeka-Paschou, M.: Data file containing the aggregated results of the �With Climate Policies� scenario used in the CAFÉ baseline stakeholder consultation; accessible at http://forum.europa.eu.int/Public/irc/env/cafe_baseline/library?l=/baseline_data/summary_tables&vm=detailed&sb=Title


