SSF JR 99 - 036 ( 1/16 ) No. mmutis Republic of the Philippines DOTC*MMDA*DPWH*NEDA*PNP-NCR*HUDCC*UP-NCTS*EMB Japan International Cooperation Agency (JICA) METRO MANILA URBAN TRANSPORTATION INTEGRATION STUDY FINAL REPORT SUMMARY ALMEC CORPORATION PACIFIC CONSULTANTS INTERNATIONAL YACHIYO ENGINEERING CO.,LTD. March 1999
Transcript
SSF
JR99-036(1/16)
No.
mm
utis
Republic of the PhilippinesDOTC*MMDA*DPWH*NEDA*PNP-NCR*HUDCC*UP-NCTS*EMB
In response to a request from the Government of the Republic of the Philippines, the
Government of Japan decided to conduct a master plan study on Metro Manila Urban
Transportation Integration Study(MMUTIS) and entrusted to study to the Japan International
Cooperation Agency (JICA).
JICA selected and dispatched a study team headed by Dr. Shizuo Iwata of ALMEC
Corporation and consists of ALMEC Corporation, Pacific Consultants International and
Yachiyo Engineering Co., LTD. to Philippine, there times between March 1996 to December
1999. In addition, JICA set up an advisory committee head by Dr.Shigeru Morichi, professor of
University of Tokyo between March 1996 and February 1999,which examined the study from
specialist and technical points of view.
The team held discussions with the officials concerned of the Government of
Philippines and conducted field surveys in the study area. Upon returning to Japan, the team
conducted further studies and prepared this final report.
I hope that this report will contribute to the promotion of this project and to the
enhancement of friendly relationship between our two countries.
Finally, I wish to express my sincere appreciation to the officials concerned of the
Government of Philippine for their close cooperation extended to the study.
March 1999
Kimoto Fujita President
Japan International Cooperation Agency
March 1999 Mr. Kimio Fujita President JAPAN INTERNATIONAL COOPERATION AGENCY Tokyo
Letter of Transmittal Dear Sir, We are pleased to formally submit herewith the final report of the “Metro Manila Urban Transportation Integration Study (MMUTIS)”. This report compiles the result of the Study which was undertaken both in the Philippines and Japan from March 1996 to March 1999 by the Study Team, composed of ALMEC Corporation, Pacific Consultants International and Yachiyo Engineering Co., Ltd. We owe a lot to many people for the accomplishment of this report. First, we would like to express our sincere appreciation and deep gratitude to all those who extended their kind assistance and cooperation to the Study Team, in particular the Department of Transportation and Communications and other government agencies of the Philippines. We also acknowledge the officials of your agency, the JICA Advisory Committee, and the Embassy of Japan in the Philippines. We wish the report would be able to continue significantly to Philippine’s transportation development. Very truly yours, ______________ Shizuo Iwata Team Leader Study Team METRO MANILA URBAN TRANSPORTATION INTEGRATION STUDY
MMUTIS FINAL REPORT SUMMARY
Table of Contents Page TRANSPORT MASTER PLAN FOR GREATER METRO MANILA 1. Introduction S-1 2. The Context for Transport Strategy S-4 3. Current Transportation Situation, Problems and Issues S-6 4. Transport Policy S-11 5. Land-use/Transport Network Development Scenario S-14 6. Transport Demand Context S-18 7. Formulation of the Transport Master Plan S-21 8. Implementation S-31 MEDIUM-TERM TRANSPORT DEVELOPMENT PLAN 9. Development of the Plan S-32 10. Profile of the Plan Components S-37 11. Project Evaluation S-44 12. Implementation Plan S-45 TRANSPORT DATABASE AND RESEARCH CAPACITY DEVELOPMENT 13. Overview S-47 14. MMUTIS Transport Surveys S-47 15. Transport Models S-49 16. Proposed Database and MMUTIS Contribution S-49 17. Technology Transfer S-51 CONCLUSIONS AND RECOMMENDATIONS 18. Conclusions S-52 19. Recommendations S-54
List of Tables Table 3.1 Socio-economic Profile, 1996 .....................................................................S - 7 Table 3.2 Traffic Demand in Metro Manila
by Transportation Mode ...............................................................................S - 8 Table 5.1 Socio-economic Framework of the Study Area ..........................................S-15 Table 5.2 Socio-economic Framework by Scenario ...................................................S-16 Table 6.1 Future Demand by Purpose .........................................................................S-18 Table 6.2 Future Demand by Mode .............................................................................S-18 Table 6.3 Volume/Capacity Ratio on Roads
Across Mini-Screenline by Corridor, 2015 .................................................S-19 Table 6.4 Volume/Capacity Ratio on Roads by Area, 2015 .......................................S-19 Table 7.1 Volume/Capacity Ratio on Roads
Across Mini-Screenline by Corridor, 2015 .................................................S-24 Table 7.2 Volume/Capacity Ratio on Roads by Area, 2015 .......................................S-24 Table 7.3 Assessment of Demand Magnitude
by Corridor/Mini-Screenline (Master Plan) ................................................S-25 Table 7.4 Summary of the MMUTIS Master Plan (Roads) ........................................S-28 Table 7.5 MRT/LRT/Busway Line (Master Plan) ......................................................S-29 Table 7.6 Master Plan Investment Summary ..............................................................S-30 Table 7.7 Economic Evaluation Results.......................................................................S-30 Table 9.1 Candidate Projects for the MTDP (1999-2004) ..........................................S-34 Table 11.1 Economic Evaluation of MTDP Projects ....................................................S-44 Table 11.2 Financial Evaluation of Revenue-generating
Projects in the MTDP ..................................................................................S-45 Table 12.1 Mid-term Cost Allocation Plan ...................................................................S-46 Table 14.1 Outline of Transportation Surveys Conducted in the MMUTIS .........................................................................S-48 Table 16.1 MMUTIS Database Contents ......................................................................S-50
List of Figures
Figure 1.1 Study Organization ......................................................................................S - 2 Figure 1.2 MMUTIS Study Area...................................................................................S - 3 Figure 5.1 Summary of Socio-economic Data by Scenario .........................................S-17 Figure 6.1 Current Traffic Situation .............................................................................S-20 Figure 6.2 “Do-nothing” Situation, 2015 .....................................................................S-20 Figure 6.3 “Do-committed” Situation, 2015 .................................................................S-20 Figure 6.4 Legend for Transport Corridor/Area Performance Analysis .......................S-20 Figure 7.1 Future Transport Network (Do Maximum) .................................................S-23 Figure 7.2 Master Plan Network, 2015 .........................................................................S-26 Figure 7.3 Traffic Volume on the Master Plan Network, 2015 ....................................S-27 Figure 9.1 Committed Projects for the MTDP (1999-2004) ........................................S-35 Figure 9.2 Proposed Projects for the MTDP (1999-2004) ...........................................S-36 Figure 10.1 Candidate and Selected Road Projects
for the MTDP (1999-2004) ........................................................................S-39 Figure 10.2 Port Access Improvement Plan ...................................................................S-40 Figure 10.3 Airport Access Improvement Plan ..............................................................S-41 Figure 10.4 Proposed Development of Modal Interchange Facilities
at Critical MRT/LRT Stations ....................................................................S-43
Glossary
ADB Asian Development Bank ALS Area Licensing System BOT Build-Operate-Transfer CALA Cavite-Laguna Urban Development and Environment Project CBD Central Business District CIF Capital Investment Folio DOTC Department of Transportation and Communications DPWH Department of Public Works and Highways ECA Environmentally Critical Area ECP Environmentally Critical Project EDSA Epifanio de los Santos Avenue EIRR Economic Internal Rate of Return EIS Environmental Impact Statement HOV High-occupancy Vehicle JICA Japan International Cooperation Agency JUMSUT Metro Manila Transportation Planning Study LGU Local Government Unit LIL Learning Innovation Loan LRT Light Rail Transit MCX Manila Calabarzon Express MMDA Metro Manila Development Authority MMETROPLAN Metro Manila Transport, Land Use and Development Planning Project MMUESS Metro Manila Urban Expressway System Study MMUSTRAP Metro Manila Urban Transportation Strategy Planning Project MMURTRIP Metro Manila Urban Transport Improvement Project MMUTDP Metro Manila Urban Transport Development Plan MMUTIP Metro Manila Urban Transportation Improvement Project MMUTIS Metro Manila Urban Transportation Integration Study MRT Mass Rail Transit MTDP Medium-term Transport Development Plan NAIA Ninoy Aquino International Airport NEDA National Economic Development Authority OD Origin-destination ODA Official Development Assistance OECF Overseas Economic Cooperation Fund PNR Philippine National Railways PM10 Particulate Matter 10 PTSS Philippine Transport Strategy Study ROW Right of Way STRADA System for Traffic Demand Analysis TDM Traffic Demand Management TEAM 4 Metro Manila Traffic Engineering and Management Project Phase IV UP-NCTS University of the Philippines - National Center for Transportation Study UTSMMA Urban Transport Study in the Manila Metropolitan Area UVVRP Unified Vehicular Volume Reduction Program WB World Bank
MMUTIS Final Report - Summary
S-1
TRANSPORT MASTER PLAN FOR GREATER METRO MANILA 1. INTRODUCTION
Background and Purpose
The MMUTIS study area1 has been suffering from worsening traffic situation and severe environmental degradation. Roads have become more congested, commuting time and distance lengthened, in-vehicle congestion and comfort level of public transport decreased, air pollution worsened, and accidents increased. Many of these are attributed to the current transport situation which is characterized by a lack of infrastructure, poor maintenance, inadequate traffic and vehicle management, undisciplined drivers and pedestrians, uncontrolled roadside activities and land use, etc. Fast-growing population and urban areas are serious threats to a sustainable development of urban transportation from the medium to the long term. While the requirements for more strategic transport planning are necessary, updated database and effective planning tools are insufficient. The Metro Manila Urban Transportation Integration Study (MMUTIS) was conducted, upon request of the Philippine Government, with technical assistance of the Japan International Cooperation Agency (JICA) with the following objectives: (1) To establish an updated transportation database system similar to the one built
in JUMSUT which is intended to contribute to transportation planning research and education in the Philippines;
(2) To formulate a Master Plan for an integrated urban transportation system for Metro Manila for the target year 2015; and
(3) To formulate a Medium-term Transportation Development Plan (1999 – 2004) based on the Master Plan.
Study Outputs The MMUTIS produced the following major outputs: (1) Transportation Master Plan up to year 2015 (2) Medium-term Transportation Investment Plan (1999 – 2004) (3) Urban Transport database and models including the System for Traffic
Demand Analysis or STRADA (4) A set of technical reports. During the study period, the MMUTIS also produced various technical notes and papers which were presented in the workshops/seminars.
1 The MMUTIS study area covers Metro Manila and the adjoining municipalities/cities in Bulacan, Rizal,
Cavite, and Laguna Provinces.
MMUTIS Final Report - Summary
S-2
Study Implementation The MMUTIS was undertaken between March 1996 and February 1999 by the Study Team, which is composed of consultants selected by the JICA and counterpart members from the Department of Transportation and Communications (DOTC), Metro Manila Development Authority (MMDA), Department of Public Works and Highways (DPWH), and the University of the Philippines’ National Center for Transportation Study (UP-NCTS). In order to guide the Study, a Steering Committee and a Technical Advisory Committee were organized. An Advisory Committee to the JICA was also formed. The Study was undertaken maintaining close coordination among the concerned agencies, resulting in a total of 102 regular meetings. A total of 26 agencies/proponents were also invited to discuss the MMUTIS plans and projects.
Figure 1.1 Study Organization
JICA DOTC
JICAStudy Team
PhilippineCounterpart
Team
SteeringCommittee
Technical AdvisoryCommittee
JICAAdvisory
Committee
StudyTeam
MMUTIS Final Report - Summary
S-3
Figure 1.2 MMUTIS Study Area
LAS PINASLAS PINASLAS PINASLAS PINASLAS PINASLAS PINASLAS PINASLAS PINASLAS PINAS
PASIG CITYPASIG CITYPASIG CITYPASIG CITYPASIG CITYPASIG CITYPASIG CITYPASIG CITYPASIG CITY
SAN JOSE DEL MONTESAN JOSE DEL MONTESAN JOSE DEL MONTESAN JOSE DEL MONTESAN JOSE DEL MONTESAN JOSE DEL MONTESAN JOSE DEL MONTESAN JOSE DEL MONTESAN JOSE DEL MONTE
IMUSIMUSIMUSIMUSIMUSIMUSIMUSIMUSIMUS
SAN MATEOSAN MATEOSAN MATEOSAN MATEOSAN MATEOSAN MATEOSAN MATEOSAN MATEOSAN MATEO
Transport developments in Metro Manila have been under government control. There was an effective City Plan, and in many locations roads were developed as planned. The current radial-circumferential road network plan can be traced back to the “Major Thoroughfare Plan” formulated by the Metropolitan Planning Commission in the 1940s. It was after the 1950s that the government seemed to have lost control over the development of transport facilities and services. As urban transport problems have become more and more a social concern, a series of transport studies had been undertaken, on which plans were based. They included the Urban Transport Study in the Manila Metropolitan Area (UTSMMA, 1973), the Metro Manila Transport, Land Use and Development Planning Project (MMETROPLAN, 1977), the Metro Manila Urban Transportation Improvement Project (MMUTIP, 1981), the Metro Manila Urban Transportation Strategy Planning Project (MMUSTRAP, 1982-85), the Metro Manila Transportation Planning Study (JUMSUT, 1981-84), the Metro Manila Urban Transport Development Plan (MMUTDP, 1991), and the Metro Manila Urban Expressway System Study (MMUESS, 1993). While substantial resources have been deployed in a large number of major studies, implementation has been limited and selective. In general, planning in Metro Manila has been in hiatus since the early 1980s and only now is it beginning to reassert itself. During that period, what has happened has been the result of individual actions of government agencies and private developers and investors. Today, there is no officially recognized development plan that is used to determine the infrastructure development strategy for Metro Manila. Further, there is no common planning database which can be used to help coordinate the activities of the main infrastructure sectors. Prospects Facing Metro Manila
Metro Manila has been constantly growing and is expected to expand further to a size which only a few cities have experienced in the world. It has to be recognized that the future will, and needs, to be very different from the past. A new direction needs to be set based on the substantive progress of the recent past. At present, there is a considerable consensus in the Philippines about the major thrust of the national policy which provides the framework for the Study area. Several broad imperatives that dictate future approaches include the:
Recognition that the private sector needs to have a substantial stake in many aspects of future development projects, Recognition that while much have been achieved recently, the performance of the transport sector should be further improved, and Recognition that city governance needs to be further strengthened to promote and ensure environmentally and financially sustainable urban development and management.
MMUTIS Final Report - Summary
S-5
Government Policy Objective
Urban management is a central policy issue that has not been adequately addressed in the past, and this is the root cause of current urban problems. To a considerable extent, the deterioration of the environment and mobility has resulted from the failure of the transport strategy to address the sector’s needs and the lack of control of the authorities over its growth. To ensure the improvement of transport systems it is thus necessary to complete some “unfinished work”, of extending basic infrastructure networks and providing for their adequate maintenance. It also requires attention to the new problems posed by uses of better-quality services and by the adverse effect of rapid motorization. To support and ensure a better quality of life in the long term, the basis of a more demanding transport policy must focus on economic, financial, environmental, and social sustainability. Increasingly, urban sustainability has become the objective of city administrators worldwide.
Sector Constraints The three major constraints in the transport sector are funding, institutional effectiveness and land for needed infrastructure. Despite limited public funds, there is still no systematic and rational allocation to planned transport projects. Although private funds for infrastructure projects substantially increase the volume of investments, recent experiences show that such projects still use up public funds somewhere along the process. A number of fundamental institutional problems have been noted: harmonization of activities at the metropolitan level needs to be closely monitored; local government units need to strongly assert their rights over land-use controls to prevent developers from implementing unplanned developments; and, traffic management and enforcement have been unified but still need further streamlining.
Ongoing Initiatives
There are three major studies that have impacted on the MMUTIS and vice versa. These are the Asian Development Bank-funded Philippine Transport Strategy Study (PTSS), the Metro Manila Urban Transport Improvement Project (MMURTRIP) and the Cavite-Laguna (CALA) Urban Development and Environment Project, both funded by the World Bank. The first two are finished, while the third has just commenced. The PTSS concerns the national transport strategy and its implications on the MMUTIS including the Philippine National Railways (PNR) right of way (ROW) and operation and access to the Manila Port and the Ninoy Aquino International Airport (NAIA). The MMURTRIP prepared short-term solutions on transport improvement on selected corridors such as the LRT Line 2 corridor, the EDSA corridor, the C-5 corridor, the Southern Luzon Expressway (SLE) corridor, and the Marikina Valley area. The CALA study aims at formulating long-term transport strategies in compliance with the MMUTIS proposal and short-term specific projects for implementation. Other initiatives include the Metro Manila Traffic Engineering and Management Project Phase IV (TEAM 4), which will replace and upgrade the area traffic control system in the main urban area, the ADB-funded Air Quality Improvement Project and PNR Restructuring Study.
MMUTIS Final Report - Summary
S-6
3. CURRENT TRANSPORTATION SITUATION, PROBLEMS AND ISSUES
Profile of the StudyArea
The study area is defined as the combined jurisdiction of Metro Manila and most of the municipalities in the adjoining provinces of Cavite, Laguna, Rizal, and Bulacan. Metro Manila’s area of 636 km2 is densely populated and the metropolitan area has been expanding rapidly toward the outer areas covering 3,670 km2.
Urban Development Characteristics
Under enormous population pressure, Metro Manila has been experiencing a drastic process of change in urban transportation, exhibiting the following characteristics:
Suburbanization has not decreased the density of inner areas with the stepping-in of commercial activities. Growth rates have been low, negative even, in some sections as was observed in the City of Manila. Infrastructure in the inner urban core has not improved, and the environment has deteriorated.
There are significant clusters of mixed land uses as well as squatter/slum communities, both of which exert strong but contrasting influences on transport.
The spatial separation of residences from workplaces and educational centers has worsened. With more households opting to live outside Metro Manila, and farther away from jobs and schools, the number of trips and trip distances has increased proportionately.
Development and land-use controls have not been evident in the study area. In outer areas, ribbon developments have prevailed with adverse impact on future road flexibility and capacity. High-intensity structures (reflected in very high floor-to-area ratio) have risen in areas intended for low-density development. Traffic impact assessment is non-existent. Private sector interests in urban development have not been properly tapped to secure public interests.
The outer urban areas (which are receiving the influx of suburbanization) are generally unprepared. Infrastructure is inadequate, if not lacking, and neither the local nor national government is addressing the problem.
Socio-economic Characteristics
The population in the Study area was 8.4 million in 1980, 11.7 million in 1990 and 14.4 million in 1995. The annual growth rate between 1990 and 1995 was as high as 4.2% per annum, significantly higher than the 2.5% national average. Thus, the concentration of the population in the study area has intensified from 17.4% in 1980 to 20.9% in 1995. Metro Manila is the largest provider of
MMUTIS Final Report - Summary
S-7
employment and education. It provides 3.6 million jobs2 and accounts for 1.7 million primary and secondary enrolments and 1.3 million tertiary enrolments.
Table 3.1
Socio-economic Profile, 1996
Item Metro Manila Adjoining
Municipalities MMUTIS Study
area Population: 9,454 4,914 14,368 No. of Households: 000 Ave. Household Size
Source: MMUTIS Person-trip Survey and various official statistics. 1/ Employment and school attendance are at workplace and at school place, respectively.
Motorization
Motorization has increased rapidly. During the period 1980-1995, the number of registered vehicles, both private and for hire, increased at an average rate of about 6% a year. More than 40% of all vehicles registered in the Philippines are concentrated in Metro Manila. Compared to other Asian cities, Metro Manila’s car ownership level is still low. It is interesting to note that the motorcycle has never been a popular transport mode in Metro Manila. The MMUTIS estimated the number of cars in the Study area in year 2015 at 2.1 million, 2.9 times higher than the present level.
Transportation Demand
The study area generated a total of 30 million person trips a day in 1996, 81% or 24.6 million of which are motorized, while 19% or 6.3 million are nonmotorized. Trip characteristics are as follows:
About 79% of the residents make daily trips. Trip rate (average number of daily trips made by a person above four years old) is 2.3. Males make more trips than females with respective trip rates of 2.6 and 2.0. Car-owning household members make more trips than noncar-owning household members with respective trip rates of 2.6 and 2.2.
2 The number of jobs grew at about 6% per annum between 1980 and 1996.
MMUTIS Final Report - Summary
S-8
Those who belong to higher-income households (e.g. P 200,000/month and above) make more trips than those from lower-income households (e.g. P 3,000/month and below) with respective trip rates of 3.1 and 1.8.
An analysis on traffic demand by transportation mode for Metro Manila revealed the following characteristics (refer to Table 3.2):
Of the total traffic demand of 17.8 million person trips, about 70% is met by public transport modes, 8% by semi-public modes (which is defined to include taxi, HOV taxi, private bus) and 21% by private modes. Passenger cars share 18.5% of the total demand. However, in terms of vehicle trips estimated based on the average occupancy of relevant modes, private modes share 53%, semi-public modes 13% and public modes 34% of the total vehicle trips. Passenger cars share 34%. Whether or not the efficiency of transport modes has been explicitly reflected in current urban transport policy has not been examined. The high modal share of public transport in Metro Manila compared to other Asian cities3 is unique and needs to be maintained. The distribution of demand has changed drastically as compared to 1980 (JUMSUT Survey). While the traditional city center in Manila was the center of demand distribution in 1980, the demand pattern is now spread over the study area. The emergence of new traffic generators along EDSA is evident. The average trip length has become longer from 5.3 km in 1980 to 6.4 km in 1996 (Metro Manila residents only). The average commuting time of “To work trips” has also become longer, from 36.6 minutes in 1980 to 51.3 minutes in 1996 (Metro Manila residents only).
Table 3.2
Traffic Demand in Metro Manila by Transportation Mode
Source: MMUTIS Person-trip Survey 1/ UV: utility vehicle 2/ PCU (Passenger Car Unit): conversion factor of different sizes of vehicles in terms of passenger car size
for comparison.
3 Bangkok and Jakarta have long favored private transport. Singapore and Tokyo maintain a higher public
transport share of 66-67%.
MMUTIS Final Report - Summary
S-9
Urban Road Development
Urban road development has consistently received high priority judging from the amount of public funding. Many studies were undertaken to accelerate road development and improvements. Nevertheless, there are still many areas for improvement such as network capacity increase through improvement of connectivity and capacity of existing network, removal of bottlenecks on the existing network through grade separation and local widening, among others, and strengthening of maintenance/rehabilitation work on the entire existing network. It is also critical to work out ways to accelerate smooth right-of-way acquisition and to minimize the negative social impact on the urban poor due to road development. New roads and major improvements of existing road networks are particularly important in the periphery of Metro Manila prior to full urbanization. Traffic Management
Although the fundamental cause of congestion is an imbalance between demand and supply, traffic management potentials have not been fully tapped. Traffic management refers to a wide range of actions and measures to improve the traffic flow, environment and safety without substantial capital investment but through legislative, engineering and operational measures. Areas for improvement are signalization of intersections including renewal of existing system, skills upgrading of traffic enforcers and aides, traffic safety improvement through safety education for drivers and school children, updating of traffic regulation, development of traffic information system, etc. Traffic engineering and management measures need also to be applied to specific corridors and areas as was done by the MMURTRIP. Similar programs should be implemented in other corridors and areas. Traffic management during the construction period of mega projects, which will be continuously implemented in the future, is also critical. Public Transport
Most of the residents depend on public transport, which generally provides good service through a mix of LRT, bus, jeepney, and tricycle. While service level and comfort have declined as congestion worsened, new types of services (such as the Tamaraw FX, a shared air-conditioned taxi with about 10 seating capacity providing point to point service), as well as air-conditioned express bus services have emerged. On this score, public transport services in the study area have responded to the market ahead of regulation. However, this should not cause complacency since the demand may quickly shift to private transport if the experience of other Asian cities is any indication. The key is to expand the rail transit system combined with other measures that would create integration, seamless transfers between different public transport modes, and traffic priority to buses and jeepneys.
MMUTIS Final Report - Summary
S-10
Transport Terminals
Potential roles of public transportation terminals are large. At present, the establishment of a clear cut definition of terminals in the urban transport policy for the metropolis is underway. Now, they are mostly indistinct limits of existing road space where vehicle and passenger movements and activities are handled often creating serious bottlenecks. For example, Baclaran, Cubao, Guadalupe, Divisoria, Blumentritt, Libertad, etc. are the typical terminal areas where adequate policy intervention is warranted. The establishment of definite policies and development guidelines on terminals, or transport nodes, is recognized to be very important to sustain public transportation and to integrate transport modes with each other and with urban development. Water Transport Water transport fulfils a very small portion of personal transportation needs in and around Metro Manila. However, for those who use it, water transport is important. The banca, which carries about 26,000 passengers a day, is an important timesaving mode for low-income residents, while ferries carry about 1,000 passengers a day along the Pasig River. The river is also an important conduit for carrying goods to industry sites. Cleaning the river is one of the major issues in the operation of passenger boats. Another is improving access to piers. Airport and Port Access The NAIA is one of the largest traffic-generating sources in Metro Manila, absorbing about 30,000 vehicles and 80,000 persons a day. Traffic congestion around the NAIA is so serious that improving access is an important issue. Although, relocation of the NAIA must be considered, this needs a strong political leadership and a social consensus to reach a solution.
Environment
Road environment has been worsening day by day as the number of motor vehicles increase and traffic congestion worsens. However, reliable data on traffic caused pollution such as air and noise levels have not been made available. Based on the limited data including those surveyed in the MMUTIS, it is indicated that existing TSP values exceeded the standard value in many locations in Metro Manila, especially Valenzuela and Ermita. Particulate Matter 10 (PM10) concentration is high in EDSA and Quezon Avenue. Since unleaded gasoline became available in February 1994, the lead concentration has declined substantially.
MMUTIS Final Report - Summary
S-11
4. TRANSPORT POLICY New Transport Policy Directions
A new paradigm in urban transport planning and management has emerged, emphasizing sustainability and private-public partnership. The environment is being given greater attention, not as an afterthought, but as an intrinsic element of economic growth and poverty reduction. While the planning horizon is necessarily long, the requirements of the short-to-medium term period cannot be sacrificed. In the case of the greater Metro Manila area, failure to adopt and follow a long-term plan has severely restricted its present options. True, there is already a perceptible shift from dependence on public sector management and funding to greater reliance on private sector skills and resources. However, the requisite adjustment in government institutions, regulations and processes has been lethargic as to limit the volume of privately financed transport infrastructure. With less government share of investment in transport projects, there is greater need to focus on capacity building, institutional restructuring, user charges, and policy reform to create competitive markets. Infrastructure Development and Management
ROW acquisition has become more and more difficult and expensive for most of the infrastructure projects and often causes a delay in project implementation. Alternative methods to the current practice need to be seriously looked into, such as the introduction of the “Land Readjustment Scheme”, closer integration of resettlement with the projects, strengthening city planning/land-use controls and so on.
Integrated Transport Planning and Development
Good planning should be a central requisite for transport sector administration. For this, planning capabilities need to be strengthened and supported with good and reliable database and decision support system. Expansion of the research and development capabilities for the transport sector is also much needed in connection to improving and sustaining good planning.
Public Transport Operations Public transport operations in the study area are facing needs for change. The MRTs/LRTs are being developed; many radial corridors are congested by jeepneys, while new bus/jeepney routes are restricted in many cases. Increasing incomes require increasingly diverse services, etc. These changes include the restructuring of existing bus/jeepney routes with the MRT/LRT as the center of the public transport system, review of existing franchising system, improvement/provision of off-street terminals/interchanges, development of bus/jeepney priorities, on-street enforcement, etc. Mass transit strategy requires purposeful planning by the government, scrutiny of the system/line integration and effective participation of the private sector.
MMUTIS Final Report - Summary
S-12
Traffic Management and Demand Management It is needless to elaborate on the importance of traffic management. Traffic management and low-cost measures can greatly contribute to the transport improvement of the Study area. With a number of mega projects underway and planned, traffic management along the corridors where these projects are located is critical. TEAM 4, MMURTRIP, Metro Manila Air Quality Improvement Project are in the pipeline.
The issue of overlapping responsibilities has already been resolved in favor of the MMDA. For all intents and purposes, the MMDA is primarily responsible for traffic management and enforcement in Metro Manila (excluding other parts of the study area). Efforts are already underway to train and equip traffic enforcers. This should be accelerated and supported by improvement in the management of traffic resources. Serious efforts in the implementation of traffic mitigation measures during the construction of mega projects (like LRT and Skyway) has been made but improvements could still be introduced like the use of real-time geographic-based information.
The term traffic demand management (TDM) is usually applied to measures that are intended to increase the cost of making undesirable trips. The modified vehicular volume reduction scheme (or color coding) is a temporary measure to control demand on a limited supply of roads. It, and similar schemes like odd-even, is not a permanent solution. There are trip demands which can be met either by walking, riding a car, taxi, jeepney, bus, and/or LRT and should be explored more extensively. Traffic management experiences worldwide show that there are many ways of reducing vehicular volumes but since demand for trips usually gets diverted to some other modes, traffic managers are looking at other measures to address this issue.
Demand management measures are a necessary complement to the construction of more infrastructures, and may even reduce the need for such physical facilities, but they exact a heavier load on overworked institutions. Hence, they should be carefully weighed on their cost and benefits. It is also noted that pricing measures contribute significantly to the increase in revenue to the government.
Attracting the Private Sector
Private sector participation has become a policy, especially with the imperatives of limited public resources. Infrastructure development has been opened to the private sector, while government has largely stayed out of the operations and delivery of transport services.
MMUTIS Final Report - Summary
S-13
However, private investments in road and rail facilities have not been as extensive as desired. Project closures (e.g., Skyway, LRT 3, C-5) have been few because of the high transaction costs, procedural delays, inadequate preparatory works, and the unavoidable learning curves for government and business leaders. To realize most of the plan targets, there must be a quantum increase in the flow of private funds into expressways and rail projects. While full government guarantees tend to speed up project negotiation, it is dangerous and should be avoided or minimized as a matter of policy. Otherwise, a new-style debt crisis may blow up at a later stage. Attracting the private sector will entail more intensive promotional efforts to actively package and bid out road projects to private proponents instead of waiting for unsolicited proposals, and to advance expenditures on securing ROWs. For rail projects, the desirable rail network has been defined by the MMUTIS but the realization of the different lines needs to be prioritized. Under a new framework track infrastructure is separated from rolling stock operations. Rail project designs should precede open solicitation of bids, and commercial or market risks should be borne by the private concessionaire. National Transport Issues The framework for private sector participation is clearly not just a metropolitan issue but a national one. It needs resolution at that level. Other national issues with significant impacts on the study area are: (a) level of taxation on motor vehicles and fuels, (b) relative pricing of gasoline and diesel, (c) earmarking of transport-related revenues, (d) devolution of road responsibilities, and (e) future locations of the international airport and the Manila port. The growth rate of motor vehicles, particularly cars, has outpaced the supply of roads. One method of tempering this growth is by increasing their prices through taxation. High car prices may have less impact on traffic congestion than high gasoline prices, but their revenue generation is quite high. This would raise available public funds, and also funding for Metro Manila transport projects even without enlarging its share. Obviously, it cannot be applied in the study area only. Diesel has always been priced lower than gasoline – whether premium, regular or unleaded. This policy was predicated on social grounds, i.e., public transport uses diesel and by extension helps the poor. It has encouraged an unwelcome shift toward diesel engines, with the consequent rise in air pollution (PM10) levels in Metro Manila. Encouraging the use of cleaner fuels (such as liquefied gas for buses and taxis) need to be supported by an appropriate tax regime. Without necessarily getting a bigger slice of the national pie, the transport sector needs a more stable and long-term source of funds. Without the creation of a dedicated fund, this is not possible. Principal benefits of such a fund, even if set up for the metropolitan region only, will be the early acquisition of ROWs, better road maintenance and better coordination of project implementation.
MMUTIS Final Report - Summary
S-14
The DPWH has adopted a long-term strategy of divesting itself of responsibilities for a large part of the national road network. For the study area, this means assumption by the MMDA and different local government units (LGUs) of the obligation to finance, build and maintain devolved roads. The division of responsibilities for the various roads identified in the Master Plan is therefore critical. At one time or another, the national government has announced the development of Batangas and Subic ports to relieve the congestion at the Manila port. Similarly, the transfer of the international airport to Clark has been declared. Transport demand in the region will be altered when, and if, these push through. Air Pollution Improvement of traffic flows will have the salutary effect of reducing pollution from motor vehicles. Other counter measures include introduction of cleaner fuels (e.g., unleaded gas, less sulfur on diesel), cleaner engines (low-emission engines), and mandatory vehicle inspection and maintenance. Only the first has been implemented in the last six years, while the last two measures suffered setbacks. There should be renewed efforts in the short term to implement the clean air program for motor vehicles. Over the medium-term period, public transport fleet modernization should focus on low-emission vehicles (through alternative fuels, use of catalytic converters or smoke traps). Administrative measures like on-road anti-smoke belching campaign and off-road vehicle inspection should be supplemented by fiscal incentives or disincentives. A graduated tax in relation to emission levels is easier to implement.
5. LAND-USE /TRANSPORT NETWORK DEVELOPMENT SCENARIO
Growth of the Metropolitan Area Metro Manila has been growing rapidly and expanding its urbanized area. It is predicted that suburbanization would be further accelerated. As a result, the estimated size of the urban area in 2015 would be doubled to roughly 1,500 km2. The current trend of suburban development is more directed to the south and east, while the movement to the north has been limited. Future Socio-economic Framework While population growth in outer areas has been accelerated, employment opportunities tend to concentrate in Metro Manila. The future population growth would still be so significant that the study area would have to accommodate 25.7 million by 2015. Estimated increment in 19 years’ time is 11.4 million people, 4.3 million jobs and 3.8 million students (see Table 5.1). This impact on urban development is so enormous that the issue on how to manage the metropolitan growth has become the most fundamental long-term urban development concern for the study area.
MMUTIS Final Report - Summary
S-15
Table 5.1 Socio-economic Framework of the Study Area
Growth
Item 1996 2015 2015/1996
1996-2015 % / year
Population (000) 14,368 25,720 1.79 3.11
Employment at Workplace (000) 5,149 9,443 1.83 3.24
Students at School Place (000) 4,589 8,394 1.83 3.23
GRDP (P billion) High Growth Medium Growth Low Growth
856 856 856
2,846 2,706 2,420
3.32 3.16 2.83
6.53 6.24 5.62
Per Capita GRDP (P)
Medium Growth 59,580 103,490 1.74 2.95
Average Household Income (P/month) 12,356 20,730 1.87 3.35
Car Ownership No. of Cars (000)% of HHs
730 18.5
2,340 28.2
3.21 1.52
6.32 2.24
Source: MMUTIS 1/ Projection is based on past trends.
Land-use/Transport Network Development Scenario Transportation development in Metro Manila has strongly affected the urban development direction and land use, while the urban development pattern has influenced the form of transportation services. Land-use zoning plans enacted in 1981 and currently being updated have not been effectively enforced and did not guide the development as they were envisioned. Strong market forces and an active private sector have been playing key roles in determining urban formation wherein the availability of transportation infrastructure was their concern. In order to formulate a long-term transportation network plan, scenarios on future urban development pattern have been prepared. They are: 1) Scenario I: This assumes that the current urban development trend and
transportation network development and management will continue. High density in urban cores and low density in outer areas are the basic features of development. However, population will increase relatively faster in outer areas while employment density will intensify in city centers.
2) Scenario II: This assumes that even as the current land-use/urban development
trend continues, transport network would develop more strategically, since it is significantly affected by the former. For example, although most of the existing transport projects/plans are concentrated in Metro Manila, these would be modified and restructured to comply with the fast-growing population in outer areas.
3) Scenario III: In this scenario, land use will be controlled and urban growth
managed more effectively, in terms of density control, zoning enforcement, decentralization of excessively accumulated urban function, etc. The transport network in this scenario will remain basically the same as Scenario II’s unless drastic change in land-use pattern is introduced.
MMUTIS Final Report - Summary
S-16
4) Scenario IV: This scenario assumes that further decentralization and growth management policy would be in force at regional level. The successful development of outside growth centers, such as Subic, Clark, Batangas, etc., would discourage the influx of migrants into the study area.
Selected Scenario On the basis of the socio-economic framework and zonal data4 and planned future transport network, prepared for Scenario III and commonly applied for other scenarios, the estimated future traffic demand (four different origin-destination, or OD, tables were prepared.) was assigned and the network performance was assessed. The results indicated that when socio-economic activities are dispersed in an integral manner with transport network development, the effect is significant. Overall congestion level decreases, the network is more evenly utilized and significant reduction in transportation costs is expected. Although the effect of urban development/land-use control on traffic has been found significant through this hypothetical analysis, the MMUTIS considers that Scenario III is still unrealistic and took Scenario II for further analysis and planning.
Table 5.2
Socio-economic Framework by Scenario
Scenario I Scenario II Scenario III Scenario IV 000 (%) 000 (%) 000 (%) 000 (%)
M Manila 1,3836(58) 12,579(53) 11,323(48) 10,191(48) North East South
2,319(10) 2,802(12) 4,757(20)
3,589(15) 2,173(9)
5,371(23)
4,859(20) 1,545(7)
5,986(25)
4,373(20) 1,391(7)
5,387(25)
Population
Total 23,713(100) 23,713(100) 23,713(100) 21,342(100) M Manila 6,240(75 5,315(64) 4,390(53) 3,951(53) North East South
569(7) 466(6)
1,012(12)
879(11) 522(6)
1,570(19)
1,190(14) 579(7)
2,128(26)
1,071(14) 521(7)
1,915(26)
Employment at Workplace
Total 8,827(100) 8,827(100) 8,827(100) 7,458(100) M Manila 2,028(64) 1,866(59) 1,704(53) 1,534(53) North East South
282 9) 316(10) 562(18)
391(12) 286(9)
644(20)
501(16) 256(8)
726(23)
451(16) 230(8)
653(23)
Attendance1/ In School
Total 3,187(100) 3,187(100) 3,187(100) 2,868(100) Source: MMUTIS 1/ Students aged over 16 years only.
4 The socio-economic data was broken down into traffic zones for network assessment
MMUTIS Final Report - Summary
S-17
10,0
00
1,50
0
1,00
0
3,00
0
Legend: Present
Scenario 1Scenario 2
Scenario 3Scenario 4
Figure 5.1 Summary of Socio-economic Data by Scenario
Population Student at School Place
Employment at Work Place Secondary Sector
Employment at Work Place Tertiary Sector
MMUTIS Final Report - Summary
S-18
6. TRANSPORT DEMAND CONTEXT
Transportation Demand Model Future traffic demand has been projected based on the conventional four-step model with modifications to reflect traffic characteristics of the study area: (1) trip generation/attraction, (2) modal split between public and private modes, (3) trip distribution, and (4) traffic assignment. Taking into account that mobility of car-owning household is considerably higher than that of noncar-owning household, the forecast model was constructed separately. Although, at present, public transport is hardly substitutional to private transport, there is an increasing probability of diversion from private mode to public mode when quality rail mass transit system is developed in the future. With this, an additional step to analyze the modal shift from private to public between step (3) and step (4) above was included, and a diversion model was developed based on the results of the “willingness-to-pay” survey. For traffic assignment, an incremental assignment model called STRADA developed under JICA was used.
Future Demand
Future transport demand in the study area is as much as 43.7 million trips (motorized) in 2015 which is 1.84 times that of 1996. The modal share between public and private was 78 : 22 in 1996 to 66 : 34 in 2015 in favor of private mode (refer to Table 6.1 and Table 6.2).
Table 6.1
Future Demand by Purpose1/
1996 2015
Purpose 000 % 000 % 2015/1996
To Work To School Business Private To Home
4,100 3,449 1,828 3,483
10,824
17.3 14.6 7.7
14.7 45.7
7,557 6,348 3,717 6,910
19,157
17.3 14.5 8.5
15.8 43.8
1.84 1.84 2.03 1.98 1.77 M
otor
ized
Total 23,684 100.0 43,689 100.0 1.84
Walk Total 6,507 21.6 10,776 19.8 1.66
TOTAL 30,191 - 54,465 - 1.80 Source: MMUTIS 1/ Includes trips made by residents of the study area
Table 6.2
Future Demand by Mode
1996 2015 Mode1/
000 % 000 % 2015/1996
Public Private
18,452 5,233
77.9 22.1
28,930 14,759
66.2 33.8
1.57 2.82
TOTAL 23,684 100.0 43,689 100.0 1.84 Source: MMUTIS 1/ Excluding walk trips
MMUTIS Final Report - Summary
S-19
Assessment of Demand Supply Balance
In order to formulate a “good” future transport network plan which is efficient in terms of meeting future demand and affordable in terms of public sector funding, a series of analytical steps were undertaken. First, future demand (2015) was assigned on the assumed network of “Do Nothing” and “Do Committed” to identify the demand/supply gaps by corridor and area. They are defined as follows: (1) “Do-nothing” network is that as of 1996. (2) “Do-committed” network further includes committed projects and other
existing plans of the government and build-operate-transfer (BOT) proposals. Assessment results shown in Table 6.3 and Table 6.4 indicate that even with “Do Committed” 5 the traffic situation is not expected to improve satisfactorily. Average volume/capacity ratio of the network would remain 2.1 and demand-supply gaps will be seen over the entire study area. Most of the corridors would also be critical.
5 The estimated investment cost of the network is roughly P 146 billion, of which P 31 billion is for
road/expressway and P 115 billion is for the MRT/LRT. Public sector’s share is roughly P 66 billion.
Table 6.3 Volume/Capacity Ratio on Roads Across
Mini-Screenline by Corridor, 2015
1996 Do Nothing
Do Committed
Cavite IS1 OS1 OS2
0.8 1.6 1.9
2.0 6.1
10.6
1.7 6.1
10.6
Laguna IS2 OS3
1.1 1.1
3.6 3.3
3.6 3.2
Rizal IE1 IE2 OE
0.7 1.1 0.6
1.6 2.6 2.4
1.5 2.4 2.4
North- east
INE ONE
1.2 0.4
3.0 1.5
2.7 1.5
North Plateau
IN1 ONI
1.1 2.0
3.5 6.3
3.5 6.3
North Coastal
IN2 IN3 ON2
1.0 1.6 1.2
2.9 3.9 5.2
2.7 3.9 5.0
EDSA KK GLP SSH
1.0 0.9 0.9
2.2 2.3 1.9
1.8 2.0 1.6
Note: Refer to Figure 6.4 for locations of screenlines.
Table 6.4
Volume/Capacity Ratio on Roads by Area, 2015 Area 1996 Do
Nothing Do
Committed 1 Within EDSA 0.8 1.7 1.6 2 North 0.8 2.3 2.2 3 Northeast 0.9 2.3 2.2 7 East 0.8 2.0 1.9 8 East South 0.8 2.1 1.8 11 Southwest 0.8 2.2 1.9
Metro Manila
12 Southeast 0.9 2.7 1.8 4 North 1.0 4.2 4.2 5 Northwest 0.5 1.8 1.8 6 Northeast 0.6 3.5 3.5 9 East North 0.9 0.9 3.4
Bulacan
10 East South 0.7 0.7 2.5 13 West North 1.1 5.1 5.1 14 West South 0.4 1.7 1.7 15 General 0.8 3.2 3.2
Cavite Laguna
16 Southeast 0.3 1.3 1.3 Total 0.7 2.3 2.1
Note: Refer to Figure 6.4 for locations of areas.
Implications for Future Transport Strategy The completion of ongoing and committed projects will hardly improve the future traffic situation except in some corridors and areas in Metro Manila. Congestion is expected to spread quickly as urban areas expand.
MMUTIS Final Report - Summary
S-20
IS1IS1
OS2OS2
OS1OS1
ON2ON2
IN3IN3
IN2IN2
SSHSSH
OS3OS3
IS2IS2
GLPGLPIE1IE1
ON1ON1
ONEONE
IE2IE2
IN1IN1
INEINEKKKK
OEOE
IS1
OS2
OS1
ON2
IN3
IN2
SSH
OS3
IS2
GLPIE1
ON1
ONE
IE2
IN1
INEKK
OE
Figure 6.1 Current Traffic Situation
Figure 6.2 “Do-nothing” Situation, 2015
Figure 6.3 “Do-committed” Situation, 2015
Figure 6.4 Legend for Transport Corridor/
Area Performance Analysis
MMUTIS Final Report - Summary
S-21
7. FORMULATION OF THE TRANSPORT MASTER PLAN
Approach A drastic approach is required for the many problems and issues facing Metro Manila’s transport sector to gradually transform the existing situation and to manage the process of change. The key issues, which are prominent in developing a practical transport strategy for the study area, are:
to support north-south urban growth and expansion; to develop a hierarchy of transport network and facilities; to gradually develop a rail transit-based public transport system; and to ensure accessibility to central business districts (CBDs), NAIA and port.
Constraints and Opportunities Major constraints which influence transport strategy include institutional effectiveness, the ability to acquire land, environmental clearance to construct infrastructure, funding and actual status of so-called committed projects. On the other hand, opportunities include public-private venture partnership, integration of transport development with city planning institutions, gradual shift of existing land use to more public transport-based city structure using mass rail transit as the center of public transport, and the further introduction/expansion of TDM measures to manage demand and increase funding sources. Funding and Affordability On the basis of the analysis on current transport spending and future trends in transport spending under alternative economic growth scenarios, the best available budget envelope for the future study area was estimated. The revised estimate6 for public sector funding for the transport sector of the study area is US$ 4.2 billion (P 168 billion) and US$ 8.7 billion (P 348 billion) under the low economic growth (4%/year) and high growth (7.0%/year) scenarios, respectively. In simple terms, the public sector budget is about US$ 250 million (P 10 billion) to US$ 500 million (P 20 billion) per year. Private sector funding (from BOT and similar schemes) is considered to be additional to this. A preliminary analysis was made on possible new fund sources in relation to traffic demand management, specifically the increase in vehicle registration tax and fuel tax. The impact of the former measure would curb car ownership rate depending upon the rate of increase. With a 30% increase7, car ownership rate is expected to reduce from 25%8 to 22.3% in 2015 or 2.1 million cars to 1.85 million cars in 2015. With a 50% increase, the ownership rate will reduce to 18.9% and
6 The original estimate made before the financial crisis was revised in the Interim Report. The revised
estimate is one-quarter to one-third lower than previously estimated due to lower economic growth and the depreciation of the peso.
7 The present level of tax rate is 15%, therefore it will become 45% in total. 8 The estimate under the current level of tax rate would remain in the future.
MMUTIS Final Report - Summary
S-22
the number of cars to 1.6 million. The corresponding revenue increases are P 300 billion and P 460 billion during the next 15 years. The impact of the increase in fuel tax on traffic is a possible shift from private to public mode, which, however, is insignificant. Only when the fuel prices double would 5.5% of car users give up the use of their cars. On the other hand, the impact on the revenue side is great. With a 50% increase in fuel (gasoline) prices, additional P 380 billion will be generated during the next 15 years. Considering the practice on the above taxes of other countries, there is an opportunity to study this further and obtain social and political consensus.
“Do-maximum” Network The “Do-maximum” network plan was prepared, which best complied with the envisioned future urban structure of the study area, to assess the level of infrastructure required to improve traffic situation and maintain adequate service level in the future. The plan is composed of at-grade primary and secondary roads, elevated/at-grade expressways and elevated/at-grade MRT, LRT and busways. Planning principles involved in this plan are as follows:
The overall network is structured in a way that the future urban development is effectively guided mainly toward the north-south direction where development and environmental conditions permit urban expansion.
The existing primary road network is restructured to integrate effectively emerging suburban areas with existing urban areas. The primary system will be further complemented with secondary roads.
All major corridors will be provided with mass rail transit line(s) which should be adequately integrated with and provide smooth access to CBDs.
Expressways with toll should integrate strategic economic centers (such as CBDs, port, airport), provide congestion-free services and divert traffic from passing through congested areas.
The network shown in Figure 7.1 is composed of 280 km of expressways, 800 km of primary arteries, 880 km of secondary arteries, and 350 km of urban rails. Of these, the virtually new constructions are 190 km of expressways, 590 km of primary arteries, 700 km of secondary arteries, and 300 km of urban rails. The estimated investment for this network is roughly US$ 30 billion, of which US$ 20 billion is the cost to government and US$ 10 billion is the cost to the private sector. Urban rail shares 50% of the total investment costs. With this level of investment in the future transport network, the overall traffic situation in the entire study area is expected to improve (refer to Table 7.1 and Table 7.2).
STA. ROSASTA. ROSASTA. ROSASTA. ROSASTA. ROSASTA. ROSASTA. ROSASTA. ROSASTA. ROSA
KAWITKAWITKAWITKAWITKAWITKAWITKAWITKAWITKAWIT
SAN JOSE DEL MONTESAN JOSE DEL MONTESAN JOSE DEL MONTESAN JOSE DEL MONTESAN JOSE DEL MONTESAN JOSE DEL MONTESAN JOSE DEL MONTESAN JOSE DEL MONTESAN JOSE DEL MONTEMALOLOSMALOLOSMALOLOSMALOLOSMALOLOSMALOLOSMALOLOSMALOLOSMALOLOS
Bulacan 6 Northeast 0.6 2.3 1.6 9 East North 0.8 2.1 0.7 10 East South 0.9 2.1 0.9 13 West North 1.1 5.1 0.6
Cavite 14 West South 0.4 1.7 0.1 Laguna 15 General 0.9 3.6 0.4
16 Southeast 0.5 1.5 0.7 Total 0.9 2.3 0.7
Master Plan Network In formulating an affordable Master Plan, discussions were held on what should be the reasonable size of the budget envelope for the study area. It was then assumed that with the possible introduction of additional funding sources to the transport sector in the study area, US$ 10 billion or P 400 billion would not be unrealistic.
MMUTIS Final Report - Summary
S-25
On this ground, the “Do-maximum” network was reviewed and reassessed to downsize it without decreasing much its performance and balance. The planning process of network formulation and traffic assessment across mini-screenlines and classified areas were reiterated and the Master Plan network was formulated within the assumed budget constraints (refer to Figure 7.2). The performance of the network is assessed from the demand-supply gap across the screenlines set in major corridors. The assigned traffic volume and the assessment results are shown in Figure 7.3 and Table 7.3 respectively, with following characteristics:
Although, in most corridors, the traffic situation is considered within tolerable range, some corridors, such as South Luzon Expressway (IS2), Aurora Boulevard (IE2), Mindanao/Quirino Highway (IN1), McArthur Highway (IN3) and EDSA (KK and SSH), would still be congested.
In general, the network capacity will be so fully utilized on a daily basis that the network would likely be heavily congested during peak hours. Therefore, traffic and demand management as well as intervention to urban development/land-use control would also be important policy options for the effective use of the provided infrastructure.
For these corridors, policy options other than infrastructure development include road pricing, color coding, HOV scheme (introduction of higher-capacity public road transport, enforcement of higher passenger occupancy of private cars, etc.) and maximum utilization of rail transit capacities.
Table 7.3
Assessment of Demand Magnitude by Corridor/Mini-Screenline (Master Plan)
SSH 483 505 273 778 0.6 31 143 175 1.1 1/ Railway capacity was assumed to be 850,000 passengers a day for both directions at any cross-section.
MMUTIS Final Report - Summary
S-26
Fig
ure
7.2
Mas
ter
Pla
n N
etw
ork,
201
5
02.
55
10
Kilo
met
er
AN
TIP
OL
OA
NT
IPO
LO
AN
TIP
OL
OA
NT
IPO
LO
AN
TIP
OL
OA
NT
IPO
LO
AN
TIP
OL
OA
NT
IPO
LO
AN
TIP
OL
O
MEY
CA
UYA
NM
EYC
AU
YAN
MEY
CA
UYA
NM
EYC
AU
YAN
MEY
CA
UYA
NM
EYC
AU
YAN
MEY
CA
UYA
NM
EYC
AU
YAN
MEY
CA
UYA
N
OB
AN
DO
OB
AN
DO
OB
AN
DO
OB
AN
DO
OB
AN
DO
OB
AN
DO
OB
AN
DO
OB
AN
DO
OB
AN
DO
KA
WIT
KA
WIT
KA
WIT
KA
WIT
KA
WIT
KA
WIT
KA
WIT
KA
WIT
KA
WIT
STA
. RO
SA
STA
. RO
SA
STA
. RO
SA
STA
. RO
SA
STA
. RO
SA
STA
. RO
SA
STA
. RO
SA
STA
. RO
SA
STA
. RO
SA
BIN
AN
GO
NA
NB
INA
NG
ON
AN
BIN
AN
GO
NA
NB
INA
NG
ON
AN
BIN
AN
GO
NA
NB
INA
NG
ON
AN
BIN
AN
GO
NA
NB
INA
NG
ON
AN
BIN
AN
GO
NA
N
NO
VA
LIC
HE
SN
OV
AL
ICH
ES
NO
VA
LIC
HE
SN
OV
AL
ICH
ES
NO
VA
LIC
HE
SN
OV
AL
ICH
ES
NO
VA
LIC
HE
SN
OV
AL
ICH
ES
NO
VA
LIC
HE
S SA
N M
ATE
OS
AN
MA
TEO
SA
N M
ATE
OS
AN
MA
TEO
SA
N M
ATE
OS
AN
MA
TEO
SA
N M
ATE
OS
AN
MA
TEO
SA
N M
ATE
O
SA
N J
OS
E D
EL
MO
NT
ES
AN
JO
SE
DE
L M
ON
TE
SA
N J
OS
E D
EL
MO
NT
ES
AN
JO
SE
DE
L M
ON
TE
SA
N J
OS
E D
EL
MO
NT
ES
AN
JO
SE
DE
L M
ON
TE
SA
N J
OS
E D
EL
MO
NT
ES
AN
JO
SE
DE
L M
ON
TE
SA
N J
OS
E D
EL
MO
NT
E
DA
SM
AR
IÑA
SD
AS
MA
RIÑ
AS
DA
SM
AR
IÑA
SD
AS
MA
RIÑ
AS
DA
SM
AR
IÑA
SD
AS
MA
RIÑ
AS
DA
SM
AR
IÑA
SD
AS
MA
RIÑ
AS
DA
SM
AR
IÑA
S
CA
LAM
BA
CA
LAM
BA
CA
LAM
BA
CA
LAM
BA
CA
LAM
BA
CA
LAM
BA
CA
LAM
BA
CA
LAM
BA
CA
LAM
BA
MA
LO
LO
SM
AL
OL
OS
MA
LO
LO
SM
AL
OL
OS
MA
LO
LO
SM
AL
OL
OS
MA
LO
LO
SM
AL
OL
OS
MA
LO
LO
S
TAYT
AY
TAYT
AY
TAYT
AY
TAYT
AY
TAYT
AY
TAYT
AY
TAYT
AY
TAYT
AY
TAYT
AY
IMU
SIM
US
IMU
SIM
US
IMU
SIM
US
IMU
SIM
US
IMU
S
SA
NTO
LAN
SA
NTO
LAN
SA
NTO
LAN
SA
NTO
LAN
SA
NTO
LAN
SA
NTO
LAN
SA
NTO
LAN
SA
NTO
LAN
SA
NTO
LAN
MA
SIN
AG
MA
SIN
AG
MA
SIN
AG
MA
SIN
AG
MA
SIN
AG
MA
SIN
AG
MA
SIN
AG
MA
SIN
AG
MA
SIN
AG
GE
N.
TR
IAS
GE
N.
TR
IAS
GE
N.
TR
IAS
GE
N.
TR
IAS
GE
N.
TR
IAS
GE
N.
TR
IAS
GE
N.
TR
IAS
GE
N.
TR
IAS
GE
N.
TR
IAS
PO
RT
AR
EA
PO
RT
AR
EA
PO
RT
AR
EA
PO
RT
AR
EA
PO
RT
AR
EA
PO
RT
AR
EA
PO
RT
AR
EA
PO
RT
AR
EA
PO
RT
AR
EA
RE
CLA
MA
TIO
N
NA
VO
TAS
NA
VO
TAS
NA
VO
TAS
NA
VO
TAS
NA
VO
TAS
NA
VO
TAS
NA
VO
TAS
NA
VO
TAS
NA
VO
TAS
CA
LOO
CA
NC
ALO
OC
AN
CA
LOO
CA
NC
ALO
OC
AN
CA
LOO
CA
NC
ALO
OC
AN
CA
LOO
CA
NC
ALO
OC
AN
CA
LOO
CA
N
ALA
BA
NG
ALA
BA
NG
ALA
BA
NG
ALA
BA
NG
ALA
BA
NG
ALA
BA
NG
ALA
BA
NG
ALA
BA
NG
ALA
BA
NG
Prim
ary
and
Sec
onda
ry A
rtery
Roa
dE
xpre
ssw
ayM
RT
/ LR
T /
Bus
way
Prim
ary
Arte
rial
(New
Cos
truct
ion)
Prim
ary
Arte
rial
(Exi
stin
g+Im
prov
emen
t)Se
cond
ary
Arte
rial
(New
Con
stru
ctio
n)Se
cond
ary
Arte
rial
(Exi
stin
g+Im
prov
emen
t)
1/
1/
Bu
sway
in
clu
des
majo
r b
us
pri
ori
ty m
easu
res
Pro
pose
dE
xist
ing
Pro
pose
dE
xist
ing
/ O
n-g
oin
gB
usw
ay
MMUTIS Final Report - Summary
S-27
Fig
ure
7.3
Tra
ffic
Vol
ume
on th
e M
aste
r P
lan
Net
wor
k, 2
015
Mey
cauy
anM
eyca
uyan
San
Mat
eoS
an M
ateo
Tayt
ayTa
ytay
Das
mar
inas
Das
mar
inas
Kilo
met
ers
Kilo
met
ers
05
1010
Mey
cauy
an
San
Jos
e de
l Mon
te
San
Mat
eo Ant
i p
Man
ila a
y
Mun
tinlu
pa
Tayt
ay
Cav
ite
Das
mar
inas
auna
e a
y
200
100
Dai
ly T
raffi
c(1
,000
pcu)
Kilo
met
ers
05
10
Mey
cauy
anM
eyca
uyan
San
Mat
eoS
an M
ateo
Tayt
ayTa
ytay
05
Kilo
met
ers
Kilo
met
ers
1010
Mey
cauy
an
San
Jos
e de
l Mon
te
San
Mat
eo Ant
i p
Man
ila a
y
Mun
tinlu
pa
Tayt
ay
Cav
ite
Das
mar
inas
Das
mar
inas
Das
mar
inas
auna
e a
y100
Dai
ly T
raffi
c(1
,000
pcu)
200
Pro
pose
dE
xist
ing
als
o in
clu
de
d in
th
e
figur
e le
ft (H
ighw
ay)
05
Kilo
met
ers
10
Mey
cauy
anM
eyca
uyan
San
Mat
eoS
an M
ateo
Tayt
ayTa
ytay
Das
mar
inas
Das
mar
inas
05
Kilo
met
ers
Kilo
met
ers
1010
Mey
cauy
an
San
Jos
e de
l Mon
te
San
Mat
eo Ant
i p
Man
ila a
y
Mun
tinlu
pa
Tayt
ay
Cav
ite
Das
mar
inas
auna
e a
y
800
Pa
sse
ng
er
Flo
w
Rai
lway
400
(1,0
00
pa
x/d
ay)
05
Kilo
met
ers
10
(1)
Hig
hway
(2)
Exp
ress
way
(3)
Rai
lway
MMUTIS Final Report - Summary
S-28
The Master Plan is expected to meet the future requirements of socio-economic activities in the study area. The proposed network (with arterial systems of MRT/LRT, expressway and at-grade primary roads) will integrate the outer area with the existing urban area. It will likewise provide a base infrastructure in the outer areas on which subcenters are to be developed to disperse the population and urban function in a more balanced manner. The Master Plan provides a reasonable level of transport infrastructure capacity although the overall service level is for supply to meet demand only slightly. This implies that with the proposed level of infrastructure alone, traffic congestion would still remain during peak hours and along some corridors. The estimated share of public transport in 2015 will be 62% (in terms of passenger km) and the share of rail in public transport, 35%. Traffic and demand management measures as well as priority measures for public transport will remain important and have to be strengthened.
Profile of the Plan Components Inasmuch as priority in the Master Plan should be given to management and low-cost measures, such as traffic management, maintenance, rehabilitation, and improvement, these are identified and being implemented continuously under the TEAM, MMURTRIP, etc. The focus of the MMUTIS is to formulate a future transport network which will be primarily composed of primary and secondary arteries, expressways and MRT/LRT/busways (refer to Table 7.4 and Table 7.5). The MMUTIS proposal includes 78 km of expressways, 346 km of primary arteries, 409 km of secondary arteries (of which 160 km is improvement of existing roads), and a total of 197 km MRT/LRT/busways.
Table 7.4 Summary of the MMUTIS Master Plan (Roads)
Subtotal 417 187 604 71 TOTAL 894 489 1,383 407 1/ Sections of NLE and SLE located in the study area. 2/ C-3 (Caloocan, Mandaluyong), EDSA (Samson) and C-5 (Katipunan) missing Links (cost estimated by the
MMUTIS).
MMUTIS Final Report - Summary
S-29
Table 7.5 MRT/LRT/Busway Line (Master Plan)
Profile Estimated Capital Cost
($ mil) Lines Section
Length (km)
System
Type
Infra
E & M
Total
Existing (Mon.– Baclaran) RIO 14.5 EL-LRT U - - -
S. Extension (Imus) RISa 15.0 EL-MRT S 450 450 900
S. Extension (Dasmariñas) RISb 15.0 AG-MRT S 150 300 450
Line 1
&
Line 6
Subtotal 44.5 600 750 1,350
E. Extension (Antipolo) R2Ea 7.7 AG/EL Busway
S 77 - 77
E. Extension (Masinag) R2E 4.0 EL-MRT S 137 91 228
Investment Summary The summary of the Master Plan projects and investments are shown in Table 7.6. In formulating the investment program with particular regard to new investments for the Master Plan network, it is to be noted that the investment required for the basic program, such as the low-cost management including traffic management, maintenance/rehabilitation and existing network improvements, is the indispensable part of the program. The portion of the investment costs in which public sector budgets are allocated beyond 1999 is also included in the program.
Subtotal 155 67 TOTAL 822 535 1/ Cost to government: 100% for primary/secondary roads; 20% for expressways, infra cost for
MRT/LRT/Busway.
Economic Evaluation
The economic assessment of the Master Plan network was conducted based on a number of assumptions.9 With an economic internal rate of return (EIRR) of 46.7%, the Master Plan is economically feasible. Also, all the projects have EIRR values of more than 15% and are economically feasible.
9 The assumption provides that the entire investment is done at the same time and the benefits include VOC
reduction and passenger time saving only.
1/ Assumes a toll rate of P 4/km.
MMUTIS Final Report - Summary
S-31
8. IMPLEMENTATION Requirements of the Planning Process
Many plans are not implemented. Often, projects which are implemented are not the results of planning. It is because plans are often unrealistic, stakeholders are not adequately consulted, political intervention takes place, among others. To minimize the above, a common and shared planning process should be established based on an updated database and plans should be institutionalized.
Strengthening Metropolitan Governance Good management is the key to implement the Master Plan effectively. It requires vigorous planning, interagency coordination, rational resource allocation, effective involvement of local governments and stakeholders in the process of development, etc. The MMDA is expected to act as the central agency. Transport and development planning process should be established, mega projects coordinated, public transport regulatory process improved, city officials trained, and institutional fragmentation rectified. An adequate set of database and planning tools are also needed. An increasingly important approach to infrastructure development is the integration among transport modes and facilities as well as between transport and urban planning and development. Financing Strategy Funding is critical in all major transport projects of the Master Plan. The government traditionally contracts loans for much of Metro Manila’s transport sector and this is expected to continue. Private sector financing is a potential source to supplement the needed funds. Privatization of transport operation, such as LRT and PNR, is the current thrust of the government. Private investment for various BOT projects is currently based on unsolicited proposals which, however, entail processes that are not transparent and require in the end substantial counterpart public funds. Formulation of BOT projects and public sector funding should be carried out in a planned manner. Moreover, the absolute lack of funds to cover the Master Plan projects requires the government to establish a new funding source. Improving Private Sector Participation Although much of the private sector participation is expected in transport projects, it always takes time before actual commitment and the process is often not transparent.
MMUTIS Final Report - Summary
S-32
MEDIUM-TERM TRANSPORT DEVELOPMENT PLAN 9. DEVELOPMENT OF THE PLAN
Approach and Policies The Medium-term Transport Development Plan (MTDP) was formulated by increasing the essential components of the Master Plan. The primary directions of the MTDP include the following:
Integration: While a number of mega projects both in the transport and urban sectors are already underway, they are not coordinated, with insufficient basic transport facilities and services in many locations. The MTDP focuses on integrating new and existing facilities and services to maximize the benefits of the huge investments being made. New Strategies: It is almost sure that the future transport situation would never improve if society seeks for traditional solutions. The rapid growth of population and urban areas has been a constant pressure on transport sector development. Increasing car ownership and a shift to private transport are the most serious threats. Conventional infrastructure development alone, even if funds were available, would not provide effective solutions. Hence, the MTDP focuses on introducing possible new strategies to prepare for further demand management, integration of urban and public transport development, and improved public-private partnership. Reality: Public funding capability for the MTDP is severely constrained due to the lack of sources and the standing commitment to a number of mega projects. Institutional capacity is also limited and has yet to improve. The MTDP focuses on this reality.
Available Funds
Public funds available for the MTDP (1999-2004) under low and high estimates have been pegged between P 24 billion (or US$ 0.6 billion) and P 64 billion (US$1.6 billion), respectively. These funds, however, are not only for new projects but mainly allotted for committed projects. Broad Priorities Under severe financial constraints, investment priorities have been broadly set forth as follows:
Management and low-cost measures, such as traffic management, minor widening, rehabilitation, public transport priorities, terminals, intersection improvements, etc.
MMUTIS Final Report - Summary
S-33
At-grade roads, particularly primary (missing links and those promoting north-south urban expansion) and secondary arterials (to strengthen road network hierarchy). Such roads in the study area are extremely important for an effective urban expansion and to accommodate the elevated expressway and MRT.
The MRT and urban expressway will increasingly become more important to sustain large urban areas. These projects assume the private sector’s effective participation.
Candidate Projects Selected candidate projects totaling P 236 billion are shown in Table 9.1. They are composed of committed projects worth P 99 billion and MMUTIS-proposed projects worth P 137 billion. After the costs are spread over the MTDP period (1999-2004), the actual costs to government would reach P 68.6 billion and P 53.6 billion for committed/carried-over projects and MMUTIS proposal, respectively. Of the available funds of P 64 billion (high estimate) only 23% or P 14.6 billion is available for new projects. Selected Projects Table 9.1 indicates serious fund constraints for implementing new projects. A review of the actual cash flow of committed projects may provide wider opportunities to accommodate new projects.
MMUTIS Final Report - Summary
S-34
Table 9.1 Candidate Projects for the MTDP (1999-2004)
1/ Northern Package includes the following: PN3 – North Central Road (Quirino Hwy-SM16); SM13 – Don M. Marcos Ave. Ext. to N. Central Rd.; and SM14 – Quirino Hwy Novaliches Bypass.
2/ Southern Package includes the following: SM1 – Aurora Ave. Ext. to R10; SM2 – A.M.Maceda & Ext. to Aurora Blvd.; SM3 – F. Martinez Ext. to Ortigas Ave.; SM4 – SLE Ext. (Pres. Quirino – J.P. Laurel); SM5 – Gilmore Ave. Ext. to Roosevelt; SM6 – Victoneta Ave. Ext. to Congressional Ave.; SM17 – Kalayaan Ave. Ext. to 20th Ave.; GS1-5 – Primary/Primary Grade Separation Projects.
10. PROFILE OF THE PLAN COMPONENTS Committed Projects
Portions of the investment costs of a number of committed projects under the
external official development assistance (ODA) loan or government funding will have to be carried over to the next MTDP period of 1999-2004. They include committed and almost-committed projects. BOT projects include the MRT Line 3, C-5 South Section and the Skyway. Included under the committed projects for external ODA loan are the LRT 1 capacity expansion (Overseas Economic Cooperation Fund), LRT 2 (OECF), three highway interchanges (OECF), and TEAM 4 (AusAid), while the almost-committed projects include Air Quality Improvement (ADB), LIL (WB), MMURTRIP (WB), and four highway interchanges (OECF). Two railway projects are also almost committed under the BOT scheme – North Rail Phase I and MRT Line 3 Extension. In addition, some government-funded road projects are committed. The total project cost of the above is P 179.1 billion, P 68.6 billion of which will be carried over to the next MTDP period.
Selected projects of this category are as follows:
1) MMURTRIP 2: This covers corridors other than those covered by MMURTRIP 1. Candidate routes include McArthur Highway and M.L. Quezon/Gen. A. Luna/M. Almeda roads. A case study has been conducted for LRT Line. Estimated project cost is P 5.0 billion.
2) TEAM 5: Ongoing TEAM Project Phase 4 only replaces the existing signals.
TEAM 5 intends to further improve the traffic signal system and traffic safety in Metro Manila. Project components include establishment of Traffic Information Center, rehabilitation of the existing signal system, signalization of additional intersections, geometric improvements at intersection, and traffic safety improvements. The estimated project cost is P 2.0 billion.
3) Provincial TEAM: This includes signalization of intersections, traffic
management and intersection improvements, training of LGU traffic management personnel in the municipalities of adjoining provinces of the study area. The project may be divided into three packages by geographic area. The total project cost is estimated at P 2.0 billion.
MMUTIS Final Report - Summary
S-38
Proposed Road Projects Road projects cover primary arterials, secondary roads and urban expressways. Since at-grade roads are intended to promote orderly urban expansion, they are packaged into a number of project packages. Road project components are as follows: (1) Northern Roads Package: This package includes primary arterials to serve
urban expansion in the north, improvements of radial corridors and several secondary and subdivision roads, with a total cost of P 10.6 billion (refer to Figure 10.1).
(2) Southern Roads Package: This package is composed of new primary arterials
to support the expansion of the urban area, opening/improvement of subdivision roads and improvement of critical corridors. Detailed study on the development of the central primary road (PS 4) should be undertaken (refer to Figure 10.1). Total cost is P 13.2 billion.
(3) Central Roads Package: This package is composed of new primary and
secondary roads, grade separation of intersections and R4 corridor improvement with a total cost of P 10.8 billion (refer to Figure 10.1).
(4) Eastern Roads Package: This package is composed of new primary and
secondary roads, grade separations and corridor improvement toward Rizal province with a total cost of P 3.6 billion (refer to Figure 10.1).
(5) Road Environment Improvement: This project component includes
improvement/ expansion of pedestrian facilities and environment with a total cost of P2.0 billion.
(6) Expressway N-S Link: This project is Skyway Phase 2 & 3 which connects
North Luzon Expressway via the Skyway (refer to Figure 10.1). The total cost is P 40.4 billion.
(7) Port Access: This provides the port with a direct expressway link (refer to
Figure 10.1) at an estimated cost of P12.7 billion. A proposed traffic scheme (MMURTRIP) is shown in Figure 10.2.
(8) C-5 North Section: This is currently being promoted as a BOT project.
Government is to shoulder land acquisition cost while the private sector constructs and operates the road as a toll road. However, the MMUTIS is of the opinion that the road should be provided with adequate service roads for the public who reside alongside it. The estimated cost is P 14.1 billion.
(9) Expressway C-5 Airport Access: The improvement plan on the NAIA access
has been prepared (refer to Figure 10.3). For the short term, the proposed plan includes improved traffic circulation and minor roads improvement, while medium-term solution includes improvement of Nichols Interchange. The estimated cost is P 2.1 billion.
MMUTIS Final Report - Summary
S-39
Figure 10.1 Candidate and Selected Road Projects for the MTDP (1999-2004)
Proposed Public Transport Projects Public transport projects include the following: (1) MRT Integration: The current plan that Line 3 terminates at Line 1 at-grade
would create serious traffic problem in the area and restrict the opportunity to serve the reclamation area. This project also intends to improve the integration of Line 1 and Line 3 and possible Line 6 in Baclaran-Pasay Rotonda area. Line 3 will be elevated or moved underground to link the reclamation area and Line 1 and Line 3 stations are to be integrated. The project should allow further integration of Line 1 and Line 3 with Line 6. The estimated project cost of the additional work except rolling stock is P 3.2 billion.
(2) MRT Modal Interchange Facilities: The integration of the MRT with access
modes is critical for the improvement of traffic circulation and passenger convenience and comfort in the interchange areas. This project focuses on the improvement of modal interchange function at critical locations of Line 1, Line 2 and Line 3 such as Baclaran-Pasay Rotonda (Lines 1 and 3) and Cubao (Line 2 and access to the east). The project is composed of pedestrian decks, which provide direct walk links between the MRT lines, bus/jeepney bays and terminal areas for smooth transfer and other pedestrian facilities and space for possible commercial/service facilities. The estimated cost is about P 2.3 billion.
(3) MRT Line 2 Extension: The MRT Line 2 needs to be extended to the east
where accessibility to the city center is constrained due to the lack of roads and efficient public transport services. The cost is P 9.1 billion.
(4) MRT Line 4: This project intends to serve R4 corridor between Recto and
Batasan (and eventually Novaliches). The cost is P 36.2 billion.
(5) MRT Line 6: This project intends to provide mass transit system between the center of Metro Manila and Cavite, by laying a MRT line between Baclaran and Imus (and eventually Dasmariñas). The cost is P 36.0 billion.
(6) PNR Commuter Improvement (MCX): The PNR ROW is ideally located to
serve the strong north-south transport demand. This project is a part of the PNR Commuter Improvement that is composed of North Rail section and MCX section, with the former almost committed. This project intends to improve the PNR line between Caloocan and Alabang. The project cost is P 64.6 billion.
MMUTIS Final Report - Summary
S-43
Figure 10.4 Proposed Development of Modal Interchange Facilities at Critical MRT/LRT Stations
MMUTIS Final Report - Summary
S-44
11. PROJECT EVALUATION
Economic Evaluation Regarding two remarkable benefits – reduction of vehicle operating cost and passenger time saving cost – as the economic benefit of the projects, a set of economic evaluations of the MTDP were conducted. The results indicate that all projects demonstrate relatively high economic viability, though the EIRR varies between 14.6% and 61.5%. The projects with the highest EIRRs are the Skyway project (Phase 2 & 3) and Southern Road Package, while those with the lowest EIRRs are MRT Line 3 Extension, MRT Line 2 Extension and Central Road Package (see Table 11.1).
Table 11.1 Economic Evaluation of MTDP Projects
Project EIRR
(%)
BCR
(%)
NPV
(P million)
MTDP Projects 30.9 2.4 181,737
North Package (Road) 28.3 3.7 22,765
Southern Package (Road) 52.8 6.8 64,703
Central Package (Road) 19.8 1.6 4,133
Eastern Package (Road) 29.0 3.3 3,554
Skyway Stage 2 and 3 61.5 7.2 118,715
Port Access (R10/C3) 30.3 2.8 10,827
C5 North Section 30.1 3.8 28,841
MRT 2 Extension (Santolan-Masinag) 19.1 1.4 1,439
MRT 3 Extension (North Avenue-Caloocan) 14.6 1.0 234
For revenue-generating projects proposed in the MTDP, a financial evaluation was carried out using the discounted cash flow analysis. The results show that the FIRR of the expressway project is not high and that of railway projects are also moderate except for the MCX/PNR Improvement (see Table 11.2).
MMUTIS Final Report - Summary
S-45
Table 11.2 Financial Evaluation of Revenue-generating Projects in the MTDP
Project FIRR (%)
Skyway Stages 2 and 3 11.7
Port Access (R10 - C3) 3.5
MRT 2 Extension (Santolan-Masinag) 10.1 (25.7)
MRT 3 Extension (North Avenue-Caloocan) 4.8 (13.2)
MRT 6 (Baclaran-Imus) 10.1 (20.3) Note: Figures in parenthesis show FIRR when only M & E costs are considered.
Environmental Consideration
The Philippine Environmental Impact Statement (EIS) system was formally established in 1978, which requires environmentally critical projects (ECPs) and those in environmentally critical areas (ECAs) to submit an EIS. The environmental assessment of the MTDP indicates that both positive and negative impacts are concentrated on the socio-environment sphere. Actually, not a few projects require a large number of resettlement due to ROW acquisition. A comprehensive relocation policy and methodology must be formulated to implement these projects in a limited period.
12. IMPLEMENTATION PLAN Funding ODA and private sector funds are the primary fund sources, both of which require counterpart local funds. While traffic management/low-cost measures, at-grade primary and secondary roads mostly require public funds, expressways and MRT/LRT/busway could attract private funding. If they are properly handled, cost to government in terms of capital and operation costs could be substantially reduced. If land acquisition is minimal, 80% of the construction costs could be shouldered by the private sector on a BOT basis, and if the infrastructure cost of a mass rail transit is shouldered by government, the system could be operated by the private sector on a BOT basis. Investment Plan The investment schedule for the MTDP period (1999-2004) has been assumed as shown in Table 12.1.
MMUTIS Final Report - Summary
S-46
Table 12.1 Mid-term Cost Allocation Plan
Project/Project Package Total MTDP (P bil) (P bil)
Cost Allocation for Mid-term Plan Period Cost to Govt.
Subtotal
Subtotal
1999 2000 2001 2002 2003 2004
MMUTIS Final Report - Summary
S-47
TRANSPORT DATABASE & RESEARCH CAPACITY DEVELOPMENT 13. OVERVIEW
One of the main objectives of the MMUTIS is to establish an updated transport database and build transport models and procedures to facilitate research and education in transport planning fields and further use by counterpart agencies for transport planning and project studies. Available transport databases prior to the MMUTIS were limited to those owned by individual agencies for their specific administrative use and old data produced by past studies. The MMUTIS’ attempt to prepare a comprehensive transport data for planning is the first since JUMSUT in 1981 under JICA technical assistance. In the MMUTIS, a number of transport surveys, including a comprehensive Household Interview Survey, were conducted which produced the primary base for updating the existing database. The MMUTIS’ contribution is not limited to updating the transport database but also various transport models including STRADA for demand analysis and assessment of transport network and projects. Procedures to use the database and models are also documented and training is provided to selected counterparts. The NCTS is expected to function as the center for further training and management of the transport database and planning tools.
14. MMUTIS TRANSPORT SURVEYS
Person-trip Survey
The primary objective of the person-trip survey (otherwise known as the Household Interview Survey or HIS) is to acquire information on the travel and socio-economic characteristics of the residents in the study area. A total of 50,516 households in Metro Manila and 8,004 households in municipalities of adjoining provinces were sampled at sampling rates of 2.5% and 0.8%, respectively during the period August to November of 1996. Other Surveys Other major surveys conducted in the MMUTIS and summarized in Table 14.1 include those on roads (including subdivision roads), vehicular traffic, travel speed, public transport operation, parking, truck routes, airport and port traffic, water transport, landuse, road environment, willingness-to-pay, and so on.
MMUTIS Final Report - Summary
S-48
Table 14.1 Outline of Transportation Surveys Conducted in the MMUTIS
working condition of drivers & operational characteristics
10 terminals for each mode direct interview with jeepney/ bus/tricycle/ taxi drivers
11 Airport Survey characteristics of NAIA related traffic
NAIA (Ninoy Aquino International Airport) domestic terminal cargo terminal
airport employee survey 24-hour traffic count and vehicle occupancy survey at all gates 24-hour direct interview with passengers, well-wishers/visitors
12 Bus/Jeepney Operator Survey
characteristics of bus/jeepney industry
public transport operators bus (51), jeepney (49+18)
direct interview with operators
13 Garbage Truck Movement Survey
traffic volume, vehicle type, loading volume and service area of garbage trucks
5 major dump sites of Metro Manila one week continuous observation
14 Willingness-to-pay Survey willingness-to-pay attitude and value of time
6 public transport mode and private car major terminal areas for public transport, and EDSA, SLE and NLE for private car 1,000 samples per mode (7,000 in total)
direct interview with passengers and drivers
15 Water Transport Demand Survey
socio-economic characteristics of river ferry passengers opinion/preference for river ferry
600 river ferry, 400 banca, 1,800 jeepney and 600 bus passengers
direct interview with passengers at selected terminals/routes
collection of records interview with investigators
17 Road Inventory Survey basic planning information by road section
all major roads in the Study area observation and measurement of roads
18 Subdivision Road Inventory basic planning information of selected roads of selected subdivisions
24 subdivisions/areas observation and measurement of roads
19 Landuse Survey updating present landuse map Metro Manila (detailed ) Study area (general classification)
observation
20 Road Environmental Survey
environmental quality of MMUTIS Study area
14 selected points in the Study area Air pollution (NOx, CO, SO2, SPM and Pb) and noise level coupled with meteorological and traffic data.
Direct measurement and analysis in laboratory.
MMUTIS Final Report - Summary
S-49
15. TRANSPORT MODELS
Various transport models have been prepared and used in the planning process of the MMUTIS. They are as follows: (a) Trip Generation/Attraction Model: This model deals with trip
generation/attraction by residents in terms of car owner vs. noncar owners and home-based vs. nonhome-based. The model was built based on socio-economic indicators and trip generation/attraction by zone.
(b) Modal-split Model: Both trip end model and trip interchange model have been
dealt with in the Study. The model was built to determine the split between “walk”, “public” and “private” trips.
(c) Trip Distribution Model: This is composed of two submodels for intrazonal
and interzonal trips. Various models were tested before Voorhees Gravity Model was selected.
(d) STRADA: The JICA STRADA consists of 25 program modules mainly to
cover database needed for traffic assignment, models for trip generation/attraction, trip distribution and modal split, and traffic assignment for highway and transit traffic.
16. PROPOSED DATABASE AND MMUTIS CONTRIBUTION
The NCTS, as the center for database management, has started to prepare a database system for transport planning and research work. Servers will be installed at the network center. The main server will maintain the homepage of the system and contain applications which process data requests. Remote users can access the database through the Internet, view the output on-line and request for other outputs. Remote workstations can be installed on key planning agencies such as the MMDA, DOTC, DPWH, National Economic Development Authority (NEDA), National Mapping and Resource Information Authority (NAMRIA), and so on. For the proposed database system, the MMUTIS will initially provide the primary inputs which will be further expanded and updated in the future. The contents of the MMUTIS database was developed based on the series of surveys and studies made in the Study (refer to Table 16.1). The MMUTIS database has already been utilized by many planning agencies for planning and studies and by graduate students for their research and thesis. Likewise, other ongoing studies by private entities have relied in part on the MMUTIS database for their planning process.
MMUTIS Final Report - Summary
S-50
Table 16.1 MMUTIS Database Contents
(CORE DATA)
Data Category Data Year Update Source
Core Data 1) HIS 2) Cordonline data 3) Screenline Data 4) Land-use Map 5) Administrative Boundary Map 6) Population Census
1980, 83, 96 1980, 83, 96 1980, 83, 96
1986 1996
1980, 90, 95
- - -
NAMRIA LGUs NSO
(PRIMARY & SECONDARY)
Data Category Primary Data
(Original Data) Secondary Data (Processed data)
Update Source
Socio-economic Population/household Zone Map HIS Master file
Population data Employment School attendance Income Car ownership
NSO
Land-use Land-use Map (GIS) Land-use data NAMRIA Transport Demand HIS Master file OD trip tables
Road network data 2005,2015 171 OD matrices – person trip basis (by trip purpose for public and private mode)
2005,2015 171
MMUTIS Final Report - Summary
S-51
17. TECHNOLOGY TRANSFER
The MMUTIS shared its resource for effective technology transfer and dissemination of study outputs through various forms such as conducting regular counterpart meetings, seminar-workshops, training course, and preparing a fact book. As of 4 December 1998, a total of 103 meetings between the JICA Study Team and Counterpart Team and 13 seminar-workshops on various topics were held. A seven-day intensive training course on MMUTIS transport models, including STRADA, is currently undertaken in the NCTS. A fact book on traffic conditions in the study area distributed to various agencies and stakeholders in the above-mentioned seminars and meetings contributed to a better understanding of the transport problems and issues.
MMUTIS Final Report - Summary
S-52
CONCLUSIONS AND RECOMMENDATIONS 18. CONCLUSIONS
The study area will continuously face critical transport situation in the future unless a number of important and difficult policy measures are taken in an integral manner now. Demand grows rapidly due to population growth, expansion of urban areas and shift from public to private transport, while government funds available for new infrastructure remains constrained. The capability to manage available facilities and resources also needs to be improved. Under this situation, the right policies are extremely hard and difficult to implement. There will be no easy solution and no single project/scheme to improve the situation drastically. Moreover, many of the problems are related to institutional issues. The manner in strengthening metropolitan governance is the central issue to tackle the complex situation facing the transport sector.
Planning should form the core of transport administration. Without an established transport and development planning process and consented/institutionalized development framework plan, coordinated effort may not be enough to provide a sound basis for the required measures and neither would it produce the intended outcome. Many of the existing transport problems are due to ineffective traffic management as has been identified in many of the past studies including the recent MMURTRIP. Existing capacities are considerably reduced due to poor maintenance of roads, lack of traffic management of vehicles, pedestrians and roadside activities along major roads and critical intersections, widespread minor bottlenecks and so on. It is easy to pinpoint that improved management and low-cost measures could improve the capacity of road sections by 10 to 20% in many locations.
The current transport policy lacks medium to long-term strategy on how to guide the future urban areas effectively. While transport sector investments are concentrated in existing congested areas, new problem areas emerge in many locations. Unless short-term measures comply with long-term strategies, the investment effects would not be maximized and the city will never improve. Because of this, the MMUTIS Master Plan worked out the transport network plan to effectively link the outer area with the existing urban areas.
Although traffic management and other low-cost measures are important and are continuously undertaken to maximize the use of available facilities and to improve management capabilities in the process, it is also critical to provide new infrastructure to cope with the increasing backlog and future demand. Balancing short-term measures and long-term strategies is becoming critically important.
In order to make the future better, or at least not worse than now, needed transport infrastructures require considerable amount of government funds.
MMUTIS Final Report - Summary
S-53
The needed amount is approximately P 530 billion and P 120 billion for the Master Plan and the MTDP period, respectively. The estimated public funds are P 200 – P 400 billion for the Master Plan period (up to 2015) and P50 – P100 billion during the MTDP period (1999-2004), based on conventional revenue source available for the transport sector in the study area under the low and high economic growth assumptions, respectively. This is a critical constraint for the improvement of transport infrastructure. The gap is roughly P 100 billion for the Master Plan.
Constraints in the availability of public funds are also critical during the MTDP period largely due to the committed and ongoing mega projects such as urban rail Line 2 and Line 3, a substantial portion of whose costs are carried over to the MTDP period. When priorities are given to management/low-cost measures and other cost-effective solutions, not much funds will be left for new impact projects which support long-term strategies. This explains clearly the need for a strong demand management or new funding source, or probably both.
Although many constraints exist, there are opportunities to improve the situation in the study area. The people’s preference for public transport, which is mostly operated by the private sector, is still strong compared to other Asian cities. A drastic car use restriction measure (UVVRP or color coding scheme) is socially accepted, and the basic road network in the central area (within EDSA) is relatively well configured. Large urban development opportunities exist in the emerging suburban areas, basic city planning institution exists (although not practiced adequately), and there is dialogue among concerned agencies and stakeholders. Considerations on these positive elements indicate the following:
Effective management of and minor investment in the existing infrastructure have great opportunities to improve the transport situation.
The public transport market is large and diverse and investment opportunities are amply available requiring improved regulatory framework to respond to demand flexibly.
Infrastructure investment in the emerging area could be cross-subsidized by urban development if they are properly integrated and guided by the government through proper regulatory measures.
The people’s acceptance of further demand management measures is considered high, taking into account the support for UVVRP by both public transport and private car users.
MMUTIS Final Report - Summary
S-54
19. RECOMMENDATIONS
Strengthening metropolitan governance is the critical success factor for transport development and management in the study area. Toward this end, the MMDA should be strengthened to function as the center of management to cover the following:
Incorporation of alignment and locations of major transport facilities in the statutory city planning institution such as zoning.
Strengthening and improvement of the practice of land-use zoning and development permit issuance to guide private sector investments based on the updated zoning plan and development standards/guidelines.
Establishment of a transport and development planning process based on an updated database, planning procedures and investment criteria. The Capital Investment Folio (CIF) which was practiced successfully during the early 1980s under the Metro Manila Commission should be reviewed for possible introduction into the planning system. The UP-NCTS should provide the MMDA and other transport agencies with the needed technical support and training on state-of-the-art technologies on transport planning
Coordination of mega projects, such as MRT, expressways, arterial roads, and major terminals. This is a critical function of the MMDA and is not limited among transport agencies but also between transport and urban development authorities. Without vigorous coordination, it will become more and more difficult to accommodate new infrastructures.
Improvement of traffic management, which will be of primary importance not only to maximize the effective use of the infrastructure but also to upgrade management capacity and educate drivers and pedestrians in the process.
Introduction of other TDM measures, which will become more important to manage the demand and at the same time to expand user charges.
Promotion of public involvement, which is becoming increasingly critical to implement impact projects/programs.
Promoting public transport-based urban areas should be placed in the center of the overall city planning and development policy which are to be supported by the following measures:
Promotion of rail transit system as the center of the public transport system of the metropolitan area through the participation of the private sector, effective use of ODA and integrated urban development.
Establishment of an improved basis for private sector participation in MRT projects including termination of unsolicited proposal method,
MMUTIS Final Report - Summary
S-55
government commitment at least to shoulder the infrastructure component and competitive bidding for the operation component by the private sector.
Promotion of transport terminal development. The MMDA is expected to take the lead to coordinate stakeholders. For this, new development methods, such as urban renewal and land readjustment systems, may provide alternative opportunities.
Improvement of public transport regulatory process to promote adequate submodal split especially between bus and jeepney, and mass rail transit.
Improvement of pedestrian environment including sidewalk, crossings, street lighting, trees, and shade.
Supportive measures should be expanded to accelerate infrastructure development including the following:
Incorporation of major transport infrastructure with city planning institution.
Government-led planning to protect and balance public interest.
Establishment of clear rules/guidelines on private sector involvement, particularly on BOT projects.
Introduction of project development schemes such as integrated development, land readjustment, etc.
Strategic use of ODA (eg. from short-term project loan to long-term program loan, urban rail development fund).
Securing new source to fund transport infrastructure and implementing expanded demand management through the following:
Shift from physical restraints to pricing measures such as road pricing, Area Licensing System (ALS), parking pricing, etc.; and
Increase in car sales tax, registration fee and fuel tax.
Establishing public involvement in transport planning and development through:
Public information on traffic situation;
Participation in transport planning process and public information on the results; and
Transport education.
MMUTIS Final Report - Summary
S-56
Members List (1) Steering Committee Chairman : Undersecretary Dr. Primitivo Cal, DOTC : Undersecretary Willie Evangelista, DOTC (successor) Vice Chairman : General Manager Robert Nacianceno, MMDA : General Manager Violeta Seva, MMDA (successor) Members : Undersecretary Teodoro Encarnacion, DPWH : Assistant Director-General Augusto Santos, NEDA : Chief Supt. Job Mayo, PNP-NCR Command : Director-General Dionisio dela Serna, HUDCC : Chancellor Claro Llaguno, UP Diliman Technical Advisory Committee Chairman : Assistant Secretary Cesar Valbuena, DOTC : Assistant Secretary George Esguerra, DOTC
(successor) Vice Chairman : General Manager Violeta Seva, MMDA Members : Assistant Secretary Manuel Bruan, LTO : Chairman Dante Lantin, LTFRB : General Manager Jose Dado, PNR : Administrator Manuel Clasara, LRTA : Assistant Secretary Manuel Bonoan, DPWH : Director Godofredo Galano, DPWH-TEC/BOT : Director Elisa Joson, DPWH-TECH/BOT : Director Ernesto Camarillo, MMDA : Director Ricardo Sigua, NCTS : Director Ruben Reinoso, NEDA : Chairman Arsenio Yulo, PEA : Col. Rogelio Luis, President, PNCC : Commissioner Romulo Fabul, HLRB : Director Amelia Dulce Supetran, EMB-DENR JICA Advisory Committee 1) Dr. Shigeru MORICHI : Chairman 2) Dr. Haruo ISHIDA : Vice Chairman 3) Dr. Seiji NISHIOKA : Urban Transportation Planning 4) Mr. Kazuhiro TANAKA : Public Transportation Planning 5) Mr. Hiroshi YOSHINAGA : Public Transportation Planning 6) Mr. Soki SATO : Public Transportation Planning 7) Mr. Tetsuya KAMURA : Public Transportation Planning JICA 1) Mr. Ikufumi TOMIMOTO : Director, First Social Development Study Division 2) Mr. Takao KAIBARA : Director, First Social Development Study Division 3) Mr. Masami FUWA : Deputy Director, First Social Development Study Div. 4) Mr. Masaei MASTUNAGA : Deputy Director, First Social Development Study Div. 5) Ms. Eri HONDA : Deputy Director, First Social Development Study Div. 6) Mr. Hiroyuki KANZAKI : First Social Development Study Division 7) Mr. Yukihiro KOIZUMI : First Social Development Study Division (Philippine Office) 8) Mr. Hiroshi GOTO : Resident Representative 9) Mr. Toshiyuki KUROYANAGI : Deputy Resident Representative 10) Mr. Hisakatsu OKUDA : Assistant Resident Representative
MMUTIS Final Report - Summary
S-57
Members List (2) JICA Study Team 1) Dr. Shizuo IWATA : Team Leader 2) Mr. Takashi SHOYAMA : Deputy Team Leader, Public Transportation
Planning 1 3) Dr. Katsuhide NAGAYAMA : Urban Development 4) Dr. Geronimo V. MANAHAN : Land-use Analysis 5) Mr. Kenji MARUOKA : Road Planning 6) Mr. Tetsuo WAKUI : Deputy Team Leader, Demand Forecast 7) Mr. Kazuyuki OTSUKA : Public Transportation Planning 2 8) Mr. Yoshinori KOTANI : Mass Transit Facility Planning 9) Mr. Rene SANTIAGO : Public Transportation Project Management/
Organization 10) Mr. Seiya MATSUOKA : Traffic Management 11) Mr. Michimasa TAKAGI : Transportation Node Planning 12) Ms. Venetia Lynn M. SISON : Transportation Survey 1 13) Dr. Tetsuji MASUJIMA : Transportation Survey 2 14) Mr. Naoshi OKAMURA : Transportation Planning/ Modeling 1 15) Mr. Masayuki ISHIYA : Transportation Planning/ Modeling 2 16) Mr. Mazhar IQUBAL : System Analysis/ Modeling 3 17) Mr. Alan J. PEAKALL : Financial/ Fiscal Analysis 18) Ms. Theresa. J. VILLAREAL : Macro Economy 19) Mr. Roger ALLPORT : Transportation Policy 20) Mr. Mitsuyoshi ASADA : Facility Planning 21) Mr. Isao HARA : Construction Planning 22) Mr. Yoshinori TANAKA : Engineering Design / Cost Estimate 23) Mr. Tsukasa KISHIMOTO : Environmental Planning 24) Mr. Yosuke SASAKI : Natural Condition Analysis Counterpart Study Team Project Director : Assistant Secretary Cesar Valbuena, DOTC Project Manager : Assistant Secretary George Esguerra, DOTC Assistant Project Managers : Director Cora Cruz, MMDA : Director Elisa Joson, DPWH : Director Olegario Villoria, Jr., NCTS Members : Mr. Arnel Manresa, DOTC : Ms. Cora Japson, DOTC : Mr. Eleuterio Galvante, DOTC : Ms. Marites Tuason, DOTC : Ms. Josephine Bondoc, DOTC : Mr. Victor Dato, NEDA : Ms. Cora Marquez, MMDA : Mr. Emmanuel Supe, DPWH-URPO : Mr. Dante Inciong, DPWH-TEC : Mr. Darren Badion, DPWH-URPO : Mr. Florencio Alano, DPWH-BOT : Ms. Sheila Gaabucayan, NCTS : Mr. Noreil Tiglao, NCTS : Ms. Aileen Mappala, NCTS : Mr. Segundo Palancia, Jr., DOTC


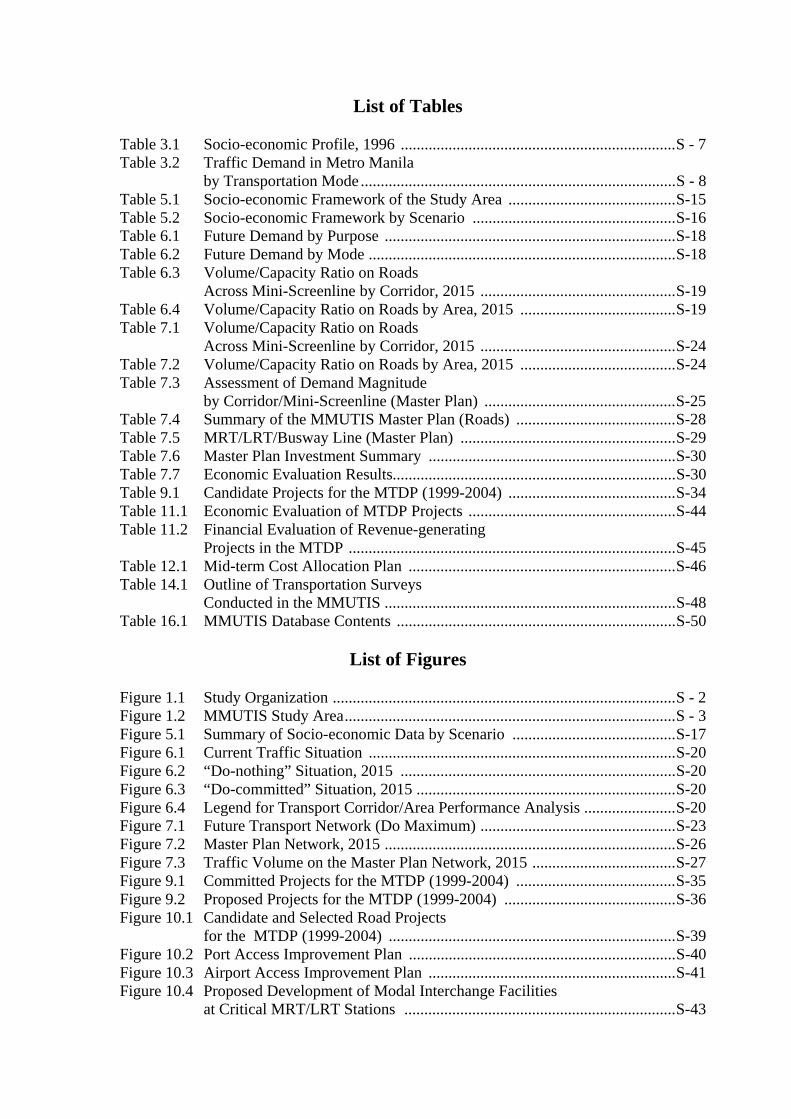


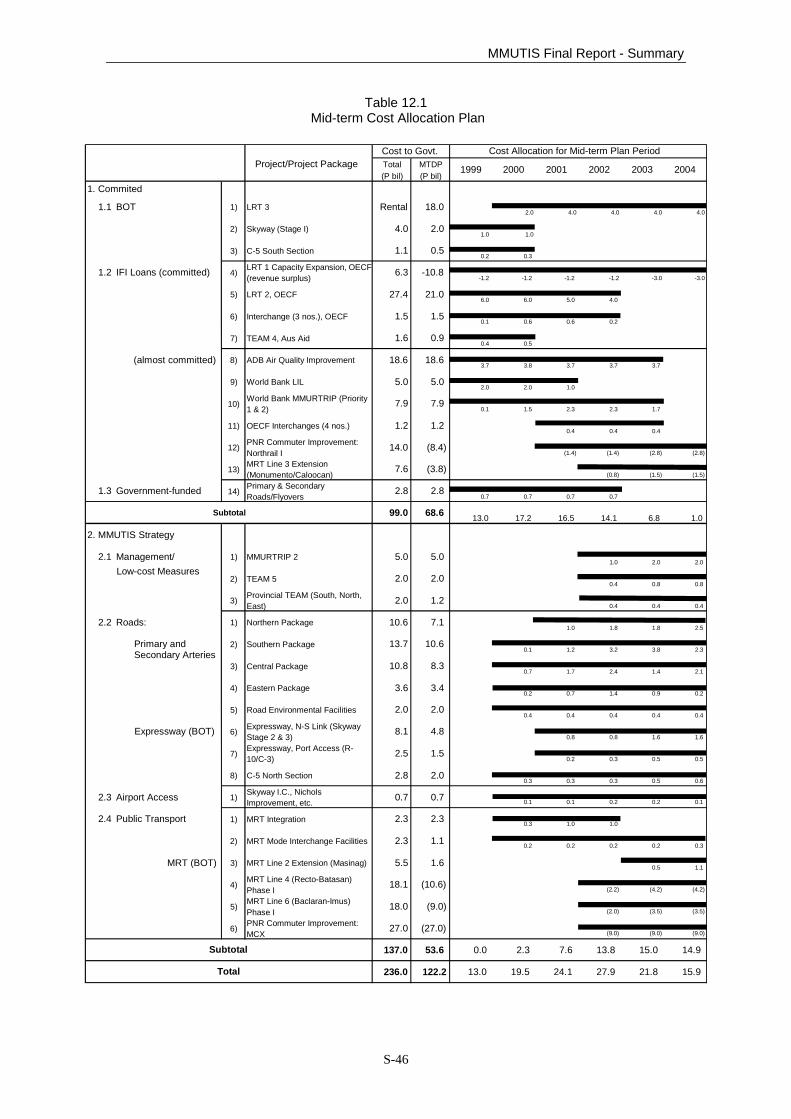


![[ Appendices ] - JICA](https://static.documents.pub/doc/80x56/61bd39fc61276e740b109e6e/-appendices-jica.jpg)


