FINAL REPORT For the Florida Department of Transportation Laboratory Simulation of Field Compaction Characteristics (Phase I) Research Report No.: FL/DOT/RMC/BB-890(F) FSU Project No.: 6120-549-39 by W. V. Ping, P.E. Michael Leonard Zenghai Yang Department of Civil & Environmental Engineering Florida A&M University – Florida State University COLLEGE OF ENGINEERING Tallahassee, FL 32310 March 2003
Transcript
FINAL REPORT
For the Florida Department of Transportation
Laboratory Simulation of Field Compaction
Characteristics
(Phase I)
Research Report No.: FL/DOT/RMC/BB-890(F)
FSU Project No.: 6120-549-39
by
W. V. Ping, P.E.
Michael Leonard
Zenghai Yang
Department of Civil & Environmental Engineering
Florida A&M University – Florida State University
COLLEGE OF ENGINEERING
Tallahassee, FL 32310
March 2003
ii
METRIC CONVERSIONS inches = 25.4 millimeters
feet = 0.305 meters
square inches = 645.1 millimeters squared
square feet = 0.093 meters squared
cubic feet = 0.028 meters cubed
pounds = 0.454 kilograms
poundforce = 4.45 newtons
poundforce per square inch = 6.89 kilopascals
pound per cubic inch = 16.02 kilograms per meters cubed
iii
DISCLAIMER
“The opinions, findings and conclusions expressed in
this publication are those of the authors and not
necessarily those of the Department of Transportation or
the U.S. Department of Transportation. This publication is
prepared in cooperation with the State of Florida
Department of Transportation and the U.S. Department of
Transportation.”
iv
ACKNOWLEDGEMENTS
Funding for this research was provided by the Florida
Department of Transportation (FDOT) and Federal Highway
Administration (FHWA) through the Research Center of the FDOT.
This research was initiated and managed by Sastry Putcha, State
Construction Geotechnical Engineer.
The FDOT Research Center, through the assistance of Richard
Long and his staff, provided financial and contractual support.
The field stress monitoring study was conducted by Ardaman &
Associates, Orlando, Florida. Dan Turner, formerly with FDOT,
provided strong support to this research study.
v
TABLE OF CONTENTS
List of Tables ............................................................................................................ viii
List of Figures ............................................................................................................ ix
Summary of Final Report ..............................................................................…........ xi
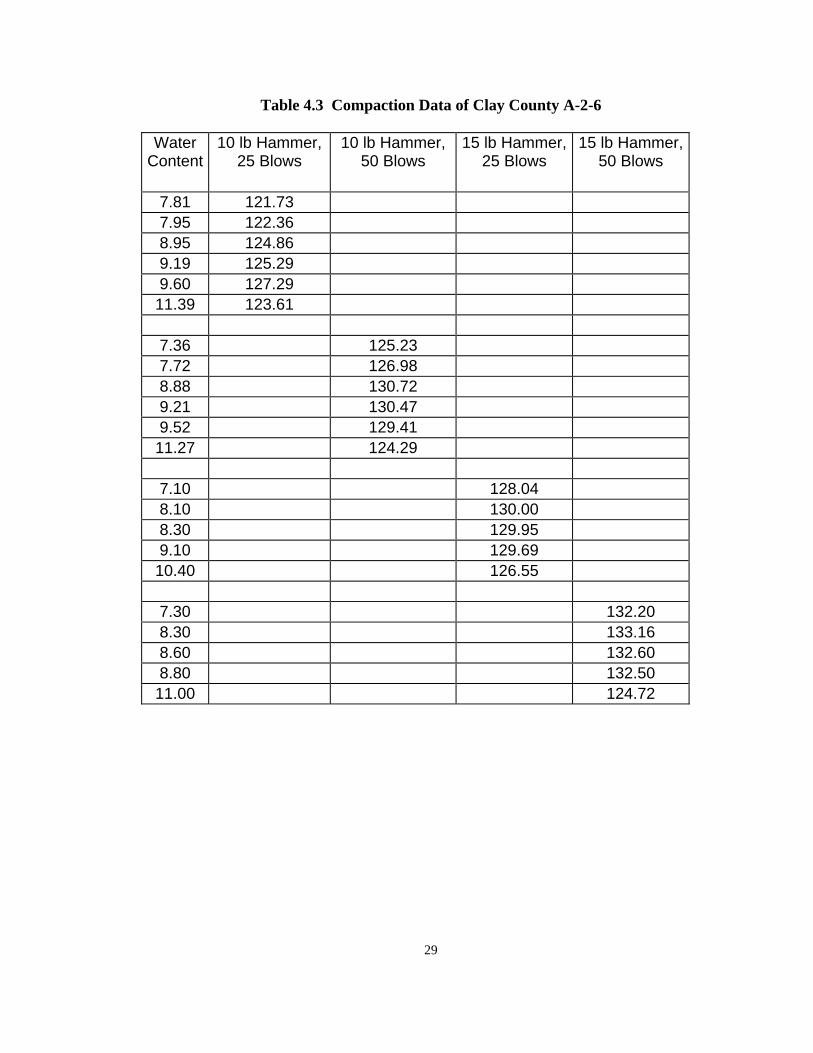
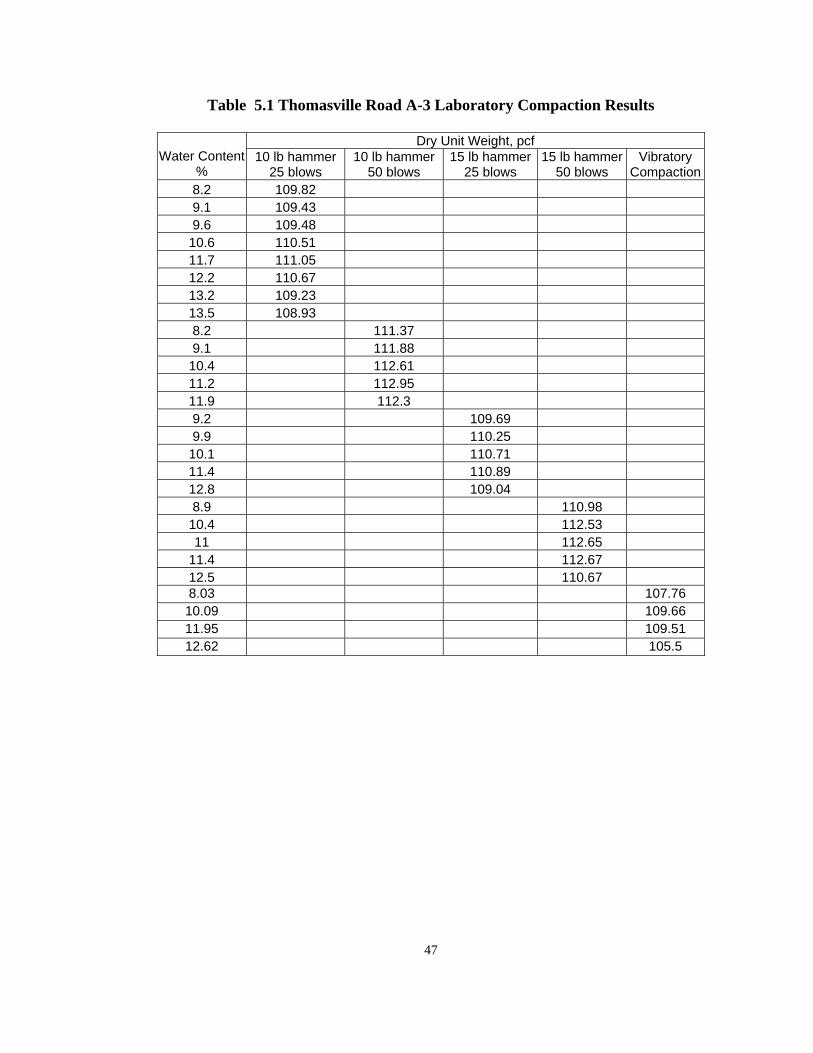
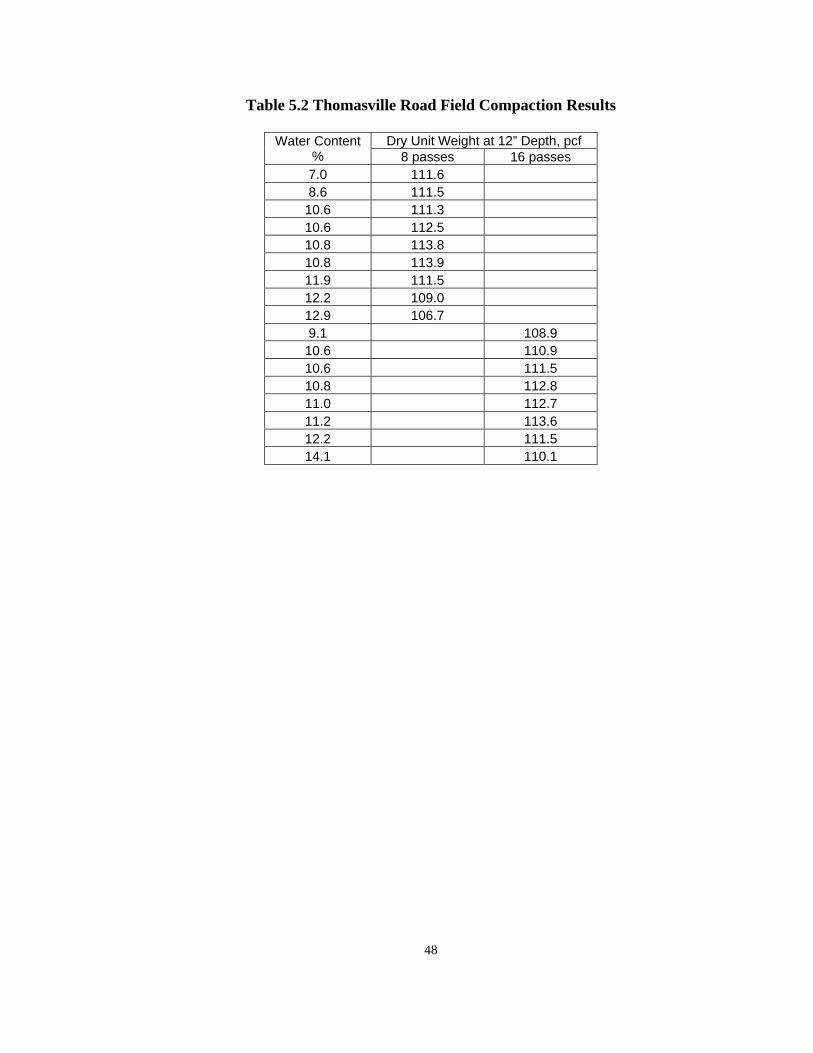
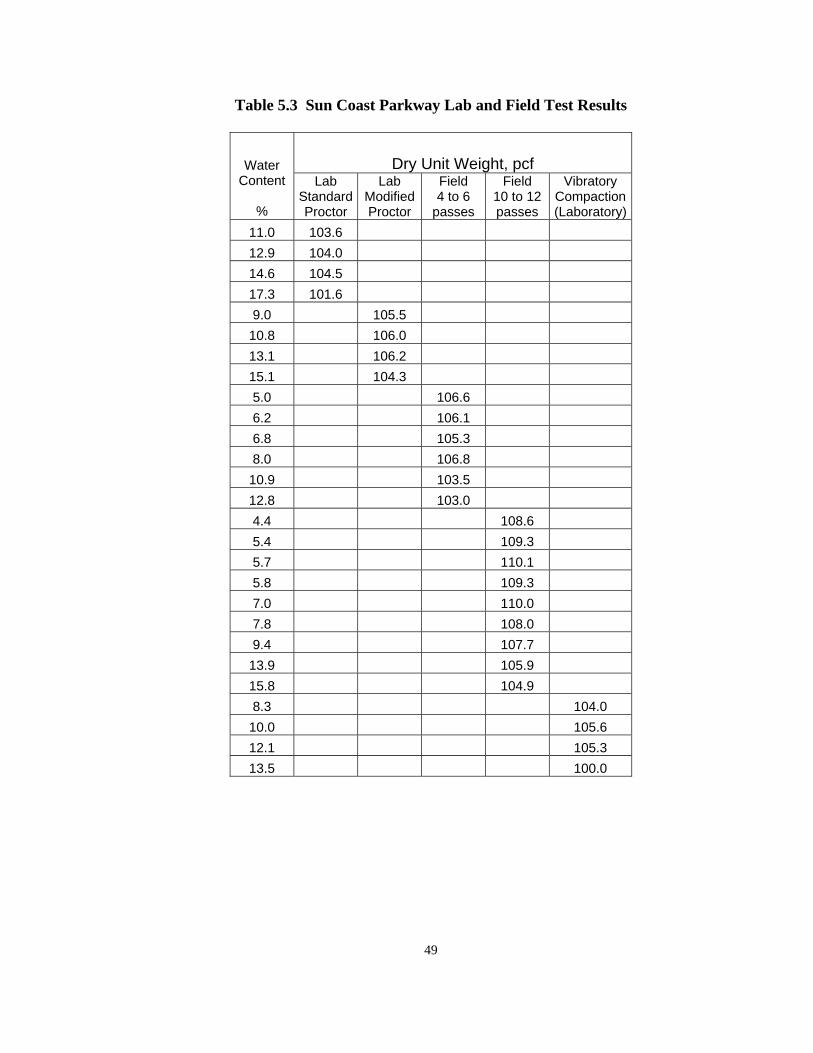
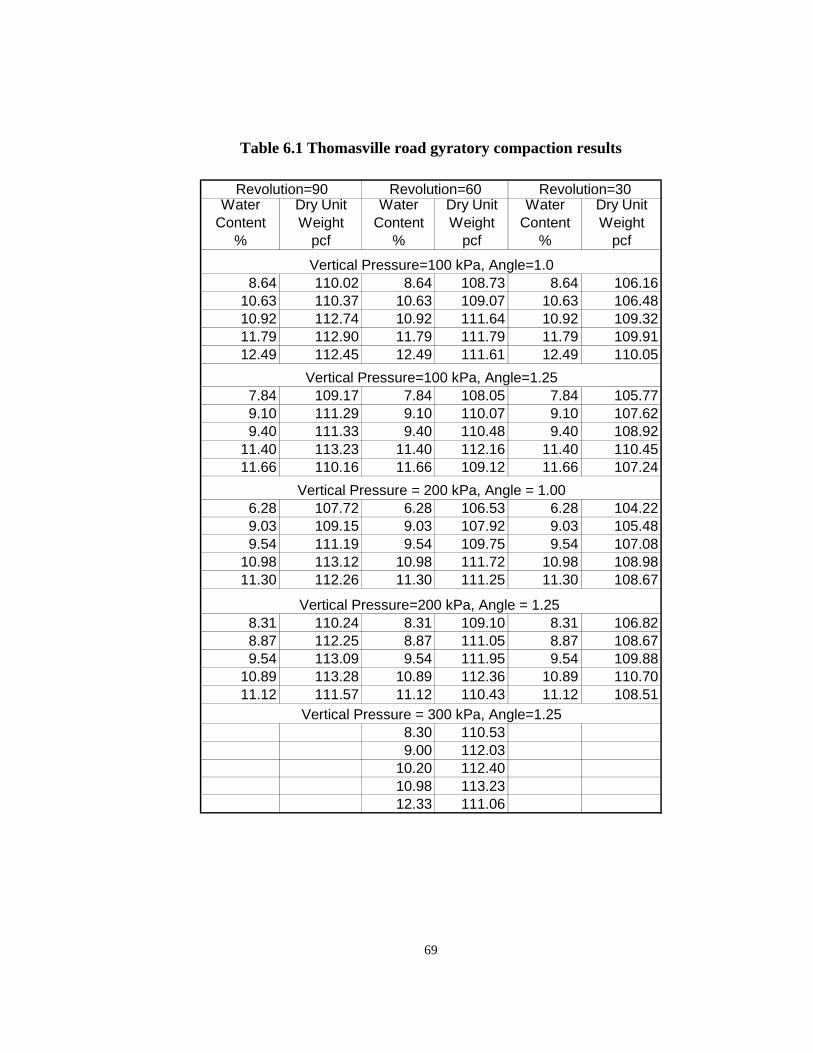
4.1 Soil Materials for Laboratory Investigation ……………………………… 25 4.2 Compaction Data for Alford City A-2-4 ………………………………….. 28 4.3 Compaction Data for Clay County A-2-6 ………………………………… 29 4.4 Compaction Data for Lake City A-3 ……………………………………… 30 5.1 Thomasville Road A-3 Laboratory Impact Compaction Results …………. 47 5.2 Thomasville Road Field Compaction Results ……………………………. 48 5.3 Sun Coast Parkway Lab and Field Test Results ………………………….. 49 5.4 State Road 56 Field Test and Lab Modified Proctor Test Results …...…. 50 6.1 Thomasville Road Gyratory Compaction Results ……………….……….. 69 6.2 Sun Coast Parkway Gyratory Compaction Results ………………………. 70
ix
LIST OF FIGURES
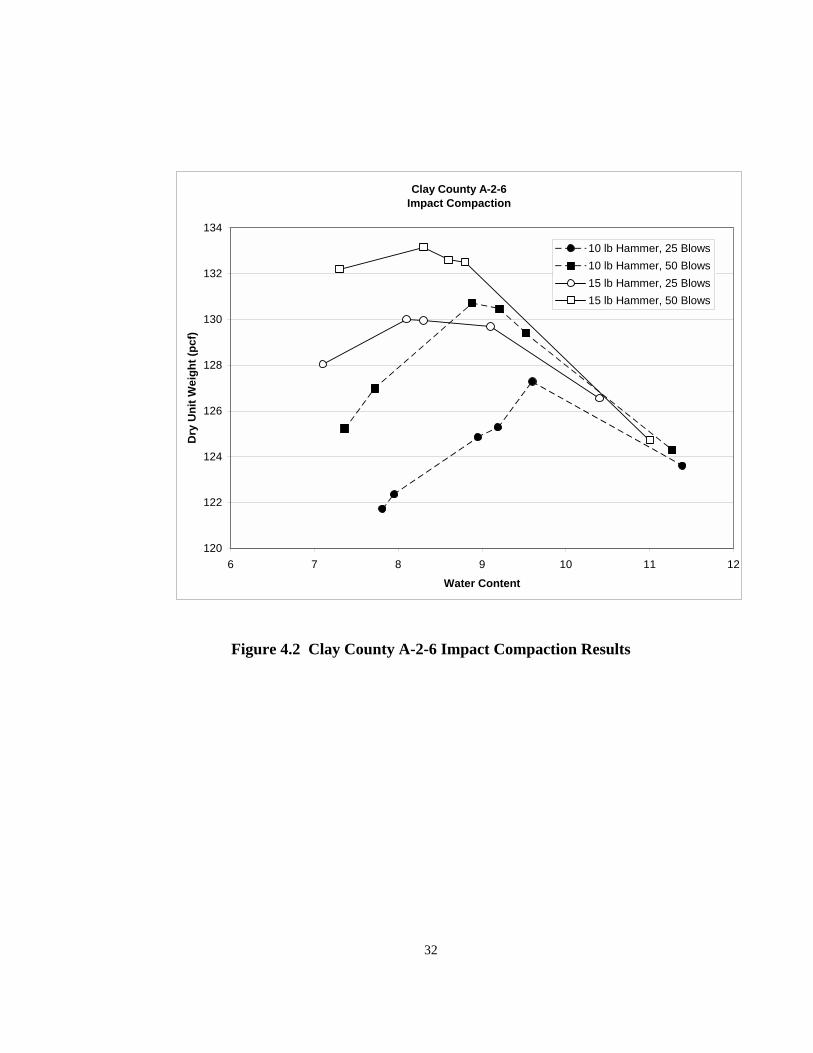
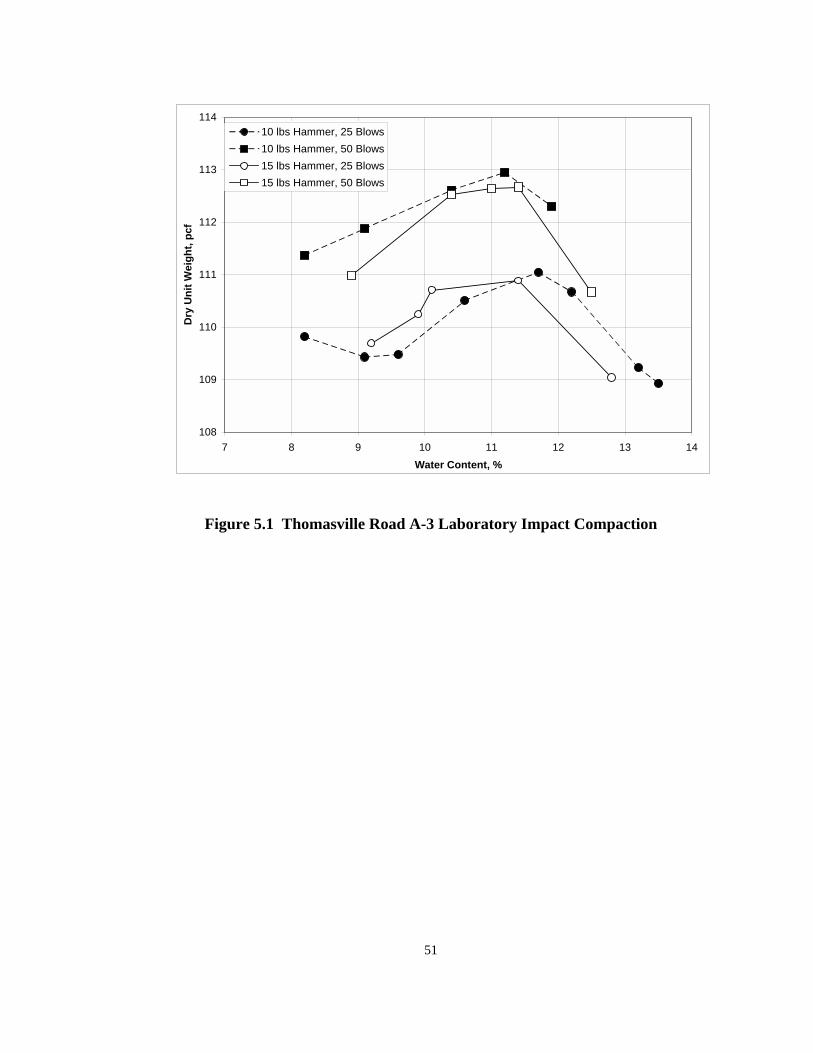
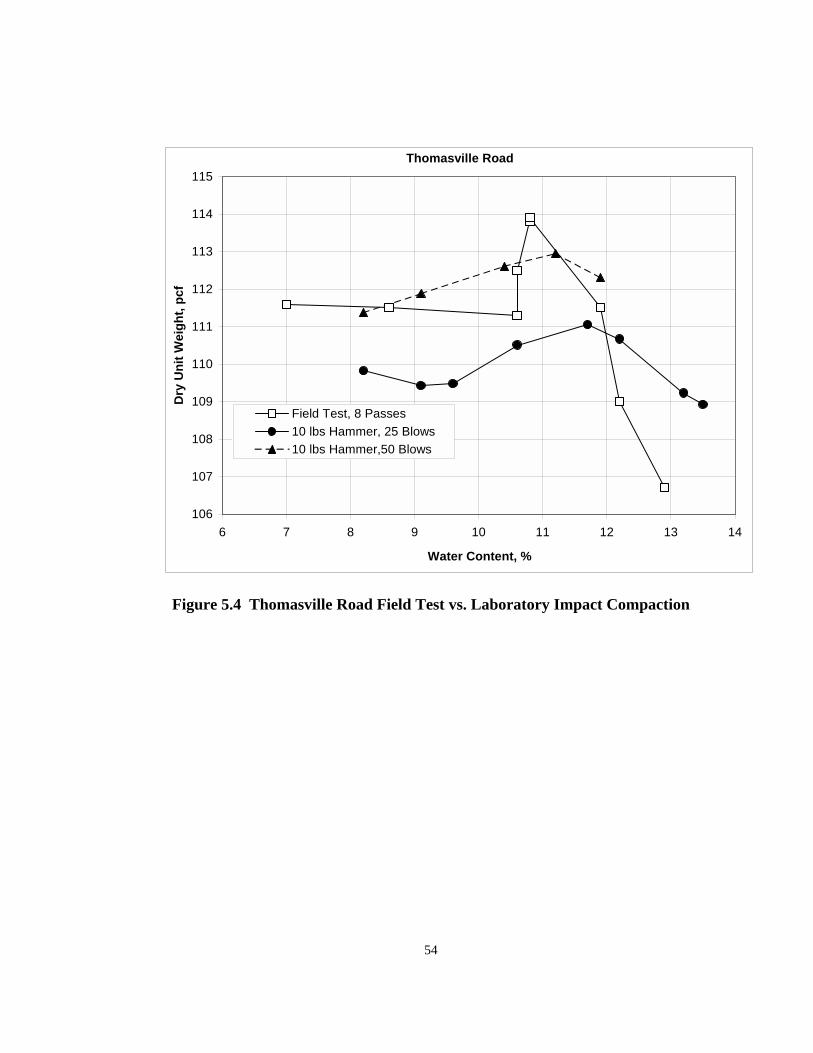
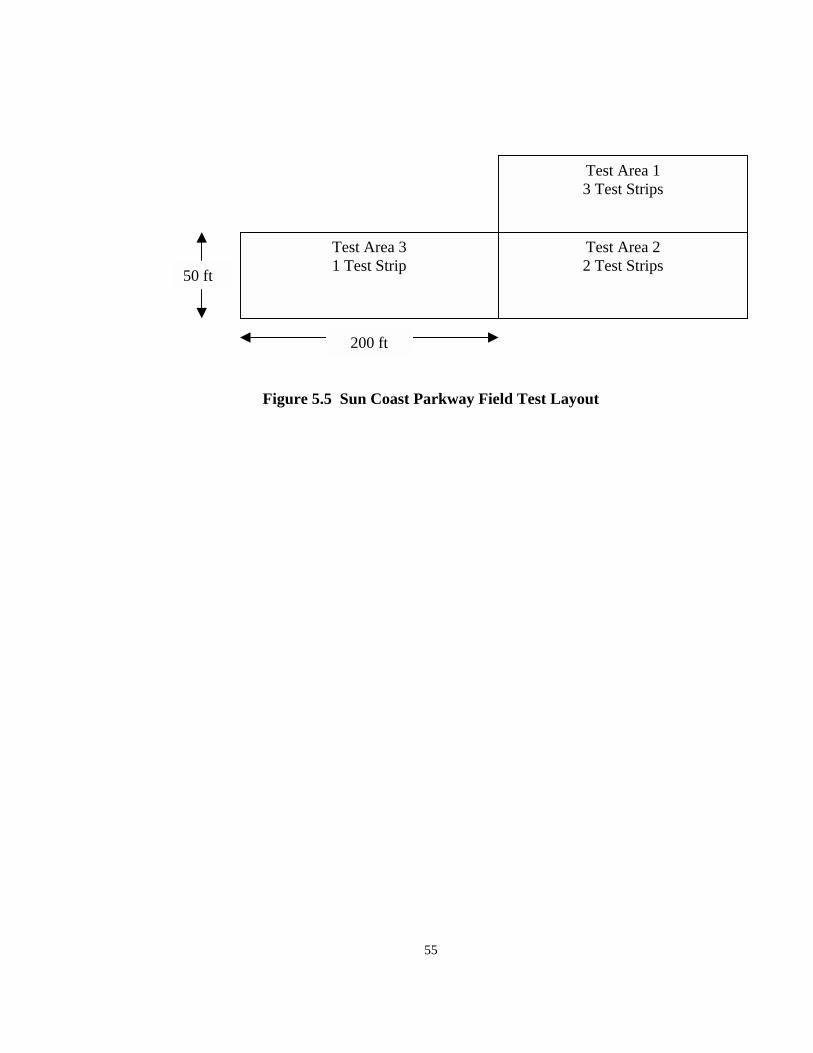
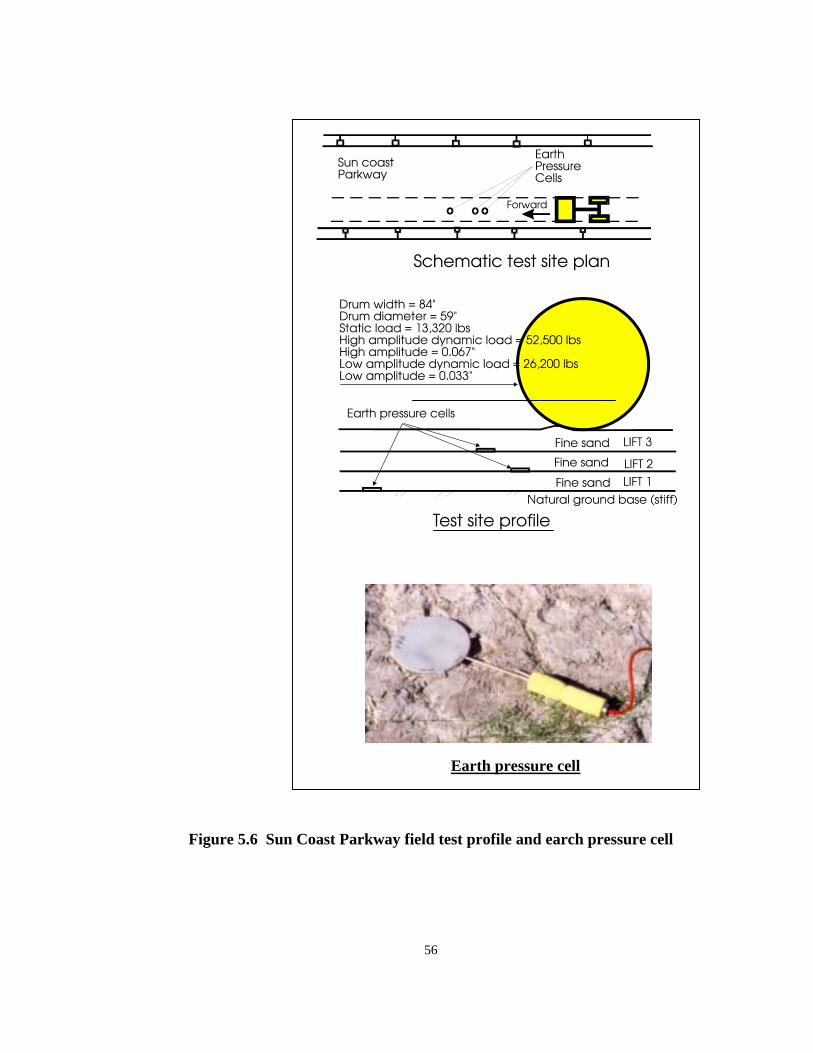
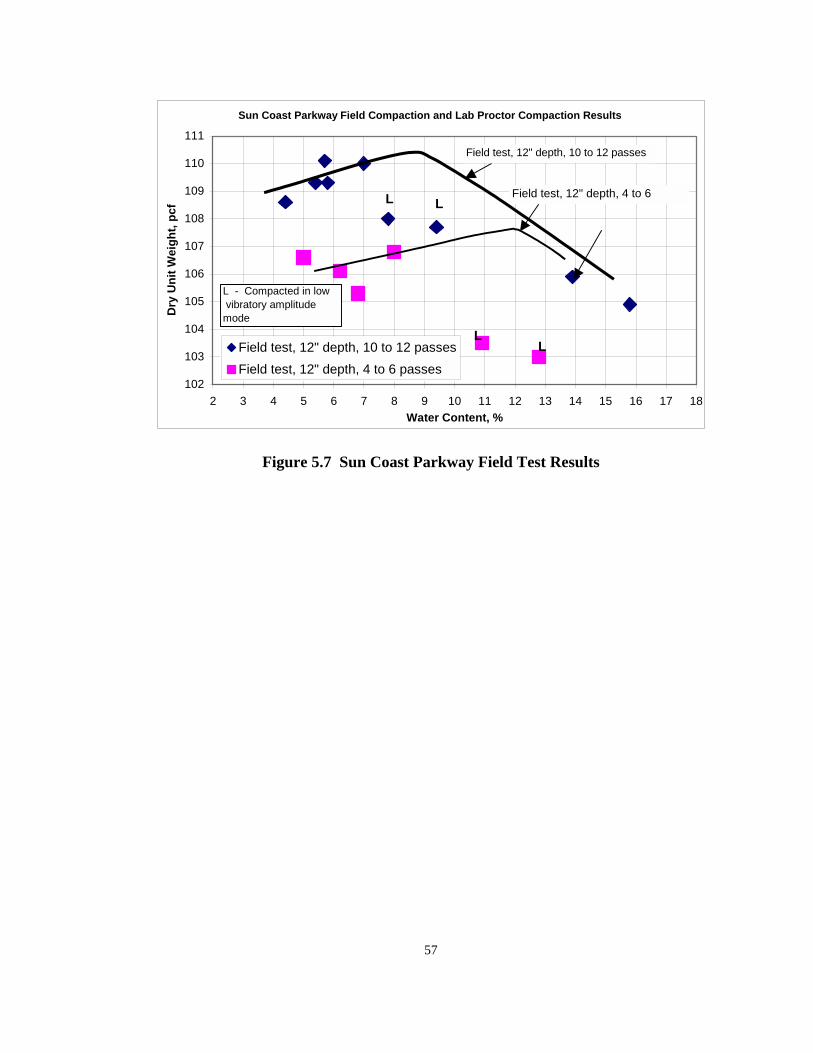
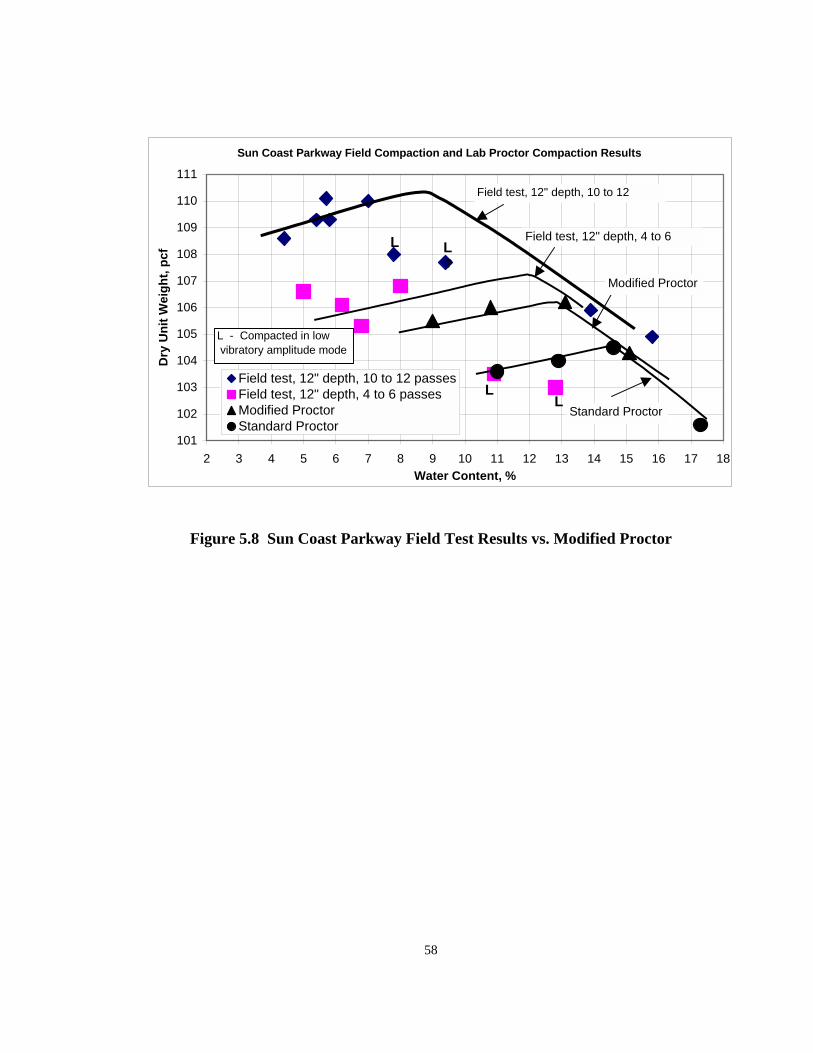
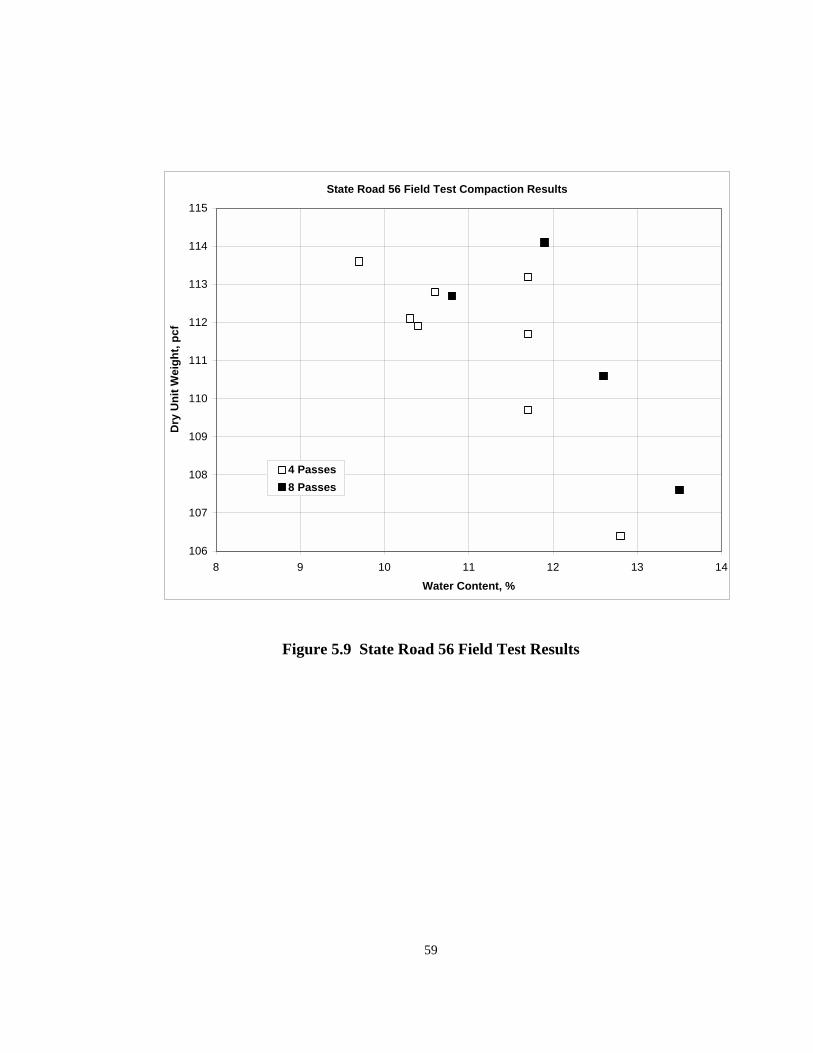
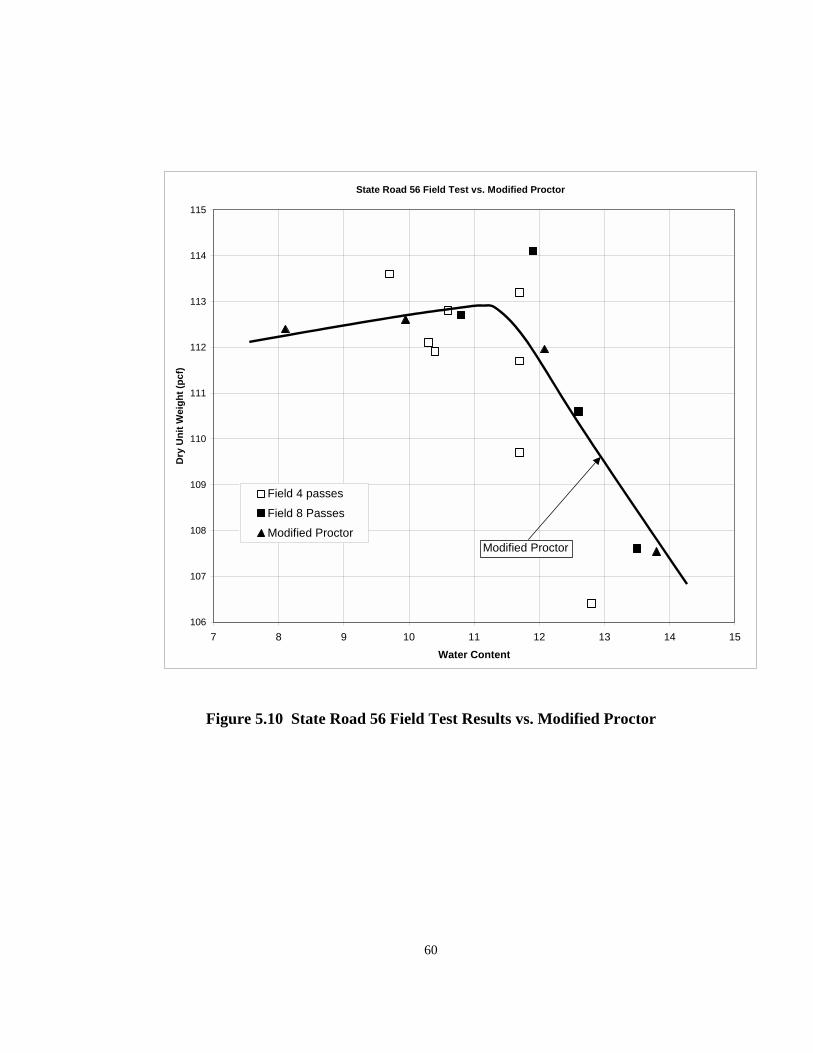
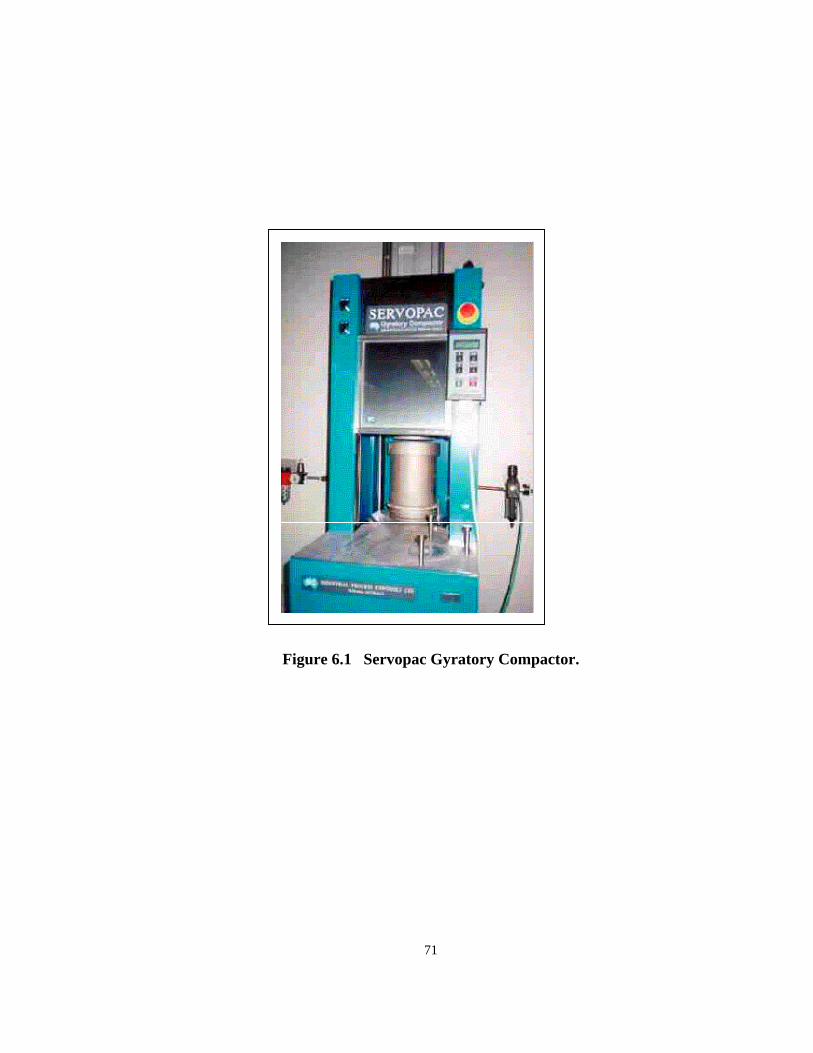
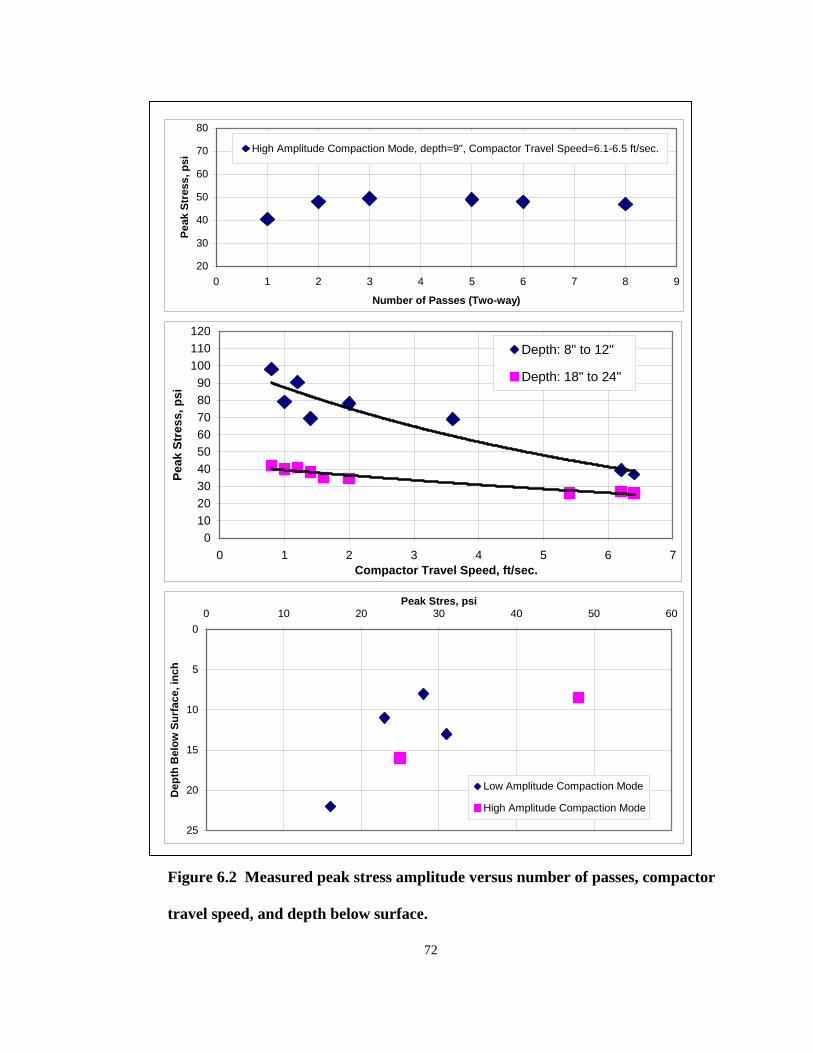
1.1 Effect of Compaction Effort on the Compaction Curve …………………. 5 4.1 Alford City A-2-4 Impact Compaction Results ………………………….. 31 4.2 Clay County A-2-6 Impact Compaction Results …………………………. 32 4.3 Lake City A-3 Impact Compaction Results ……………………………… 33 5.1 Thomasville Road A-3 Laboratory Impact Compaction …………………. 51 5.2 Thomasville Road Field Test Layout, Desity and Moisture Test ………... 52 5.3 Thomasville Road Field Compaction Results ……………………………. 53 5.4 Thomasville Road Field Test vs. Laboratory Impact Compaction ………. 54 5.5 Sun Coast Parkway Field Test Layout …………………………………… 55 5.6 Sun Coast Parkway Field Test Profile and Earth Pressure Cell …………. 56 5.7 Sun Coast Parkway Field Test Results …………………………………… 57 5.8 Sun Coast Parkway Field Test Results vs. Modified Proctor ……………. 58 5.9 State Road 56 Field Test Results …………………………………………. 59 5.10 State Road 56 Field Test Results vs. Modified Proctor ………………….. 60 6.1 Servopac Gyratory Compactor …………………………………….……... 71 6.2 Measured Peak Stress Amplitude versus Number of Passes, Compactor
Travel Speed and Depth Below Surface …………………………………. 72
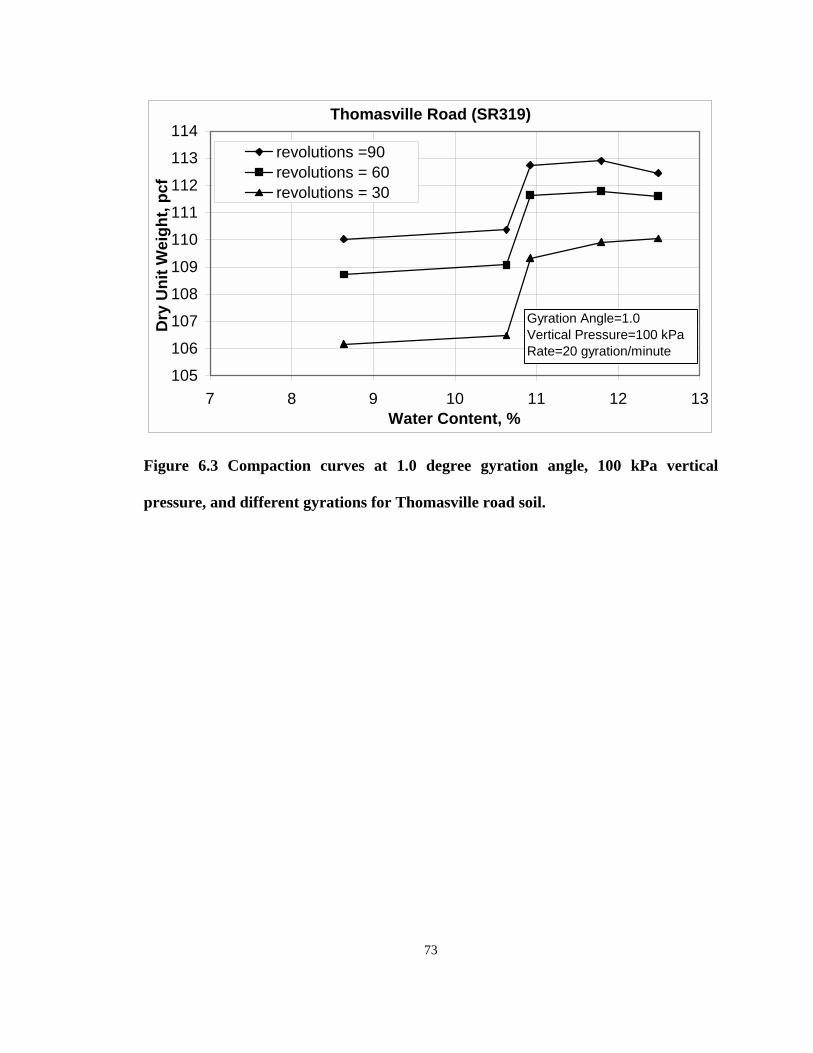
6.3 Compaction Curve at 1.0 degree Gyration Angle, 100 kPa Vertical Stress, and Different Gyrations for Thomasville Road Soil ……….……………..
73
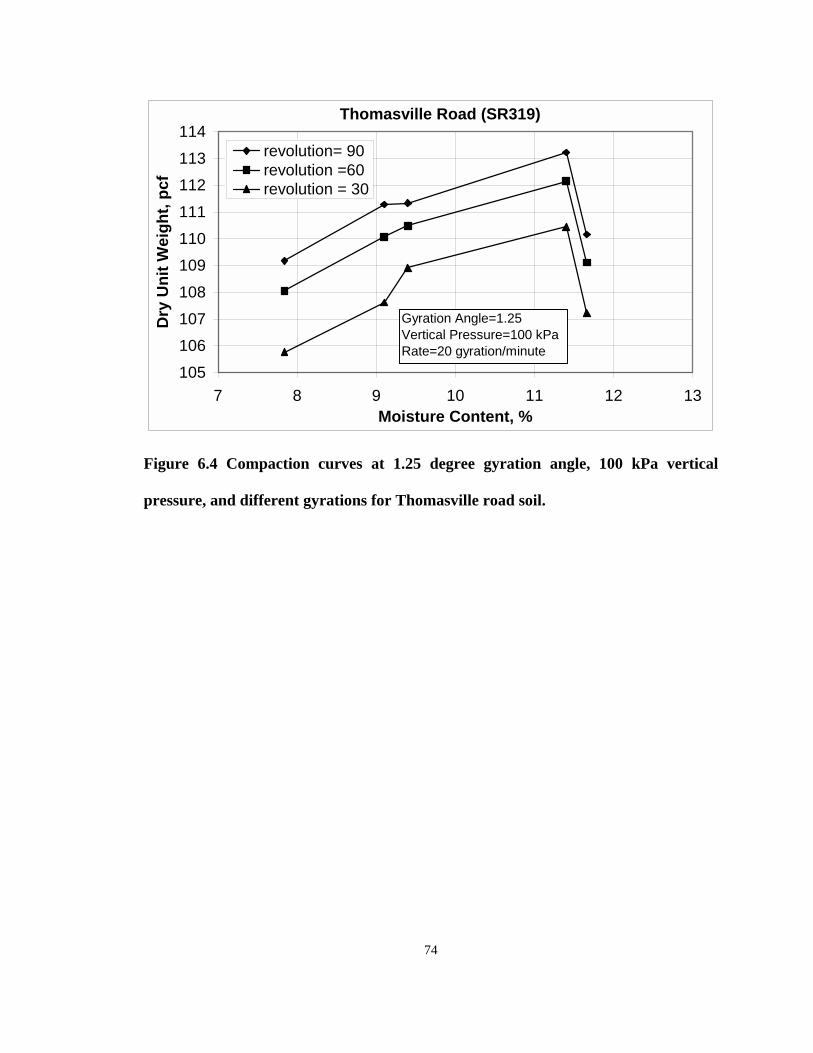
6.4 Compaction Curve at 1.25 degree Gyration Angle, 100 kPa Vertical Stress, and Different Gyrations for Thomasville Road Soil ……………..
74
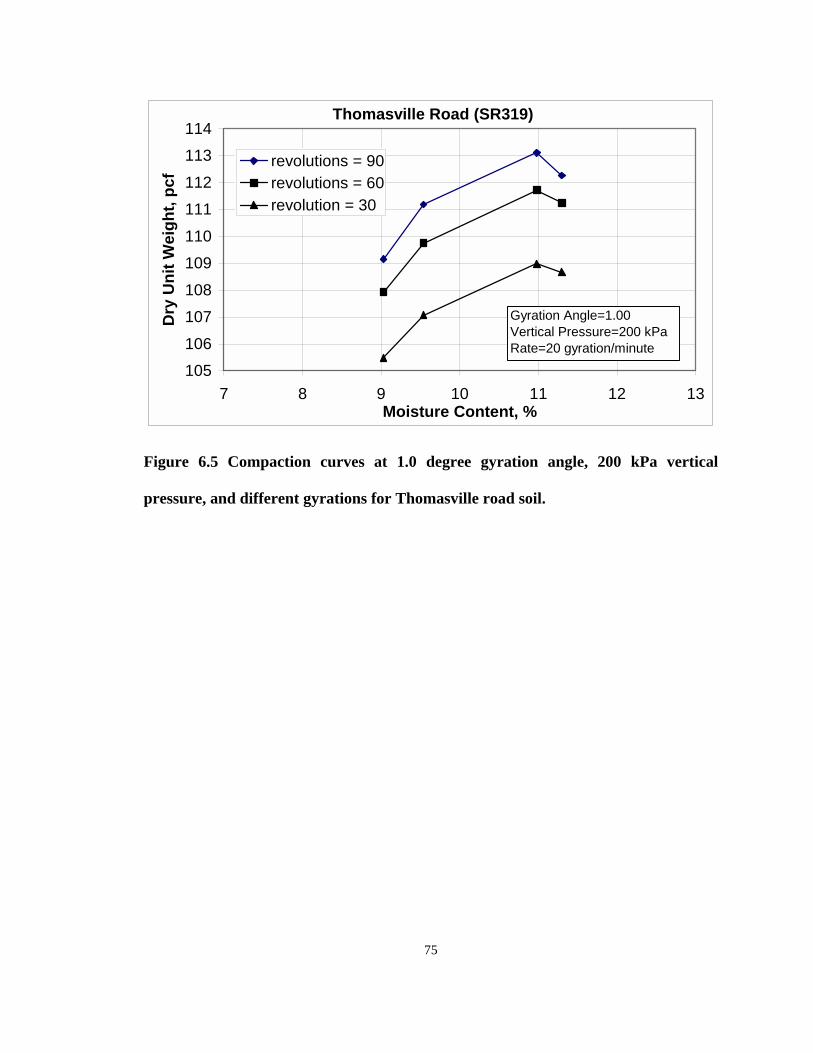
6.5 Compaction Curve at 1.0 degree Gyration Angle, 200 kPa Vertical Stress, and Different Gyrations for Thomasville Road Soil ……………………...
75
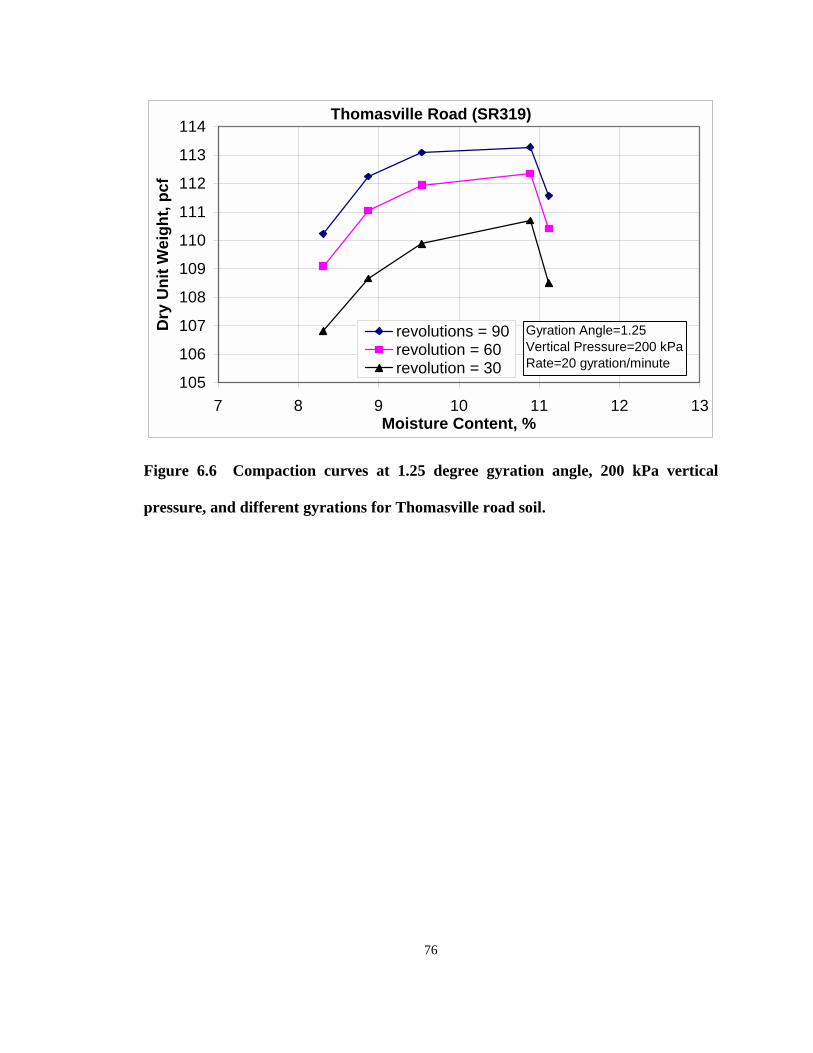
6.6 Compaction Curve at 1.25 degree Gyration Angle, 200 kPa Vertical Stress, and Different Gyrations for Thomasville Road Soil …………….
76
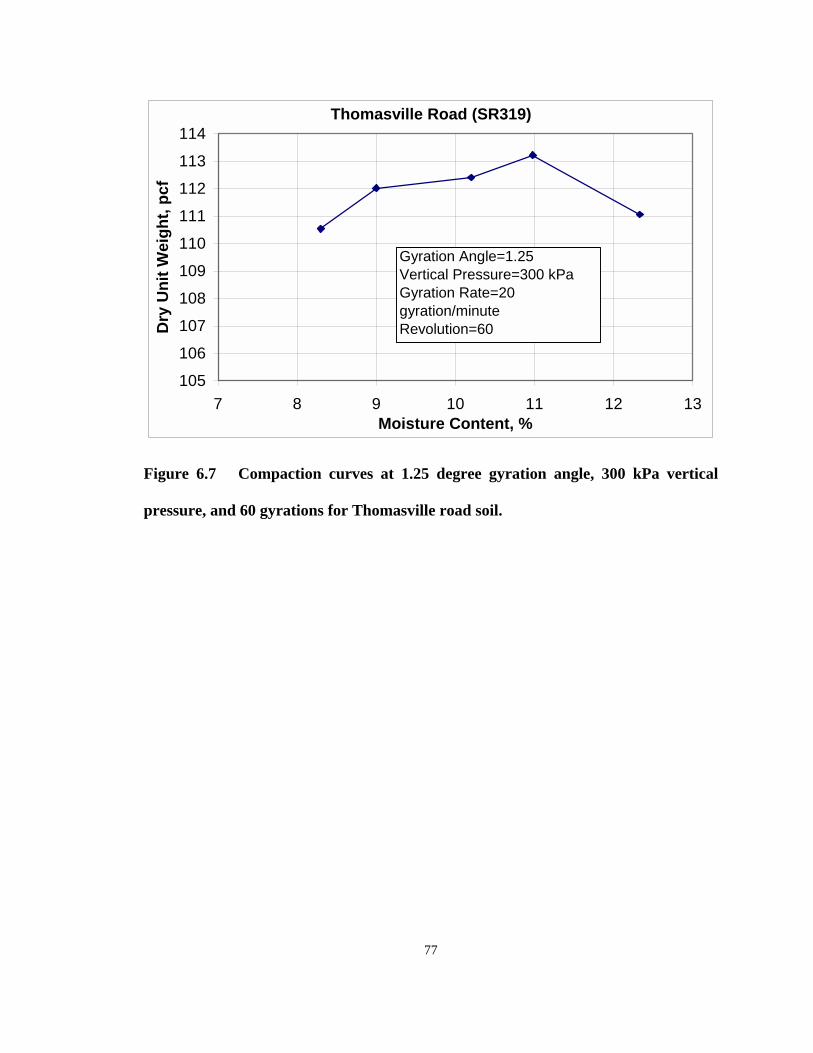
6.7 Compaction Curve at 1.25 degree Gyration Angle, 300 kPa Vertical Stress, and Different Gyrations for Thomasville Road Soil ……………...
77
6.8 Compaction Curve at 1.0 degree Gyration Angle, 100 kPa Vertical Stress, and Different Gyrations for Sun Coast Parkway Soil ………………...…..
78
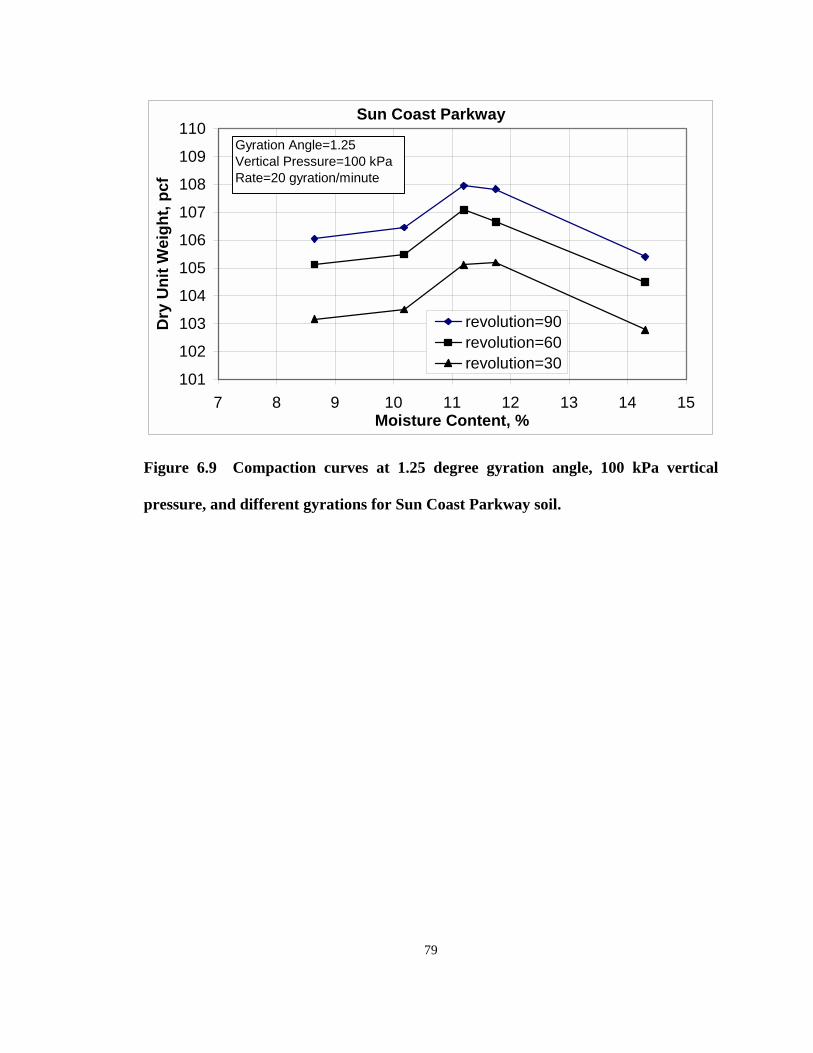
6.9 Compaction Curve at 1.25 degree Gyration Angle, 100 kPa Vertical Stress, and Different Gyrations for Sun Coast Parkway Soil …………...
79
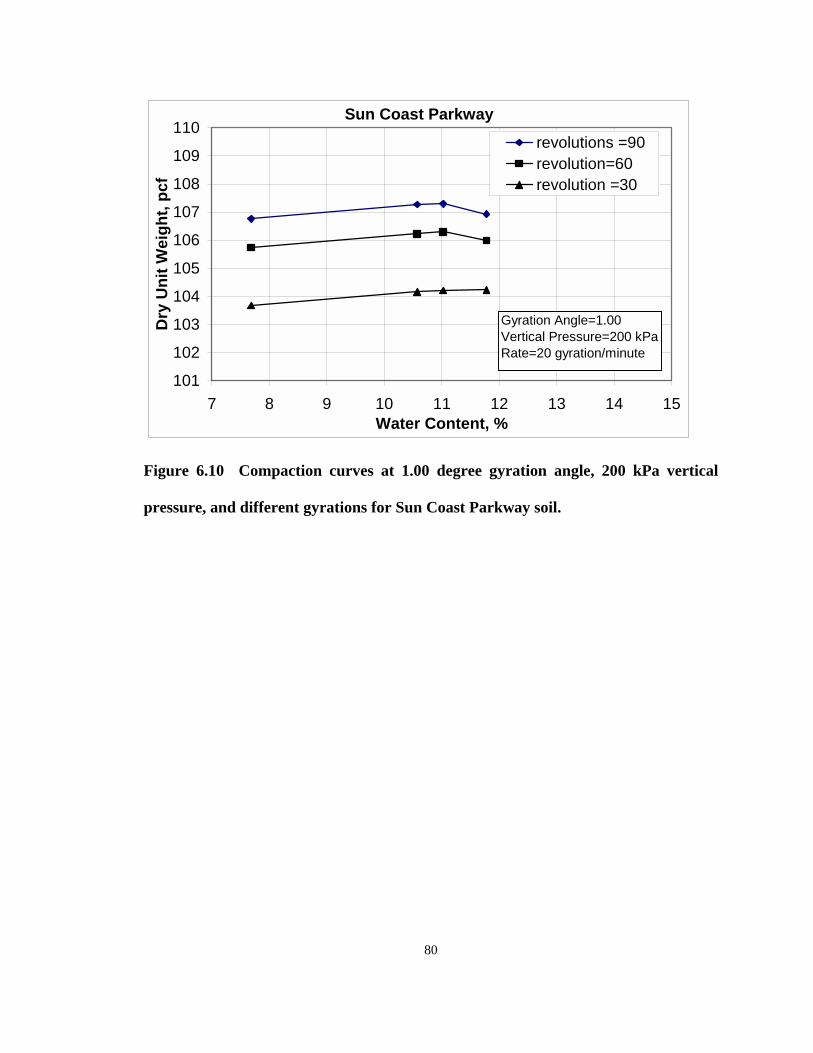
6.10 Compaction Curve at 1.0 degree Gyration Angle, 200 kPa Vertical Stress, and Different Gyrations for Sun Coast Parkway Soil …………………..
80
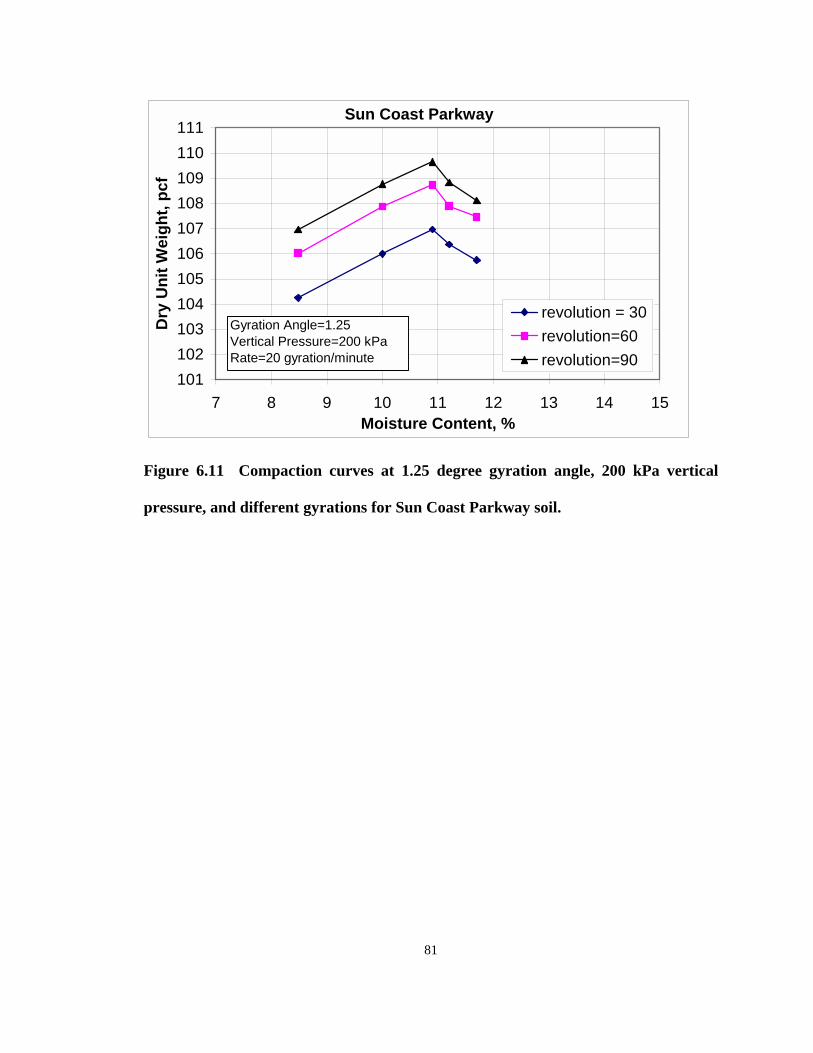
6.11 Compaction Curve at 1.25 degree Gyration Angle, 200 kPa Vertical Stress, and Different Gyrations for Sun Coast Parkway Soil …………….
81
x
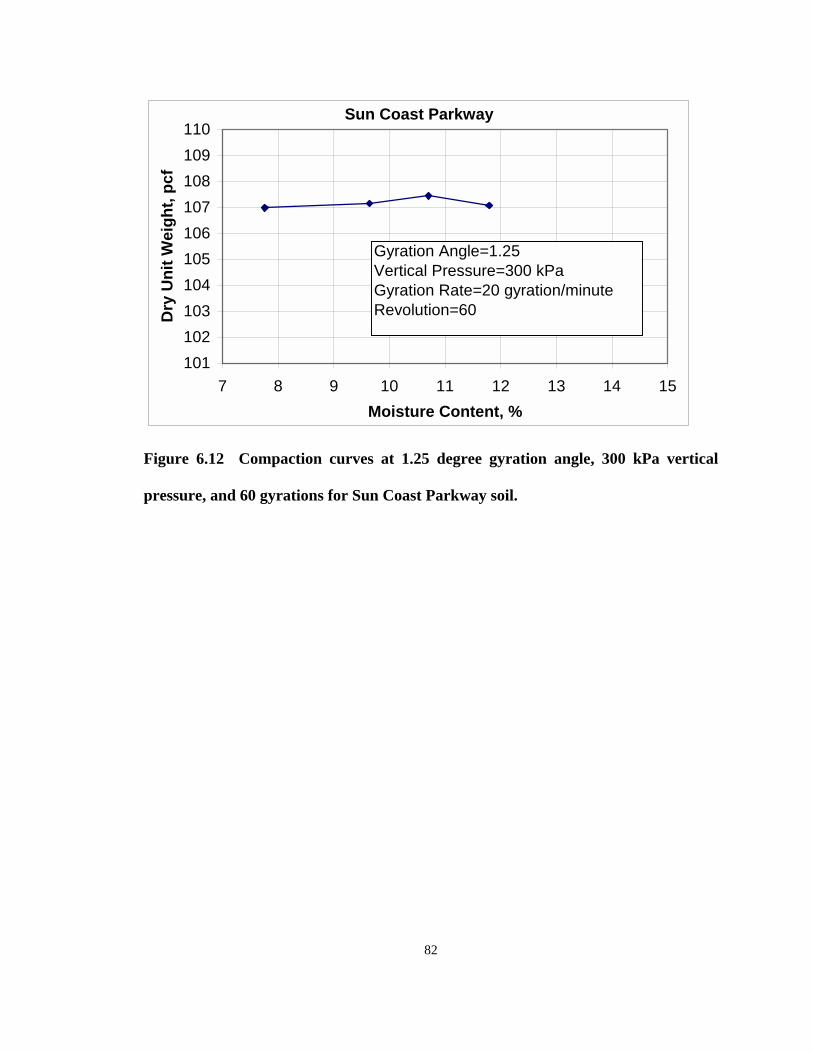
6.12 Compaction Curve at 1.25 degree Gyration Angle, 300 kPa Vertical Stress, and Different Gyrations for Sun Coast Parkway Soil …………...
82
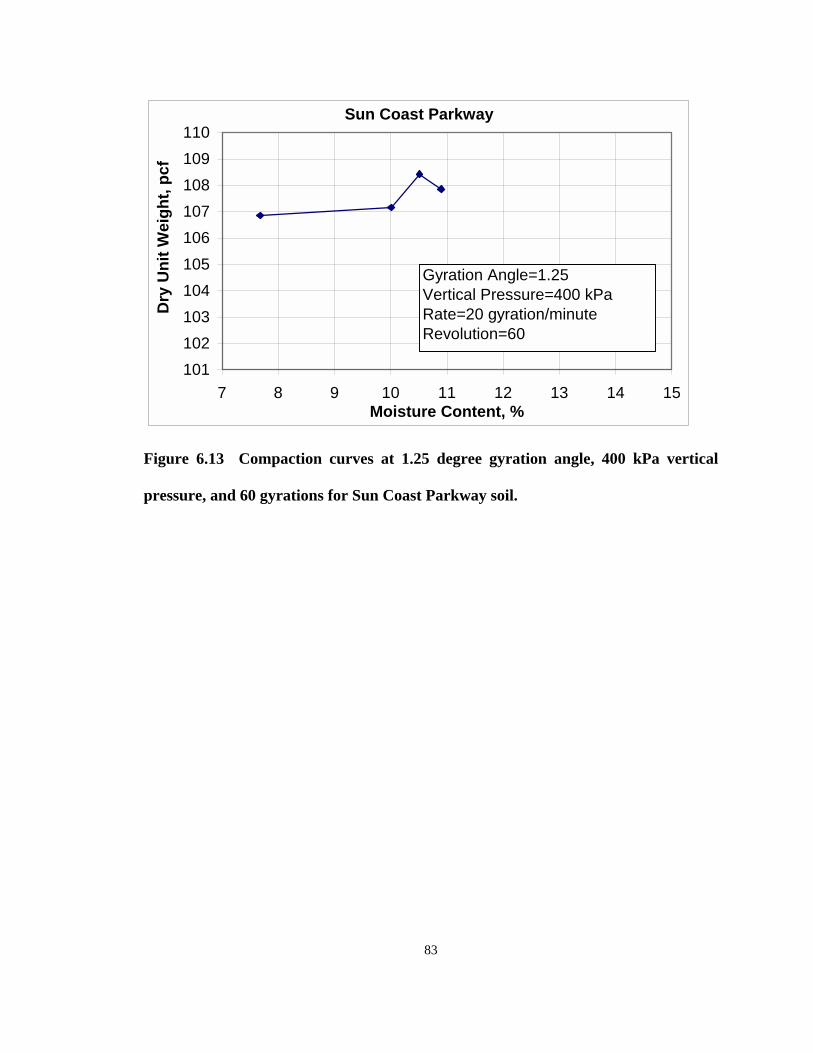
6.13 Compaction Curve at 1.25 degree Gyration Angle, 400 kPa Vertical Stress, and Different Gyrations for Sun Coast Parkway Soil …………….
83
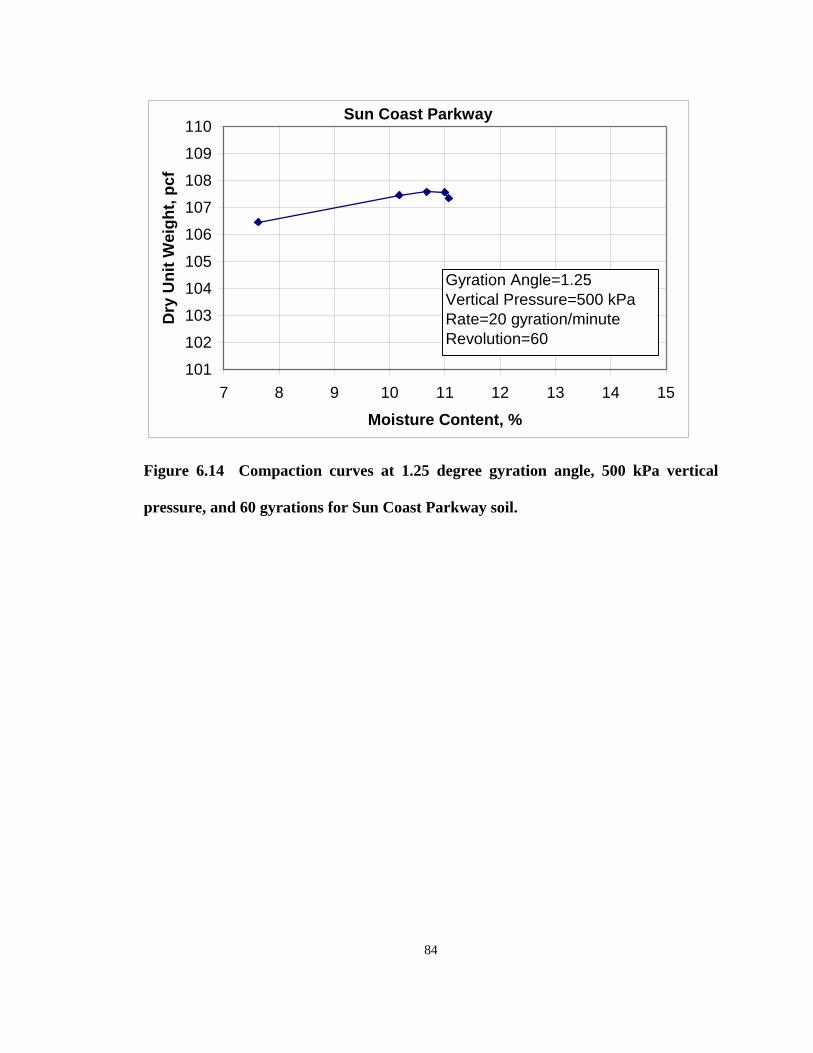
6.14 Compaction Curve at 1.25 degree Gyration Angle, 500 kPa Vertical Stress, and Different Gyrations for Sun Coast Parkway Soil ……………...
84
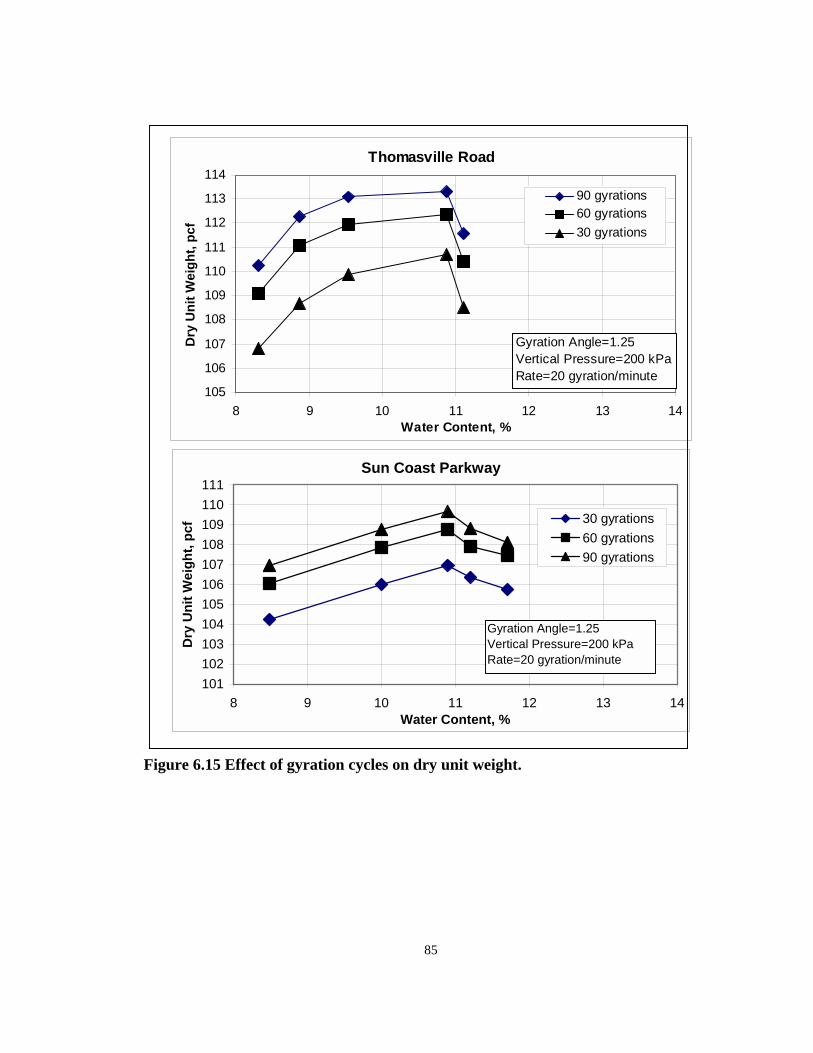
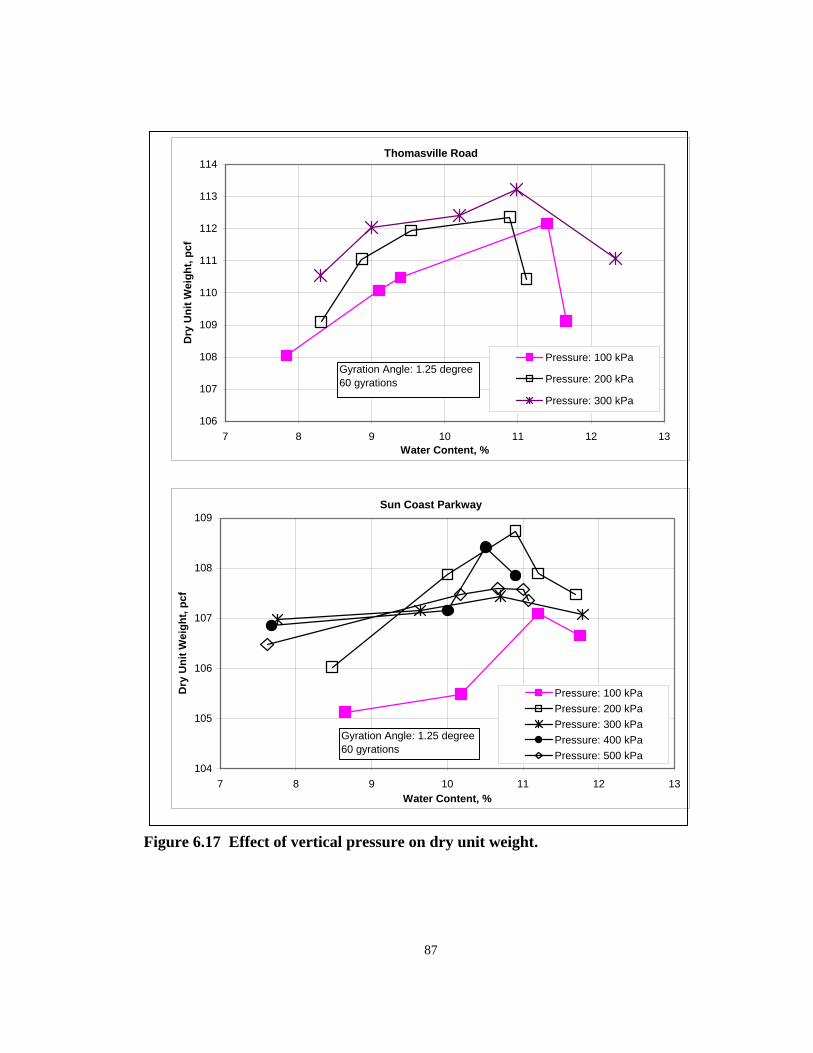
6.15 Effect of Gyration Cycles on Dry Unit Weight …………………………... 85 6.16 Effect of Gyration Angle on Dry Unit Weight ……………………….. 86 6.17 Effect of Vertical Stress on Dry Unit Weight ……………………….. 87 6.18 Dry Unit Weight versus Number of Passes at Sun Coast Parkway Field
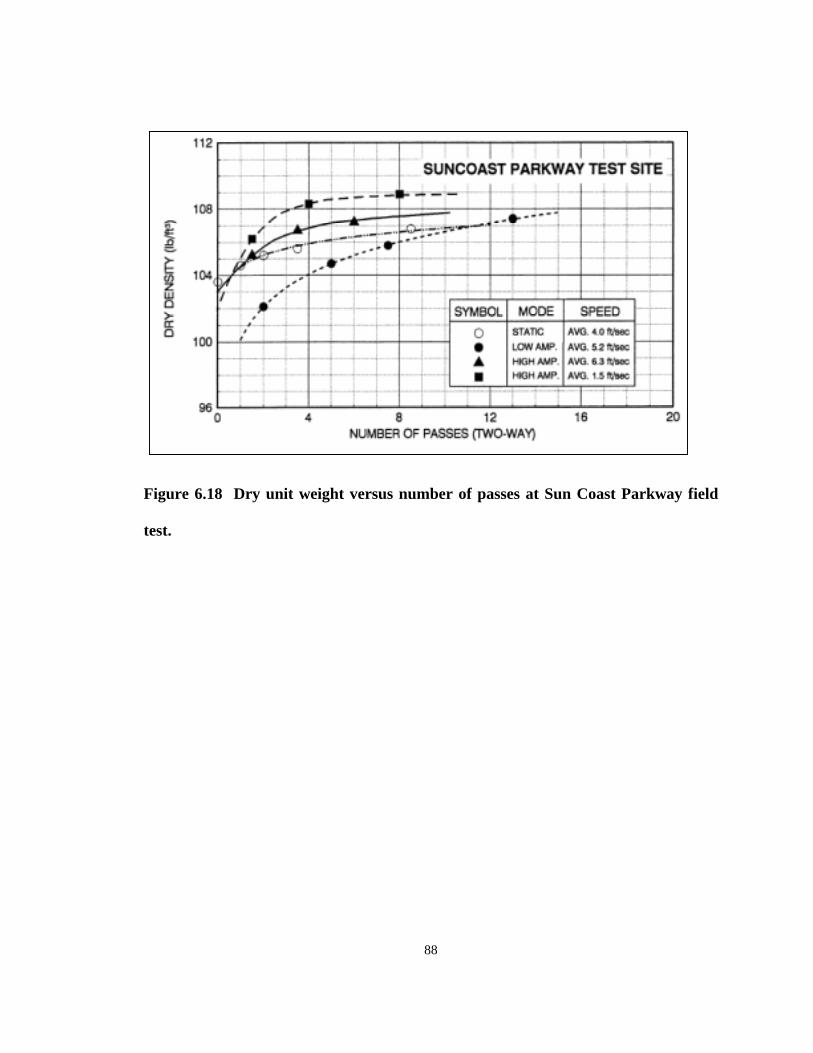
Test ……………………………………………………………………… 88
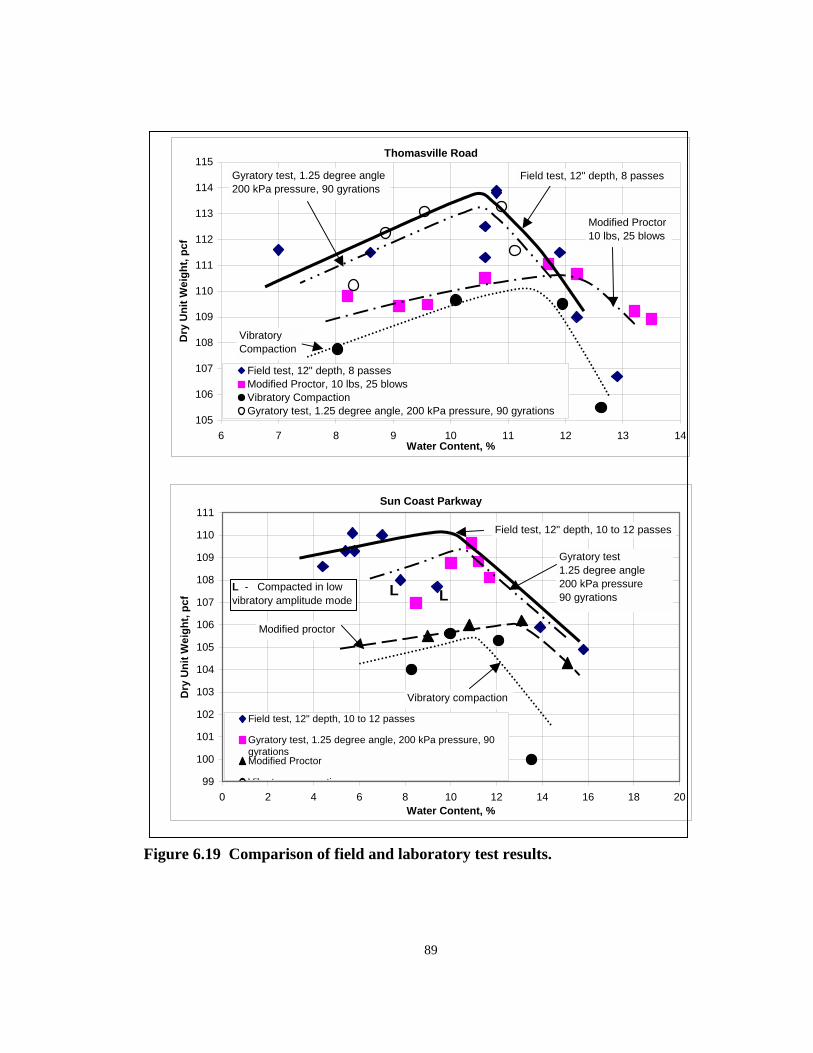
6.19 Comparison of Field and Laboratory Test Results ……………………….. 89
xi
Summary of Final Report
Laboratory Simulation of Field Compaction Characteristics
(Phase I)
PROBLEM STATEMENT Fill materials are used in almost all roadway construction projects. When fill materials are used, the engineering properties of the soil need to be improved by compacting it. The direct consequence of soil compaction is densification, which in turn results in higher strength, lower compressibility, and lower permeability. Most of construction specifications for fill materials are based on laboratory compaction tests. These laboratory compaction tests are designed to represent the highest degree of compaction that can reasonably be achieved in the field. The most common of these laboratory tests are the standard and modified Proctor tests. Both of these tests utilize impact compaction, although impact compaction shows no resemblance to any type of field compaction and is ineffective for granular soils. Since the development of the Proctor tests, there have been dramatic advances in field compaction equipment. Therefore, the Proctor tests no longer represent the maximum achievable field density.
OBJECTIVES The primary objectives of this project included a survey of current field compaction equipment, laboratory investigation of compaction characteristics, field study of compaction characteristics, and laboratory simulation of field compaction characteristics. The findings from the laboratory and compaction programs were used to establish preliminary guidelines for a suitable laboratory compaction procedure.
FINDINGS AND CONCLUSIONS The findings and conclusions based on the analysis of this experimental study are
summarized below. 1. Numerous tests have shown that impact compaction is not an adequate procedure
for compacting pure sands in the laboratory. The standard and modified Proctor test procedures, AASHTO T90 and T180, respectively, were not developed for use with cohesionless soils.
2. Three field tests had shown that with the advent of advanced earthmoving and compaction field equipment, the AASHTO T90 and T180 test procedures no longer represented the maximum achievable field dry unit weights for A-3 sands. Dry unit weights substantially greater than the modified AASHTO maximum dry
xii
density were achieved in the field with a reasonable number of passes when using conventional vibratory compaction equipment on sandy soils when the in-place moisture content was less than or equal to the optimum moisture content corresponding to the field compactive effort.
3. The optimum moisture content corresponding to the field compactive effort was likely less than the modified AASHTO optimum moisture content when sand fill was compacted by more than 3 passes of a conventional vibratory compactor.
4. In the field, compaction after 8 passes of conventional vibratory compaction equipment has little effect on the dry unit weight.
5. Gyratory compaction was more reliable than impact compaction when compacting pure sands in the laboratory.
1
CHAPTER 1
INTRODUCTION
1.1 Background
Fill materials are used in almost all roadway construction projects. When fill
materials are used, the engineering properties of the soil need to be improved by
compaction. The primary benefit of compacting a soil is to increase its strength. Several
types of machinery are used to compact soils in the field. These include sheepsfoot rollers
(also known as padfoot rollers), rubber tire rollers, steel wheeled rollers, and vibratory
rollers. Vibratory rollers are primarily used in the compaction of granular soils.
When fill soils are used, they need to be tested in the laboratory first, in order to
determine their maximum dry densities and optimum moisture contents (OMC). The
maximum dry density determined in the laboratory is often used to specify the required
density to which fill should be compacted in the field. Compacting fill at its optimum
moisture content is the most economical technique that a contractor can use to achieve
the required density of the material. Over the years, several techniques have been
developed to compact soils in the laboratory. These include impact, static, kneading, and
vibratory compaction. All of these methods are used to determine the density to which
soil can be compacted in the field.
Although it has no resemblance to any type of field compaction, impact compaction
is by far the most popular laboratory technique. This is largely due to the fact that impact
compaction was the first technique to be standardized. As a result, impact compaction
2
tests have been used for decades and a broad base of data exists for comparison. The tests
most commonly used in modern construction are the standard and modified Proctor tests.
The standard Proctor test was originally developed in the 1930s to represent the highest
degree of compaction achievable in the field at that time. The test was modified in the
1940s but has remained unchanged for decades.
1.2 Problem Statement
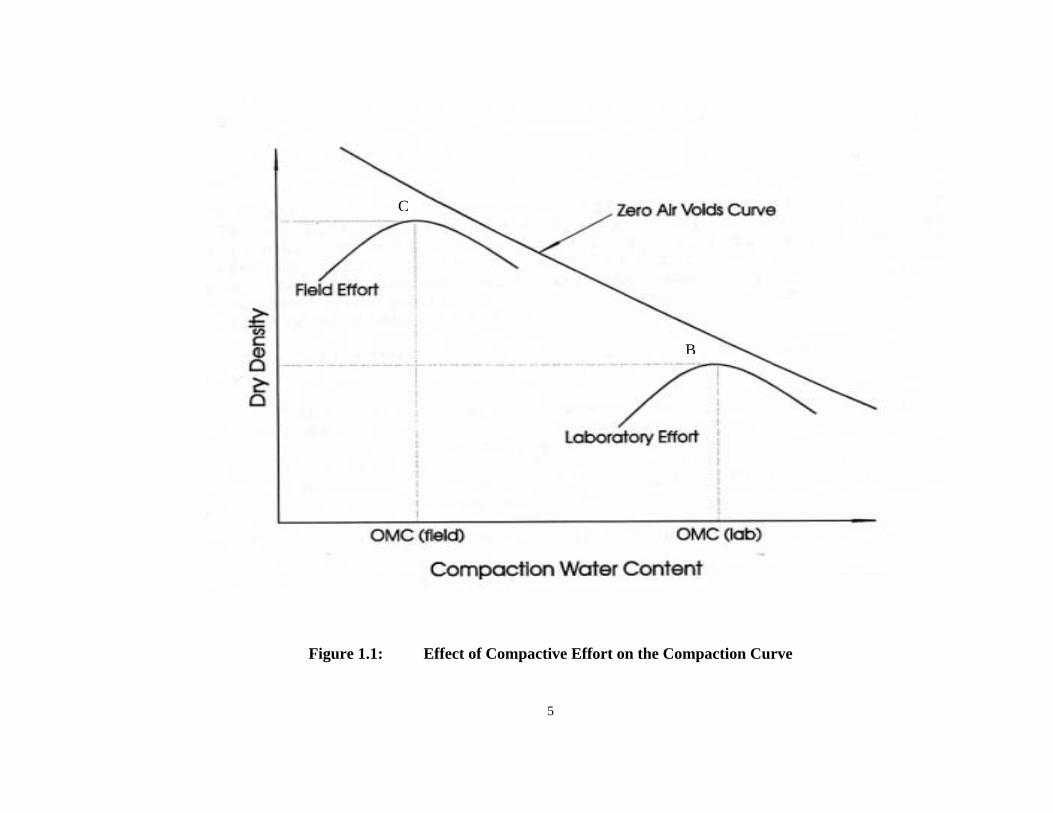
Previous studies have proved that as the compaction effort increases, the maximum
dry density of a soil increases and the optimum moisture content decreases (Selig, 1982).
Over the past few decades much heavier earth moving and field compaction equipment
has been developed. The fact that this modern compaction equipment produces a far
greater compaction effort than the field equipment available in the 1940s demonstrates
that the modified Proctor test no longer represents the maximum achievable field density
of a soil (point B vs. point C in Figure 1.1). Consequently, compacting fill materials at
the optimum moisture content determined using the modified Proctor laboratory test will
result in unit weights lower than the maximum achievable density. The inadequacies of
the modified Proctor test are compounded when cohesionless (granular) soils are used as
fill materials. It is widely known that impact compaction is ineffective on cohesionless
soils, yet the method is still widely used to specify the required field density for all types
of soils.
As a result of these phenomena , the Florida Department of Transportation (FDOT)
and other state transportation agencies have suffered from claims and supplemental
agreements to remedy the discrepancies between the laboratory and field compaction
3
results. In response to this trend, the FDOT has funded a research study on the laboratory
and field compaction characteristics of soils.
1.3 Scope of Study
The primary objectives of this project were to evaluate field and laboratory
compaction characteristics and to further study laboratory compaction techniques such as
kneading and/or gyratory compaction, in addition to impact and vibratory compaction,
for the laboratory simulation of field compaction. The first step in this process was to
evaluate the influence of water content and compactive effort on the compaction
characteristics of soils in the laboratory. Also different laboratory compaction techniques
were investigated to determine the best way to replicate field compaction. These other
techniques included using vibratory and gyratory compaction. While the initial phase of
this project investigated these compaction techniques on several subgrade soil types, the
bulk of the research concentrated on pure sands, classified A-3 in the AASHTO
classification system, due to the inadequacies of current laboratory compaction
procedures. After these techniques were investigated in the laboratory, the findings were
compared to results from full-scale field tests. Field test sections were constructed using
advanced field compaction techniques in order to evaluate the most influential factors for
achieving compaction in the field. The field and laboratory results were then analyzed to
determine the appropriate procedure to simulate the field compaction effort in the
laboratory.
4
1.4 Report Organization
This report summarizes the results of the study on laboratory and field compaction
characteristics. The research presented here is a preliminary investigation that will
ultimately be used to develop comprehensive laboratory procedures for compacting soils.
Chapter 1 presents the background, problem statement and objectives of the field
and laboratory programs. A brief literature review of previous research in soil
compaction is presented in Chapter 2. A discussion on the current state of practice of
field compaction as well as a survey of current field compaction equipment are
summarized in Chapter 3. A thorough summary of the laboratory study and a presentation
of the results are presented in Chapter 4. Chapter 5 is composed of a summary of the field
compaction study and the data that resulted from the field tests. Chapter 6 presents the
laboratory research that was conducted to simulate the field test results. Finally,
conclusions and recommendations of this research study are summarized in Chapter 7.
5
Figure 1.1: Effect of Compactive Effort on the Compaction Curve
C
B
6
CHAPTER 2
LITERATURE REVIEW
2.1 Background
Soil compaction is performed to impart the desired engineering properties to a
compacted mass. It is not, in general, practical during the construction of compacted soils
to directly specify these desired properties. Rather, the engineer must first specify
descriptors of the compacted product, the compactive process, or both that are easy to
measure and then the engineer must be able to relate these specifications to the desired
properties. The requisite correlations are not simple and continue to challenge engineers
seeking the best design.
Although the relationships among compacted properties and the variables of the
compaction process are mostly studied directly in the field, this is expensive and time
consuming. Accordingly, in the present state of the art, the above relationships are
established in the laboratory. But this approach has serious intrinsic limitations, because
field compaction is achieved by different modes and at different energy levels than in the
laboratory and more variability exists in the field (Essigmann, 1978).
The consequences of bringing a soil to the same compacted density and moisture
by different methods of compaction are not clear. Some believe that the soil fabric is
strongly influenced by the compaction type and that properties, such as strength, will be
peculiar to the method of achieving a given moisture and density, others disagree.
7
Previous studies have shown that at common moisture-density values, impact and
kneading-compacted samples had about the same strength (Essigmann, 1978).
The quality of compacted material is generally specified in terms of dry unit
weight, which is usually expressed as a percentage of the maximum dry density achieved
in a specific laboratory compaction test. Construction specifications based on this
principle are known as “end-result” specifications (Wahls, 1967). There are many
laboratory soil compaction procedures. These include the tests based on the Proctor
hammer (AASHTO T99 and T180), those using vibratory compaction (ASTM D4253),
and procedures based on the Texas State Highway Department gyratory soils press.
Details of these test procedures as well as their applications are presented in the following
sections. Also, several concerns about construction specifications have emerged as the
result of previous field test research. The causes for these concerns are also discussed in
this chapter.
2.2 Current Test Procedures
Currently, many published procedures for compacting soils are available. Most of
these procedures utilize either impact compaction or vibratory compaction. The most
popular test procedures and their uses are discussed in this section.
8
2.2.1 Impact Compaction
The most common impact compactions tests are the standard and modified Proctor
tests, AASHTO T99 and T180, respectively. Developed in the 1930s and 1940s, these
tests were the first to be standardized and, as a result, a broad base of data exists for
comparison. One downfall of the Proctor tests is that impact compaction has proved to be
relatively ineffective for the compaction of noncohesive soils because the material is
displaced under the hammer, and consequently low-density values are obtained
(Forssblad, 1967). Despite this fact, the majority of states use these test procedures in
their construction specifications.
Standard Proctor Compaction Procedure
This test procedure covers laboratory compaction procedures used to determine
the relationship between water content and dry unit weight of soils compacted in a 4 or 6
in. diameter mold with a 5.5 lb. hammer dropped from a height of 12 in. producing a
compactive effort of 12,400 ft-lb/ft3. A soil at a selected water content is placed in three
layers into a mold of the given dimensions, with each layer compacted by 25 blows of the
hammer. The resulting dry unit weight is then determined. This procedure is repeated for
a sufficient number of water contents to establish a relationship between the dry unit
weight and the water content of the soil. This test procedure applies only to soils that
have 30% or less by weight of particles retained on the 3/4 in. sieve. Generally a well-
defined maximum dry unit weight will be produced for non-free draining soils. If this test
method is used on free draining soils, the maximum unit weight may not be well defined
9
and can be less than that obtained using the ASTM test procedure D 4253 (Maximum
Index Density and Unit Weight of Soils Using a Vibratory Table, see section 2.2.2).
Modified Proctor Compaction Procedure
This test method covers laboratory compaction procedures used to determine the
relationship between water content and dry unit weight of soils compacted in a 4 or 6 in.
diameter mold with a 10 lb. hammer dropped from a height of 18 in. producing a
compactive effort of 56,000 ft-lb/ft3. Five layers of soil at a selected water content are
placed into a mold of the given dimensions, with each layer compacted by 25 blows of
the hammer. The resulting dry unit weight is then determined. This procedure is repeated
for a sufficient number of water contents to establish a relationship between the dry unit
weight and the water content of the soil. This test procedure applies only to soils that
have 30% or less by weight of particles retained on the 3/4 in. sieve. Generally a well-
defined maximum dry unit weight will be produced for non-free draining soils. As with
the standard Proctor test procedure, if this test method is used on free draining soils the
maximum unit weight may not be well defined, and can be less than that obtained using
the ASTM test procedure D 4253.
2.2.2 Vibratory Compaction
For many cohesionless free draining soils, impact compaction does not yield
consistent results. As a result, several test procedures have been developed using
vibratory compaction. These test procedures produce more consistent results than impact
compaction, for the compaction of granular soils. Vibratory compaction also provides a
10
better correlation between the field and the laboratory, since most field compaction is
performed with vibratory compaction equipment. The most common laboratory test that
utilizes vibratory compaction is the ASTM D 4253, Maximum Index Density and Unit
Weight of Soils Using a Vibratory Table, test procedure. Since the development of the
ASTM test, several alternative methods have been developed, but none have received
wide spread acceptance. One of these alternatives was a vibratory compaction procedure
developed by the Concrete and Soil Laboratory of AB Vibro-Verken, Solna, Sweden in
the 1960s. This compaction method utilized a vibrating tamper to compact soils. The
developers of this procedure claimed that the results obtained during the compaction of
cohesionless soils were similar to those obtained by the modified Proctor impact
compaction test. This claim detracted from the validity of this procedure because the
modified Proctor test is not suitable for round noncohesive soils due to material that is
displaced under the compaction hammer. No other proposed method of vibratory
compaction has proved to be as suitable as the ASTM D 4253 test procedure.
Maximum Index Density and Unit Weight of Soils Using a Vibratory Table
The ASTM D 4253 test method covers the determination of the maximum index
density/unit-weight of cohesionless, free-draining soils using a vertically vibrating table.
This test method is applicable to soils that may contain up to 15%, by dry mass, of soil
particles passing a No. 200 sieve, provided they still have cohesionless free-draining
characteristics. Further, this test method is applicable to soils in which 100%, by dry
mass, of soil particles pass a 3 in. sieve. The maximum index density/unit weight of a
given free draining soil is determined by placing either oven-dried or wet soil in a mold,
11
applying a 2 lb/in2 surcharge to the surface of the soil, and then vertically vibrating the
mold, soil, and surcharge. The assembly is vibrated using either an electromagnetic,
eccentric, or cam-driven vibrating table having a sinusoid-like time-vertical displacement
relationship at a double amplitude of vertical vibration of about 0.013 in. for eight
minutes at 60 Hz or about 0.019 in. for 10 minutes at 50 Hz. The maximum index
density/unit weight is calculated by dividing the oven-dried mass/weight of the densified
soil by its volume.
2.2.3 Gyratory Compaction
In recent years, the use of gyratory compactors in the asphalt paving industry has
become very common, primarily due to the advent of the SUPERPAVE asphalt design
method. Most of the SUPERPAVE gyratory compactors were developed from a
manually operated device that was used for many years by the Texas State Highway
Department. The Texas Highway Department referred to this device as a gyratory soil
press. The soil press was used on both soil and blackbase (asphalt stabilized and emulsion
base) materials. This soil press led to the development of the U.S. Army Corps of
Engineers Gyratory Testing Machine (GTM) and the GTM in turn led to the development
of the current gyratory compactors. During this investigation results show that the new
Superpave gyratory compactors can also be used to compact soils in the laboratory.
Several reasons can be given for the beneficial use of gyratory compactors. One reason is
that gyratory compaction has a stronger resemblance to field compaction than impact
compaction does. This means that the internal structure of specimens compacted with a
gyratory compactor will show a closer resemblance to that resulting from actual after-
12
construction roadway traffic. A gyratory compactor has the ability to simultaneously
apply a vertical load in addition to a self adjusting kneading action which simulates the
moving traffic load experienced by a flexible pavement system. In addition to the
physical similarities to field compaction, gyratory compactors are generally more precise,
effective, and repeatable than impact hammers. Currently there are no standard test
procedures for compacting soil with a Superpave gyratory compactor. The only previous
research available was conducted using the Texas gyratory soils press or the Army Corps
of Engineers GTM.
U.S. Army Corps of Engineers Gyratory Testing Machine
In 1962, the U.S. Army Corps of Engineers (USACE) conducted an investigation
into the use of gyratory compaction for determining density requirements for subgrade
and base materials. This research took place at the U.S. Army Engineer Waterways
Experiment Station in Vicksburg, Mississippi, as part of an overall investigation of
flexible pavements and soil compaction. The Corps of Engineers found that the
AASHTO impact compaction tests proved inadequate in some instances, particularly
with cohesionless soils (U.S.A.C.E., 1962). As a result of these inadequacies, excessive
settlement was being experienced in the subgrade and/or bases of some flexible
pavements. The settlement was due to densification caused by traffic after construction.
This indicated that traffic had a greater compacting effect than the compaction achieved
during construction. The USACE felt a need for an improved compaction procedure to
eliminate these settlement problems.
13
As stated earlier, the Corps of Engineers had developed their Gyratory Testing
Machine (GTM) from a device used by the Texas Department of Transportation. During
the initial development of the GTM, the Corps of Engineers undertook a study of the
major test variables. During this study, the Corps made several observations. First, the
rate of kneading had little or no effect on densification. Additional findings were that
increased vertical pressure resulted in a consistent increase in unit weight, that an
increased number of revolutions resulted in a consistent increase in unit weight, and that
the optimal gyration angle should be between one and two degrees. Information form this
early study was used to develop test procedures for both bituminous paving mixtures and
soils. Most relevant to this report is the proposed Corps of Engineers test procedure for
compacting soils with the GTM. This test procedure was proposed as an alternative to the
AASHTO impact compaction tests. The procedure suggested the use of compaction
pressures based on the theoretical vertical stresses produced at various depths by the
anticipated wheel load. The proposed test procedure is listed below.
A. Obtain a representative sample of the soil or base course material for the proposed pavement system.
B. Select a water content for the test specimen that will be representative of the
anticipated water content of the material in the field immediately after construction.
C. Assuming equivalent circular loading for each tire contact area, calculate the
theoretical vertical pressure versus depth for the anticipated wheel loading. D. Thoroughly mix the sample of soil or base material at the selected water
content and then compact it in the gyratory compactor for 500 revolutions at a one-degree gyration angle using the vertical pressures corresponding to those computed for several depths beneath the wheel load. Calculate the dry density of the soil or base material on the basis of vertical movement of the compression ram of the gyratory compactor. To calculate the density, it is necessary to know only the weight of the material and the volume of the test mold are needed for various readings of the ram travel. Then prepare a plot of
14
density versus the number of revolutions for each selected depth. On these density versus revolutions curves, mark the point where the next 100 revolutions caused an increase in dry density of only one lb/ft3. The density at this point will be considered the required construction density for the proposed material at the selected depth.
The Corps of Engineers used this procedure to compare field results with those
obtained in the laboratory. They used construction and after-traffic density data that was
available from two field test sections. The materials used at the test sections included a
limestone aggregate base course and a sand-gravel subbase from Columbus Air Force
Base, Columbus, Miss., and a sand-gravel subbase, and a sand subgrade from the
channelized traffic test section No. 2 at the Waterways Experiment Station. The USACE
used this data to compare the after-traffic densities from the field sections to those
densities determined using the gyratory compactor. The after-traffic and gyratory
densities were also compared to the modified AASHTO compaction test results as well as
the construction densities. The conclusions the Corps of Engineers showed a good
correlation between the gyratory computed construction density and the post-construction
field density for the four cohesionless subgrade and base materials tested. In addition,
they found that the densities obtained using the proposed gyratory test procedure showed
a better correlation with the after-traffic densities than those results obtained with the
AASHTO compaction test.
2.3 Field Compaction
Several factors need to be considered whenever field operations are conducted.
These factors include equipment selection, moisture control, applied compaction
15
energies, and quality control. Further discussion of these factors and their effects on field
compaction are provided in this chapter.
2.3.1 Moisture Control
Moisture requirements are often included in construction specifications for
embankment and subgrade soils. However most of these requirements are specified in a
qualitative manner, leaving the interpretation to the judgement of the inspector.
Qualitative statements commonly included in construction specifications are “to the
satisfaction of the engineer”, “as required by the engineer”, or “as required for
compaction”. These types of specifications give the impression that moisture control is of
little concern in the field. This is especially the case for granular materials. These
materials may be compacted successfully at a relatively large range of moisture contents,
although the materials may experience bulking problems at excessively high water
contents (Transportation Research Board, 1990). This reason alone suggests that the
modified Proctor laboratory compaction test has little in common with field compaction
of granular soils and that the density data obtained from the test does not represent the
maximum achievable field compaction.
2.3.2 Field Tests
The undertaking of a comprehensive compaction field test requires a great deal of
coordination as well as financial backing. For these reasons there have been very few
tests conducted over the years. The U.S. Bureau of Public Roads sponsored one such test,
in 1964. The three part study included an evaluation of the state of the art compaction of
16
soil and rock for highway purposes, a fundamental study of properties of soils in the
laboratory, and a full scale field test dealing with soil compaction for highway purposes.
The field test was conducted by the Illinois Institute of Technology (IIT) Research
Institute, from June through October 1965, at Hazelcrest, Illinois (Hampton, 1967).
The objectives of the field test were to determine (1) the desired characteristics of
compacted soil, (2) how best to measure and specify the proper compaction, and (3) the
effectiveness of various methods of achieving compaction. For the purpose of this report
the researchers are most interested in the proper method of specifying compaction.
During the field test, several different field compactors were evaluated for several types
of soils. During the field test, four different soil types were compacted using four
different compactor types (vibratory, pneumatic, sheepsfoot, and segmented pad). Each
of the test lifts was compacted with 16 passes of the respective compactor. Density
measurements were taken after 2, 4, 8, and 16 passes. The vibratory roller, which is of the
greatest relevance to this report, was found to be the most effective for compacting silty
sand, subgrade soils. This finding coincides with the fact that a common practice today is
to use vibratory rollers on sandy soils.
Another interesting finding was that the maximum density measurements for each
compactor type ranged from 89 to 102 percent of the modified Proctor maximum density
for each soil. This indicates that the compaction equipment available in 1964 could not
achieve densities much higher than the modified Proctor density. This means that in 1964
the modified Proctor compaction test was a reliable method of calculating the maximum
17
achievable field density. The compaction equipment available today has far greater
capabilities than the equipment available in 1964. This would indicate that compaction
equipment today is capable of reaching densities higher than the modified Proctor
densities, and that changes are needed in the construction specifications to coincide with
the technological advances of the industry. Also, the majority of the field test strips were
compacted dry of optimum, which suggests a difficulty in sustaining the high water
contents that are specified by the modified Proctor test.
18
CHAPTER 3
SURVEY OF CURRENT FIELD OPERATIONS
3.1 Introduction
A survey of the state of practice in field compaction needed to be completed before
the field tests could be conducted. Included in the survey reported here was a study of
current on-going field compaction techniques for roadway construction as well as an
investigation into the field compaction equipment that is most commonly used.
Discussions with construction contractors as well as specifications provided by
equipment manufacturers were used to determine the appropriate techniques that were to
be used during the field tests.
3.2 State of Practice
In order for the field test to yield useful results, the field tests needed to be
conducted using practices commonly implemented by contractors. Several factors
affecting compaction had to be investigated before the field test could take place. These
factors included the type of field compaction equipment used and the layout of the field
compaction lifts. Several types of compaction equipment are commonly used for roadway
construction. These types include sheepsfoot rollers (also known as padfoot rollers),
rubber tire rollers, steel-wheeled rollers, and vibratory rollers. The type of equipment that
a contractor selects should be determined by the type of soils encountered. Certain types
of compactors work better with some types of soils than with others. In many cases,
however, the contractor will use whatever equipment he already owns or has leased.
19
Whatever equipment the contractor uses must comply with the specification requirements
and must be approved by the engineer. Minimum wheel loads and tire pressures for
pneumatic rollers and minimum weight for steel wheel rollers are specified, whereas for
vibratory drum compactors, a specific frequency range and a minimum dynamic force are
usually specified. Length of feet, minimum weight per square inch of cross-sectional area
of the tamping feet, and operating speed are specified for sheepsfoot rollers.
Maximum lift thickness should be specified depending on the equipment being
used or the project soils, or both. This way, the inspector will know in advance the
maximum thickness that the contractor will be allowed to place and compact. The
contractor can place thinner lifts if he chooses.
Pneumatic-tire compactors achieve compaction by the interaction of (a) wheel load,
(b) tire size, (c) tire ply, (d) inflation pressure, and (e) the kneading action of the rubber
tires as they pass over the lift. Pneumatic-tire rollers should be ballasted to meet at least
the minimum wheel load.
Vibratory drum compactors develop their compactive effort by vibrations. Four
machine features must be known in order to rate vibratory rollers: (a) unsprung drum
weight, (b) rated dynamic force, (c) frequency at which the rated dynamic force is
developed, and (d) drum width. The contractor or equipment supplier should have these
data. Vibratory rollers should operate between 1,100 and 1,500 vpm, and the dynamic
force at the operating frequency should be at least 2.5 times the unsprung drum weight
20
(see the manufacturer’s literature for the roller). Therefore, by using the machine data and
the specification requirements, a range of acceptable frequencies can be determined.
Compaction of granular soils is mostly due to the dynamic force created by a
rotating eccentric weight. Vibratory compactors dramatically lose their effectiveness
when the vibration is shut off because the compaction is due solely to the static weight of
the machine. Satisfactory compaction of thick lifts cannot be accomplished in this case.
When sheepsfoot rollers are used, the criteria for job control can be determined by
a test in the field. The feet must penetrate into the loose lift. If they ride on top, the
machine is too light and the ballast must be increased. With succeeding passes, the feet
should “walk out” of the layer. The number of passes required for the feet to walk out of
the layer will then be used to control subsequent layers. If the feet do not walk out, the
machine is too heavy and is shearing the soil, or the soil is too wet. The roller should be
lightened and a new test should be performed for job control or the soil should be dried.
To be effective, smooth steel wheel rollers should weigh at least 10 tons and exert a
minimum force of 300 lb per linear inch of width on the compression faces. These data
can usually be obtained by referring to the manufacturer’s specifications on the roller. At
least eight passes over the lift at a maximum speed of six ft/sec are usually adequate.
These rollers may be used on lifts of eight inches or less of compacted thickness
(Transportation Research Board, 1990).
21
Prior to each field test, meetings were conducted with the contractors involved.
Through these discussions, contractors concluded that the most common field practice for
compacting granular soil was to use a smooth-drum vibratory compactor. This type of
compactor is commonly operated at the maximum speed and vibrating frequency. In one
case the smooth-drum roller was run in combination with a pad-foot roller (both
vibratory). When using this technique, the pad-foot roller would make several passes over
the soil and then would be followed by several passes with the smooth-drum roller. The
manufacture’s specifications for the compactors used during the field tests are listed in
section 3.3. Results also show that the most common lift thickness used during
compaction of stabilized subgrade or embankment soils was 12 to 18 inches of loose soil
(before compaction). The information acquired during these contractor discussions was
implemented during the field tests, ensuring that the results would represent typical
roadway construction.
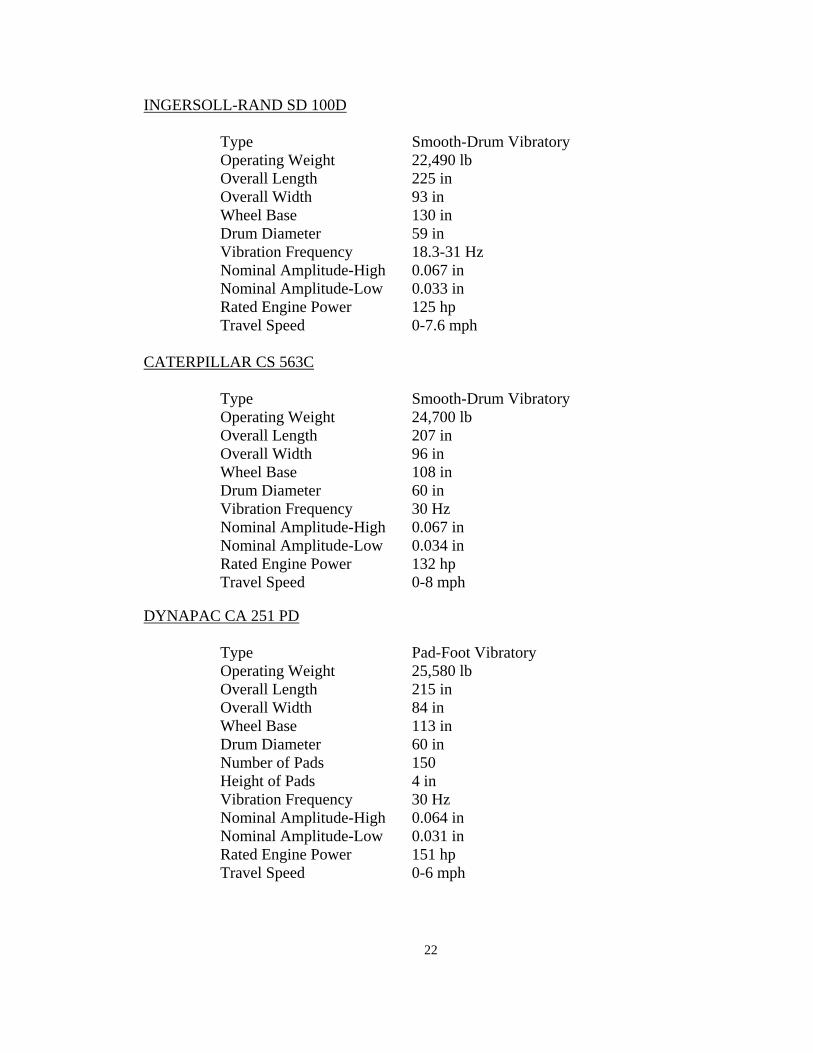
3.3 Field Compaction Equipment Specifications
Specifications for the field compaction equipment that was used during the field
tests are listed below.
22
INGERSOLL-RAND SD 100D
Type Smooth-Drum Vibratory Operating Weight 22,490 lb
Overall Length 225 in Overall Width 93 in Wheel Base 130 in Drum Diameter 59 in Vibration Frequency 18.3-31 Hz Nominal Amplitude-High 0.067 in Nominal Amplitude-Low 0.033 in Rated Engine Power 125 hp Travel Speed 0-7.6 mph
CATERPILLAR CS 563C
Type Smooth-Drum Vibratory Operating Weight 24,700 lb
Overall Length 207 in Overall Width 96 in Wheel Base 108 in Drum Diameter 60 in Vibration Frequency 30 Hz Nominal Amplitude-High 0.067 in Nominal Amplitude-Low 0.034 in
Rated Engine Power 132 hp Travel Speed 0-8 mph DYNAPAC CA 251 PD
Type Pad-Foot Vibratory Operating Weight 25,580 lb
Overall Length 215 in Overall Width 84 in Wheel Base 113 in Drum Diameter 60 in Number of Pads 150 Height of Pads 4 in Vibration Frequency 30 Hz Nominal Amplitude-High 0.064 in Nominal Amplitude-Low 0.031 in
Rated Engine Power 151 hp Travel Speed 0-6 mph
23
All compactors were operated at their maximum speeds and vibration frequencies
during the field test. The compaction procedure for each field test was determined by the
contractors’ normal methods of operation. The results of these field tests are presented in
Chapter 5 of this report.
24
CHAPTER 4
LABORATORY INVESTIGATION OF COMPACTION CHARACTERISTICS
4.1 Introduction
The first task of this research project was to investigate the current standards for
laboratory compaction. The two major factors that affect soil compaction are the moisture
content of the soil and the compactive effort that is applied to the soil. These two factors
were investigated in order to evaluate their influence during impact compaction. During
the preliminary investigation, the modified Proctor test was used as a standard level of
compaction. After the modified Proctor compaction curve had been developed for a
specified soil, the energy level of the compaction test was increased further. Compaction
curves at several energy levels were completed for each soil. These alternate compaction
curves were compared to the modified Proctor compaction curve in order to determine
the influence of increasing the energy level applied to a soil.
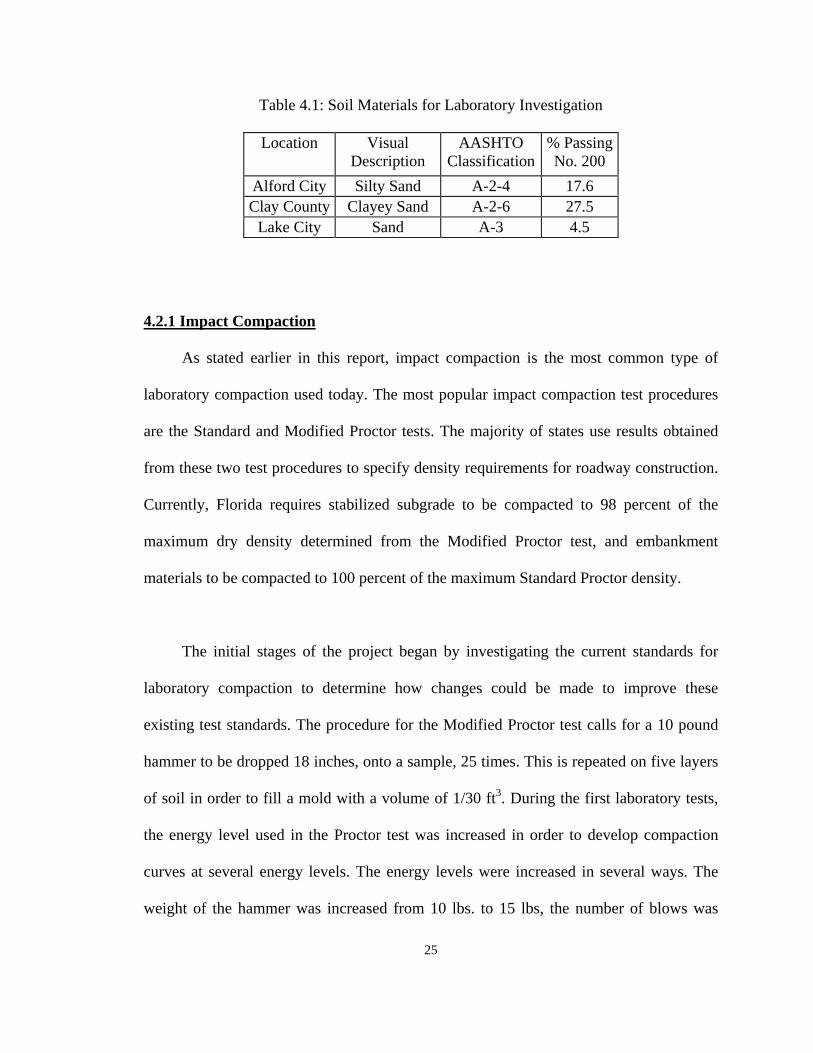
4.2 Soil Materials
Several soil types were used during the initial laboratory investigation. The soils
were chosen to represent the types of material that are commonly used for stabilized
subgrade in Florida. These soils included a silty sand from Alford City, a clayey sand
from Clay County, and a fine sand from Lake City. The basic properties of the soils are
listed in Table 4.1.
25
Table 4.1: Soil Materials for Laboratory Investigation
Location Visual Description
AASHTO Classification
% Passing No. 200
Alford City Silty Sand A-2-4 17.6 Clay County Clayey Sand A-2-6 27.5
Lake City Sand A-3 4.5
4.2.1 Impact Compaction
As stated earlier in this report, impact compaction is the most common type of
laboratory compaction used today. The most popular impact compaction test procedures
are the Standard and Modified Proctor tests. The majority of states use results obtained
from these two test procedures to specify density requirements for roadway construction.
Currently, Florida requires stabilized subgrade to be compacted to 98 percent of the
maximum dry density determined from the Modified Proctor test, and embankment
materials to be compacted to 100 percent of the maximum Standard Proctor density.
The initial stages of the project began by investigating the current standards for
laboratory compaction to determine how changes could be made to improve these
existing test standards. The procedure for the Modified Proctor test calls for a 10 pound
hammer to be dropped 18 inches, onto a sample, 25 times. This is repeated on five layers
of soil in order to fill a mold with a volume of 1/30 ft3. During the first laboratory tests,
the energy level used in the Proctor test was increased in order to develop compaction
curves at several energy levels. The energy levels were increased in several ways. The
weight of the hammer was increased from 10 lbs. to 15 lbs, the number of blows was
26
increased from 25 to 50, and the number of lifts was increased from five to eight. These
changes in the test procedure were used in several combinations. From initial test results
it was determined that changing the number of lifts in the test procedure did not result in
any significant results that could not be obtained from the other procedural changes. It
was determined that further procedural changes should concentrate on changes in the
hammer weight and number of blows. After further investigation a decision was made to
develop compaction curves using the following procedures: 10 lb. hammer-25 blows