911160 Revision 0 ENGINEERING SERVICES FOR THE NEXT GENERATION NUCLEAR PLANT (NGNP) WITH HYDROGEN PRODUCTION Final Report – NGNP Core Performance Analysis, Phase 1 Prepared by General Atomics For the Battelle Energy Alliance, LLC Subcontract No. 00075309 Uniform Filing Code UFC:8201.3.1.2 GA Project 30302 CM Aprvd ISSUED 2009/03/16
Transcript
911160Revision 0
ENGINEERING SERVICES FOR THE NEXT GENERATION NUCLEAR PLANT (NGNP) WITH
HYDROGEN PRODUCTION
Final Report – NGNP Core Performance Analysis, Phase 1
Prepared by General Atomics For the Battelle Energy Alliance, LLC
Final Report – NGNP Core Performance Analysis, Phase 1 911160/0
iii
LIST OF CONTRIBUTORS
Name Organization
Alan Baxter General Atomics
Chris Ellis General Atomics
Mike Fikani General Atomics
David Hanson General Atomics
John Saurwein General Atomics
Chuck Charman C Squared, LLC
Final Report – NGNP Core Performance Analysis, Phase 1 911160/0
iv
EXECUTIVE SUMMARY
GA has been tasked by the Battelle Energy Alliance (BEA) to perform a core performance analysis (CPA) for a prismatic annular Modular Helium Reactor (MHR) core having the basic parameters given in Table E-1. The primary objective of the analysis is to determine if an acceptable core design can be achieved using a single fissile fuel particle or whether a binary fuel particle system (i.e., including a fissile particle and a fertile particle) is necessary. By definition, an acceptable core design is a design that provides for adequate fuel cycle length and efficient use of nuclear material, and that meets core design requirements with acceptable margin, including fuel performance and fission product release on a total core basis.
Table E-1. Key Parameters for NGNP Core Performance Analysis
Parameter Value
Power level 600 MWt
Fuel cycle length 18 months*
Core inlet helium temperature 490°C - 590°C
Core outlet helium temperature 900°C
Max. time-averaged fuel temperature 1250°C**
Fuel particle systems (1) Binary fuel particle system: UCO fissile particle (350-�m kernel and ~19.7-wt% enrichment and a UCO (or UO2) fertile particle (500-�m kernel and 0.72-wt% enrichment)
Compact packing fraction ~30% for core average 35% maximum (goal) 35% - 40% for localized fuel zoning, if needed, not to exceed 5% of total core fuel compact volume
*The fuel cycle length is defined as 18 months from “startup-to-startup”, with due allowance for refueling down time, but with the goal of trying to increase the cycle length toward 540 EPFD **Historically, GA has used a maximum time-average fuel temperature of 1250°C as a guideline only in assessing the suitability of a core physics design. This is because even if the maximum time-averaged fuel temperature of a small fraction of the fuel should exceed 1250°C, this does not necessarily mean that the design is unacceptable because the high temperatures may not lead to fuel failure and fission product release, which are the figures of merit for a core design. Thus, GA recommends that a maximum time-averaged fuel temperature of 1250°C be used only as a guideline, and not as a hard limit, in the current core performance analysis.
Final Report – NGNP Core Performance Analysis, Phase 1 911160/0
v
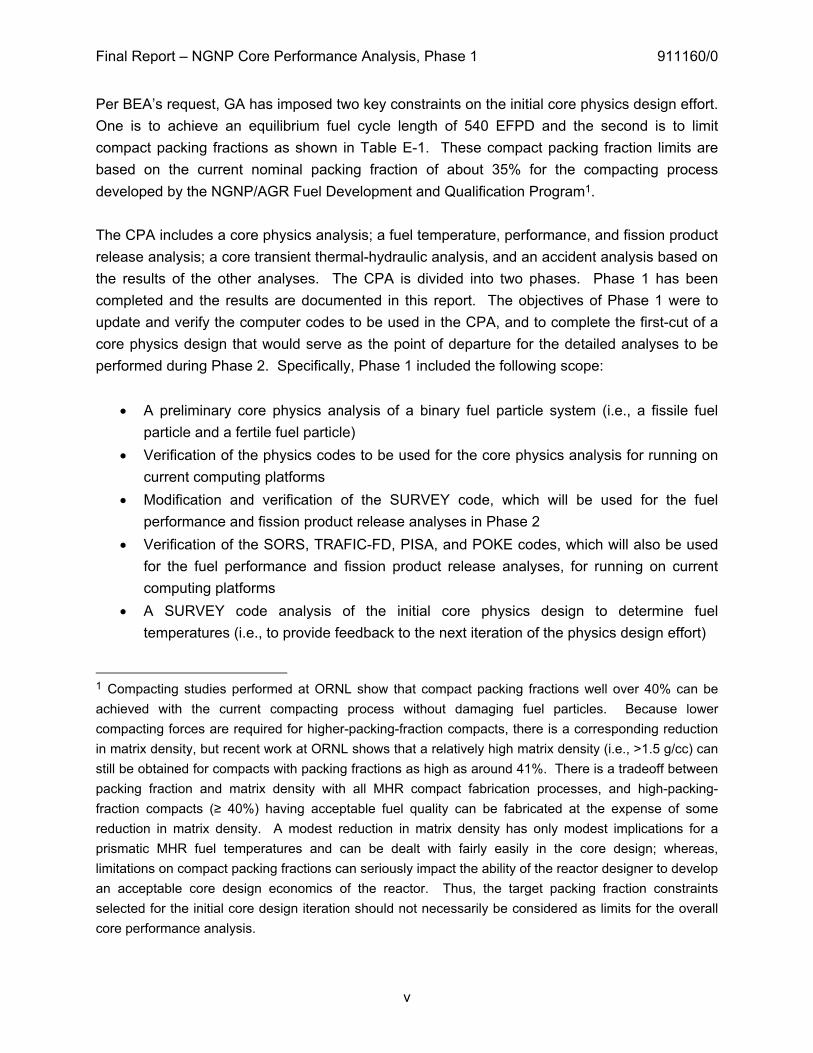
Per BEA’s request, GA has imposed two key constraints on the initial core physics design effort. One is to achieve an equilibrium fuel cycle length of 540 EFPD and the second is to limit compact packing fractions as shown in Table E-1. These compact packing fraction limits are based on the current nominal packing fraction of about 35% for the compacting process developed by the NGNP/AGR Fuel Development and Qualification Program1. The CPA includes a core physics analysis; a fuel temperature, performance, and fission product release analysis; a core transient thermal-hydraulic analysis, and an accident analysis based on the results of the other analyses. The CPA is divided into two phases. Phase 1 has been completed and the results are documented in this report. The objectives of Phase 1 were to update and verify the computer codes to be used in the CPA, and to complete the first-cut of a core physics design that would serve as the point of departure for the detailed analyses to be performed during Phase 2. Specifically, Phase 1 included the following scope:
� A preliminary core physics analysis of a binary fuel particle system (i.e., a fissile fuel particle and a fertile fuel particle)
� Verification of the physics codes to be used for the core physics analysis for running on current computing platforms
� Modification and verification of the SURVEY code, which will be used for the fuel performance and fission product release analyses in Phase 2
� Verification of the SORS, TRAFIC-FD, PISA, and POKE codes, which will also be used for the fuel performance and fission product release analyses, for running on current computing platforms
� A SURVEY code analysis of the initial core physics design to determine fuel temperatures (i.e., to provide feedback to the next iteration of the physics design effort)
1 Compacting studies performed at ORNL show that compact packing fractions well over 40% can be achieved with the current compacting process without damaging fuel particles. Because lower compacting forces are required for higher-packing-fraction compacts, there is a corresponding reduction in matrix density, but recent work at ORNL shows that a relatively high matrix density (i.e., >1.5 g/cc) can still be obtained for compacts with packing fractions as high as around 41%. There is a tradeoff between packing fraction and matrix density with all MHR compact fabrication processes, and high-packing-fraction compacts (� 40%) having acceptable fuel quality can be fabricated at the expense of some reduction in matrix density. A modest reduction in matrix density has only modest implications for a prismatic MHR fuel temperatures and can be dealt with fairly easily in the core design; whereas, limitations on compact packing fractions can seriously impact the ability of the reactor designer to develop an acceptable core design economics of the reactor. Thus, the target packing fraction constraints selected for the initial core design iteration should not necessarily be considered as limits for the overall core performance analysis.
Final Report – NGNP Core Performance Analysis, Phase 1 911160/0
vi
In Phase 2, the core physics design from Phase 1 will be used as the starting point to develop an optimized core design for a binary fuel particle system based on feedback from the Phase 1 SURVEY code analysis. This optimized core design will be evaluated for fuel performance and fission product release and will be the basis for a core accident analysis. Thermal-hydraulic calculations will be performed to support the accident analysis. Using the optimized binary fuel particle core design as the point of departure, a core design will then be developed for a single fissile particle. A fuel performance and fission product release analysis will be performed for the single fuel particle design. An evaluation of fuel shuffle schemes will also be performed to determine if the binary-fuel-particle and single-fuel-particle core designs can be further optimized using fuel shuffling. Based on the results of the single fuel particle physics analysis and the supporting fuel performance/fission product release analysis, a recommendation will be made for or against the use of a single fissile fuel particle for the NGNP.
The computer code sequence to be used in the CPA is shown in Figure E-1.
Figure E-1. Computer Flow Sequence for Core Performance Analysis
MICROX
DIF3D BURP
SURVEY/POKE
SORS
SORT3D
TAC2DTRAFIC-FD INTERFACE CODE
SINDA-FLUENT ANSYS
Normal Operation
Accident Analysis
PISA
Thermomechanical, Flow and Stress
Analysis
NJOY
MICROR
ENDF/B
GAUGE
Final Report – NGNP Core Performance Analysis, Phase 1 911160/0
vii
Core Physics Analysis The scope of the core physics analysis in Phase 1 was to perform a 3D nuclear design analysis of the NGNP MHR core having a binary fuel particle system and the core parameters given in Table E-1. This analysis included the following steps:
1. Develop a 2D model for the two particle MHR core 2. Develop broad group cross sections for the 2D model using the MICROX code 3. Using the 2D model, perform burnup calculations using the GAUGE code to determine
fuel loadings to meet the EFPD and packing fraction requirements through to equilibrium 4. Extend the 2D model to 3D 5. Perform a 3D core analysis from the initial core through to an equilibrium fuel cycle (5 or
6 cycles) using the DIF3D and BURP codes. Consider control rod insertion plus temperature and burnup effects that will impact the TRISO particle power/temperature
6. Confirm the DIF3D results with an independent Monte Carlo code (MCNP) analysis of the initial core design
The output from the physics analysis was generated in a format suitable for input to the SURVEY/TRAFIC code, which was used for the Phase 1 fuel performance and fission product transport analysis. Computer Code Verification The GA physics codes used in core design have been formally verified, but have been run previously on a DecAlpha UNIX platform, which is no longer available. Consequently, it was necessary to port the codes from the DecAlpha UNIX platform to the SGI ALTIX supercomputer platform and to re-verify them for running on the new platform. The following physics codes were verified for running on the SGI ALTIX supercomputer:
� MICROX � GAUGE � BURP � DIF3D � SORT3D
The GA codes to be used for the fuel performance and fission product release and transport analysis were also ported to the SGI ALTIX supercomputer and verified for running on that computing platform. These codes include:
Final Report – NGNP Core Performance Analysis, Phase 1 911160/0
viii
� SURVEY � TRAFIC-FD � POKE � PISA � SORS
With the exception of SURVEY and POKE, the codes in the above lists were verified for running on the SGI ALTIX by comparing the results obtained on the SGI ALTIX with results obtained from a verified version of the code that was run previously on the GA DEC ALPHA computer. A report was prepared to document verification of each of the codes verified in this manner. The SURVEY code was also verified as part of the Phase 1 work scope, but this required a substantially greater effort and a different approach than used for the other codes. The SURVEY code calculates the full-core distributions of burnup, fast fluence, temperature, and fuel failure, and the full-core fission gas release. The 3D core power distribution calculated with the DIF3D code is supplied as input to SURVEY via the interface code SORT3D. The following major modifications were required to SURVEY to make the code useable for the CPA:
� The code was converted to Fortran 90, and a generalized dimensioning protocol was introduced
� The POKE code, which calculates the coolant flow distribution in the core, was incorporated into SURVEY
� Fuel performance models were developed and incorporated for the natural-enriched UCO TRISO fertile particle
There has not been a two-particle core design analyzed at GA since 1989 when the performance of the 350-MW(t) steam-cycle MHTGR was assessed. This analysis was performed using an older version of SURVEY that used power distributions from GAUGE/FEVER/TSORT rather than from DIF3D/SORT3D, and the input and output files for the 1989 analysis have been lost. Consequently, because there is no verified two-particle test case which has been run on the GA DEC ALPHA computer system, the thermal portion (the “THERM” module) of SURVEY was verified by comparison with analogous calculations made with the POKE code for the NGNP pre-conceptual 600-MW(t) design. The agreement between the predicted fuel temperatures and coolant flow rates were excellent and verifies the thermal calculations in the latest version of SURVEY. However, verification of the SURVEY code was not entirely completed in Phase 1. The PERFOR module in SURVEY, which calculates fuel particle performance and fission gas release, still needs to be verified. This will be done early in Phase 2 of the CPA.
Final Report – NGNP Core Performance Analysis, Phase 1 911160/0
ix
Results for Phase 1 Core Design The first-cut of a complete 3D core physics design through equilibrium burnup on the binary fuel particle system was developed during Phase 1. The Phase 1 design meets the following initial requirements and goals specified for the core performance analysis (see Table E-1):
� Core power of 600 MW(t) � Fuel cycle length of 18 months (540 EFPD) � Maximum fuel compact packing fraction of 35% (the current design is 33.7% and
includes some localized zoning) However, the fuel temperature volume distributions calculated by SURVEY/THERM for the Phase 1 core design indicate that the fuel temperatures are excessive and that the core power distribution will require further optimization (as anticipated). For example, 4% to 5% of the fuel operates at a time-averaged temperature of >1250°C during one of the five operating cycles analyzed (i.e., cycle 2). It should be noted, however, that these temperature calculations are conservative because they were performed for a reactor outlet helium temperature of 950°C and a reactor inlet helium temperature of 490°C. In Phase 2, the reactor outlet helium temperature will be lowered to 900°C to be consistent with Table E-1 and the reactor inlet temperature will be increased to 540°C (to maintain the same design core �T as for the GT-MHR). A detailed evaluation of the fuel temperature distributions calculated by SURVEY for the Phase 1 design indicates the following modifications to the Phase 1 core design should be evaluated in Phase 2. First, the axial power distribution should be skewed more to the top of the core. Considering only fuel temperature, the ideal axial power profile is one that peaks at the top of the core and decreases exponentially down the length of the core. A truly exponential axial profile is impractical for number of reasons, including packing fraction limits, axial stability limits, etc, but the power can be skewed more to the top than in the Phase 1 physics design. However, this may require that the compact packing fraction constraints imposed in Phase 1 be relaxed somewhat. Second, the heavy-metal loadings in the four rows of buffer fuel at the fuel element-reflector element interface evidently need to be reduced, especially in the bottom axial fuel zone. This recommendation needs to be confirmed by a systematic examination of the radial- and axial power factors predicted for the fuel subvolumes at the fuel/reflector interfaces. Some of the radial power factors, especially at the fuel/reflector interfaces, are very high by historical standards for MHR cores, especially following control rod withdrawals. Scoping work done by the GA team during NGNP preconceptual design demonstrated that fuel shuffling can dramatically reduce the range of radial power factors in the core; however, the particular fuel shuffling scheme evaluated during preconceptual design did not skew the power distribution
Final Report – NGNP Core Performance Analysis, Phase 1 911160/0
x
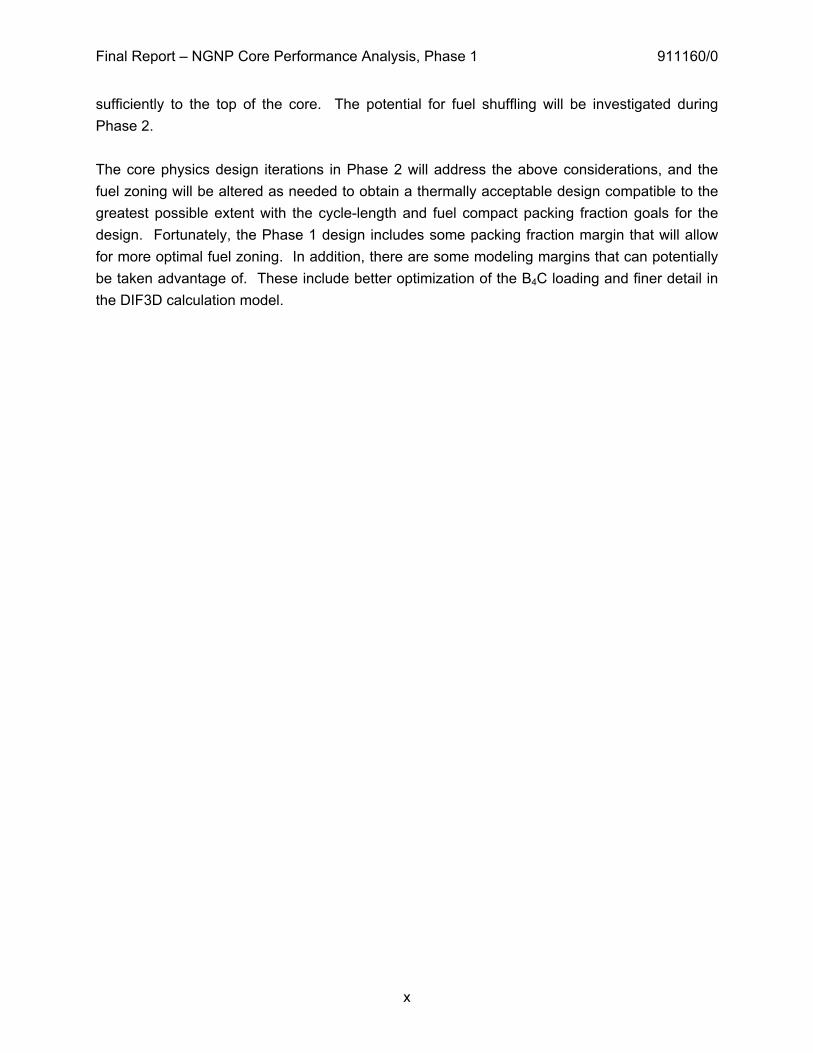
sufficiently to the top of the core. The potential for fuel shuffling will be investigated during Phase 2. The core physics design iterations in Phase 2 will address the above considerations, and the fuel zoning will be altered as needed to obtain a thermally acceptable design compatible to the greatest possible extent with the cycle-length and fuel compact packing fraction goals for the design. Fortunately, the Phase 1 design includes some packing fraction margin that will allow for more optimal fuel zoning. In addition, there are some modeling margins that can potentially be taken advantage of. These include better optimization of the B4C loading and finer detail in the DIF3D calculation model.
Final Report – NGNP Core Performance Analysis, Phase 1 911160/0
Final Report – NGNP Core Performance Analysis, Phase 1 911160/0
xii
LIST OF FIGURES
Figure 1-1. Computer Flow Sequence for Core Performance Analysis .......................................3Figure 2-1. Reactor System .........................................................................................................6Figure 2-2. Core Cross Section at Vessel Midplane ....................................................................7Figure 2-3. Standard Fuel Element Design (dimensions in inches)...........................................10Figure 2-4. Control or Reserve Shutdown Fuel Element (dimensions in inches) ......................11Figure 2-5. Standard Fuel Element and its Components...........................................................15Figure 2-6. Reflector Control Element .......................................................................................20Figure 2-7. Control Rod Design .................................................................................................21Figure 2-8. One-third symmetrical reactor geometry model (excluding ring 9 and beyond) ......23Figure 2-9. Diffusion Model Used for Subhex Depletion Calculations .......................................27Figure 2-10. Radial subhex map design for entire one-third symmetrical reactor model...........28Figure 2-11. Cycle 5 Radial Power Distribution - BOEC (3 EFPD)............................................35Figure 2-12. Cycle 5 Radial Power Distribution - MOEC (270 EFPD) .......................................36Figure 2-13. Cycle 5 Radial Power Distribution - EOEC (540 EFPD)........................................37Figure 2-14. Cycle 5 Axial Power Profiles – BOEC to 80 EFPD................................................38Figure 2-15. Cycle 5 Axial Power Profiles – 90 EFPD to 170 EFPD..........................................39Figure 2-16. Cycle 5 Axial Power Profiles – 180 EFPD to 260 EFPD........................................39Figure 2-17. Cycle 5 Axial Power Profiles – 270 EFPD to 340 EFPD........................................40Figure 2-18. Cycle 5 Axial Power Profiles – 350 EFPD to 420 EFPD........................................40Figure 2-19. Cycle 5 Axial Power Profiles – 430 EFPD to 500 EFPD........................................41Figure 2-20. Cycle 5 Axial Power Profiles - 510 EFPD to 540 EFPD ........................................41Figure 4-1. Peak Fuel Temperature Volume Distribution for Segment 1 ...................................58Figure 4-2. Peak Fuel Temperature Volume Distribution for Segment 2 ...................................59Figure 4-3. Time-Average Fuel Temperature Volume Distribution for Segment 1.....................60Figure 4-4. Time-Average Fuel Temperature Volume Distribution for Segment 2.....................61
Final Report – NGNP Core Performance Analysis, Phase 1 911160/0
xiii
LIST OF TABLES
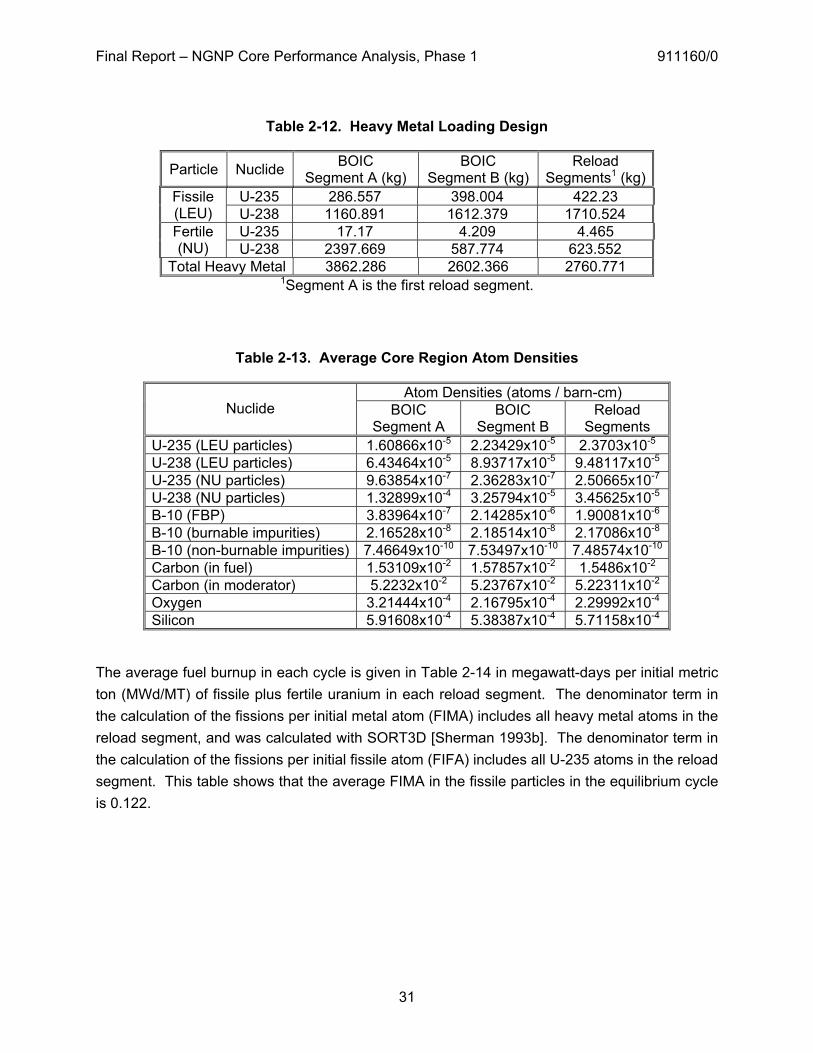
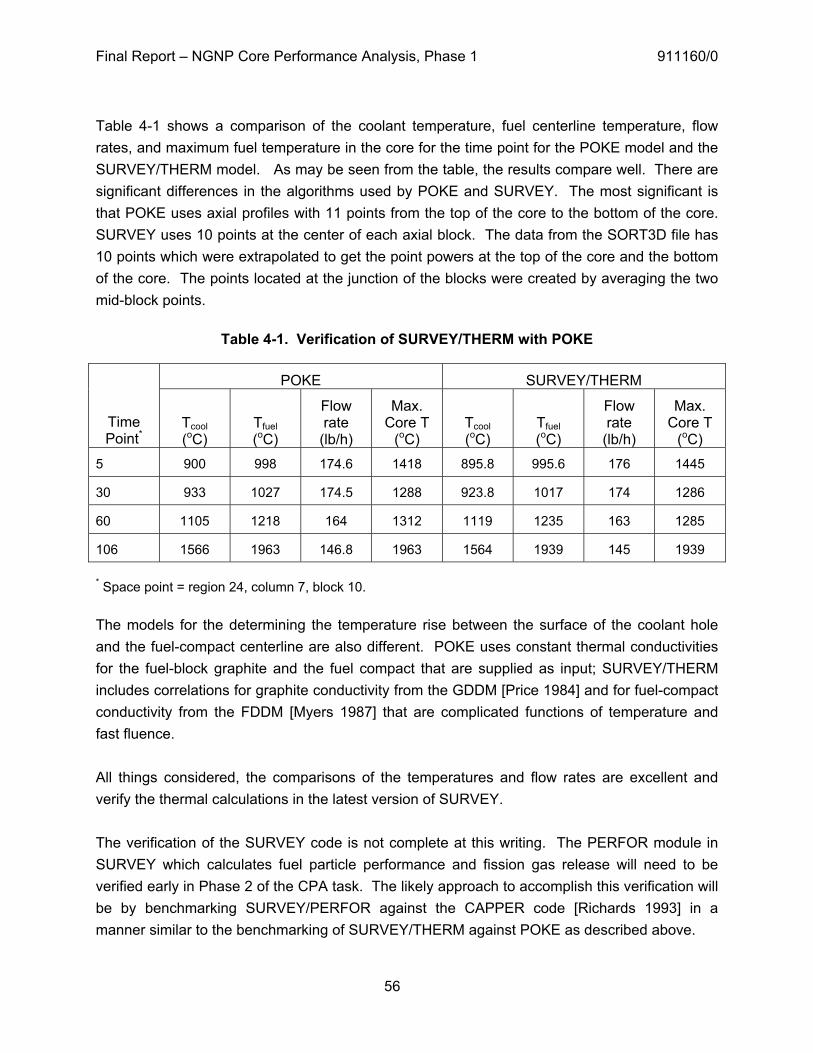
Table 1-1. Key Parameters for NGNP Core Performance Analysis.............................................2Table 2-1. Core Design Parameters ............................................................................................8Table 2-2. Fuel Element Design Data........................................................................................12Table 2-3. Element and Core Volumes......................................................................................13Table 2-4. Coated Particle Design .............................................................................................16Table 2-5. Basis for TRISO-Coated Fuel Properties..................................................................17Table 2-6. Fuel Quality and Performance Limits........................................................................17Table 2-7. Characteristics of Fixed Burnable Poison.................................................................18Table 2-8. Reflector Element Volumes ......................................................................................19Table 2-9. Broad Group Energy Structure .................................................................................25Table 2-10. Nuclide Listing for Diffusion Calculations................................................................26Table 2-11. Fuel Cycle Design...................................................................................................30Table 2-12. Heavy Metal Loading Design..................................................................................31Table 2-13. Average Core Region Atom Densities ....................................................................31Table 2-14. Average Fuel Burnup for Each Cycle .....................................................................32Table 2-15. DIF3D Radial Power Results for Equilibrium Cycle ................................................34Table 4-1. Verification of SURVEY/THERM with POKE ............................................................56
Final Report – NGNP Core Performance Analysis, Phase 1 911160/0
xiv
ACRONYMS AND ABBREVIATIONS
APF Axial Power Factor
BEA Battelle Energy Alliance (operators of the INL)
Final Report – NGNP Core Performance Analysis, Phase 1 911160/0
1
1 INTRODUCTION
GA has been tasked by the Battelle Energy Alliance (BEA) to perform a core performance analysis (CPA) for a prismatic annular Modular Helium Reactor (MHR) core having the basic parameters given in Table 1-1. The primary objective of the analysis is to determine if an acceptable core design can be achieved using a single fissile fuel particle or whether a binary fuel particle system (i.e., including a fissile particle and a fertile particle) is necessary.2 By definition, an acceptable core design is a design that provides for adequate fuel cycle length and efficient use of nuclear material, and that meets core design requirements with acceptable margin, including fuel performance and fission product release on a total core basis. The CPA includes a core physics analysis; a fuel temperature, performance, and fission product release analysis; a core transient thermal-hydraulic analysis, and an accident analysis based on the results of the other analyses. The CPA is divided into two phases. Phase 1 has been completed and the results are documented in this report. The objectives of Phase 1 were to update and verify the computer codes to be used in the CPA, and to complete the first-cut of a core physics design that would serve as the point of departure for the detailed analyses to be performed during Phase 2. Specifically, Phase 1 included the following scope:
� A preliminary core physics analysis of a binary fuel particle system (i.e., a fissile fuel particle and a fertile fuel particle)
� Verification of the physics codes to be used for the core physics analysis for running on current computing platforms
� Modification and verification of the SURVEY code, which will be used for the fuel performance and fission product release analyses in Phase 2
� Verification of the SORS, TRAFIC-FD, PISA, and POKE codes, which will also be used for the fuel performance and fission product release analyses, for running on current computing platforms
2 GA has used both a fissile fuel particle and fertile fuel particle in past GA core designs because GA has found that use of a fissile/fertile fuel particle system maximizes the ability to zone the core to minimize local power peaking and to maximize fuel cycle length.
Final Report – NGNP Core Performance Analysis, Phase 1 911160/0
2
Table 1-1. Key Parameters for NGNP Core Performance Analysis
Parameter Value Power level 600 MWt Fuel cycle length 18 months* Core inlet helium temperature 490°C - 590°C Core outlet helium temperature 900°C Max. time-averaged fuel temperature 1250°C** Fuel particle systems (1) Binary fuel particle system: UCO fissile particle
(350-�m kernel and 19.9-wt% enrichment and a UCO (or UO2) fertile particle (500-�m kernel and 0.72-wt% enrichment)
35% maximum (goal) 35% - 40% for localized fuel zoning, if needed, not to exceed 5% of total core fuel compact volume***
*The fuel cycle length is defined as 18 months from “startup-to-startup”, with due allowance for refueling down time, but with the goal of trying to increase the cycle length toward 540 EPFD **Historically, GA has used a maximum time-average fuel temperature of 1250°C as a guideline only in assessing the suitability of a core physics design. This is because even if the maximum time-averaged fuel temperature of a small fraction of the fuel should exceed 1250°C, this does not necessarily mean that the design is unacceptable because the high temperatures may not lead to fuel failure and fission product release, which are the figures of merit for a core design. Thus, GA recommends that a maximum time-averaged fuel temperature of 1250°C be used only as a guideline, and not as a hard limit, in the current core performance analysis. ***These compact packing fractions are guidelines based on the current nominal packing fraction of about 35% for the compacting process developed by the NGNP/AGR Fuel Development and Qualification Program. However, compacting studies performed at ORNL show that compact packing fractions well over 40% can be achieved with the current compacting process without damaging fuel particles. Because lower compacting forces are required for higher-packing-fraction compacts, there is a corresponding reduction in matrix density, but recent work at ORNL shows that a relatively high matrix density (i.e., >1.5 g/cc) can still be obtained for compacts with packing fractions as high as around 41%. There is a tradeoff between packing fraction and matrix density with all MHR compact fabrication processes, and high-packing-fraction compacts (� 40%) having acceptable fuel quality can be fabricated at the expense of some reduction in matrix density. A modest reduction in matrix density has only modest implications for a prismatic MHR and can be fairly easily dealt with in the core design; whereas, limitations on compact packing fractions can have a serious impact on the economics of the reactor. Thus, the target packing fraction constraints selected for the initial core design iteration should not necessarily be considered as hard limits for the overall core performance analysis task.
Final Report – NGNP Core Performance Analysis, Phase 1 911160/0
3
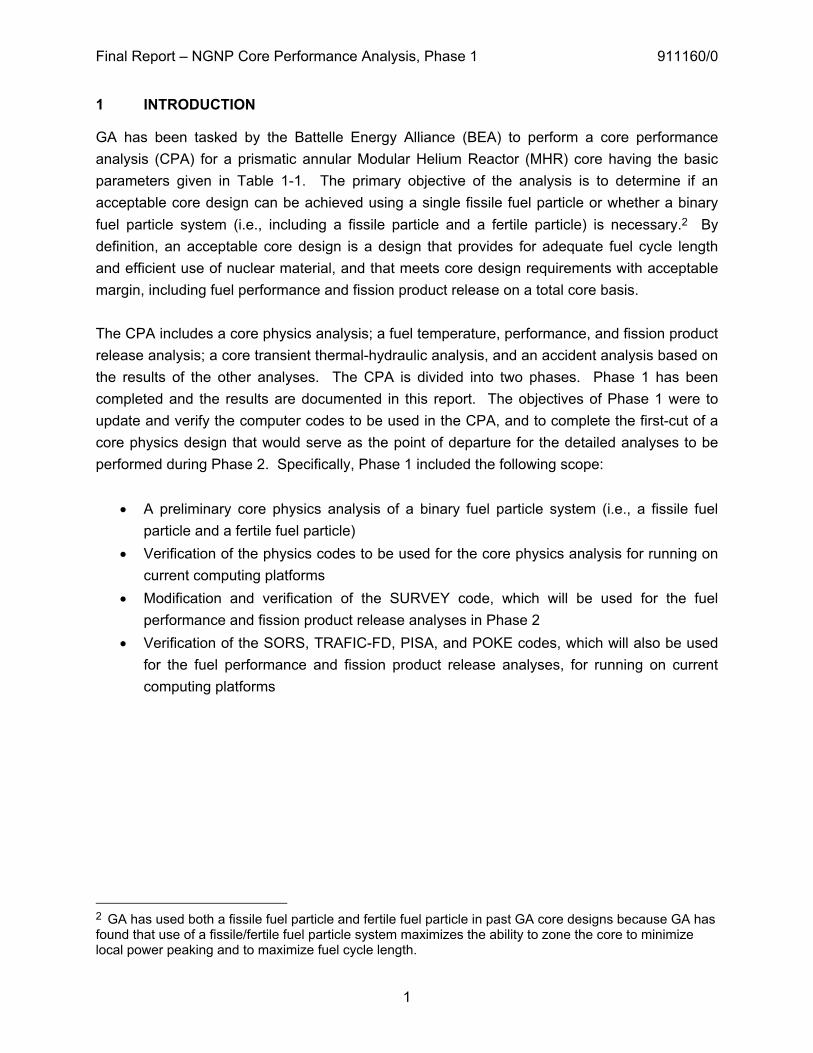
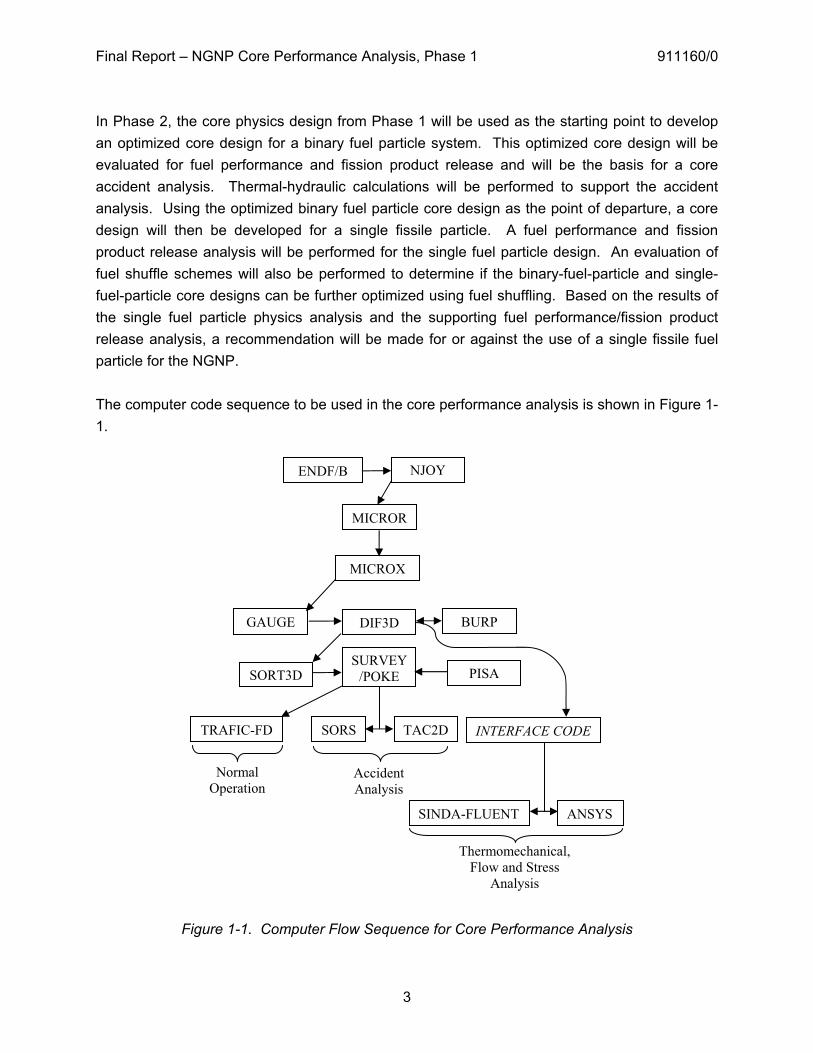
In Phase 2, the core physics design from Phase 1 will be used as the starting point to develop an optimized core design for a binary fuel particle system. This optimized core design will be evaluated for fuel performance and fission product release and will be the basis for a core accident analysis. Thermal-hydraulic calculations will be performed to support the accident analysis. Using the optimized binary fuel particle core design as the point of departure, a core design will then be developed for a single fissile particle. A fuel performance and fission product release analysis will be performed for the single fuel particle design. An evaluation of fuel shuffle schemes will also be performed to determine if the binary-fuel-particle and single-fuel-particle core designs can be further optimized using fuel shuffling. Based on the results of the single fuel particle physics analysis and the supporting fuel performance/fission product release analysis, a recommendation will be made for or against the use of a single fissile fuel particle for the NGNP. The computer code sequence to be used in the core performance analysis is shown in Figure 1-1.
Figure 1-1. Computer Flow Sequence for Core Performance Analysis
MICROX
DIF3D BURP
SURVEY/POKE
SORS
SORT3D
TAC2DTRAFIC-FD INTERFACE CODE
SINDA-FLUENT ANSYS
Normal Operation
Accident Analysis
PISA
Thermomechanical, Flow and Stress
Analysis
NJOY
MICROR
ENDF/B
GAUGE
Final Report – NGNP Core Performance Analysis, Phase 1 911160/0
4
2 NGNP CORE PHYSICS ANALYSIS
The scope of the core physics analysis task in Phase 1 was to perform an initial 3D nuclear design analysis of the NGNP MHR core having a binary fuel particle system for the core parameters given in Section 1. This analysis included the following steps:
1. Develop a 2D model for the two particle MHR core 2. Develop broad group cross sections for the 2D model 3. Using the 2D model, determine fuel loadings to meet the EFPD and packing fraction
requirements through to equilibrium 4. Extend the 2D model to 3D 5. Perform a 3D core analysis from the initial core through to an equilibrium fuel cycle (5 or
6 cycles). Consider control rod insertion plus temperature and burnup effects that will impact the TRISO particle power/temperature.
6. Confirm the DIF3D results with an independent Monte Carlo code (MCNP) analysis of the initial core design
The output from the physics analysis was generated in a format suitable for input to the SURVEY code, which was used in Phase 1 to calculate fuel temperatures, as discussed in Section 4. The Phase 1 core physics analysis is described in this section. Further details can be found in [Ellis 2009] 2.1 Core Design Description
2.1.1 Core Configuration
The NGNP preconceptual design of the core consists of an array of hexagonal fuel elements in a cylindrical arrangement surrounded by a single ring of identically sized solid graphite replaceable reflector elements, followed by a region of permanent reflector elements all located within a reactor pressure vessel. The permanent reflector elements contain a 10 cm (3.94 in.) thick borated region at the outer boundary, adjacent to the core barrel. The borated region contains B4C particles of the same design as in the FBP (see lower half of Table 2-8.), but dispersed throughout the entire borated region with a volume fraction of 61%. The core is designed to provide 600 MW(t) at a power density of 6.57 MW/m3. A core elevation view is shown in Figure 2-1 and a plan view is shown in Figure 2-2. The active core consists of hexagonal graphite fuel elements containing blind holes for fuel compacts and full length channels for helium coolant flow. The fuel elements are stacked to form columns (10 fuel elements per column) that rest on support structures as shown in Figure 2-1. The active core
Final Report – NGNP Core Performance Analysis, Phase 1 911160/0
5
columns form a three row annulus with columns of hexagonal graphite reflector elements in the inner and outer regions (see Figure 2-2). Twelve core columns and 36 outer reflector columns contain channels for control rods. Eighteen columns in the core also contain channels for reserve shutdown material. The annular core configuration was selected, along with the power density of 6.57 MW/m3, to achieve maximum power rating and still permit passive core heat removal while maintaining the fuel temperature at ~ 1600°C (2912°F) during a conduction cooldown event. The active core effective outer diameter of 4.8 m (190.2 in.) is sized to maintain a minimum reflector thickness of 1 m (39.4 in.) within the 7.2 m (284.5 in.) inner diameter reactor vessel. These dimensions allow for a lateral restraint structure between the reflector and vessel. The height of the core with ten elements in each column is 7.9 m (312 in.), which allows a maximum power rating and axial power stability over the cycle. The core reactivity is controlled by a combination of fixed burnable poison (FBP), movable poison, and a negative temperature coefficient. The fixed poison is in the form of lumped burnable poison compacts; the movable poison is in the form of metal clad control rods. Should the control rods become inoperable, a backup reserve shutdown control (RSC) is provided in the form of boronated pellets that may be released into channels in the active core. The control rods are fabricated from natural boron in annular graphite compacts with metal cladding for structural support. The control rods are located in row one of the core, and in the inner ring of the outer reflector (Figure 2-2). These control rods enter the core and outer reflector through the top reactor vessel penetrations in which the control rod drives are housed. The 36 control rods located in the outer reflector are the operating control rods, and are used for control during power operation, and for reactor trip. These operating rods can maintain the required 1% �� shutdown margin indefinitely under hot conditions, or for at least one day under cold conditions. Locating the operating rods in the outer reflector prevents damage during depressurized or pressurized passive heat removal. The twelve control rods in the core are the startup control rods, which are withdrawn before the reactor reaches criticality. With the startup and operating rods inserted, a 1% �� shutdown margin can be indefinitely maintained under cold conditions. The RSC consists of boronated graphite pellets, housed in hoppers above the core. When the RSC is actuated, these pellets drop into channels in 18 columns of the active core. The RSC is used to institute reactor shutdown if the control rods become inoperable, or if necessary, to provide additional negative reactivity beyond that available in the inserted control rods. Basic core nuclear design parameters are summarized in Table 2-1.
Final Report – NGNP Core Performance Analysis, Phase 1 911160/0
6
Figure 2-1. Reactor System
Final Report – NGNP Core Performance Analysis, Phase 1 911160/0
7
Figure 2-2. Core Cross Section at Vessel Midplane
Final Report – NGNP Core Performance Analysis, Phase 1 911160/0
8
Table 2-1. Core Design Parameters
Core power (MW(t)) 600 Number of fuel columns 102 Thermal power density (MW/m3) 6.57 Effective inner diameter of active core (m) 2.96 Effective outer diameter of active core (m) 4.83 Active core height (m) 7.93 Number of fuel elements (10 per column) Standard 720 Control 120 Reserve shutdown 180 Number of control rods In-core 12 Outer reflector 36 Number of RSC channels in the core 18 Fissile material in kernel (19.7974% enriched U) UC0.5O1.5 Fertile material in kernel (natural U) UC0.5O1.5 Refueling interval (months) 18 Number of columns per refueling segment 51 Time to refuel (days) 10 Availability factor (%) 98.6 Equilibrium cycle length (effective full-power 540 Core fuel loading (kg) Initial core, LEU 3457.83 NU 3006.82 Reloads, LEU 2132.75 NU 628.02 Weight of reload segment in core (kg) Carbon 76,771 Oxygen 278.9 Silicon 1215.7
Final Report – NGNP Core Performance Analysis, Phase 1 911160/0
9
2.1.2 Fuel Element Design
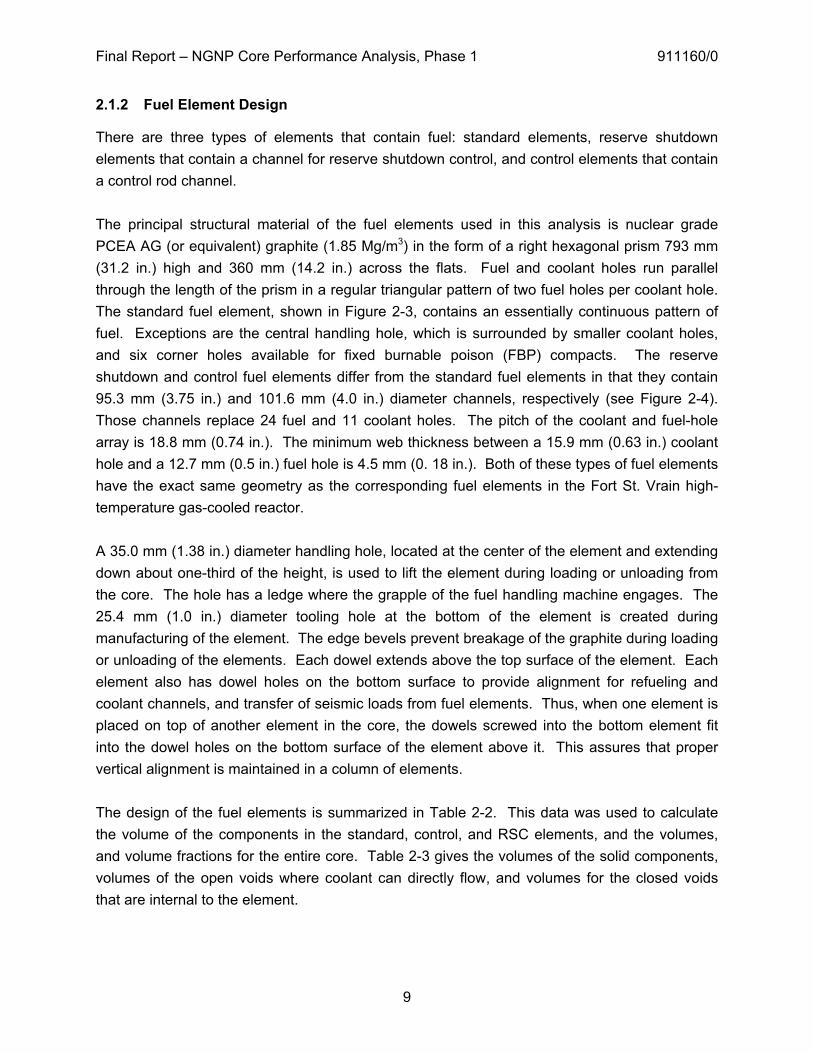
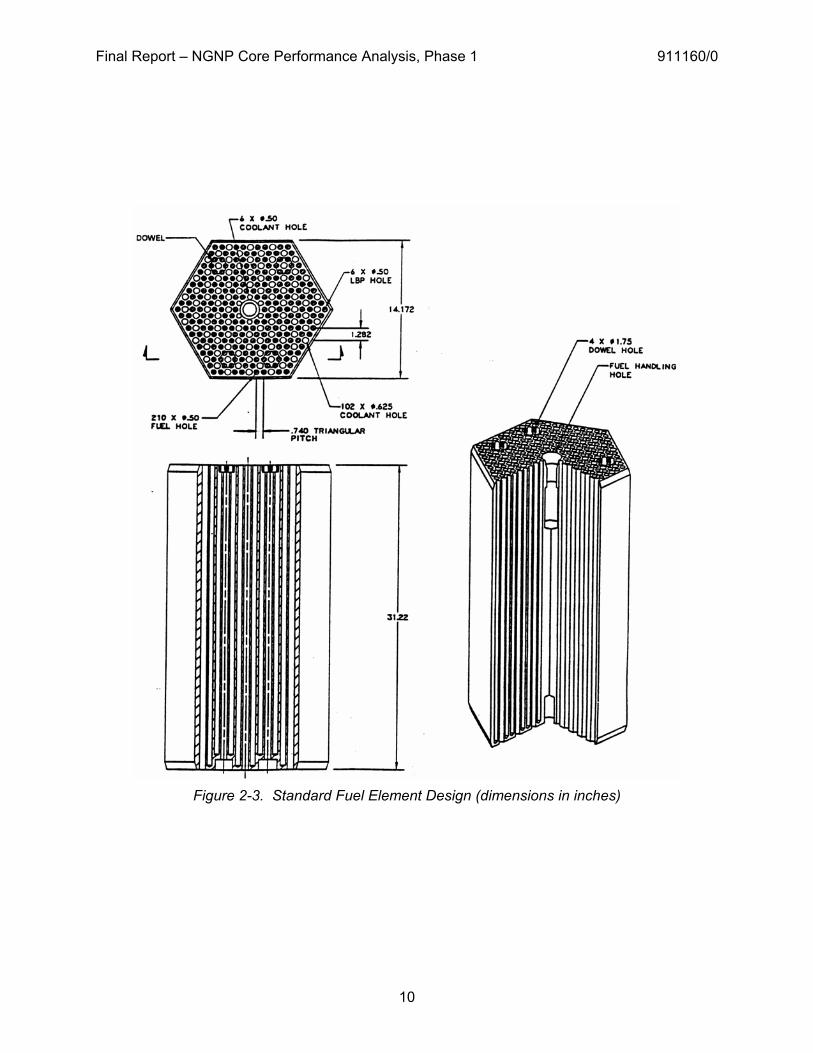
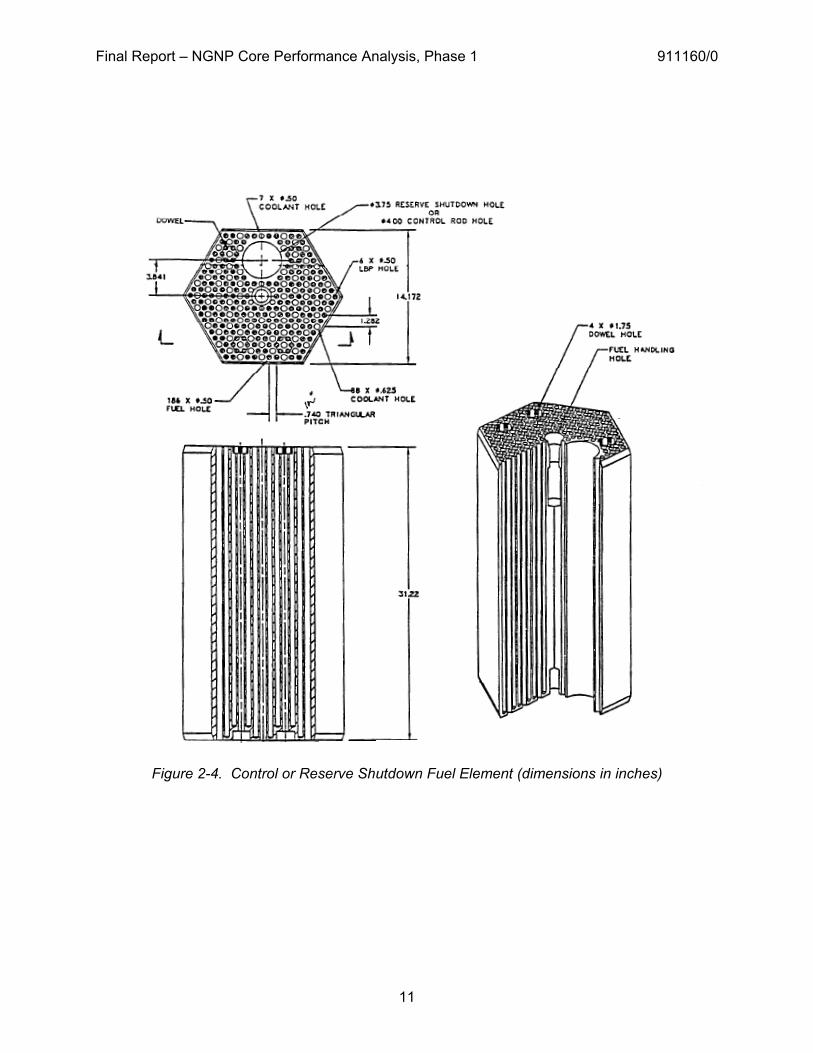
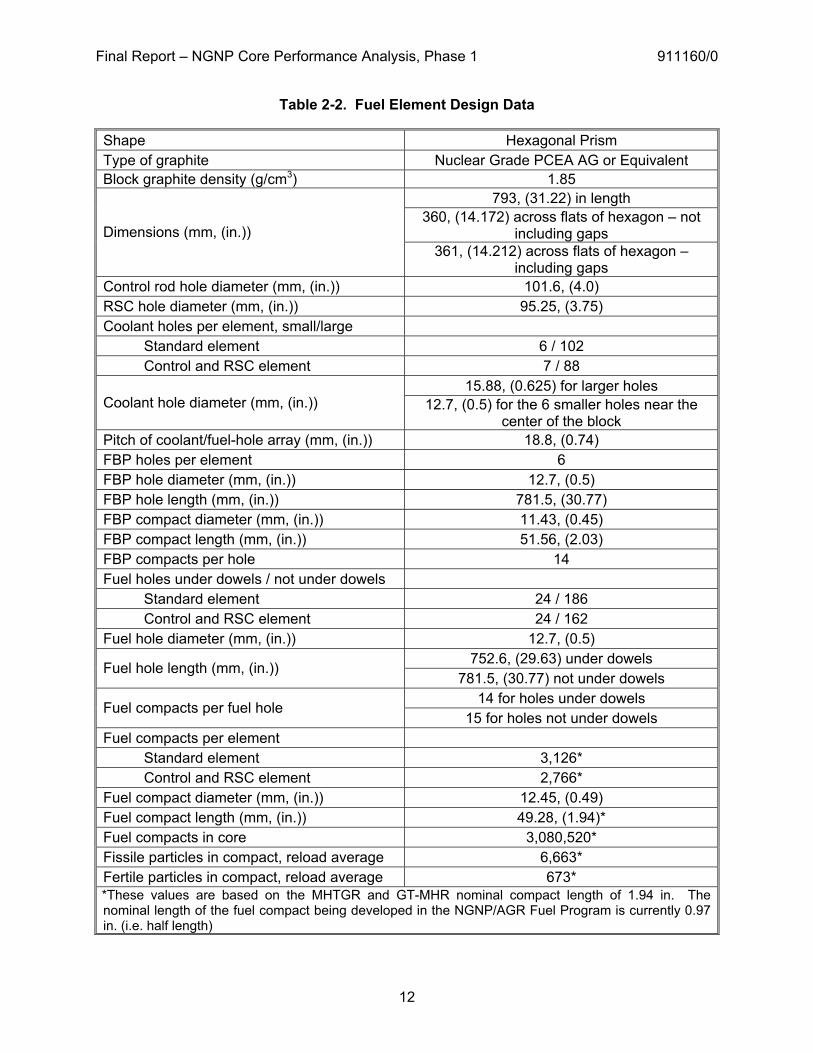
There are three types of elements that contain fuel: standard elements, reserve shutdown elements that contain a channel for reserve shutdown control, and control elements that contain a control rod channel. The principal structural material of the fuel elements used in this analysis is nuclear grade PCEA AG (or equivalent) graphite (1.85 Mg/m3) in the form of a right hexagonal prism 793 mm (31.2 in.) high and 360 mm (14.2 in.) across the flats. Fuel and coolant holes run parallel through the length of the prism in a regular triangular pattern of two fuel holes per coolant hole. The standard fuel element, shown in Figure 2-3, contains an essentially continuous pattern of fuel. Exceptions are the central handling hole, which is surrounded by smaller coolant holes, and six corner holes available for fixed burnable poison (FBP) compacts. The reserve shutdown and control fuel elements differ from the standard fuel elements in that they contain 95.3 mm (3.75 in.) and 101.6 mm (4.0 in.) diameter channels, respectively (see Figure 2-4). Those channels replace 24 fuel and 11 coolant holes. The pitch of the coolant and fuel-hole array is 18.8 mm (0.74 in.). The minimum web thickness between a 15.9 mm (0.63 in.) coolant hole and a 12.7 mm (0.5 in.) fuel hole is 4.5 mm (0. 18 in.). Both of these types of fuel elements have the exact same geometry as the corresponding fuel elements in the Fort St. Vrain high-temperature gas-cooled reactor. A 35.0 mm (1.38 in.) diameter handling hole, located at the center of the element and extending down about one-third of the height, is used to lift the element during loading or unloading from the core. The hole has a ledge where the grapple of the fuel handling machine engages. The 25.4 mm (1.0 in.) diameter tooling hole at the bottom of the element is created during manufacturing of the element. The edge bevels prevent breakage of the graphite during loading or unloading of the elements. Each dowel extends above the top surface of the element. Each element also has dowel holes on the bottom surface to provide alignment for refueling and coolant channels, and transfer of seismic loads from fuel elements. Thus, when one element is placed on top of another element in the core, the dowels screwed into the bottom element fit into the dowel holes on the bottom surface of the element above it. This assures that proper vertical alignment is maintained in a column of elements. The design of the fuel elements is summarized in Table 2-2. This data was used to calculate the volume of the components in the standard, control, and RSC elements, and the volumes, and volume fractions for the entire core. Table 2-3 gives the volumes of the solid components, volumes of the open voids where coolant can directly flow, and volumes for the closed voids that are internal to the element.
Final Report – NGNP Core Performance Analysis, Phase 1 911160/0
10
Figure 2-3. Standard Fuel Element Design (dimensions in inches)
Final Report – NGNP Core Performance Analysis, Phase 1 911160/0
11
Figure 2-4. Control or Reserve Shutdown Fuel Element (dimensions in inches)
Final Report – NGNP Core Performance Analysis, Phase 1 911160/0
12
Table 2-2. Fuel Element Design Data
Shape Hexagonal Prism Type of graphite Nuclear Grade PCEA AG or Equivalent Block graphite density (g/cm3) 1.85
793, (31.22) in length 360, (14.172) across flats of hexagon – not
including gaps Dimensions (mm, (in.)) 361, (14.212) across flats of hexagon –
including gaps Control rod hole diameter (mm, (in.)) 101.6, (4.0) RSC hole diameter (mm, (in.)) 95.25, (3.75) Coolant holes per element, small/large Standard element 6 / 102 Control and RSC element 7 / 88
15.88, (0.625) for larger holes Coolant hole diameter (mm, (in.)) 12.7, (0.5) for the 6 smaller holes near the
center of the block Pitch of coolant/fuel-hole array (mm, (in.)) 18.8, (0.74) FBP holes per element 6 FBP hole diameter (mm, (in.)) 12.7, (0.5) FBP hole length (mm, (in.)) 781.5, (30.77) FBP compact diameter (mm, (in.)) 11.43, (0.45) FBP compact length (mm, (in.)) 51.56, (2.03) FBP compacts per hole 14 Fuel holes under dowels / not under dowels Standard element 24 / 186 Control and RSC element 24 / 162 Fuel hole diameter (mm, (in.)) 12.7, (0.5)
752.6, (29.63) under dowels Fuel hole length (mm, (in.)) 781.5, (30.77) not under dowels
14 for holes under dowels Fuel compacts per fuel hole 15 for holes not under dowels
Fuel compacts per element Standard element 3,126* Control and RSC element 2,766* Fuel compact diameter (mm, (in.)) 12.45, (0.49) Fuel compact length (mm, (in.)) 49.28, (1.94)* Fuel compacts in core 3,080,520* Fissile particles in compact, reload average 6,663* Fertile particles in compact, reload average 673* *These values are based on the MHTGR and GT-MHR nominal compact length of 1.94 in. The nominal length of the fuel compact being developed in the NGNP/AGR Fuel Program is currently 0.97 in. (i.e. half length)
Final Report – NGNP Core Performance Analysis, Phase 1 911160/0
The TRISO particles are bonded into fuel compacts to prevent mechanical interaction between the fuel particles and moderator graphite by maintaining the fuel as a free standing non-structural component of the fuel element, to maximize the thermal conductivity in the fuel, and to provide a secondary barrier to metallic fission product release through absorption mechanisms. The fuel compacts, which are contained within the fuel holes in the fuel elements, have a 12.45 mm (0.49 in.) diameter with a length of 49.3 mm (1.94 in.).3
3 The nominal length of the fuel compact being developed in the NGNP/AGR Fuel Program is currently 0.97 in. (i.e. half length). Whether the compact length is 1.94 in. or 0.97 in. (in which case twice as many compacts will be needed) has no impact on the core performance analysis.
Final Report – NGNP Core Performance Analysis, Phase 1 911160/0
14
Each fuel compact is a mixture of fissile and fertile fuel particles bonded by a carbonaceous matrix.4 These compacts are stacked in the fuel holes. The six stacks under each of the four dowels contain 14 fuel compacts; all other stacks contain 15 fuel compacts. A nominal radial gap of 0.127 mm (0.005 in.) between the fuel compact and the fuel hole allows for fuel element loading and precludes interference between the fuel compact and the graphite block during operation. Graphite plugs cemented into the tops of the fuel holes enclose the fuel compact stacks. A gap between the top of the fuel compact stack and the graphite plug also precludes interference during operation. 2.1.4 Fuel Particle Design
The reference fuel cycle employs low-enriched uranium and natural uranium. The fissile fuel is 19.7974% enriched uranium having an oxygen-to-uranium ratio of 1.5 in fresh fuel, and a carbon-to-uranium ratio of 0.5. The fertile fuel is the same composition as the fissile fuel, except that natural uranium is used rather than enriched uranium. Natural uranium, rather than depleted uranium, was selected for the fertile material because of the presence of more U-235 in natural uranium. The core has a double-heterogeneous fuel configuration. The first level of heterogeneity consists of the TRISO coated particle design. As depicted in Figure 2-5, the fuel kernel is surrounded by a buffer (porous) layer of graphite and two high-density pyrocarbon layers with a silicon carbide layer in between. The buffer layer allows for limited kernel migration and provides some retention of gas particles. The silicon carbide layer ensures the structural integrity of the particle under constant pressure and also helps retain metallic fission products. These TRISO particles are dispersed in a graphite compact matrix to form fuel compacts, which are inserted into vertical fuel channels arranged in the fuel element, and produce the second level of heterogeneity. Details of the TRISO particle designs are given in Table 2-4. The reasons for the specified properties of each TRISO particle component are given in Table 2-5. The fuel quality and performance limits are given in Table 2-6. Core release limits for the volatile metallic fission products Cs-137 and Ag-110m, both of which can potentially leak from TRISO particles with intact coating layers, are also included in Table 2-6.
4 The compact fabrication process currently being developed by the NGNP/AGR Fuel Program does not include use of graphite shim particles, which were used in GA’s compacting process. However, it may be necessary to use shim particles in NGNP/AGR fuel compacts to occupy compact volume in compacts having relatively low fuel particle packing fractions (in the event that such compacts are required by the core design).
Final Report – NGNP Core Performance Analysis, Phase 1 911160/0
15
Figure 2-5. Standard Fuel Element and its Components
Fuel Compact
Fuel Element
Uranium Oxycarbide (fuel kernel)
Buffer
Inner Pyrocarbon
Outer Pyrocarbon Silicon Carbide
TRISO Coated Fuel Particle
Final Report – NGNP Core Performance Analysis, Phase 1 911160/0
Final Report – NGNP Core Performance Analysis, Phase 1 911160/0
17
Table 2-5. Basis for TRISO-Coated Fuel Properties
Particle Component
Specified Property Purpose
Assure adequate heavy metal Control power production per particle Diameter Control pressure vessel failure Assure adequate heavy metal
Kernel
Density Minimize fission gas release
Buffer Thickness and Density Control gas pressure
Assure impermeability to chlorine during SiC deposition Provide structural support to SiC layer throughout irradiation IPyC Thickness and
Density Assure maximum irradiation stability with minimum permeability Control pressure vessel failure
SiC Thickness and Density Contain metallic and gaseous fission
products Provide structural support to SiC layer throughout irradiation Thickness Provide backup to SiC for gaseous fission product containment OPyC
Density Assure maximum irradiation stability with minimum permeability
Table 2-6. Fuel Quality and Performance Limits
Parameter Segment Average
Value
Upper Bound Value
As-manufactured fuel quality Heavy metal contamination fraction �1.0x10⁻⁵ �2.0x10⁻⁵ Missing buffer fraction �1.0x10⁻⁵ �2.0x10⁻⁵ Missing or permeable inner pyrocarbon �4.0x10⁻⁵ �1.0x10⁻⁴ SiC coating defect fraction �5.0x10⁻⁵ �1.0x10⁻⁴ Missing or defective OPyC �1.0x10⁻⁴ �1.0x10⁻³ Fuel performance In-service failure fraction (normal) �5.0x10⁻⁵ �2.0x10⁻⁴ Incremental failure during accident �1.5x10⁻⁴ �6.0x10⁻⁴ Metallic fission product release from core Cs-137 core fractional release �1.0 x 10⁻⁵ �1.0 x 10⁻⁴ Ag-110m core fractional release �2.0 x 10⁻⁴ �2.0 x 10⁻³
Final Report – NGNP Core Performance Analysis, Phase 1 911160/0
18
2.1.5 Fixed Burnable Poison Design
The FBP consists of boron carbide (B4C) granules dispersed in graphite compacts. The B4C granules are pyrocarbon (PyC) coated to limit oxidation and loss from the system. The amount of burnable poison is determined by reactivity control requirements, which may vary with each reload cycle. The diameters of the FBP rods are specified according to requirements for self-shielding of the absorber material to control its burnout rate relative to the fissile fuel burnout rate. The goals are to achieve near complete burnout of the material when the element is replaced, and to minimize the hot excess reactivity swing over the cycle. The current design uses six FBP rods per element in all core layers, while axial zoning is performed through having relatively less FBP mass in the top and bottom layers compared to the middle layers of the core. Axial FBP zoning will be used to maintain the axial power shape during burnup and to prevent xenon induced axial power oscillations. The current design also uses a constant FBP compact diameter of 11.43 mm (0.45 in.) for all cycles. Details of the FBP design are given in Table 2-7, assuming that each FBP rod contains 14 compacts.
Table 2-7. Characteristics of Fixed Burnable Poison
FBP holes per element 6 FBP compacts per FBP rod 14 Compact diameter (mm, (in.) 11.43 (0.45) Compact length (mm, (in.)) 51.56 (2.03) Rod length (mm, (in.)) 721.87 (28.42) Volume fraction of B4C particles plus shim particles 0.61
FBP Component Composition Diameter(�m)
Thickness (�m)
Density(g/cm3)
B4C particle Kernel B4C 200 - 2.47 Buffer coating C - 18 1.0 Pyrolytic coating C - 23 1.87 Shim particle C - - 1.65 Matrix C - - 0.94
2.1.6 Hexagonal Reflector Elements
The hexagonal reflector elements are nuclear grade PCEA AG (or equivalent) graphite. Their size, shape, and handling hole are similar to the fuel elements, except that some of the reflector elements are half-height or three-quarter height. The volumes of the reflector components are given in Table 2-8.
Final Report – NGNP Core Performance Analysis, Phase 1 911160/0
The reflector above the active core is composed of two layers: one layer of full-height elements above a layer of half-height elements, for total reflector height of 1.2 m (46.8 in.). The top reflector elements channel coolant flow to the active core and provide for the insertion of reserve shutdown material into the active core. They have the same array of coolant holes as the fuel element and the same holes for the insertion of reactivity control devices. The reflector below the active core has a total height of 1.6 m (62.4 in.). It consists of two layers: one layer of two half-height reflector elements above a layer of two half-height flow distribution and support elements. The bottom two elements provide for the passage of coolant from the active core into the core support area. This is accomplished by directing the coolant channel flow to the outside of the core support pedestal. The channels for the control rods and reserve shutdown material (RSS) stop at the top of the lower reflector so that neither the rods nor the RSS material can exit the core at the bottom. However, small holes are drilled through the reflector below the control rod channels so that adequate cooling is provided for the rods when they are inserted in the core or side reflectors without excessive coolant flow through these channels when the rods are withdrawn from the core. The outer side reflector includes one full row and a partial second row of hexagonal reflector columns as shown in Figure 2-2. The outer row of hexagonal elements is solid, with the
Final Report – NGNP Core Performance Analysis, Phase 1 911160/0
20
exception of the handling holes. Thirty-six of the elements in the inner row of the outer side reflector also have a control rod channel as shown in Figure 2-6. The control rod channel has a diameter of 102 mm (4 in.) and stops at an elevation just below the active core. Crushable graphite matrix at the lower end of each control rod channel will limit the load between the control rod assembly and reflector element in the event that the neutron control assembly support fails. The control rod channel is centered on the flat nearest the active core 102 mm (4.028 in.) from the center of the reflector element. The distance from the flat of the reflector block to the edge of the control rod channel is 27 mm (1.06 in.).
Figure 2-6. Reflector Control Element
Final Report – NGNP Core Performance Analysis, Phase 1 911160/0
21
The inner (central) reflector includes 61 columns of hexagonal elements. The central and side reflector columns consist of, from top down, one three-quarter height element, eleven full-height elements, one three-quarter height element, and two half-height elements, above the core support pedestal. The total reflector height for the equivalent 13.5 elements above the top of the core support pedestal is 10.7 m (421.5 in.). The dowel/socket connection at each axial element-to-element interface provides alignment for refueling and control rod channels, and transfers seismic loads from reflector elements. 2.1.7 Control Rods and Reserve Shutdown Control
Figure 2-7 shows the control rod design. The neutron absorber material consists of B4C granules uniformly dispersed in a graphite matrix and formed into annular compacts. The boron is enriched to 90 weight percent B-10 and the compacts contain 40 weight percent B4C. The compacts have an inner diameter of 52.8 mm, an outer diameter of 82.6 mm, and are enclosed in Incoloy 800H canisters for structural support. Alternatively, carbon-fiber reinforced carbon (C-C) composite canisters, or SiC, may be used for structural support. The control rod consists of a string of 18 canisters with sufficient mechanical flexibility to accommodate any postulated offset between elements, even during a seismic event.
Figure 2-7. Control Rod Design
Final Report – NGNP Core Performance Analysis, Phase 1 911160/0
22
The reserve shutdown control material consists of 40 weight percent natural boron in B4C granules dispersed in a graphite matrix and formed into pellets. The B4C granules are coated with PyC to limit oxidation and loss from the system during high temperature, high moisture events. When released into the reserve shutdown channel in the fuel element, the pellets have a packing fraction of � 0.55. The control rods are withdrawn in groups with three control rods in each group. The three control rods in each group are symmetrically located around the core, so that one rod is located in each 120° sector of the core. Figure 2-8 shows the locations of the control rod groups in a 1/3 section of the 102-column 600 MW(t) core. Control rod groups 1 through 12 in the outer reflector are the operating control rods, and groups 13 through 16 are the startup control rods. For startup from a cold condition, the control rod withdrawal sequence begins with the withdrawal of group 16 and progresses through groups 15, 14, 13, 12, 11, etc. During normal power operation, control is accomplished with only the operating control rods (the startup control rods are in the fully withdrawn position.) These rods are operated automatically on the demand signal from the Plant Control Data Instrumentation System (PCDIS) in symmetric groups, with three control rods per group. The neutron flux level is continuously monitored by the ex-vessel detectors that supply signals to the PCDIS, the Investment Protection System (IPS) and the Reactor Protection System (RPS). For a planned shutdown, the operating control rods are sequentially inserted, in the order indicated in Figure 2-8, to obtain a subcritical reactor. The I-135, Xe-135 and other radioactive nuclides will then decay, and the temperature of the core and reflectors will decrease, depending on the time dependence of the coolant flow and inlet temperature. When it is necessary to maintain a cold shutdown, the startup control rods will be inserted after a predetermined delay time. The delay time is long enough to ensure the rods would not be damaged in the event of a subsequent loss of forced core cooling.
Final Report – NGNP Core Performance Analysis, Phase 1 911160/0
23
Figure 2-8. One-third symmetrical reactor geometry model (excluding ring 9 and beyond)
Key: Blue columns = reload segment A Red columns = reload segment B Grey columns = reflector Circle w/ number = control rod bank number Circle w/o number = RSC location
Final Report – NGNP Core Performance Analysis, Phase 1 911160/0
24
2.1.8 Permanent Reflector Design
To allow for a 900°C helium outlet temperature, it was determined that direct vessel cooling is necessary and that the permanent reflector should be redesigned to have holes for helium core inlet flow [GA 2007]. The current design uses 54 coolant holes equally spaced around the reactor, each 20.32 cm (8 in.) in diameter. The volume fraction occupied by these holes (in the non-borated region of the permanent reflector) is 0.29. Neutron shielding of the reactor structural equipment consists of graphite permanent reflector elements containing a 10 cm (3.94 in.) thick borated region at the outer boundary, adjacent to the core barrel. The borated region contains B4C particles of the same design as the FBP (see lower half of Table 2-7.) As opposed to containing the particles in compacts, the current design assumes B4C particles are dispersed throughout the entire borated region, and the volume fraction the particles occupy within the borated region is 0.61. 2.2 Core Physics Methods
For multi-group cross-sections, fuel particle and fuel compact heterogeneities must be accounted for in the calculation of the microscopic cross-sections to account for shielding of resonances in the fuel kernel and in the fuel compact for cold and hot conditions. GA accounts for these heterogeneities using the MICROX code. MICROX is an integral transport theory flux spectrum code, which solves the thermalization and neutron slowing-down equations on a detailed energy grid for a two-region lattice cell [Walti 1972]. Fluxes in these two regions are coupled by collision probabilities based upon a flat flux approximation. GA uses the MICROX code to account for the rod and particle self-shielding in the calculation of multi-group and transport cross-sections. MICROX uses a model with two cylindrical regions. Region 1, which is the inner cylinder, is used to model a cylindrical fuel compact containing up to two types of particles. The cylindrical region 2, which surrounds region 1, is used to homogenize everything else in the fuel elements. Fuel particles can not be modeled in region 2. MICROX calculates a fine group spectrum, with 92 fast groups from 15 MeV down to 2.3824 eV, plus 101 thermal points from 2.38 eV down to 0.001 eV. This 193 fine group spectrum has been used to collapse the cross-section data down to 9 groups (5 fast + 4 thermal) as shown in Table 2-9.
Final Report – NGNP Core Performance Analysis, Phase 1 911160/0
25
Table 2-9. Broad Group Energy Structure
Group # Type Lower Energy (eV)
1 1.8316x10⁵ 2 961 3 17.61 4 3.9279 5
Fast
2.38 6 1.275 7 0.825 8 0.13 9
Thermal
0.001
Microscopic core cross-sections for a total of 54 different nuclides are calculated with MICROX for use in all diffusion analysis. Since there are two particle types (fissile and fertile,) two separate sets comprising of sixteen heavy metal nuclide cross-sections were developed which gives the ability to independently track the depletion of each particle type during a core burnup. A complete list of these nuclides is given in Table 2-10 where:
� NSAG35 and NSAG49 represent non-saturating aggregates from U-235 and Pu-239, respectively (these aggregates help estimate a lumped reactivity worth of the remaining fission products);
� B-10 represents the boron within the FBP; � B-Nat is natural boron; � BIMP is burnable impurities within graphite in terms of boron worth; � NBIMP is non-burnable impurities within graphite in terms of boron worth; � C-Fuel represents graphite within fuel compacts; � C-Mod represents graphite within FBP and the graphite blocks.
Note that in Table 2-10, separate carbon atom densities are given due to carbon in the fuel compacts and carbon in the graphite block to allow flexibility in modeling carbon at different temperatures.
Final Report – NGNP Core Performance Analysis, Phase 1 911160/0
26
Table 2-10. Nuclide Listing for Diffusion Calculations
Nuclide Nuclide-Type Nuclide Nuclide-Type Nuclide Nuclide-Type U-235 Heavy Metal Tc-99 Fission Product Sm-151 Fission Product U-236 Heavy Metal Rh-103 Fission Product Sm-152 Fission Product U-238 Heavy Metal Rh-105 Fission Product Eu-151 Fission Product
Np-237 Heavy Metal Ag-109 Fission Product Eu-152 Fission Product Np-239 Heavy Metal Ag-110m Fission Product Eu-153 Fission Product Pu-238 Heavy Metal I-135 Fission Product Eu-154 Fission Product Pu-239 Heavy Metal Xe-131 Fission Product Eu-155 Fission Product Pu-240 Heavy Metal Xe-135 Fission Product NSAG35 Fission Product Pu-241 Heavy Metal Cs-133 Fission Product NSAG49 Fission Product Pu-242 Heavy Metal Cs-134 Fission Product B-10 Structural Am-241 Heavy Metal Cs-136 Fission Product B-Nat Structural
Am-242m Heavy Metal Nd-143 Fission Product BIMP Structural Am-243 Heavy Metal Nd-145 Fission Product NBIMP Structural Cm-242 Heavy Metal Pm-147 Fission Product Silicon Structural Cm-243 Heavy Metal Pm-148m Fission Product Oxygen Structural Cm-244 Heavy Metal Pm-148g Fission Product C-Fuel Structural Kr-83 Fission Product Sm-149 Fission Product C-Mod Structural Mo-95 Fission Product Sm-150 Fission Product Hydrogen Structural
For hot conditions, core cross-sections for the nuclides associated with the fuel compacts were performed at 1130 K, while the graphite blocks were performed at 1080 K. The methods applied in generating core cross-sections do not take into account any direct temperature feedback. Instead, only one set of core cross-sections at a specified temperature is used for hot conditions for diffusion burnup calculations for all time points from BOIC to end of equilibrium cycle (EOEC.) The set applied was derived from a BOIC core spectrum. As explained in [Ellis 2009], this is a reasonable assumption and also conservative from the standpoint of fuel cycle length. A detailed discussion how these nuclides were processed for the 2D and 3D models, how impurities within the graphite were modeled and how self-shielding factors were applied, are given in [Ellis 2009]. Two-dimensional diffusion burnup calculations were performed with the GA code GAUGE based upon a triangular spatial mesh [Archibald 1983]. In GAUGE, a single fuel column (called a
Final Report – NGNP Core Performance Analysis, Phase 1 911160/0
27
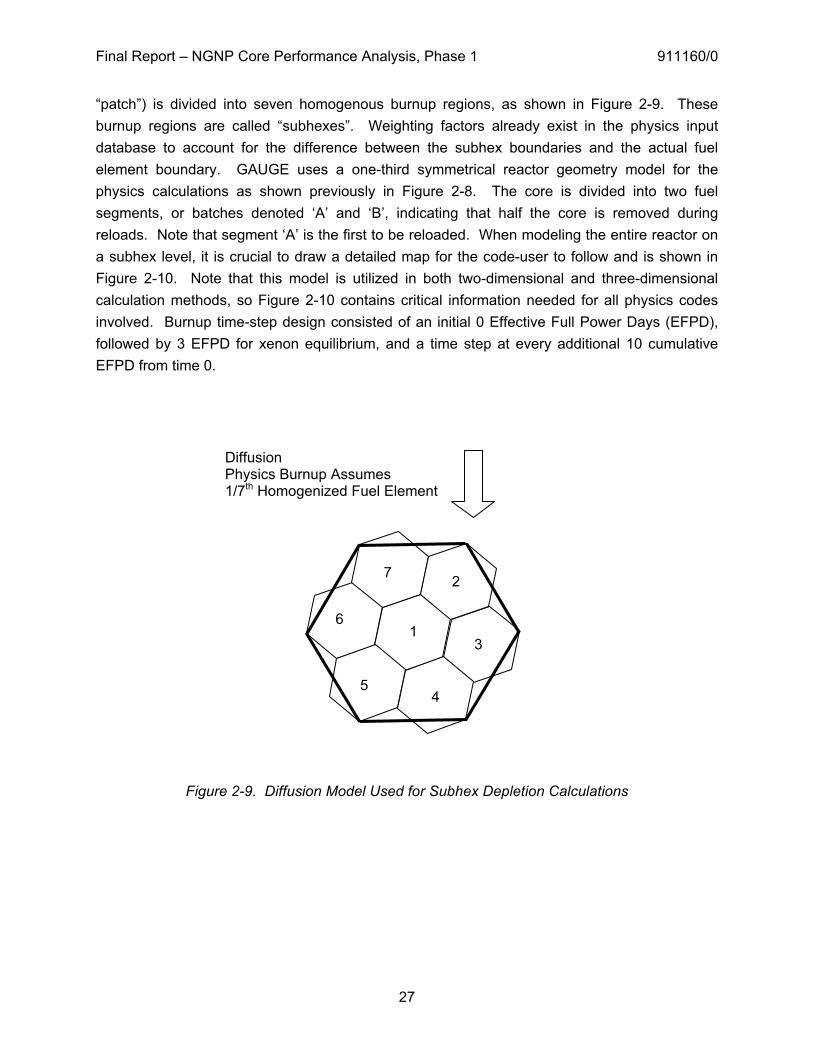
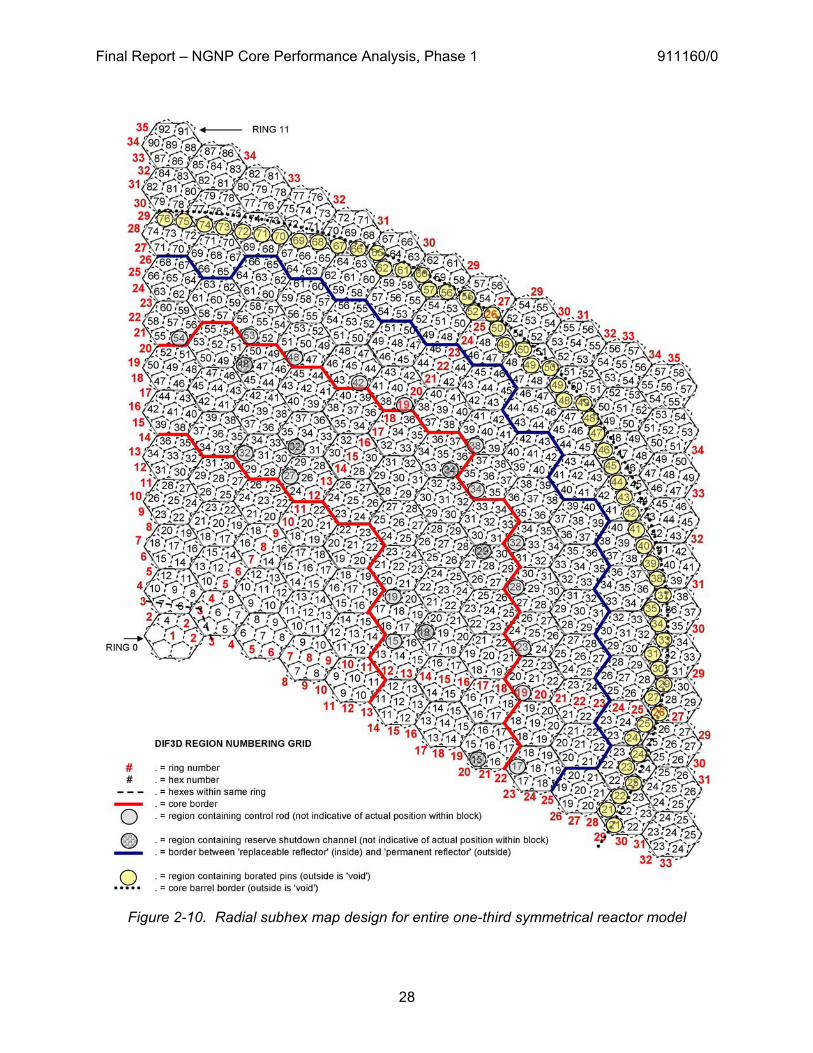
“patch”) is divided into seven homogenous burnup regions, as shown in Figure 2-9. These burnup regions are called “subhexes”. Weighting factors already exist in the physics input database to account for the difference between the subhex boundaries and the actual fuel element boundary. GAUGE uses a one-third symmetrical reactor geometry model for the physics calculations as shown previously in Figure 2-8. The core is divided into two fuel segments, or batches denoted ‘A’ and ‘B’, indicating that half the core is removed during reloads. Note that segment ‘A’ is the first to be reloaded. When modeling the entire reactor on a subhex level, it is crucial to draw a detailed map for the code-user to follow and is shown in Figure 2-10. Note that this model is utilized in both two-dimensional and three-dimensional calculation methods, so Figure 2-10 contains critical information needed for all physics codes involved. Burnup time-step design consisted of an initial 0 Effective Full Power Days (EFPD), followed by 3 EFPD for xenon equilibrium, and a time step at every additional 10 cumulative EFPD from time 0.
Figure 2-9. Diffusion Model Used for Subhex Depletion Calculations
Diffusion Physics Burnup Assumes 1/7th Homogenized Fuel Element
1 3
4 5
6
7 2
Final Report – NGNP Core Performance Analysis, Phase 1 911160/0
28
Figure 2-10. Radial subhex map design for entire one-third symmetrical reactor model
Final Report – NGNP Core Performance Analysis, Phase 1 911160/0
29
A critical feature GAUGE has is its ability to determine the operating control rod sequence during normal operation. Based on the user providing a desired K-effective range and the control rod bank sequence pattern, GAUGE will calculate which control rod banks are fully inserted, fully withdrawn, and which bank (if needed) is partially inserted. GAUGE calculates these positions at every burnup time-step. Three-dimensional diffusion burnup calculations were performed with a combination of two codes: the commercial (Argonne National Laboratory) code DIF3D, Version 6.0 [Derstine 1984] and the GA code BURP [Sherman 1993a]. DIF3D solves the multigroup diffusion theory eigenvalue, adjoint, fixed source and criticality problems in 1, 2, and 3 space dimensions for orthogonal (rectangular or cylindrical), triangular, and hexagonal geometries. The solution flux file from DIF3D is then used by BURP to perform nuclide depletion calculations. This cycle of calculations is then repeated at many time-steps to simulate reactor operation. Similar to GAUGE, DIF3D uses the same depletion model and one-third symmetrical reactor geometry model previously shown in Figures 2-8, 2-9 and 2-10. The main difference is that the axial design of the reactor is also taken into account within DIF3D, and includes the top and bottom reflectors. The axial extent of a DIF3D core region is over the length of a single fuel element. The control rod bank insertion/withdrawal pattern determined by GAUGE as a function of burnup time-step is read into a curve-fit of the three-dimensional s-curve and used to build control rod position files for the BURP model. 2.3 Core Physics Results
2.3.1 Fuel Cycle Description
Each standard element contains 3,126 fuel compacts, and each control element and RSC element contains 2,766 fuel compacts. Each compact contains fissile and fertile particles. Each particle contains a kernel of UC0.5O1.5 and coatings of carbon and silicon. The fissile kernels use 19.7974 weight % enriched uranium, while natural uranium is used in the fertile kernels. The fuel cycle uses two reload segments, so that 51 of the 102 columns core (half of the core) are replaced each reload. The control rod pattern (12 control rods in the core and 36 control rods in the outer reflector) allows refueling by 1/6 core sectors. The refueling operation is performed one sector at a time. Each refueling sector thus contains 17 core columns, with 10 fuel elements per column. In refueling each of the six refueling core sectors, the sector elements are removed one layer at a time until all of the core elements in the sector have been removed. Fresh reload elements and one cycle old elements are then reloaded into the sector. Thus, all 1020 core elements are removed from the reactor each reload, and the 510 two-cycle-
Final Report – NGNP Core Performance Analysis, Phase 1 911160/0
30
old elements are reinserted with 510 fresh reload elements. Current core calculations assume that fuel elements are not shuffled axially or radially during the refueling process. Ten days are allowed for refueling. As required for this core performance analysis, the fuel cycle length was chosen to be 18 months (1.5 years), and the availability factor was selected to be 98.6%, which includes refueling time. The nominal cycle time is thus 365.25 x 1.5 x 0.986 = 540 effective full power days (EFPD). The fuel cycle design is summarized in Table 2-11, and was determined after several design iterations from two-dimensional analysis. The optimization strategy used for the fuel cycle keeps the fissile and fertile loadings constant for every reload, but allows the FBP loadings and the cycle time to vary to obtain the required K-effective at the end of each cycle. The advantages of this strategy are:
1. The fissile and fertile loadings for all reloads are identical. This will greatly simplify core nuclear analysis and fuel production, and will make reload fuel blocks much more interchangeable.
2. A reasonable � K-eff over each cycle can be achieved. This allows the maximum control rod worth requirement to be a small as possible.
Equilibrium 540 18 2132.754 628.017 1.5 1.021 The effective core enrichments for the initial core and reload cycles are 10.9% and 15.5%, respectively. Based on the fissile and fertile loadings for each cycle in Table 2-11, the heavy metal loadings (Table 2-12) and average GAUGE core region atom densities (Table 2-13) were calculated for the initial core and reload segments. Table 2-13 includes atom densities for B-10 resulting from burnable and non-burnable impurities in the graphite. Table 2-13 also includes the beginning-of-initial-cycle (BOIC) and reload-atom densities for B-10 resulting from the FBP compacts.
Final Report – NGNP Core Performance Analysis, Phase 1 911160/0
Carbon (in fuel) 1.53109x10⁻² 1.57857x10⁻² 1.5486x10⁻² Carbon (in moderator) 5.2232x10⁻² 5.23767x10⁻² 5.22311x10⁻² Oxygen 3.21444x10⁻⁴ 2.16795x10⁻⁴ 2.29992x10⁻⁴ Silicon 5.91608x10⁻⁴ 5.38387x10⁻⁴ 5.71158x10⁻⁴
The average fuel burnup in each cycle is given in Table 2-14 in megawatt-days per initial metric ton (MWd/MT) of fissile plus fertile uranium in each reload segment. The denominator term in the calculation of the fissions per initial metal atom (FIMA) includes all heavy metal atoms in the reload segment, and was calculated with SORT3D [Sherman 1993b]. The denominator term in the calculation of the fissions per initial fissile atom (FIFA) includes all U-235 atoms in the reload segment. This table shows that the average FIMA in the fissile particles in the equilibrium cycle is 0.122.
Final Report – NGNP Core Performance Analysis, Phase 1 911160/0
Power distributions are controlled to limit fuel temperature, to limit fuel element stress, and to assure axial stability. The principal means of power distribution control is the use of axial and radial zones of differing concentrations of LEU, NU and FBP. The current zoning scheme consists of three radial zones and three axial zones. The three radial zones correspond to the three annular core rings containing 30, 36 and 36 columns per ring as seen in Figure 2-2. The three axial zones correspond to the top three layers, bottom three layers, and the remaining middle four layers. Fuel radial zoning is given another level of detail with buffer zoning factors. These regions apply along all sides directly adjacent to a reflector (both inner and outer) element and extend to only the first 4-columns. These factors reduce the relative fuel loading to help minimize and fine tune power peaking typically seen at these interfaces. Another important consideration related to fuel zoning factors is the fuel particle packing fraction in the fuel compacts. The current zoning factors and fuel loadings result in acceptable particle packing fractions, i.e., an average of 30% for the initial core and 30.2% for reloads. The maximum packing fraction is calculated to be 33.7% for segment A of the initial core. The maximum packing fraction of hard spheres of the same diameter is 74% for a cubic or hexagonal close packed array. The upper limit of the packing fraction of hard spheres of the same diameter placed randomly in a volume is about 60%. The maximum total packing fraction of fissile and fertile particles in a fuel compact assigned for this NGNP core performance analysis is 35%. The maximum design packing fraction of 33.7% is within this requirement, and occurs in 12.2% of all fuel compacts within the core. A full description of the fuel zoning and packing fraction details can be found in [Ellis 2009].
Final Report – NGNP Core Performance Analysis, Phase 1 911160/0
33
2.3.3 Steady State Power Distributions
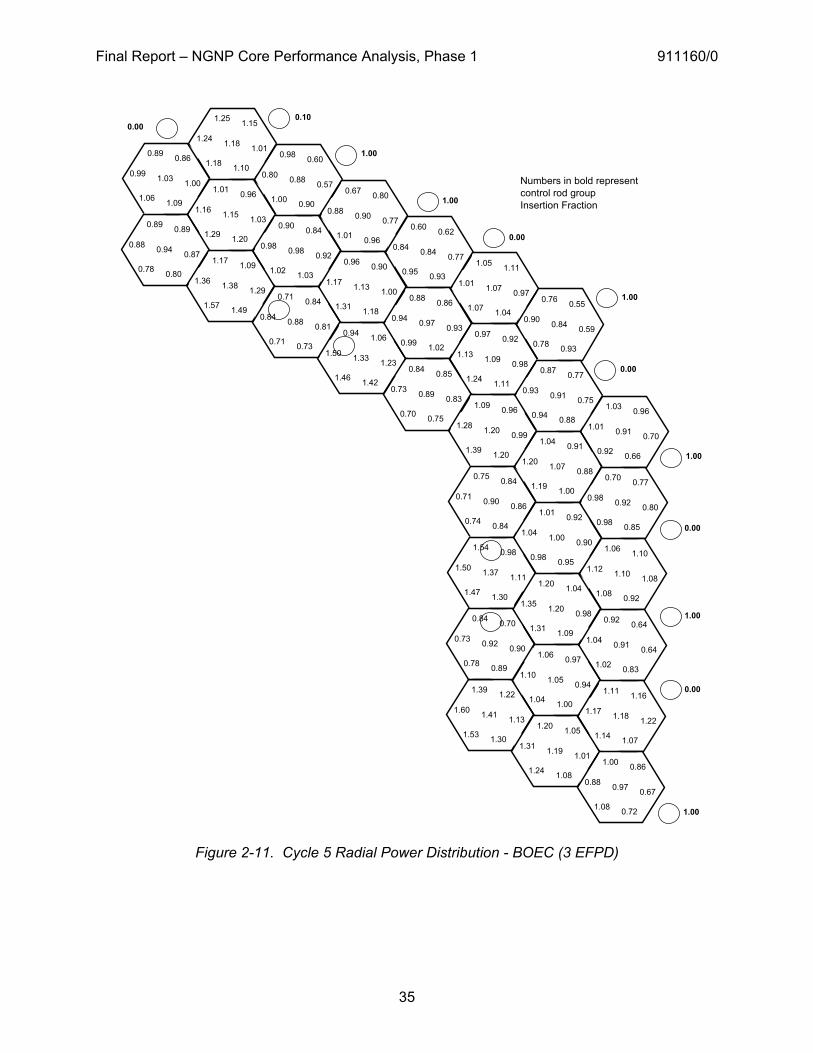
Results of the 3Dimensional DIF3D hexagonal mesh diffusion calculations are used to create the power distributions as a function of burnup in this section. Note that DIF3D results (as opposed to GAUGE) was chosen here since the input to the fuel performance analysis directly comes from DIF3D output. Table 2-15 summarizes the radial power history data for the equilibrium cycle from the DIF3D fuel depletion calculation with control rod search. Data is given for each time point during the equilibrium cycle, and includes the core ring (row) peaking factor and the radial peaking factor (RPF) for the maximum subhex region normalized by the number of fuel compacts within the subhex. Also given is the number of inserted control rod groups needed for a near-critical reactor and the K-eff obtained with those rods inserted. Each control rod group includes three control rods spaced symmetrically around the core. Note that the ‘Col_Sub’ column displays two pieces of information. ‘Col’ refers to the core column number in a 1/3 core sector ranging from 1 to 10 for row 1, 11 to 22 for row 2, and 23 to 34 for row 3. This is in a clockwise direction using Figure 2-8 as a guide. ‘Sub’ refers to the subhex number, using Figure 2-9 as a guide. Also note that the order of subhexes 2 through 7 rotates 60° for every 1/6 core sector. The zero day power and critical rod group data are based on a hypothetical 100% power level, but with no xenon buildup. Since this condition is unrealistic, the data given for the 3.0 day burnup is actually more representative of the expected beginning of equilibrium cycle conditions. As shown, the middle region of fuel columns has been zoned to run at higher than average power density, while the inner and outer zones run at somewhat lower power density so that power peaking at the two core-reflector interfaces is minimized. The radial power distribution and operating control rod pattern for the beginning, middle and end of the equilibrium cycle (BOEC, MOEC and EOEC, respectively) calculated in the DIF3D depletion are given in Figures 2-11, 2-12, and 2-13. These figures give the RPF for each of the seven hexagonal subhex regions. The calculated RPF is for each entire subhex region, and varies over the burnup cycle due to the effects of fuel depletion and the location of the operating control rods. As for the axial power factors (APF) for each DIF3D axial region, or core layer, they are generally kept below 1.4. During the initial physics calculations, as a design guideline, the APF is kept at or below 1.6 at any point during the approach to equilibrium cycle. This simplifies further zoning changes and minimizes the number of iterations required to reach an optimized design.
Final Report – NGNP Core Performance Analysis, Phase 1 911160/0
34
Table 2-15. DIF3D Radial Power Results for Equilibrium Cycle
Time Point
Delta EFPD
Control Rod Banks Inserted K-eff Row 1 Row 2 Row 3 Col_Sub RPF1
Final Report – NGNP Core Performance Analysis, Phase 1 911160/0
35
1.18
1.18 1.10
1.24
1.151.25
1.01
0.88
1.00 0.90
0.80
0.600.98
0.57
0.90
1.01 0.96
0.88
0.800.67
0.77
0.84
0.95 0.93
0.84
0.620.60
0.77
1.07
1.07 1.04
1.01
1.111.05
0.97
0.84
0.78 0.93
0.90
0.550.76
0.59
1.03
1.06 1.09
0.99
0.860.89
1.00
0.94
0.78 0.80
0.88
0.890.89
0.87
1.15
1.29 1.20
1.16
0.961.01
1.03
1.38
1.57 1.49
1.36
1.091.17
1.29
0.98
1.02 1.03
0.98
0.840.90
0.92
1.13
1.31 1.18
1.17
0.900.96
1.00
0.97
0.99 1.02
0.94
0.860.88
0.93
0.89
0.70 0.75
0.73
0.850.84
0.83
1.09
1.24 1.11
1.13
0.920.97
0.98
0.91
0.94 0.88
0.93
0.770.87
0.75
1.20
1.39 1.20
1.28
0.961.09
0.99
1.07
1.19 1.00
1.20
0.911.04
0.88
0.91
0.92 0.66
1.01
0.961.03
0.70
0.92
0.98 0.85
0.98
0.770.70
0.800.90
0.74 0.84
0.71
0.840.75
0.86
1.00
0.98 0.95
1.04
0.921.01
0.90
1.10
1.08 0.92
1.12
1.101.06
1.08
1.20
1.31 1.09
1.35
1.041.20
0.98
0.91
1.02 0.83
1.04
0.640.92
0.64
1.05
1.04 1.00
1.10
0.971.06
0.94
1.41
1.53 1.30
1.60
1.221.39
1.13
1.19
1.24 1.08
1.31
1.051.20
1.01
1.18
1.14 1.07
1.17
1.161.11
1.22
0.97
1.08 0.72
0.88
0.861.00
0.67
0.88
0.71 0.73
0.84
0.840.71
0.81
1.33
1.46 1.42
1.50
1.060.94
1.23
1.37
1.47 1.30
1.50
0.981.54
1.11
0.92
0.78 0.89
0.73
0.700.84
0.90
0.00
Numbers in bold representcontrol rod groupInsertion Fraction
0.10
1.00
1.00
0.00
1.00
0.00
1.00
0.00
1.00
0.00
1.00
Figure 2-11. Cycle 5 Radial Power Distribution - BOEC (3 EFPD)
Final Report – NGNP Core Performance Analysis, Phase 1 911160/0
36
1.11
1.12 1.06
1.12
1.041.08
0.97
0.82
0.91 0.83
0.73
0.550.88
0.54
0.87
1.00 0.94
0.86
0.750.65
0.76
0.81
0.91 0.91
0.80
0.590.58
0.74
1.10
1.12 1.10
1.05
1.061.03
1.01
0.90
0.83 1.01
0.93
0.580.75
0.65
0.91
0.94 0.96
0.88
0.750.76
0.89
0.79
0.66 0.64
0.78
0.780.78
0.77
1.08
1.23 1.16
1.11
0.930.97
1.01
1.25
1.18 1.20
1.17
1.071.13
1.20
0.89
0.93 0.93
0.89
0.780.82
0.85
1.11
1.29 1.20
1.17
0.900.96
1.02
0.92
0.95 0.97
0.90
0.840.85
0.90
0.76
0.53 0.62
0.63
0.790.78
0.78
1.15
1.31 1.23
1.19
1.011.03
1.10
1.01
1.03 1.02
0.99
0.850.95
0.88
1.26
1.27 1.28
1.21
1.091.17
1.13
1.28
1.38 1.25
1.38
1.171.25
1.18
1.44
1.37 1.39
1.37
1.411.37
1.47
1.31
1.21 1.09
1.24
1.501.06
1.140.81
0.63 0.82
0.56
0.850.68
0.87
1.07
1.04 1.01
1.08
1.051.08
1.01
1.29
1.21 1.05
1.31
1.351.33
1.23
1.28
1.36 1.16
1.43
1.161.33
1.07
0.91
0.99 0.80
1.03
0.680.96
0.63
0.98
0.98 0.92
1.02
0.931.00
0.89
1.30
1.24 1.22
1.21
1.201.21
1.12
1.13
1.20 1.05
1.27
1.041.18
0.98
1.15
1.11 1.02
1.17
1.101.13
1.11
0.87
0.94 0.63
0.79
0.760.92
0.60
0.72
0.51 0.57
0.69
0.750.62
0.72
1.26
1.16 1.20
1.31
1.090.94
1.21
1.37
1.27 1.31
1.24
1.061.44
1.22
0.78
0.61 0.79
0.55
0.660.73
0.82
0.00
Numbers in bold representcontrol rod groupInsertion Fraction
0.00
1.00
1.00
0.00
1.00
0.00
0.00
0.00
1.00
0.00
1.00
Figure 2-12. Cycle 5 Radial Power Distribution - MOEC (270 EFPD)
Final Report – NGNP Core Performance Analysis, Phase 1 911160/0
37
1.36
1.32 1.30
1.26
1.221.20
1.25
1.19
1.12 1.14
0.94
1.011.19
1.09
1.42
1.32 1.33
1.37
1.411.46
1.33
1.20
1.12 1.12
1.16
1.071.17
1.03
1.36
1.28 1.29
1.33
1.291.33
1.26
1.16
0.92 1.15
1.10
0.980.97
1.00
0.95
0.94 0.95
0.96
0.830.83
0.94
0.65
0.51 0.49
0.67
0.710.71
0.65
1.13
1.17 1.16
1.14
1.101.09
1.12
0.99
0.75 0.82
0.86
0.991.00
0.99
0.92
0.87 0.89
0.91
0.930.93
0.92
1.17
1.21 1.19
1.19
1.111.13
1.13
0.91
0.87 0.89
0.90
0.920.92
0.91
0.58
0.36 0.44
0.47
0.680.65
0.63
1.14
1.18 1.16
1.15
1.101.09
1.13
0.97
0.94 0.96
0.95
0.860.97
0.85
1.01
0.86 1.00
0.88
0.991.00
0.99
1.14
1.17 1.12
1.18
1.101.14
1.10
1.39
1.31 1.28
1.34
1.271.32
1.28
1.18
1.12 1.01
1.12
1.270.96
0.960.58
0.42 0.61
0.36
0.660.49
0.68
0.91
0.87 0.90
0.87
0.930.91
0.92
1.39
1.31 1.33
1.30
1.331.33
1.36
1.16
1.17 1.12
1.19
1.111.17
1.10
1.19
1.11 1.02
1.10
1.171.14
1.07
0.90
0.88 0.89
0.86
0.910.89
0.90
0.98
0.83 0.99
0.74
0.980.83
0.98
1.12
1.15 1.12
1.17
1.081.13
1.08
1.34
1.27 1.23
1.27
1.321.32
1.26
1.14
1.12 0.97
0.91
0.951.09
0.96
0.57
0.36 0.43
0.53
0.670.53
0.61
0.99
0.75 0.82
0.96
1.000.82
0.99
0.98
0.81 0.98
0.74
0.810.95
0.99
0.56
0.42 0.61
0.36
0.520.52
0.66
0.00
Numbers in bold representcontrol rod groupInsertion Fraction
0.00
0.00
0.00
0.00
0.10
0.00
0.00
0.00
0.00
0.00
0.00
Figure 2-13. Cycle 5 Radial Power Distribution - EOEC (540 EFPD)
Final Report – NGNP Core Performance Analysis, Phase 1 911160/0
38
The axial power profiles and operating control rod pattern for every burnup time point of the equilibrium cycle calculated in the DIF3D depletion are given in Figures 2-14 through 2-20. These figures give the axial power factor (APF) for each DIF3D axial region, or core layer. Generally APF is kept below 1.4. The APF does not exceed 1.6 at any point during the approach to equilibrium cycle.
0.00
0.20
0.40
0.60
0.80
1.00
1.20
1.40
1.60
0 1 2 3 4 5 6 7 8 9 10
Axial Fuel Layer (core top = 0)
Rel
ativ
e Po
wer
3 Days - 6.1 Rod Groups Inserted10 Days - 6.1 Rod Groups Inserted20 Days - 6.1 Rod Groups Inserted30 Days - 6.1 Rod Groups Inserted40 Days - 6.1 Rod Groups Inserted50 Days - 6.1 Rod Groups Inserted60 Days - 6.1 Rod Groups Inserted70 Days - 6.1 Rod Groups Inserted80 Days - 6.1 Rod Groups Inserted
Figure 2-14. Cycle 5 Axial Power Profiles – BOEC to 80 EFPD
Final Report – NGNP Core Performance Analysis, Phase 1 911160/0
39
0.00
0.20
0.40
0.60
0.80
1.00
1.20
1.40
1.60
0 1 2 3 4 5 6 7 8 9 10
Axial Fuel Layer (core top = 0)
Rel
ativ
e Po
wer
90 Days - 6.1 Rod Groups Inserted100 Days - 6.1 Rod Groups Inserted110 Days - 6.1 Rod Groups Inserted120 Days - 6.1 Rod Groups Inserted130 Days - 6.1 Rod Groups Inserted140 Days - 6.1 Rod Groups Inserted150 Days - 6 Rod Groups Inserted160 Days - 5.7 Rod Groups Inserted170 Days - 5.6 Rod Groups Inserted
Figure 2-15. Cycle 5 Axial Power Profiles – 90 EFPD to 170 EFPD
0.00
0.20
0.40
0.60
0.80
1.00
1.20
1.40
1.60
0 1 2 3 4 5 6 7 8 9 10
Axial Fuel Layer (core top = 0)
Rel
ativ
e Po
wer
180 Days - 5.6 Rod Groups Inserted190 Days - 5.5 Rod Groups Inserted200 Days - 5.5 Rod Groups Inserted210 Days - 5.4 Rod Groups Inserted220 Days - 5.3 Rod Groups Inserted230 Days - 5.3 Rod Groups Inserted240 Days - 5.2 Rod Groups Inserted250 Days - 5.2 Rod Groups Inserted260 Days - 5.1 Rod Groups Inserted
Figure 2-16. Cycle 5 Axial Power Profiles – 180 EFPD to 260 EFPD
Final Report – NGNP Core Performance Analysis, Phase 1 911160/0
40
0.00
0.20
0.40
0.60
0.80
1.00
1.20
1.40
1.60
0 1 2 3 4 5 6 7 8 9 10
Axial Fuel Layer (core top = 0)
Rel
ativ
e Po
wer
270 Days - 5 Rod Groups Inserted280 Days - 4.5 Rod Groups Inserted290 Days - 4.5 Rod Groups Inserted300 Days - 4.4 Rod Groups Inserted310 Days - 4.2 Rod Groups Inserted320 Days - 4 Rod Groups Inserted330 Days - 4 Rod Groups Inserted340 Days - 3.5 Rod Groups Inserted
Figure 2-17. Cycle 5 Axial Power Profiles – 270 EFPD to 340 EFPD
0.00
0.20
0.40
0.60
0.80
1.00
1.20
1.40
1.60
0 1 2 3 4 5 6 7 8 9 10
Axial Fuel Layer (core top = 0)
Rel
ativ
e Po
wer
350 Days - 3.3 Rod Groups Inserted360 Days - 3.2 Rod Groups Inserted370 Days - 3.1 Rod Groups Inserted380 Days - 2.7 Rod Groups Inserted390 Days - 2.6 Rod Groups Inserted400 Days - 2.4 Rod Groups Inserted410 Days - 2.4 Rod Groups Inserted420 Days - 2.3 Rod Groups Inserted
Figure 2-18. Cycle 5 Axial Power Profiles – 350 EFPD to 420 EFPD
Final Report – NGNP Core Performance Analysis, Phase 1 911160/0
41
0.00
0.20
0.40
0.60
0.80
1.00
1.20
1.40
1.60
0 1 2 3 4 5 6 7 8 9 10
Axial Fuel Layer (core top = 0)
Rel
ativ
e Po
wer
430 Days - 2.2 Rod Groups Inserted440 Days - 2.1 Rod Groups Inserted450 Days - 2.1 Rod Groups Inserted460 Days - 1.7 Rod Groups Inserted470 Days - 1.5 Rod Groups Inserted480 Days - 1.4 Rod Groups Inserted490 Days - 1.2 Rod Groups Inserted500 Days - 1.1 Rod Groups Inserted
Figure 2-19. Cycle 5 Axial Power Profiles – 430 EFPD to 500 EFPD
0.00
0.20
0.40
0.60
0.80
1.00
1.20
1.40
1.60
0 1 2 3 4 5 6 7 8 9 10
Axial Fuel Layer (core top = 0)
Rel
ativ
e Po
wer
510 Days - 1 Rod Groups Inserted520 Days - 0.5 Rod Groups Inserted530 Days - 0.2 Rod Groups Inserted540 Days - 0.1 Rod Groups Inserted
Figure 2-20. Cycle 5 Axial Power Profiles - 510 EFPD to 540 EFPD
Final Report – NGNP Core Performance Analysis, Phase 1 911160/0
42
2.4 Core Physics Summary
A complete 3D core physics design through equilibrium burnup on the binary fuel particle system has been achieved for Phase 1 of the NGNP core performance analysis. The design meets the following requirements from Table 1-1:
� Core power of 600 MW(t) � Fuel cycle length of 18 months (540 EFPD) � Maximum TRISO PF of 35% (current design is 1.3% under this requirement and
includes localized zoning) The core physics design optimization iterations planned for Phase 2 will address the maximum time-averaged fuel temperature guideline of 1250°C based on feedback from the Phase 1 SURVEY/TRAFIC-FD results (see Section 4). Fuel zoning design shall then be altered as needed. Fortunately there appears to be some additional margin on packing fraction for more optimal iterations if necessary. In addition, there are some modeling margins which can also be taken advantage of. These include better optimization of the B4C loading and finer detail in the DIF3D calculation model.
Final Report – NGNP Core Performance Analysis, Phase 1 911160/0
43
3 COMPUTER CODE VERIFICATION
The GA physics codes used in core design have been run previously on a DecAlpha UNIX platform, but this computing platform is now longer available. Consequently, it was necessary to port the codes from the DecAlpha UNIX platform to the SGI ALTIX supercomputer platform and to verify that they run correctly on the new platform. The physics codes that have been verified for running on the SGI ALTIX platform include:
� MICROX � GAUGE � BURP � DIF3D � SORT3D
The GA codes to be used for the fuel performance and fission product release and transport analysis also had to be ported to the SGI ALTIX supercomputer and verified for running on that computing platform. These codes include:
*Note: POKE was incorporated into SURVEY and was verified as part of SURVEY In addition to porting and verifying the above codes for running on the SGI ALTIX platform, it was also necessary to extensively modify and update the SORT3D and SURVEY codes. The activities performed to verify the above codes, with the exception of SURVEY (including POKE) are discussed in this section. The work performed to update and verify the SURVEY (with POKE) code is discussed in Section 4. 3.1 Verification of the Physics Computer Codes
A procedure was developed in consultation with GA QA staff for verifying the MICROX, GAUGE, BURP, DIF3D, and SORT3D, physics codes for operation on the SGI Altix 3000 supercomputer. A template for documenting the verification was also developed and used to document the results for each code. The verification procedure meets the requirements of NQA-1 2000, Req. 3, Section 400 & 800, Req. 11, Section 400, and Subpart 2.7. An outline of
Final Report – NGNP Core Performance Analysis, Phase 1 911160/0
44
this procedure is as follows:
� The source code was copied from DecAlpha platform to the Altix platform. � The code was compiled and linked using the Intel Fortran 90 compiler on the Altix. � Any problems with the code compilation due to compiler differences and language
constructions, which do not comply with the Fortran 90, were corrected. � The verification sample problem was copied from the DecAlpha to the Altix. � A Unix shell script was generated to perform the following:
o Run the sample problem on the Altix and capture the ASCII output file. o Run the Unix DIFF editing utility to create a difference file which compares, on a
line by line basis, the ASCII text output file created by the sample problem on the Altix to the results previously obtained on the DecAlpha computer.
o Give the output file a unique name which describes the files being compared. � Edit the difference file to remove lines which have Time, Date, or CPU time differences
since these differences are to be expected. � Review in detail the remaining differences line by line. Differences in the least
significant digits are considered to be acceptable. If the difference is more significant, then investigate the context in the original output file where the difference occurred.
� Create a readme file which explains the testing performed and describes the difference.xxx file created by the run.
� Document the results using the document template developed for this process. 3.1.1 MICROX Code Verification
MICROX [Walti 1972] is an integral transport theory flux spectrum code used to generate broad group cross sections for specified nuclides in a particular reactor spectrum. MICROX solves the neutron slowing down and thermalization equations on a detailed energy grid for a two-region lattice cell. The fluxes in the two regions are coupled by collision probabilities. The computation of these probabilities is based upon the spatially flat neutron emission approximation and the transport (modified Po) approximation of anisotropic scattering effects. The collision probability calculation also uses an energy dependent Dancoff correction factor algorithm. A second level of heterogeneity can also be treated (i.e., the inner region may include two different types of grains or particles). Neutron leakage effects are treated by performing B1 slowing down theory (fast and resonance-energy ranges), or Po plus DB2 thermalization (thermal-energy range) calculations in each spatial region. Energy-dependent bucklings are supplied as input. The MICROX code was verified by running a sample problem using the procedure listed above. Other than differences in the time at which both runs were made and the CPU run times on the two platforms, the line by line comparison showed changes only in the least significant digits in
Final Report – NGNP Core Performance Analysis, Phase 1 911160/0
45
the output of the comparison between the two runs. For example, consider the following DIFF output comparison of lines 1191 and 1192 of the output cases:
The first line lists the lines in the DecAlpha and Altix test run outputs that are being compared and that have differences. In this case it is lines 1191 and 1192 in both outputs. The next two lines list the specific Altix outputs from the two cases (line 4 is a spacer line), and the last two lines list the corresponding output from the DecAlpha run. As can be seen, the difference between the two cases is in the last digit (least significant) of the last number listed in line 1191 (4.20137E-02 and 4.20136E-02), and in the least significant digits of the fifth number in line 1192 (5.53289E-01 and 5.53290E-01). These small changes are most probably due to the different algorithms used to process the data on the CPUs on the two platforms. Thus, it is concluded that the MICROX code has been successfully verified for operation on the new platform. Details of the verification procedure and results are given in [MICROX 2008].
3.1.2 GAUGE Code Verification
GAUGE [Archibald 1983] is a two-dimensional, few-neutron-group, neutron diffusion-depletion program for triangular mesh geometry reactor models. It can be used to calculate fuel burnup histories for large reactors with a hexagonal core configuration; and it is extensively used for reactor physics scoping studies on the Modular Helium Reactor (MHR) core design work. The GAUGE code was verified by running sample problems using the verification procedure listed above. Other than the time and CPU speed differences, the line by line comparison of the output from the sample problems showed either no changes or insignificant changes in the results from both platforms. A typical comparison of the non-time differences in the two test problem outputs, in this case line 71835 in the output, is shown below: 71835c71909 < 60 3.76550E-04 8.51019E-03 8.88675E-03 0.00000E+00 0.00000E+00 0.00000E+00 10.013 --- > 60 3.76550E-04 8.51021E-03 8.88676E-03 0.00000E+00 0.00000E+00 0.00000E+00 10.013 Here the only change is in the least significant decimal places in the third and fourth numbers in the output lines. Thus, it is concluded that the GAUGE code has been successfully verified for operation on the new platform. Details of the verification procedure and results are given in
Final Report – NGNP Core Performance Analysis, Phase 1 911160/0
46
[GAUGE 2008]. 3.1.3 BURP Code Verification
BURP (Burnup Replacement Package) [Sherman 1993a] is a macroscopic cross section generation and nuclide depletion code developed in house at GA to provide reactor core nuclide depletion capability when used in tandem with the existing, static, three dimensional diffusion models in DIF3D. The primary purpose of BURP is to provide burnup capability for 3D reactor models using the nodal solution method in DIF3D; although 1D and 2D DIF3D models will also interface properly. The code accepts DIF3D output and uses it to perform a nuclide burnup over a defined interval, then provides input for a static DIF3D static diffusion calculation based on the changes in nuclide densities occurring during the burnup time. A line by line comparison of the test problem run on both platforms showed no changes in the output from the two runs except for a difference in the time at which the runs were made; thus, it is concluded that the BURP code has been successfully verified for operation on the new platform. Details of the verification procedure and results are given in [BURP 2008]. 3.1.4 DIF3D Code Verification
DIF3D [Derstine 1984] is a computer code developed at Argonne National Laboratory (ANL) as a nodal method to solve the neutron diffusion equations in two- and three-dimensional hexagonal geometries. The current DIF3D is an extension of the original ANL finite-difference, diffusion-theory code DIF3D [Lawrence 1983]. DIF3D is primarily used at GA in combination with the BURP code to perform fuel burnup calculations on MHR designs. As shown in the examples discussed for the previous codes, most of the non-time setting, or non CPU speed, differences are insignificant. They occurred in the least significant digits of the output quantities, and are well within expected tolerances. In the case where the differences were larger, the numbers were compared to the original output files and were found to be associated with a balance between neutron flux in and neutron flux out of the computational cells, i.e., the small difference between two large numbers. The calculated differences are very small compared to the flux values used in the calculation and do not have a significant effect on the results. Thus, it is concluded that the DIF3D code has been successfully verified for operation on the new platform. Details of the verification procedure and results are given in [DIF3D 2008].
Final Report – NGNP Core Performance Analysis, Phase 1 911160/0
47
3.1.5 SORT3D Code Verification
The function of SORT3D [SORT3D 1994] is to process 3D model power, neutron flux, and nuclide number density data, from DIF3D/BURP to a form suitable for use in the SURVEY [Hudritsch 1984] fuel performance code. The SORT3D code produces binary SURVEY input files in a structure similar to the "power" and "flux" files created by TSORT [Archibald 1977]. The new "SURVEY" files produced by SORT3D incorporate all the necessary data from the old TSORT "power" and "flux" files along with the unique 3D data generated with DIF3D/BURP. The use of true 3D nuclear data substantially increases the accuracy of the SURVEY code's results, especially for the newer fuel placement MHR core designs. Except for time-of-run differences, and the title line, which was not converted from the Altix run binary input correctly by the translator program, all differences in the line-by-line comparison from the DIFF utility run are in the least significant figures in some of the output numbers. For example, consider the comparison of line 351 in the DIFF output: 351c351< fma(15, 1, 1:10)= 0.13198E-02 0.20035E+00 0.24547E+00 0.29770E-02 0.34914E+00 0.35572E+00 0.36599E-02 0.35248E+00 0.27611E+00 0.20274E-02---> fma(15, 1, 1:10)= 0.13198E-02 0.20035E+00 0.24547E+00 0.29770E-02 0.34914E+00 0.35572E+00 0.36598E-02 0.35248E+00 0.27611E+00 0.20274E-02
The only difference in the DecAlpha and Altix test run outputs that are being compared is in the seventh number on the line which is 0.36599E-02 in the DecAlpha output and 0.36598E-02 in the Altix output. Similar insignificant differences occur in the other lines listed in the DIFF utility output. These differences are likely due to differences in the computing algorithms used on the CPUs on the two platforms; thus, it is concluded that the SORT3D code has been successfully verified for operation on the new platform. Details of the verification procedure and results are given in [SORT3D 2008]. 3.2 Verification of the Fuel Performance and Fission Product Transport Codes
The same procedure that was used to verify the physics codes for running on the SGI Altix 3000 supercomputer was used for the fuel performance and fission product transport codes except for the SURVEY code, which was debugged, significantly updated from the original version, modified to include the POKE code, and modified to handle the two fuel particle (LEU and NU) core design. The verification of the SURVEY codes, which proved more challenging than the verification of the other codes to be used in the CPA task, is described in Section 4.
Final Report – NGNP Core Performance Analysis, Phase 1 911160/0
48
3.2.1 TAC2D Code Verification
TAC2D [Boonstra 1976] is a code developed at GA for calculating steady-state and transient temperatures in two-dimensional problems using finite difference methods. The configuration of the body to be analyzed is described in rectangular, cylindrical or circular (polar) coordinate systems using orthogonal lines of constant coordinates called grid lines. The grids lines specify an array of nodal elements. Nodal points are defined as lying midway between the bounding grid lines of these elements. A finite difference equation is formulated for each nodal point in terms of its capacitance, heat generation, and heat flow paths to neighboring nodal points. The resulting system of equations is solved by an efficient implicit method. The original version running on the VAX computer, was verified according to GA standards [TAC2D 1975]. It has since been ported to both the DecAlpha and for use on PCs using Windows. These versions were also verified, and the verification was documented [DelBene 2000]. For application to the current design work, the PC version of TAC2D will be used. 3.2.2 TRAFIC-FD Code Verification
The original TRAFIC [Smith 1978] code was developed in 1978 to calculate fission product transport in HTGR cores. The geometry modeled includes the fuel compacts, the graphite webs and the coolant holes in a typical core fuel block. TRAFIC-FD [Tzung 1992b] is an update of the original TRAFIC code with an improved solution method and a faster run time. The transport of fission products can be described with diffusion equations; and the finite difference method is utilized in the TRAFIC-FD code to solve these equations. The SURVEY code is used to obtain the detailed history of the core environment necessary for the calculation. The release of fission products for the entire core is found by sampling calculation cells at several locations in each fuel block and at many blocks throughout the reactor core. The basic geometry dealt with in TRAFIC-FD is the smallest unit of symmetry in a fuel block, a 30-60-90 triangle with fuel compact, web graphite, and coolant hole. This is called a calculation cell. A one dimensional approximation is made in the analysis. There are four parts to the transport model. First the radionuclide releases from the fuel microspheres are calculated; these nuclides released from the microspheres are assumed to be available instantly at the outside surface of the cylindrical fuel compact. A gap transport model between the outside surface of the fuel compact and the graphite web surface is the second part of the model. The third part of the model is diffusion through the graphite; the fourth part of the calculation covers the transport across the coolant-hole boundary layer. Two test problems were run for the TRAFIC-FD code on both platforms, and a line-by-line comparison of the outputs showed no differences in the first problem outputs except for the times when the cases were run. In the second case, the differences occurred in the least
Final Report – NGNP Core Performance Analysis, Phase 1 911160/0
49
significant digit of the output quantities, and are well within expected tolerances. As a typical result of the DIFF comparison for the second test problem, consider the following line output comparison from DIFF. The DecAlpha line is given first then the Altix line: > 40 385.0 2.79E-04 2.26E-35 2.95E-13 0.00E+00 3.52 0.00015 0.00015 0.00015 1.29E+02 1.61E+01 1.45E+02 2.24E-02 1.33E-04 0.00E+00 < 40 385.0 2.79E-04 2.26E-35 2.95E-13 2.80E-45 3.52 0.00015 0.00015 0.00015 1.29E+02 1.61E+01 1.45E+02 2.24E-02 1.33E-04 5.60E-38 As can be seen the only differences in the two lines are between numbers which are zero or very small and effectively zero (2.26E-38, and 5.6E-38). The differences are probably due to differences in how the CPU chips on both platforms subtract two numbers. Since any differences are in the least significant digits of the output quantities, and are well within expected tolerances, it is concluded that the TRAFIC-FD code has been successfully verified for operation on the new platform. Details of the verification procedure and results are given in [TRAFIC-FD 2008]. 3.2.3 SORS Code Verification
The SORS computer code [Cadwallader 1993] is used to evaluate fuel particle failure and fission product release from the core under accident conditions. This release contributes to the total fission product release from the vessel upon which dose calculations are based. Core temperatures from TAC2D are used in SORS, and, based on the thermal conditions, SORS calculates:
1. Release from heavy metal contamination in the fuel compact matrix as a function of
temperature and nuclide. 2. Release from initially exposed kernels in the core as a function of nuclide, fuel burnup,
and temperature. 3. Failure of initially intact fuel particles (both with and without manufacturing defects) due
to the mechanisms of pressure vessel failure, SiC corrosion by fission products, and SiC thermal decomposition.
4. Diffusion of fission products through intact coatings.
SORS accounts for diffusion of the nonvolatile nuclides through the fuel compact matrix and core graphite, and their transport by the primary coolant. After release from the fuel particles, the nonvolatile fission products are still confined by the matrix and structural graphite barriers. To escape from the core, these fission products must diffuse through the graphite to the coolant channel, evaporate at the surface of the channel, and be carried out of the coolant channel by the coolant stream. At the coolant-hole surface, the flux of fission products diffusing to the surface must equal the flux of fission products transporting across the boundary layer. SORS assumes that a steady-state profile in the graphite web is reached within each time step. The
Final Report – NGNP Core Performance Analysis, Phase 1 911160/0
50
release to the coolant is determined from mass transfer and vapor pressure relationships. The SORS solution technique utilizes coupled first-order differential equations with coefficients which are dependent on time. The differential equations are integrated numerically using the Hammings predictor-corrector technique. Because the Hammings technique is a four-step method, the Runge-Kutta routine is used to set up the starting values. The SORS code was ported from a PC platform to the ALTIX and verified in the same manner as outlined in section 3.1 above. In this case there was only a difference in one line of the calculated output between the sample case run on both problems and this was in the fifth decimal place in one number (5.25454E-09 in the Altix output and 5.25455E-09 in the PC output). Thus, it is concluded that the SORS code has been successfully verified for operation on the new platform. Details of the verification procedure and results are given in [SORS 2008]. 3.2.4 PISA Code Verification
The PISA code [Pelessone 1993] is a one-dimensional, finite-element code for thermal and stress analysis of irradiated fuel particles. PISA allows performance of simultaneous thermal and stress history analyses of a spherical fuel particle under user-specified irradiation conditions. Three material models are used in PISA to model material properties. These are a linear elastic model, a linear viscoelastic materials with stationary creep model, and a linear viscoelastic materials with stationary and transient creep model. PISA was updated to accommodate new TRISO particle irradiation conditions, to permit improved modeling of material conditions, and to allow porting to PCs from UNIX environments. The code was compiled using the Fortran 90 compiler to run on the GA Altix supercomputer, and was verified for this computing platform by running three test problem provided in the users manual [Pelessone 1993]. The results agreed exactly with the outputs given in the user’s manual for all three test cases. Details of the verification procedure and results are given in [PISA 2009].
Final Report – NGNP Core Performance Analysis, Phase 1 911160/0
51
4 NGNP FUEL PERFORMANCE/FISSION PRODUCT RELEASE FROM CORE
A fundamental requirement in the design of any nuclear power plant is the containment and control of the radionuclides (RN) produced by the various nuclear reactions. In response to this requirement, different RN containment systems have been designed and employed for different reactor designs. For MHR designs, a hallmark philosophy has been adopted since the early 1980s to design the plant such that the radionuclides will be retained in the core during normal operation and postulated accidents. Consequently, an assessment of the expected RN release rates from the core during normal operation is needed to determine whether or not the candidate design meets the core release criteria that have been derived from top-level RN control requirements. Design methods have been developed at GA during the past four decades to model coated-particle fuel performance and radionuclide transport in core materials during normal plant operation. These design methods have been used extensively for core design and safety analysis, and they will be used in Phase 2 of this CPA task. However, before they can be used for the CPA, these codes must be verified because they have been ported to a new computational platform (Section 3), and certain codes, including SORT3D and SURVEY, have also be modified to analyze the core designs to be considered. 4.1 Historical Overview
The development histories of the SURVEY and TRAFIC codes, which will be used in Phase 2 of the CPA task, are summarized below. 4.1.1 SURVEY Code Development
The SURVEY code calculates the full-core, fuel failure and fission gas release during normal operation. SURVEY [Georghiou 1978] was originally written to support large HTGR design and licensing. The original SURVEY code required power distribution input from the interface code TSORT [Archibald 1977] which provided a 3D power distribution “synthesis” of GAUGE (X-Y power distributions) [Archibald 1983] and FEVER (Z power distributions) [Todt 1969]. SURVEY was subsequently sold to KHI and used for HTTR core design and analysis [Hudritsch 1984]. SURVEY was modified substantially for use on the NP-MHTGR program [Stone 1993]: (1) a new interface code SORT3D [SORT3D 1994] was written so that DIF3D power distributions could be input to SURVEY; (2) Li targets were added, including a target particle failure model and a tritium diffusive release model; and (3) fuel performance and fission gas release models were added for the HEU UCO driver fuel. Because of the Li target and tritium release models, this version of SURVEY was Unclassified Controlled Nuclear Information (UCNI).
Final Report – NGNP Core Performance Analysis, Phase 1 911160/0
52
In 1994, the NPR SURVEY code was used to conduct a core performance analysis of a gas-turbine MHR fueled with weapons-grade Pu, the so-called PC-MHR. The fuel design was a single, 94%-enriched, TRISO-coated PuO2-x particle. Fuel failure and fission gas release models were defined and programmed in SURVEY (since there is a paucity of performance data for high-burnup PuO2-x particles, data for high-burnup HEU UCO was also used as an expedient when developing the Pu models). Pressure-vessel performance correlations for the PuO2-x particle, which are required in SURVEY, were derived from a series of PISA code calculations [Pelesonne 1993]. The 3D core power distribution was calculated with DIF3D and input to SURVEY via the SORT3D interface code. The SURVEY output was supplied to TRAFIC-FD which was used to predict fission metal release from the core. SURVEY appeared to function flawlessly for this application, and the predicted results appeared to be highly credible. In 2002, DOE/NNSA determined that SURVEY (and TRAFIC-FD as well) should be transferred to OKBM for use on the Russian GT-MHR program. Consequently, all references and programming related to Li targets and H-3 behavior were removed from the code and users manual, and a new user’s manual was issued [Pfremmer 2002]. 4.1.2 TRAFIC-FD Code Development
The TRAFIC/COPAR code calculates the full-core fission metal release during normal operation based upon the burnup, fast fluence, temperature and particle failure distributions calculated by SURVEY. The TRAFIC code [Smith 1978] was originally written for the LHTGR program (2240 MWt LHTGR). The COPAR code [Smith 1977] which calculates fission metal release from failed and intact TRISO particles was included as a subroutine in TRAFIC which models transport in the fuel-compact matrix and fuel-block graphite and release into the He coolant (COPAR can also be used as a stand-alone code to calculate particle release). TRAFIC requires SURVEY code output as input; unlike COPAR, it cannot be used as a stand-alone code. By benchmarking it against an analogous German code, a fundamental error was discovered in the original COPAR code [Smith 1977]. (The analytical solution was only valid when the activation energies for the diffusivities in all of the coatings are equal, which is practically never.) A new code, COPAR2 [Hudritsch 1986], was written, which solved the same equations using an infinite-series solution instead of an analytical solution. However, while mathematically correct (unlike the original code), COPAR2 had chronic convergence problems for many applications and proved to be impractical for routine core analysis. The TRAFIC code was modified for use on NP-MHTGR. Another new particle release code COPAR-FD [Tzung 1992a] was written (finite-difference solution) to replace COPAR2, again
Final Report – NGNP Core Performance Analysis, Phase 1 911160/0
53
solving the same set of equations, and was programmed into the TRAFIC code. Other changes were also made to generalize TRAFIC, and the modified code was named TRAFIC-FD [Tzung 1992b]. The TRAFIC-FD code was used to predict fission metal release from the PC-MHR core and appeared to function flawlessly for this application. 4.2 Code Modifications
The interface code SORT3D was modified for application to NGNP, and the fuel performance code SURVEY was modified to incorporate flow correlations and fuel performance models for the required fuel particle types. The POKE code [Kapernick 1993] was incorporated in SURVEY to develop the flow correlations, and the PISA code was used to develop pressure vessel failure models for the NUCO fertile particle. Successful operation of the THERM module in SURVEY was verified by comparison with the PISA code. The details of the work to update and verify the codes are described below. SORT3D, SURVEY, and TRAFIC-FD have all been ported to the SGI Altix supercomputer system. As described in Section 3, SORT3D and TRAFIC-FD were verified for running on the Altix system by running test problems on the Altix system and comparing the results with those generated for the test problems on the GA DecAlpha computer system. 4.2.1 SORT3D Modifications
The SORT3D code was successfully run using the results of the DIF3D/BURP and produced a usable binary output file required as SURVEY input. During this process, it was found that SORT3D was not dimensioned large enough for the Version 6.4 five-cycle design. SORT3D was modified to check all of the input parameters against the code dimensioning. In the future, if the size of the input is larger then a dimension in SORT3D, an error message will be printed with instructions as to which parameter has to be changed and what the correct size should be. The messages instruct the custodian to recompile the code and then force a termination. This prevents generation of incorrect results and eliminates the time spent to determine the cause of the error. 4.2.2 SURVEY Modifications
4.2.2.1 Code Debugging
The SURVEY code was converted to Fortran 90 and all of the old-style dynamic dimensioning was removed in favor of dimensioned arrays using a consistent set of parameters to set each array size. Over the years, several custodians have added coding to the SURVEY. To simplify their modifications, some additional fixed arrays were created and stored in common blocks. This was done so the dynamic dimensioning did not have to be modified, which would have
Final Report – NGNP Core Performance Analysis, Phase 1 911160/0
54
been a complicated process. The added arrays have used either fixed dimensions or have added local parameters that are not consistent with other array sizes. For the current version 6.4 design, many of these array sizes are no longer large enough and have created run time problems. The arrays and common blocks were eliminated and added to the main storage blocks using the consistent set of parameters. Using fixed array sizes allows array bounds checking which can eliminate many coding errors. At least three out-of-bound array indexes have been corrected to date. The TREAD/TFIN portion of SURVEY was converted to Fortran 90 and the dynamic dimensioning was eliminated. This portion of the code sums and averages the local-point thermal and fuel performance results over the volume of the core and produces a set of PostScript plot files. The new dimensioned arrays were created with appropriate parameters and the section of coding is currently being debugged. 4.2.2.2 Incorporation of POKE Code Flow Option
An option was added to SURVEY to determine the flow rate in each subhex based on calculation using the POKE flow routines. This feature allows a better approximation to the coolant flow rate vs. time in each channel using the actual power profiles from DIF3D in each subhex and the total core flow rate through the core. The current procedure uses an approximation to adjusting the flow using the power tilt and a polynomial expression which corrects the flow. The coefficients can be determined from a series of POKE runs or a simpler procedure using an EXCEL spreadsheet. Both options are in the code, but it is judged that determining the flow rate using the POKE routines offers an improvement in the results. The additional cost is very small increasing the execution time for SURVEY by about 30 seconds for 34 regions and 283 time steps. 4.2.2.3 Pressure Vessel Failure Model for Natural UCO
A pressure-vessel failure model was generated for the natural enriched UCO TRISO fertile particle. The approach closely followed the work done previously for a PuO2-x particle, as discussed in Section 4.1.1. The model uses the PISA code to determine the compressive stresses in the SiC layer due to irradiation shrinkage in the OPyC layer assuming the IPyC layer fails early. For particles with a failed OPyC coating, the failure of the SiC layer is based on integration of the Weibull integral over the volume of the SiC layer using a thick shell equation for the stress in the SiC layer.
Final Report – NGNP Core Performance Analysis, Phase 1 911160/0
55
4.2.3 TRAFIC-FD
SURVEY produces a file, SURVEYOUT, which is used by the TRAFIC-FD code. The structure of this file was not changed; however, modifications were made to the fixed dimensioning of the code to write the file so as not to change the file structure. 4.3 SURVEY Verification
The other codes to be used in the CPA were verified by comparison of the results obtained from running the codes on the GA SGI ALTIX computer system to results obtained from verified versions which were run on the GA DEC ALPHA computer system (Section 3). The DEC ALPHA computer system is being decommissioned which required the re-verification of the codes on GA’s new computer system. However, a different approach was required for SURVEY verification as elaborated below. There has not been a two-particle core design analyzed at GA since 1989 when the performance of the 350-MW(t) steam-cycle MHTGR with an LEU UCO fissile/ThO2 fertile particle design was assessed. This analysis was performed using an older version of SURVEY which used power distributions from GAUGE/FEVER/TSORT rather than from DIF3D/SORT3D, and the input and output files for the 1989 analysis have been lost. Consequently, since there is no verified two-particle test case which was run on the GA DEC ALPHA computer system, verification of the new version of SURVEY/THERM required a different approach. The thermal analysis portion of the SURVEY code (the “THERM” module) was compared to a single-particle calculation performed on the DEC ALPHA for the PC-MHR [PC-MHR 1994]. This comparison indicated that the thermal portion of the code was producing the same results for the single particle case. For the two-particle case additional verification was performed to make sure that no errors were introduced due to a two-particle input. The THERM portion of SURVEY was compared to flow/thermal calculations from the POKE code performed for the NGNP Pre-conceptual 600-MW(t) design. The POKE model consists of 238 individual channels. The axial power distributions for each channel were created by reading the normalized axial powers, the column peaking factors, and the number of coolant holes from the SORT3D file used by SURVEY. POKE input files were created for time points 5, 30, 60, and 106 at space point region 24, column 7, block 10 (a subhex containing buffer fuel which is adjacent to the outer reflector in the bottom fuel element in a column in the outer fuel ring. This fuel element is also adjacent to a control rod. This space point and time point 106 were selected because this is where and when SURVEY predicted the maximum fuel temperature (1939°C) during the 5-cycle lifetime analyzed. The first time points were arbitrarily selected.
Final Report – NGNP Core Performance Analysis, Phase 1 911160/0
56
Table 4-1 shows a comparison of the coolant temperature, fuel centerline temperature, flow rates, and maximum fuel temperature in the core for the time point for the POKE model and the SURVEY/THERM model. As may be seen from the table, the results compare well. There are significant differences in the algorithms used by POKE and SURVEY. The most significant is that POKE uses axial profiles with 11 points from the top of the core to the bottom of the core. SURVEY uses 10 points at the center of each axial block. The data from the SORT3D file has 10 points which were extrapolated to get the point powers at the top of the core and the bottom of the core. The points located at the junction of the blocks were created by averaging the two mid-block points.
Table 4-1. Verification of SURVEY/THERM with POKE
POKE SURVEY/THERM
Time Point*
Tcool (oC)
Tfuel (oC)
Flow rate
(lb/h)
Max. Core T
(oC) Tcool (oC)
Tfuel (oC)
Flow rate
(lb/h)
Max. Core T
(oC) 5 900 998 174.6 1418 895.8 995.6 176 1445
30 933 1027 174.5 1288 923.8 1017 174 1286
60 1105 1218 164 1312 1119 1235 163 1285
106 1566 1963 146.8 1963 1564 1939 145 1939 * Space point = region 24, column 7, block 10. The models for the determining the temperature rise between the surface of the coolant hole and the fuel-compact centerline are also different. POKE uses constant thermal conductivities for the fuel-block graphite and the fuel compact that are supplied as input; SURVEY/THERM includes correlations for graphite conductivity from the GDDM [Price 1984] and for fuel-compact conductivity from the FDDM [Myers 1987] that are complicated functions of temperature and fast fluence. All things considered, the comparisons of the temperatures and flow rates are excellent and verify the thermal calculations in the latest version of SURVEY. The verification of the SURVEY code is not complete at this writing. The PERFOR module in SURVEY which calculates fuel particle performance and fission gas release will need to be verified early in Phase 2 of the CPA task. The likely approach to accomplish this verification will be by benchmarking SURVEY/PERFOR against the CAPPER code [Richards 1993] in a manner similar to the benchmarking of SURVEY/THERM against POKE as described above.
Final Report – NGNP Core Performance Analysis, Phase 1 911160/0
57
The CAPPER code was written to analyze fuel performance and fission gas release in fuel irradiation capsules. CAPPER is a local-point code which requires time-dependent burnup, fast fluence and temperature histories as input (this information would be obtained from SURVEY/THERM). The code was written for analysis of both one- and two-particle fuel systems. CAPPER is a well-structured, well-documented code that was developed under the exacting software development standards required by the NPR program. It contains all of the fuel performance and fission gas release models from GA’s Fuel Design Data Manual and also contains other candidate fuel performance and gas release models in separate self-contained modules. The pressure-vessel failure correlations derived for the NUCO fertile particle will have to be added to CAPPER. 4.4 Initial Performance Assessment of Phase 1 Core Design (Version 6.4)
The modified SURVEY code was run using the SORT3D file for the Phase 1 core design (version 6.4) generated by DIF3D. SURVEY produced results for the thermal portion of the code that are judged to be reliable based upon the above comparison with POKE code results. The volume temperature distributions calculated by SURVEY are shown in Figures 4-1 through 4-4. The first two figures give peak temperature distributions for fuel segments 1 and 2, and the second two figures give the time-average temperature distributions for the two segments. The extreme peak fuel temperatures evident in Figures 4-1 and 4-2 are clearly of concern, but they could conceivably be limited to a small fraction of the core and be persistent for only a short period of time. Perhaps of greater concern are the high time-average fuel temperatures evident in Figures 4-3 and 4-4. For example, during fuel load 3 in Segment 2, 4% to 5% of the fuel operates at an average temperature >1250°C. Formally, the fuel failure and fission product release rates have not yet been calculated; however, based upon past fuel performance analyses of MHR cores, it is obvious that this core design would not meet the fission product release limits for an NGNP operating at 900°C to 950°C that were recommended in [Hanson 2008].
Final Report – NGNP Core Performance Analysis, Phase 1 911160/0
58
Figure 4-1. Peak Fuel Temperature Volume Distribution for Segment 1
Final Report – NGNP Core Performance Analysis, Phase 1 911160/0
59
Figure 4-2. Peak Fuel Temperature Volume Distribution for Segment 2
Final Report – NGNP Core Performance Analysis, Phase 1 911160/0
60
Figure 4-3. Time-Average Fuel Temperature Volume Distribution for Segment 1
Final Report – NGNP Core Performance Analysis, Phase 1 911160/0
61
Figure 4-4. Time-Average Fuel Temperature Volume Distribution for Segment 2
Final Report – NGNP Core Performance Analysis, Phase 1 911160/0
62
It is important to note that the temperatures in Figures 4-1 through 4-4 are conservative because they were calculated for a reactor outlet helium temperature of 950°C and a reactor inlet helium temperature of 490°C.5 In Phase 2, the reactor outlet helium temperature will be lowered to 900°C to be consistent with Table 1-1 and the reactor inlet temperature will be increased to 540°C to maintain the same design core �T as for the GT-MHR (and based on the assumption of direct cooling of the reactor pressure vessel.6 These changes in the reactor inlet and outlet helium temperatures will have a significant beneficial effect on fuel temperatures, Nevertheless, the fuel temperature volume distributions calculated in Phase 1 indicate that the core power distribution requires further optimization (as was anticipated). Inspection of the locations where the highest fuel temperatures are calculated provides guidance for how the core power distribution should be optimized to reduce fuel temperatures. For example, the maximum fuel temperature occurs at time point 106 at space point region 24, column 7, block 10 (a subhex containing buffer fuel which is adjacent to the outer reflector in the bottom fuel element in a column in the outer fuel ring). This fuel element is also adjacent to a control rod. The radial power factor at time point 106 is 1.88, and the axial power factor is 1.3; moreover, the excessively large RPF occurs after the adjacent control rod was moved from 50% inserted at time point 105 to fully withdrawn at time point 106. This example and similar observations lead to the following recommendations for optimizing the core power distribution to reduce fuel temperatures. The axial power distribution should be skewed to the top of the core to the fullest extent practical. Considering only fuel temperature, the ideal axial power profile is one that peaks at the top of the core and decreases exponentially down the length of the core; such a power profile gives a constant minimum fuel temperature along the entire length of the core. A truly exponential axial power profile is impractical for number of reasons, including packing fraction limits, axial stability limits, etc.; but the power can be skewed more to the top than in the Phase 1 physics design. This may, however, require that the compact packing fraction constraints imposed in Phase 1 be relaxed somewhat. The heavy-metal loadings in the four buffer-fuel rows at the fuel element-reflector interface evidently need to be reduced, especially in the bottom axial fuel zone. This recommendation needs to be confirmed by a systematic examination of the RPFs and APFs predicted for the subhexes at the fuel/reflector interfaces.
5 The core coolant bypass fraction was assumed to be 10%. 6 In Phase 2, the core bypass flow will be increased to 15% as a somewhat more conservative estimate of the bypass flow.
Final Report – NGNP Core Performance Analysis, Phase 1 911160/0
63
Some of the radial power factors, especially at the fuel/reflector interfaces, are very high by historical standards for MHR cores. The scoping work done by the GA team during the Phase 1 pre-conceptual design demonstrated that fuel shuffling can dramatically reduce the range of radial power factors in the core; however, the particular fuel shuffling scheme that they evaluated did not sufficiently skew the power to the top of the core [Richards 2008]. The potential for fuel shuffling will be investigated during Phase 2.
Final Report – NGNP Core Performance Analysis, Phase 1 911160/0
64
5 REFERENCES
[Archibald 1977] Archibald, R., “TSORT: A Computer Program to Process Nuclear Design Data for Use in Core Performance and Mechanical Design Calculations with the SURVEY Program,” GA Report GA-A14524, General Atomics Technologies, June 1977
[Archibald 1983] R. J. Archibald, P. K. Koch, “A User’s and Programmer’s Guide to the GAUGE Two-Dimensional Neutron Diffusion Program”, General Atomics report GA-A16657, July 1983
[Boonstra 1976] Boonstra, R.H., “TAC2D – A General Purpose Two-Dimensional Heat Transfer Computer Code,” GA Report GA-A14032, July 15, 1976
[BURP 2008] “BURP Code Verification for NGNP Prismatic Core Performance Analysis,” GA document PC-911148, Rev 0, December 2008
[Cadwallader 1993] Cadwallader, G.J., and S.B. Inamati, “SORS/NP1 Code Description and Users Manual,” CEGA report CEGA-002092, September 1993
[DelBene 2000] Del Bene, J.V., “TAC2D Version 1.1 Verification Report and Independent Review’” General Atomics document 910351, November 2000
[Derstine 1984] K. L. Derstine, “DIF3D: A Code to Solve One-, Two-, and Three-Dimensional Finite-Difference Diffusion Theory Problems”, Argonne National Laboratory, ANL-82-64, April 1984
[DIF3D 2008] “DIF3D Code Verification for NGNP Prismatic Core Performance Analysis,” GA document PC-911150 Rev 0, December 2008
[Ellis 2009] Ellis, C.P., “Core Physics Design Calculations for Next Generation Nuclear Plant (NGNP) Core Performance Analysis, Phase 1”, GA Report 911161, Rev. 0, February 2009
[GA 2007] GA Document, “Preconceptual Engineering Services For The Next Generation Nuclear Plant (NGNP) With Hydrogen Production”, 911107, Rev. 0, July 2007
[GAUGE 2008] “GAUGE Code Verification for NGNP Prismatic Core Performance Analysis,” GA document PC-911149, Rev 0, December 2008
[Georghiou 1978] Georghiou, D. L., “SURVEY: A Computer Code for the Thermal and Fuel Performance Analysis of High-Temperature Gas-Cooled Reactors. Part I - User's Manual,” GA-D14869, GA Technologies, November 1978 (GAProprietary Information)
Final Report – NGNP Core Performance Analysis, Phase 1 911160/0
65
[Hanson 2008] Hanson, D. L., “NGNP Contamination Control Study,” 911117, Rev. 0, General Atomics, April 2008
[Hudritsch 1984] Hudritsch, W. W., V. Jovanovic, and D. L. Georghiou, “SURVEY – A Computer Code for the Thermal and Fuel Performance Analysis of High-Temperature Gas-cooled Reactors - User's Manual,” GA-C17554, GA Technologies, March 1984
[Hudritsch 1986] Hudritsch, W. W., “COPAR2, A Program to Compute the Release of Fission Products from Coated Particles,” 908696, Rev.0, General Atomics, January 1986
[Kapernick 1993] Kapernick. R., “POKE User's Manual,” CEGA-002928, Rev. N/C, CEGA Corporation, November 1993
[Lawrence 1983] Lawrence, R. D., “The DIF3D Nodal Neutronics Option for Two- and Three-Dimensional Diffusion Theory Calculations in Hexagonal Geometry,” ANL-83-1, March 1983
[MICROX 2008] “MICROX Code Verification for NGNP Prismatic Core Performance Analysis,” GA document PC-911148, Rev 0, December 2008
[Pelesonne 1993] Pelesonne, D., “PISA: A Coupled Thermal-Stress Code for the Mechanical Analysis of Irradiated Fuel Particles - User's Manual,” CEGA-002550, CEGA Corporation, July 1993
[Pfremmer 2002] Pfremmer, R. D., “Software Description and User's Manual for GT-MHR Fuel Performance Code, SURVEY,” 911009, Rev. 0, General Atomics, April 2002
[PISA 2009] Baxter, A., “PISA Code Verification for NGNP Prismatic Core Performance Analysis,” 911164, Rev. 0, General Atomics, March 2009
[Richards 1993] Richards, M., "Software Design Description and User's Manual for CAPPER Irradiation Capsule Performance Computer Code," CEGA-002309, Issue N/C, CEGA Corporation, April 1993
[Richards 2008] Richards, M., “NGNP Parametric Fuel and Reactor Pressure Vessel Temperature Calculations,” 911127, Rev. 0, General Atomics, November 2008
[Sherman 1993a] R. Sherman, “BURP: A Macroscopic Cross Section Generation and Nuclide Depletion Program For Use With DIF3D”, CEGA Memo CEGA-M-93-1139, August 1993
Final Report – NGNP Core Performance Analysis, Phase 1 911160/0
66
[Sherman 1993b] R. Sherman, “Software Requirements Specification for SORT3D Code Development”, CEGA-002813, Rev. 1, Oct 1993
[Smith 1977] Smith, P. D., and R. G. Steinke, "COPAR, A Program to Compute Release of Metallic Fission Products from Coated Particles," GA-A14034, General Atomic, November 1977
[Smith 1978] Smith, P.D., “TRAFIC, A Computer Program for Calculating the Release of Metallic Fission Products from an HTGR Core,” Technical Report GA-AI4721, General Atomics, February 1978
[SORS 2008] “SORS Code Verification for NGNP Prismatic Core GA Performance Analysis,” General Atomics Report PC-911153, Rev 0, December 2008
[SORT3D 1994] “Input Instructions for the SORT3D Computer Code,” Memo 816:RLS:009:94, from R. Sherman to R.K. Lane, September 22, 1994, Project 6301
[SORT3D 2008] “SORT3D Code Verification for NGNP Prismatic Core GA Performance Analysis,” General Atomics Report PC-911151, Rev. 0, December 2008
[Stone 1993] Stone, C. A., “Software Design Description and User's Manual for the NP-MHTCR Core Performance Code, SURVEY,” CEGA-002927, Rev. 0, CEGA Corporation, November 1993 (UCNI)
[TAC2D 1975] Morcos, S.M. and Williams, K.A., “The TAC2D Code, Version TFMABC-75-1, Part C: Code Verification and Benchmark Problems,” General Atomics report GA-A13415, June 1975
[Todt 1969] Todt, F. W. and L. J. Todt, “FEVERIM1 - A One-Dimensional Depletion Program for Reactor Fuel Cycle Analysis,” GA-9780, General Atomic, October 1969
[TRAFIC-FD 2008] “TRAFIC-FD Code Verification for NGNP Prismatic Core GA Performance Analysis,” General Atomics Report PC-911154, Rev 0, December 2008
[Tzung 1992a] Tzung, F., “COPAR FD, A Finite Difference Program to Compute Release of Metallic Fission Products from Coated Particles: Code Theory and Users Manual,” CEGA-002098, Rev. N/C, CEGA Corporation, September 1992
[Tzung 1992b] Tzung, F., “TRAFIC-FD, A Finite Difference Program to Compute Release of Metallic Fission Products From an HTGR Core; Code Theory and Users Manual,” CEGA-001904, Rev. N/C, CEGA Corporation, September 1992
Final Report – NGNP Core Performance Analysis, Phase 1 911160/0
67
[Walti 1972] P. Walti and P. Koch, “MICROX – A Two-Region Flux Spectrum Code for the Efficient Calculation of Group Cross Sections”, Gulf General Report Gulf-GA-A10827, April 1972
P.O. BOX 85608 SAN DIEGO, CA 92186-5608 (858) 455-3000