+ All Categories
Home > Documents > FINAL REPORT OF THE THIRTY EIGHTH NORTH … REPORT OF THE THIRTY EIGHTH . NORTH CAROLINA LAYER...

FINAL REPORT OF THE THIRTY EIGHTH NORTH … REPORT OF THE THIRTY EIGHTH . NORTH CAROLINA LAYER...

Date post: 26-Jun-2019
Category:
Upload: buicong
View: 214 times
Download: 0 times
Share this document with a friend
83
FINAL REPORT OF THE THIRTY EIGHTH NORTH CAROLINA LAYER PERFORMANCE AND MANAGEMENT TEST 1 Vol. 38, No. 5 April 2012 The North Carolina Layer Performance and Management Test is conducted under the auspices of the North Carolina Layer Performance and Management Program, Cooperative Extension Service at North Carolina State University and the North Carolina Department of Agriculture and Consumer Services. The flock is maintained at the Piedmont Research Station, Salisbury, North Carolina. Mr. Joe Hampton is the Piedmont Research Station Superintendent; Mr. Aaron Sellers is Resident Manager of the flock; Pam Jenkins is the Statistical Research Assistant; and Dr. K. E. Anderson is the Director for the program and Project Leader. The purpose of this program is to assist poultry industry personnel in North Carolina, across the country, and internationally in the evaluation of commercial layer stocks and management systems. The data presented herein represents the analysis of the first production cycle and molt of the 38th North Carolina Layer Performance and Management Test (Cage Production). Performance summary tables are available for each strain, and molt treatment. Copies of current and past reports are maintained for public access at http://www.ces.ncsu.edu/depts/poulsci/tech_info.html#layer For further information contact: Dr. Kenneth E. Anderson Poultry Science Department North Carolina State University Box 7608 Raleigh, NC 27695-7608 Tel: (919) 515-5527 Fax: (919) 515-7070 Email: [email protected] 1 The use of trade names in this publication does not imply endorsement by the North Carolina Cooperative Extension Service of the products named nor criticism of similar ones not mentioned. 1
Transcript

FINAL REPORT OF THE THIRTY EIGHTH

NORTH CAROLINA LAYER PERFORMANCE

AND MANAGEMENT TEST1

Vol. 38, No. 5 April 2012

The North Carolina Layer Performance and Management Test is conducted under the auspices of the North Carolina Layer Performance and Management Program, Cooperative Extension Service at North Carolina State University and the North Carolina Department of Agriculture and Consumer Services. The flock is maintained at the Piedmont Research Station, Salisbury, North Carolina. Mr. Joe Hampton is the Piedmont Research Station Superintendent; Mr. Aaron Sellers is Resident Manager of the flock; Pam Jenkins is the Statistical Research Assistant; and Dr. K. E. Anderson is the Director for the program and Project Leader. The purpose of this program is to assist poultry industry personnel in North Carolina, across the country, and internationally in the evaluation of commercial layer stocks and management systems. The data presented herein represents the analysis of the first production cycle and molt of the 38th North Carolina Layer Performance and Management Test (Cage Production). Performance summary tables are available for each strain, and molt treatment. Copies of current and past reports are maintained for public access at http://www.ces.ncsu.edu/depts/poulsci/tech_info.html#layer For further information contact:

Dr. Kenneth E. Anderson Poultry Science Department North Carolina State University Box 7608 Raleigh, NC 27695-7608

Tel: (919) 515-5527 Fax: (919) 515-7070 Email: [email protected]

1The use of trade names in this publication does not imply endorsement by the North Carolina Cooperative Extension Service of the products named nor criticism of similar ones not mentioned.

1

2

38th NORTH CAROLINA LAYER PERFORMANCE AND MANAGEMENT TEST

Volume 38 No. 5

Report on First Laying Cycle, Molt, and Second Laying Cycle Entries and Strains:

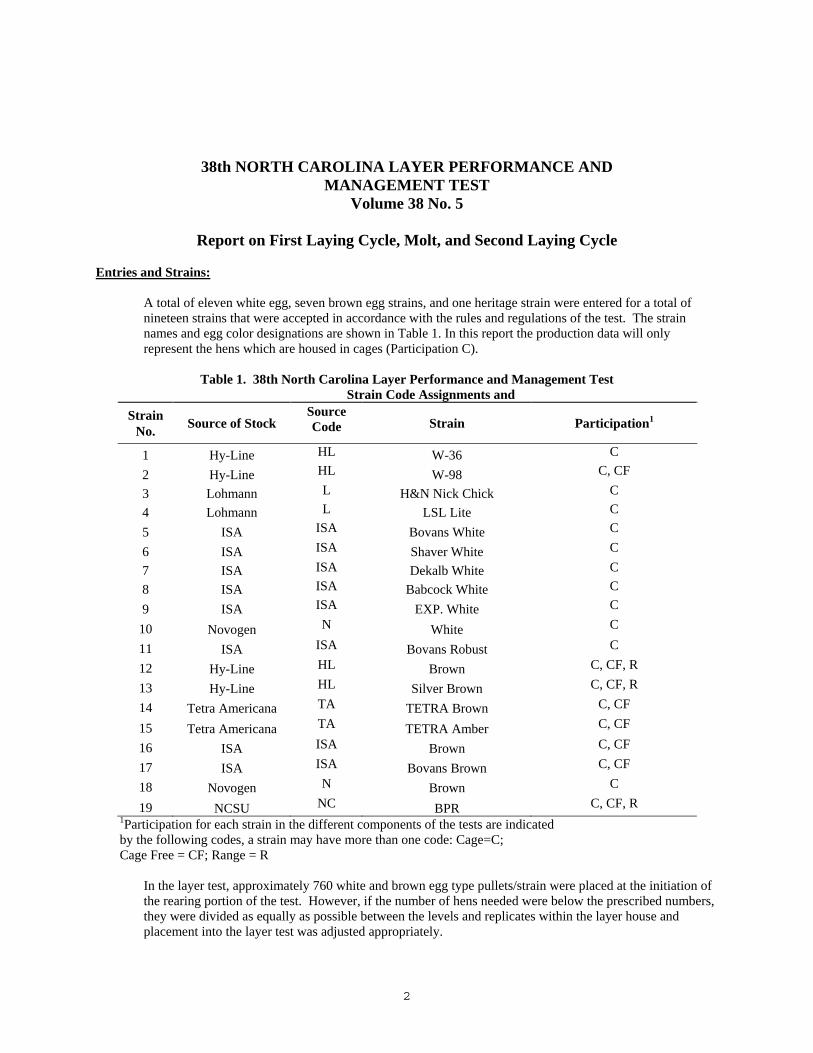
A total of eleven white egg, seven brown egg strains, and one heritage strain were entered for a total of nineteen strains that were accepted in accordance with the rules and regulations of the test. The strain names and egg color designations are shown in Table 1. In this report the production data will only represent the hens which are housed in cages (Participation C).

Table 1. 38th North Carolina Layer Performance and Management Test Strain Code Assignments and

Strain No.

Source of Stock

Source Code

Strain Participation1

1 Hy-Line HL W-36 C

2 Hy-Line HL W-98 C, CF

3 Lohmann L H&N Nick Chick C

4 Lohmann L LSL Lite C

5 ISA ISA Bovans White C

6 ISA ISA Shaver White C

7 ISA ISA Dekalb White C

8 ISA ISA Babcock White C

9 ISA ISA EXP. White C

10 Novogen N White C

11 ISA ISA Bovans Robust C

12 Hy-Line HL Brown C, CF, R

13 Hy-Line HL Silver Brown C, CF, R

14 Tetra Americana TA TETRA Brown C, CF

15 Tetra Americana TA TETRA Amber C, CF

16 ISA ISA Brown C, CF

17 ISA ISA Bovans Brown C, CF

18 Novogen N Brown C

19 NCSU NC BPR C, CF, R 1Participation for each strain in the different components of the tests are indicated by the following codes, a strain may have more than one code: Cage=C; Cage Free = CF; Range = R

In the layer test, approximately 760 white and brown egg type pullets/strain were placed at the initiation of the rearing portion of the test. However, if the number of hens needed were below the prescribed numbers, they were divided as equally as possible between the levels and replicates within the layer house and placement into the layer test was adjusted appropriately.

3

Dates of Importance:

The nineteen entries were hatched on January 6, 2010. The chicks were all sexed according to their genetics (vent, feather, or color), vaccinated for Marek’s disease, and wing banded for identification before being transferred to the brood/grow house. Table 1 shows the source of the laying stock, strain which was entered, and participation in the test environments and Table 36 provides the breeder, source of eggs, and entry status of each strain(Cage, Cage Free, or Range Environment). The rearing phase for the range, cage free, and the cage reared pullets complete the grow phase at 16 wks, then transitioned to the laying phase during their 17th wk of age. First cycle production records commenced on May 5, 2010 (17 weeks of age), through the molt period which was induced on May 4, 2011. The molt records commenced on May 4, 2011 (69 weeks of age), and ended on June 1, 2011 (73 weeks of age). The second cycle began on June 1, 2011 (73 weeks of age) and ended on February 15, 2012 (110 weeks of age) This report includes production data summarized from 17 to 69 weeks, 69 to 73 weeks, and 73-110 weeks. A table showing the changes in body weights from 17 to 69 wk of age, weight loss during the molt period, and overall weight gain is included in the information.

Pullet Housing:

The chicks were randomly assigned to the growing cages with white egg and brown egg replicates being intermingled throughout the house. The white egg strains occupied approximately 58 % of the house and brown egg strains occupied the other 42 % of the house. All strains were assigned to be represented as equally as possible in each of room, row, and levels.

The chicks from the brown egg strains destined for the range study were randomly assigned to the growing pens throughout House 2. This work will not be reported further until the single cycle report.

House 8--is an environmental controlled closed brood-grow facility with 3 banks of quad-deck cages in each room. Each room was assigned a number, each side of each bank was assigned a row number, each cage section within each row and level/row has been assigned a replicate number. For statistical analysis, pairs of rows have been designated as blocks. Thus, each block consisted of two rows containing 24 replicates on all levels. This allows for a total of 3,744 pullets per room resulting in a total pullet count for this test in House 8 using 3 rearing rooms of 11,232. The white and brown-egg strains were randomly assigned to the replicates in the house. Entrant strains were assigned to the replicates in a restricted randomized manner with the restrictions being that all strains were approximately equally represented in all rows, levels, and rooms. The chicks were brooded in the same cage during the entire 17 wk rearing period. Paper was placed on the cage floor for the first 7 days within each of the replicate series within each row. Each cage within the replicate was filled with 13 white-egg or brown-egg (13 per 24" x 26" cage) pullets on the day of hatch for a rearing allowance of 48 in2, 4.7 cm (1.8 in) of feeder space/bird and 1:6.5 nipple drinkers to bird ratio. The same numbers of pullets were grown in each replicate for both white and brown-egg strains. The room dividers were removed for this test so that all birds were essentially reared in a contiguous house.

Layer Housing:

The hens were randomly assigned to the replicate cages with white egg and brown egg strains being inter-mingled throughout the houses. The white egg strains occupied 58% of the house and brown egg strains occupied the other 42%. All strains were assigned to be represented as equally as possible in all rows, and levels. Laying Hen Cage Facilities reported in this test consist of two houses. House 4 is a high rise, environmentally controlled facility with three banks of Quad-deck (4-tier) high cages. There are a total of 216 replicates which can support 4,428 hens. House 5 is a standard height totally enclosed force ventilated laying house with a scraper pit manure handling system. It has 2 banks of tri-deck (3 levels) cages and two banks with quad-deck (4 levels) cages. There are a total of 252 replicates in house 5 which can support 5,166 hens.

Table 2. Description of Replicates and Hen populations in the Cage Layer Housing

House Replicates Hens/rep. hens/cage Hen No. Total Hens 4 108 21 7 2,268 4 108 20 5 2,160 4,428 5 126 21 7 2,646 5 126 20 5 2,520 5,166

Cage Layout Description

In both houses, each side of a bank was designated as a row and each row was divided into 9 8-foot replicates/level. The replicates are equipped with feed hoppers to supply and monitor feed consumption for each individual replicate and the feed is distributed by an automatic feeding system. The white-egg and brown-egg strains were assigned to the replicates in a restricted randomized manner, with the restrictions being that all strains were approximately equally represented in all rows, levels and cage sizes.

Test Design:

The arrangement for the laying test involved a completely randomized design and the main effects were set up in a factorial arrangement. The main effects within Houses 4 and 5 were strain and density. Following are general descriptions of the main effects:

Strain

The samples of fertile eggs from commercial breeder flocks were provided directly by the breeders involved. All eggs were set and hatched concurrently. A total of eleven white egg strains, 7 brown egg strains, and 1 heritage strain participated in the test. See the 38th Hatch Report (Vol. 38, No. 1) for details.

Density

In Houses 4 and 5, all individual replicateswithin each block contained one strain of layers. The cage density in both houses was dictated by the cage size that was either 61 or 81 cm wide and 41 cm deep. This allowed for two density combinations of 73 in2 (471 cm2) at 7 hens/cage (81 x 41 cm) and 77 in2 (497 cm2) at 5 hens/cage (61x 41 cm).

Table 3. Population and Density Allocations in Houses 4 and 5

Hens per Cage

Cage Size Width Depth

Floor Space

per Bird

Feeder Space

per Bird

Water Nipples

per Cage

5 61 cm x 40.7 cm 497 cm2 (77 in2) 12.2 cm 4.8 in

2

7 81.2 cm x 40.7 cm 471 cm2 (73 in2) 11.6 cm 4.6 in

2

4

5

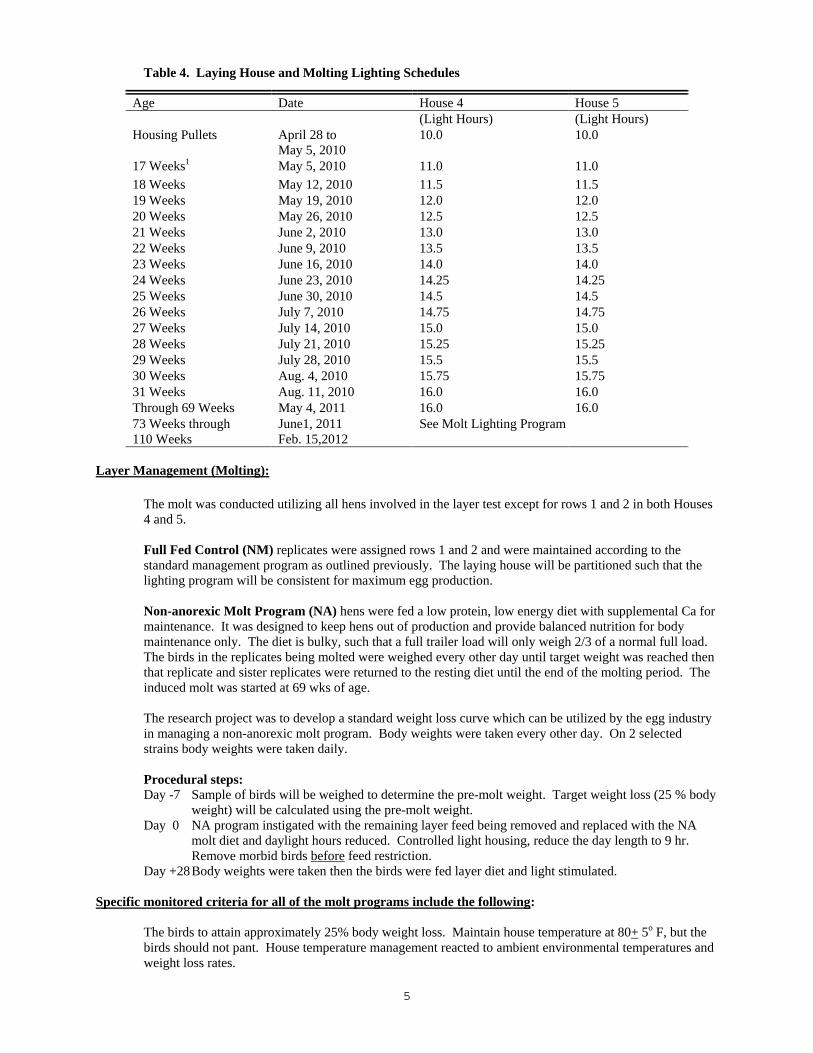
Table 4. Laying House and Molting Lighting Schedules

Age Date House 4 House 5 (Light Hours) (Light Hours) Housing Pullets April 28 to

May 5, 2010 10.0 10.0

17 Weeks1 May 5, 2010 11.0 11.0 18 Weeks May 12, 2010 11.5 11.5 19 Weeks May 19, 2010 12.0 12.0 20 Weeks May 26, 2010 12.5 12.5 21 Weeks June 2, 2010 13.0 13.0 22 Weeks June 9, 2010 13.5 13.5 23 Weeks June 16, 2010 14.0 14.0 24 Weeks June 23, 2010 14.25 14.25 25 Weeks June 30, 2010 14.5 14.5 26 Weeks July 7, 2010 14.75 14.75 27 Weeks July 14, 2010 15.0 15.0 28 Weeks July 21, 2010 15.25 15.25 29 Weeks July 28, 2010 15.5 15.5 30 Weeks Aug. 4, 2010 15.75 15.75 31 Weeks Aug. 11, 2010 16.0 16.0 Through 69 Weeks May 4, 2011 16.0 16.0 73 Weeks through June1, 2011 See Molt Lighting Program 110 Weeks Feb. 15,2012

Layer Management (Molting):

The molt was conducted utilizing all hens involved in the layer test except for rows 1 and 2 in both Houses 4 and 5. Full Fed Control (NM) replicates were assigned rows 1 and 2 and were maintained according to the standard management program as outlined previously. The laying house will be partitioned such that the lighting program will be consistent for maximum egg production.

Non-anorexic Molt Program (NA) hens were fed a low protein, low energy diet with supplemental Ca for maintenance. It was designed to keep hens out of production and provide balanced nutrition for body maintenance only. The diet is bulky, such that a full trailer load will only weigh 2/3 of a normal full load. The birds in the replicates being molted were weighed every other day until target weight was reached then that replicate and sister replicates were returned to the resting diet until the end of the molting period. The induced molt was started at 69 wks of age.

The research project was to develop a standard weight loss curve which can be utilized by the egg industry in managing a non-anorexic molt program. Body weights were taken every other day. On 2 selected strains body weights were taken daily.

Procedural steps: Day -7 Sample of birds will be weighed to determine the pre-molt weight. Target weight loss (25 % body

weight) will be calculated using the pre-molt weight. Day 0 NA program instigated with the remaining layer feed being removed and replaced with the NA

molt diet and daylight hours reduced. Controlled light housing, reduce the day length to 9 hr. Remove morbid birds before feed restriction.

Day +28 Body weights were taken then the birds were fed layer diet and light stimulated. Specific monitored criteria for all of the molt programs include the following:

The birds to attain approximately 25% body weight loss. Maintain house temperature at 80+ 5o F, but the birds should not pant. House temperature management reacted to ambient environmental temperatures and weight loss rates.

6

The 1st post-molt production period light schedule is the guide by which the lights will be adjusted following the molt. Actual house conditions and the flock’s reaction to the NCSU Non-Fasting Molting Program may affect how the light stimulation will actually be given. In general the hens ceased egg production by Day 6-10 of the molt program. However, some of the Brown egg strains never achieved 0 egg production. The hens were allowed to consume all of the molt feed provided between feedings. The molting ration is designed to keep hens out of production and to provide for skeletal and muscle maintenance. Livability was excellent with this program.

Table 5. Molting Lighting Schedules

Age Date House 4 House 5 (Light Hours) (Light Hours) Through 69 Weeks May 4, 2011 16.0 16.0 69 Weeks May 4, 2011 9.0 hr 9.0 hr 73 Weeks June 1, 2011 15.5 15.5 74 weeks June 8, 2011 16.0 16.0 75 Weeks through end of test (110 wk)

June 15, 2011 to Feb. 15, 2012

16.0 16.0

Layer Nutrition:

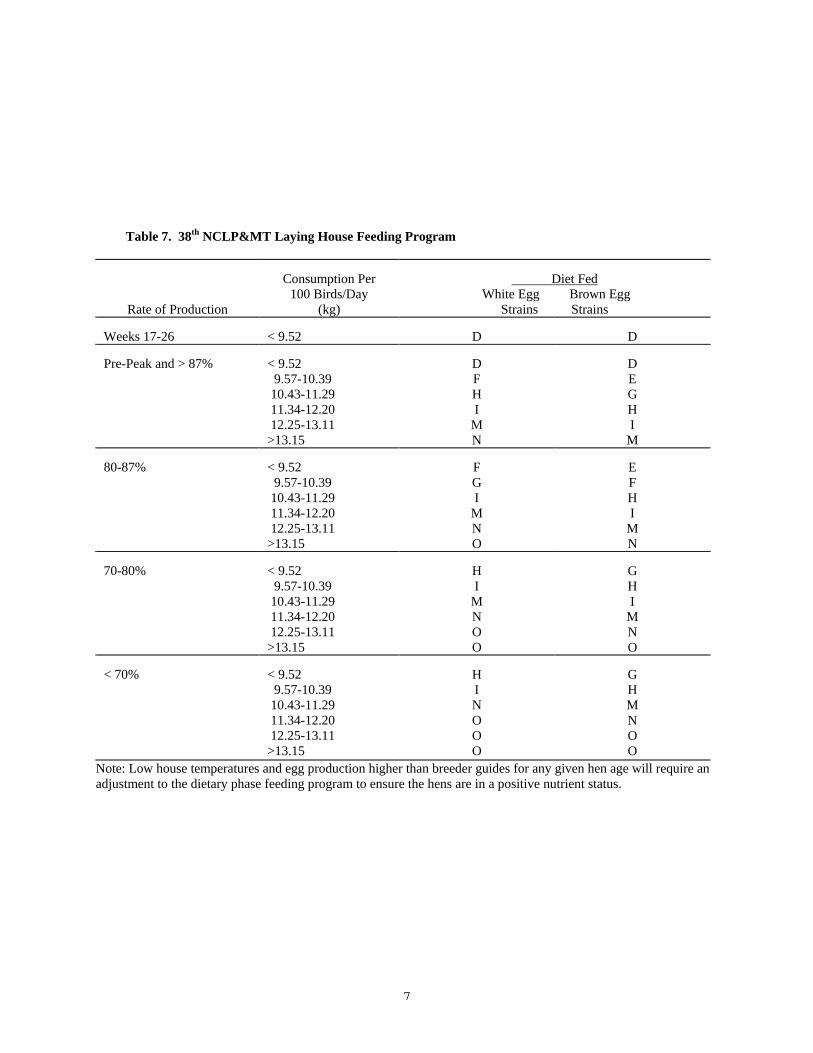
Layer diets are identified as Diets D, E, F, G, H, I, M, N, and O which consist of a pre-lay diet and a series of layer diets formulated to assure a daily protein, mineral and amino acid intake as shown below. Feed was offered ad libitum in accordance with the guidelines that all birds should receive acceptable nutrient intake at all times depending on the bird’s age and production rate as shown in the Laying House Feeding Program Table.

The diets provided during the molt, consisted of a low protein/energy diet and a Resting Diet described in the Molt Diets Table which follow. The molt diets were formulated to provide nutrition for body maintenance. The Resting Diet provides layer with the nutrients needed to maintain a static body weight with no egg production.

Table 6. Minimum Daily Intake of Nutrients Per Bird at Various Stages of Production in the 38th NCLP&MT

Production Stage Pre-Peak

> 87% 87-80% 80-70% <70%

White Egg Layers Protein1(g/day) 19 18 17 16 Calcium (g/day) 4.0 4.1 4.2 4.3 Lysine (mg/day 820 780 730 690 TSAA (mg)day) 700 670 630 590 Brown Egg Layers Protein1(g/day) 20 19 18 17 Calcium (g/day) 4.0 4.0 4.1 4.2 Lysine (mg/day 830 820 780 730 TSAA (mg)day) 710 700 670 630

1 If the egg production is higher than predicted values protein intake should be increased by 1% Note: House temperatures dictate the body maintenance demand of the hen if the house temperature is 75 to 80°F feed protein content should be increased accordingly to compensate for metabolic heat needed to maintain a homeostatic body temperature. If the house temperature is at or above 85°F no adjustment is needed.

7

Table 7. 38th NCLP&MT Laying House Feeding Program

Rate of Production

Consumption Per

100 Birds/Day (kg)

Diet Fed White Egg Brown Egg

Strains Strains Weeks 17-26

< 9.52 D D

Pre-Peak and > 87%

< 9.52 9.57-10.39 10.43-11.29 11.34-12.20 12.25-13.11 >13.15

D F H I

M N

D E G H I

M 80-87%

< 9.52 9.57-10.39 10.43-11.29 11.34-12.20 12.25-13.11 >13.15

F G I

M N O

E F H I

M N

70-80%

< 9.52 9.57-10.39 10.43-11.29 11.34-12.20 12.25-13.11 >13.15

H I

M N O O

G H I

M N O

< 70%

< 9.52 9.57-10.39 10.43-11.29 11.34-12.20 12.25-13.11 >13.15

H I N O O O

G H M N O O

Note: Low house temperatures and egg production higher than breeder guides for any given hen age will require an adjustment to the dietary phase feeding program to ensure the hens are in a positive nutrient status.

8

Table 8. 38th NCLP&MT Laying Periods Feed Formulations D through H

Ingredients

D E F G H

Corn 866.71 925.46 997.91 1068.19 1131.97 Soybean meal 663.18 621.10 552.33 499.80 457.65 Wheat Midds Fat (Tallow) 110.88 102.43 87.73 74.61 64.32 Gluten Meal 60% 95.83 88.37 100.00 99.23 90.80 D.L. Methionine 3.08 2.89 2.52 2.26 2.48 Lysine 78.8% Soybean Hulls Ground Limestone 132.42 133.70 135.07 134.02 132.50 Coarse Limestone 75.00 75.00 75.00 75.00 75.00 Bi-Carbonate 3.00 3.00 3.00 3.00 3.00 Phosphate Mono/D 36.77 34.73 32.84 30.36 28.79 Salt 6.00 5.99 5.95 5.93 5.92 Vit. premix 1.00 1.00 1.00 1.00 1.00 Min. premix 1.00 1.00 1.00 1.00 1.00 Mold Inhibitor 1.00 1.00 1.00 1.00 1.00 T-Premix 1.00 1.00 1.00 1.00 1.00 .06% Selenium Premix 1.00 1.00 1.00 1.00 1.00 Choline Cl 60% 2.14 2.33 2.65 2.59 2.57 Calculated Analysis Protein % 22.0 21.0 20.00 19.00 18.0 ME kcal/kg 2926.0 2926.0 2926.0 2926.0 2926.0 Calcium % 4.45 4.45 4.45 4.40 4.35 T. Phos. % 0.71 0.68 0.65 0.61 0.59 Lysine % 1.15 1.09 1.00 0.93 0.87 TSAA % 0.89 0.85 0.81 0.77 0.75

9

Table 9. 38th NCLP&MT Laying Periods Feed Formulations I through O

Ingredients

I M N O

Corn 1199.47 1258.28 1309.81 1371.93 Soybean meal 406.08 363.91 340.24 333.87 Wheat Midds Fat (Tallow) 52.26 43.80 38.85 14.71 Gluten Meal 60% 89.84 82.64 61.54 25.79 D.L. Methionine 2.02 1.62 1.75 1.80 Lysine 78.8% Soybean Hulls Ground Limestone 158.82 160.10 161.33 167.71 Coarse Limestone 50.00 50.00 50.00 50.00 Bi-Carbonate 3.00 3.00 3.00 3.00 Phosphate Mono/D 26.79 24.75 22.60 20.30 Salt 5.90 5.89 5.89 5.89 Vit. premix 1.00 1.00 1.00 1.00 Min. premix 1.00 1.00 1.00 1.00 Mold Inhibitor 1.00 1.00 1.00 1.00 T-Premix 1.00 1.00 1.00 1.00 .06% Selenium Premix 1.00 1.00 1.00 1.00 Choline Cl 60% 0.83 1.02 Calculated Analysis Protein % 17.00 16.00 15.00 14.00 ME kcal/kg 2926.0 2926.0 2926.0 2860.0 Calcium % 4.35 4.35 4.35 4.45 T. Phos. % 0.56 0.52 0.49 0.47 Lysine % 0.80 0.74 0.70 0.68 TSAA % 0.70 0.65 0.62 0.58

10

Table 10. 38th NCLP&MT Laying Periods Feed Formulations Molt and Resting Diets

Ingredient Molt Diets

Low ME Resting

Corn 702.50

1427.70

Corn Gluten Meal

Soybean Hulls 1164.77

226.00

Soybean Meal 48%

117.00

Wheat Midds 18.26

186.50

Coarse Limestone 17.78

16.50

Phosphate Mono/D 69.84

4.00

Bentonite

Salt 9.16

5.00

Methionine 2.69

1.30

Choline Chloride

Vit. premix 1.00

1.00

Min. premix 1.00

1.00

T - Premix 1.00

1.00

Fat 9.99

10.00

MYC-OUT 65 1.00

2.00

.06% Sel Premix 1.00

1.00

Total 2000

2000

Calculated Analysis

Protein % 9.92

11.75

Me kcal/kg 1650

2859

Calcium % 1.33

3.80

T. Phos % 0.88

0.44

Lysine % 0.42

0.55

TSAA % 0.35

0.49

11

Data Collection Schedule and Procedures:

Age at 50% Production (Maturity) - The first day at which the birds in the individual replicates achieved 50% production. Egg Production - All eggs that had the potential of being marketed were credited toward the test unit's (replicate) egg production, regardless of the shell condition at the time of collection. All eggs were collected and recorded daily. Egg production was summarized at twenty-eight day intervals, and was calculated and reported on a Hen-Housed and Hen-Day basis. Egg Weight--At twenty-eight day intervals, all eggs produced in the previous 24-hour period were weighed and sorted by size (See egg size distribution). Percentages of eggs within each size category, average egg weight (g), and egg mass (g) were calculated and reported. Egg Quality--At twenty-eight day intervals, all eggs produced within the previous 24 hours were examined by candling light and graded according to current USDA standards for egg quality. Eggs were graded in the pilot processing facility and handled as they would be in a commercial off-line facility. Egg Size Distribution--At twenty-eight day intervals, all eggs produced within the previous 24 hours were weighed and sorted according to current USDA standards for egg size. Egg Income--Egg income was calculated using current year regional average prices for farm value of eggs based on egg production and quality evaluation. Feed Consumption and Conversion--All feed offered for consumption was recorded for each replicate. At twenty-eight day intervals, feed not consumed was weighed back and feed consumption was calculated. Daily feed intake (kg/100 hens/day) was calculated and reported for each strain. Feed Costs--Feed costs were based on the actual current feed prices for each feed delivery which were calculated and summarized for the complete production cycle. Body weights—Birds were weighed and weights recorded at housing (17 wk), end of 1st cycle (69 wks), start of the 2nd cycle (73 wk), and at the end of the 2nd cycle (110 wk) . Body weight gain for the 1st cycle was calculated and reported for each strain. In the Molt period lowest body weight, percent weight loss, 73 wk body weights were taken or calculated and reported for each strain. Mortality--All mortalities were recorded daily, and obvious accidents or hens used for experiment sampling were not included in reported mortalities.

Statistical Analyses and Separation of Means:

All data were subjected to ANOVA utilizing the GLM procedure of SAS, with main effects of strain and density. Separate analyses were conducted for white and brown egg strains. Significant differences (P < 0.01) within white and brown egg strains are noted by differing letters among columns of means. The layer houses were not significant; therefore, data for houses 4 and 5 were pooled in this analysis. First and second order interactions were tested for significance. The LS Means from the GLM Procedure were separated via the PDIFF option.

DESCRIPTION OF DATA TABLE STATISTICS

First cycle performance of white and brown egg strains are shown on Tables 14 to 19. The molt period performance and weight loss data of the white egg strains are shown on Tables 20 to 27 and for the brown egg strains Tables 28 to35. The post molt performance of the white egg strains are shown on Tables 36 to 41 and for the brown egg strains Tables 42 to 47. Overall performance of the white egg strains are shown on Tables 48 to 53 and for the brown egg strains Tables 54 to 59. Overall body weight gains of the white egg strains are shown on Tables 60 and for the brown egg strains Tables 61.

Breeder (Strain):

Short identification codes of the breeder and strain of the stock were developed. See more complete information following data tables in Table 64.

12

Hen Housed Eggs per Bird: The total number of eggs produced divided by the number of birds housed at 119 days. Hen Day Egg Production: The average daily number of eggs produced per 100 hens per day. Egg Mass: The average daily production of egg mass in grams per hen day. Mortality: The percentage of birds which died between 119 through 483 days of age, 483 through 512 which occurred during the molt period, and 512-763 are reported separately. These percentages are combined for the 119 through 763 report tables. Feed Consumption: The kilograms of feed consumed daily per 100 hens. Feed Conversion: The grams of egg produced per gram of feed consumed. Egg Weight: The average egg weight (gms) for each period sampled. Weight of all eggs collected from previous 24 hours divided by the number of eggs collected. Egg Income: The calculated income per hen housed at 119 days, from egg production using current year regional average egg prices 5/5/2010 to 6/1/2011and from 6/1/2011 to 2/15/2012. Table 11. Three Year Regional Average Egg Prices

Grade Size $$/Dozen 1st Cycle and Molt $$/Dozen 2nd Cycle

A Extra Large 1.19 1.33

A Large 1.16 1.29

A Medium 0.93 1.04

A Small 0.79 0.91

A1 Pee Wee 0.39 0.46

B2 All 0.61 0.68

Checks2 All 0.61 0.68 1Based upon pricing calculation D.D. Bell (PeeWee $= A Small $ x 0.5) 2 Based upon pricing calculation D.D. Bell (Checks and B $= A Large $ x 0.53)

Grade Information:

The average grade of all eggs sampled according to USDA grading standards over all sampling periods. Grades are established by personnel trained in USDA grading standards.

13

Egg Size Distribution:

Following are the size classifications used for establishing the USDA egg size grading. There has been blending of egg size in this test with the weight cut off between medium and large being 23.5. This maximizes the number of USDA large eggs just as would occur in a commercial plant. The proportion of the eggs falling into the following size categories are reported in the tables. Table 12. USDA Egg Weights Used To Establish The Egg Size Distribution Weighted for Large Eggs.

Size Category Ounces/Dozen

Pee Wee < 18

Small 18 – 21

Medium 21 - 23.5

Large 23.5 – 27

Extra Large > 27 Feed Cost: The calculated feed cost per hen housed at 119 days, using the pounds/diet consumed and the average price of each diet per ton. Table 13. The Average Contract Feed Price For Feed Purchases During The First Cycle.

Diets Price Per Ton 1st Cycle Price Per Ton 2nd Cycle

D 325.30

E 333.13 426.63

F 344.43 416..40

G 360.23 436.40

H 376.58 427.90

I 399.70 396.87

Molt Diet LP/LE 336.40

Resting 362.00

M 380.34

N 368.80

O 341.12

Metric Conversions:

1 lb = 453.6 g 1 g = .03527 oz 1 lb = .4536 kg 1 kg = 2.204 lb 1 oz = 28.35 g 1 g = 1000 mg

1 kg = 1000 g

14

TABLE 14. EFFECT OF WHITE EGG STRAIN AND DENSITY ON PERFORMANCE OF HENS IN THE 38th NCLP&MT (119-483 DAYS)

Eggs Age at Feed Feed Per Bird Egg Egg 50%

Breeder Density1 Consumption Conversion Housed Production Mass Mortality Production (Strain) (in2/hen) (kg/100/hen/d) (g egg/g feed) (HD%) (g/HD) (%) (Days)

Hy-Line 73 9.8 0.50 294.6 82.1 49.5 1.8 145.8 W-36 77 10.1 0.49 299.1 82.9 50.3 1.6 146.5

Average 10.0D 0.49AB 296.9DE 82.5E 49.9C 1.7E 146.1B Hy-Line 73 10.9 0.47 293.3 82.5 52.2 4.8 140.7 W-98 77 10.8 0.49 292.1 84.0 53.6 6.3 139.5

Average 10.8ABC 0.48B 292.7E 83.3DE 52.9B 5.5ABCDE 140.1E H&N 73 10.7 0.48 301.9 85.5 52.7 7.0 143.9 Nick Chick 77 11.0 0.48 307.3 87.2 54.0 5.0 142.7

Average 10.8ABC 0.48B 304.6ABCD 86.3AB 53.4AB 6.0ABCD 143.3CD Lohmann 73 11.0 0.48 300.1 86.1 53.0 9.5 144.9 LSL-Lite 77 11.0 0.48 311.0 87.4 53.8 5.0 144.9

Average 11.0A 0.48B 305.6ABC 86.8AB 53.4AB 7.3ABC 144.9BC Bovans 73 10.5 0.49 299.4 86.6 52.5 10.6 144.2 White 77 10.7 0.48 305.3 87.0 52.5 8.1 146.0

Average 10.6BC 0.48B 302.3BCD 86.8AB 52.5B 9.4A 145.1BC Shaver 73 9.8 0.50 298.1 84.0 50.6 4.8 149.5 White 77 10.0 0.50 305.1 85.3 51.0 2.1 149.5

Average 9.9D 0.50A 301.6CD 84.6CD 50.8C 3.4CDE 149.5A DeKalb 73 10.9 0.48 309.7 86.2 53.1 4.4 142.8 White 77 11.0 0.48 310.6 87.1 54.0 4.3 143.8

Average 10.9AB 0.48B 310.2AB 86.7AB 53.6AB 4.3BCDE 143.3CD ISA Babcock 73 11.0 0.49 311.5 86.5 54.1 2.0 143.2 White 77 10.9 0.49 313.9 87.4 54.6 3.1 141.5

Average 11.0AB 0.49AB 312.7A 86.9A 54.4A 2.5DE 142.3DE ISA 73 10.3 0.51 300.4 86.1 52.7 7.7 141.1 Exp. White 77 10.7 0.50 313.5 87.2 53.6 4.2 141.0

Average 10.5C 0.50A 307.0ABC 86.7AB 53.1B 5.9ABCD 141.0DE Novogen 73 10.8 0.48 299.0 84.4 53.4 7.0 146.3 White 77 10.7 0.48 304.8 84.7 52.9 3.8 146.2

Average 10.8ABC 0.48B 301.9CD 84.5CD 53.1B 5.4BCDE 146.2B Bovans 73 10.6 0.49 300.0 85.4 52.7 8.1 146.4 Robust 77 10.6 0.49 301.2 85.4 52.7 7.0 144.0

Average 10.6BC 0.49AB 300.6CDE 85.4BC 52.7B 7.5AB 145.2BC

All 73 10.6 0.49 300.7Z 85.0Z 52.4Z 6.2 144.4 Strains 77 10.7 0.49 305.8Y 86.0Y 53.0Y 4.6 144.1 1All strains were housed such that each strain is equally represented in each density. A,B,C,D,E - Different letters denote significant differences (P<.01), comparisons made among strain average values. Y,Z - Different letters denote significant differences (P<.01), comparisons made among density average values.

15

TABLE 15. EFFECT OF WHITE EGG STRAIN AND DENSITY ON EGG WEIGHT AND EGG SIZE DISTRIBUTION OF HENS IN THE 38th NCLP&MT (119-483 DAYS)

Egg Pee Extra Breeder Density1 Weight Wee Small Medium Large Large (Strain) (in2/hen) (g/egg) (%) (%) (%) (%) (%)

Hy-Line 73 59.3 0.3 6.8 11.0 27.6 53.9 W-36 77 59.8 0.4 4.2 12.7 25.7 56.8

Average 59.5DE 0.3 5.5BCD 11.9A 26.6BC 55.4DE Hy-Line 73 62.6 0.1 4.0 9.7 15.3 70.6 W-98 77 63.0 0.3 3.9 9.1 14.5 72.1

Average 62.8A 0.2 3.9D 9.4B 14.9F 71.4A H&N 73 60.7 0.1 4.8 9.7 23.7 61.4 Nick Chick 77 60.9 0.2 5.2 10.0 21.7 62.7

Average 60.8BC 0.2 5.0BCD 9.8AB 22.7CDE 62.1BC Lohmann 73 60.5 0.0 6.8 8.0 25.2 59.6 LSL-Lite 77 60.3 0.1 5.5 10.2 23.6 60.4

Average 60.4CD 0.1 6.1AB 9.1B 24.4CD 60.0CD Bovans 73 59.3 0.3 5.4 12.3 28.5 53.2 White 77 59.1 0.4 6.6 11.2 29.1 52.6

Average 59.2EF 0.3 6.0ABC 11.7A 28.8B 52.9EF Shaver 73 58.6 0.2 7.2 10.2 34.6 47.6 White 77 58.6 0.5 8.3 9.0 33.9 48.2

Average 58.6F 0.4 7.7A 9.6B 34.2A 47.9F DeKalb 73 60.6 0.2 6.0 8.8 23.2 61.8 White 77 60.7 0.3 6.2 8.2 20.6 64.5

Average 60.7BC 0.2 6.1AB 8.5B 21.9DE 63.1BC ISA Babcock 73 61.6 0.1 3.6 8.8 19.9 67.1 White 77 61.6 0.3 4.6 8.9 19.9 65.8

Average 61.6B 0.2 4.1CD 8.8B 19.9E 66.5AB ISA 73 60.4 0.2 4.8 10.1 24.8 59.9 Exp. White 77 60.5 0.2 4.8 9.4 24.7 60.6

Average 60.5CD 0.2 4.8BCD 9.7AB 24.7BCD 60.2CD Novogen 73 61.9 0.1 4.5 7.8 20.3 66.7 White 77 61.0 0.2 5.7 8.8 23.9 61.1

Average 61.5B 0.1 5.1BCD 8.3B 22.1DE 63.9BC Bovans 73 60.5 0.2 6.5 9.4 21.2 62.5 Robust 77 60.6 0.3 5.8 9.7 23.7 59.9

Average 60.5C 0.2 6.1AB 9.6B 22.4DE 61.2BC

All 73 60.5 0.2 5.5 9.6 24.0 60.4 Strains 77 60.6 0.3 5.5 9.7 23.7 60.4

1All strains were housed such that each strain is equally represented in each density A,B,C,D,E,F - Different letters denote significant differences (P<.01), comparisons made among strain average values.

16

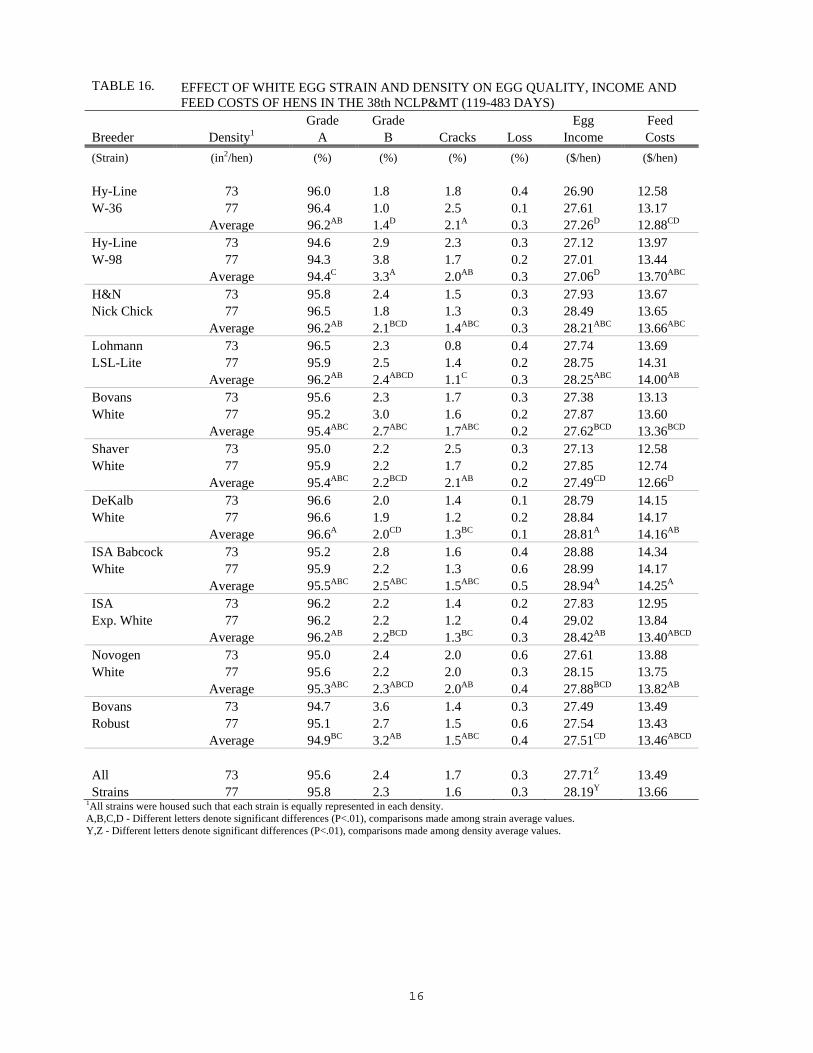
TABLE 16. EFFECT OF WHITE EGG STRAIN AND DENSITY ON EGG QUALITY, INCOME AND

FEED COSTS OF HENS IN THE 38th NCLP&MT (119-483 DAYS) Grade Grade Egg Feed

Breeder Density1 A B Cracks Loss Income Costs (Strain) (in2/hen) (%) (%) (%) (%) ($/hen) ($/hen)

Hy-Line 73 96.0 1.8 1.8 0.4 26.90 12.58 W-36 77 96.4 1.0 2.5 0.1 27.61 13.17

Average 96.2AB 1.4D 2.1A 0.3 27.26D 12.88CD Hy-Line 73 94.6 2.9 2.3 0.3 27.12 13.97 W-98 77 94.3 3.8 1.7 0.2 27.01 13.44

Average 94.4C 3.3A 2.0AB 0.3 27.06D 13.70ABC H&N 73 95.8 2.4 1.5 0.3 27.93 13.67 Nick Chick 77 96.5 1.8 1.3 0.3 28.49 13.65

Average 96.2AB 2.1BCD 1.4ABC 0.3 28.21ABC 13.66ABC Lohmann 73 96.5 2.3 0.8 0.4 27.74 13.69 LSL-Lite 77 95.9 2.5 1.4 0.2 28.75 14.31

Average 96.2AB 2.4ABCD 1.1C 0.3 28.25ABC 14.00AB Bovans 73 95.6 2.3 1.7 0.3 27.38 13.13 White 77 95.2 3.0 1.6 0.2 27.87 13.60

Average 95.4ABC 2.7ABC 1.7ABC 0.2 27.62BCD 13.36BCD Shaver 73 95.0 2.2 2.5 0.3 27.13 12.58 White 77 95.9 2.2 1.7 0.2 27.85 12.74

Average 95.4ABC 2.2BCD 2.1AB 0.2 27.49CD 12.66D DeKalb 73 96.6 2.0 1.4 0.1 28.79 14.15 White 77 96.6 1.9 1.2 0.2 28.84 14.17

Average 96.6A 2.0CD 1.3BC 0.1 28.81A 14.16AB ISA Babcock 73 95.2 2.8 1.6 0.4 28.88 14.34 White 77 95.9 2.2 1.3 0.6 28.99 14.17

Average 95.5ABC 2.5ABC 1.5ABC 0.5 28.94A 14.25A ISA 73 96.2 2.2 1.4 0.2 27.83 12.95 Exp. White 77 96.2 2.2 1.2 0.4 29.02 13.84

Average 96.2AB 2.2BCD 1.3BC 0.3 28.42AB 13.40ABCD Novogen 73 95.0 2.4 2.0 0.6 27.61 13.88 White 77 95.6 2.2 2.0 0.3 28.15 13.75

Average 95.3ABC 2.3ABCD 2.0AB 0.4 27.88BCD 13.82AB Bovans 73 94.7 3.6 1.4 0.3 27.49 13.49 Robust 77 95.1 2.7 1.5 0.6 27.54 13.43

Average 94.9BC 3.2AB 1.5ABC 0.4 27.51CD 13.46ABCD

All 73 95.6 2.4 1.7 0.3 27.71Z 13.49 Strains 77 95.8 2.3 1.6 0.3 28.19Y 13.66

1All strains were housed such that each strain is equally represented in each density. A,B,C,D - Different letters denote significant differences (P<.01), comparisons made among strain average values. Y,Z - Different letters denote significant differences (P<.01), comparisons made among density average values.

17

TABLE 17. EFFECT OF BROWN EGG STRAIN AND DENSITY ON PERFORMANCE OF HENS IN THE 38th

NCLP&MT (119-483 DAYS) Eggs Age at

Feed Feed Per Bird Egg Egg 50% Breeder Density1 Consumption Conversion Housed Production Mass Mortality Production (Strain) (in2/hen) (kg/100/hen/d) (g egg/g feed) (HD%) (g/HD) (%) (Days)

Hy-Line 73 10.5 0.49 292.9 82.1 52.2 4.0 145.8 Brown 77 10.7 0.49 303.5 83.8 53.4 0.8 143.3

Average 10.6 0.49A 298.2AB 83.0B 52.8AB 2.4C 144.5AB

Hy-Line 73 10.7 0.47 302.7 84.7 50.3 2.6 143.5 Silver Brown 77 10.8 0.46 302.4 85.6 50.8 5.0 143.4

Average 10.8 0.46BC 302.5AB 85.2A 50.6D 3.8BC 143.5AB

TETRA 73 10.8 0.46 283.8 80.4 50.8 7.0 144.3 Brown 77 10.8 0.47 282.5 82.0 51.7 8.8 142.2

Average 10.8 0.47B 283.2C 81.2C 51.2CD 7.9AB 143.2BC

TETRA 73 10.6 0.46 295.4 82.9 49.3 5.5 141.1 Amber 77 11.0 0.44 292.2 83.7 49.1 7.3 140.5

Average 10.8 0.45C 293.8B 83.3B 49.2E 6.4ABC 140.8C

ISA 73 10.9 0.48 297.7 83.5 53.3 5.1 146.8 Brown 77 11.2 0.47 302.6 85.5 54.0 6.2 144.9

Average 11.0 0.48AB 300.1AB 84.5AB 53.7A 5.7ABC 145.8A

Bovans 73 10.6 0.49 304.1 84.8 52.8 5.6 144.5 Brown 77 10.9 0.49 305.8 85.3 53.7 2.7 144.2

Average 10.8 0.49A 305.0A 85.0A 53.2AB 4.1ABC 144.4AB

Novogen 73 10.9 0.47 290.2 83.5 51.4 9.9 144.7 Brown 77 10.9 0.47 297.6 84.5 52.6 6.2 144.7

Average 10.9 0.47B 293.9B 84.0AB 52.0BC 8.1A 144.7AB

All 73 10.7 0.47 295.3 83.1 Z 51.4 Z 5.7 144.4 Strains 77 10.9 0.47 298.1 84.3 Y 52.2 Y 5.3 143.3

NCSU Barred 73 9.1 0.32 191.5 55.0 29.9 4.7 159.0 Plym. Rock 77 9.9 0.30 183.6 55.2 31.0 9.5 171.7

1All strains were housed such that each strain is equally represented in each density. A,B,C,D - Different letters denote significant differences (P<.01), comparisons made among strain average values. Y,Z - Different letters denote significant differences (P<.01), comparisons made among density average values.

18

TABLE 18. EFFECT OF BROWN EGG STRAIN AND DENSITY ON EGG WEIGHT AND EGG SIZE DISTRIBUTION OF HENS IN THE 38th NCLP&MT (119-483 DAYS)

Egg Pee Extra Breeder Density1 Weight Wee Small Medium Large Large (Strain) (in2/hen) (g/egg) (%) (%) (%) (%) (%)

Hy-Line 73 62.8 0.0 1.3 8.3 20.5 69.6 Brown 77 62.9 0.1 1.2 7.9 20.2 70.3

Average 62.8A 0.0 1.3C 8.1C 20.4C 69.9A

Hy-Line 73 58.7 0.4 3.7 13.4 37.5 44.8 Silver Brown 77 58.5 0.0 2.9 15.3 34.2 47.4

Average 58.6D 0.2 3.3B 14.4A 35.9A 46.1D

TETRA 73 62.2 0.0 3.1 8.9 19.8 67.6 Brown 77 62.2 0.1 2.9 8.8 21.1 66.9

Average 62.2AB 0.1 3.0B 8.8BC 20.5C 67.3AB

TETRA 73 58.7 0.1 5.2 13.7 32.5 48.0 Amber 77 57.7 0.0 7.7 15.3 36.0 40.8

Average 58.2D 0.1 6.5A 14.5A 34.3A 44.4D

ISA 73 62.8 0.0 3.5 6.8 19.5 69.9 Brown 77 62.2 0.2 3.8 8.7 20.2 67.0

Average 62.5AB 0.1 3.6B 7.7C 19.9C 68.4A

Bovans 73 61.4 0.0 2.7 9.4 25.9 61.9 Brown 77 62.1 0.1 2.1 8.8 23.6 65.1

Average 61.7BC 0.1 2.4BC 9.1BC 24.8B 63.5BC

Novogen 73 60.6 0.3 3.3 10.2 26.5 59.4 Brown 77 61.5 0.2 2.8 10.7 22.8 63.2 Average 61.0C 0.3 3.0B 10.4B 24.7B 61.3C All 73 61.0 0.1 3.3 10.1 26.0 60.2 Strains 77 61.0 0.1 3.3 10.8 25.5 60.1 NCSU Barred 73 52.5 1.3 19.0 26.3 36.6 16.1 Plym. Rock 77 52.7 2.0 17.2 26.6 36.1 17.0

1All strains were housed such that each strain is equally represented in each density. A,B,C,D - Different letters denote significant differences (P<.01), comparisons made among strain average values.

19

TABLE 19. EFFECT OF BROWN EGG STRAIN AND DENSITY ON EGG QUALITY, INCOME AND FEED COSTS OF HENS IN THE 38th NCLP&MT (119-483 DAYS)

Grade Grade Egg Feed Breeder Density1 A B Cracks Loss Income Costs (Strain) (in2/hen) (%) (%) (%) (%) ($/hen) ($/hen)

Hy-Line 73 96.1 1.5de 2.1 0.3 27.61 13.88 Brown 77 96.3 1.8bcde 1.7 0.3 28.61 14.64

Average 96.2AB 1.6 1.9 0.3 28.11AB 14.26

Hy-Line 73 95.7 2.5bcd 1.5 0.3 27.72 14.36 Silver Brown 77 97.3 1.0e 1.5 0.2 28.01 14.33

Average 96.5A 1.8 1.5 0.2 27.87AB 14.34

TETRA 73 94.9 2.2bcde 2.4 0.5 26.30 14.09 Brown 77 95.3 2.9bcd 1.6 0.2 26.36 14.02

Average 95.1ABC 2.6 2.0 0.4 26.33C 14.05

TETRA 73 95.0 2.9bcd 1.7 0.4 26.85 14.22 Amber 77 96.3 1.7bcde 1.9 0.2 26.45 14.25

Average 95.6AB 2.3 1.8 0.3 26.65C 14.24

ISA 73 93.4 4.8a 1.6 0.3 27.57 14.56 Brown 77 94.8 3.6a 1.5 0.2 28.08 14.80

Average 94.1C 4.2 1.5 0.2 27.83AB 14.68

Bovans 73 96.4 1.6cde 1.9 0.2 28.51 14.31 Brown 77 95.3 3.0bc 1.5 0.2 28.56 14.50

Average 95.8AB 2.3 1.7 0.2 28.54A 14.41

Novogen 73 94.7 3.1b 1.9 0.3 26.77 14.11 Brown 77 95.3 2.9bcd 1.6 0.2 27.60 14.34 Average 95.0BC 3.0 1.7 0.3 27.18BC 14.23 All 73 95.2 2.7 1.9 0.3 27.33 14.22 Strains 77 95.8 2.4 1.6 0.2 27.67 14.41 NCSU Barred 73 87.4 9.0 2.9 0.7 15.36 12.13 Plym. Rock 77 94.2 3.2 1.5 1.1 15.06 12.54

1All strains were housed such that each strain is equally represented in each density. A,B,C - Different letters denote significant differences (P<.01), comparisons made among strain average values. a,b,c,d,e - Different letters denote significant differences (P<.01) in the strain*density interactions.

20

TABLE 20. EFFECT OF WHITE EGG STRAIN AND DENSITY ON PERFORMANCE OF HENS IN THE 38th NCLP&MT (483-511 DAYS) NON-MOLTED

Eggs Feed Feed Per Bird Egg Egg

Breeder Density1 Consumption Conversion Housed Production Mass Mortality (Strain) (in2/hen) (kg/100/hen/d) (g egg/g feed) (HD%) (g/HD) (%)

Hy-Line 73 9.9 0.53 21.3 78.0 51.5 0.0 W-36 77 10.3 0.52 22.3 80.9 53.7 1.3

Average 10.1C 0.52 21.8 79.4 52.6C 0.6 Hy-Line 73 11.8 0.50 22.6 84.1 59.0 0.0 W-98 77 13.0 0.45 24.7 83.8 58.1 0.0

Average 12.4AB 0.48 23.7 84.0 58.6A 0.0 H&N 73 12.4 0.48 22.4 87.2 58.6 1.2 Nick Chick 77 11.7 0.50 23.0 86.5 58.6 0.0

Average 12.0AB 0.49 22.7 86.8 58.6A 0.6 Lohmann 73 12.1 0.51 21.8 92.4 60.7 0.0 LSL-Lite 77 12.0 0.48 22.6 85.0 56.1 0.0

Average 12.0AB 0.49 22.2 88.7 58.4AB 0.0 Bovans 73 11.8 0.48 22.6 88.1 56.7 1.2 White 77 12.1 0.49 22.8 89.3 58.9 0.0

Average 11.9AB 0.49 22.7 88.7 57.8AB 0.6 Shaver 73 10.9 0.51 23.7 86.5 55.4 0.0 White 77 11.3 0.48 23.0 85.0 53.0 1.7

Average 11.1BC 0.49 23.3 85.7 54.2BC 0.8 DeKalb 73 12.9 0.45 25.4 87.8 57.4 1.6 White 77 13.1 0.45 23.6 85.9 57.5 4.7

Average 13.0A 0.45 24.5 86.8 57.5AB 3.2 ISA Babcock 73 12.1 0.52 25.4 92.1 63.5 0.0 White 77 11.4 0.49 23.1 83.4 56.0 0.0

Average 11.7AB 0.51 24.2 87.7 59.7A 0.0 ISA 73 11.2 0.51 22.5 86.7 56.8 0.0 Exp. White 77 11.8 0.47 21.1 82.5 55.1 1.7

Average 11.5BC 0.49 21.8 84.6 55.9ABC 0.8 Novogen 73 11.7 0.48 22.0 82.5 55.6 0.0 White 77 11.4 0.50 22.7 85.5 56.8 1.3

Average 11.5BC 0.49 22.4 84.0 56.2ABC 0.6 Bovans 73 11.2 0.52 22.7 86.6 58.2 1.2 Robust 77 12.4 0.46 21.9 85.9 57.0 2.5

Average 11.8AB 0.49 22.3 86.2 57.6AB 1.9

All 73 11.6 0.50 22.9 86.5 57.6 0.5 Strains 77 11.9 0.48 22.8 84.9 56.4 1.2 1All strains were housed such that each strain is equally represented in each density. A,B,C - Different letters denote significant differences (P<.01), comparisons made among strain average values.

21

TABLE 21. EFFECT OF WHITE EGG STRAIN AND DENSITY ON EGG WEIGHT AND EGG SIZE DISTRIBUTION OF HENS IN THE 38th NCLP&MT (483-511 DAYS) NON-MOLTED

Egg Pee Extra Breeder Density1 Weight Wee Small Medium Large Large (Strain) (in2/hen) (g/egg) (%) (%) (%) (%) (%)

Hy-Line 73 66.2 0.0 0.0 0.0 21.7 78.3 W-36 77 66.3 0.0 0.0 0.0 21.3 77.3

Average 66.3BCD 0.0 0.0 0.0 21.5BC 77.8AB Hy-Line 73 70.2 0.0 0.0 0.0 1.9 93.7 W-98 77 69.4 0.0 0.0 0.0 8.1 91.9

Average 69.8A 0.0 0.0 0.0 5.0C 92.8A H&N 73 67.2 0.0 0.0 0.0 17.1 82.9 Nick Chick 77 67.8 0.0 0.0 0.0 15.8 81.4

Average 67.5BC 0.0 0.0 0.0 16.4C 82.2A Lohmann 73 65.7 0.0 0.0 0.0 23.4 76.6 LSL-Lite 77 65.9 0.0 0.0 0.0 20.1 79.9

Average 65.8CD 0.0 0.0 0.0 21.7BC 78.3AB Bovans 73 64.3 0.0 0.0 0.0 34.5 61.0 White 77 65.9 0.0 0.0 0.0 30.8 69.2

Average 65.1DE 0.0 0.0 0.0 32.6AB 65.1BC Shaver 73 64.0 0.0 0.0 0.0 35.7 64.3 White 77 62.4 0.0 0.0 0.0 57.0 43.0

Average 63.2E 0.0 0.0 0.0 46.4A 53.7C DeKalb 73 65.3 0.0 0.0 0.0 23.7 74.8 White 77 66.9 0.0 0.0 0.0 19.0 81.0

Average 66.1BCD 0.0 0.0 0.0 21.4BC 77.9AB ISA Babcock 73 69.0 0.0 0.0 0.0 13.0 87.0 White 77 67.1 0.0 0.0 0.0 16.4 82.4

Average 68.0AB 0.0 0.0 0.0 14.7C 84.7A ISA 73 65.5 0.0 0.0 0.0 22.5 77.6 Exp. White 77 66.7 0.0 0.0 0.0 12.3 87.7

Average 66.1BCD 0.0 0.0 0.0 17.4BC 82.6A Novogen 73 67.4 0.0 0.0 0.0 17.8 82.3 White 77 66.5 0.0 0.0 0.0 18.1 81.9

Average 66.9BCD 0.0 0.0 0.0 17.9BC 82.1A Bovans 73 67.1 0.0 0.0 0.0 18.2 80.4 Robust 77 66.5 0.0 0.0 0.0 24.7 75.3

Average 66.8BCD 0.0 0.0 0.0 21.5BC 77.9AB

All 73 66.5 0.0 0.0 0.0 20.8 78.1 Strains 77 66.5 0.0 0.0 0.0 22.1 77.4

1All strains were housed such that each strain is equally represented in each density. A,B,C,D - Different letters denote significant differences (P<.01), comparisons made among strain average values.

22

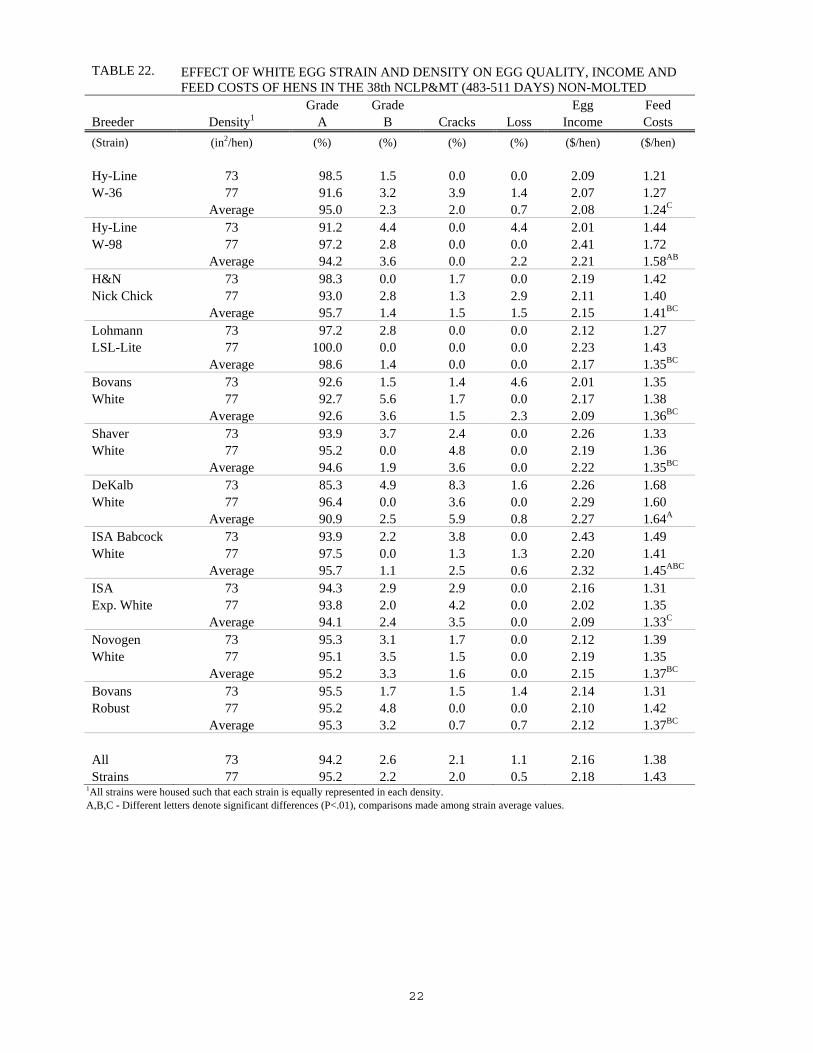
TABLE 22. EFFECT OF WHITE EGG STRAIN AND DENSITY ON EGG QUALITY, INCOME AND FEED COSTS OF HENS IN THE 38th NCLP&MT (483-511 DAYS) NON-MOLTED

Grade Grade Egg Feed Breeder Density1 A B Cracks Loss Income Costs (Strain) (in2/hen) (%) (%) (%) (%) ($/hen) ($/hen)

Hy-Line 73 98.5 1.5 0.0 0.0 2.09 1.21 W-36 77 91.6 3.2 3.9 1.4 2.07 1.27

Average 95.0 2.3 2.0 0.7 2.08 1.24C Hy-Line 73 91.2 4.4 0.0 4.4 2.01 1.44 W-98 77 97.2 2.8 0.0 0.0 2.41 1.72

Average 94.2 3.6 0.0 2.2 2.21 1.58AB H&N 73 98.3 0.0 1.7 0.0 2.19 1.42 Nick Chick 77 93.0 2.8 1.3 2.9 2.11 1.40

Average 95.7 1.4 1.5 1.5 2.15 1.41BC Lohmann 73 97.2 2.8 0.0 0.0 2.12 1.27 LSL-Lite 77 100.0 0.0 0.0 0.0 2.23 1.43

Average 98.6 1.4 0.0 0.0 2.17 1.35BC Bovans 73 92.6 1.5 1.4 4.6 2.01 1.35 White 77 92.7 5.6 1.7 0.0 2.17 1.38

Average 92.6 3.6 1.5 2.3 2.09 1.36BC Shaver 73 93.9 3.7 2.4 0.0 2.26 1.33 White 77 95.2 0.0 4.8 0.0 2.19 1.36

Average 94.6 1.9 3.6 0.0 2.22 1.35BC DeKalb 73 85.3 4.9 8.3 1.6 2.26 1.68 White 77 96.4 0.0 3.6 0.0 2.29 1.60

Average 90.9 2.5 5.9 0.8 2.27 1.64A ISA Babcock 73 93.9 2.2 3.8 0.0 2.43 1.49 White 77 97.5 0.0 1.3 1.3 2.20 1.41

Average 95.7 1.1 2.5 0.6 2.32 1.45ABC ISA 73 94.3 2.9 2.9 0.0 2.16 1.31 Exp. White 77 93.8 2.0 4.2 0.0 2.02 1.35

Average 94.1 2.4 3.5 0.0 2.09 1.33C Novogen 73 95.3 3.1 1.7 0.0 2.12 1.39 White 77 95.1 3.5 1.5 0.0 2.19 1.35

Average 95.2 3.3 1.6 0.0 2.15 1.37BC Bovans 73 95.5 1.7 1.5 1.4 2.14 1.31 Robust 77 95.2 4.8 0.0 0.0 2.10 1.42

Average 95.3 3.2 0.7 0.7 2.12 1.37BC

All 73 94.2 2.6 2.1 1.1 2.16 1.38 Strains 77 95.2 2.2 2.0 0.5 2.18 1.43

1All strains were housed such that each strain is equally represented in each density. A,B,C - Different letters denote significant differences (P<.01), comparisons made among strain average values.

23

TABLE 23. EFFECT OF WHITE EGG STRAIN AND DENSITY ON BODY WEIGHT OF HENS IN

THE 38th NCLP&MT (483-511 DAYS) NON-MOLTED 17 Wk 69 Wk 1st Cycle Lowest Molt 73 Wk

Breeder Density1 Body Wt Body Wt Wt Gain Body Wt Wt Loss Body Wt (Strain) (in2/hen) (kg) (kg) (%) (kg) (%) (kg)

Hy-Line 73 1.23 1.81 47.4 1.76 3.0 1.76 W-36 77 1.19 1.77 48.1 1.74 0.1 1.77

Average 1.21CDE 1.79BC 47.7B 1.75BCD 1.5ABC 1.76BCD Hy-Line 73 1.29 2.06 59.0 1.94 5.3 1.95 W-98 77 1.28 2.04 59.3 1.93 5.5 1.93

Average 1.29AB 2.05A 59.2A 1.93A 5.4A 1.94A H&N 73 1.27 1.79 40.8 1.77 -1.5 1.81 Nick Chick 77 1.30 1.91 47.6 1.90 -0.7 1.93

Average 1.28AB 1.85BC 44.2BC 1.83ABC -1.1BC 1.87AB Lohmann 73 1.23 1.81 47.5 1.81 -1.0 1.83 LSL-Lite 77 1.27 1.77 39.0 1.75 -0.6 1.78

Average 1.25BCD 1.79BCD 43.3BC 1.78BCD -0.8BC 1.80ABCD Bovans 73 1.20 1.73 44.3 1.73 -2.1 1.77 White 77 1.15 1.74 51.3 1.72 -1.0 1.76

Average 1.18E 1.74CD 47.8B 1.72CD -1.5BC 1.76BCD Shaver 73 1.20 1.68 40.6 1.68 -1.9 1.71 White 77 1.19 1.62 35.6 1.61 -1.9 1.65

Average 1.19DE 1.65D 38.1C 1.65D -1.9BC 1.68D DeKalb 73 1.24 1.78 42.7 1.71 3.4 1.71 White 77 1.28 1.88 46.6 1.82 2.6 1.82

Average 1.26BC 1.83BC 44.7BC 1.76BCD 3.0AB 1.77BCD ISA Babcock 73 1.32 1.87 41.4 1.87 -1.0 1.89 White 77 1.32 1.89 43.8 1.85 0.7 1.88

Average 1.32A 1.88B 42.6BC 1.86AB -0.2ABC 1.88AB ISA 73 1.30 1.82 39.8 1.74 3.5 1.75 Exp. White 77 1.28 1.71 33.9 1.67 1.1 1.69

Average 1.29AB 1.77BCD 36.8C 1.70CD 2.3ABC 1.72CD Novogen 73 1.29 1.82 41.4 1.82 -2.2 1.86 White 77 1.26 1.82 44.0 1.82 -2.5 1.86

Average 1.27AB 1.82BC 42.7BC 1.82ABC -2.3C 1.86ABC Bovans 73 1.20 1.74 44.8 1.73 -0.6 1.75 Robust 77 1.30 1.85 41.9 1.84 -1.2 1.87

Average 1.25BCD 1.79BC 43.4BC 1.79BC -0.9BC 1.81ABC

All 73 1.25 1.81 44.5 1.78 0.4 1.80 Strains 77 1.26 1.82 44.6 1.78 0.2 1.81

1All strains were housed such that each strain is equally represented in each density. A,B,C,D,E - Different letters denote significant differences (P<.01), comparisons made among strain average values.

24

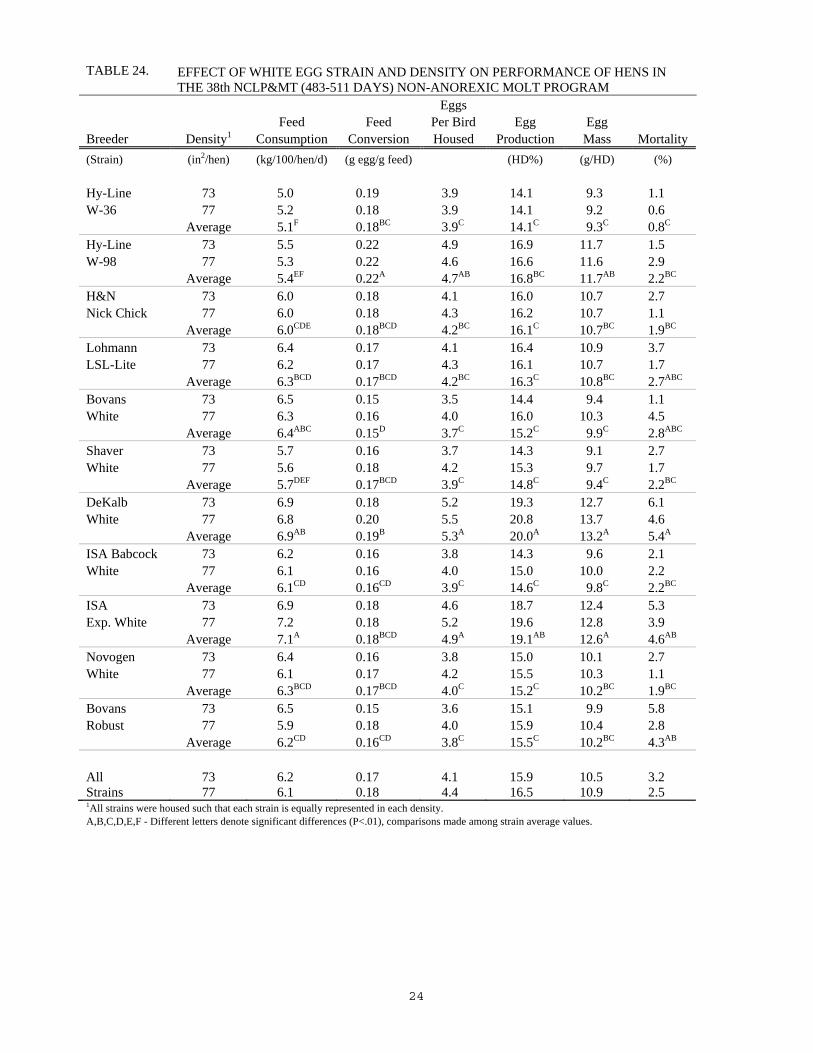
TABLE 24. EFFECT OF WHITE EGG STRAIN AND DENSITY ON PERFORMANCE OF HENS IN THE 38th NCLP&MT (483-511 DAYS) NON-ANOREXIC MOLT PROGRAM

Eggs Feed Feed Per Bird Egg Egg

Breeder Density1 Consumption Conversion Housed Production Mass Mortality (Strain) (in2/hen) (kg/100/hen/d) (g egg/g feed) (HD%) (g/HD) (%)

Hy-Line 73 5.0 0.19 3.9 14.1 9.3 1.1 W-36 77 5.2 0.18 3.9 14.1 9.2 0.6

Average 5.1F 0.18BC 3.9C 14.1C 9.3C 0.8C Hy-Line 73 5.5 0.22 4.9 16.9 11.7 1.5 W-98 77 5.3 0.22 4.6 16.6 11.6 2.9

Average 5.4EF 0.22A 4.7AB 16.8BC 11.7AB 2.2BC H&N 73 6.0 0.18 4.1 16.0 10.7 2.7 Nick Chick 77 6.0 0.18 4.3 16.2 10.7 1.1

Average 6.0CDE 0.18BCD 4.2BC 16.1C 10.7BC 1.9BC Lohmann 73 6.4 0.17 4.1 16.4 10.9 3.7 LSL-Lite 77 6.2 0.17 4.3 16.1 10.7 1.7

Average 6.3BCD 0.17BCD 4.2BC 16.3C 10.8BC 2.7ABC Bovans 73 6.5 0.15 3.5 14.4 9.4 1.1 White 77 6.3 0.16 4.0 16.0 10.3 4.5

Average 6.4ABC 0.15D 3.7C 15.2C 9.9C 2.8ABC Shaver 73 5.7 0.16 3.7 14.3 9.1 2.7 White 77 5.6 0.18 4.2 15.3 9.7 1.7

Average 5.7DEF 0.17BCD 3.9C 14.8C 9.4C 2.2BC DeKalb 73 6.9 0.18 5.2 19.3 12.7 6.1 White 77 6.8 0.20 5.5 20.8 13.7 4.6

Average 6.9AB 0.19B 5.3A 20.0A 13.2A 5.4A ISA Babcock 73 6.2 0.16 3.8 14.3 9.6 2.1 White 77 6.1 0.16 4.0 15.0 10.0 2.2

Average 6.1CD 0.16CD 3.9C 14.6C 9.8C 2.2BC ISA 73 6.9 0.18 4.6 18.7 12.4 5.3 Exp. White 77 7.2 0.18 5.2 19.6 12.8 3.9

Average 7.1A 0.18BCD 4.9A 19.1AB 12.6A 4.6AB Novogen 73 6.4 0.16 3.8 15.0 10.1 2.7 White 77 6.1 0.17 4.2 15.5 10.3 1.1

Average 6.3BCD 0.17BCD 4.0C 15.2C 10.2BC 1.9BC Bovans 73 6.5 0.15 3.6 15.1 9.9 5.8 Robust 77 5.9 0.18 4.0 15.9 10.4 2.8

Average 6.2CD 0.16CD 3.8C 15.5C 10.2BC 4.3AB

All 73 6.2 0.17 4.1 15.9 10.5 3.2 Strains 77 6.1 0.18 4.4 16.5 10.9 2.5 1All strains were housed such that each strain is equally represented in each density. A,B,C,D,E,F - Different letters denote significant differences (P<.01), comparisons made among strain average values.

25

TABLE 25. EFFECT OF WHITE EGG STRAIN AND DENSITY ON EGG WEIGHT AND EGG SIZE DISTRIBUTION OF HENS IN THE 38th NCLP&MT (483-511 DAYS) NON-ANOREXIC MOLT PROGRAM

Egg Pee Extra Breeder Density1 Weight Wee Small Medium Large Large (Strain) (in2/hen) (g/egg) (%) (%) (%) (%) (%)

Hy-Line 73 65.8 0.0 0.0 0.0 22.6 77.5 W-36 77 65.4 0.0 0.0 0.0 25.7 74.3

Average 65.6BC 0.0 0.0 0.0 24.1BC 75.9 CD Hy-Line 73 69.3 0.0 0.0 0.0 3.5 95.9 W-98 77 69.9 0.0 0.0 0.0 1.6 98.4

Average 69.6E 0.0 0.0 0.0 2.5E 97.2A H&N 73 66.5 0.0 0.0 0.0 22.6 77.4 Nick Chick 77 66.3 0.0 0.0 0.0 14.0 85.1

Average 66.4CD 0.0 0.0 0.0 18.3CD 81.2 BC Lohmann 73 66.3 0.0 0.0 0.0 22.3 77.7 LSL-Lite 77 66.1 0.0 0.0 0.0 14.0 86.0

Average 66.2CD 0.0 0.0 0.0 18.2CD 81.9 BC Bovans 73 65.6 0.0 0.0 0.0 25.8 74.2 White 77 64.5 0.0 0.0 0.0 31.8 68.2

Average 65.1B 0.0 0.0 0.0 28.8B 71.2D Shaver 73 64.0 0.0 0.0 0.0 41.0 58.5 White 77 63.7 0.0 0.0 0.0 39.1 59.7

Average 63.8A 0.0 0.0 0.0 40.1A 59.1E DeKalb 73 66.1 0.0 0.0 0.0 18.4 81.6 White 77 66.3 0.0 0.0 0.0 17.1 82.9

Average 66.2CD 0.0 0.0 0.0 17.8CD 82.3 BC ISA Babcock 73 66.9 0.0 0.0 0.0 13.4 86.6 White 77 67.0 0.0 0.0 0.0 15.6 84.4

Average 67.0D 0.0 0.0 0.0 14.5D 85.5B ISA 73 66.8 0.0 0.0 0.0 18.0 81.3 Exp. White 77 65.7 0.0 0.0 0.0 24.5 75.5

Average 66.2BCD 0.0 0.0 0.0 21.3BCD 78.4 BCD Novogen 73 67.1 0.0 0.0 0.0 15.8 84.2 White 77 67.1 0.0 0.0 0.0 19.6 79.6

Average 67.1CD 0.0 0.0 0.0 17.7CD 81.9 BC Bovans 73 66.0 0.0 0.0 0.0 20.7 79.3 Robust 77 65.4 0.0 0.0 0.0 25.6 74.4

Average 65.7BCD 0.0 0.0 0.0 23.2BCD 76.8 BCD

All 73 66.4 0.0 0.0 0.0 20.4 79.5 Strains 77 66.1 0.0 0.0 0.0 20.8 79.0

1All strains were housed such that each strain is equally represented in each density. A,B,C,D - Different letters denote significant differences (P<.01), comparisons made among strain average values.

26

TABLE 26. EFFECT OF WHITE EGG STRAIN AND DENSITY ON EGG QUALITY, INCOME AND FEED COSTS OF HENS IN THE 38th NCLP&MT (483-511 DAYS) NON-ANOREXIC MOLT PROGRAM

Grade Grade Egg Feed Breeder Density1 A B Cracks Loss Income Costs (Strain) (in2/hen) (%) (%) (%) (%) ($/hen) ($/hen)

Hy-Line 73 95.0 1.4 3.6 0.0 0.37 0.54 W-36 77 94.9 0.6 4.6 0.0 0.37 0.56

Average 94.9 1.0 4.1 0.0 0.37D 0.55C Hy-Line 73 90.3 5.7 3.4 0.6 0.46 0.64 W-98 77 92.5 4.7 2.8 0.0 0.43 0.57

Average 91.4 5.2 3.1 0.3 0.44BC 0.61BC H&N 73 93.2 4.4 2.3 0.0 0.39 0.61 Nick Chick 77 96.6 1.6 0.9 0.9 0.41 0.63

Average 94.9 3.0 1.6 0.4 0.40CD 0.62BC Lohmann 73 94.7 3.0 2.3 0.0 0.40 0.64 LSL-Lite 77 95.6 2.2 2.2 0.0 0.41 0.64

Average 95.1 2.6 2.3 0.0 0.40CD 0.64B Bovans 73 92.2 3.7 4.2 0.0 0.33 0.63 White 77 95.9 2.0 2.1 0.0 0.38 0.62

Average 94.0 2.8 3.1 0.0 0.36D 0.62B Shaver 73 94.1 2.9 2.4 0.6 0.35 0.59 White 77 93.8 0.8 4.2 1.2 0.39 0.61

Average 94.0 1.9 3.3 0.9 0.37D 0.60BC DeKalb 73 97.3 1.8 0.9 0.0 0.50 0.74 White 77 95.9 2.8 1.3 0.0 0.53 0.73

Average 96.6 2.3 1.1 0.0 0.52A 0.73A ISA Babcock 73 95.3 1.3 3.5 0.0 0.37 0.66 White 77 92.7 2.6 4.7 0.0 0.38 0.64

Average 94.0 2.0 4.1 0.0 0.38CD 0.65B ISA 73 95.6 1.7 2.1 0.7 0.45 0.69 Exp. White 77 98.1 0.0 1.9 0.0 0.51 0.76

Average 96.8 0.8 2.0 0.3 0.48AB 0.73A Novogen 73 92.6 4.6 2.8 0.0 0.36 0.64 White 77 92.3 4.0 3.0 0.7 0.39 0.65

Average 92.5 4.3 2.9 0.4 0.38CD 0.65B Bovans 73 96.4 2.8 0.8 0.0 0.35 0.62 Robust 77 94.3 3.9 1.8 0.0 0.38 0.59

Average 95.4 3.3 1.3 0.0 0.37D 0.61BC

All 73 94.2 3.0 2.6 0.2 0.39 0.64 Strains 77 94.8 2.3 2.7 0.3 0.42 0.64

1All strains were housed such that each strain is equally represented in each density. A,B,C,D - Different letters denote significant differences (P<.01), comparisons made among strain average values.

27

TABLE 27. EFFECT OF WHITE EGG STRAIN AND DENSITY ON BODY WEIGHT OF HENS IN THE 38th NCLP&MT (483-511 DAYS) NON-ANOREXIC MOLT PROGRAM

17 Wk 69 Wk 1st Cycle Lowest Molt 73 Wk Days to 0% Breeder Density1 Body Wt Body Wt Wt Gain Body Wt Wt Loss Body Wt Production (Strain) (in2/hen) (kg) (kg) (%) (kg) (%) (kg)

Hy-Line 73 1.20 1.81 51.2 1.39 19.4 1.46 8.3 W-36 77 1.21 1.80 48.1 1.32 20.9 1.42 7.9

Average 1.21FG 1.80B 49.6AB 1.35B 20.2 1.44CD 8.1BCD Hy-Line 73 1.34 1.98 48.3 1.49 18.4 1.62 7.7 W-98 77 1.32 2.00 51.8 1.51 19.0 1.62 7.0

Average 1.33AB 1.99A 50.0A 1.50A 18.7 1.62A 7.3D H&N 73 1.26 1.83 45.6 1.39 20.3 1.46 8.7 Nick Chick 77 1.28 1.85 44.1 1.37 20.4 1.47 8.4

Average 1.27DE 1.84B 44.8ABCD 1.38B 20.4 1.46BCD 8.6BCD Lohmann 73 1.28 1.81 41.9 1.35 20.4 1.44 8.8 LSL-Lite 77 1.29 1.85 42.9 1.39 20.6 1.47 9.3

Average 1.29CD 1.83B 42.4D 1.37B 20.5 1.46BCD 9.1AB Bovans 73 1.21 1.82 50.6 1.35 18.5 1.48 7.2 White 77 1.20 1.75 46.8 1.33 17.5 1.45 8.0

Average 1.20G 1.79B 48.7ABC 1.34BC 18.0 1.46BCD 7.6CD Shaver 73 1.20 1.69 41.3 1.26 18.7 1.37 7.4 White 77 1.23 1.73 40.8 1.29 17.8 1.42 8.4

Average 1.21FG 1.71C 41.0DE 1.28C 18.3 1.40D 7.9BCD DeKalb 73 1.28 1.77 38.4 1.34 20.5 1.41 8.3 White 77 1.30 1.82 39.8 1.38 16.3 1.52 7.8

Average 1.29BCD 1.80B 39.1DE 1.36B 18.4 1.47BCD 8.1BCD ISA Babcock 73 1.35 1.92 42.6 1.45 21.9 1.50 8.6 White 77 1.35 1.94 44.0 1.47 19.9 1.56 8.9

Average 1.35A 1.93A 43.3CD 1.46A 20.9 1.53B 8.7ABC ISA 73 1.32 1.80 36.2 1.38 17.0 1.49 9.8 Exp. White 77 1.32 1.78 35.1 1.33 15.0 1.51 10.0

Average 1.32ABC 1.79B 35.7E 1.35B 16.0 1.50BC 9.9A Novogen 73 1.27 1.78 41.1 1.34 21.1 1.41 8.6 White 77 1.24 1.77 42.6 1.31 20.2 1.41 8.9

Average 1.25DE 1.78BC 41.9D 1.32BC 20.7 1.41D 8.7ABC Bovans 73 1.23 1.80 46.6 1.37 18.1 1.48 8.3 Robust 77 1.26 1.77 40.9 1.33 19.1 1.43 8.8

Average 1.24EF 1.79B 43.8BCD 1.35B 18.6 1.45BCD 8.6BCD

All 73 1.27 1.82 44.0 1.37 19.5 1.47 8.3 Strains 77 1.27 1.82 43.4 1.37 18.8 1.48 8.5

1All strains were housed such that each strain is equally represented in each density. A,B,C,D,E,F,G - Different letters denote significant differences (P<.01), comparisons made among molt program average values.

28

TABLE 28. EFFECT OF BROWN EGG STRAIN AND DENSITY ON PERFORMANCE OF HENS IN THE 38th NCLP&MT (483-511 DAYS) NON-MOLTED

Eggs Feed Feed Per Bird Egg Egg

Breeder Density1 Consumption Conversion Housed Production Mass Mortality (Strain) (in2/hen) (kg/100/hen/d) (g egg/g feed) (HD%) (g/HD) (%)

Hy-Line 73 11.8 0.47 21.6 82.2 55.1 0.0 Brown 77 11.2 0.51 23.0 84.3 56.7 0.0

Average 11.5 0.49 22.3AB 83.3ABC 55.9AB 0.0

Hy-Line 73 10.5 0.50 22.5 83.6 52.0 1.2 Silver Brown 77 11.3 0.48 23.9 86.5 53.8 2.5

Average 10.9 0.49 23.2A 85.1AB 52.9BC 1.9

TETRA 73 10.7 0.44 19.0 70.6 46.9 1.2 Brown 77 12.4 0.44 19.8 80.6 54.8 1.3

Average 11.5 0.44 19.4C 75.6D 50.8C 1.2

TETRA 73 10.7 0.47 21.3 79.5 49.1 1.2 Amber 77 12.7 0.40 20.5 79.3 50.2 1.3

Average 11.7 0.43 20.9BC 79.4CD 49.7C 1.2

ISA 73 11.5 0.52 23.0 87.5 59.2 0.0 Brown 77 11.8 0.48 22.9 84.7 55.7 0.0

Average 11.6 0.50 22.9A 86.1A 57.4A 0.0

Bovans 73 11.1 0.50 23.1 86.3 55.7 1.6 Brown 77 11.8 0.50 23.2 87.3 59.2 0.0

Average 11.5 0.50 23.2A 86.8A 57.4A 0.8

Novogen 73 11.2 0.46 19.2 77.9 50.8 0.0 Brown 77 12.1 0.46 21.3 83.6 54.5 0.0

Average 11.6 0.46 20.3C 80.7BCD 52.6BC 0.0

All 73 11.1 0.48 21.4 81.1 52.7 Z 0.7 Strains 77 11.9 0.47 22.1 83.8 55.0 Y 0.7

NCSU Barred 73 9.1 0.30 11.7 44.0 26.6 0.0 Plym. Rock 77 11.5 0.24 10.9 43.2 26.2 0.0

1All strains were housed such that each strain is equally represented in each density. A,B,C,D - Different letters denote significant differences (P<.01), comparisons made among strain average values. Y,Z - Different letters denote significant differences (P<.01), comparisons made among density average values.

29

TABLE 29. EFFECT OF BROWN EGG STRAIN AND DENSITY ON EGG WEIGHT AND EGG SIZE DISTRIBUTION OF HENS IN THE 38th NCLP&MT (483-511 DAYS) NON-MOLTED

Egg Pee Extra Breeder Density1 Weight Wee Small Medium Large Large (Strain) (in2/hen) (g/egg) (%) (%) (%) (%) (%)

Hy-Line 73 67.0 0.0 0.0 0.0 21.8 78.2 Brown 77 67.2 0.0 0.0 0.0 15.5 84.5

Average 67.1A 0.0 0.0 0.0 18.7C 81.4A

Hy-Line 73 62.2 0.0 0.0 1.6 56.2 42.3 Silver Brown 77 62.2 0.0 0.0 1.5 56.0 42.6

Average 62.2B 0.0 0.0 1.5 56.1A 42.4C

TETRA 73 66.4 0.0 0.0 0.0 22.0 78.0 Brown 77 67.9 0.0 0.0 0.0 27.0 73.0

Average 67.2A 0.0 0.0 0.0 24.5C 75.5A

TETRA 73 61.8 0.0 0.0 0.0 54.3 45.7 Amber 77 63.3 0.0 0.0 0.0 56.6 43.4

Average 62.6B 0.0 0.0 0.0 55.5A 44.6C

ISA 73 67.6 0.0 0.0 0.0 19.3 79.0 Brown 77 65.7 0.0 0.0 0.0 29.3 70.7

Average 66.6A 0.0 0.0 0.0 24.3C 74.8A

Bovans 73 64.5 0.0 0.0 0.0 31.3 68.8 Brown 77 67.8 0.0 0.0 0.0 21.4 78.6

Average 66.1A 0.0 0.0 0.0 26.3BC 73.7AB

Novogen 73 65.1 0.0 0.0 0.0 39.6 60.4 Brown 77 65.2 0.0 0.0 0.0 44.4 55.7 Average 65.2A 0.0 0.0 0.0 42.0AB 58.0BC All 73 64.9 0.0 0.0 0.2 34.9 64.6 Strains 77 65.6 0.0 0.0 0.2 35.7 64.1 NCSU Barred 73 60.5 0.0 0.0 0.0 61.13 34.70 Plym. Rock 77 60.8 0.0 0.0 6.7 50.23 43.10

1All strains were housed such that each strain is equally represented in each density. A,B,C - Different letters denote significant differences (P<.01), comparisons made among strain average values.

30

TABLE 30. EFFECT OF BROWN EGG STRAIN AND DENSITY ON EGG QUALITY, INCOME AND FEED COSTS OF HENS IN THE 38th NCLP&MT (483-511 DAYS) NON-MOLTED

Grade Grade Egg Feed Breeder Density1 A B Cracks Loss Income Costs (Strain) (in2/hen) (%) (%) (%) (%) ($/hen) ($/hen)

Hy-Line 73 98.6 0.0 1.4 0.0 2.12 1.39 Brown 77 95.3 3.0 1.8 0.0 2.22 1.37

Average 96.9 1.5 1.6 0.0 2.17AB 1.38

Hy-Line 73 96.9 3.1 0.0 0.0 2.16 1.25 Silver Brown 77 97.1 1.5 1.5 0.0 2.29 1.39

Average 97.0 2.3 0.7 0.0 2.22A 1.32

TETRA 73 95.6 3.1 1.4 0.0 1.83 1.29 Brown 77 93.0 3.5 3.6 0.0 1.88 1.35

Average 94.3 3.3 2.5 0.0 1.85C 1.32

TETRA 73 94.1 6.0 0.0 0.0 2.02 1.29 Amber 77 96.5 1.6 1.9 0.0 1.97 1.47

Average 95.3 3.8 1.0 0.0 2.00BC 1.38

ISA 73 94.7 3.6 0.0 1.8 2.16 1.35 Brown 77 92.1 4.6 3.4 0.0 2.16 1.42

Average 93.4 4.1 1.7 0.9 2.16AB 1.38

Bovans 73 95.4 4.6 0.0 0.0 2.23 1.34 Brown 77 91.5 5.9 2.7 0.0 2.19 1.41

Average 93.4 5.2 1.3 0.0 2.21AB 1.37

Novogen 73 93.9 6.1 0.0 0.0 1.83 1.23 Brown 77 98.5 1.5 0.0 0.0 2.07 1.38 Average 96.2 3.8 0.0 0.0 1.95C 1.31 All 73 95.6 3.8 0.4 0.3 2.05 1.30 Strains 77 94.9 3.0 2.1 0.0 2.11 1.40 NCSU Barred 73 95.8 0.0 0.0 4.2 1.05 1.08 Plym. Rock 77 93.3 6.7 0.0 0.0 1.02 1.32

1All strains were housed such that each strain is equally represented in each density. A,B,C - Different letters denote significant differences (P<.01), comparisons made among strain average values.

31

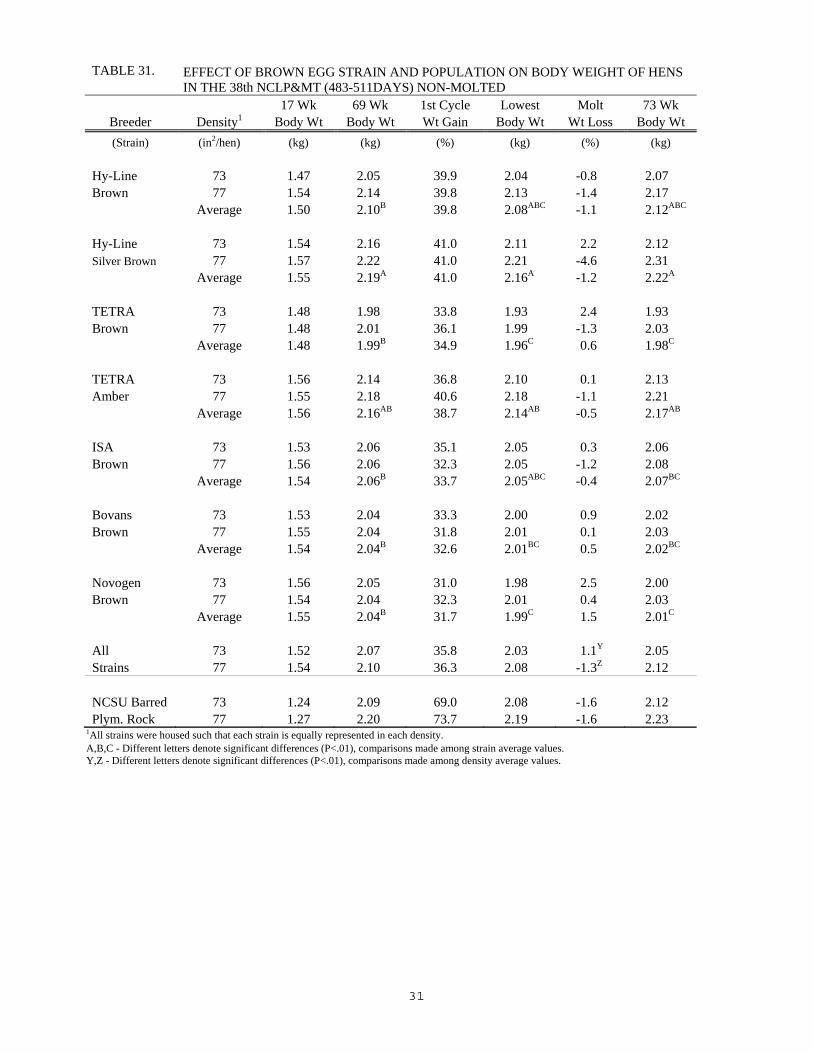
TABLE 31. EFFECT OF BROWN EGG STRAIN AND POPULATION ON BODY WEIGHT OF HENS IN THE 38th NCLP&MT (483-511DAYS) NON-MOLTED

17 Wk 69 Wk 1st Cycle Lowest Molt 73 Wk Breeder Density1 Body Wt Body Wt Wt Gain Body Wt Wt Loss Body Wt (Strain) (in2/hen) (kg) (kg) (%) (kg) (%) (kg)

Hy-Line 73 1.47 2.05 39.9 2.04 -0.8 2.07 Brown 77 1.54 2.14 39.8 2.13 -1.4 2.17

Average 1.50 2.10B 39.8 2.08ABC -1.1 2.12ABC

Hy-Line 73 1.54 2.16 41.0 2.11 2.2 2.12 Silver Brown 77 1.57 2.22 41.0 2.21 -4.6 2.31

Average 1.55 2.19A 41.0 2.16A -1.2 2.22A

TETRA 73 1.48 1.98 33.8 1.93 2.4 1.93 Brown 77 1.48 2.01 36.1 1.99 -1.3 2.03

Average 1.48 1.99B 34.9 1.96C 0.6 1.98C

TETRA 73 1.56 2.14 36.8 2.10 0.1 2.13 Amber 77 1.55 2.18 40.6 2.18 -1.1 2.21

Average 1.56 2.16AB 38.7 2.14AB -0.5 2.17AB

ISA 73 1.53 2.06 35.1 2.05 0.3 2.06 Brown 77 1.56 2.06 32.3 2.05 -1.2 2.08

Average 1.54 2.06B 33.7 2.05ABC -0.4 2.07BC

Bovans 73 1.53 2.04 33.3 2.00 0.9 2.02 Brown 77 1.55 2.04 31.8 2.01 0.1 2.03

Average 1.54 2.04B 32.6 2.01BC 0.5 2.02BC

Novogen 73 1.56 2.05 31.0 1.98 2.5 2.00 Brown 77 1.54 2.04 32.3 2.01 0.4 2.03 Average 1.55 2.04B 31.7 1.99C 1.5 2.01C All 73 1.52 2.07 35.8 2.03 1.1Y 2.05 Strains 77 1.54 2.10 36.3 2.08 -1.3Z 2.12 NCSU Barred 73 1.24 2.09 69.0 2.08 -1.6 2.12 Plym. Rock 77 1.27 2.20 73.7 2.19 -1.6 2.23

1All strains were housed such that each strain is equally represented in each density. A,B,C - Different letters denote significant differences (P<.01), comparisons made among strain average values. Y,Z - Different letters denote significant differences (P<.01), comparisons made among density average values.

32

TABLE 32. EFFECT OF BROWN EGG STRAIN AND DENSITY ON PERFORMANCE OF HENS IN THE 38th NCLP&MT (483-511 DAYS) NON-ANOREXIC MOLT PROGRAM

Eggs Feed Feed Per Bird Egg Egg

Breeder Density1 Consumption Conversion Housed Production Mass Mortality (Strain) (in2/hen) (kg/100/hen/d) (g egg/g feed) (HD%) (g/HD) (%)

Hy-Line 73 5.3 0.20 4.1 15.3 10.2 0.5 Brown 77 4.8 0.21 4.2 15.1 10.0 2.2

Average 5.1C 0.20AB 4.2B 15.2B 10.1B 1.4

Hy-Line 73 5.4 0.21 4.9 18.1 11.3 1.6 Silver Brown 77 5.9 0.24 5.9 22.9 14.2 1.1

Average 5.7AB 0.23A 5.4A 20.5A 12.8A 1.4

TETRA 73 6.0 0.18 3.9 15.7 10.5 2.1 Brown 77 5.8 0.17 3.9 14.9 9.9 1.1

Average 5.9A 0.18C 3.9B 15.3B 10.2B 1.6

TETRA 73 5.1 0.17 3.6 14.1 8.9 3.2 Amber 77 5.0 0.22 4.5 17.9 11.0 2.3

Average 5.1C 0.20ABC 4.1B 16.0B 10.0B 2.7

ISA 73 5.1 0.19 3.6 14.1 9.4 3.7 Brown 77 5.1 0.19 3.7 14.4 9.4 3.9

Average 5.1BC 0.19BC 3.7B 14.3B 9.4B 3.8

Bovans 73 5.3 0.20 4.2 16.6 10.9 3.7 Brown 77 5.2 0.21 4.4 16.3 10.8 5.6

Average 5.3BC 0.21AB 4.3B 16.5B 10.8B 4.6

Novogen 73 5.4 0.18 3.6 14.4 9.3 3.7 Brown 77 5.3 0.19 3.9 15.3 9.9 4.4

Average 5.3ABC 0.18BC 3.8B 14.8B 9.6B 4.1

All 73 5.4 0.19Z 4.0 15.5 10.1 2.7 Strains 77 5.3 0.20Y 4.4 16.7 10.8 3.0

1All strains were housed such that each strain is equally represented in each density. A,B,C,D - Different letters denote significant differences (P<.01), comparisons made among strain average values. Y,Z - Different letters denote significant differences (P<.01), comparisons made among density average values.

33

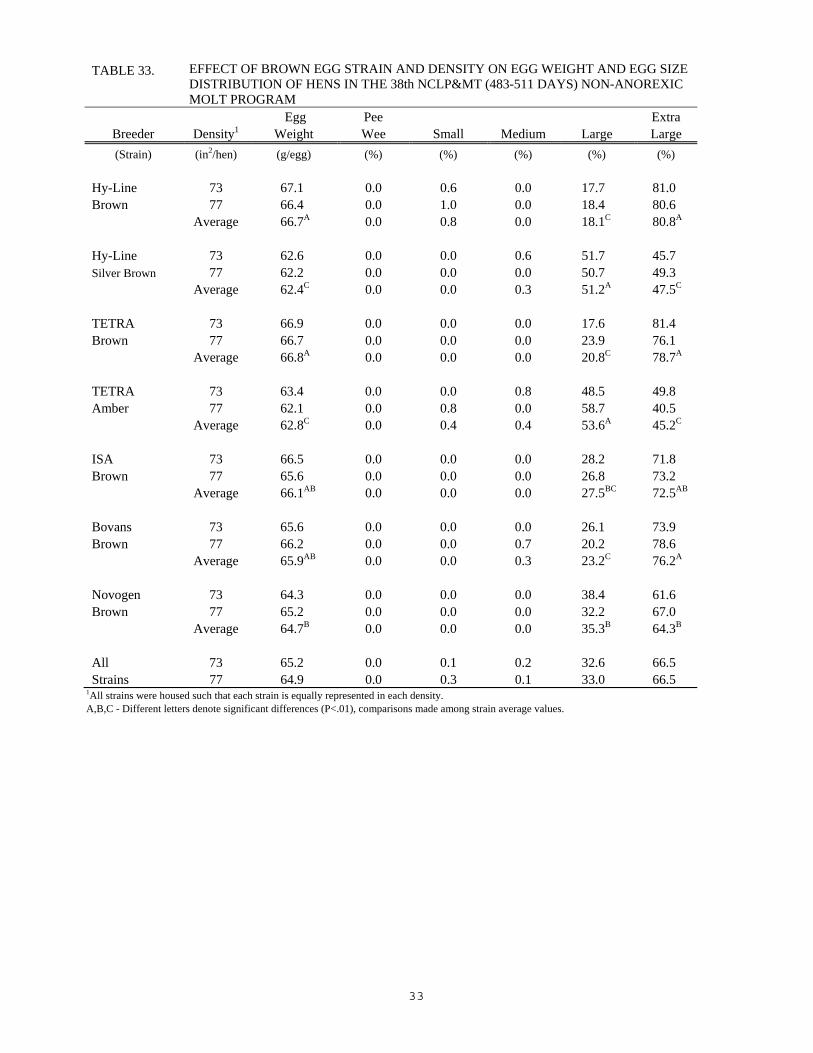
TABLE 33. EFFECT OF BROWN EGG STRAIN AND DENSITY ON EGG WEIGHT AND EGG SIZE DISTRIBUTION OF HENS IN THE 38th NCLP&MT (483-511 DAYS) NON-ANOREXIC MOLT PROGRAM

Egg Pee Extra Breeder Density1 Weight Wee Small Medium Large Large (Strain) (in2/hen) (g/egg) (%) (%) (%) (%) (%)

Hy-Line 73 67.1 0.0 0.6 0.0 17.7 81.0 Brown 77 66.4 0.0 1.0 0.0 18.4 80.6

Average 66.7A 0.0 0.8 0.0 18.1C 80.8A

Hy-Line 73 62.6 0.0 0.0 0.6 51.7 45.7 Silver Brown 77 62.2 0.0 0.0 0.0 50.7 49.3

Average 62.4C 0.0 0.0 0.3 51.2A 47.5C

TETRA 73 66.9 0.0 0.0 0.0 17.6 81.4 Brown 77 66.7 0.0 0.0 0.0 23.9 76.1

Average 66.8A 0.0 0.0 0.0 20.8C 78.7A

TETRA 73 63.4 0.0 0.0 0.8 48.5 49.8 Amber 77 62.1 0.0 0.8 0.0 58.7 40.5

Average 62.8C 0.0 0.4 0.4 53.6A 45.2C

ISA 73 66.5 0.0 0.0 0.0 28.2 71.8 Brown 77 65.6 0.0 0.0 0.0 26.8 73.2

Average 66.1AB 0.0 0.0 0.0 27.5BC 72.5AB

Bovans 73 65.6 0.0 0.0 0.0 26.1 73.9 Brown 77 66.2 0.0 0.0 0.7 20.2 78.6

Average 65.9AB 0.0 0.0 0.3 23.2C 76.2A

Novogen 73 64.3 0.0 0.0 0.0 38.4 61.6 Brown 77 65.2 0.0 0.0 0.0 32.2 67.0 Average 64.7B 0.0 0.0 0.0 35.3B 64.3B All 73 65.2 0.0 0.1 0.2 32.6 66.5 Strains 77 64.9 0.0 0.3 0.1 33.0 66.5

1All strains were housed such that each strain is equally represented in each density. A,B,C - Different letters denote significant differences (P<.01), comparisons made among strain average values.

34

TABLE 34. EFFECT OF BROWN EGG STRAIN AND DENSITY ON EGG QUALITY, INCOME AND FEED COSTS OF HENS IN THE 38th NCLP&MT (483-511 DAYS) NON-ANOREXIC MOLT PROGRAM

Grade Grade Egg Feed Breeder Density1 A B Cracks Loss Income Costs (Strain) (in2/hen) (%) (%) (%) (%) ($/hen) ($/hen)

Hy-Line 73 95.4 1.9 2.0 0.7 0.39 0.56 Brown 77 96.9 1.4 1.7 0.0 0.40 0.51

Average 96.2 1.7 1.9 0.4 0.40B 0.53AB

Hy-Line 73 90.1 4.8 3.0 2.1 0.44 0.58 Silver Brown 77 97.6 1.7 0.7 0.0 0.57 0.59

Average 93.9 3.2 1.9 1.1 0.51A 0.58A

TETRA 73 90.0 5.7 3.3 1.0 0.36 0.58 Brown 77 92.0 5.4 2.6 0.0 0.36 0.59

Average 91.0 5.6 2.9 0.5 0.36B 0.59A

TETRA 73 92.4 3.9 2.8 0.9 0.34 0.50 Amber 77 94.1 2.7 3.3 0.0 0.43 0.49

Average 93.3 3.3 3.0 0.4 0.38B 0.49B

ISA 73 93.5 5.2 1.3 0.0 0.35 0.51 Brown 77 93.4 3.5 3.1 0.0 0.35 0.50

Average 93.5 4.3 2.2 0.0 0.35B 0.50B

Bovans 73 96.9 0.9 2.3 0.0 0.41 0.53 Brown 77 93.6 3.8 2.1 0.6 0.41 0.55

Average 95.2 2.3 2.2 0.3 0.41B 0.54AB

Novogen 73 95.6 3.6 0.8 0.0 0.34 0.50 Brown 77 95.5 2.8 0.9 0.9 0.37 0.52 Average 95.6 3.2 0.8 0.4 0.36B 0.51B All 73 93.4 3.7 2.2 0.7 0.38Z 0.54 Strains 77 94.7 3.0 2.1 0.2 0.41Y 0.54

1All strains were housed such that each strain is equally represented in each density. A,B - Different letters denote significant differences (P<.01), comparisons made among strain average values. Y,Z - Different letters denote significant differences (P<.01), comparisons made among density average values.

35

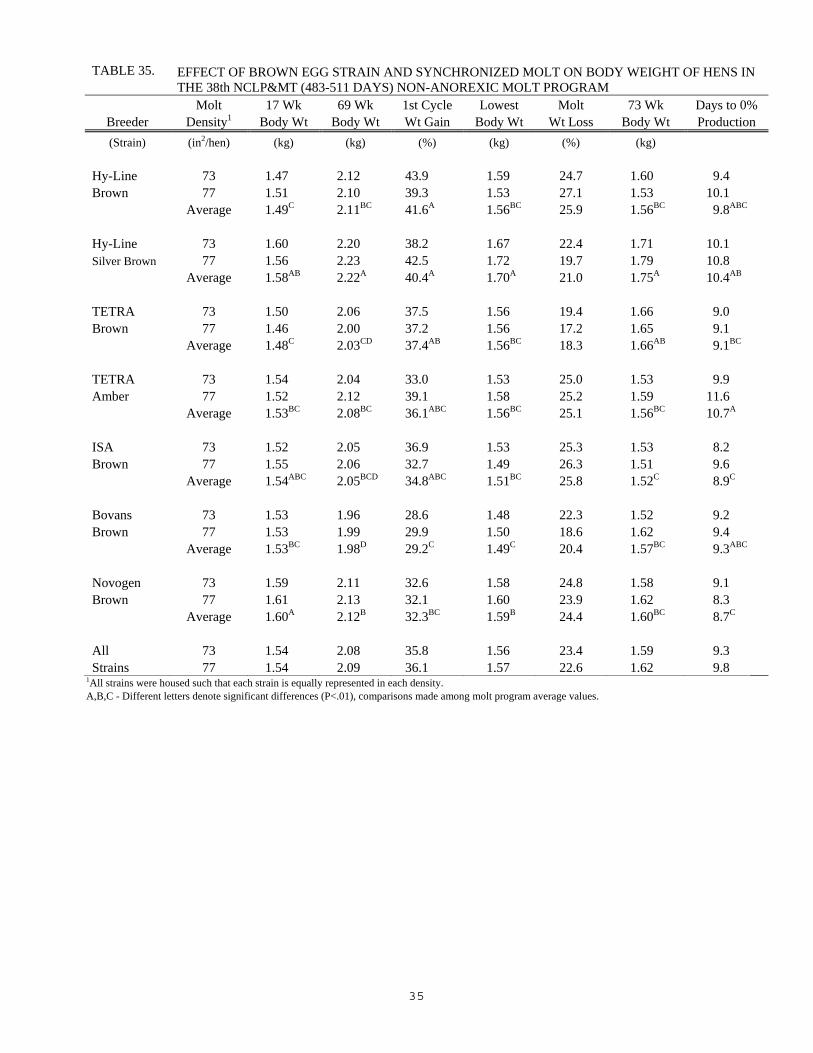
TABLE 35. EFFECT OF BROWN EGG STRAIN AND SYNCHRONIZED MOLT ON BODY WEIGHT OF HENS IN THE 38th NCLP&MT (483-511 DAYS) NON-ANOREXIC MOLT PROGRAM

Molt 17 Wk 69 Wk 1st Cycle Lowest Molt 73 Wk Days to 0% Breeder Density1 Body Wt Body Wt Wt Gain Body Wt Wt Loss Body Wt Production (Strain) (in2/hen) (kg) (kg) (%) (kg) (%) (kg)

Hy-Line 73 1.47 2.12 43.9 1.59 24.7 1.60 9.4 Brown 77 1.51 2.10 39.3 1.53 27.1 1.53 10.1

Average 1.49C 2.11BC 41.6A 1.56BC 25.9 1.56BC 9.8ABC

Hy-Line 73 1.60 2.20 38.2 1.67 22.4 1.71 10.1 Silver Brown 77 1.56 2.23 42.5 1.72 19.7 1.79 10.8

Average 1.58AB 2.22A 40.4A 1.70A 21.0 1.75A 10.4AB

TETRA 73 1.50 2.06 37.5 1.56 19.4 1.66 9.0 Brown 77 1.46 2.00 37.2 1.56 17.2 1.65 9.1

Average 1.48C 2.03CD 37.4AB 1.56BC 18.3 1.66AB 9.1BC

TETRA 73 1.54 2.04 33.0 1.53 25.0 1.53 9.9 Amber 77 1.52 2.12 39.1 1.58 25.2 1.59 11.6

Average 1.53BC 2.08BC 36.1ABC 1.56BC 25.1 1.56BC 10.7A

ISA 73 1.52 2.05 36.9 1.53 25.3 1.53 8.2 Brown 77 1.55 2.06 32.7 1.49 26.3 1.51 9.6

Average 1.54ABC 2.05BCD 34.8ABC 1.51BC 25.8 1.52C 8.9C

Bovans 73 1.53 1.96 28.6 1.48 22.3 1.52 9.2 Brown 77 1.53 1.99 29.9 1.50 18.6 1.62 9.4

Average 1.53BC 1.98D 29.2C 1.49C 20.4 1.57BC 9.3ABC

Novogen 73 1.59 2.11 32.6 1.58 24.8 1.58 9.1 Brown 77 1.61 2.13 32.1 1.60 23.9 1.62 8.3

Average 1.60A 2.12B 32.3BC 1.59B 24.4 1.60BC 8.7C All 73 1.54 2.08 35.8 1.56 23.4 1.59 9.3 Strains 77 1.54 2.09 36.1 1.57 22.6 1.62 9.8

1All strains were housed such that each strain is equally represented in each density. A,B,C - Different letters denote significant differences (P<.01), comparisons made among molt program average values.

36

TABLE 36. EFFECT OF WHITE EGG STRAIN AND DENSITY ON PERFORMANCE OF HENS IN

THE 38th NCLP&MT (512-763 DAYS) NON-MOLTED Eggs

Feed Feed Per Bird Egg Egg Breeder Density1 Consumption Conversion Housed Production Mass Mortality (Strain) (in2/hen) (kg/100/hen/d) (g egg/g feed) (HD%) (g/HD) (%)

Hy-Line 73 10.6 0.40 148.1 62.0 41.8 7.2 W-36 77 10.7 0.43 158.0 66.4 45.4 7.5

Average 10.6D 0.41 153.1 64.2 43.6 7.3 Hy-Line 73 13.0 0.37 147.4 66.1 47.7 4.5 W-98 77 12.9 0.38 159.8 67.8 48.1 4.2

Average 12.9AB 0.37 153.6 67.0 47.9 4.4 H&N 73 12.2 0.38 148.2 65.8 45.0 6.0 Nick Chick 77 11.9 0.40 164.2 68.8 47.4 2.5

Average 12.0ABC 0.39 156.2 67.3 46.2 4.2 Lohmann 73 11.8 0.42 152.7 73.2 49.2 4.8 LSL-Lite 77 12.4 0.39 161.3 69.7 46.7 8.8

Average 12.1ABC 0.40 157.0 71.4 48.0 6.8 Bovans 73 12.0 0.38 152.0 68.8 45.4 10.7 White 77 11.8 0.43 156.5 74.6 49.5 18.8

Average 11.9ABCD 0.40 154.2 71.7 47.4 14.7 Shaver 73 11.2 0.41 165.0 70.3 45.6 7.2 White 77 11.1 0.41 153.3 68.6 44.7 13.3

Average 11.1CD 0.41 159.2 69.4 45.1 10.2 DeKalb 73 13.2 0.39 170.9 75.5 50.3 12.1 White 77 13.2 0.38 160.4 72.8 49.9 4.2

Average 13.2A 0.38 165.6 74.1 50.1 8.2 ISA Babcock 73 12.0 0.42 180.8 73.1 49.7 1.6 White 77 10.9 0.42 160.2 66.9 45.4 7.5

Average 11.4CD 0.42 170.5 70.0 47.5 4.6 ISA 73 11.2 0.42 153.8 69.1 46.7 13.1 Exp. White 77 13.0 0.39 159.7 73.3 50.2 8.3

Average 12.1ABC 0.40 156.7 71.2 48.4 10.7 Novogen 73 11.8 0.38 148.7 65.4 44.7 13.1 White 77 11.5 0.39 152.7 65.1 43.7 7.5

Average 11.6BCD 0.38 150.7 65.3 44.2 10.3 Bovans 73 12.4 0.39 153.4 69.8 48.0 16.7 Robust 77 12.0 0.41 157.1 71.5 48.6 7.7

Average 12.2ABC 0.40 155.2 70.6 48.3 12.2

All 73 11.9 0.40 156.4 69.0 46.7 8.8 Strains 77 11.9 0.40 158.5 69.6 47.2 8.2 1All strains were housed such that each strain is equally represented in each density. A,B,C,D - Different letters denote significant differences (P<.01), comparisons made among strain average values.

37

TABLE 37. EFFECT OF WHITE EGG STRAIN AND DENSITY ON EGG WEIGHT AND EGG SIZE

DISTRIBUTION OF HENS IN THE 38th NCLP&MT (512-763 DAYS) NON-MOLTED Egg Pee Extra

Breeder Density1 Weight Wee Small Medium Large Large (Strain) (in2/hen) (g/egg) (%) (%) (%) (%) (%)

Hy-Line 73 67.8 0.0 0.0 0.0 8.9 89.8 W-36 77 68.5 0.0 0.0 0.3 6.6 92.5

Average 68.1BC 0.0 0.0 0.1B 7.8C 91.1AB Hy-Line 73 72.4 0.0 0.0 0.0 2.3 96.4 W-98 77 71.3 0.0 0.0 0.0 5.4 93.7

Average 71.8A 0.0 0.0 0.0B 3.8C 95.0A H&N 73 68.5 0.0 0.0 0.0 7.2 92.0 Nick Chick 77 69.1 0.0 0.0 0.0 5.6 92.5

Average 68.8B 0.0 0.0 0.0B 6.4C 92.3A Lohmann 73 67.3 0.0 0.0 0.0 7.3 92.4 LSL-Lite 77 67.4 0.0 0.0 0.2 11.6 87.9

Average 67.3BCD 0.0 0.0 0.1B 9.4BC 90.2AB Bovans 73 66.2 0.0 0.0 0.2 13.7 85.3 White 77 66.4 0.0 0.2 0.4 14.0 84.7

Average 66.3CD 0.0 0.1 0.3AB 13.9AB 85.0BC Shaver 73 65.2 0.0 0.2 0.5 17.8 80.7 White 77 65.4 0.0 0.0 1.6 18.6 79.0

Average 65.3D 0.0 0.1 1.0A 18.2A 79.8C DeKalb 73 66.6 0.0 0.0 0.0 9.0 90.2 White 77 68.6 0.0 0.0 0.0 7.3 91.2

Average 67.6BC 0.0 0.0 0.0B 8.1BC 90.7AB ISA Babcock 73 68.1 0.0 0.0 0.9 6.4 91.8 White 77 67.8 0.0 0.0 0.4 6.2 91.8

Average 67.9BC 0.0 0.0 0.6AB 6.3C 91.8A ISA 73 67.6 0.0 0.0 0.0 8.7 89.8 Exp. White 77 68.6 0.0 0.0 0.0 5.9 93.3

Average 68.1BC 0.0 0.0 0.0B 7.3C 91.5A Novogen 73 68.6 0.4 0.0 0.0 8.8 89.7 White 77 67.2 0.0 0.0 0.2 9.4 88.1

Average 67.9BC 0.2 0.0 0.1B 9.1BC 88.9AB Bovans 73 68.9 0.0 0.0 0.6 7.1 90.9 Robust 77 68.3 0.0 0.0 0.5 6.8 92.0

Average 68.6B 0.0 0.0 0.6AB 6.9C 91.4A

All 73 67.9 0.0 0.0 0.2 8.8 89.9 Strains 77 68.0 0.0 0.0 0.3 8.9 89.7

1All strains were housed such that each strain is equally represented in each density. A,B,C,D - Different letters denote significant differences (P<.01), comparisons made among strain average values.

38

TABLE 38. EFFECT OF WHITE EGG STRAIN AND DENSITY ON EGG QUALITY, INCOME AND FEED COSTS OF HENS IN THE 38th NCLP&MT (512-763 DAYS) NON-MOLTED

Grade Grade Egg Feed Breeder Density1 A B Cracks Loss Income Costs (Strain) (in2/hen) (%) (%) (%) (%) ($/hen) ($/hen)

Hy-Line 73 92.8 1.1 4.9 1.3 15.51 10.38 W-36 77 94.2 0.9 4.2 0.7 16.81 10.47

Average 93.5 1.0 4.5 1.0 16.16 10.42 Hy-Line 73 85.2 6.8 6.6 1.3 14.83 12.00 W-98 77 93.4 2.9 2.8 0.9 16.88 12.31

Average 89.3 4.8 4.7 1.1 15.85 12.15 H&N 73 89.9 6.1 3.1 0.8 15.39 11.42 Nick Chick 77 90.3 4.5 3.4 1.9 16.90 11.73

Average 90.1 5.3 3.3 1.4 16.14 11.57 Lohmann 73 93.5 2.1 4.1 0.3 16.30 9.98 LSL-Lite 77 92.1 4.2 3.3 0.4 17.01 11.78

Average 92.8 3.2 3.7 0.3 16.65 10.88 Bovans 73 90.9 4.6 3.6 0.9 15.83 10.89 White 77 91.2 5.7 2.3 0.8 16.35 10.07

Average 91.1 5.2 2.9 0.8 16.09 10.48 Shaver 73 90.2 3.3 5.6 0.9 17.08 10.77 White 77 89.5 4.1 5.5 0.8 15.82 10.05

Average 89.9 3.7 5.5 0.8 16.45 10.41 DeKalb 73 95.2 2.5 1.6 0.8 18.22 12.22 White 77 94.2 2.3 2.0 1.6 16.81 11.81

Average 94.7 2.4 1.8 1.2 17.51 12.01 ISA Babcock 73 93.0 3.6 2.5 0.9 19.02 12.26 White 77 90.2 3.6 4.5 1.7 16.43 10.82

Average 91.6 3.6 3.5 1.3 17.73 11.54 ISA 73 91.2 3.5 3.8 1.5 15.87 10.21 Exp. White 77 92.7 2.8 3.6 0.9 16.80 11.74

Average 91.9 3.1 3.7 1.2 16.34 10.97 Novogen 73 90.3 5.7 2.9 1.2 15.35 10.98 White 77 89.2 3.8 4.8 2.3 15.46 11.04

Average 89.7 4.7 3.8 1.8 15.40 11.01 Bovans 73 87.8 4.5 6.3 1.5 15.73 11.09 Robust 77 94.5 2.7 2.2 0.7 16.73 10.91

Average 91.2 3.6 4.2 1.1 16.23 11.00

All 73 90.9 4.0 4.1 1.0 16.28 11.11 Strains 77 91.9 3.4 3.5 1.1 16.54 11.15

1All strains were housed such that each strain is equally represented in each density. There are no significant differences among these means.

39

TABLE 39. EFFECT OF WHITE EGG STRAIN AND DENSITY ON PERFORMANCE OF HENS IN THE 38th NCLP&MT (512-763 DAYS) NON-ANOREXIC MOLT PROGRAM

Eggs Feed Feed Per Bird Egg Egg

Breeder Density1 Consumption Conversion Housed Production Mass Mortality (Strain) (in2/hen) (kg/100/hen/d) (g egg/g feed) (HD%) (g/HD) (%)

Hy-Line 73 10.6 0.47 178.2 74.2 50.1 3.2 W-36 77 11.1 0.46 179.7 74.2 50.8 2.8

Average 10.8C 0.47 179.0ABC 74.2E 50.5D 3.0CD Hy-Line 73 12.9 0.42 174.2 76.1 53.9 3.9 W-98 77 12.7 0.44 171.2 77.7 55.8 0.7

Average 12.8A 0.43 172.7ABCD 76.9DE 54.9AB 2.3D H&N 73 12.0 0.45 174.2 78.4 53.9 6.4 Nick Chick 77 11.9 0.46 186.0 81.3 55.3 7.3

Average 12.0AB 0.46 180.1ABC 79.9BCD 54.6AB 6.8ABC Lohmann 73 12.0 0.47 177.5 82.4 55.7 5.8 LSL-Lite 77 11.7 0.48 184.4 82.2 56.0 9.4

Average 11.9B 0.47 180.9ABC 82.3AB 55.8A 7.6AB Bovans 73 11.7 0.47 161.1 80.6 54.3 12.7 White 77 12.1 0.46 173.3 81.3 54.7 8.4

Average 11.9B 0.46 167.2CD 81.0ABC 54.5ABC 10.6A Shaver 73 10.7 0.46 171.7 75.5 49.3 2.1 White 77 10.9 0.47 189.3 79.6 51.5 2.8

Average 10.8C 0.47 180.5ABC 77.6D 50.4D 2.5D DeKalb 73 12.4 0.45 177.7 82.7 56.0 4.0 White 77 12.5 0.46 187.4 84.2 57.1 5.8

Average 12.5AB 0.45 182.5AB 83.5A 56.5A 4.9BCD ISA Babcock 73 11.8 0.46 190.6 80.5 54.1 3.7 White 77 11.8 0.46 183.0 79.7 54.3 4.4

Average 11.8B 0.46 186.8A 80.1BCD 54.2ABC 4.1BCD ISA 73 11.4 0.46 161.2 77.7 52.5 6.4 Exp. White 77 12.0 0.44 177.2 78.0 52.7 6.1

Average 11.7B 0.45 169.2BCD 77.8CD 52.6BCD 6.2BCD Novogen 73 11.6 0.45 169.5 77.0 52.3 4.8 White 77 11.8 0.44 180.2 76.6 51.9 5.6

Average 11.7B 0.45 174.8ABCD 76.8DE 52.1CD 5.2BCD Bovans 73 12.4 0.43 159.7 78.2 53.2 7.9 Robust 77 11.9 0.45 168.4 79.2 53.4 7.8

Average 12.2AB 0.44 164.0D 78.7CD 53.3BC 7.9AB

All 73 11.8 0.45 172.3Z 78.5 53.2 5.5 Strains 77 11.9 0.46 180.0Y 79.5 54.0 5.5 1All strains were housed such that each strain is equally represented in each density. A,B,C,D,E - Different letters denote significant differences (P<.01), comparisons made among strain average values. Y,Z- Different letters denote significant differences (P<.01), comparisons made between density average values.

40

TABLE 40. EFFECT OF WHITE EGG STRAIN AND DENSITY ON EGG WEIGHT AND EGG SIZE DISTRIBUTION OF HENS IN THE 38th NCLP&MT (512-763 DAYS) NON-ANOREXIC MOLT PROGRAM

Egg Pee Extra Breeder Density1 Weight Wee Small Medium Large Large (Strain) (in2/hen) (g/egg) (%) (%) (%) (%) (%)

Hy-Line 73 67.4 0.0 0.0 0.0 7.3 92.3 W-36 77 68.4 0.0 0.0 0.1 5.8 93.7

Average 67.9B 0.0 0.0 0.0 6.6B 93.0B Hy-Line 73 70.9 0.0 0.0 0.0 3.0 96.4 W-98 77 71.8 0.0 0.0 0.0 1.4 98.1

Average 71.4A 0.0 0.0 0.0 2.2C 97.2A H&N 73 68.7 0.0 0.0 0.0 4.6 95.0 Nick Chick 77 68.0 0.0 0.0 0.1 5.7 93.6

Average 68.3B 0.0 0.0 0.1 5.1BC 94.3AB Lohmann 73 67.5 0.0 0.0 0.3 7.2 92.4 LSL-Lite 77 68.0 0.0 0.0 0.0 5.4 94.2

Average 67.7B 0.0 0.0 0.1 6.3B 93.3B Bovans 73 67.3 0.0 0.1 0.2 5.4 94.0 White 77 67.2 0.0 0.0 0.1 8.5 90.0

Average 67.3B 0.0 0.1 0.1 6.9B 92.0B Shaver 73 65.2 0.0 0.0 0.3 13.1 86.1 White 77 64.6 0.1 0.1 0.2 15.2 83.8

Average 64.9C 0.0 0.1 0.2 14.2A 85.0C DeKalb 73 67.6 0.0 0.1 0.6 5.7 93.5 White 77 67.7 0.0 0.1 0.0 7.2 92.0

Average 67.7B 0.0 0.1 0.3 6.5B 92.7B ISA Babcock 73 67.2 0.0 0.1 0.0 7.8 91.7 White 77 68.0 0.0 0.2 0.0 5.7 93.3

Average 67.6B 0.0 0.2 0.0 6.7B 92.5B ISA 73 67.4 0.0 0.0 0.3 6.2 93.2 Exp. White 77 67.4 0.0 0.1 0.0 6.7 92.8

Average 67.4B 0.0 0.1 0.2 6.4B 93.0B Novogen 73 67.8 0.0 0.0 0.0 6.1 93.5 White 77 67.7 0.0 0.0 0.0 7.7 91.7

Average 67.8B 0.0 0.0 0.0 6.9B 92.6B Bovans 73 67.9 0.0 0.0 0.2 7.1 92.2 Robust 77 67.4 0.0 0.0 0.1 6.7 92.3

Average 67.7B 0.0 0.0 0.1 6.9B 92.2B

All 73 67.7 0.0 0.0 0.2 6.7 92.7 Strains 77 67.8 0.0 0.1 0.0 6.9 92.3

1All strains were housed such that each strain is equally represented in each density. A,B,C - Different letters denote significant differences (P<.01), comparisons made among strain average values.

41

TABLE 41. EFFECT OF WHITE EGG STRAIN AND DENSITY ON EGG QUALITY, INCOME AND FEED COSTS OF HENS IN THE 38th NCLP&MT (512-763 DAYS) NON-ANOREXIC MOLT PROGRAM

Grade Grade Egg Feed Breeder Density1 A B Cracks Loss Income Costs (Strain) (in2/hen) (%) (%) (%) (%) ($/hen) ($/hen)

Hy-Line 73 95.8 0.9 2.9 0.4 19.19 9.73 W-36 77 95.1 0.9 3.6 0.4 19.28 10.52

Average 95.4AB 0.9D 3.2 0.4 19.24AB 10.12 Hy-Line 73 93.7 3.1 2.6 0.7 18.51 11.55 W-98 77 93.0 3.3 3.1 0.5 18.17 10.72

Average 93.4BC 3.2A 2.8 0.6 18.34ABC 11.13 H&N 73 94.7 2.4 2.4 0.5 18.64 10.10 Nick Chick 77 95.5 1.6 2.3 0.6 19.94 10.90

Average 95.1AB 2.0ABCD 2.4 0.5 19.29AB 10.50 Lohmann 73 95.5 1.8 2.5 0.1 19.14 10.16 LSL-Lite 77 96.2 1.4 2.0 0.5 19.87 10.08

Average 95.9A 1.6BCD 2.2 0.3 19.51AB 10.12 Bovans 73 92.8 3.3 3.6 0.3 17.10 8.79 White 77 92.1 2.4 4.1 1.5 18.09 10.11

Average 92.4C 2.9AB 3.8 0.9 17.60C 9.45 Shaver 73 96.0 1.0 2.5 0.5 18.46 9.49 White 77 95.4 1.8 2.2 0.6 20.23 9.93

Average 95.7AB 1.4CD 2.3 0.5 19.34AB 9.71 DeKalb 73 94.0 3.1 2.7 0.1 19.03 10.15 White 77 93.5 2.8 3.0 0.7 19.85 10.94

Average 93.8ABC 3.0AB 2.9 0.4 19.44AB 10.55 ISA Babcock 73 94.1 2.7 2.8 0.4 20.35 10.67 White 77 94.6 2.1 2.6 0.8 19.45 10.48

Average 94.3ABC 2.4ABC 2.7 0.6 19.90A 10.58 ISA 73 95.7 1.7 2.3 0.2 17.40 9.27 Exp. White 77 94.1 2.7 2.9 0.4 18.91 10.44

Average 94.9AB 2.2ABCD 2.6 0.3 18.15BC 9.86 Novogen 73 95.1 1.8 2.8 0.4 18.20 9.89 White 77 94.0 2.3 3.1 0.6 19.18 10.87

Average 94.6ABC 2.0ABCD 2.9 0.5 18.69ABC 10.38 Bovans 73 93.8 2.9 2.8 0.5 16.99 9.96 Robust 77 95.0 1.9 2.2 0.8 17.97 9.55

Average 94.4ABC 2.4ABC 2.5 0.7 17.48C 9.75

All 73 94.7 2.3 2.7 0.4 18.46Z 9.98 Strains 77 94.4 2.1 2.8 0.7 19.18Y 10.41

1All strains were housed such that each strain is equally represented in each density. A,B,C,D - Different letters denote significant differences (P<.01), comparisons made among strain average values. Y,Z- Different letters denote significant differences (P<.01), comparisons made between density average values.

42

TABLE 42. EFFECT OF BROWN EGG STRAIN AND DENSITY ON PERFORMANCE OF HENS IN THE 38th NCLP&MT (512-763 DAYS) NON-MOLTED

Eggs Feed Feed Per Bird Egg Egg

Breeder Density1 Consumption Conversion Housed Production Mass Mortality (Strain) (in2/hen) (kg/100/hen/d) (g egg/g feed) (HD%) (g/HD) (%)

Hy-Line 73 10.9 0.41 147.6 63.2 44.5 1.2 Brown 77 11.8 0.41 168.9 69.5 48.6 0.0

Average 11.3 0.41A 158.2A 66.3A 46.6AB 0.6C

Hy-Line 73 12.2 0.36 157.2 67.1 43.8 5.0 Silver Brown 77 11.7 0.37 157.2 65.2 42.0 4.5

Average 11.9 0.36AB 157.2AB 66.1A 42.9BC 4.8BC

TETRA 73 11.2 0.33 118.3 52.7 36.7 10.7 Brown 77 12.1 0.35 118.0 58.4 41.1 15.0

Average 11.6 0.34B 118.2D 55.6B 38.9CD 12.9A

TETRA 73 10.4 0.36 130.0 57.3 37.3 11.9 Amber 77 12.2 0.32 128.5 57.6 38.3 5.0

Average 11.3 0.34B 129.2CD 57.4B 37.8D 8.5AB

ISA 73 11.5 0.39 149.1 65.0 44.7 6.0 Brown 77 11.9 0.40 159.1 69.9 47.0 11.3

Average 11.7 0.39A 154.1AB 67.5A 45.8AB 8.6AB

Bovans 73 12.4 0.40 158.8 72.8 49.2 12.9 Brown 77 12.0 0.40 158.5 68.3 47.4 10.0

Average 12.2 0.40A 158.6A 70.6A 48.3A 11.5AB

Novogen 73 11.1 0.39 135.5 65.6 43.6 10.7 Brown 77 11.7 0.38 143.3 64.5 43.4 8.8

Average 11.4 0.38AB 139.4BC 65.0A 43.5B 9.8AB

All 73 11.4 0.38 142.3 63.4 42.8 8.3 Strains 77 11.9 0.37 147.6 64.7 44.0 7.8

NCSU Barred 73 9.7 0.18 67.2 28.0 16.9 3.0 Plym. Rock 77 10.6 0.17 63.4 29.0 18.0 3.9

1All strains were housed such that each strain is equally represented in each density. A,B,C,D - Different letters denote significant differences (P<.01), comparisons made among strain average values.

43

TABLE 43. EFFECT OF BROWN EGG STRAIN AND DENSITY ON EGG WEIGHT AND EGG SIZE DISTRIBUTION OF HENS IN THE 38th NCLP&MT (512-763 DAYS) NON-MOLTED

Egg Pee Extra Breeder Density1 Weight Wee Small Medium Large Large (Strain) (in2/hen) (g/egg) (%) (%) (%) (%) (%)

Hy-Line 73 70.7 0.0 0.0 0.0 4.9 94.1 Brown 77 70.2 0.0 0.0 0.0 7.2 92.2

Average 70.5A 0.0 0.0 0.0 6.1D 93.1A

Hy-Line 73 65.5 0.0 0.0 0.4 19.7 79.7 Silver Brown 77 64.8 0.0 0.0 0.2 21.3 77.8

Average 65.2E 0.0 0.0 0.3 20.5A 78.7C

TETRA 73 70.0 0.0 0.0 0.2 7.3 90.7 Brown 77 70.6 0.0 0.0 0.0 4.3 93.4

Average 70.3AB 0.0 0.0 0.1 5.8D 92.0A

TETRA 73 65.4 0.3 0.0 1.4 20.7 77.5 Amber 77 66.8 0.0 0.0 0.7 14.5 83.4

Average 66.1DE 0.1 0.0 1.0 17.6AB 80.5C

ISA 73 69.0 0.0 0.0 0.2 9.0 90.7 Brown 77 67.2 0.0 0.2 0.0 12.6 86.3

Average 68.1C 0.0 0.1 0.1 10.8CD 88.5AB

Bovans 73 67.8 0.0 0.0 0.2 13.4 85.8 Brown 77 69.5 0.0 0.0 0.4 7.6 91.9

Average 68.7BC 0.0 0.0 0.3 10.5CD 88.8AB

Novogen 73 66.5 0.0 0.0 0.2 14.3 84.6 Brown 77 67.4 0.0 0.0 0.4 14.9 84.3 Average 67.0CD 0.0 0.0 0.3 14.6BC 84.4BC All 73 67.8 0.0 0.0 0.4 12.8 86.1 Strains 77 68.1 0.0 0.0 0.2 11.8 87.0 NCSU Barred 73 60.9 0.0 0.0 1.0 33.67 62.97 Plym. Rock 77 62.7 0.0 0.0 1.4 35.10 62.90

1All strains were housed such that each strain is equally represented in each density. A,B,C,D,E - Different letters denote significant differences (P<.01), comparisons made among strain average values.

44

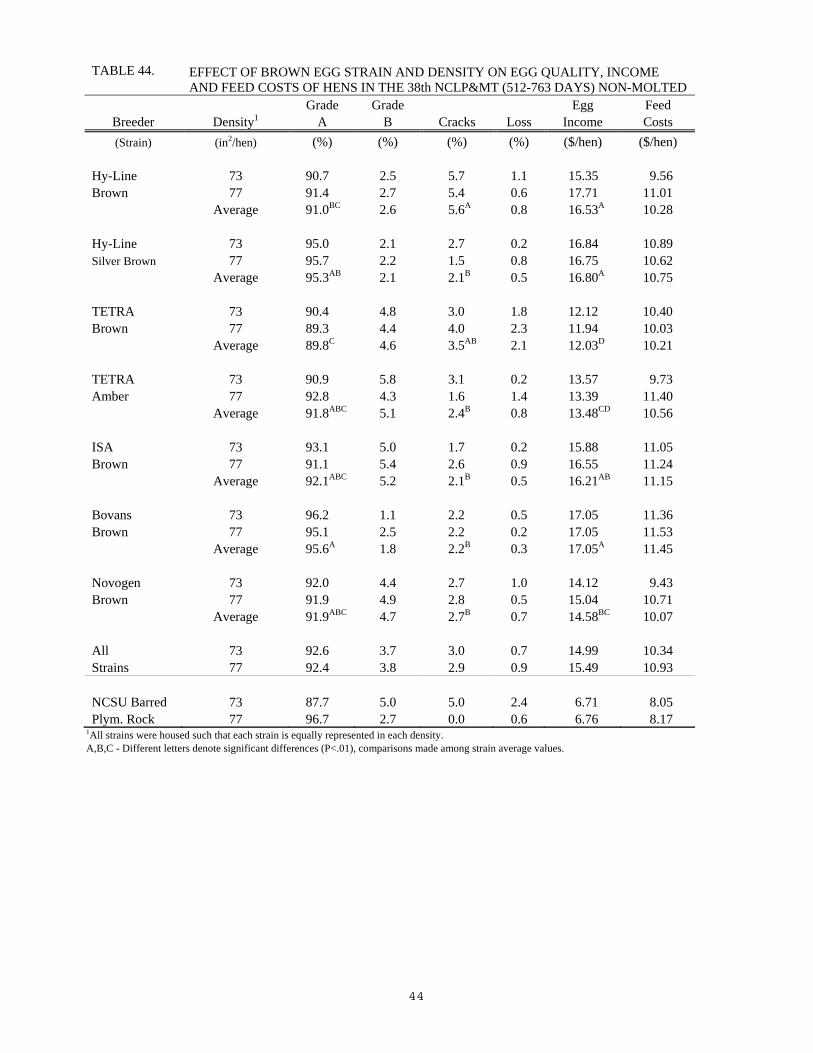
TABLE 44. EFFECT OF BROWN EGG STRAIN AND DENSITY ON EGG QUALITY, INCOME AND FEED COSTS OF HENS IN THE 38th NCLP&MT (512-763 DAYS) NON-MOLTED

Grade Grade Egg Feed Breeder Density1 A B Cracks Loss Income Costs (Strain) (in2/hen) (%) (%) (%) (%) ($/hen) ($/hen)

Hy-Line 73 90.7 2.5 5.7 1.1 15.35 9.56 Brown 77 91.4 2.7 5.4 0.6 17.71 11.01

Average 91.0BC 2.6 5.6A 0.8 16.53A 10.28

Hy-Line 73 95.0 2.1 2.7 0.2 16.84 10.89 Silver Brown 77 95.7 2.2 1.5 0.8 16.75 10.62

Average 95.3AB 2.1 2.1B 0.5 16.80A 10.75

TETRA 73 90.4 4.8 3.0 1.8 12.12 10.40 Brown 77 89.3 4.4 4.0 2.3 11.94 10.03

Average 89.8C 4.6 3.5AB 2.1 12.03D 10.21

TETRA 73 90.9 5.8 3.1 0.2 13.57 9.73 Amber 77 92.8 4.3 1.6 1.4 13.39 11.40

Average 91.8ABC 5.1 2.4B 0.8 13.48CD 10.56

ISA 73 93.1 5.0 1.7 0.2 15.88 11.05 Brown 77 91.1 5.4 2.6 0.9 16.55 11.24

Average 92.1ABC 5.2 2.1B 0.5 16.21AB 11.15

Bovans 73 96.2 1.1 2.2 0.5 17.05 11.36 Brown 77 95.1 2.5 2.2 0.2 17.05 11.53

Average 95.6A 1.8 2.2B 0.3 17.05A 11.45

Novogen 73 92.0 4.4 2.7 1.0 14.12 9.43 Brown 77 91.9 4.9 2.8 0.5 15.04 10.71 Average 91.9ABC 4.7 2.7B 0.7 14.58BC 10.07 All 73 92.6 3.7 3.0 0.7 14.99 10.34 Strains 77 92.4 3.8 2.9 0.9 15.49 10.93 NCSU Barred 73 87.7 5.0 5.0 2.4 6.71 8.05 Plym. Rock 77 96.7 2.7 0.0 0.6 6.76 8.17

1All strains were housed such that each strain is equally represented in each density. A,B,C - Different letters denote significant differences (P<.01), comparisons made among strain average values.

45

TABLE 45. EFFECT OF BROWN EGG STRAIN AND DENSITY ON PERFORMANCE OF HENS IN THE 38th NCLP&MT (512-763 DAYS) NON-ANOREXIC MOLT PROGRAM

Eggs Feed Feed Per Bird Egg Egg

Breeder Density1 Consumption Conversion Housed Production Mass Mortality (Strain) (in2/hen) (kg/100/hen/d) (g egg/g feed) (HD%) (g/HD) (%)

Hy-Line 73 11.3 0.43 167.0 70.1 48.8 4.3 Brown 77 11.4 0.43 171.3 70.5 49.4 2.8

Average 11.4 0.43AB 169.1A 70.3C 49.1BC 3.5

Hy-Line 73 11.6 0.42 178.8 74.7 49.0 2.1 Silver Brown 77 11.7 0.41 163.4 72.8 48.0 4.4

Average 11.6 0.42BC 171.1A 73.8B 48.5C 3.3

TETRA 73 11.4 0.42 145.6 67.7 47.4 6.4 Brown 77 11.0 0.42 153.6 66.8 46.6 2.2

Average 11.2 0.42BC 149.6C 67.2C 47.0CD 4.3

TETRA 73 11.5 0.39 152.1 68.5 44.8 3.2 Amber 77 11.0 0.41 152.9 69.8 44.6 4.4

Average 11.2 0.40C 152.5BC 69.2C 44.7D 3.8

ISA 73 11.7 0.44 167.0 74.5 51.5 4.8 Brown 77 12.0 0.45 167.9 78.0 53.3 4.5

Average 11.8 0.44AB 167.5A 76.2AB 52.4A 4.6

Bovans 73 11.4 0.47 168.8 77.1 53.1 5.8 Brown 77 12.2 0.44 176.2 77.5 53.8 6.1

Average 11.8 0.45A 172.5A 77.3A 53.4A 6.0

Novogen 73 11.6 0.44 158.7 76.4 50.9 5.8 Brown 77 11.6 0.45 171.4 76.9 51.9 2.3

Average 11.6 0.44AB 165.0AB 76.6AB 51.4AB 4.0

All 73 11.5 0.43 162.6 72.7 49.4 4.6 Strains 77 11.6 0.43 165.3 73.2 49.6 3.8

1All strains were housed such that each strain is equally represented in each density. A,B,C,D - Different letters denote significant differences (P<.01), comparisons made among strain average values.

46

TABLE 46. EFFECT OF BROWN EGG STRAIN AND DENSITY ON EGG WEIGHT AND EGG SIZE DISTRIBUTION OF HENS IN THE 38th NCLP&MT (512-763 DAYS) NON-ANOREXIC MOLT PROGRAM

Egg Pee Extra Breeder Density1 Weight Wee Small Medium Large Large (Strain) (in2/hen) (g/egg) (%) (%) (%) (%) (%)

Hy-Line 73 69.7 0.0 0.0 0.1 5.5 93.6 Brown 77 70.2 0.0 0.0 0.2 4.7 94.8

Average 69.9A 0.0 0.0 0.2 5.1D 94.2A

Hy-Line 73 65.7 0.0 0.0 0.2 12.5 87.3 Silver Brown 77 65.9 0.0 0.0 0.0 14.2 85.4

Average 65.8CD 0.0 0.0 0.1 13.4B 86.4C

TETRA 73 69.9 0.0 0.0 0.1 5.0 94.3 Brown 77 69.8 0.0 0.0 0.2 4.8 94.7

Average 69.8AB 0.0 0.0 0.1 4.9D 94.5A

TETRA 73 65.3 0.0 0.0 0.0 17.7 82.0 Amber 77 63.8 0.0 0.0 0.6 22.7 76.6

Average 64.6D 0.0 0.0 0.3 20.2A 79.3D

ISA 73 69.0 0.0 0.0 0.1 6.8 92.9 Brown 77 68.1 0.0 0.0 0.1 7.8 91.7

Average 68.5B 0.0 0.0 0.1 7.3CD 92.3AB

Bovans 73 68.8 0.0 0.0 0.0 7.2 92.8 Brown 77 69.2 0.0 0.0 0.2 5.2 94.0

Average 69.0AB 0.0 0.0 0.1 6.2CD 93.4AB

Novogen 73 66.5 0.0 0.0 0.2 9.0 90.5 Brown 77 67.3 0.0 0.0 0.6 10.2 89.0 Average 66.9C 0.0 0.0 0.4 9.6BC 89.7BC All 73 67.8 0.0 0.0 0.1 9.1 90.5 Strains 77 67.7 0.0 0.0 0.3 9.9 89.4

1All strains were housed such that each strain is equally represented in each density. A,B,C,D - Different letters denote significant differences (P<.01), comparisons made among strain average values.

47

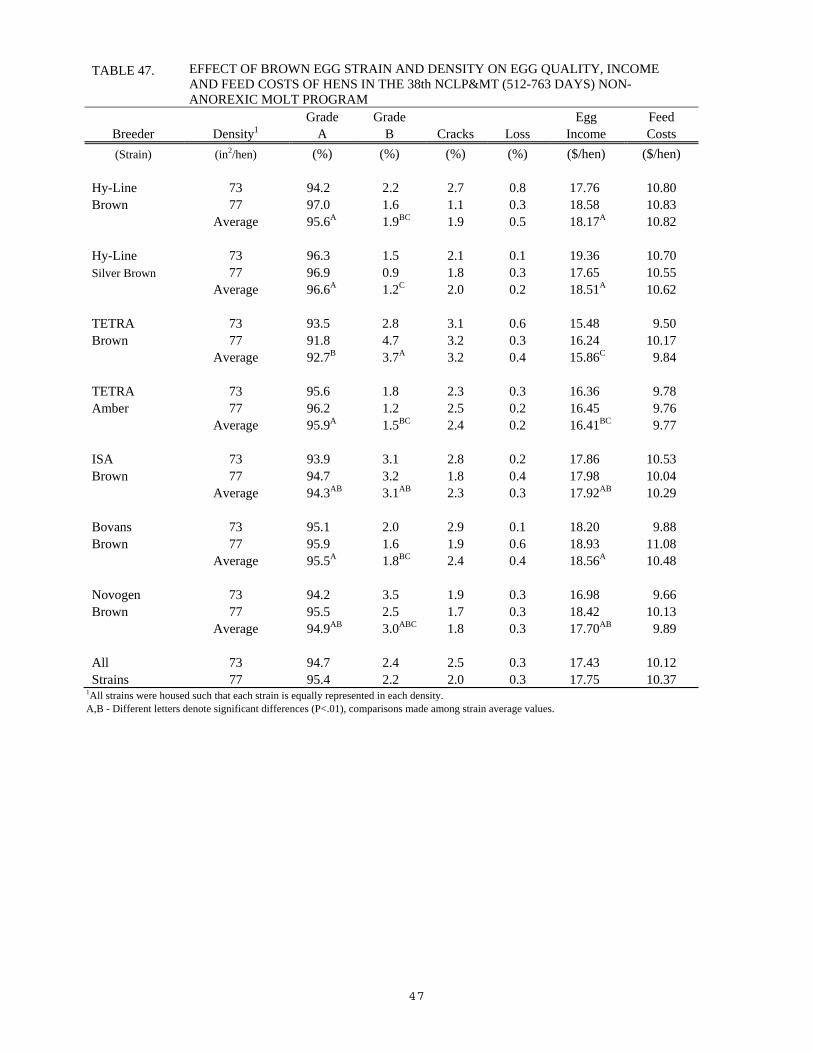
TABLE 47. EFFECT OF BROWN EGG STRAIN AND DENSITY ON EGG QUALITY, INCOME AND FEED COSTS OF HENS IN THE 38th NCLP&MT (512-763 DAYS) NON-ANOREXIC MOLT PROGRAM

Grade Grade Egg Feed Breeder Density1 A B Cracks Loss Income Costs (Strain) (in2/hen) (%) (%) (%) (%) ($/hen) ($/hen)

Hy-Line 73 94.2 2.2 2.7 0.8 17.76 10.80 Brown 77 97.0 1.6 1.1 0.3 18.58 10.83

Average 95.6A 1.9BC 1.9 0.5 18.17A 10.82

Hy-Line 73 96.3 1.5 2.1 0.1 19.36 10.70 Silver Brown 77 96.9 0.9 1.8 0.3 17.65 10.55

Average 96.6A 1.2C 2.0 0.2 18.51A 10.62

TETRA 73 93.5 2.8 3.1 0.6 15.48 9.50 Brown 77 91.8 4.7 3.2 0.3 16.24 10.17

Average 92.7B 3.7A 3.2 0.4 15.86C 9.84

TETRA 73 95.6 1.8 2.3 0.3 16.36 9.78 Amber 77 96.2 1.2 2.5 0.2 16.45 9.76

Average 95.9A 1.5BC 2.4 0.2 16.41BC 9.77

ISA 73 93.9 3.1 2.8 0.2 17.86 10.53 Brown 77 94.7 3.2 1.8 0.4 17.98 10.04

Average 94.3AB 3.1AB 2.3 0.3 17.92AB 10.29

Bovans 73 95.1 2.0 2.9 0.1 18.20 9.88 Brown 77 95.9 1.6 1.9 0.6 18.93 11.08

Average 95.5A 1.8BC 2.4 0.4 18.56A 10.48

Novogen 73 94.2 3.5 1.9 0.3 16.98 9.66 Brown 77 95.5 2.5 1.7 0.3 18.42 10.13 Average 94.9AB 3.0ABC 1.8 0.3 17.70AB 9.89 All 73 94.7 2.4 2.5 0.3 17.43 10.12 Strains 77 95.4 2.2 2.0 0.3 17.75 10.37

1All strains were housed such that each strain is equally represented in each density. A,B - Different letters denote significant differences (P<.01), comparisons made among strain average values.

48

TABLE 48. EFFECT OF WHITE EGG STRAIN AND DENSITY ON PERFORMANCE OF HENS IN THE 38th NCLP&MT (119-763 DAYS) NON-MOLTED

Eggs Feed Feed Per Bird Egg Egg

Breeder Density1 Consumption Conversion Housed Production Mass Mortality (Strain) (in2/hen) (kg/100/hen/d) (g egg/g feed) (HD%) (g/HD) (%)

Hy-Line 73 10.0 0.46 464.4 74.3 46.5 9.6 W-36 77 10.3 0.47 477.5 76.1 48.4 10.0

Average 10.1D 0.47 470.9 75.2C 47.5C 9.8BC Hy-Line 73 11.9 0.43 458.1 76.3 51.0 11.7 W-98 77 11.6 0.44 479.5 77.2 51.0 7.5

Average 11.7AB 0.44 468.8 76.7BC 51.0AB 9.6BC H&N 73 11.3 0.44 467.4 77.8 50.1 15.5 Nick Chick 77 11.3 0.45 489.7 79.2 51.4 7.5

Average 11.3AB 0.45 478.5 78.5ABC 50.8AB 11.5BC Lohmann 73 11.4 0.46 469.0 82.0 52.1 20.7 LSL-Lite 77 11.4 0.45 492.5 79.9 50.7 13.8

Average 11.4AB 0.45 480.7 80.9A 51.4A 17.2ABC Bovans 73 11.1 0.44 476.2 79.6 49.2 20.3 White 77 11.1 0.46 483.4 82.1 51.5 27.5

Average 11.1ABC 0.45 479.8 80.9A 50.4AB 23.9A Shaver 73 10.3 0.48 492.6 79.4 48.7 9.5 White 77 10.3 0.47 475.3 78.1 48.2 18.3

Average 10.3CD 0.47 484.0 78.7ABC 48.4BC 13.9ABC DeKalb 73 11.8 0.44 504.8 81.2 51.7 16.1 White 77 11.9 0.44 481.7 80.4 52.3 13.9

Average 11.9A 0.44 493.3 80.8A 52.0A 15.0ABC ISA Babcock 73 11.4 0.46 517.4 81.1 52.7 3.2 White 77 10.7 0.47 496.7 78.7 50.3 8.8

Average 11.0ABCD 0.46 507.0 79.9AB 51.5A 6.0C ISA 73 10.7 0.47 482.5 80.3 50.8 20.2 Exp. White 77 11.6 0.45 488.2 81.5 52.4 18.3

Average 11.2ABC 0.46 485.4 80.9A 51.6A 19.3AB Novogen 73 11.1 0.45 472.0 76.8 50.4 17.9 White 77 10.9 0.45 476.8 77.0 49.1 13.8

Average 11.0BCD 0.45 474.4 76.9BC 49.7ABC 15.8ABC Bovans 73 11.1 0.46 480.6 79.4 51.2 23.8 Robust 77 11.3 0.46 484.2 80.9 52.5 16.7

Average 11.2AB 0.46 482.4 80.2AB 51.9A 20.3AB

All 73 11.1 0.45 480.4 78.9 50.4 15.3 Strains 77 11.1 0.46 484.1 79.2 50.7 14.2 1All strains were housed such that each strain is equally represented in each density. A,B,C,D - Different letters denote significant differences (P<.01), comparisons made among strain average values.

49

TABLE 49. EFFECT OF WHITE EGG STRAIN AND DENSITY ON EGG WEIGHT AND EGG SIZE

DISTRIBUTION OF HENS IN THE 38th NCLP&MT (119-763 DAYS) NON-MOLTED Egg Pee Extra

Breeder Density1 Weight Wee Small Medium Large Large (Strain) (in2/hen) (g/egg) (%) (%) (%) (%) (%)

Hy-Line 73 62.9 0.2 3.9 7.1 21.2 66.8 W-36 77 63.5 0.6 2.1 7.9 16.6 72.5

Average 63.2BCD 0.4 3.0 7.5A 18.9BC 69.6BC Hy-Line 73 66.9 0.0 2.6 5.3 9.5 81.7 W-98 77 66.1 0.4 2.7 4.9 12.6 78.8

Average 66.5A 0.2 2.7 5.1AB 11.1D 80.2A H&N 73 64.2 0.2 3.3 5.2 15.7 74.9 Nick Chick 77 64.7 0.3 2.3 5.5 14.3 76.7

Average 64.5B 0.3 2.8 5.3AB 15.0CD 75.8AB Lohmann 73 63.2 0.0 2.4 5.9 18.5 72.5 LSL-Lite 77 63.4 0.0 4.0 5.3 19.8 70.7

Average 63.3BC 0.0 3.2 5.6AB 19.1BC 71.6ABC Bovans 73 61.8 0.0 4.1 6.9 24.4 63.6 White 77 62.3 0.4 3.4 7.3 24.2 64.3

Average 62.0CD 0.2 3.8 7.1A 24.3AB 64.0CD Shaver 73 61.3 0.4 4.1 6.0 30.2 58.9 White 77 61.5 0.7 3.4 7.8 29.9 57.8

Average 61.4D 0.5 3.8 6.9A 30.0A 58.3D DeKalb 73 63.1 0.1 4.2 3.6 20.0 71.7 White 77 64.6 0.0 4.0 4.2 13.2 77.9

Average 63.9B 0.0 4.1 3.9B 16.6CD 74.8AB ISA Babcock 73 64.6 0.3 0.8 5.7 14.1 78.4 White 77 63.8 0.4 2.9 4.9 16.4 74.3

Average 64.2B 0.3 1.9 5.3AB 15.3CD 76.3AB ISA 73 63.2 0.2 2.6 6.6 19.3 70.6 Exp. White 77 64.2 0.0 2.4 5.4 15.5 76.0

Average 63.7BC 0.1 2.5 6.0AB 17.4BCD 73.3AB Novogen 73 64.9 0.3 2.2 3.7 16.9 76.1 White 77 63.5 0.2 3.2 5.1 20.0 70.4

Average 64.2B 0.2 2.7 4.4B 18.5BC 73.2AB Bovans 73 64.2 0.3 3.2 5.8 16.3 73.5 Robust 77 64.6 0.0 2.0 5.5 15.5 76.4

Average 64.4B 0.2 2.6 5.7AB 15.9CD 75.0AB

All 73 63.7 0.2 3.1 5.6 18.7 71.7 Strains 77 63.8 0.3 2.9 5.8 18.0 72.3

1All strains were housed such that each strain is equally represented in each density. A,B,C,D - Different letters denote significant differences (P<.01), comparisons made among strain average values.

50

TABLE 50. EFFECT OF WHITE EGG STRAIN AND DENSITY ON EGG QUALITY, INCOME AND FEED COSTS OF HENS IN THE 38th NCLP&MT (119-763 DAYS) NON-MOLTED

Grade Grade Egg Feed Breeder Density1 A B Cracks Loss Income Costs (Strain) (in2/hen) (%) (%) (%) (%) ($/hen) ($/hen)

Hy-Line 73 94.3 2.3 2.6 0.9 44.17 23.88 W-36 77 95.4 1.1 3.3 0.3 46.24 24.65

Average 94.8 1.7 2.9 0.6 45.21 24.26 Hy-Line 73 90.7 4.5 3.9 0.9 43.43 27.34 W-98 77 95.0 2.4 2.1 0.5 46.57 27.35

Average 92.9 3.4 3.0 0.7 45.00 27.35 H&N 73 93.6 3.5 2.2 0.6 44.85 26.16 Nick Chick 77 93.7 3.4 2.0 0.9 47.12 27.00

Average 93.7 3.5 2.1 0.8 45.99 26.58 Lohmann 73 94.9 2.4 2.0 0.7 45.33 24.62 LSL-Lite 77 93.3 3.9 2.4 0.3 47.31 27.26

Average 94.1 3.2 2.2 0.5 46.32 25.94 Bovans 73 94.0 3.2 1.9 0.9 45.20 25.34 White 77 93.4 4.4 1.8 0.4 46.12 24.84

Average 93.7 3.8 1.9 0.7 45.66 25.09 Shaver 73 93.0 2.6 3.8 0.6 46.85 24.60 White 77 93.2 3.4 3.0 0.4 45.10 23.55

Average 93.1 3.0 3.4 0.5 45.97 24.07 DeKalb 73 95.6 2.4 1.7 0.4 49.20 28.10 White 77 95.2 2.4 1.6 0.7 46.68 27.20

Average 95.4 2.4 1.7 0.6 47.94 27.65 ISA Babcock 73 93.2 3.8 2.4 0.7 50.08 27.75 White 77 93.6 2.9 2.4 1.1 47.36 26.12

Average 93.4 3.3 2.4 0.9 48.72 26.93 ISA 73 94.8 2.2 2.3 0.7 46.44 24.46 Exp. White 77 93.8 2.8 2.8 0.7 47.03 26.38

Average 94.3 2.5 2.5 0.7 46.74 25.42 Novogen 73 93.3 3.8 2.1 0.8 45.38 25.90 White 77 92.3 3.2 3.5 1.0 45.24 25.75

Average 92.8 3.5 2.8 0.9 45.31 25.82 Bovans 73 91.8 3.8 3.6 0.8 45.68 25.58 Robust 77 95.6 2.4 1.3 0.6 47.21 25.64

Average 93.7 3.1 2.5 0.7 46.45 25.61

All 73 93.6 3.1 2.6 0.7 46.06 25.79 Strains 77 94.0 2.9 2.4 0.6 46.54 25.98

1All strains were housed such that each strain is equally represented in each density. There are no significant differences among these means.

51

TABLE 51. EFFECT OF WHITE EGG STRAIN AND DENSITY ON PERFORMANCE OF HENS IN THE 38th NCLP&MT (119-763 DAYS) NON-ANOREXIC MOLT PROGRAM

Eggs Feed Feed Per Bird Egg Egg

Breeder Density1 Consumption Conversion Housed Production Mass Mortality (Strain) (in2/hen) (kg/100/hen/d) (g egg/g feed) (HD%) (g/HD) (%)

Hy-Line 73 9.9 0.47 476.5 76.0 48.0 5.8 W-36 77 10.3 0.46 483.6 76.6 48.8 5.6

Average 10.1C 0.47 480.1BCD 76.3F 48.4D 5.7F Hy-Line 73 11.4 0.44 474.7 77.1 51.0 9.1 W-98 77 11.3 0.46 466.9 78.8 52.8 11.6

Average 11.4A 0.45 470.8 CD 77.9EF 51.9ABC 10.3CDEF H&N 73 11.0 0.46 482.4 79.7 51.3 15.4 Nick Chick 77 11.2 0.46 499.8 82.1 52.7 13.4

Average 11.1AB 0.46 491.1ABC 80.9BC 52.0ABC 14.4BCDE Lohmann 73 11.2 0.46 483.6 81.4 52.1 17.0 LSL-Lite 77 11.1 0.46 500.8 82.5 52.9 16.1

Average 11.2AB 0.46 492.2ABC 82.0AB 52.5AB 16.6ABC Bovans 73 10.8 0.46 462.9 81.2 51.7 25.9 White 77 11.1 0.46 483.1 81.7 51.6 20.8

Average 10.9AB 0.46 473.0CD 81.5AB 51.6BC 23.4A Shaver 73 10.0 0.47 470.9 77.4 48.3 10.6 White 77 10.2 0.48 500.6 80.3 49.6 6.1

Average 10.1C 0.47 485.8ABCD 78.8DE 49.0D 8.4EF DeKalb 73 11.3 0.46 493.1 82.3 52.7 15.5 White 77 11.4 0.46 509.3 83.6 53.6 14.3

Average 11.4A 0.46 501.2AB 83.0A 53.2A 14.9BCDE ISA Babcock 73 11.1 0.46 506.0 81.1 52.2 8.0 White 77 11.2 0.46 501.1 81.5 52.9 10.6

Average 11.2AB 0.46 503.6A 81.3ABC 52.5AB 9.3DEF ISA 73 10.6 0.47 463.8 79.5 50.7 19.6 Exp. White 77 11.1 0.46 497.9 80.7 51.4 12.8

Average 10.8B 0.47 480.8BCD 80.1BCD 51.1C 16.2ABCD Novogen 73 11.0 0.45 471.3 78.5 50.9 15.5 White 77 11.0 0.45 490.7 78.6 50.8 10.0

Average 11.0AB 0.45 481.0BCD 78.6DE 50.9C 12.7CDEF Bovans 73 11.2 0.45 461.3 79.5 51.0 22.8 Robust 77 10.9 0.46 471.8 79.5 50.6 18.9

Average 11.0AB 0.45 466.6D 79.5CDE 50.8C 20.8AB

All 73 10.9 0.46 476.9Z 79.4Z 50.9Z 15.0 Strains 77 11.0 0.46 491.4Y 80.5Y 51.6Y 12.7 1All strains were housed such that each strain is equally represented in each density. A,B,C,D,E,F - Different letters denote significant differences (P<.01), comparisons made among strain average values. Y,Z- Different letters denote significant differences (P<.01), comparisons made between density average values.

52

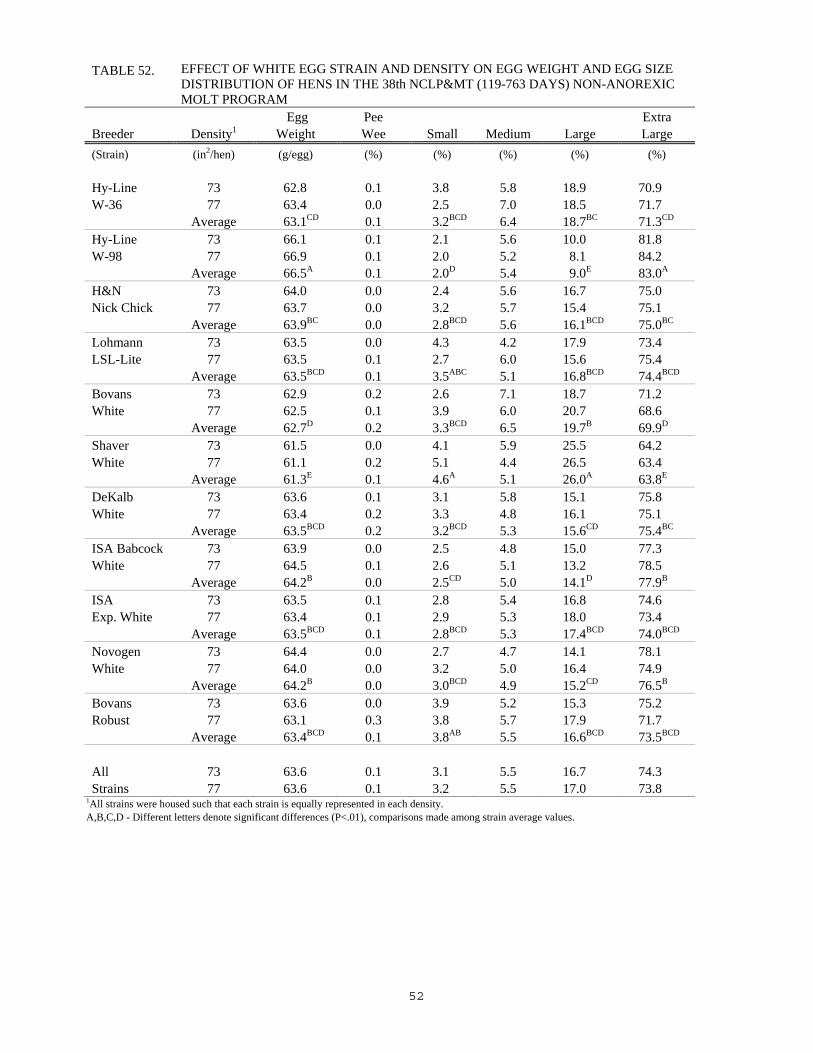
TABLE 52. EFFECT OF WHITE EGG STRAIN AND DENSITY ON EGG WEIGHT AND EGG SIZE DISTRIBUTION OF HENS IN THE 38th NCLP&MT (119-763 DAYS) NON-ANOREXIC MOLT PROGRAM

Egg Pee Extra Breeder Density1 Weight Wee Small Medium Large Large (Strain) (in2/hen) (g/egg) (%) (%) (%) (%) (%)

Hy-Line 73 62.8 0.1 3.8 5.8 18.9 70.9 W-36 77 63.4 0.0 2.5 7.0 18.5 71.7

Average 63.1CD 0.1 3.2BCD 6.4 18.7BC 71.3CD Hy-Line 73 66.1 0.1 2.1 5.6 10.0 81.8 W-98 77 66.9 0.1 2.0 5.2 8.1 84.2

Average 66.5A 0.1 2.0D 5.4 9.0E 83.0A H&N 73 64.0 0.0 2.4 5.6 16.7 75.0 Nick Chick 77 63.7 0.0 3.2 5.7 15.4 75.1

Average 63.9BC 0.0 2.8BCD 5.6 16.1BCD 75.0BC Lohmann 73 63.5 0.0 4.3 4.2 17.9 73.4 LSL-Lite 77 63.5 0.1 2.7 6.0 15.6 75.4

Average 63.5BCD 0.1 3.5ABC 5.1 16.8BCD 74.4BCD Bovans 73 62.9 0.2 2.6 7.1 18.7 71.2 White 77 62.5 0.1 3.9 6.0 20.7 68.6

Average 62.7D 0.2 3.3BCD 6.5 19.7B 69.9D Shaver 73 61.5 0.0 4.1 5.9 25.5 64.2 White 77 61.1 0.2 5.1 4.4 26.5 63.4

Average 61.3E 0.1 4.6A 5.1 26.0A 63.8E DeKalb 73 63.6 0.1 3.1 5.8 15.1 75.8 White 77 63.4 0.2 3.3 4.8 16.1 75.1

Average 63.5BCD 0.2 3.2BCD 5.3 15.6CD 75.4BC ISA Babcock 73 63.9 0.0 2.5 4.8 15.0 77.3 White 77 64.5 0.1 2.6 5.1 13.2 78.5

Average 64.2B 0.0 2.5CD 5.0 14.1D 77.9B ISA 73 63.5 0.1 2.8 5.4 16.8 74.6 Exp. White 77 63.4 0.1 2.9 5.3 18.0 73.4

Average 63.5BCD 0.1 2.8BCD 5.3 17.4BCD 74.0BCD Novogen 73 64.4 0.0 2.7 4.7 14.1 78.1 White 77 64.0 0.0 3.2 5.0 16.4 74.9

Average 64.2B 0.0 3.0BCD 4.9 15.2CD 76.5B Bovans 73 63.6 0.0 3.9 5.2 15.3 75.2 Robust 77 63.1 0.3 3.8 5.7 17.9 71.7

Average 63.4BCD 0.1 3.8AB 5.5 16.6BCD 73.5BCD

All 73 63.6 0.1 3.1 5.5 16.7 74.3 Strains 77 63.6 0.1 3.2 5.5 17.0 73.8

1All strains were housed such that each strain is equally represented in each density. A,B,C,D - Different letters denote significant differences (P<.01), comparisons made among strain average values.

53

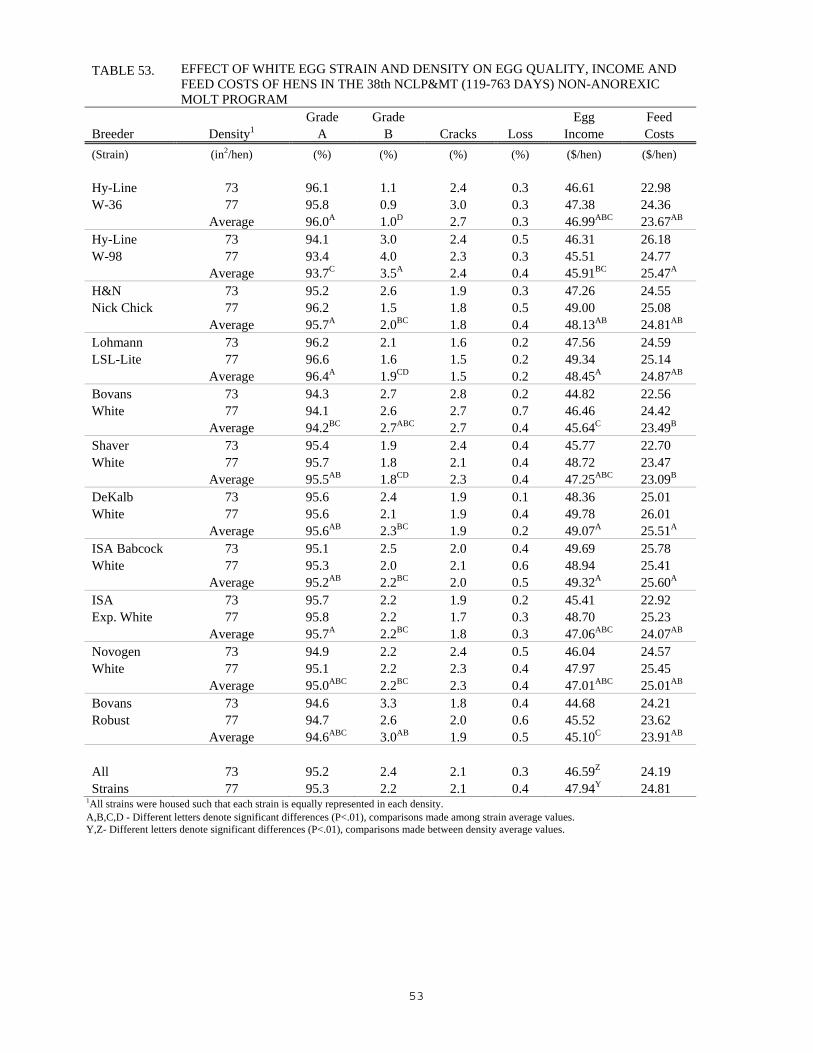
TABLE 53. EFFECT OF WHITE EGG STRAIN AND DENSITY ON EGG QUALITY, INCOME AND FEED COSTS OF HENS IN THE 38th NCLP&MT (119-763 DAYS) NON-ANOREXIC MOLT PROGRAM

Grade Grade Egg Feed Breeder Density1 A B Cracks Loss Income Costs (Strain) (in2/hen) (%) (%) (%) (%) ($/hen) ($/hen)

Hy-Line 73 96.1 1.1 2.4 0.3 46.61 22.98 W-36 77 95.8 0.9 3.0 0.3 47.38 24.36

Average 96.0A 1.0D 2.7 0.3 46.99ABC 23.67AB Hy-Line 73 94.1 3.0 2.4 0.5 46.31 26.18 W-98 77 93.4 4.0 2.3 0.3 45.51 24.77

Average 93.7C 3.5A 2.4 0.4 45.91BC 25.47A H&N 73 95.2 2.6 1.9 0.3 47.26 24.55 Nick Chick 77 96.2 1.5 1.8 0.5 49.00 25.08

Average 95.7A 2.0BC 1.8 0.4 48.13AB 24.81AB Lohmann 73 96.2 2.1 1.6 0.2 47.56 24.59 LSL-Lite 77 96.6 1.6 1.5 0.2 49.34 25.14

Average 96.4A 1.9CD 1.5 0.2 48.45A 24.87AB Bovans 73 94.3 2.7 2.8 0.2 44.82 22.56 White 77 94.1 2.6 2.7 0.7 46.46 24.42

Average 94.2BC 2.7ABC 2.7 0.4 45.64C 23.49B Shaver 73 95.4 1.9 2.4 0.4 45.77 22.70 White 77 95.7 1.8 2.1 0.4 48.72 23.47

Average 95.5AB 1.8CD 2.3 0.4 47.25ABC 23.09B DeKalb 73 95.6 2.4 1.9 0.1 48.36 25.01 White 77 95.6 2.1 1.9 0.4 49.78 26.01

Average 95.6AB 2.3BC 1.9 0.2 49.07A 25.51A ISA Babcock 73 95.1 2.5 2.0 0.4 49.69 25.78 White 77 95.3 2.0 2.1 0.6 48.94 25.41

Average 95.2AB 2.2BC 2.0 0.5 49.32A 25.60A ISA 73 95.7 2.2 1.9 0.2 45.41 22.92 Exp. White 77 95.8 2.2 1.7 0.3 48.70 25.23

Average 95.7A 2.2BC 1.8 0.3 47.06ABC 24.07AB Novogen 73 94.9 2.2 2.4 0.5 46.04 24.57 White 77 95.1 2.2 2.3 0.4 47.97 25.45

Average 95.0ABC 2.2BC 2.3 0.4 47.01ABC 25.01AB Bovans 73 94.6 3.3 1.8 0.4 44.68 24.21 Robust 77 94.7 2.6 2.0 0.6 45.52 23.62

Average 94.6ABC 3.0AB 1.9 0.5 45.10C 23.91AB

All 73 95.2 2.4 2.1 0.3 46.59Z 24.19 Strains 77 95.3 2.2 2.1 0.4 47.94Y 24.81

1All strains were housed such that each strain is equally represented in each density. A,B,C,D - Different letters denote significant differences (P<.01), comparisons made among strain average values. Y,Z- Different letters denote significant differences (P<.01), comparisons made between density average values.

54

TABLE 54. EFFECT OF BROWN EGG STRAIN AND DENSITY ON PERFORMANCE OF HENS IN THE 38th NCLP&MT (119-763 DAYS) NON-MOLTED

Eggs Feed Feed Per Bird Egg Egg

Breeder Density1 Consumption Conversion Housed Production Mass Mortality (Strain) (in2/hen) (kg/100/hen/d) (g egg/g feed) (HD%) (g/HD) (%)

Hy-Line 73 10.5 0.46 455.4 74.1 48.7 7.2 Brown 77 11.2 0.46 492.7 78.4 51.8 3.8

Average 10.8 0.46A 474.1ABC 76.2AB 50.2A 5.5C

Hy-Line 73 11.2 0.42 475.5 77.2 47.2 9.8 Silver Brown 77 11.1 0.43 494.0 77.8 47.6 7.0

Average 11.2 0.43BC 484.7A 77.5A 47.4BC 8.4BC

TETRA 73 10.7 0.41 411.8 67.3 43.8 15.5 Brown 77 11.5 0.42 411.8 72.8 47.9 28.8

Average 11.1 0.41C 411.8D 70.1C 45.8BC 22.1A

TETRA 73 10.3 0.43 450.0 73.2 44.7 16.7 Amber 77 11.7 0.39 439.7 73.3 45.6 13.8

Average 11.0 0.41C 444.8C 73.2BC 45.2C 15.2AB

ISA 73 11.2 0.45 467.9 76.6 50.2 11.9 Brown 77 11.6 0.44 488.0 79.6 51.3 15.0

Average 11.4 0.45ABC 477.9AB 78.1A 50.8A 13.5ABC

Bovans 73 11.4 0.45 489.4 80.1 51.1 17.7 Brown 77 11.3 0.45 481.3 78.2 51.4 15.0

Average 11.3 0.45AB 485.3A 79.1A 51.3A 16.4AB

Novogen 73 10.8 0.44 443.0 76.4 48.4 22.6 Brown 77 11.2 0.44 455.4 76.5 48.7 17.7

Average 11.0 0.44ABC 449.2BC 76.5AB 48.5AB 20.2A

All 73 10.9 0.44 456.1 75.0 47.7 14.5 Strains 77 11.4 0.43 466.1 76.7 49.2 14.4

NCSU Barred 73 9.3Z 0.26 270.3 43.9 24.7Z 7.8 Plym. Rock 77 10.2Y 0.25 257.8 44.4 25.7Y 13.4

1All strains were housed such that each strain is equally represented in each density. A,B,C,D - Different letters denote significant differences (P<.01), comparisons made among strain average values. Y,Z - Different letters denote significant differences (P<.01), comparisons made among density average values.

55

TABLE 55. EFFECT OF BROWN EGG STRAIN AND DENSITY ON EGG WEIGHT AND EGG SIZE DISTRIBUTION OF HENS IN THE 38th NCLP&MT (119-763 DAYS) NON-MOLTED

Egg Pee Extra Breeder Density1 Weight Wee Small Medium Large Large (Strain) (in2/hen) (g/egg) (%) (%) (%) (%) (%)

Hy-Line 73 65.7 0.0 1.2 5.6 15.4 77.2 Brown 77 66.0 0.1 0.5 4.5 16.2 78.4

Average 65.8A 0.0 0.9B 5.0B 15.8CD 77.8A

Hy-Line 73 61.1 0.4 2.4 8.6 32.7 55.6 Silver Brown 77 61.1 0.0 2.2 8.7 29.7 58.8

Average 61.1C 0.2 2.3AB 8.7A 31.2A 57.2C

TETRA 73 65.2 0.0 1.6 6.5 14.5 76.6 Brown 77 65.9 0.3 1.1 5.5 13.5 78.7

Average 65.5A 0.1 1.3B 6.0AB 14.0D 77.7A

TETRA 73 61.2 0.2 3.4 8.2 29.3 58.5 Amber 77 62.1 0.1 3.8 8.0 28.7 58.7

Average 61.7C 0.1 3.6A 8.1A 29.0A 58.6C

ISA 73 65.3 0.0 1.0 5.3 14.8 78.6 Brown 77 64.2 0.3 2.0 5.0 17.9 74.3

Average 64.8A 0.1 1.5B 5.2B 16.4CD 76.5A

Bovans 73 63.6 0.0 2.6 3.8 23.2 70.1 Brown 77 65.5 0.0 0.5 5.6 18.2 75.3

Average 64.6AB 0.0 1.6B 4.7B 20.7BC 72.7AB

Novogen 73 63.1 0.5 1.7 7.0 22.7 67.5 Brown 77 63.5 0.1 2.0 6.8 23.2 67.9 Average 63.3B 0.3 1.8B 6.9AB 23.0B 67.7B All 73 63.6 0.2 2.0 6.4 21.8 69.2 Strains 77 64.0 0.1 1.7 6.3 21.1 70.3 NCSU Barred 73 56.1 0.7 10.7 15.3 36.52 35.23 Plym. Rock 77 56.9 1.1 9.7 15.8 36.32 36.10

1All strains were housed such that each strain is equally represented in each density. A,B,C,D - Different letters denote significant differences (P<.01), comparisons made among strain average values.

56

TABLE 56. EFFECT OF BROWN EGG STRAIN AND DENSITY ON EGG QUALITY, INCOME AND FEED COSTS OF HENS IN THE 38th NCLP&MT (119-763 DAYS) NON-MOLTED

Grade Grade Egg Feed Breeder Density1 A B Cracks Loss Income Costs (Strain) (in2/hen) (%) (%) (%) (%) ($/hen) ($/hen)

Hy-Line 73 94.0 2.0 3.4 0.6 44.24 24.20 Brown 77 93.8 2.2 3.6 0.4 48.23 26.68

Average 93.9 2.1BC 3.5 0.5 46.23AB 25.44

Hy-Line 73 96.5 1.9 1.4 0.2 46.07 26.20 Silver Brown 77 95.9 1.6 1.9 0.6 47.61 26.66

Average 96.2 1.8C 1.7 0.4 46.84A 26.43

TETRA 73 93.3 3.6 2.4 0.8 39.50 25.41 Brown 77 93.0 3.4 2.6 0.9 39.46 25.10

Average 93.2 3.5ABC 2.5 0.9 39.48D 25.25

TETRA 73 92.8 4.7 2.1 0.4 42.46 24.59 Amber 77 94.6 3.1 1.6 0.7 41.74 27.54

Average 93.7 3.9ABC 1.9 0.6 42.10CD 26.06

ISA 73 93.1 4.6 2.0 0.3 45.37 26.84 Brown 77 93.0 4.6 1.9 0.5 46.98 27.66

Average 93.0 4.6A 2.0 0.4 46.18AB 27.25

Bovans 73 96.3 1.6 2.0 0.2 48.13 26.72 Brown 77 94.7 2.9 2.0 0.4 47.11 27.28

Average 95.5 2.2BC 2.0 0.3 47.62A 27.00

Novogen 73 93.9 4.0 1.6 0.5 42.39 24.27 Brown 77 93.9 4.1 1.7 0.2 44.01 25.79 Average 93.9 4.1AB 1.7 0.4 43.20BC 25.03 All 73 94.3 3.2 2.1 0.4 44.02 25.46 Strains 77 94.1 3.1 2.2 0.5 45.02 26.67 NCSU Barred 73 87.9 7.0 3.6 1.5 23.12 21.26 Plym. Rock 77 95.1 3.2 0.9 0.9 22.84 22.03

1All strains were housed such that each strain is equally represented in each density. A,B,C,D - Different letters denote significant differences (P<.01), comparisons made among strain average values.

57

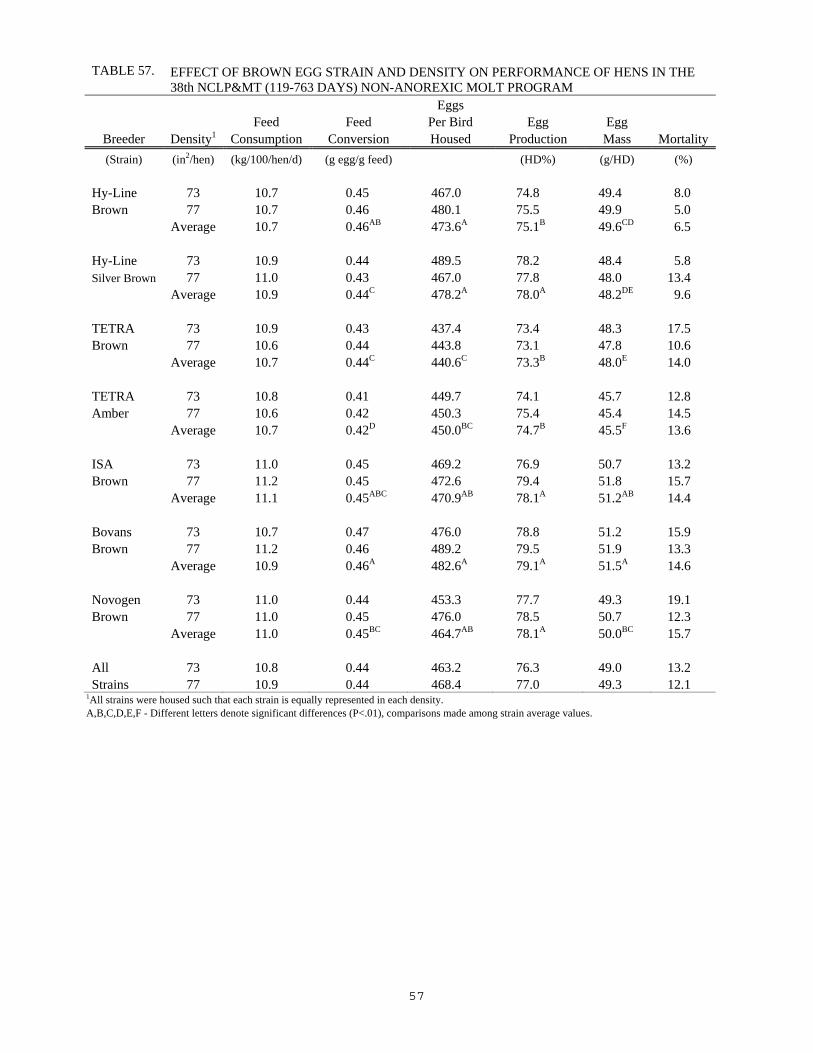
TABLE 57. EFFECT OF BROWN EGG STRAIN AND DENSITY ON PERFORMANCE OF HENS IN THE 38th NCLP&MT (119-763 DAYS) NON-ANOREXIC MOLT PROGRAM

Eggs Feed Feed Per Bird Egg Egg

Breeder Density1 Consumption Conversion Housed Production Mass Mortality (Strain) (in2/hen) (kg/100/hen/d) (g egg/g feed) (HD%) (g/HD) (%)

Hy-Line 73 10.7 0.45 467.0 74.8 49.4 8.0 Brown 77 10.7 0.46 480.1 75.5 49.9 5.0

Average 10.7 0.46AB 473.6A 75.1B 49.6CD 6.5

Hy-Line 73 10.9 0.44 489.5 78.2 48.4 5.8 Silver Brown 77 11.0 0.43 467.0 77.8 48.0 13.4

Average 10.9 0.44C 478.2A 78.0A 48.2DE 9.6

TETRA 73 10.9 0.43 437.4 73.4 48.3 17.5 Brown 77 10.6 0.44 443.8 73.1 47.8 10.6

Average 10.7 0.44C 440.6C 73.3B 48.0E 14.0

TETRA 73 10.8 0.41 449.7 74.1 45.7 12.8 Amber 77 10.6 0.42 450.3 75.4 45.4 14.5

Average 10.7 0.42D 450.0BC 74.7B 45.5F 13.6

ISA 73 11.0 0.45 469.2 76.9 50.7 13.2 Brown 77 11.2 0.45 472.6 79.4 51.8 15.7

Average 11.1 0.45ABC 470.9AB 78.1A 51.2AB 14.4

Bovans 73 10.7 0.47 476.0 78.8 51.2 15.9 Brown 77 11.2 0.46 489.2 79.5 51.9 13.3

Average 10.9 0.46A 482.6A 79.1A 51.5A 14.6

Novogen 73 11.0 0.44 453.3 77.7 49.3 19.1 Brown 77 11.0 0.45 476.0 78.5 50.7 12.3

Average 11.0 0.45BC 464.7AB 78.1A 50.0BC 15.7

All 73 10.8 0.44 463.2 76.3 49.0 13.2 Strains 77 10.9 0.44 468.4 77.0 49.3 12.1

1All strains were housed such that each strain is equally represented in each density. A,B,C,D,E,F - Different letters denote significant differences (P<.01), comparisons made among strain average values.

58

TABLE 58. EFFECT OF BROWN EGG STRAIN AND DENSITY ON EGG WEIGHT AND EGG SIZE DISTRIBUTION OF HENS IN THE 38th NCLP&MT (119-763 DAYS) NON-ANOREXIC MOLT PROGRAM

Egg Pee Extra Breeder Density1 Weight Wee Small Medium Large Large (Strain) (in2/hen) (g/egg) (%) (%) (%) (%) (%)

Hy-Line 73 65.9 0.0 0.6 4.4 14.1 80.5 Brown 77 65.9 0.0 0.8 4.5 13.5 80.8

Average 65.9A 0.0 0.7C 4.4BC 13.8C 80.6A

Hy-Line 73 61.7 0.1 2.0 7.3 27.7 62.7 Silver Brown 77 61.6 0.0 1.4 8.7 27.3 62.5

Average 61.7D 0.0 1.7BC 8.0A 27.5A 62.6C

TETRA 73 65.5 0.0 1.9 4.4 14.1 78.9 Brown 77 65.3 0.0 1.9 4.8 15.4 77.7

Average 65.4AB 0.0 1.9B 4.6BC 14.8C 78.3AB

TETRA 73 61.6 0.1 2.8 7.8 27.2 61.8 Amber 77 60.0 0.0 4.6 9.3 31.7 54.3

Average 60.8D 0.0 3.7A 8.5A 29.4A 58.1C

ISA 73 65.4 0.0 2.4 3.3 15.2 78.9 Brown 77 64.7 0.0 2.3 4.9 15.5 77.1

Average 65.1AB 0.0 2.3B 4.1C 15.3BC 78.0AB

Bovans 73 64.6 0.0 1.2 5.8 17.9 74.9 Brown 77 64.9 0.1 1.5 4.9 15.8 77.4

Average 64.8B 0.0 1.3BC 5.3BC 16.9BC 76.2AB

Novogen 73 63.1 0.0 1.9 5.3 20.0 72.5 Brown 77 64.1 0.2 1.4 6.1 17.2 74.9 Average 63.6C 0.1 1.7BC 5.7B 18.6B 73.7B All 73 64.0 0.0 1.8 5.5 19.5 72.9 Strains 77 63.8 0.0 2.0 6.2 19.5 72.1

1All strains were housed such that each strain is equally represented in each density. A,B,C - Different letters denote significant differences (P<.01), comparisons made among strain average values.

59

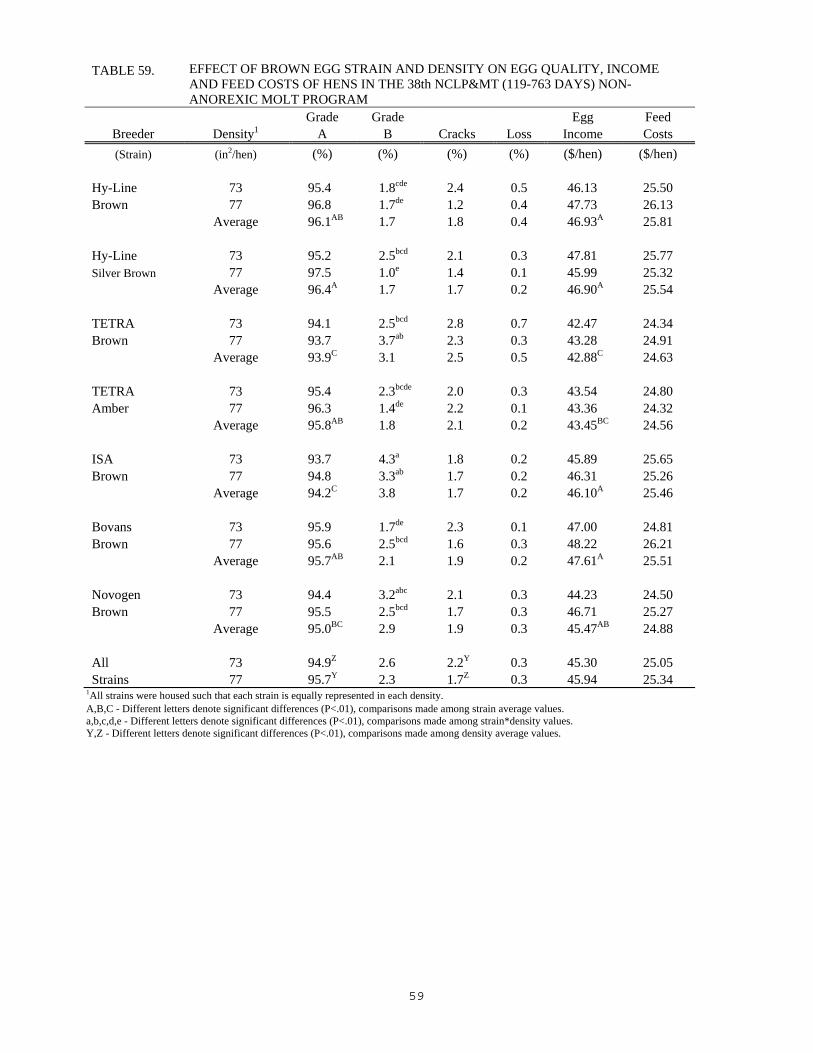
TABLE 59. EFFECT OF BROWN EGG STRAIN AND DENSITY ON EGG QUALITY, INCOME AND FEED COSTS OF HENS IN THE 38th NCLP&MT (119-763 DAYS) NON-ANOREXIC MOLT PROGRAM

Grade Grade Egg Feed Breeder Density1 A B Cracks Loss Income Costs (Strain) (in2/hen) (%) (%) (%) (%) ($/hen) ($/hen)

Hy-Line 73 95.4 1.8cde 2.4 0.5 46.13 25.50 Brown 77 96.8 1.7de 1.2 0.4 47.73 26.13

Average 96.1AB 1.7 1.8 0.4 46.93A 25.81

Hy-Line 73 95.2 2.5bcd 2.1 0.3 47.81 25.77 Silver Brown 77 97.5 1.0e 1.4 0.1 45.99 25.32

Average 96.4A 1.7 1.7 0.2 46.90A 25.54

TETRA 73 94.1 2.5bcd 2.8 0.7 42.47 24.34 Brown 77 93.7 3.7ab 2.3 0.3 43.28 24.91

Average 93.9C 3.1 2.5 0.5 42.88C 24.63

TETRA 73 95.4 2.3bcde 2.0 0.3 43.54 24.80 Amber 77 96.3 1.4de 2.2 0.1 43.36 24.32

Average 95.8AB 1.8 2.1 0.2 43.45BC 24.56

ISA 73 93.7 4.3a 1.8 0.2 45.89 25.65 Brown 77 94.8 3.3ab 1.7 0.2 46.31 25.26

Average 94.2C 3.8 1.7 0.2 46.10A 25.46

Bovans 73 95.9 1.7de 2.3 0.1 47.00 24.81 Brown 77 95.6 2.5bcd 1.6 0.3 48.22 26.21

Average 95.7AB 2.1 1.9 0.2 47.61A 25.51

Novogen 73 94.4 3.2abc 2.1 0.3 44.23 24.50 Brown 77 95.5 2.5bcd 1.7 0.3 46.71 25.27 Average 95.0BC 2.9 1.9 0.3 45.47AB 24.88 All 73 94.9Z 2.6 2.2Y 0.3 45.30 25.05 Strains 77 95.7Y 2.3 1.7Z 0.3 45.94 25.34

1All strains were housed such that each strain is equally represented in each density. A,B,C - Different letters denote significant differences (P<.01), comparisons made among strain average values. a,b,c,d,e - Different letters denote significant differences (P<.01), comparisons made among strain*density values. Y,Z - Different letters denote significant differences (P<.01), comparisons made among density average values.

60

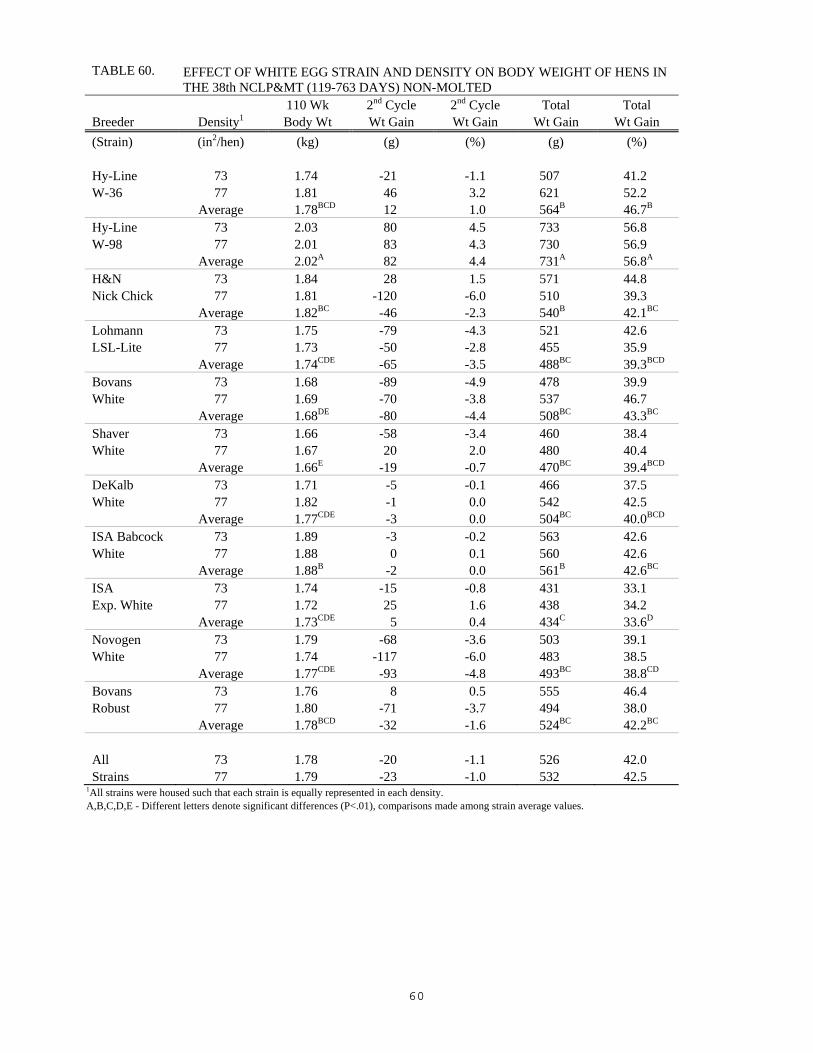
TABLE 60. EFFECT OF WHITE EGG STRAIN AND DENSITY ON BODY WEIGHT OF HENS IN THE 38th NCLP&MT (119-763 DAYS) NON-MOLTED

110 Wk 2nd Cycle 2nd Cycle Total Total Breeder Density1 Body Wt Wt Gain Wt Gain Wt Gain Wt Gain (Strain) (in2/hen) (kg) (g) (%) (g) (%)

Hy-Line 73 1.74 -21 -1.1 507 41.2 W-36 77 1.81 46 3.2 621 52.2

Average 1.78BCD 12 1.0 564B 46.7B Hy-Line 73 2.03 80 4.5 733 56.8 W-98 77 2.01 83 4.3 730 56.9

Average 2.02A 82 4.4 731A 56.8A H&N 73 1.84 28 1.5 571 44.8 Nick Chick 77 1.81 -120 -6.0 510 39.3

Average 1.82BC -46 -2.3 540B 42.1BC Lohmann 73 1.75 -79 -4.3 521 42.6 LSL-Lite 77 1.73 -50 -2.8 455 35.9

Average 1.74CDE -65 -3.5 488BC 39.3BCD Bovans 73 1.68 -89 -4.9 478 39.9 White 77 1.69 -70 -3.8 537 46.7

Average 1.68DE -80 -4.4 508BC 43.3BC Shaver 73 1.66 -58 -3.4 460 38.4 White 77 1.67 20 2.0 480 40.4

Average 1.66E -19 -0.7 470BC 39.4BCD DeKalb 73 1.71 -5 -0.1 466 37.5 White 77 1.82 -1 0.0 542 42.5

Average 1.77CDE -3 0.0 504BC 40.0BCD ISA Babcock 73 1.89 -3 -0.2 563 42.6 White 77 1.88 0 0.1 560 42.6

Average 1.88B -2 0.0 561B 42.6BC ISA 73 1.74 -15 -0.8 431 33.1 Exp. White 77 1.72 25 1.6 438 34.2

Average 1.73CDE 5 0.4 434C 33.6D Novogen 73 1.79 -68 -3.6 503 39.1 White 77 1.74 -117 -6.0 483 38.5

Average 1.77CDE -93 -4.8 493BC 38.8CD Bovans 73 1.76 8 0.5 555 46.4 Robust 77 1.80 -71 -3.7 494 38.0

Average 1.78BCD -32 -1.6 524BC 42.2BC

All 73 1.78 -20 -1.1 526 42.0 Strains 77 1.79 -23 -1.0 532 42.5

1All strains were housed such that each strain is equally represented in each density. A,B,C,D,E - Different letters denote significant differences (P<.01), comparisons made among strain average values.

61

TABLE 61. EFFECT OF WHITE EGG STRAIN AND DENSITY ON BODY WEIGHT OF HENS IN THE 38th NCLP&MT (119-763 DAYS) NON-ANOREXIC MOLT PROGRAM

110 Wk 2nd Cycle 2nd Cycle Total Total Breeder Density1 Body Wt Wt Gain Wt Gain Wt Gain Wt Gain (Strain) (in2/hen) (kg) (g) (%) (g) (%)

Hy-Line 73 1.84 377 26.0 638 53.2 W-36 77 1.84 418 29.5 624 51.5

Average 1.84CD 397AB 27.8 631B 52.3B Hy-Line 73 2.08 468 29.6 744 56.3 W-98 77 2.14 522 32.9 823 62.6

Average 2.11A 495A 31.2 783A 59.5A H&N 73 1.91 451 31.5 652 52.1 Nick Chick 77 1.89 417 28.4 604 47.1

Average 1.90BC 434AB 29.9 628B 49.6BCD Lohmann 73 1.84 396 28.1 561 44.0 LSL-Lite 77 1.84 376 26.3 549 42.5

Average 1.84CD 386B 27.2 555BCD 43.2DE Bovans 73 1.81 333 22.6 605 50.1 White 77 1.84 387 27.4 639 53.5

Average 1.83CDE 360B 25.0 622BC 51.8BC Shaver 73 1.73 362 26.7 538 45.1 White 77 1.78 356 25.9 550 44.8

Average 1.76E 359B 26.3 544CD 44.9CDE DeKalb 73 1.83 412 30.1 543 42.5 White 77 1.79 269 18.1 487 37.6

Average 1.81DE 341B 24.1 515D 40.0E ISA Babcock 73 1.96 461 31.0 612 45.5 White 77 1.98 428 27.7 634 47.1

Average 1.97B 444AB 29.4 623BC 46.3BCDE ISA 73 1.84 346 23.7 518 39.3 Exp. White 77 1.86 350 23.5 546 41.6

Average 1.85CD 348B 23.6 532D 40.4E Novogen 73 1.86 455 32.8 597 47.3 White 77 1.81 398 28.4 567 45.8

Average 1.84CD 427AB 30.6 582BCD 46.5BCDE Bovans 73 1.84 368 25.2 613 49.9 Robust 77 1.81 376 27.0 551 43.9

Average 1.82CDE 372B 26.1 582BCD 46.9BCDE

All 73 1.87 403 27.9 602 47.7 Strains 77 1.87 391 26.8 598 47.1

1All strains were housed such that each strain is equally represented in each density. A,B,C,D,E - Different letters denote significant differences (P<.01), comparisons made among strain average values.

62

TABLE 62. EFFECT OF BROWN EGG STRAIN AND DENSITY ON BODY WEIGHT OF HENS IN THE 38th NCLP&MT (119-763 DAYS) NON-MOLTED

110 Wk 2nd Cycle 2nd Cycle Total Total Breeder Density1 Body Wt Wt Gain Wt Gain Wt Gain Wt Gain (Strain) (in2/hen) (kg) (g) (%) (g) (%)

Hy-Line 73 2.06 -12 -0.4 592 40.3 Brown 77 2.08 -86 -3.9 549 36.2

Average 2.07B -49 -2.1 571AB 38.2AB

Hy-Line 73 2.13 10 0.7 592 38.6 Silver Brown 77 2.25 -67 -2.4 677 43.2

Average 2.19A -28 -0.9 634A 40.9A

TETRA 73 2.00 64 3.3 517 34.9 Brown 77 2.09 59 3.0 614 41.8

Average 2.04B 62 3.2 565AB 38.3AB

TETRA 73 2.11 -19 -0.8 549 35.3 Amber 77 2.13 -74 -3.2 581 37.6

Average 2.12AB -46 -2.0 565AB 36.5AB

ISA 73 2.05 -5 -0.2 524 34.2 Brown 77 2.03 -50 -2.4 475 30.8

Average 2.04B -27 -1.3 500BC 32.5ABC

Bovans 73 1.94 -75 -3.7 415 27.1 Brown 77 1.93 -104 -4.9 381 24.8

Average 1.93C -90 -4.3 398C 26.0C

Novogen 73 2.05 50 2.9 483 31.1 Brown 77 2.03 1 0.1 486 31.9

Average 2.04B 26 1.5 485BC 31.5BC

All 73 2.05 2 0.2 525 34.5 Strains 77 2.08 -46 -2.0 538 35.2

NCSU Barred 73 2.24 118 5.7 1004 81.1 Plym. Rock 77 2.28 52 2.4 1018 80.6

1All strains were housed such that each strain is equally represented in each density. A,B,C - Different letters denote significant differences (P<.01), comparisons made among strain average values.

63

TABLE 63. EFFECT OF BROWN EGG STRAIN AND DENSITY ON BODY WEIGHT OF HENS IN THE 38th NCLP&MT (119-763 DAYS) NON-ANOREXIC MOLT PROGRAM

110 Wk 2nd Cycle 2nd Cycle Total Total Breeder Density1 Body Wt Wt Gain Wt Gain Wt Gain Wt Gain (Strain) (in2/hen) (kg) (g) (%) (g) (%)

Hy-Line 73 2.12 528 33.2 648 44.1 Brown 77 2.16 630 41.5 652 43.2

Average 2.14B 579ABC 37.3ABC 650A 43.6A

Hy-Line 73 2.21 500 29.5 615 38.6 Silver Brown 77 2.27 484 27.4 708 45.3

Average 2.24A 492BC 28.4C 661A 41.9AB

TETRA 73 2.14 483 30.2 643 43.0 Brown 77 2.09 440 27.0 636 43.9

Average 2.12BC 462C 28.6C 639A 43.5A

TETRA 73 2.15 622 40.7 617 40.3 Amber 77 2.17 581 37.3 642 42.2

Average 2.16AB 601AB 39.0AB 630A 41.3AB

ISA 73 2.18 646 42.6 653 45.1 Brown 77 2.14 631 42.5 592 38.6

Average 2.16AB 638A 42.6A 623A 41.8AB

Bovans 73 2.05 524 35.4 521 34.1 Brown 77 2.05 432 27.4 517 33.7

Average 2.05C 478BC 31.4BC 519B 33.9B

Novogen 73 2.17 580 37.0 574 36.2 Brown 77 2.17 555 35.6 564 35.2

Average 2.17AB 568ABC 36.3ABC 569AB 35.7AB

All 73 2.15 555 35.5 610 40.2 Strains 77 2.15 536 34.1 616 40.3

1All strains were housed such that each strain is equally represented in each density. A,B,C - Different letters denote significant differences (P<.01), comparisons made among strain average values.

64

Figure 1. Hy-Line W-36, bi-weekly hen-day egg production1 and period feed consumption1 by hen population (73 or 77 in2) and molt program (NM2 or NA3)

0

10

20

30

40

50

60

70

80

90

100

17 25 33 41 49 57 65 73 81 89 97 105

Weeks of Age

HD %, 73 sq in NM Hens HD %, 77 sq in NM Hens HD %, 73 sq in NA Hens HD %, 77 sq in NA Hens

Feed Cons, 73 sq in NM Hens Feed Cons, 77 sq in NM Hens Feed Cons, 73 sq in NA Hens Feed Cons, 77 sq in NA Hens

1 Hen-day Production is % and Feed Consumption is kg/100 Hens/d2 NM = non-molted3 NA = non-anorexic molt program

Figure 2. Hy-Line W-98, hen-day egg production1 and period feed consumption1 by hen population (73 or 77 in2) and molt program (NM2 or NA3)

0

10

20

30

40

50

60

70

80

90

100

17 25 33 41 49 57 65 73 81 89 97 105

Weeks of Age

HD %, 73 sq in NM Hens HD %, 77 sq in NM Hens HD %, 73 sq in NA Hens HD %, 77 sq in NA Hens

Feed Cons, 73 sq in NM Hens Feed Cons, 77 sq in NM Hens Feed Cons, 73 sq in NA Hens Feed Cons, 77 sq in NA Hens

1 Hen-day Production is % and Feed Consumption is kg/100 Hens/d2 NM = non-molted3 NA = non-anorexic molt program

65

Figure 3. H & N “Nick Chick”, bi-weekly hen-day egg production1 and period feed consumption1 by hen population (73 or 77 in2) and molt program (NM2 or NA3)

0

10

20

30

40

50

60

70

80

90

100

17 25 33 41 49 57 65 73 81 89 97 105

Weeks of Age

HD %, 73 sq in NM Hens HD %, 77 sq in NM Hens HD %, 73 sq in NA Hens HD %, 77 sq in NA Hens

Feed Cons, 73 sq in NM Hens Feed Cons, 77 sq in NM Hens Feed Cons, 73 sq in NA Hens Feed Cons, 77 sq in NA Hens

1 Hen-day Production is % and Feed Consumption is kg/100 Hens/d2 NM = non-molted3 NA = non-anorexic molt program

66

Figure 4. Lohmann LSL-Lite, bi-weekly hen-day egg production1 and period feed consumption1 by hen population (73 or 77 in2) and molt program (NM2 or NA3)

0

10

20

30

40

50

60

70

80

90

100

17 25 33 41 49 57 65 73 81 89 97 105

Weeks of Age

HD %, 73 sq in NM Hens HD %, 77 sq in NM Hens HD %, 73 sq in NA Hens HD %, 77 sq in NA Hens

Feed Cons, 73 sq in NM Hens Feed Cons, 77 sq in NM Hens Feed Cons, 73 sq in NA Hens Feed Cons, 77 sq in NA Hens

1 Hen-day Production is % and Feed Consumption is kg/100 Hens/d2 NM = non-molted3 NA = non-anorexic molt program

67

Figure 5. ISA Bovans White, bi-weekly hen-day egg production1 and period feed consumption1 by hen population (73 or 77 in2) and molt program (NM2 or NA3)

0

10

20

30

40

50

60

70

80

90

100

17 25 33 41 49 57 65 73 81 89 97 105

Weeks of Age

HD %, 73 sq in NM Hens HD %, 77 sq in NM Hens HD %, 73 sq in NA Hens HD %, 77 sq in NA Hens

Feed Cons, 73 sq in NM Hens Feed Cons, 77 sq in NM Hens Feed Cons, 73 sq in NA Hens Feed Cons, 77 sq in NA Hens

1 Hen-day Production is % and Feed Consumption is kg/100 Hens/d2 NM = non-molted3 NA = non-anorexic molt program

68

Figure 6. ISA Shaver White, bi-weekly hen-day egg production1 and period feed consumption1 by hen population (73 or 77 in2) and molt program (NM2 or NA3)

0

10

20

30

40

50

60

70

80

90

100

17 25 33 41 49 57 65 73 81 89 97 105

Weeks of Age

HD %, 73 sq in NM Hens HD %, 77 sq in NM Hens HD %, 73 sq in NA Hens HD %, 77 sq in NA Hens

Feed Cons, 73 sq in NM Hens Feed Cons, 77 sq in NM Hens Feed Cons, 73 sq in NA Hens Feed Cons, 77 sq in NA Hens

1 Hen-day Production is % and Feed Consumption is kg/100 Hens/d2 NM = non-molted3 NA = non-anorexic molt program

69

Figure 7. ISA Dekalb White, bi-weekly hen-day egg production1 and period feed consumption1 by hen population (73 or 77 in2) and molt program (NM2 or NA3)

0

10

20

30

40

50

60

70

80

90

100

17 25 33 41 49 57 65 73 81 89 97 105

Weeks of Age

HD %, 73 sq in NM Hens HD %, 77 sq in NM Hens HD %, 73 sq in NA Hens HD %, 77 sq in NA Hens

Feed Cons, 73 sq in NM Hens Feed Cons, 77 sq in NM Hens Feed Cons, 73 sq in NA Hens Feed Cons, 77 sq in NA Hens

1 Hen-day Production is % and Feed Consumption is kg/100 Hens/d2 NM = non-molted3 NA = non-anorexic molt program

70

Figure 8. ISA Babcock White, bi-weekly hen-day egg production1 and period feed consumption1 by hen population (73 or 77 in2) and molt program (NM2 or NA3)

0

10

20

30

40

50

60

70

80

90

100

17 25 33 41 49 57 65 73 81 89 97 105

Weeks of Age

HD %, 73 sq in NM Hens HD %, 77 sq in NM Hens HD %, 73 sq in NA Hens HD %, 77 sq in NA Hens

Feed Cons, 73 sq in NM Hens Feed Cons, 77 sq in NM Hens Feed Cons, 73 sq in NA Hens Feed Cons, 77 sq in NA Hens

1 Hen-day Production is % and Feed Consumption is kg/100 Hens/d2 NM = non-molted3 NA = non-anorexic molt program

71

Figure 9. ISA Experimental White, bi-weekly hen-day egg production1 and period feed consumption1 by hen population (73 or 77 in2) and molt program (NM2 or NA3)

0

10

20

30

40

50

60

70

80

90

100

17 25 33 41 49 57 65 73 81 89 97 105

Weeks of Age

HD %, 73 sq in NM Hens HD %, 77 sq in NM Hens HD %, 73 sq in NA Hens HD %, 77 sq in NA Hens

Feed Cons, 73 sq in NM Hens Feed Cons, 77 sq in NM Hens Feed Cons, 73 sq in NA Hens Feed Cons, 77 sq in NA Hens

1 Hen-day Production is % and Feed Consumption is kg/100 Hens/d2 NM = non-molted3 NA = non-anorexic molt program

72

Figure 10. Novogen White, bi-weekly hen-day egg production1 and period feed consumption1 by hen population (73 or 77 in2) and molt program (NM2 or NA3)

0

10

20

30

40

50

60

70

80

90

100

17 25 33 41 49 57 65 73 81 89 97 105

Weeks of Age

HD %, 73 sq in NM Hens HD %, 77 sq in NM Hens HD %, 73 sq in NA Hens HD %, 77 sq in NA Hens

Feed Cons, 73 sq in NM Hens Feed Cons, 77 sq in NM Hens Feed Cons, 73 sq in NA Hens Feed Cons, 77 sq in NA Hens

1 Hen-day Production is % and Feed Consumption is kg/100 Hens/d2 NM = non-molted3 NA = non-anorexic molt program

73

Figure 11. ISA Bovans Robust, bi-weekly hen-day egg production1 and period feed consumption1 by hen population (73 or 77 in2) and molt program (NM2 or NA3)

0

10

20

30

40

50

60

70

80

90

100

17 25 33 41 49 57 65 73 81 89 97 105

Weeks of Age

HD %, 73 sq in NM Hens HD %, 77 sq in NM Hens HD %, 73 sq in NA Hens HD %, 77 sq in NA Hens

Feed Cons, 73 sq in NM Hens Feed Cons, 77 sq in NM Hens Feed Cons, 73 sq in NA Hens Feed Cons, 77 sq in NA Hens

1 Hen-day Production is % and Feed Consumption is kg/100 Hens/d2 NM = non-molted3 NA = non-anorexic molt program

74

Figure 12. Hy-Line Brown, bi-weekly hen-day egg production1 and period feed consumption1 by hen population (73 or 77 in2) and molt program (NM2 or NA3)

0

10

20

30

40

50

60

70

80

90

100

17 25 33 41 49 57 65 73 81 89 97 105

Weeks of Age

HD %, 73 sq in NM Hens HD %, 77 sq in NM Hens HD %, 73 sq in NA Hens HD %, 77 sq in NA Hens

Feed Cons, 73 sq in NM Hens Feed Cons, 77 sq in NM Hens Feed Cons, 73 sq in NA Hens Feed Cons, 77 sq in NA Hens

1 Hen-day Production is % and Feed Consumption is kg/100 Hens/d2 NM = non-molted3 NA = non-anorexic molt program

75

Figure 13. Hy-Line Silver Brown, bi-weekly hen-day egg production1 and period feed consumption1 by hen population (73 or 77 in2) and molt program (NM2 or NA3)

0

10

20

30

40

50

60

70

80

90

100

17 25 33 41 49 57 65 73 81 89 97 105

Weeks of Age

HD %, 73 sq in NM Hens HD %, 77 sq in NM Hens HD %, 73 sq in NA Hens HD %, 77 sq in NA Hens

Feed Cons, 73 sq in NM Hens Feed Cons, 77 sq in NM Hens Feed Cons, 73 sq in NA Hens Feed Cons, 77 sq in NA Hens

1 Hen-day Production is % and Feed Consumption is kg/100 Hens/d2 NM = non-molted3 NA = non-anorexic molt program

76

77

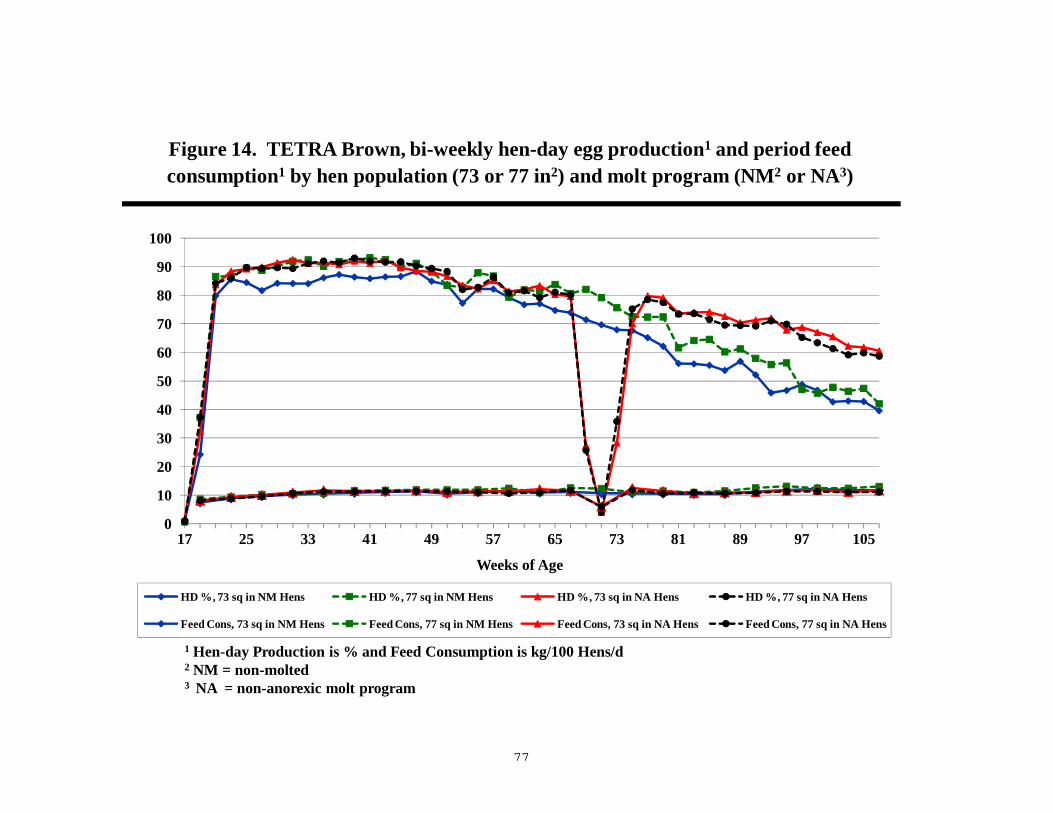
Figure 14. TETRA Brown, bi-weekly hen-day egg production1 and period feed consumption1 by hen population (73 or 77 in2) and molt program (NM2 or NA3)

0

10

20

30

40

50

60

70

80

90

100

17 25 33 41 49 57 65 73 81 89 97 105

Weeks of Age

HD %, 73 sq in NM Hens HD %, 77 sq in NM Hens HD %, 73 sq in NA Hens HD %, 77 sq in NA Hens

Feed Cons, 73 sq in NM Hens Feed Cons, 77 sq in NM Hens Feed Cons, 73 sq in NA Hens Feed Cons, 77 sq in NA Hens

1 Hen-day Production is % and Feed Consumption is kg/100 Hens/d2 NM = non-molted3 NA = non-anorexic molt program

78

Figure 15. TETRA Amber, bi-weekly hen-day egg production1 and period feed consumption1 by hen population (73 or 77 in2) and molt program (NM2 or NA3)

0

10

20

30

40

50

60

70

80

90

100

17 25 33 41 49 57 65 73 81 89 97 105

Weeks of Age

HD %, 73 sq in NM Hens HD %, 77 sq in NM Hens HD %, 73 sq in NA Hens HD %, 77 sq in NA Hens

Feed Cons, 73 sq in NM Hens Feed Cons, 77 sq in NM Hens Feed Cons, 73 sq in NA Hens Feed Cons, 77 sq in NA Hens

1 Hen-day Production is % and Feed Consumption is kg/100 Hens/d2 NM = non-molted3 NA = non-anorexic molt program

Figure 16. ISA Brown, bi-weekly hen-day egg production1 and period feed consumption1 by hen population (73 or 77 in2) and molt program (NM2 or NA3)

0

10

20

30

40

50

60

70

80

90

100

17 25 33 41 49 57 65 73 81 89 97 105

Weeks of Age

HD %, 73 sq in NM Hens HD %, 77 sq in NM Hens HD %, 73 sq in NA Hens HD %, 77 sq in NA Hens

Feed Cons, 73 sq in NM Hens Feed Cons, 77 sq in NM Hens Feed Cons, 73 sq in NA Hens Feed Cons, 77 sq in NA Hens

1 Hen-day Production is % and Feed Consumption is kg/100 Hens/d2 NM = non-molted3 NA = non-anorexic molt program

79

Figure 17. ISA Bovans Brown, bi-weekly hen-day egg production1 and period feed consumption1 by hen population (73 or 77 in2) and molt program (NM2 or NA3)

0

10

20

30

40

50

60

70

80

90

100

17 25 33 41 49 57 65 73 81 89 97 105

Weeks of Age

HD %, 73 sq in NM Hens HD %, 77 sq in NM Hens HD %, 73 sq in NA Hens HD %, 77 sq in NA Hens

Feed Cons, 73 sq in NM Hens Feed Cons, 77 sq in NM Hens Feed Cons, 73 sq in NA Hens Feed Cons, 77 sq in NA Hens

1 Hen-day Production is % and Feed Consumption is kg/100 Hens/d2 NM = non-molted3 NA = non-anorexic molt program

80

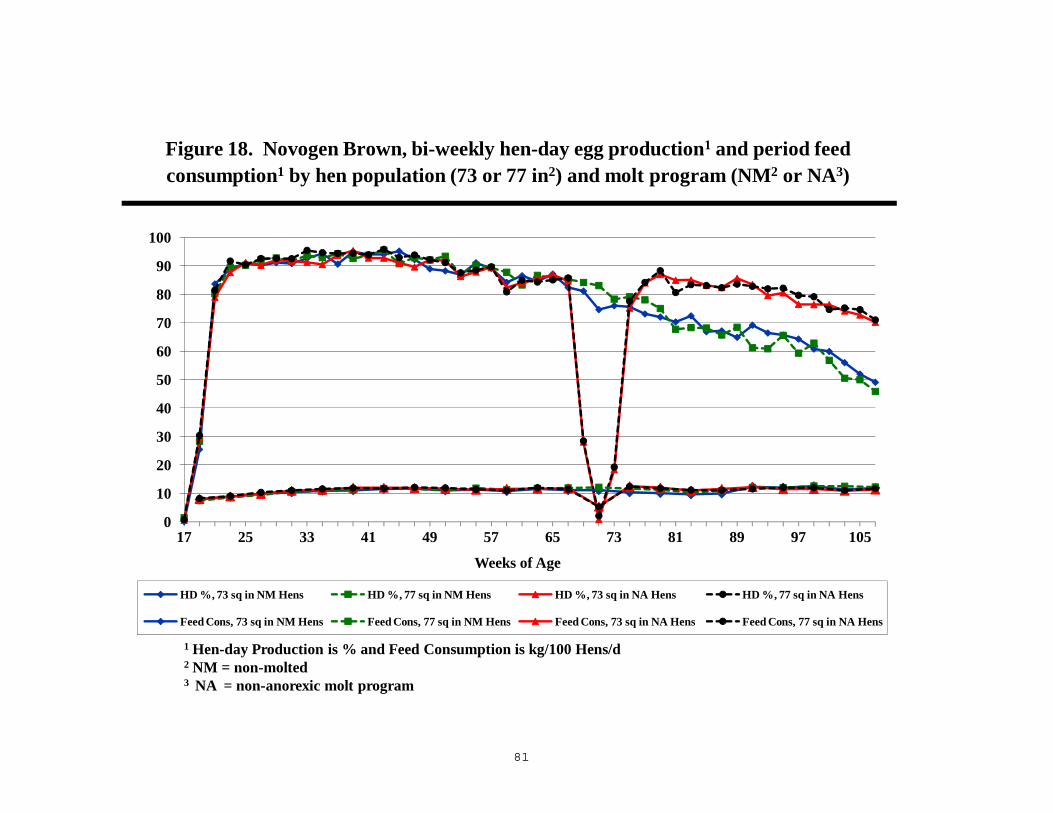
Figure 18. Novogen Brown, bi-weekly hen-day egg production1 and period feed consumption1 by hen population (73 or 77 in2) and molt program (NM2 or NA3)

0

10

20

30

40

50

60

70

80

90

100

17 25 33 41 49 57 65 73 81 89 97 105

Weeks of Age

HD %, 73 sq in NM Hens HD %, 77 sq in NM Hens HD %, 73 sq in NA Hens HD %, 77 sq in NA Hens

Feed Cons, 73 sq in NM Hens Feed Cons, 77 sq in NM Hens Feed Cons, 73 sq in NA Hens Feed Cons, 77 sq in NA Hens

1 Hen-day Production is % and Feed Consumption is kg/100 Hens/d2 NM = non-molted3 NA = non-anorexic molt program

81

82

Figure 19. NCSU Barred Ply. Rock, bi-weekly hen-day egg production1 and period feed consumption1 by hen population (73 or 77 in2) in only non-molted

0

10

20

30

40

50

60

70

80

90

100

17 25 33 41 49 57 65 73 81 89 97 105

Weeks of Age

HD %, 73 sq in NM Hens HD %, 77 sq in NM Hens

Feed Cons, 73 sq in NM Hens Feed Cons, 77 sq in NM Hens

1 Hen-day Production is % and Feed Consumption is kg/100 Hens/d

83

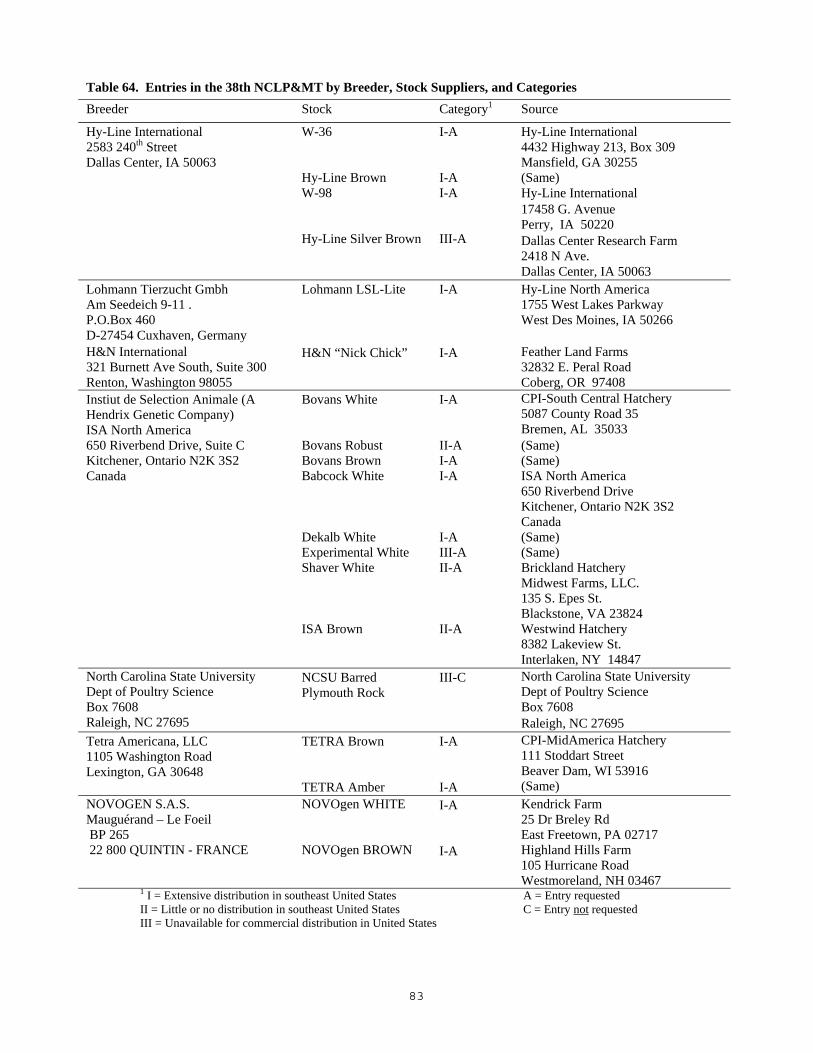
Table 64. Entries in the 38th NCLP&MT by Breeder, Stock Suppliers, and Categories Breeder Stock Category1 Source

Hy-Line International 2583 240th Street Dallas Center, IA 50063

W-36 Hy-Line Brown W-98 Hy-Line Silver Brown

I-A I-A I-A III-A

Hy-Line International 4432 Highway 213, Box 309 Mansfield, GA 30255 (Same) Hy-Line International 17458 G. Avenue Perry, IA 50220 Dallas Center Research Farm 2418 N Ave. Dallas Center, IA 50063

Lohmann Tierzucht Gmbh Am Seedeich 9-11 . P.O.Box 460 D-27454 Cuxhaven, Germany

Lohmann LSL-Lite I-A Hy-Line North America 1755 West Lakes Parkway West Des Moines, IA 50266

H&N International 321 Burnett Ave South, Suite 300 Renton, Washington 98055

H&N “Nick Chick” I-A Feather Land Farms 32832 E. Peral Road Coberg, OR 97408

Instiut de Selection Animale (A Hendrix Genetic Company) ISA North America 650 Riverbend Drive, Suite C Kitchener, Ontario N2K 3S2 Canada

Bovans White Bovans Robust Bovans Brown Babcock White Dekalb White Experimental White Shaver White ISA Brown

I-A II-A I-A I-A I-A III-A II-A II-A

CPI-South Central Hatchery 5087 County Road 35 Bremen, AL 35033 (Same) (Same) ISA North America 650 Riverbend Drive Kitchener, Ontario N2K 3S2 Canada (Same) (Same) Brickland Hatchery Midwest Farms, LLC. 135 S. Epes St. Blackstone, VA 23824 Westwind Hatchery 8382 Lakeview St. Interlaken, NY 14847

North Carolina State University Dept of Poultry Science Box 7608 Raleigh, NC 27695

NCSU Barred Plymouth Rock

III-C

North Carolina State University Dept of Poultry Science Box 7608 Raleigh, NC 27695

Tetra Americana, LLC 1105 Washington Road Lexington, GA 30648

TETRA Brown TETRA Amber

I-A I-A

CPI-MidAmerica Hatchery 111 Stoddart Street Beaver Dam, WI 53916 (Same)

NOVOGEN S.A.S. Mauguérand – Le Foeil BP 265 22 800 QUINTIN - FRANCE

NOVOgen WHITE NOVOgen BROWN

I-A I-A

Kendrick Farm 25 Dr Breley Rd East Freetown, PA 02717 Highland Hills Farm 105 Hurricane Road Westmoreland, NH 03467

1 I = Extensive distribution in southeast United States A = Entry requested II = Little or no distribution in southeast United States C = Entry not requested III = Unavailable for commercial distribution in United States


Recommended